the Creative Commons Attribution 4.0 License.
the Creative Commons Attribution 4.0 License.
 | 08 May 2026
Understanding meteorological, runoff, and agricultural drought propagation and their influencing factors in an ensemble of multiple datasets
Yuanrui Liu
Tingting Hu
Jiawen Yang
Lei Yu
Understanding the propagation of diverse drought conditions is essential for effective drought preparedness. This study evaluated the propagation of meteorological, runoff, and agricultural droughts across global land areas from 1958 to 2024 using an ensemble of reanalysis data (ERA5), land surface model simulations (GLDAS), and merged observational datasets (TerraClimate). Two distinct methodological frameworks were employed to characterize drought propagation: time-lag correlation analysis and multi-threshold run theory. Based on standardized drought indices derived from precipitation, runoff, and soil moisture, the drought propagation characteristics of response time (RT), propagation rate (PR), and lag time (LT) were examined. Moreover, the climatic and geographical factors influencing drought propagation were quantified using the SHapley Additive exPlanations (SHAP)-based attribution method. The results demonstrate the propagation pathways of meteorological-runoff-agricultural drought at the global scale, with the average RT, PR, and LT from meteorological to runoff drought at 5.0 months, 55.3 %, and 1.23 months; from meteorological to agricultural drought at 8.7 months, 30.3 %, and 2.60 months; and from runoff to agricultural drought at 5.8 months, 35.0 %, and 2.49 months, respectively. Drought propagation exhibits pronounced spatiotemporal heterogeneity, closely related to the regional climatic background. Temperature and potential evapotranspiration are the primary factors influencing the propagation of meteorological drought to runoff drought, whereas precipitation plays a decisive role in the propagation from meteorological or runoff drought to agricultural drought. The findings underscore the importance of taking climatic characteristics into account in the development and implementation of regional drought risk management.
- Article
(13237 KB) - Full-text XML
-
Supplement
(1610 KB) - BibTeX
- EndNote


Drought is one of the most frequent natural disasters and is generally defined as a prolonged period of moisture deficits within the water cycle (Liu et al., 2020; AghaKouchak et al., 2023). Under global warming, the magnitude, frequency, and spatial extent of droughts have increased in recent decades, driven by precipitation variability and increased atmospheric evaporative demand (Chen et al., 2025; Gebrechorkos et al., 2025). The intensified droughts pose a significant threat to ecosystems and socio-economic sectors, such as agricultural production (Hendrawan et al., 2022), ecosystem productivity (Cao et al., 2022; Gu et al., 2025), and water resources (Fowler et al., 2022; Liu et al., 2025; Xie et al., 2025). Moreover, multiple climate and hydrological projections reveal a consistent drying trend across many regions during the 21st century (Cook et al., 2020; Christian et al., 2023; Li et al., 2025). The increasing frequency and intensity of droughts are expected to exacerbate water scarcity and ecosystem degradation in the foreseeable future, thus posing significant threats to both the natural environment and human society. Therefore, characterizing the spatio-temporal dynamics of droughts is crucial, as it has significant implications for adapting to and mitigating the impacts of drought-related hazards.
Drought is a complex and multifaceted natural phenomenon (Wu et al., 2022). Although a drought event typically originates from inadequate precipitation and excessive evapotranspiration (referred to as meteorological drought), its impacts on human and natural systems are closely related to subsequent development, such as diminished runoff and streamflow (hydrological drought), reduced soil moisture (agricultural drought), and declined groundwater (groundwater drought). There exists a strong interrelationship among different types of droughts, owing to the close linkage of their driving factors within the hydrological cycle. The transition processes from one type of drought (i.e., meteorological drought) to another (i.e., hydrological drought) are referred to as drought propagation (Apurv et al., 2017; Colombo et al., 2024). Understanding the characteristics of drought propagation is essential for elucidating drought evolution mechanisms and improving early warning systems. These characteristics include propagation time (the time lag between different drought types), propagation probability (the likelihood of transition between drought types), and propagation threshold (the critical level of drought conditions required to trigger a subsequent drought response). Over the past decades, numerous studies have assessed the propagation characteristics of different drought conditions, using identification methods such as time-lag correlation analysis (López-Moreno et al., 2013; Barker et al., 2016; Liu et al., 2023; Geng et al., 2024), run theory (Aryal et al., 2024; Xiong et al., 2025), and event-coincidence analysis (Baez-Villanueva et al., 2024). For example, Shi et al. (2022b) examined the response time from meteorological and hydrological droughts using the maximum correlation coefficient method, and analyzed the variations in response time across different climatic regions. Han et al. (2023) investigated the propagation pathways of various types of droughts across China and revealed the long-chain propagation mechanisms involving meteorological, hydrological, agricultural, and groundwater droughts. Aryal et al. (2024) evaluated the propagation time from meteorological drought to hydrological and agricultural drought across Australia, emphasizing the significant influence of climatic conditions and drought indices in assessing drought propagation dynamics. Among the aforementioned studies, correlation analysis and run theory are two of the most commonly used methodologies for quantifying drought propagation (Zhang et al., 2022). The time-lag correlation analysis based on standardized drought indices (SDIs) with varying accumulation periods provides a direct and effective method for assessing the response time among different drought types from a statistical perspective. However, the correlation analysis can only reflect the average linear relationship between different drought types, but cannot capture the variations among individual drought events (Zhou et al., 2024; Brunner and Chartier-Rescan, 2024). In comparison, the run theory identifies discrete drought events based on the time series of drought indices, thereby providing a more physically meaningful interpretation of the time lag relationship among various drought conditions. Although extensive research has been conducted to examine the characteristics of drought propagation, the results of these studies are heavily dependent on the datasets, evaluation methods, drought indices, and thresholds employed. A comparison of the differences and consistencies in drought propagation characteristics derived from different datasets and methods is desired to improve our understanding of drought propagation, particularly at the global scale.
The propagation characteristics of different types of drought vary depending on climatic conditions and underlying surface conditions (Apurv et al., 2017; Sattar et al., 2019; Apurv and Cai, 2020). Over the past decades, a large number of attribution studies have been conducted to quantify the impacts of climatic and geographical factors on drought propagation, using methods such as statistical analysis (Gevaert et al., 2018), clustering analysis (Liu et al., 2023), causality analysis (Shi et al., 2022a), and machine learning models (Muthuvel and Qin, 2025). Data-driven machine learning approaches are increasingly being employed in drought modeling due to their inherent advantages in capturing nonlinear patterns from complex and high-dimensional data (Sundararajan et al., 2021; Prodhan et al., 2022). Although machine learning models achieve satisfactory simulation accuracy, their reliability remains questionable due to their black-box nature and lack of physical interpretability (Rudin, 2019; Hassija et al., 2024). SHapley Additive exPlanations (SHAP) provides a unified attribution framework for explaining the machine learning outputs, enabling the interpretation of the causal relationships between independent variables and dependent variables (Antwarg et al., 2021; Nohara et al., 2022). Recently, SHAP-based attribution models have been utilized to investigate drought dynamics across various temporal and spatial scales (Xue et al., 2024; Feng et al., 2025). To the best of our knowledge, there is currently a lack of studies that analyze the factors influencing drought propagation from the perspective of SHAP-based machine learning.
Reliable drought monitoring and an in-depth understanding of the underlying mechanisms depend on datasets that accurately describe variations in drought-related hydro-meteorological variables. For large-scale and global assessments, gauge observations and gauge-based gridded datasets are often constrained by limited spatial and temporal coverage, the occurrence of missing values, and challenges in data accessibility (Wang et al., 2020; Gebrechorkos et al., 2024). Numerous satellites, reanalysis, earth system models, and merged datasets have been developed, providing long-term and spatially continuous records of hydro-meteorological variables (Abatzoglou et al., 2018; Hersbach et al., 2020). Over the past decades, extensive efforts have been made to evaluate drought dynamics using different datasets at both regional and global scales. For example, Yuan et al. (2023) assessed the global patterns of flash drought, which is characterized by the rapid depletion of soil moisture, using ERA5 reanalysis and climate model datasets. Gebrechorkos et al. (2025) revealed the critical role of atmospheric evaporative demand in accelerating global drought severity, based on an ensemble of reanalysis, gridded observation, and hydrological model datasets. Wu et al. (2025) conducted an assessment of the dynamic predictability of agricultural drought across global land areas, utilizing the gridded observation, reanalysis, and hydrological model datasets. However, inconsistent findings across studies can be attributed to the inherent uncertainties and errors within different datasets; few systematic comparisons have been conducted to quantify the discrepancies among the multiple datasets in representing drought propagation characteristics (Chen et al., 2020; Huang et al., 2025).
Although previous studies have evaluated drought propagation across various temporal and spatial scales, a comprehensive assessment of the propagation characteristics of meteorological, runoff, and agricultural droughts – derived from ensembles of multiple datasets – remains lacking, particularly at the global scale. Moreover, comparisons among different evaluation methods are also needed to fully understand the drought propagation process and its underlying influencing factors. Therefore, the objectives of this study are as follows: (1) to assess the spatial and temporal patterns of response time, propagation rate, and lag time across meteorological, runoff, and agricultural droughts – derived from an ensemble of multiple datasets; (2) to quantify the main climatic and underlying surface factors that influence drought propagation characteristics from the perspective of machine learning; (3) to compare the robustness and uncertainty associated with different methods and datasets in characterizing drought propagation.
2.1 Datasets
Monthly precipitation, runoff, and soil moisture were derived from the ERA5, the Global Land Data Assimilation System (GLDAS), and TerraClimate datasets to calculate the drought indices. ERA5 is the fifth-generation global atmospheric reanalysis product developed by the European Centre for Medium-Range Weather Forecasts. It integrates extensive records of both in-situ and satellite observations through an ensemble-based data assimilation system (Hersbach et al., 2020). Precipitation in ERA5 was generated by the atmospheric component of the Integrated Forecasting System, whereas runoff and soil moisture were simulated by a land surface model (Boussetta et al., 2021). The soil moisture in ERA5 was aggregated to 1 meter volumetric soil water using weighted data from three layers: 0–7, 7–28, and 28–100 cm. GLDAS is a multi-model ensemble comprising three land surface models – Noah, Catchment, and the Variable Infiltration Capacity – which integrate satellite and in-situ observations through advanced land surface modeling techniques. The soil moisture in GLDAS models has different soil layer structures, all of which were weighted to the root zone depth of 1 m to be consistent with ERA5. TerraClimate integrates multiple datasets, including WorldClim, Climate Research Unit, and Japanese 55-year Reanalysis, to generate hydro-meteorological variables (Abatzoglou et al., 2018). The soil moisture in the TerraClimate refers to the plant extractable soil water based on the root zone storage capacity, as modeled by an empirical water balance model. The original spatial and temporal resolutions of the raw datasets are as follows: ERA5 (1940–present) at 0.25° × 0.25°, GLDAS v2.0 at 1° × 1° (1948–2014), GLDAS v2.0 at 0.25° × 0.25° (2015–2024), and TerraClimate (1958–2025) at ° × °. To ensure spatial and temporal consistency, the period from 1958 to 2024 was selected as the reference period, and all datasets were uniformly interpolated onto a 1° × 1° latitude–longitude grid using bilinear interpolation.
In addition, the temperature and potential evapotranspiration (PET) were also obtained from the ensemble of ERA5, GLDAS, and TerraClimate datasets. Potential evapotranspiration in these datasets was calculated using the Penman-Monteith method (Abatzoglou et al., 2018). The Normalized Difference Vegetation Index (NDVI) was obtained directly from the Advanced Very High Resolution Radiometer instruments operated by the National Oceanic and Atmospheric Administration (NOAA) (Pinzon and Tucker, 2014). The elevation dataset was obtained from the ETOPO Global Relief Model developed by the National Centers for Environmental Information (https://www.ncei.noaa.gov/products/etopo-global-relief-model, last access: 1 May 2026). The aridity index dataset was derived from the Global Aridity Index and Potential Evapotranspiration Database – Version 3 (Zomer et al., 2022).
2.2 Drought definition and drought indices
Drought is a complex phenomenon related to multiple variables in the water cycle, and there is no universally accepted definition in the current literature (Van Loon, 2015). Drought propagation is a hierarchical top-down process in which meteorological drought, caused by insufficient precipitation, can propagate to other hydrological variables (Teutschbein et al., 2025). A large number of drought indices and datasets have been developed to characterize varying drought conditions at different spatial and temporal scales (AghaKouchak et al., 2023; Gebrechorkos et al., 2025). To provide a consistent and comparable assessment of drought propagation, standardized drought indices (SDIs) derived from precipitation, runoff, and soil moisture were used to define meteorological, hydrological, and agricultural droughts. The SDI time series were obtained by fitting the drought variables of interest to a suitable probability distribution and subsequently normalizing the probabilities to generate a standardized time series. Three SDIs, including Standardized Precipitation Index (SPI) (McKee et al., 1993), Standardized Runoff Index (SRI) (Shukla and Wood, 2008), and Standardized Soil Moisture Index (SSI) (Hao and AghaKouchak, 2013), were computed by fitting parametric probability distributions, specifically the Gamma, log-normal, and normal distributions, respectively. The maximum likelihood estimation (MLE) method was utilized to estimate the parameters of the probability distributions, with the initial values determined based on the L-moments estimation (Stagge et al., 2015). Compared with other drought indices, the SDI is not only simple and efficient to calculate, but also applicable to diverse climates due to its consistent calculation procedure (Zarch et al., 2015; Adnan et al., 2018). Meanwhile, the SDI can be calculated using drought-related variables across multiple time scales, thus enhancing its effectiveness in analyzing drought propagation.
2.3 Response time analysis based on correlation coefficient
The response times among meteorological, hydrological, and agricultural droughts were analyzed using correlation analysis. Assuming that a high correlation coefficient indicates a strong relationship, the correlation analysis between drought indices with different accumulation periods can be conducted to determine the response time of different drought types (Zhang et al., 2022). For example, the response time from meteorological drought to agricultural drought is determined by the accumulation period of SPI that corresponds to the maximum correlation coefficient with the SSI at a 1-month accumulation period. A shorter accumulation period of SPI to 1-month SSI indicates a more rapid agricultural drought response to meteorological drought conditions. The correlation coefficient is calculated using Pearson's correlation coefficient formulated as follows (Pearson, 1896):
where rP represents the Pearson's correlation coefficient between SPI-n (n is the accumulation period, n=1, 2, …, 24) and SSI-1; and represent the average value of SPI and SSI, respectively; xi and yi represents the SPI and SSI values in the time i, respectively. The Pearson's correlation coefficient is ranged from −1 to 1. We evaluated the response times from meteorological drought to runoff drought (RTMR), from meteorological drought to agricultural drought (RTMA), and from runoff drought to agricultural drought (RTRA) by analyzing the correlations between SPI and SRI, between SPI and SSI, and between SRI and SSI, respectively.
2.4 Lag time analysis based on run theory
Run theory is a commonly used method for analyzing drought characteristics, which defines the initiation and termination of a drought event based on the drought index. In this study, the drought events were identified using a multi-threshold run theory, which has advantages in avoiding the unreasonable splitting of persistent droughts and filtering out minor drought episodes, thus providing more accurate identification of drought events (Fleig et al., 2006; Ma et al., 2021). Potential drought events were initially identified using an intermediate threshold (X0=0). Subsequently, the adjacent drought events with an interval of one month and whose drought index values were below a high threshold (X1=1) within that month were combined. Finally, the potential drought events with one month length and whose drought index value is greater than a low threshold () were ruled out.
After using run theory to identify the initiation and termination of drought events, the propagation rate and lag time between the two types of droughts can be evaluated. Taking meteorological and agricultural droughts as an example, the propagation from meteorological drought to agricultural drought is defined as the occurrence of an agricultural drought event during the period in which a meteorological drought occurs. Thus, the propagation rate (PRMA) and lag time (LTMA) can be mathematically expressed as follows (Sattar et al., 2019):
where n is number of meteorological drought events that propagate to agricultural drought events; m is the total number of meteorological drought events during the study period; TM,i is the starting time of meteorological drought event i, and TA,i is the starting time of agricultural drought event i. To elucidate the propagation of drought across different types, the SPI, SRI, and SSI at a 1-month accumulation period were used to represent meteorological, runoff, and agricultural drought, respectively. Consistent with the analysis of drought response time, we analyzed the propagation rate and lag time between meteorological and runoff droughts (PRMR and LTMR), between meteorological and agricultural droughts (PRMA and LTMA), and between runoff and agricultural droughts (PRRA and LTRA).
2.5 Assessment of variation across multiple datasets
Two criteria were used to evaluate the variation in drought propagation across different datasets: the coefficient of variation (CV) and the mean absolute deviation (MAD). Specifically, CV and MAD are calculated as follows:
where xi represents the drought propagation characteristics (i.e., RT, PR and LT) for dataset i (i=1, 2, 3).
2.6 Trend analysis of drought propagation
Temporal evolution of drought propagation characteristics was assessed through a moving window approach. For each grid, the drought propagation characteristics (i.e., response time, propagation rate, and lag time) between different types of droughts were calculated using a 30-year moving window that advanced one year at a time, thereby generating an annual time series for the period from 1987 to 2024. The significance of the time series trend was assessed using the Mann-Kendall (MK) test, where a trend was considered statistically significant at the p value <0.05 (Mann, 1945; Kendall, 1975). Given that the series is derived from a moving window with overlapping data, we conducted the Trend-Free Pre-Whitening (TFPW) procedure prior to the MK test to address potential autocorrelation (Yue et al., 2002). The TFPW-MK test effectively removes the influence of serial correlation on trend significance, providing a more robust assessment. In addition, the magnitude of the trend was estimated using Sen's slope estimator (Sen, 1968).
2.7 SHAP-based attribution analysis
The characteristics of drought propagation are closely associated with regional climatic and geographical features. In this study, we quantified the factors that influence drought propagation characteristics across global land areas using the SHapley Additive exPlanations (SHAP) method. SHAP is an effective method for interpreting the outputs of machine learning models, which are often treated as black-box systems, based on principles derived from cooperative game theory (Nohara et al., 2022). The explanation model in the SHAP method can be represented as follows (Antwarg et al., 2021):
where G(x) is the simulated drought propagation characteristics; φ0 is the average predicted drought propagation characteristics; and φi represents the SHAP value for factor i. For a machine learning model f and input instance x, the SHAP value φi for factor i can be formulated as:
where N is the set of all factors, and S is a subset of factor excluding factor i. The SHAP value φi can quantify the magnitude and direction of factors influencing the model predictions.
According to previous studies, climatic conditions are among the most important factors influencing drought propagation characteristics (Aryal et al., 2024). To explore the relative importance of long-term climatic conditions for drought propagation, the average values (1958–2024) of eight climatic and physiographic variables, including precipitation, temperature, potential evapotranspiration, runoff, soil moisture, aridity index, elevation, and vegetation condition, were selected as model predictors. The corresponding drought propagation characteristics (i.e., response time, propagation rate, and lag time) were selected as target variables. The Extreme Gradient Boosting (XGBoost) model was employed to model the relationships between climatic predictors and drought propagation target variables. The XGBoost model is an efficient and robust gradient-boosted decision tree algorithm that is widely applied in classification and regression tasks within the field of water resources engineering (Chen and Guestrin, 2016; Niazkar et al., 2024). To account for spatial autocorrelation, spatial block cross-validation was employed on the training set to prevent overfitting. The global grid was partitioned into 43 spatially contiguous blocks according to the IPCC AR6 reference land regions (Iturbide et al., 2020). In each fold, ten blocks were held out for validation, and the XGBoost model was trained on the remaining blocks. Model performance was evaluated using the coefficient of determination (R2) and root mean square error (RMSE), averaged across all held-out blocks.
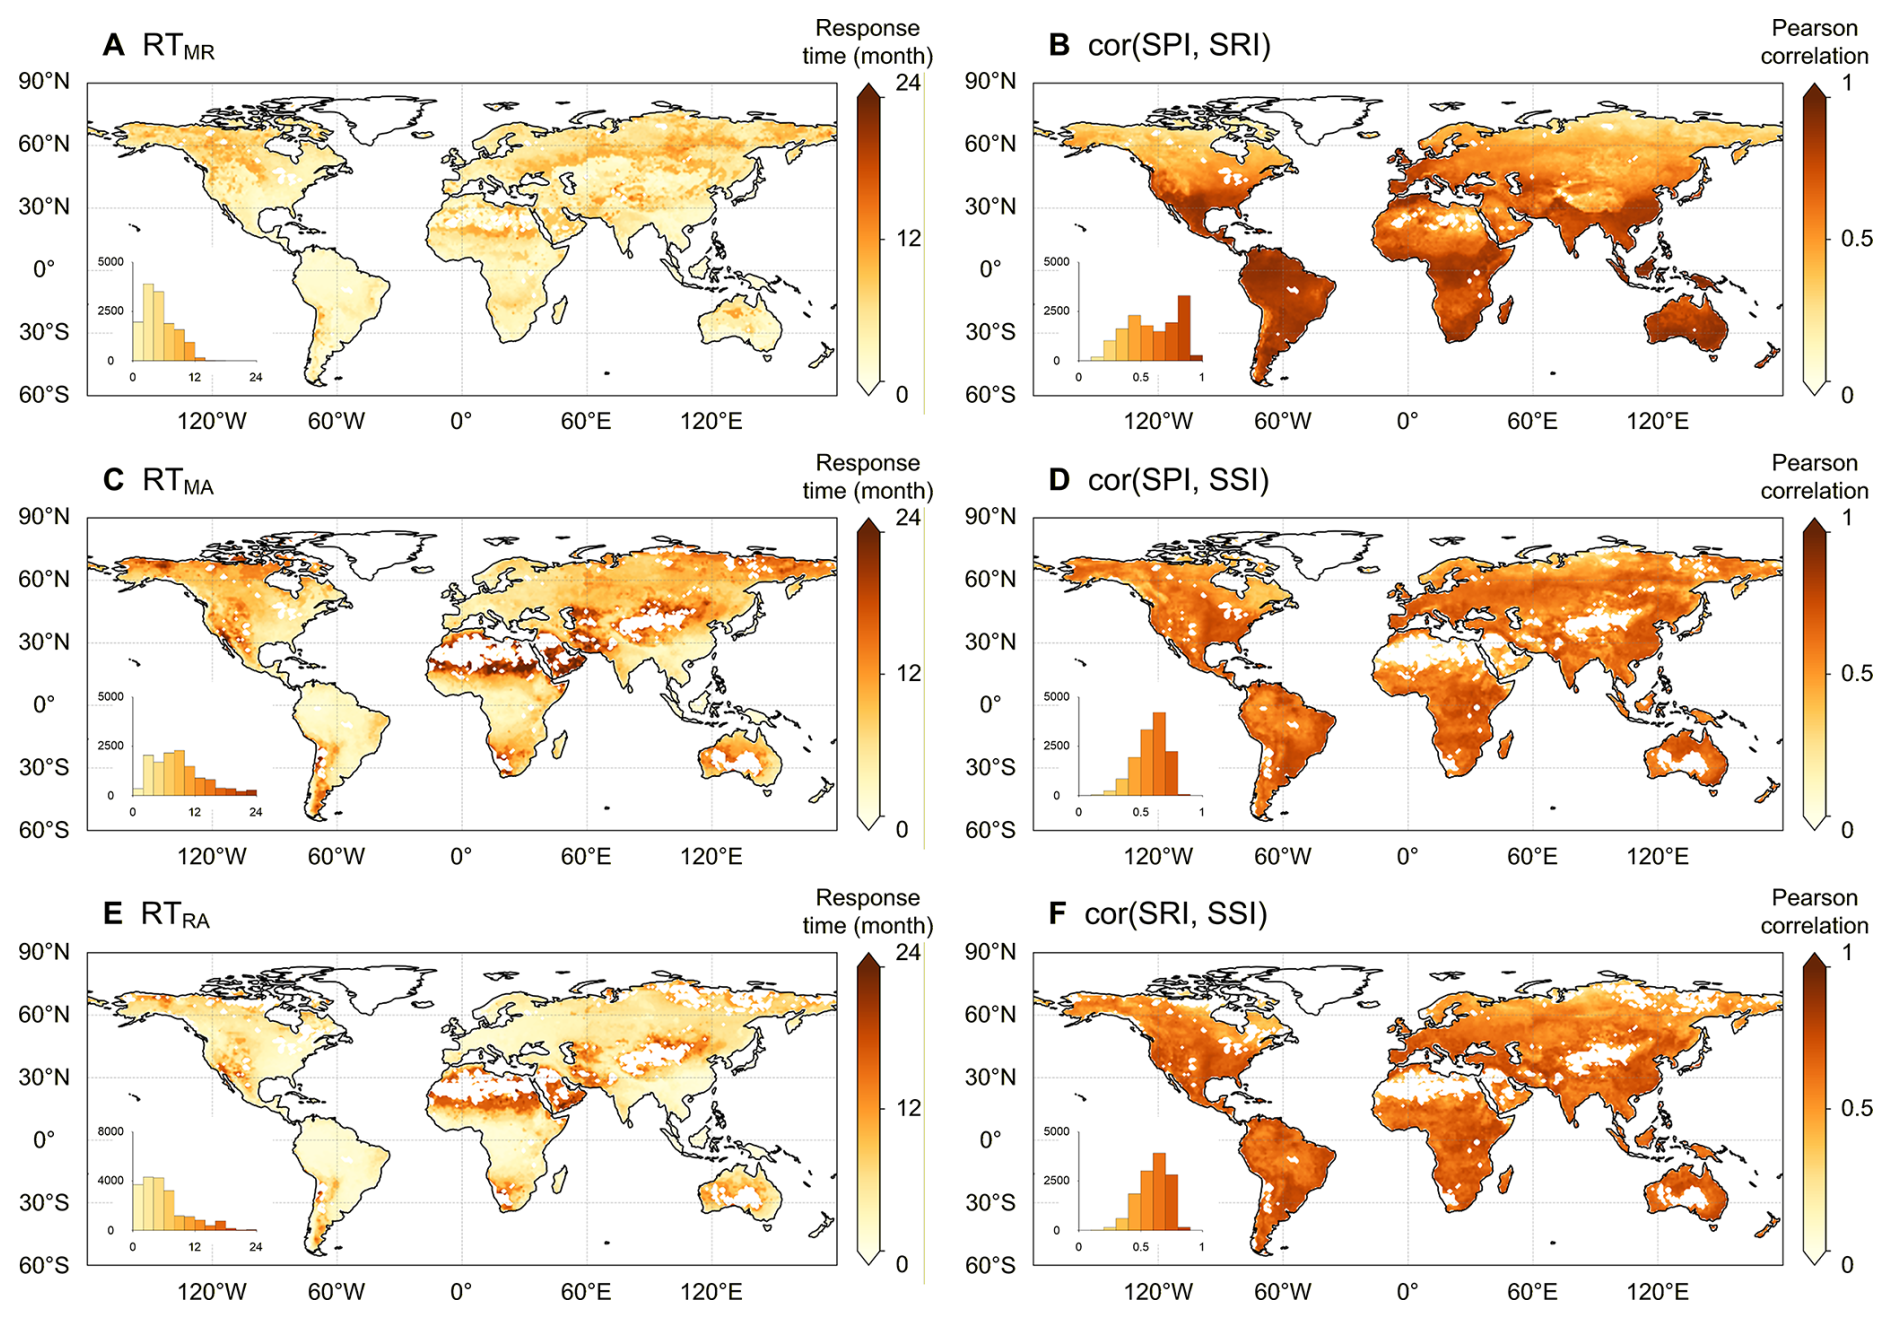
Figure 1Spatial patterns of average response time from meteorological to runoff droughts (RTMR), from meteorological to agricultural droughts (RTMA), and from runoff to agricultural droughts (RTRA), and the corresponding Pearson correlation coefficients derived from the ensemble of ERA5, GLDAS, and TerraClimate datasets. The blank grids indicate that the correlation between different drought indices is not statistically significant (p value <0.05). The inner plots show the histograms of response time and maximum correlation across global land areas.
3.1 Response time and correlation of drought indices
Figure 1 illustrates the spatial patterns of response times among meteorological, runoff and agricultural droughts based on the ensemble of multiple datasets. The results indicate a more rapid propagation of meteorological drought to runoff drought when compared to agricultural drought. The average RTMR, RTMA and RTRA across global land areas are 5.0 months, 8.7 months, and 5.8 months, respectively, with interquartile ranges (IQRs) of [2.7, 6.7] months, [5.0, 11.3] months, and [2.3, 7.3] months. The response time varies across different regions, with shorter propagation times in southeastern Asia, central Africa, South America, and North America. The robustness of the response time evaluation can be attributed to the relatively high correlation coefficients presented in Fig. 1. The IQRs of corresponding correlation coefficients of SPI–SRI, SPI–SSI, and SRI–SSI are [0.43, 0.80], [0.51, 0.68], and [0.52, 0.70], respectively (Fig. 1B, D, and F). The correlation coefficients of response times are relatively high in the mid- to low-latitude regions (30° S–30° N), suggesting strong robustness of the response time measurements in these regions. The response times among meteorological, runoff, and agricultural droughts also exhibit obvious seasonal variations (Figs. S1 and S2 in the Supplement). Shorter response times and higher correlation coefficients were observed during the summer season (June–August in the Northern Hemisphere, and December–February in the Southern Hemisphere).
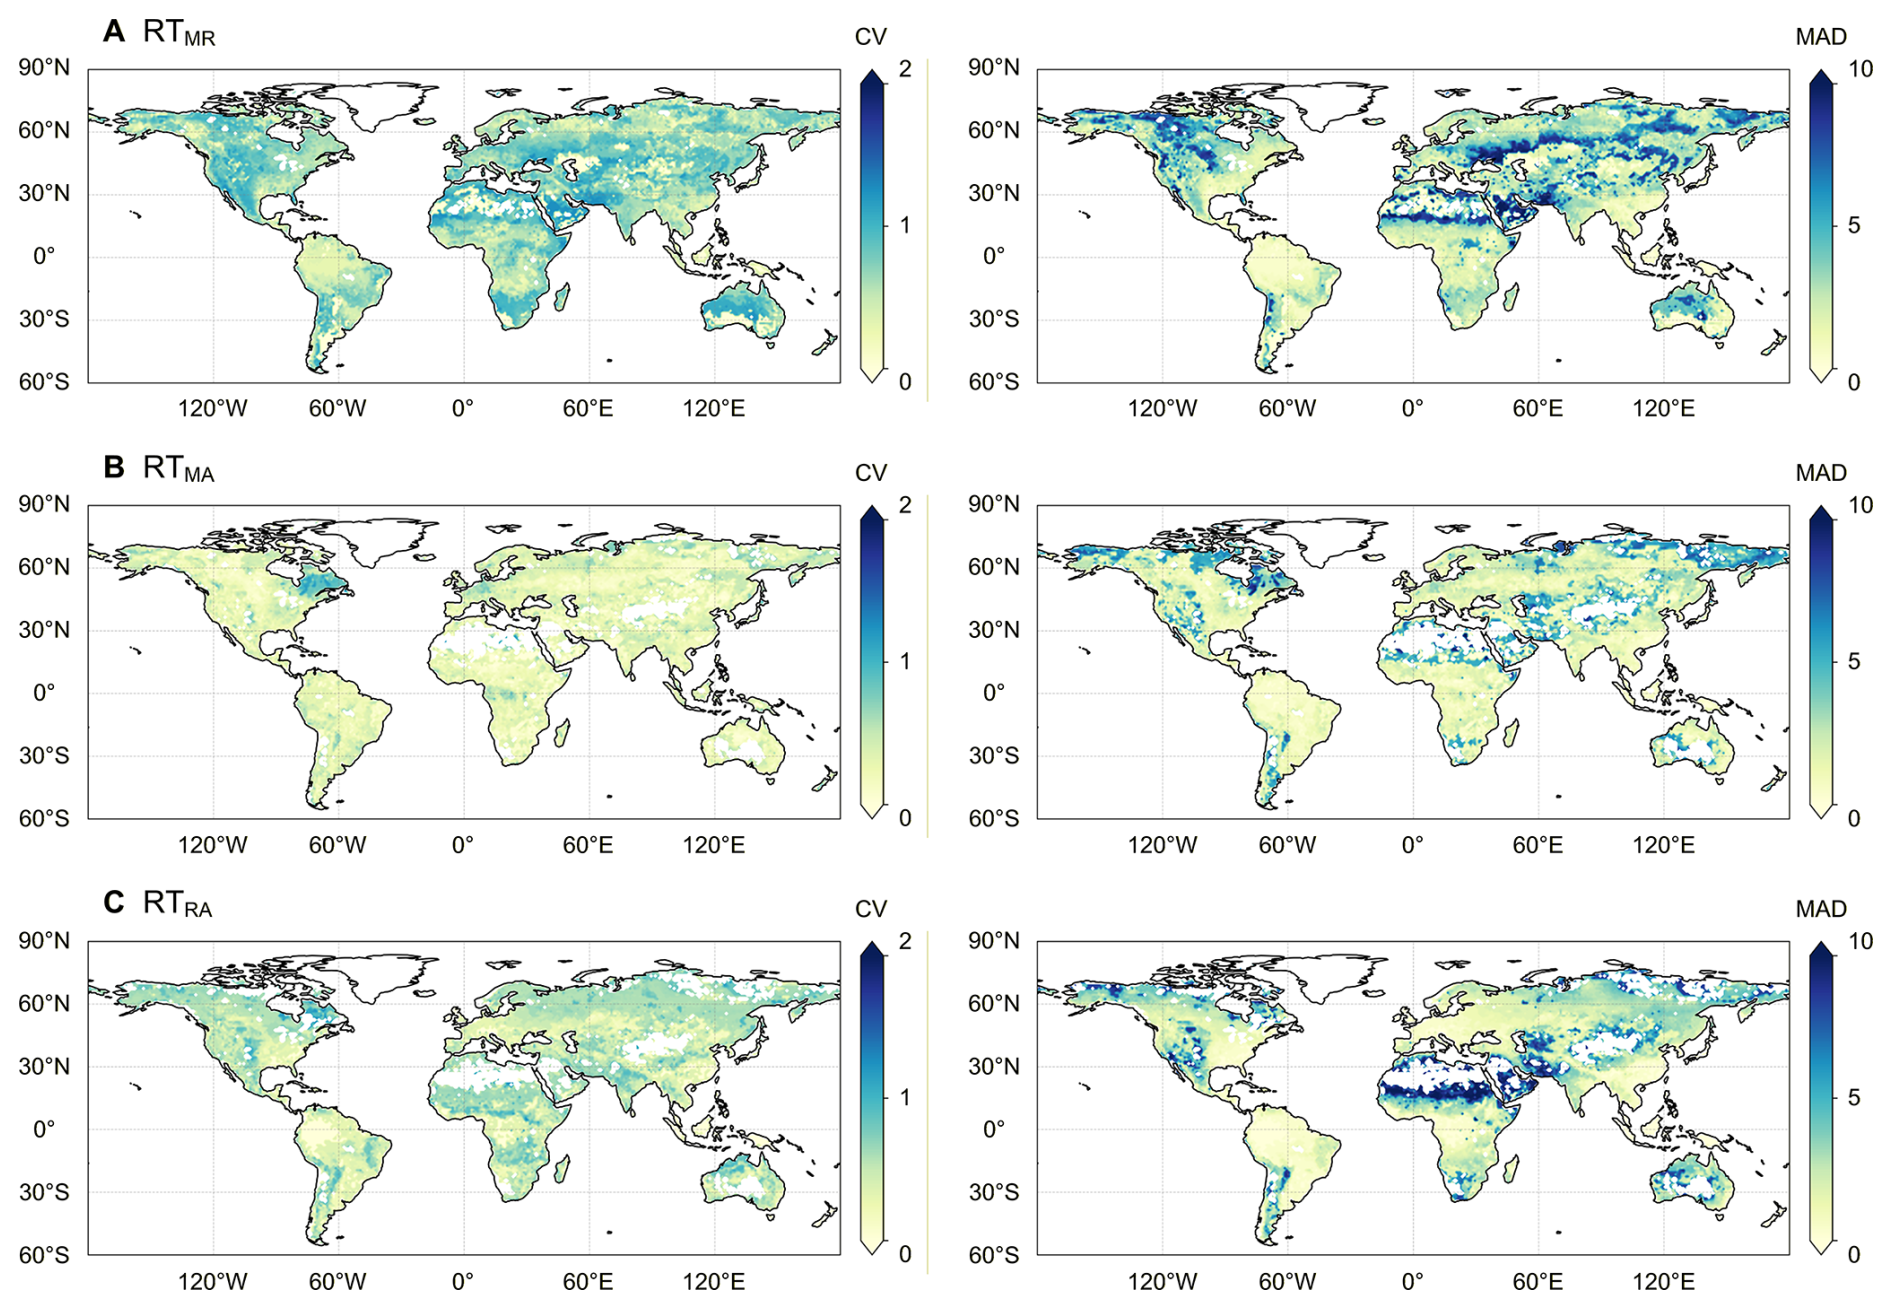
Figure 2Spatial patterns of CV and MAD across the ERA5, GLDAS, and TerraClimate datasets for the response time from meteorological to runoff droughts (RTMR), from meteorological to agricultural droughts (RTMA), and from runoff to agricultural droughts (RTRA). Larger values of the CV and MAD signify a more substantial disparity among distinct datasets.
Moreover, the response time also varied across different datasets (Figs. S3 and S4). For example, consistently low RTMR values were observed in the TerraClimate dataset, whereas high RTMR values were observed in the ERA5 and GLDAS datasets. On average, the fluctuation ranges of RTMR, RTMA and RTRA among different datasets were [1.96, 7.06] month, [7.87, 10.65] month, and [4.95, 8.00] month, respectively. To quantify the differences among various datasets, two metrics (i.e., CV and MAD) were calculated, and their spatial patterns are shown in Fig. 2. Larger values of CV and MAD indicate more substantial differences among different datasets. The lowest values of CV and MAD were observed in the RTMA, followed by the RTRA and RTMR. This result indicates that the RTMA showed relatively small variation across different datasets over global land areas, except in the high-latitude regions of the Northern Hemisphere. In contrast, substantial disparities existed in the RTMR and RTRA evaluations derived from different datasets, particularly in North America, the Sahara, central Asia, and central Australia. Specifically, consistently low RTMR values were observed in the TerraClimate dataset, whereas high RTMR values were predominantly found in the high latitudes of the Northern Hemisphere (Fig. S3). Regarding the maximum correlation of RTMR, RTMA, and RTRA, the GLDAS dataset generally exhibited higher correlation coefficients, whereas the ERA5 and TerraClimate datasets displayed obviously spatial heterogeneity (Fig. S4). This indicates that the response time among different droughts is more reliably represented in the GLDAS dataset.
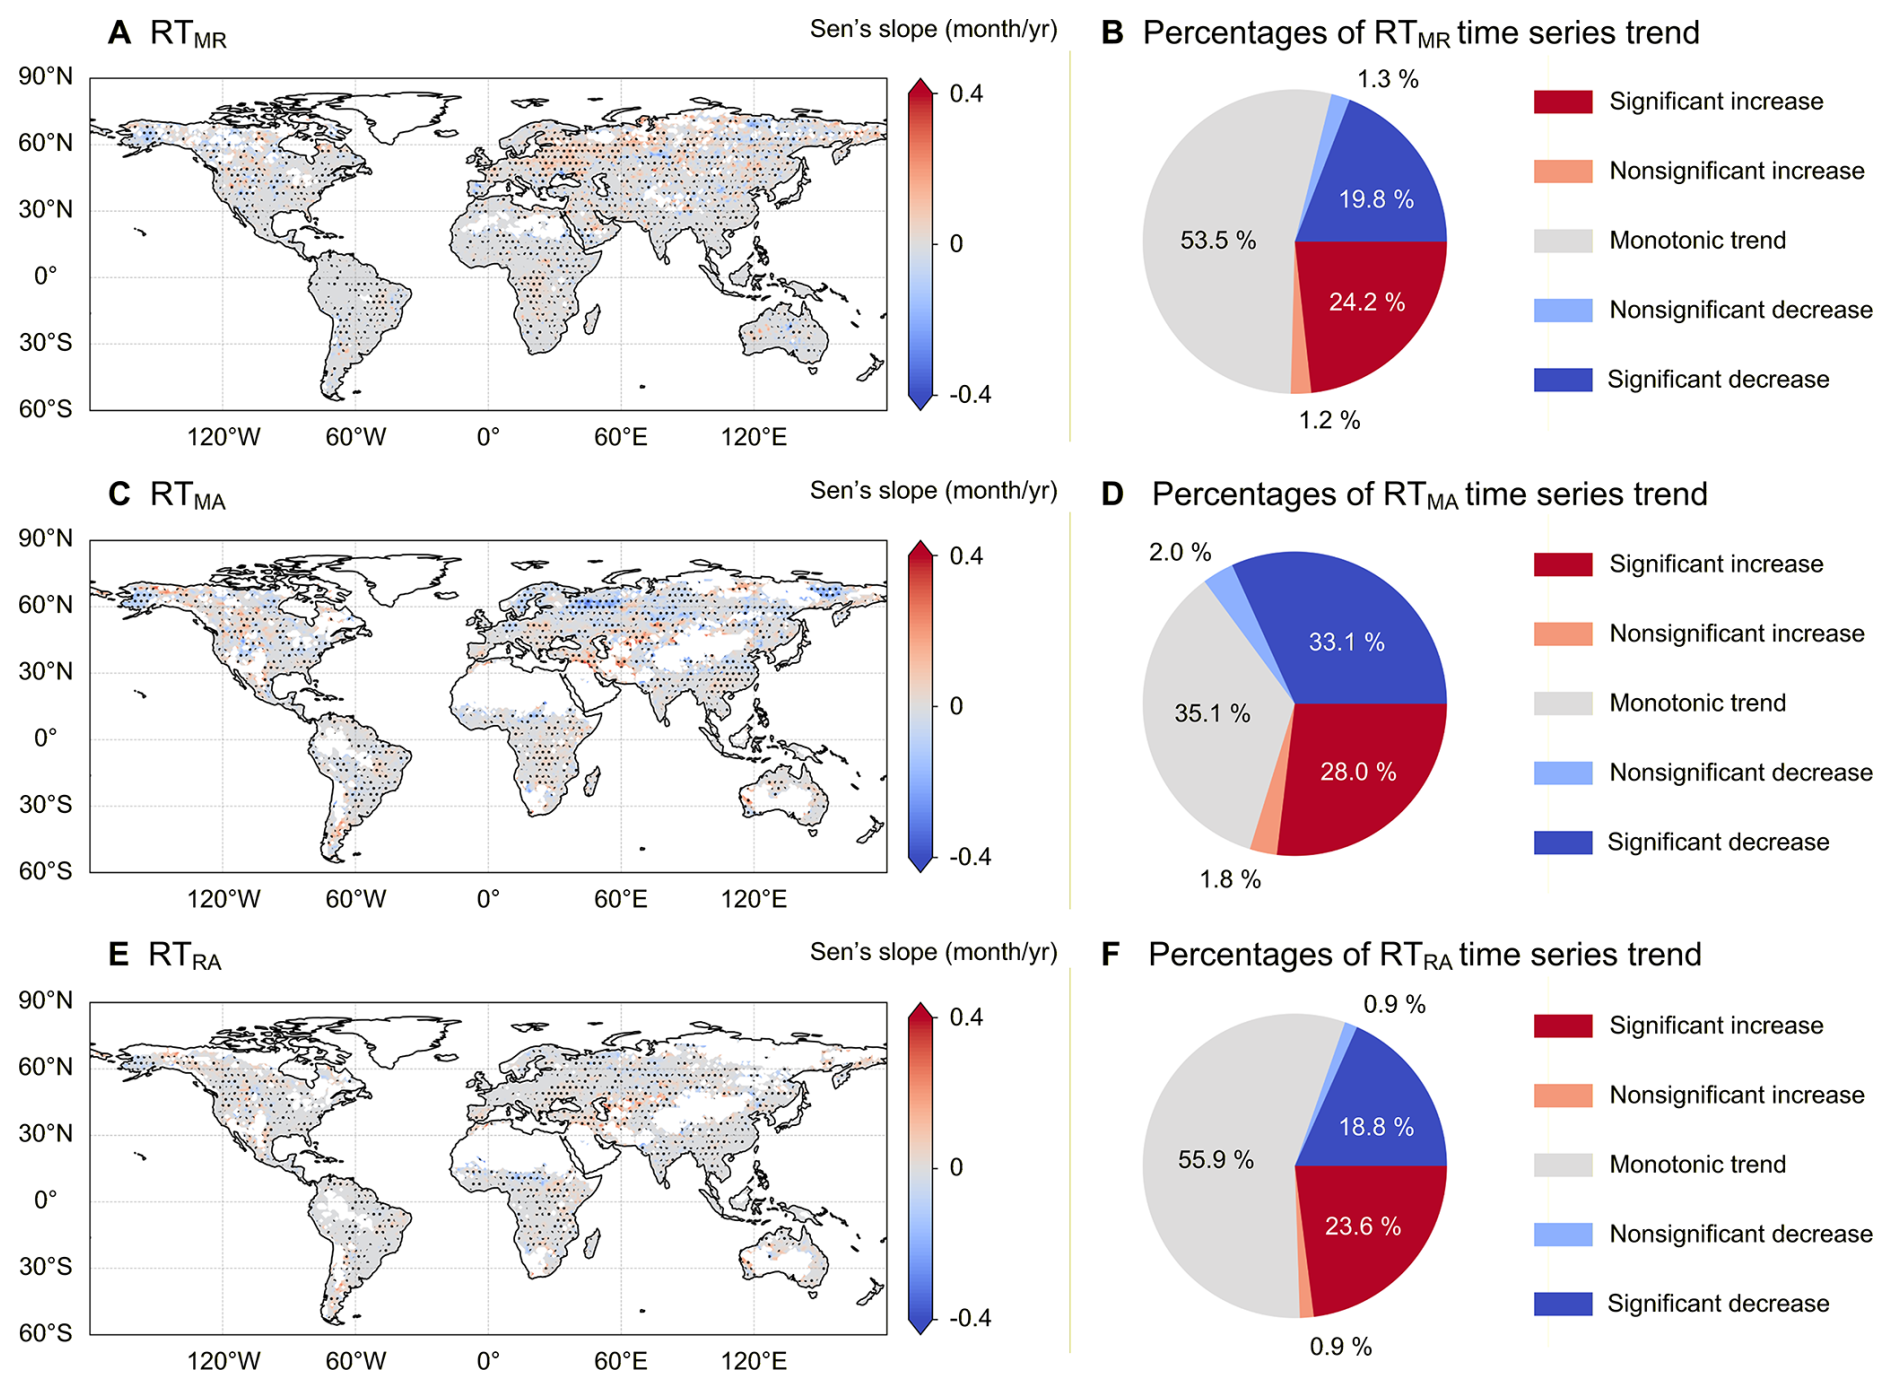
Figure 3Spatial patterns of time series trends in RTMR, RTMA and RTRA across global land areas. The blank grids signify that, within at least one time-window in the time series of response time obtained from the moving window, the correlation coefficient is not statistically significant. The black dots indicate the statistical significance of the time series trend, where the p value of the TFPW-MK test is less than 0.05. A significant increase (decrease) indicates that the Sen's slope is greater (less) than 0 and that the p value of the TFPW-MK test is less than 0.05. A nonsignificant increase (decrease) indicates that the Sen's slope is greater (less) than 0 and that the p value of the TFPW-MK test is greater than 0.05. A monotonic trend indicates that Sen's slope is equal to 0.
Figure 3 presents the spatial patterns of the time series trends for RTMR, RTMA, and RTRA, calculated using 30-year moving windows based on the Sen's slope estimator and the M-K test. The temporal trends in response time across different drought types demonstrate notable spatial heterogeneity. The grids exhibiting a monotonic time series trend account for 53.4 %, 35.1 %, and 55.9 % of the total grid for RTMR, RTMA, and RTRA, respectively. In contrast, the percentages of statistically significant increases range from 23.0 % to 26.9 %, whereas the percentages of statistically significant decreases fall within the range of 18.3 % to 31.8 %. For the RTMR, regions exhibiting increasing trends are primarily located in Europe, northwestern Asia, central Africa, and North America, while decreasing trends are sporadically observed across Asia. The decreasing trends of RTMA are primarily observed in the mid- to high-latitudes of the Northern Hemisphere, while increasing trends are predominantly evident in Central Asia and North America. In contrast, aside from the obvious increase observed in Central Asia, no clear spatial distribution pattern can be identified in the time series trend of RTRA. This result indicates that the response time of various drought conditions can vary across different regions, exhibiting significant interannual variability.
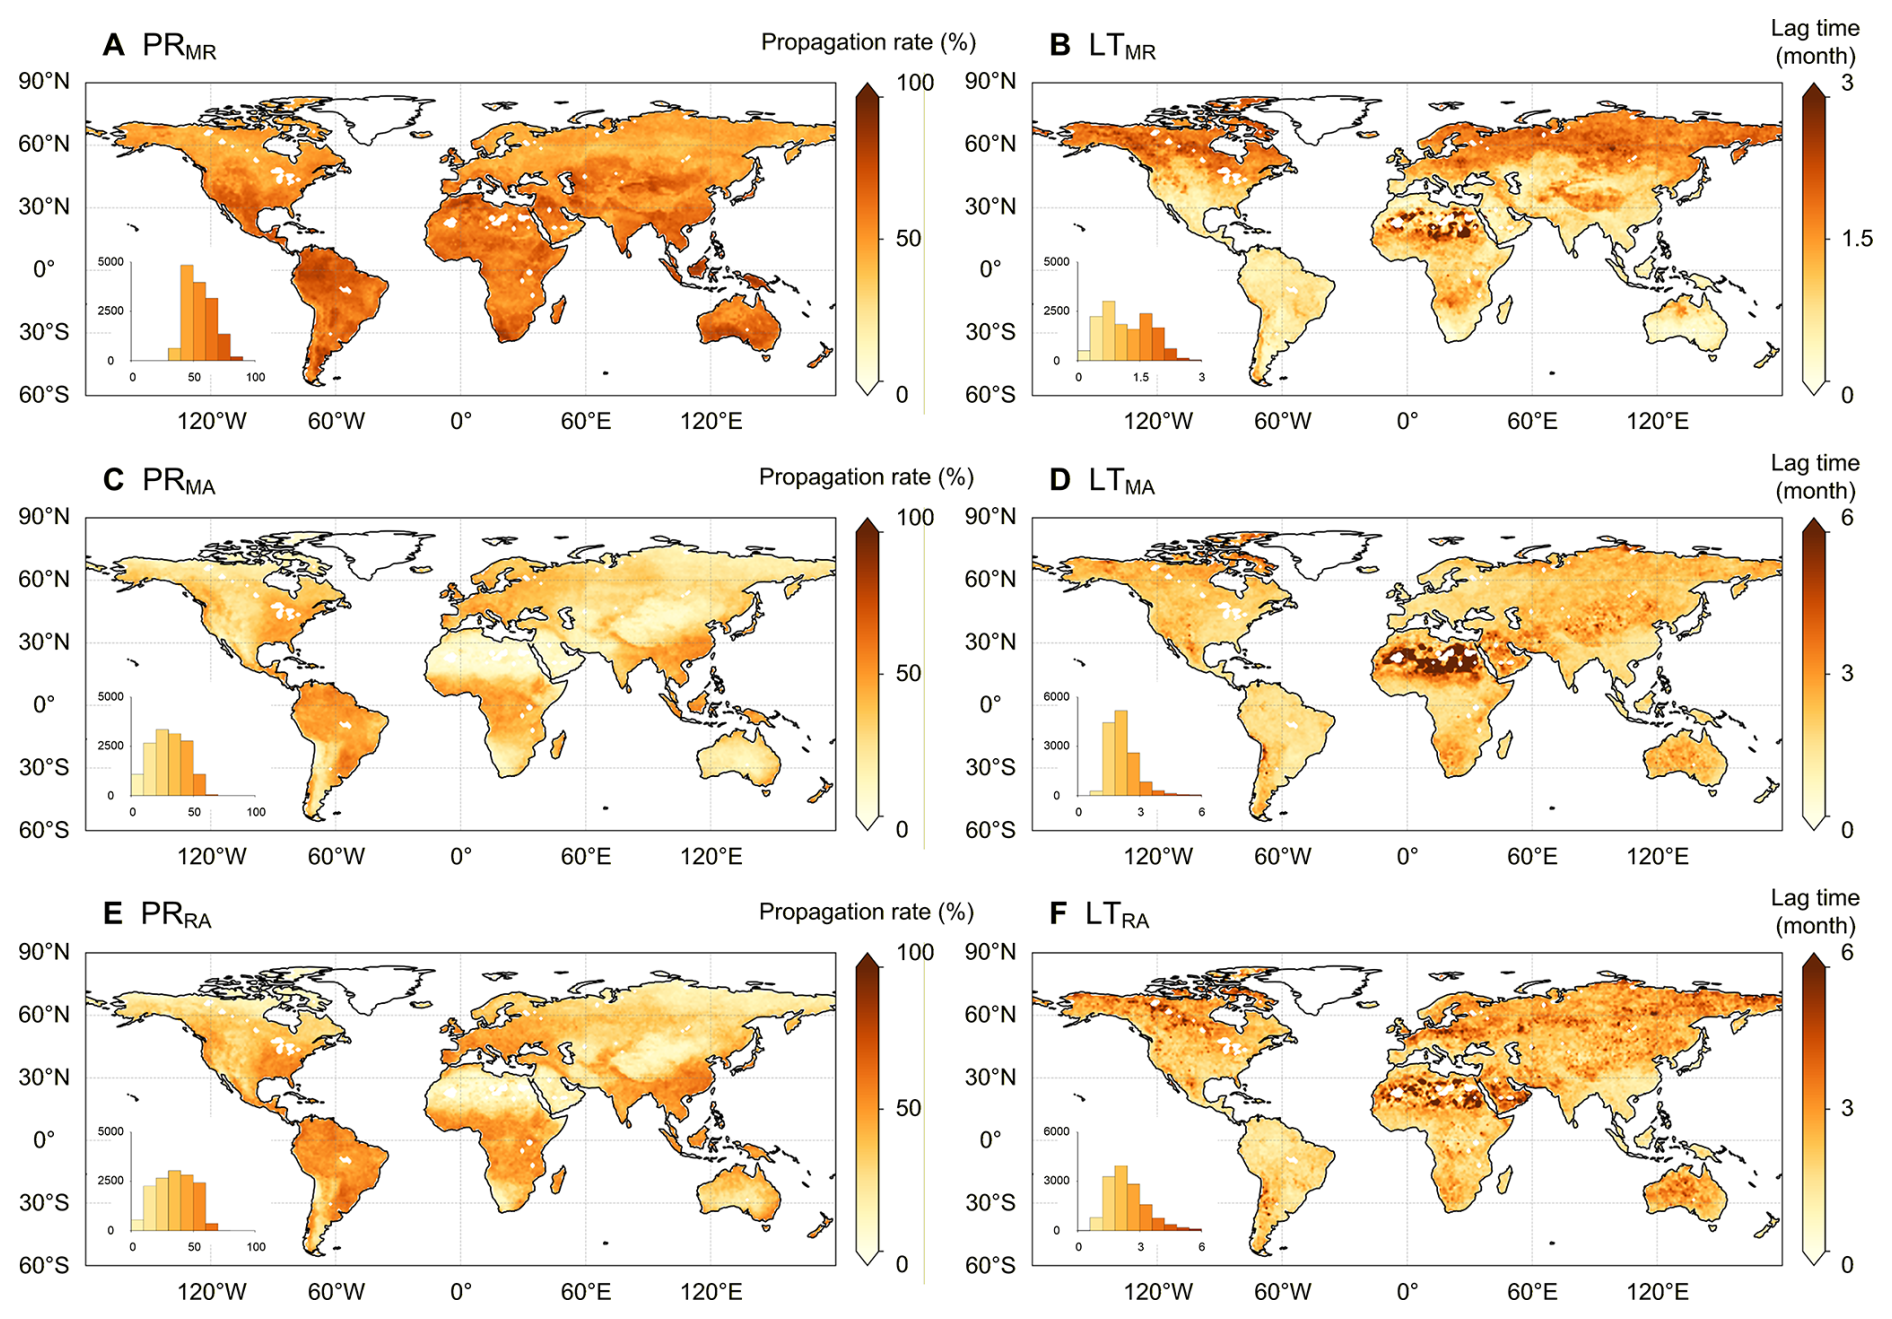
Figure 4Spatial patterns of propagation rate (PRMR, PRMA and PRRA) and lag time (LTMR, LTMA and LTRA) derived from the ensemble of ERA5, GLDAS, and TerraClimate datasets across global land areas. The inner plots show the histograms of propagation rate and lag time across global land areas. The value of LTMR is lower those that of LTMA and LTRA, so it is assigned a different colour bar.
3.2 Propagation rate and lag time of drought events
Figure 4 illustrates the spatial patterns of propagation rate and lag time derived from the ensemble of ERA5, GLDAS, and TerraClimate datasets across global land areas. The propagation rate represents the linkages between two kinds of drought events. A high propagation rate indicates that subsequent drought events are more sensitive to prior drought events. Among three pairs of drought propagation, the propagation rate from meteorological to runoff droughts is highest, with a global average PRMR value of 55.3 % and an IQR of [46.4, 63.2] %. Spatially, a higher PRMR (larger than 60 %) tends to occur in mid- and low-latitude regions as well as in low-altitude areas, and is often associated with a shorter LTMR (less than 1 month). The average LTMR across global land areas is 1.23 months, with IQR of [0.68, 1.68] months. Consistent with the correlation analysis between SPI and SRI, the propagation from meteorological drought to runoff drought is significantly influenced by regional temperature conditions. Tropical and subtropical regions exhibit a higher propagation rate and a shorter lag time from meteorological drought to runoff drought. The average PRMA and PRRA over global land areas are 30.3 % and 35.0 %, respectively, with the IQRs being [19.3, 41.5] % and [23.0, 47.6] %; and average LTMA and LTRA are 2.60 and 2.49 months, with the IQRs being [1.71, 2.92] and [1.68, 2.51] months. The higher PRMA and PRRA (larger than 40 %) along with the shorter LTMA and LTRA (less than 2 months) trend to occur in humid regions, such as eastern North America, South America, central Africa, and southeastern Asia.
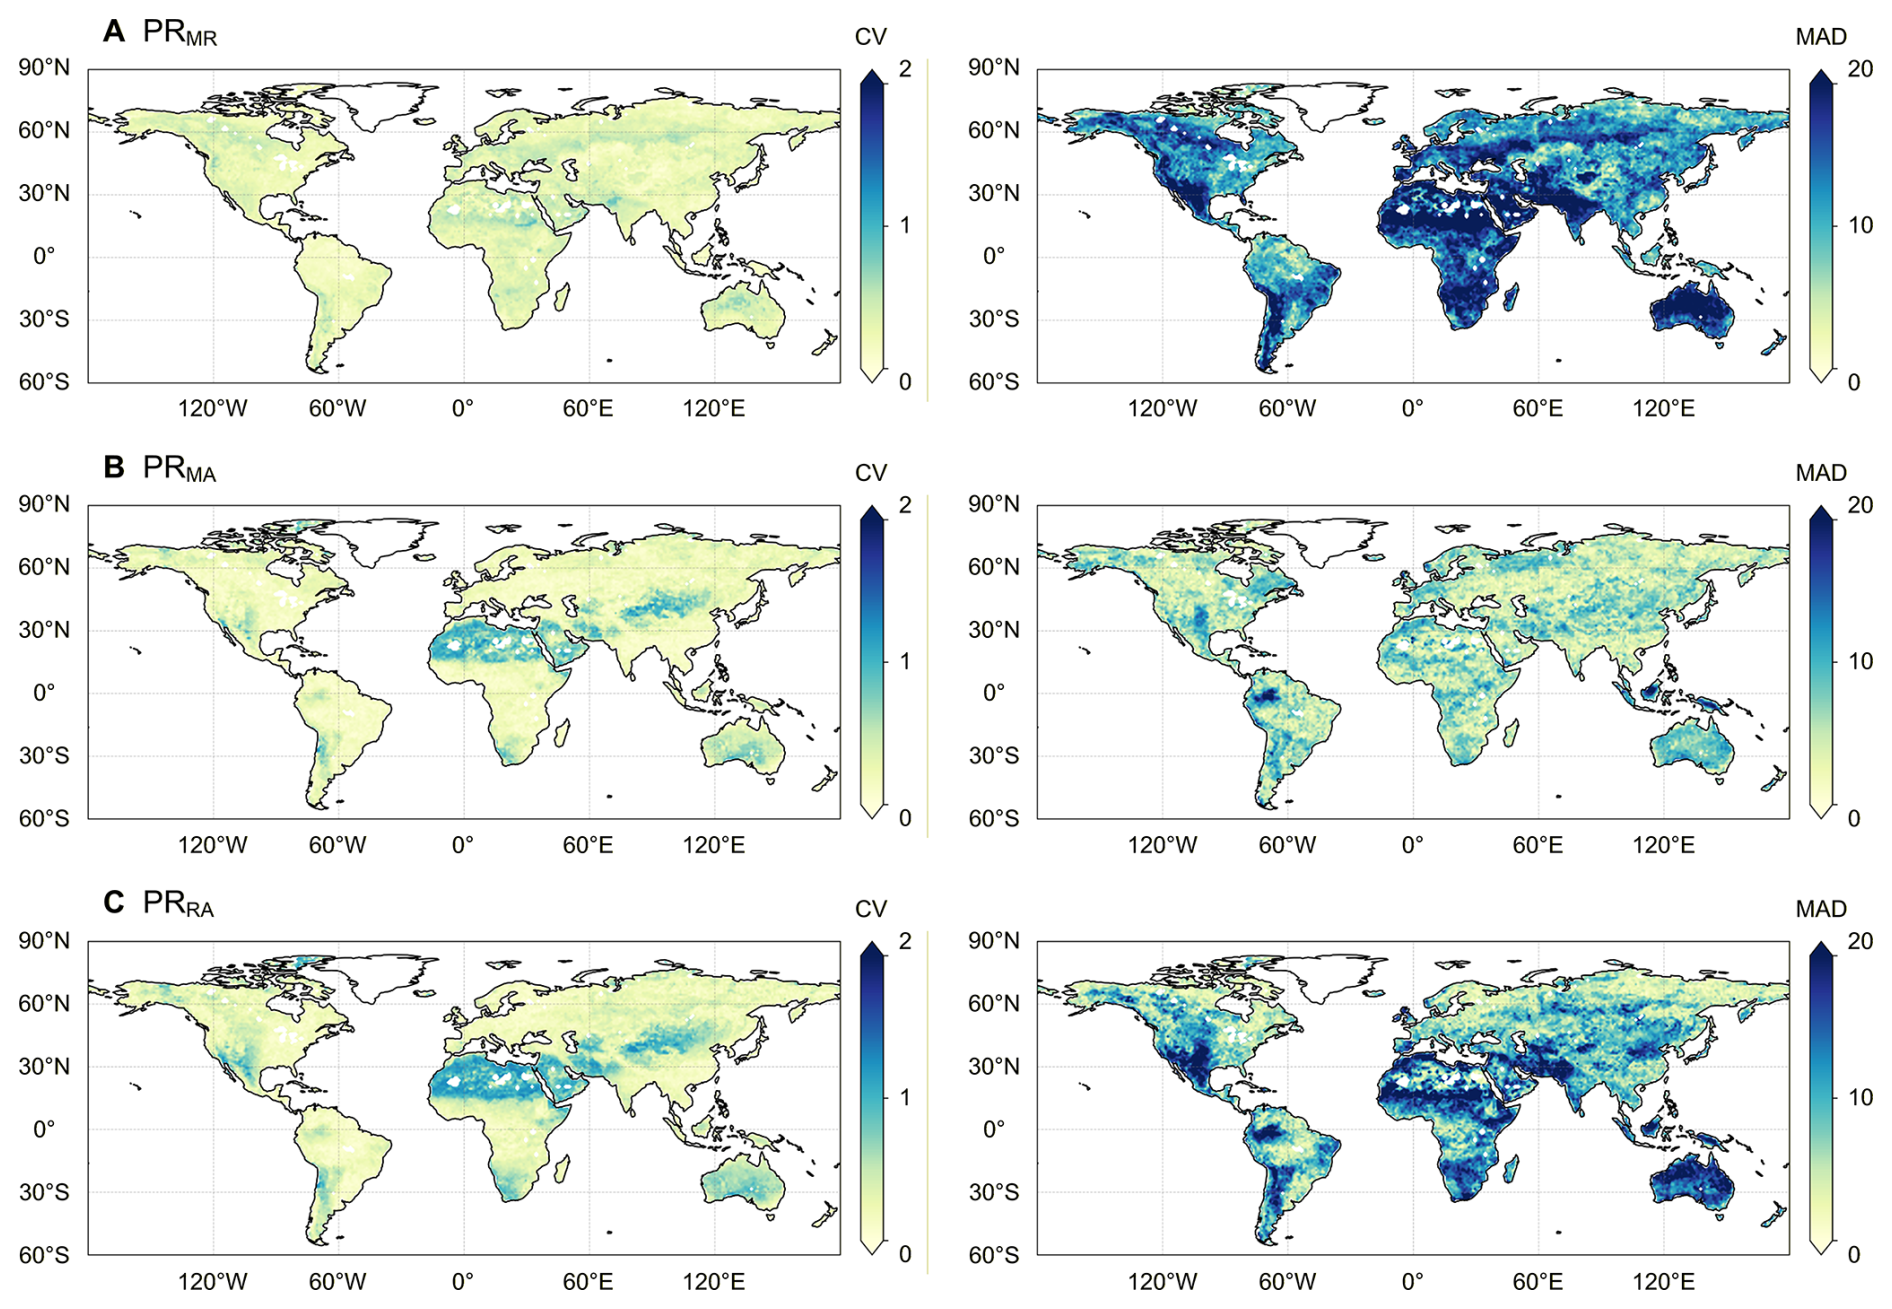
Figure 5Spatial patterns of CV and MAD across the ERA5, GLDAS, and TerraClimate datasets for the propagation rate from meteorological to runoff droughts (PRMR), from meteorological to agricultural droughts (PRMA), and from runoff to agricultural droughts (PRRA).
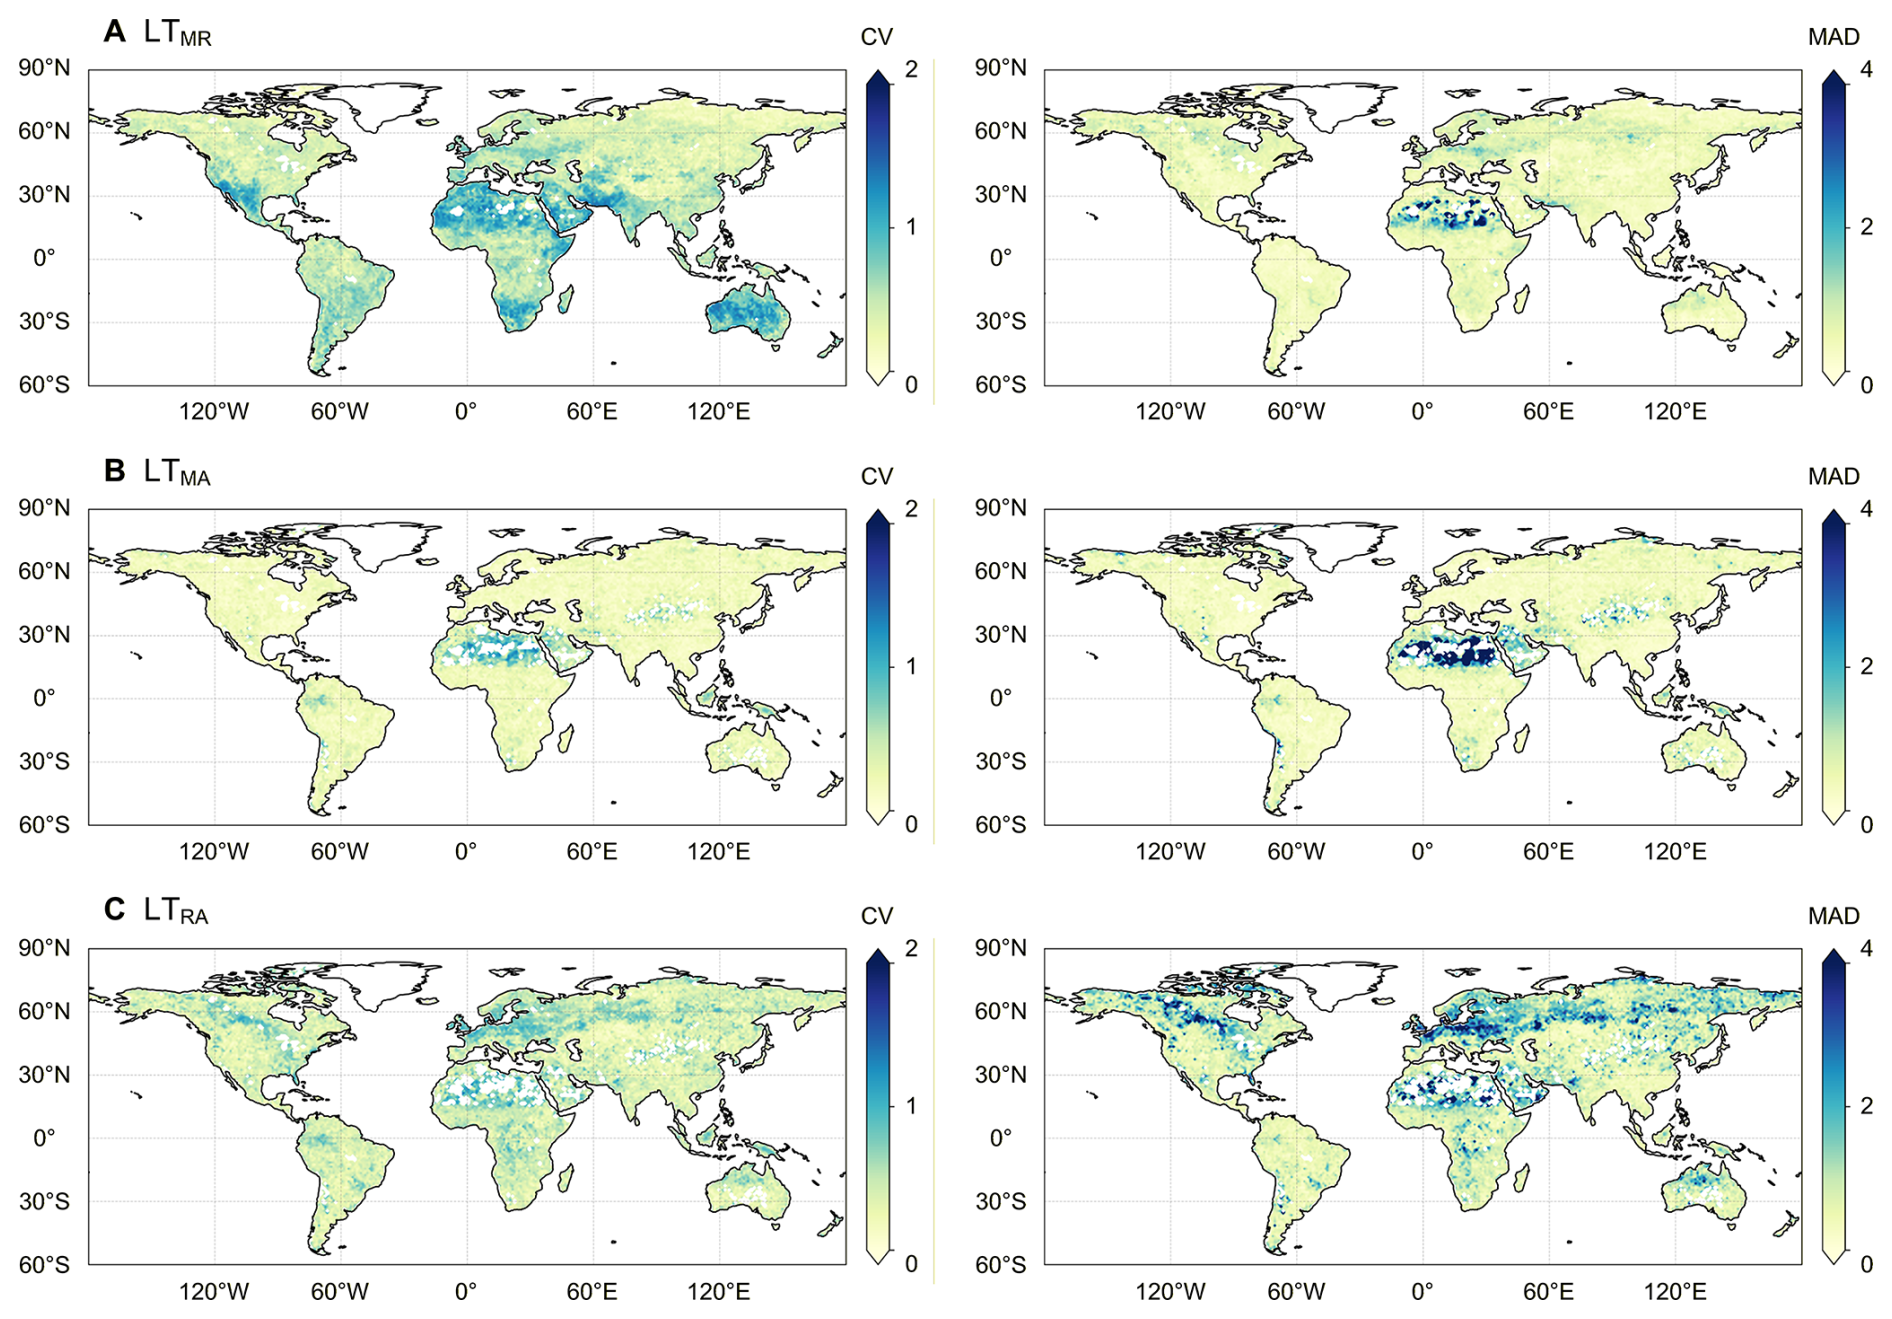
Figure 6Spatial patterns of CV and MAD across the ERA5, GLDAS, and TerraClimate datasets for the lag time from meteorological to runoff droughts (LTMR), from meteorological to agricultural droughts (LTMA), and from runoff to agricultural droughts (LTRA).
Figures 5 and 6 illustrate the spatial patterns of CV and MAD for propagation rate and lag time. The spatial patterns of propagation rate and lag time across the ERA5, GLDAS, and TerraClimate datasets are shown in Figs. S3 and S4. For different datasets, the average fluctuation ranges of PRMR, PRMA and PRRA are [44.3, 72.8] %, [26.9, 33.6] %, and [24.9, 43.5] %, and those of LTMR, LTMA and LTRA are [0.69, 1.49] month, [2.05, 3.03] month, and [1.87, 3.46] month, respectively. Consistent with the response time results, the PRMA and LTMA exhibited smallest differences across different datasets with low CV and MAD. In comparison, the relatively large differences were observed in the PRMR, PRRA, LTMR, and LTRA, especially in regions where in-situ observations are scarce. The highest PRMR and lowest LTMR values are found in the TerraClimate datasets, with PRMR values in the low and middle latitudes approaching 90 % and LTMR values approaching less than 1 month, respectively. In the ERA5 dataset, the relatively low PRMR and high LTMR values are found in the high latitudes of the Northern Hemisphere; while in the GLDAS dataset, the relatively low PRMR and high LTMR values are found in the hyper-arid regions, such as Sahara and the Arabian Peninsula. The highest PRMR value is detected in the ERA5 dataset, with an average value of 33.6 % across global land areas, followed by GLDAS (30.2 %) and TerraClimate (26.9 %). The average PRMA values are 2.05 months, 2.70 months, and 3.03 months for the ERA5, GLDAS, and TerraClimate datasets, respectively. This suggests that the ERA5 reanalysis reveal a significant global sensitivity of agricultural drought to meteorological drought. Similarly, agricultural drought exhibits greater sensitivity to runoff drought, as evidenced by the simulations in the GLDAS dataset. The average PRRA values are 36.4 %, 43.5 %, and 24.9 % for ERA5, GLDAS, and TerraClimate datasets, respectively, while the corresponding average LTRA values are 3.46 months, 1.87 months, and 2.08 months.
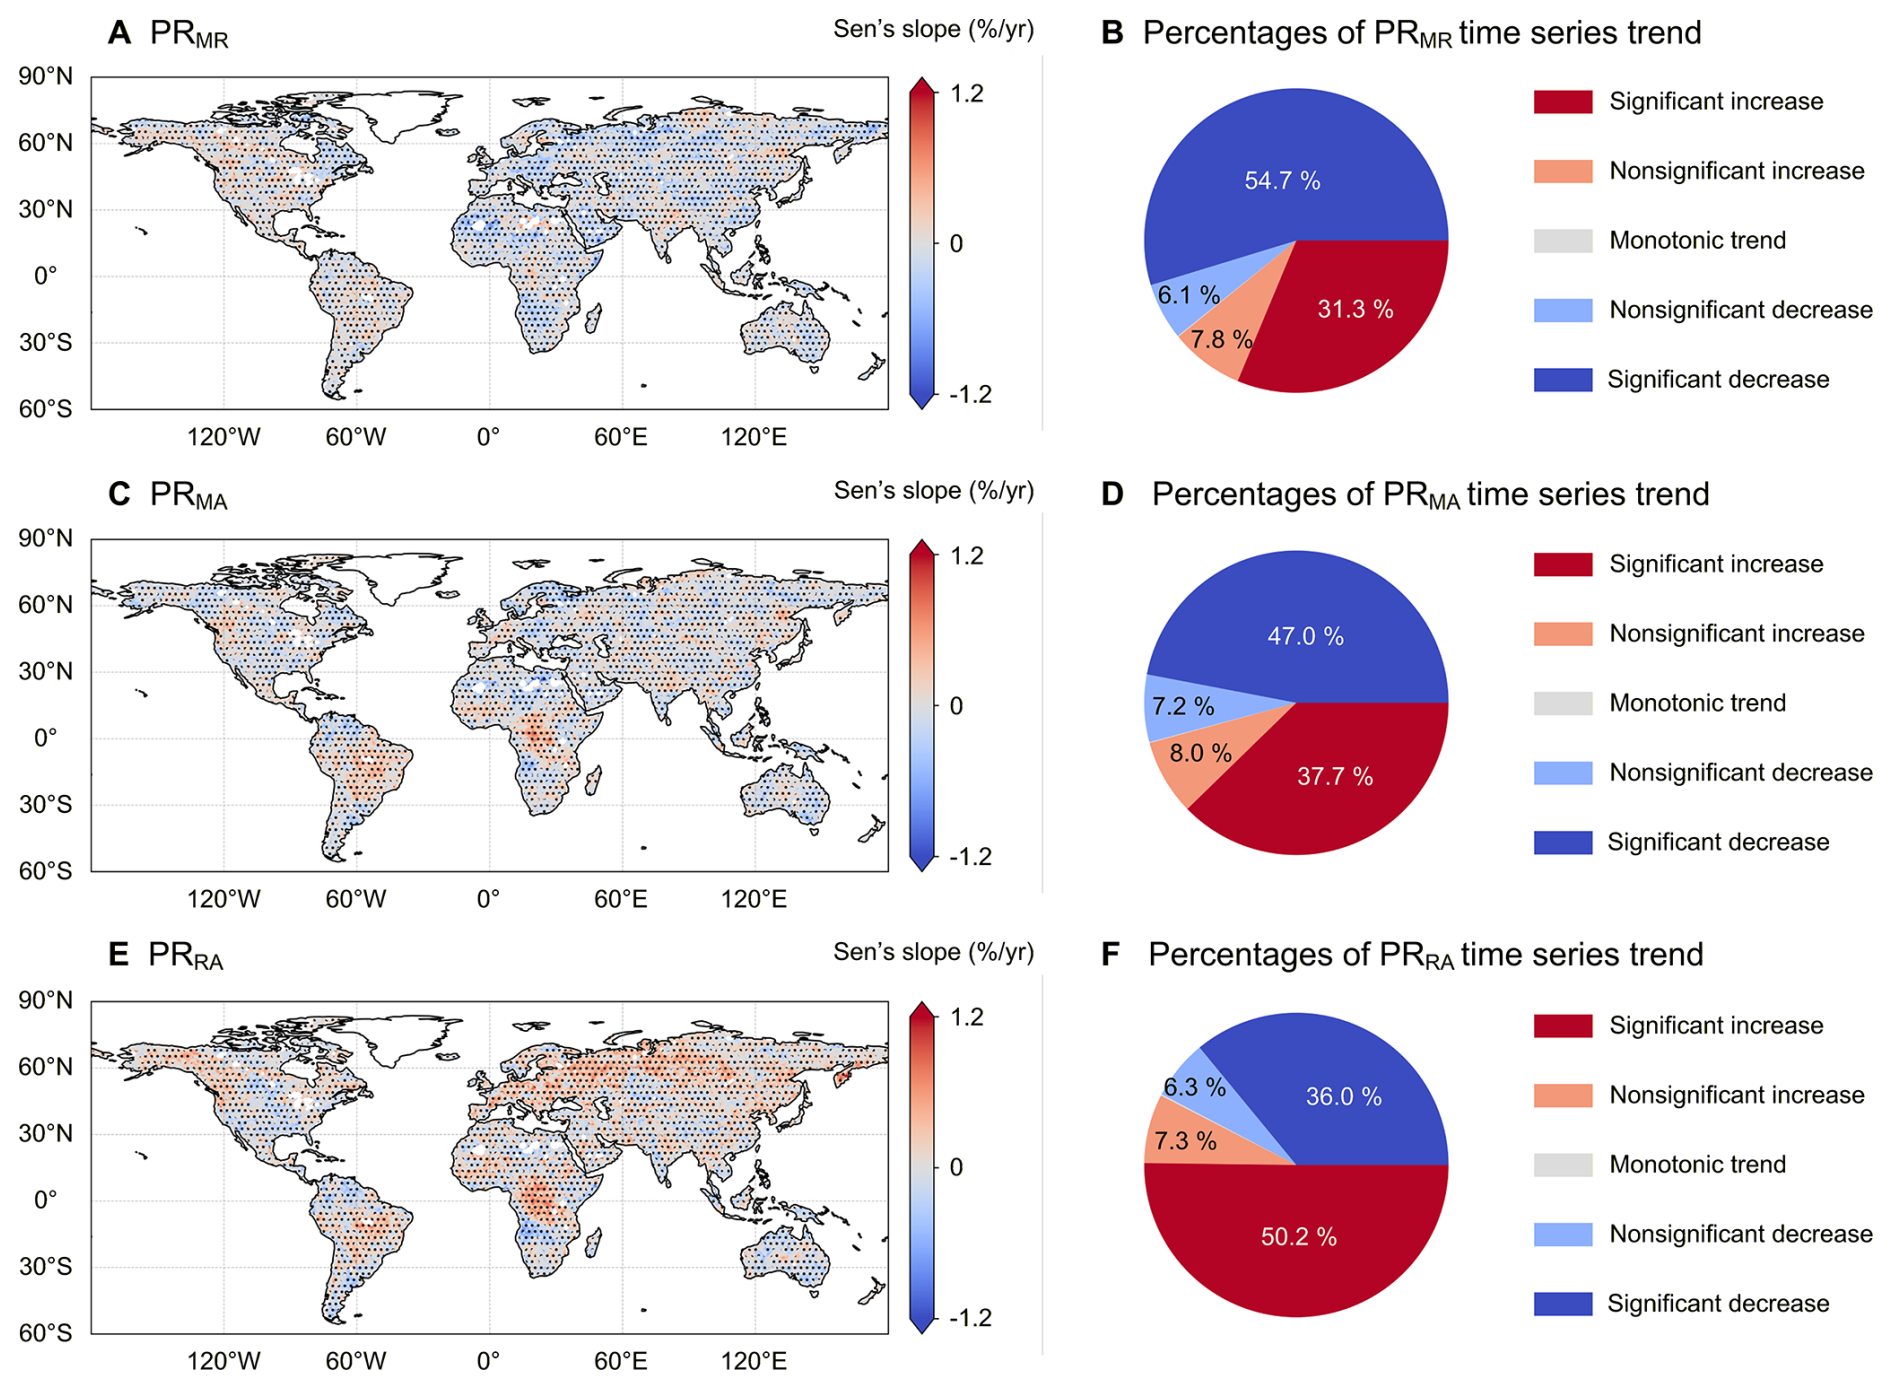
Figure 7Spatial patterns of time series trends in the PRMR, PRMA and PRRA across global land areas. The blank grids indicate that the data is missing in one of the ERA5, GLDAS, and TerraClimate datasets. The black dots indicate the statistical significance of the time series trend, where the p value of the TFPW-MK test is less than 0.05. A significant increase (decrease) indicates that the Sen's slope is greater (less) than 0 and that the p value of the TFPW-MK test is less than 0.05. A nonsignificant increase (decrease) indicates that the Sen's slope is greater (less) than 0 and that the p value of the TFPW-MK test is greater than 0.05. A monotonic trend indicates that Sen's slope is equal to 0.
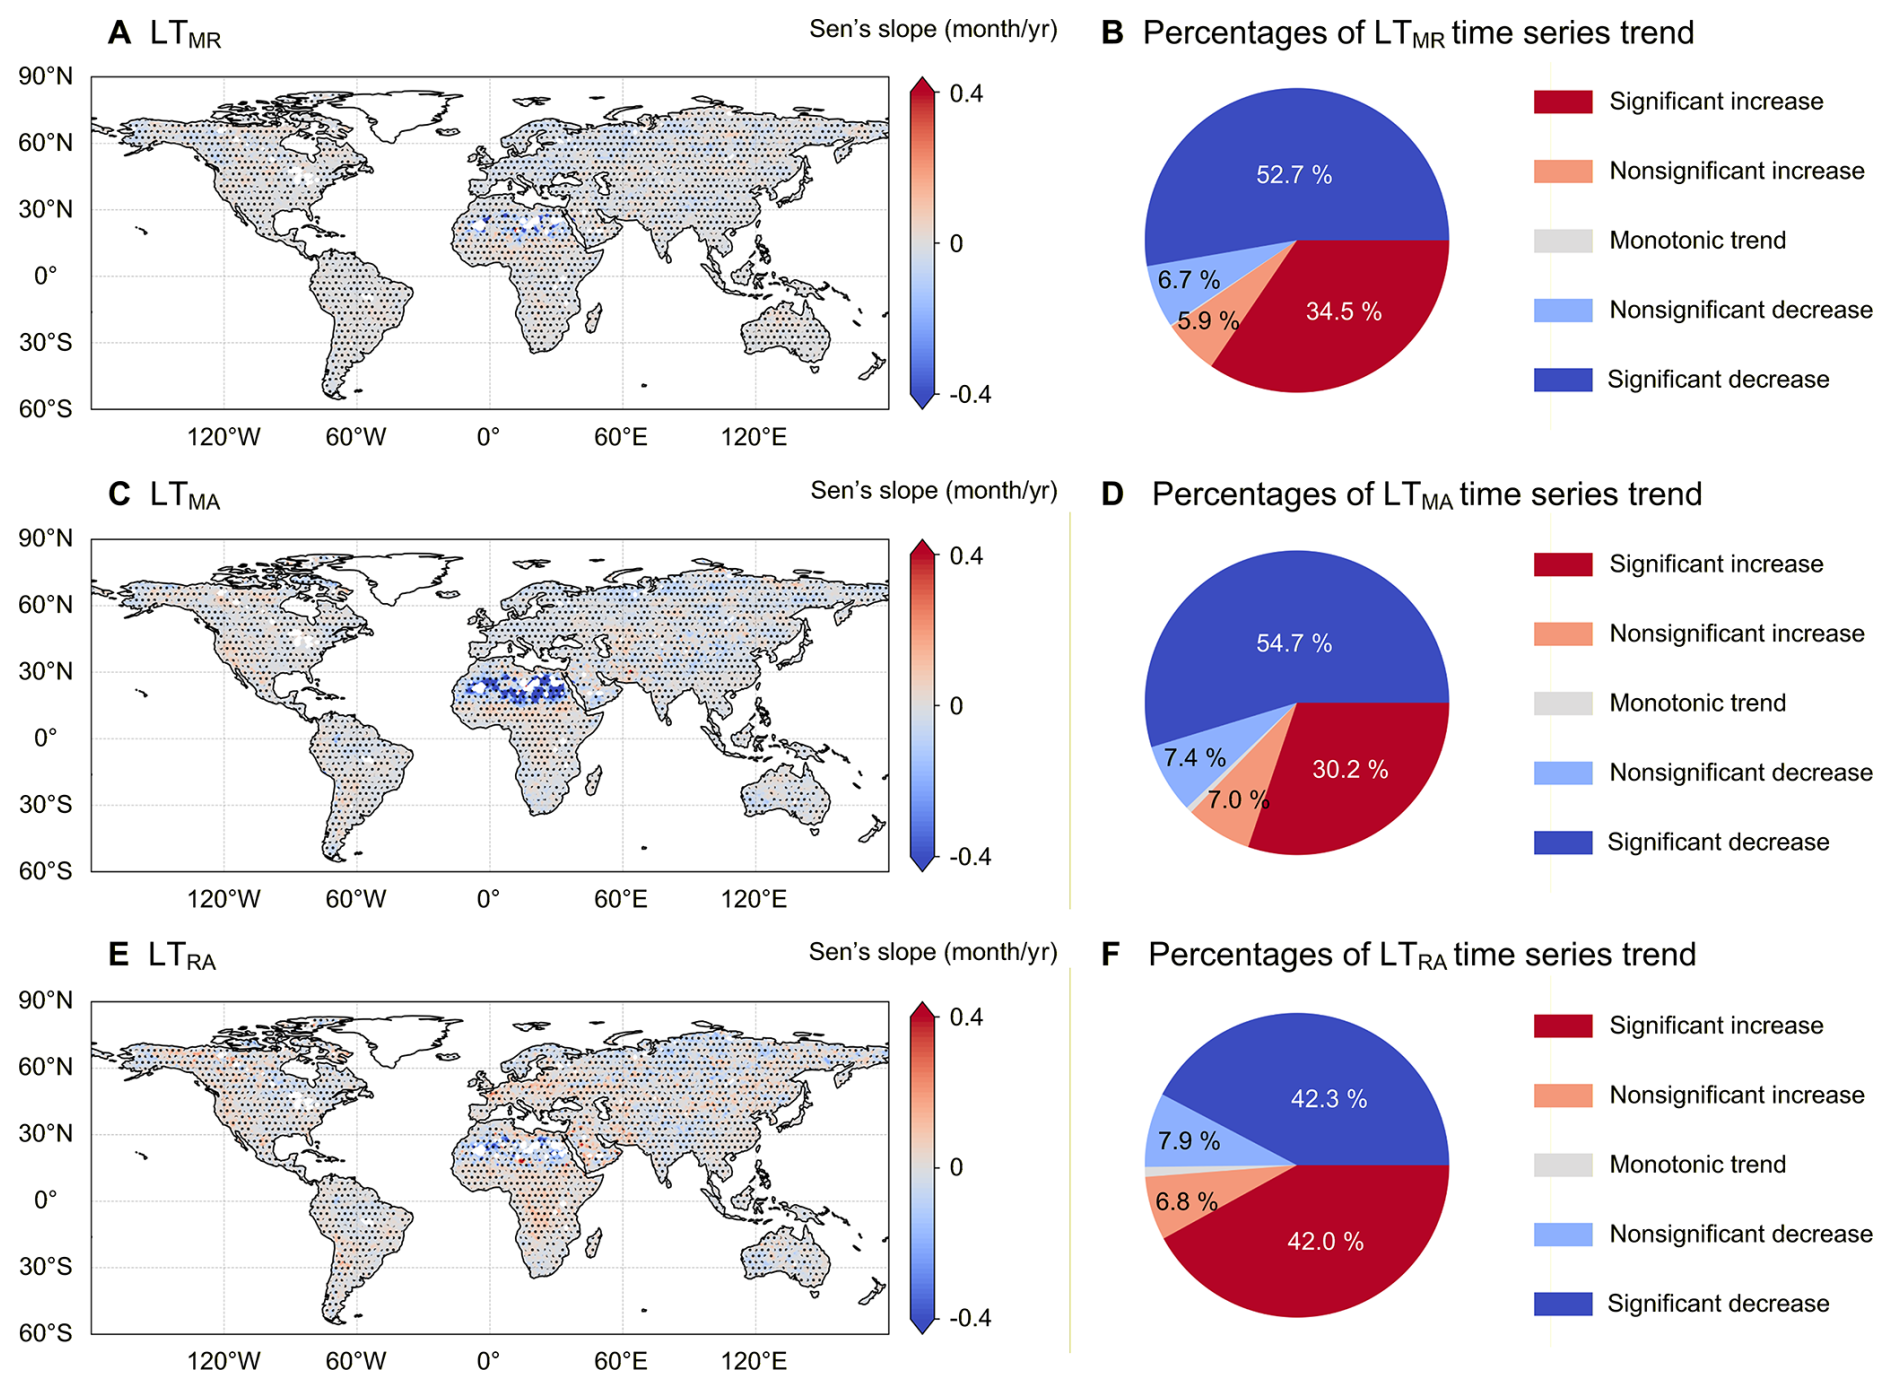
Figure 8Spatial patterns of time series trends in the LTMR, LTMA and LTRA across global land areas. The blank grids indicate that the data is missing in one of the ERA5, GLDAS, and TerraClimate datasets. The black dots indicate the statistical significance of the time series trend, where the p value of the TFPW-MK test is less than 0.05. A significant increase (decrease) indicates that the Sen's slope is greater (less) than 0 and that the p value of the TFPW-MK test is less than 0.05. A nonsignificant increase (decrease) indicates that the Sen's slope is greater (less) than 0 and that the p value of the TFPW-MK test is greater than 0.05. A monotonic trend indicates that Sen's slope is equal to 0.
Figures 7 and 8 illustrate the spatial distributions of temporal trends in propagation rate and lag time across global land areas, based on a 30-year moving window analysis from year 1958 to 2024. The propagation rate and lag time derived from the runoff theory can be calculated from the grid using continuous meteorological and runoff data; therefore, blank grids indicate missing data in at least one of the ERA5, GLDAS, or TerraClimate datasets. The PRMR shows a significant decline across 49.0 % of global land areas, while the corresponding LTMH exhibits a notable decrease in 47.8 %. This indicates a reduced propagation from meteorological drought to runoff drought in nearly half of the global land area. In contrast, the PMH (LTMH) shows a significant increase across 28.1 % (29.6 %) of global areas, particularly in the North America and South America. Although more than 42.5 % (50.9 %) of the land area exhibits a significant decreasing trend in PRMA (LTMA), notable increasing trends are observed in the western North America, central South America, and central Africa. For the PRRA, the land areas experiencing increasing trends (significant percentages of 46.7 %) are more extensive than those showing decreasing trends (significant percentages of 31.7 %). Notable increase trends are observed in the western North America, central South America, central Africa, Europe, and northern Asia. Similar spatial patterns are observed in the LTRA, with significant increases and decreases accounting for 37.0 % and 38.3 %, respectively.
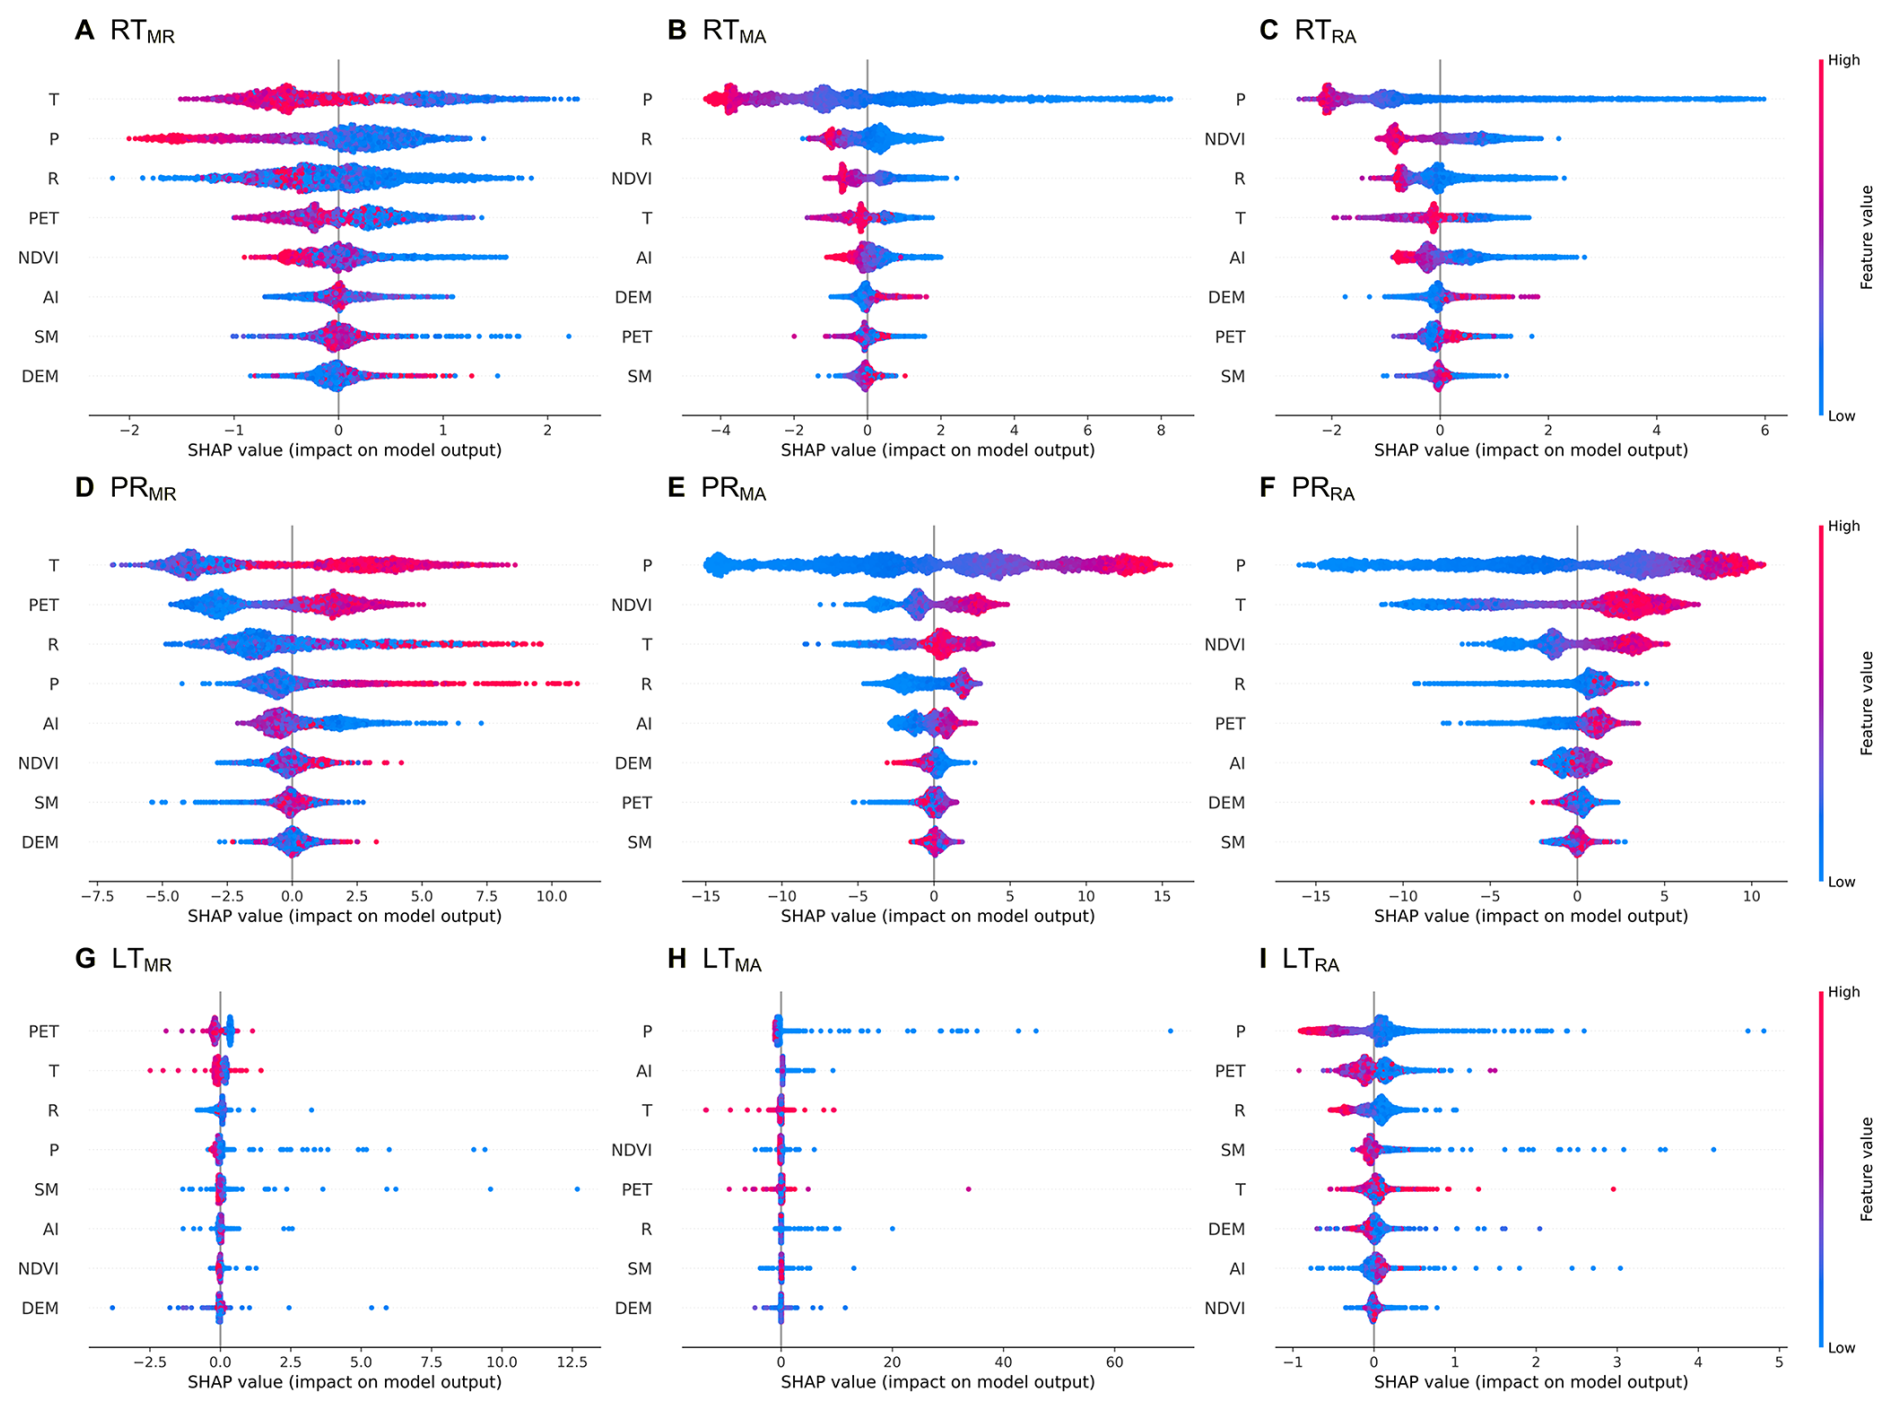
Figure 9Scatter plots of SHAP values for factors influencing response time, propagation rate, and lag time across global land areas. (P: precipitation, T: temperature, PET: potential evapotranspiration, R: runoff, SM: soil moisture, AI: aridity index, DEM: elevation, NDVI: vegetation condition).
3.3 SHAP-based attribution of drought propagation characteristics
Using different drought propagation characteristics as the target variables, nine XGBoost models were established. The validation sets of these models yielded satisfactory evaluation results (Table S1 in the Supplement), which can substantiate the attribution results. Spatial analysis of drought propagation indicates that regional climatic conditions and physiographical characteristics significantly influence the patterns and dynamics of drought propagation. In this study, we conducted an in-depth analysis of the influence of climate, topography and vegetation conditions on the processes of drought propagation, using a SHAP-based attribution method. Figure 9 presents the SHAP values of eight factors that influence drought propagation characteristics across global land areas, including precipitation, temperature, potential evapotranspiration, runoff, soil moisture, aridity index, elevation, and vegetation condition. The SHAP value reflects both the direction and magnitude of the influence of factors on drought propagation characteristics. A positive SHAP value indicates that the factor has contributed to an increase in response time, propagation rate, and lag time. For example, considering the influence of temperature on the RTMR, the SHAP value indicates that regions with higher average temperatures trend to have shorter response times from meteorological to runoff droughts (Fig. 9A). The scatter plots of SHAP values indicate that precipitation, temperature, potential evapotranspiration, runoff, aridity index, and NDVI are all positively correlated with the three drought propagation characteristics. Particularly, the elevation is negatively correlated with drought propagation characteristics, whereas soil moisture exhibits an inconsistent correlation with these characteristics.
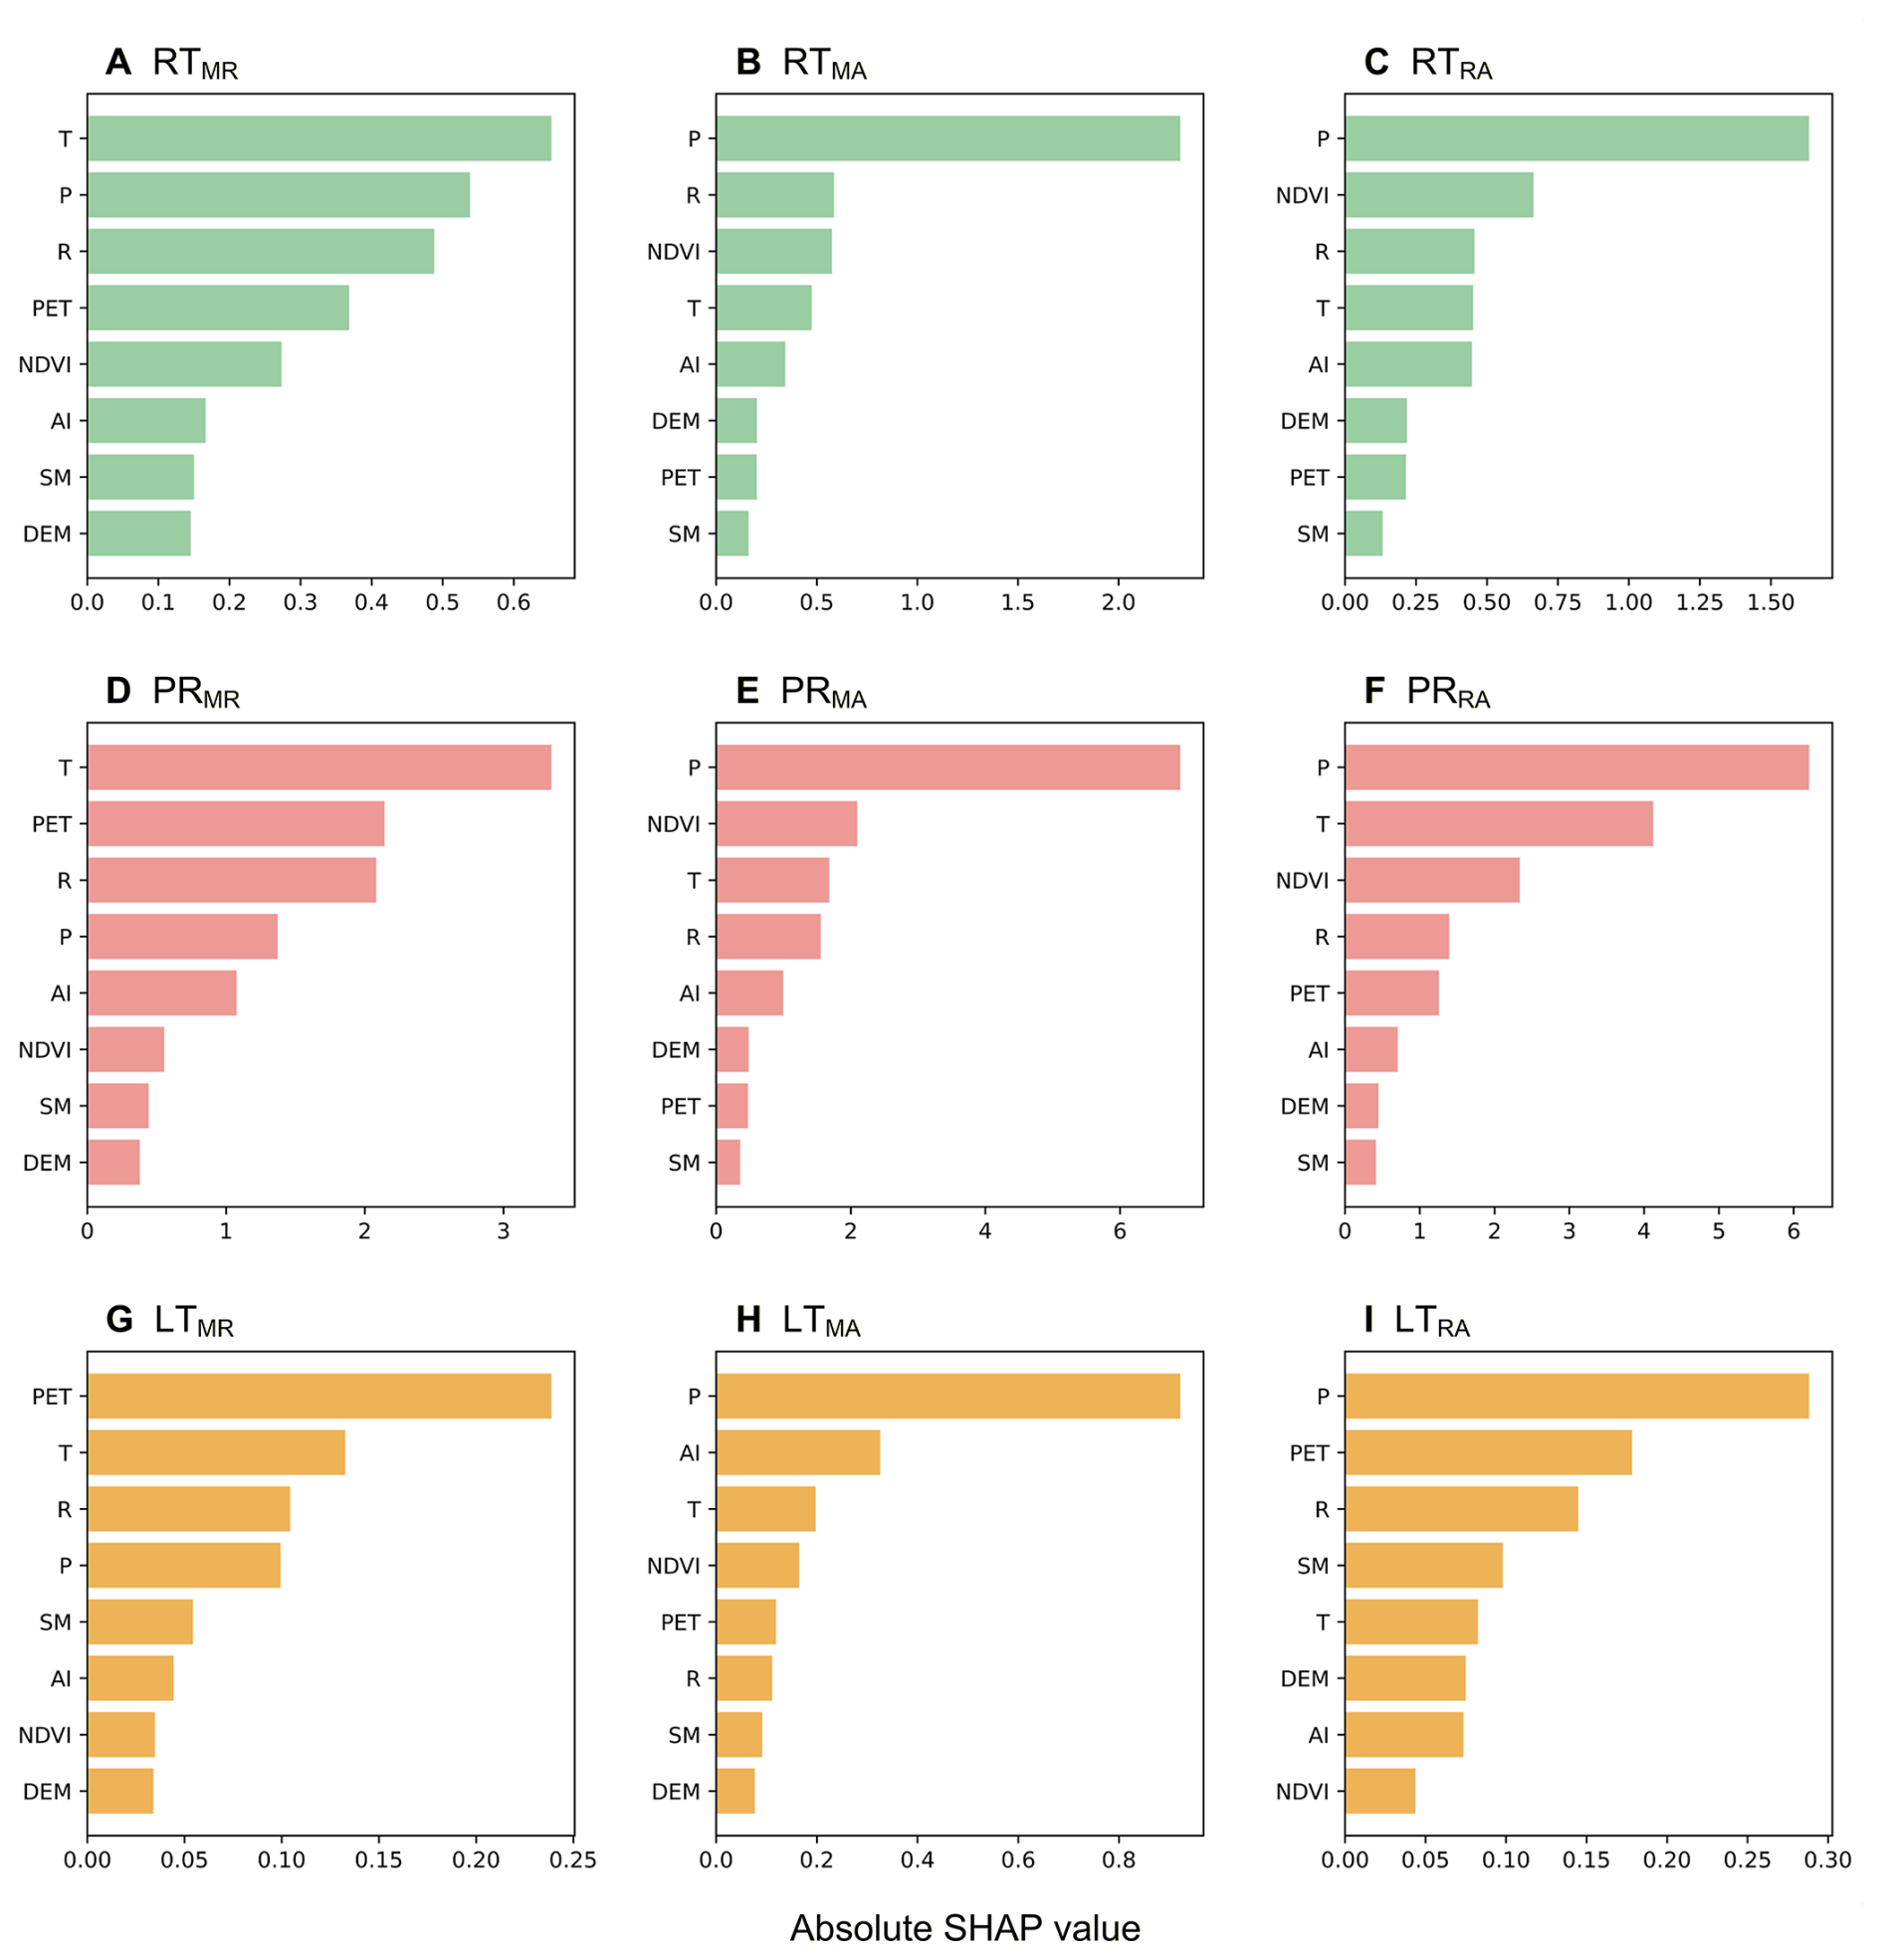
Figure 10Ranking of factors influencing drought propagation characteristics based on the absolute SHAP value.
Figure 10 presents the ranking of factors that influence drought propagation characteristics, based on the absolute SHAP values, which is consistent with the scatter plots of SHAP values. The greater the absolute value of SHAP, the more significant its influence on the characteristics of drought propagation. Temperature and potential evapotranspiration are the most significant factors that influence the propagation of meteorological drought into runoff drought. The average absolute SHAP values of temperature (potential evapotranspiration) for RTMR, PRMR, and LTMR are 0.65 (0.37), 3.34 (2.14), and 0.13 (0.24), respectively, ranking first (fourth), first (second), and second (first) among all influencing factors. This result indicates that in warm regions characterized by higher average temperatures and potential evapotranspiration, runoff drought is more sensitive to meteorological drought, thus having a faster response time and a shorter lag time. In comparison, precipitation serves as the main influencing factor in the propagation from both meteorological and runoff droughts to agricultural drought. Among all factors considered for RTMA, RTRA, PRMA, PRRA, LTMA, and LTRA, precipitation exhibits the highest average absolute SHAP value. The differences in SHAP values among other factors are not obvious and vary depending on the distinct characteristics of drought propagation. In humid regions, agricultural drought trends to be more sensitive to meteorological and runoff drought conditions.
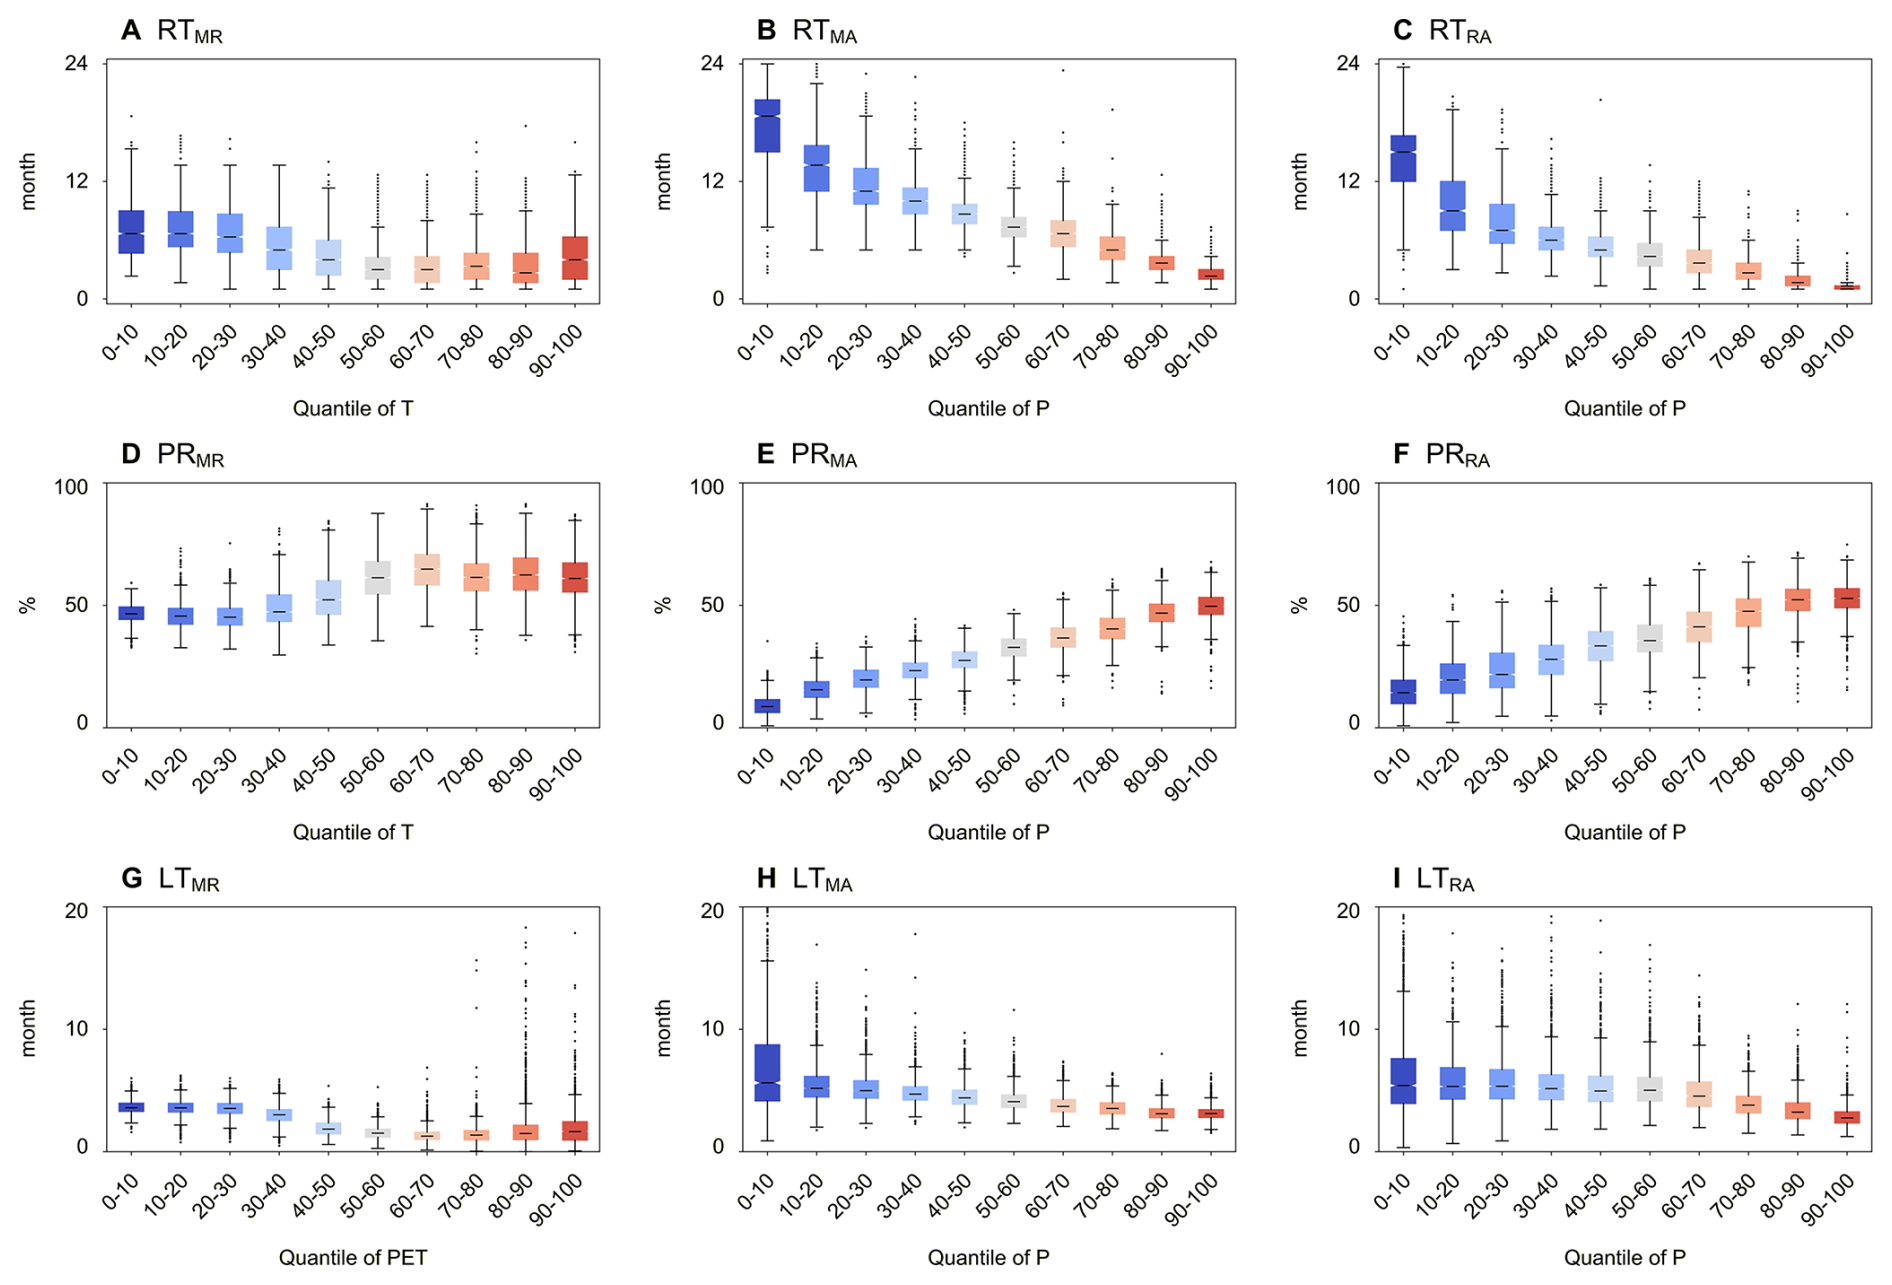
Figure 11Box plots of drought propagation characteristics across global land areas classified by the percentiles of dominant factors. The dominant factor is temperature for RTMR, PRMR, PET for LTMR, and precipitation for the other characteristics.
Figure 11 presents the boxplots of response time, propagation rate, and lag time across global land areas, grouped based on the percentiles of dominant factors identified through SHAP attribution analysis. The meteorological-to-runoff drought propagation characteristics are primarily influenced by regional temperature and PET, with the non-monotonic behaviour predominantly observed in the 30th to 70th percentiles of temperature and PET. In this percentile range, both RTMR and LTMR decrease as temperature and PET increase, while PRMR increases as temperature and PET increase. This result indicates that as temperature and PET increase, runoff drought becomes more sensitive to meteorological drought, and this relationship remains robust within the intermediate ranges of temperature and PET. For example, the average RTMR is 6.61 months in the 20th to 30th percentiles, decreasing to 3.43 months in the 60th to 70th percentiles; meanwhile, the average RTMR is 6.88 months in the 0th to 10th percentiles and 4.60 months in the 90th to 100th percentiles. In comparison, the propagations from meteorological and runoff droughts to agricultural drought are mainly derived by the regional precipitation patterns. The average RTMA, RTRA, LTMA, and LTRA consistently decrease with increasing percentiles of precipitation, whereas the average PRMA, PRRA increase with increasing percentiles of precipitation. This indicates that agricultural drought driven by soil moisture deficits is more sensitive to meteorological and runoff droughts in humid regions, showing a strong linear correlation with regional precipitation patterns.
4.1 Physical interpretation of drought propagation characteristics
In this study, two distinct methodological frameworks were employed to quantify drought propagation: (1) the response time derived from time-lag correlation analysis, and (2) the lag time based on event identification using the run theory. Response time is determined by identifying the accumulation period of a drought index (e.g., SPI) that maximizes its correlation with a target drought index (e.g., SSI at a 1-month accumulation timescale) (López-Moreno et al., 2013; Zhang et al., 2022). This approach reflects the overall synchronicity and statistical memory characteristics of various drought conditions. Thus, the response time values are strongly influenced by long-term variations in regional climatic and hydrological conditions, such as the seasonal cycle, multi-year climate oscillations, and water storage capacity. The response time refers to the system's long-term state that retains a memory of past drought conditions. The evaluation of response time is beneficial for seasonal drought predictability and long-term drought preparedness. The response time also functions as an indicator of the feasibility of using one type of drought index as a proxy for another. For example, due to the lack of comprehensive observational data, the SPI with varying accumulation periods can reflect hydrological, agricultural and groundwater drought conditions (Kumar et al., 2016).
In comparison, lag time is derived from discrete drought events identified using the multi-threshold run theory, which measures the time difference between the onset of one drought event and the onset of another drought event. By focusing on event-based dynamics, the lag time reflects the instantaneous triggering mechanism by which drought signals propagate from the atmosphere to the land surface. Numerous previous studies have analyzed the threshold of extreme stress that triggers drought propagation, using methods such as copula functions, hydrological models, and machine learning (Geng et al., 2024; Yang et al., 2025). The lag time captures the non-linear response mechanism between different drought conditions at a short time scale, which is crucial for real-time early warning and impact assessment.
Our results provide a globally consistent comparison of the response time and lag time for meteorological, runoff, and agricultural drought propagation. The response time of drought propagation (average RTMR, RTMA, and RTRA of 5.0 [2.7, 6.7] months, 8.7 [5.0, 11.3] months, and 5.8 [2.3, 7.3] months) is generally longer than the lag time (average LTMR, LTMA, and LTRA of 1.23 [0.68, 1.68] months, 2.60 [1.71, 2.92] months, and 2.49 [1.68, 2.51] months). This numerical gap arises from differences in the methodology, but both approaches indicate a consistent propagation pathway for meteorological, runoff, and agricultural droughts, with similar spatial patterns. In addition, the machine learning-based attribution method also identifies similar impact factors, which indicates the consistency of drought propagation mechanisms revealed by response time and lag time. This aligns with the conceptual framework of drought propagation, where precipitation deficits (meteorological drought) first influence runoff generation over the land surface (runoff drought), and subsequently affect soil moisture in the root zone (agricultural drought).
4.2 Main factors influencing drought propagation
Across the global land areas, the drought propagation characteristics exhibit notable spatial heterogeneity. Regions such as South America, eastern North America, central Africa, and southeastern Asia demonstrate shorter response times, higher propagation rates, and longer lag times across meteorological, runoff, and agricultural droughts (Figs. 1 and 4). In our analysis, XGBoost models incorporating the SHAP-based attribution method were employed to quantify the impacts of climatic, topographic, and vegetation-related features on drought propagation. Our findings demonstrate that temperature and PET are the key factors influencing the propagation from meteorological to runoff drought, while precipitation predominantly determines the propagation from meteorological/runoff to agricultural drought. This is consistent with previous studies highlighting the significant role of climate characteristics in drought propagation (Apurv et al., 2017). Specifically, the non-monotonic behaviour of meteorological-to-runoff drought propagation characteristics mainly occurred in the range of 20th to the 70th percentiles for temperatures and PET. In the subtropical regions, shorter RTMR and LTMR with low PRMR trend to occur in regions characterized by higher average temperature and PET (Fig. 11). This is primarily attributed to the influence of temperature on the snow-related processes of the water cycle, resulting in a delayed response of runoff to changes in precipitation. During cold seasons, precipitation is stored in the form of snow and ice in glaciers, which subsequently melt and contribute to runoff during the following warm season. Therefore, the sensitivity of runoff drought to meteorological drought is significantly influenced by temperature variations. In comparison, the sensitivity of agricultural drought to meteorological and runoff droughts is closely associated with the regional average precipitation. This is because deep soil layers and aquifers in humid regions generally exhibit high saturation levels, where fluctuations in soil moisture demonstrate a more significant response to variations in precipitation and runoff.
4.3 Comparison of drought propagation in different datasets
A wide variety of meteorohydrological datasets are available for drought monitoring and evaluation. However, a consensus on the most suitable datasets for assessing drought propagation remains elusive across different applications and specific regions. Our results, derived from an ensemble of three different datasets (i.e., ERA5, GLDAS, and TerraClimate), reveal both robust global patterns and notable uncertainties in quantifying drought propagation characteristics. Consistent spatial patterns of drought propagation characteristics – such as shorter RT and LT in tropical and subtropical regions, and longer RT and LT in high-latitude and arid regions – across multiple datasets demonstrate the robustness of drought propagation mechanisms under climatic control. This agreement underscores the fundamental dynamics of drought propagation, which are independent of the methodology and forcing datasets. However, the magnitudes of drought propagation, especially in the meteorological to runoff pathway, also demonstrate significant inter-datasets variability (Figs. 2, 5, and 6). This divergence highlights the inherent uncertainty in drought propagation assessments and points to the distinct strengths and limitations of each dataset.
ERA5 is a high-resolution reanalysis dataset derived from the Integrated Forecasting System, which is forced by atmospheric observations. It generally exhibits higher values of RTMR, RTRA, LTMR, and LTRA, and lower values of PRMR and PRRA in high-latitude regions (Figs. S3–S6). This may more accurately represent the drought propagation in snow-dominated systems where runoff generation processes are complex and exhibit seasonal lags. GLDAS is an ensemble of multiple land surface models and exhibits intermediate drought propagation characteristics with relatively high spatial consistency in correlation coefficients (Fig. S4). This result indicates that the land surface model demonstrates a more robust pattern of drought propagation, and its process-consistent parameterizations may better represent the interrelationships among different drought types. TerraClimate, a statistically downscaled and bias-corrected dataset, consistently yielded the shortest RTMR and LTMR and the highest PRMR, particularly in the mid- to low-latitudes. While this result aligns with the expectation of rapid response in rainfall-dominated regions, the empirical water balance model in TerraClimate may also lead to an overestimation of propagation speed and sensitivity. Our findings rely on the ensemble of multiple datasets, thus avoiding the bias of any single dataset and providing a more robust and consistent understanding of drought propagation.
4.4 Uncertainties and implications in drought propagation evaluation
Drought propagation evaluation relies heavily on drought indices for monitoring and characterizing various drought types. Considering the data availability and the continuity in both temporal and spatial dimensions at the global scale, we employed the SPI, SRI, and SSI to represent meteorological, runoff, and agricultural droughts. Our results demonstrated the propagation pathway of meteorological- runoff-agricultural droughts, which is consistent with previous studies that employed similar indices (Han et al., 2023; Mei et al., 2025). As a multifaceted phenomenon, hydrological drought is a broad term that is related not only to runoff but also to streamflow and the levels of groundwater, lakes, and reservoirs (Van Loon, 2015). Using the drought indices derived from streamflow, the propagation from agricultural to hydrological droughts has also been identified in many studies, particularly at the watershed scale (Odongo et al., 2023; Teutschbein et al., 2025). Runoff is the volume of water that originates from precipitation and flows over the land surface; it is not directly equal to the streamflow in stream channels. A deficit in runoff can directly affect the availability of soil moisture due to reduced recharge to the root zone, representing the propagation from hydrological drought to agricultural drought. In comparison, soil moisture retains precipitation that falls on the land surface and then delays the propagation time form precipitation to streamflow (McColl et al., 2017).
Due to the inherent variability of drought-related variables, significant uncertainties exist within hydrometeorological datasets (Bador et al., 2020). Our findings depend on an ensemble of three datasets (i.e., ERA5, GLDAS, and TerraClimate), which helps avoid biased and incomplete evaluations of drought propagation that could result from relying on a single dataset. We conducted a comparative analysis of drought propagation characteristics derived from multiple datasets, systematically evaluating their consistency and discrepancies (Figs. S3–S6). The results underscore the impact of input data uncertainties on the assessment of drought propagation, with notable discrepancies predominantly observed in the hyper-arid, high-latitude, and high-evaluation regions. Specifically, in hyper-arid regions – where precipitation is extremely low and highly erratic – the calculation of the SPI and SRI becomes statistically unstable; consequently, the correlation between SPI and SRI in such environments can indeed be uninterpretable. This is primarily attributed to the scarcity of in-situ stations capable of providing continuous spatial and temporal observations in these regions. The data assimilation systems and land surface models employed across different datasets to fill missing observations inevitably introduce uncertainties in both model parameters and structural configurations.
Generally, our study provides a comprehensive assessment of multiple drought propagation characteristics across global land areas, which has significant implications for the development and improvement of drought monitoring and early warning systems. In tropical and sub-tropical regions, real-time monitoring of meteorological drought can improve the forecasting of hydrological drought; whereas in humid regions, drought indices based on precipitation and runoff could provide more accurate predictions of agricultural drought risks. Future research could focus on improving the accuracy of predicting future drought changes by incorporating the mechanisms of drought propagation into predictive models. In addition, human activities – such as water abstraction, reservoir regulation, and land-use change – can profoundly modify natural drought propagation processes by altering catchment storage and flow pathways, thereby influencing drought propagation (Wens et al., 2019; Du et al., 2024). While disentangling the effects of human activities on drought propagation at a global scale remains challenging, existing studies have provided valuable evidence of such influences (Long et al., 2026). Future research could also focus on quantitatively disentangling the effects of human activities on drought propagation, particularly at the global scale.
In this study, we systematically assessed the propagation characteristics of multiple drought types from 1958 to 2024 across global land areas. Based on an ensemble of multiple datasets (i.e., ERA5, GLDAS, and TerraClimate), three standardized drought indices (SDIs) derived from precipitation, runoff, and soil moisture were employed to represent meteorological, runoff, and agricultural drought conditions, respectively. The lag time derived from correlation analysis, as well as the response time and propagation rate based on run theory, were examined to characterize the propagation of meteorological, runoff, and agricultural droughts. Furthermore, the XGBoost-SHAP model was utilized to quantify the crucial factors that influence drought propagation. Main findings are: (1) The average response time (RTMR=5.0 months, RTMA=8.7 months, RTRA=5.8 months), propagation rate (PRMR=55.3 %, PRMA=30.3 %, PRRA=35.0 %), and lag time (LTMR=1.23 months, LTMA=2.60 months, LTRA=2.49 months) confirm the propagation pathway of meteorological- runoff-agricultural drought at global scale. (1) Over the past six decades, approximately 40 % of the landmass demonstrates temporal variations in the response time of drought propagation, while approximately 70 % of the landmass shows temporal changes in both propagation rate and lag time. (3) Among the eight climatic, topographic, and vegetation-related factors, temperature and potential evapotranspiration are the primary factors influencing the propagation from meteorological drought to runoff drought, primarily due to the lagging effects associated with snow melting processes. (4) In comparison, precipitation predominantly determines the propagation from meteorological or runoff drought to agricultural drought, due to the hydrological process effects of deep soil moisture and aquifer water. In summary, our study presents a multiple data-driven, global perspective on the propagation of meteorological, runoff, and agricultural drought conditions, offering significant implications for drought monitoring and early warning systems in the context of global warming.
ERA5 reanalysis dataset developed by the European Centre for Medium-Range Weather Forecasts (ECMWF) can be assessed at https://cds.climate.copernicus.eu/ (last access: 1 May 2026). GLDAS dataset is available at https://ldas.gsfc.nasa.gov/. TerraClimate dataset is downloaded from https://www.climatologylab.org/terraclimate.html (last access: 1 May 2026). The code used for this study is available on Zenodo at https://doi.org/10.5281/zenodo.19837802 (Liu, 2026).
The supplement related to this article is available online at https://doi.org/10.5194/hess-30-2775-2026-supplement.
Conceptualization: YL and LY, Data curation: TH and YL, Formal analysis: TH and YL, Funding acquisition: LY, Investigation: TH and YL, Methodology: YL and LY, Software: YL, Validation: JY and YL, Visualization: YL and LY, Writing (original draft preparation): YL and LY, Writing (review and editing): JY and LY.
The contact author has declared that none of the authors has any competing interests.
Publisher's note: Copernicus Publications remains neutral with regard to jurisdictional claims made in the text, published maps, institutional affiliations, or any other geographical representation in this paper. The authors bear the ultimate responsibility for providing appropriate place names. Views expressed in the text are those of the authors and do not necessarily reflect the views of the publisher.
The authors are grateful to the editors, the anonymous reviewers, Yao Wang and Haiyun Shi for their insightful comments and suggestions.
This research is supported by the National Key R&D Program of China (grant no. 2023YFC3205600) and the Natural Science Foundation of Henan (grant no. 252300423280).
This paper was edited by Manuela Irene Brunner and reviewed by Yao Wang, Haiyun Shi, and one anonymous referee.
Abatzoglou, J. T., Dobrowski, S. Z., Parks, S. A., and Hegewisch, K. C.: TerraClimate, a high-resolution global dataset of monthly climate and climatic water balance from 1958–2015, Sci. Data, 5, 1–12, https://doi.org/10.1038/sdata.2017.191, 2018.
Adnan, S., Ullah, K., Shuanglin, L., Gao, S., Khan, A. H., and Mahmood, R.: Comparison of various drought indices to monitor drought status in Pakistan, Clim. Dynam., 51, 1885–1899, https://doi.org/10.1007/s00382-017-3987-0, 2018.
AghaKouchak, A., Huning, L. S., Sadegh, M., Qin, Y., Markonis, Y., Vahedifard, F., and Kreibich, H.: Toward impact-based monitoring of drought and its cascading hazards, Nat. Rev. Earth Environ., 4, 582–595, https://doi.org/10.1038/s43017-023-00457-2, 2023.
Antwarg, L., Miller, R. M., Shapira, B., and Rokach, L.: Explaining anomalies detected by autoencoders using Shapley Additive Explanations, Expert Syst. Appl., 186, 115736, https://doi.org/10.1016/j.eswa.2021.115736, 2021.
Apurv, T. and Cai, X.: Drought propagation in contiguous US watersheds: A process-based understanding of the role of climate and watershed properties, Water Resour. Res., 56, e2020WR027755, https://doi.org/10.1029/2020WR027755, 2020.
Apurv, T., Sivapalan, M., and Cai, X.: Understanding the role of climate characteristics in drought propagation, Water Resour. Res., 53, 9304–9329, https://doi.org/10.1002/2017WR021445, 2017.
Aryal, S. K., Zheng, H., Zhang, Y., and Faiz, M. A.: Drought propagation and recovery behaviors across 407 Australian catchments, Earths Future, 12, e2023EF004190, https://doi.org/10.1029/2023EF004190, 2024.
Bador, M., Boé, J., Terray, L., Alexander, L. V., Baker, A., Bellucci, A., and Vanniere, B.: Impact of higher spatial atmospheric resolution on precipitation extremes over land in global climate models, J. Geophys. Res.-Atmos., 125, e2019JD032184, https://doi.org/10.1029/2019JD032184, 2020.
Baez-Villanueva, O. M., Zambrano-Bigiarini, M., Miralles, D. G., Beck, H. E., Siegmund, J. F., Alvarez-Garreton, C., Verbist, K., Garreaud, R., Boisier, J. P., and Galleguillos, M.: On the timescale of drought indices for monitoring streamflow drought considering catchment hydrological regimes, Hydrol. Earth Syst. Sci., 28, 1415–1439, https://doi.org/10.5194/hess-28-1415-2024, 2024.
Barker, L. J., Hannaford, J., Chiverton, A., and Svensson, C.: From meteorological to hydrological drought using standardised indicators, Hydrol. Earth Syst. Sci., 20, 2483–2505, https://doi.org/10.5194/hess-20-2483-2016, 2016.
Boussetta, S., Balsamo, G., Arduini, G., Dutra, E., McNorton, J., Choulga, M., and Zsoter, E.: ECLand: The ECMWF land surface modelling system, Atmosphere, 12, 723, https://doi.org/10.3390/atmos12060723, 2021.
Brunner, M. I. and Chartier-Rescan, C.: Drought spatial extent and dependence increase during drought propagation from the atmosphere to the hydrosphere, Geophys. Res. Lett., 51, e2023GL107918, https://doi.org/10.1029/2023GL107918, 2024.
Cao, D., Zhang, J., Han, J., Zhang, T., Yang, S., Wang, J., and Yao, F.: Projected increases in global terrestrial net primary productivity loss caused by drought under climate change, Earths Future, 10, e2022EF002681, https://doi.org/10.1029/2022EF002681, 2022.
Chen, L., Brun, P., Buri, P., Fatichi, S., Gessler, A., McCarthy, M. J., Pellicciotti, F., Stocker, B., and Karger, D. N.: Global increase in the occurrence and impact of multiyear droughts, Science, 387, 278–284, https://doi.org/10.1126/science.ado4245, 2025.
Chen, N., Li, R., Zhang, X., Yang, C., Wang, X., Zeng, L., and Niyogi, D.: Drought propagation in Northern China Plain: A comparative analysis of GLDAS and MERRA-2 datasets, J. Hydrol., 588, 125026, https://doi.org/10.1016/j.jhydrol.2020.125026, 2020.
Chen, T. and Guestrin, C.: XGBoost: A Scalable Tree Boosting System, in: Proceedings of the 22nd ACM SIGKDD International Conference on Knowledge Discovery and Data Mining, 785–794, https://doi.org/10.1145/2939672.2939785, 2016.
Christian, J. I., Martin, E. R., Basara, J. B., Furtado, J. C., Otkin, J. A., Lowman, L. E., and Xiao, X.: Global projections of flash drought show increased risk in a warming climate, Commun. Earth Environ., 4, 165, https://doi.org/10.1038/s43247-023-00826-1, 2023.
Colombo, P., Neto, G. G. R., Costa, A. C., Mamede, G. L., and Oel, P. R. V.: Modeling the influence of small reservoirs on hydrological drought propagation in space and time, J. Hydrol., 629, 130640, https://doi.org/10.1016/j.jhydrol.2024.130640, 2024.
Cook, B. I., Mankin, J. S., Marvel, K., Williams, A. P., Smerdon, J. E., and Anchukaitis, K. J.: Twenty-first century drought projections in the CMIP6 forcing scenarios, Earths Future, 8, e2019EF001461, https://doi.org/10.1029/2019EF001461, 2020.
Du, M., Huang, S., Singh, V. P., Leng, G., Huang, Q., and Li, Y.: Quantifying the effects of direct human activities and climate change on the spatial propagation of hydrological drought in the Yellow River Basin, China, J. Hydrol., 643, 131931, https://doi.org/10.1016/j.jhydrol.2024.131931, 2024.
Feng, Y., Sun, F., and Liu, F.: SHAP-powered insights into short-term drought dynamics disturbed by diurnal temperature range across China, Agr. Water Manage., 316, 109579, https://doi.org/10.1016/j.agwat.2025.109579, 2025.
Fleig, A. K., Tallaksen, L. M., Hisdal, H., and Demuth, S.: A global evaluation of streamflow drought characteristics, Hydrol. Earth Syst. Sci., 10, 535–552, https://doi.org/10.5194/hess-10-535-2006, 2006.
Fowler, K., Peel, M., Saft, M., Nathan, R., Horne, A., Wilby, R., and Peterson, T.: Hydrological shifts threaten water resources, Water Resour. Res., 58, e2021WR031210, https://doi.org/10.1029/2021WR031210, 2022.
Gebrechorkos, S. H., Leyland, J., Dadson, S. J., Cohen, S., Slater, L., Wortmann, M., Ashworth, P. J., Bennett, G. L., Boothroyd, R., Cloke, H., Delorme, P., Griffith, H., Hardy, R., Hawker, L., McLelland, S., Neal, J., Nicholas, A., Tatem, A. J., Vahidi, E., Liu, Y., Sheffield, J., Parsons, D. R., and Darby, S. E.: Global-scale evaluation of precipitation datasets for hydrological modelling, Hydrol. Earth Syst. Sci., 28, 3099–3118, https://doi.org/10.5194/hess-28-3099-2024, 2024.
Gebrechorkos, S. H., Sheffield, J., Vicente-Serrano, S. M., Funk, C., Miralles, D. G., Peng, J., and Dadson, S. J.: Warming accelerates global drought severity, Nature, 642, 628–635, https://doi.org/10.1038/s41586-025-09047-2, 2025.
Geng, G., Zhang, B., Gu, Q., He, Z., and Zheng, R.: Drought propagation characteristics across China: Time, probability, and threshold, J. Hydrol., 631, 130805, https://doi.org/10.1016/j.jhydrol.2024.130805, 2024.
Gevaert, A. I., Veldkamp, T. I. E., and Ward, P. J.: The effect of climate type on timescales of drought propagation in an ensemble of global hydrological models, Hydrol. Earth Syst. Sci., 22, 4649–4665, https://doi.org/10.5194/hess-22-4649-2018, 2018.
Gu, L., Schumacher, D. L., Fischer, E. M., Slater, L. J., Yin, J., Sippel, S., and Knutti, R.: Flash drought impacts on global ecosystems amplified by extreme heat, Nat. Geosci., 18, 709–715, https://doi.org/10.1038/s41561-025-01719-y, 2025.
Han, Z., Huang, S., Zhao, J., Leng, G., Huang, Q., Zhang, H., and Li, Z.: Long-chain propagation pathways from meteorological to hydrological, agricultural and groundwater drought and their dynamics in China, J. Hydrol., 625, 130131, https://doi.org/10.1016/j.jhydrol.2023.130131, 2023.
Hao, Z. and AghaKouchak, A.: Multivariate standardized drought index: a parametric multi-index model, Adv. Water Resour., 57, 12–18, https://doi.org/10.1016/j.advwatres.2013.03.009, 2013.
Hassija, V., Chamola, V., Mahapatra, A., Singal, A., Goel, D., Huang, K., and Hussain, A.: Interpreting black-box models: a review on explainable artificial intelligence, Cogn. Comput., 16, 45–74, https://doi.org/10.1007/s12559-023-10178-9, 2024.
Hendrawan, V. S. A., Kim, W., Touge, Y., Ke, S., and Komori, D.: A global-scale relationship between crop yield anomaly and multiscalar drought index based on multiple precipitation data, Environ. Res. Lett., 17, 014037, https://doi.org/10.1088/1748-9326/ac45b4, 2022.
Hersbach, H., Bell, B., Berrisford, P., Hirahara, S., Horányi, A., Muñoz-Sabater, J., and Thépaut, J. N.: The ERA5 global reanalysis, Q. J. Roy. Meteor. Soc., 146, 1999–2049, https://doi.org/10.1002/qj.3803, 2020.
Huang, K., Zhang, H., Cui, G., Wang, Y., Yin, M., and Du, J.: Drought propagation in china: Uncertainties originate more from dataset choice than drought index selection, Atmos. Res., 308, 108555, https://doi.org/10.1016/j.atmosres.2025.108555, 2025.
Iturbide, M., Gutiérrez, J. M., Alves, L. M., Bedia, J., Cerezo-Mota, R., Cimadevilla, E., Cofiño, A. S., Di Luca, A., Faria, S. H., Gorodetskaya, I. V., Hauser, M., Herrera, S., Hennessy, K., Hewitt, H. T., Jones, R. G., Krakovska, S., Manzanas, R., Martínez-Castro, D., Narisma, G. T., Nurhati, I. S., Pinto, I., Seneviratne, S. I., van den Hurk, B., and Vera, C. S.: An update of IPCC climate reference regions for subcontinental analysis of climate model data: definition and aggregated datasets, Earth Syst. Sci. Data, 12, 2959–2970, https://doi.org/10.5194/essd-12-2959-2020, 2020.
Kendall, M. G.: Rank Correlation Methods, 4th edn., Charles Griffin, London, 1975.
Kumar, R., Musuuza, J. L., Van Loon, A. F., Teuling, A. J., Barthel, R., Ten Broek, J., Mai, J., Samaniego, L., and Attinger, S.: Multiscale evaluation of the Standardized Precipitation Index as a groundwater drought indicator, Hydrol. Earth Syst. Sci., 20, 1117–1131, https://doi.org/10.5194/hess-20-1117-2016, 2016.
Li, Q., Ye, A., Nath, R., Zhang, Y., and Zhou, J.: The global drought-sensitive areas will expand in the future, Ecol. Indic., 178, 113838, https://doi.org/10.1016/j.ecolind.2025.113838, 2025.
Liu, Q., Zhang, S., Zhang, H., Bai, Y., and Zhang, J.: Monitoring drought using composite drought indices based on remote sensing, Sci. Total Environ., 711, 134585, https://doi.org/10.1016/j.scitotenv.2019.134585, 2020.
Liu, W., Fu, Z., van Vliet, M. T., Davis, K. F., Ciais, P., Bao, Y., and Wada, Y.: Global overlooked multidimensional water scarcity, P. Natl. Acad. Sci. USA, 122, e2413541122, https://doi.org/10.1073/pnas.2413541122, 2025.
Liu, Y.: Datasets underlying the publication of “Understanding meteorological, runoff, and agricultural drought propagation and their influencing factors in an ensemble of multiple datasets”, Zenodo [data set], https://doi.org/10.5281/zenodo.19837802, 2026.
Liu, Y., Shan, F., Yue, H., Wang, X., and Fan, Y.: Global analysis of the correlation and propagation among meteorological, agricultural, surface water, and groundwater droughts, J. Environ. Manage., 333, 117460, https://doi.org/10.1016/j.jenvman.2023.117460, 2023.
Long, J., Xu, C., Wang, H., Li, Z., and Xu, F.: Reconstruction of drought propagation pathways: A global analysis of multitype propagation chains and nonlinear mechanisms, Glob. Planet. Change, 256, 105144, https://doi.org/10.1016/j.gloplacha.2025.105144, 2026.
López-Moreno, J. I., Vicente-Serrano, S. M., Zabalza, J., Beguería, S., Lorenzo-Lacruz, J., Azorin-Molina, C., and Morán-Tejeda, E.: Hydrological response to climate variability at different time scales: A study in the Ebro basin, J. Hydrol., 477, 175–188, https://doi.org/10.1016/j.jhydrol.2012.11.028, 2013.
Ma, M., Yuan, F., Cui, H., Ren, L., and Liu, Y.: A comprehensive analysis of meteorological drought stress over the Yellow River basin (China) for the next 40 years, Int. J. Climatol., 41, E2927–E2948, https://doi.org/10.1002/joc.6993, 2021.
Mann, H. B.: Nonparametric Tests Against Trend, Econometrica, 13, 245–259, 1945.
McColl, K. A., Alemohammad, S. H., Akbar, R., Konings, A. G., Yueh, S., and Entekhabi, D.: The global distribution and dynamics of surface soil moisture, Nat. Geosci., 10, 100–104, https://doi.org/10.1038/ngeo2868, 2017.
McKee, T., Doesken, N., and Kleist, J.: The relationship of drought frequency and duration to time scales, in: Proceedings of the 8th Conference on Applied Climatology, American Meteorological Society, Boston, MA, 179–184, 1993.
Mei, L., Aru, H., Tong, S., Wang, Y., Guo, E., Zhang, T., and Bao, Y.: Study on the propagation processes and driving mechanisms of meteorological, hydrological, and agricultural droughts on the Mongolian Plateau, J. Hydrol., 654, 133511, https://doi.org/10.1016/j.jhydrol.2025.133511, 2025.
Muthuvel, D. and Qin, X.: Probabilistic analysis of future drought propagation, persistence, and spatial concurrence in monsoon-dominant Asian regions under climate change, Hydrol. Earth Syst. Sci., 29, 3203–3225, https://doi.org/10.5194/hess-29-3203-2025, 2025.
Niazkar, M., Menapace, A., Brentan, B., Piraei, R., Jimenez, D., and Dhawan, P.: Applications of XGBoost in water resources engineering: a systematic literature review (Dec 2018–May 2023), Environ. Model. Softw., 174, 105971, https://doi.org/10.1016/j.envsoft.2024.105971, 2024.
Nohara, Y., Matsumoto, K., Soejima, H., and Nakashima, N.: Explanation of machine learning models using shapley additive explanation and application for real data in hospital, Comput. Meth. Prog. Bio., 214, 106584, https://doi.org/10.1016/j.cmpb.2021.106584, 2022.
Odongo, R. A., De Moel, H., and Van Loon, A. F.: Propagation from meteorological to hydrological drought in the Horn of Africa using both standardized and threshold-based indices, Nat. Hazards Earth Syst. Sci., 23, 2365–2386, https://doi.org/10.5194/nhess-23-2365-2023, 2023.
Pearson, K.: Mathematical contributions to the theory of evolution. – III. Regression, heredity, and panmixia, Philos. T. R. Soc. Lond., 187, 253–318, https://doi.org/10.1098/rsta.1896.0007, 1896.
Pinzon, J. E. and Tucker, C. J.: A non-stationary 1981–2012 AVHRR NDVI3g time series, Remote Sens., 6, 6929–6960, https://doi.org/10.3390/rs6086929, 2014.
Prodhan, F. A., Zhang, J., Hasan, S. S., Sharma, T. P. P., and Mohana, H. P.: A review of machine learning methods for drought hazard monitoring and forecasting: Current research trends, challenges, and future research directions, Environ. Model. Softw., 149, 105327, https://doi.org/10.1016/j.envsoft.2022.105327, 2022.
Rudin, C.: Stop explaining black box machine learning models for high stakes decisions and use interpretable models instead, Nat. Mach. Intell., 1, 206–215, https://doi.org/10.1038/s42256-019-0048-x, 2019.
Sattar, M. N., Lee, J. Y., Shin, J. Y., and Kim, T. W.: Probabilistic characteristics of drought propagation from meteorological to hydrological drought in South Korea, Water Resour. Manage., 33, 2439–2452, https://doi.org/10.1007/s11269-019-02255-2, 2019.
Sen, P. K.: Estimates of the Regression Coefficient Based on Kendall's Tau, J. Am. Stat. Assoc., 63, 1379–1389, 1968.
Shi, H., Zhao, Y., Liu, S., Cai, H., and Zhou, Z.: A new perspective on drought propagation: causality, Geophys. Res. Lett., 49, e2021GL096758, https://doi.org/10.1029/2021GL096758, 2022a.
Shi, H., Zhou, Z., Liu, L., and Liu, S.: A global perspective on propagation from meteorological drought to hydrological drought during 1902–2014, Atmos. Res., 280, 106441, https://doi.org/10.1016/j.atmosres.2022.106441, 2022b.
Shukla, S. and Wood, A. W.: Use of a standardized runoff index for characterizing hydrologic drought, Geophys. Res. Lett., 35, L02405, https://doi.org/10.1029/2007GL032487, 2008.
Stagge, J. H., Tallaksen, L. M., Gudmundsson, L., Van Loon, A. F., and Stahl, K.: Candidate distributions for climatological drought indices (SPI and SPEI), Int. J. Climatol., 35, 4027–4040, https://doi.org/10.1002/joc.4267, 2015.
Sundararajan, K., Garg, L., Srinivasan, K., Bashir, A. K., Kaliappan, J., Ganapathy, G. P., and Meena, T.: A contemporary review on drought modeling using machine learning approaches, Comput. Model. Eng. Sci., 128, 447–487, https://doi.org/10.32604/cmes.2021.015528, 2021.
Teutschbein, C., Grabs, T., Giese, M., Todorović, A., and Barthel, R.: Drought propagation in high-latitude catchments: insights from a 60-year analysis using standardized indices, Nat. Hazards Earth Syst. Sci., 25, 2541–2564, https://doi.org/10.5194/nhess-25-2541-2025, 2025.
Van Loon, A. F.: Hydrological drought explained, WIREs Water, 2, 359–392, https://doi.org/10.1002/wat2.1085, 2015.
Wang, F., Wang, Z., Yang, H., Di, D., Zhao, Y., and Liang, Q.: Utilizing GRACE-based groundwater drought index for drought characterization and teleconnection factors analysis in the North China Plain, J. Hydrol., 585, 124849, https://doi.org/10.1016/j.jhydrol.2020.124849, 2020.
Wens, M., Johnson, J. M., Zagaria, C., and Veldkamp, T. I.: Integrating human behavior dynamics into drought risk assessment – A sociohydrologic, agent-based approach, WIREs Water, 6, e1345, https://doi.org/10.1002/wat2.1345, 2019.
Wu, H., Su, X., Huang, S., Singh, V. P., Zhou, S., Tan, X., and Hu, X.: Decreasing dynamic predictability of global agricultural drought with warming climate, Nat. Clim. Change, 15, 411–419, https://doi.org/10.1038/s41558-025-02289-y, 2025.
Wu, J., Yao, H., Chen, X., Wang, G., Bai, X., and Zhang, D.: A framework for assessing compound drought events from a drought propagation perspective, J. Hydrol., 604, 127228, https://doi.org/10.1016/j.jhydrol.2021.127228, 2022.
Xie, X., Wu, Z., Xie, Y., Wang, B., and Hu, J.: Agricultural water production function-driven water resources optimization model for irrigation management under extreme drought: a case study for the upper reaches of Yangtze River, China, J. Hydrol.: Reg. Stud., 62, 102974, https://doi.org/10.1016/j.ejrh.2025.102974, 2025.
Xiong, H., Han, J., and Yang, Y.: Propagation from meteorological to hydrological drought: Characteristics and influencing factors, Water Resour. Res., 61, e2024WR037765, https://doi.org/10.1029/2024WR037765, 2025.
Xue, C., Ghirardelli, A., Chen, J., and Tarolli, P.: Investigating agricultural drought in Northern Italy through explainable Machine Learning: Insights from the 2022 drought, Comput. Electron. Agr., 227, 109572, https://doi.org/10.1016/j.compag.2024.109572, 2024.
Yang, C., Liu, C., Xing, X., and Ma, X.: Predicting the risk and trigger thresholds for propagation of meteorological droughts to agricultural droughts in China based on Copula-Bayesian model, Agr. Water Manage., 313, 109468, https://doi.org/10.1016/j.agwat.2025.109468, 2025.
Yuan, X., Wang, Y., Ji, P., Wu, P., Sheffield, J., and Otkin, J. A.: A global transition to flash droughts under climate change, Science, 380, 187–191, https://doi.org/10.1126/science.abn6301, 2023.
Yue, S., Pilon, P., and Cavadias, G.: Power of the Mann–Kendall and Spearman's rho tests for detecting monotonic trends in hydrological series, J. Hydrol., 259, 254–271, https://doi.org/10.1016/S0022-1694(01)00594-7, 2002.
Zarch, M. A. A., Sivakumar, B., and Sharma, A.: Droughts in a warming climate: A global assessment of Standardized precipitation index (SPI) and Reconnaissance drought index (RDI), J. Hydrol., 526, 183–195, https://doi.org/10.1016/j.jhydrol.2014.09.071, 2015.
Zhang, X., Hao, Z., Singh, V. P., Zhang, Y., Feng, S., Xu, Y., and Hao, F.: Drought propagation under global warming: Characteristics, approaches, processes, and controlling factors, Sci. Total Environ., 838, 156021, https://doi.org/10.1016/j.scitotenv.2022.156021, 2022.
Zhou, Z., Wang, P., Li, L., Fu, Q., Ding, Y., Chen, P., and Shi, H.: Recent development on drought propagation: A comprehensive review, J. Hydrol., 645, 132196, https://doi.org/10.1016/j.jhydrol.2024.132196, 2024.
Zomer, R. J., Xu, J., and Trabucco, A.: Version 3 of the global aridity index and potential evapotranspiration database, Sci. Data, 9, 409, https://doi.org/10.1038/s41597-022-01493-1, 2022.