the Creative Commons Attribution 4.0 License.
the Creative Commons Attribution 4.0 License.
 | 15 Apr 2026
Exploring controls on solute export mechanisms in anthropogenically impacted catchments in Southern Germany in climatically different periods
Tobias Schuetz
Global warming is assumed to impact the mobilization, transport, transformation, and storage of nutrients, impacting the health and functionality of riverine ecosystems. To enhance future water quality management, it is essential to understand potentially changing solute export mechanisms (SEM) in response to climate change. This study examines SEM for nutrients (NO3-N, NH4-N, soluble reactive phosphorus, total phosphorus, and total organic carbon) and geogenic minerals (Ca2+ and Mg2+) across 40 anthropogenically impacted catchments in southern Germany under changing climatic conditions. The findings reveal seasonal and climate-driven differences in SEM. We identify explanatory controls impacted by alterations in climate by comparing an earlier time period (Period 1: prior to 1 January 2012) with a more recent one (Period 2: after 1 January 2012). Moreover, the comparison of SEM and their controlling factors across both climatically distinct periods provides a valuable proxy for anticipating future SEM responses to climate change. Our results indicate an increase in enrichment behaviour for nutrients, while geogenic solutes exhibit a slight but insignificant increase in dilution pattern. Changes in climate conditions between period 1 and period 2 have altered solute source distribution and hydrological connectivity, depending on catchment characteristics such as land cover, climate conditions, soil properties, and geology. Rising temperatures, prolonged heatwaves, and sporadic but intense 1 d precipitation events have led to greater internal nutrient accumulation and decreased hydrological connectivity. Consequently, solute transport is primarily intensified at near-surface pathways that are only active sporadically during summer and during rising groundwater levels in autumn and winter. Further, nutrient dilution mechanisms are increasingly overprinted by enrichment-driven mobilization processes. Looking ahead, solute peak concentrations may more frequently exceed regulatory benchmarks for water quality, posing risks to riverine ecosystems and drinking water supplies. These findings should be integrated into future catchment management strategies to mitigate the intensification of enrichment export mechanisms and safeguard water resources.
- Article
(2152 KB) - Full-text XML
-
Supplement
(1137 KB) - BibTeX
- EndNote


Instream water quality responds to hydrological and biogeochemical processes, which are vulnerable to altering climate and landscape boundary conditions over time and space (Musolff et al., 2015). Under changing climatic conditions, solute source distribution and their hydrological connectivity are likely to shift. These alterations can affect solute mobilization and alter the dominant transport pathways of nutrients. Climatically changing conditions, such as prolonged droughts and extreme weather patterns, increase the production of decomposable organic material and weaken the connectivity between solute sources and water bodies (e.g., Bieroza et al., 2024; Winter et al., 2020; Yang et al., 2018). These solutes originate from the decomposition of organic material and the weathering of soil and bedrock, dissolving in water and leaching out (Botter et al., 2020; Ebeling et al., 2021; Musolff et al., 2015). Prolonged droughts allow for an increase in nutrient accumulation at the surface by dead organic materials, increasing the mass stored in shallow solute sources (Ainsworth and Long, 2005; Huntington and Wieczorek, 2021; Kukal and Irmak, 2018; Gomez et al., 2011; Greaver et al., 2016; Meixner and Fenn, 2004). Solutes are mobilized via surface runoff, subsurface flow, or groundwater discharge, depending on the spatial distribution of solute sources and the hydrological connectivity. The term solute export mechanisms (SEM) summarizes the processes by which dissolved substances, such as nutrients and minerals, are mobilized and transported from terrestrial systems to downstream water bodies.
Catchments, characterized by different sizes and diverse land uses, encompass a broad spectrum of hydrological and biogeochemical processes. These processes operate across different temporal scales from individual events to seasonal and intra-annual patterns (e.g. Ebeling et al., 2021; Minaudo et al., 2019; Rose et al., 2018; Westphal et al., 2019). This spatial and temporal variability complicates the understanding of the mechanisms driving solute export across different scales (Ebeling et al., 2021; Schuetz et al., 2016). Despite a principal understanding of these processes, the long-term effects of climatic alterations on solute export mechanisms over decades remains poorly documented (Knapp et al., 2020; Dupas et al., 2016). Monitoring these changes is a crucial tool, as extreme weather patterns potentially induced by climate change may affect the mobilization and transport pathways of ecosystem-relevant nutrients (Huntington and Wieczorek, 2021; Knapp et al., 2020; Lucas et al., 2023). To address these challenges long-term water quality observations enable the capturing of key processes, and legacy stores (Bieroza et al., 2024; Ebeling et al., 2021; Knapp et al., 2020; Winter et al., 2020). However, understanding how catchment functions, such as solute mobilization and retention, respond to changing conditions, including land use alterations, remains a significant challenge.
The concentration-discharge (c–Q) relationship is a valuable tool for tracking solute mobilization and transportation, identifying shifts in solute source distribution across various temporal and spatial scales (e.g. Basu et al., 2010; Dupas et al., 2016; Moatar et al., 2020; Rose et al., 2018). Solutes from the surface and upper soil layers are mobilized by surface runoff and rapid interflow, causing increasing solute concentrations with rising discharge. This process, defined as enrichment behaviour, is characterized by a positive concentration-discharge relationship (e.g. Basu et al., 2011; Ebeling et al., 2021; Musolff et al., 2015). In contrast, when solute sources become depleted during wet periods, respectively rainfall events, solute concentrations decrease with rising discharge, resulting in a negative concentration-discharge relationship, defined as dilution dynamics (Basu et al., 2011; Dupas et al., 2018; Pohle et al., 2021; Thompson et al., 2011). The degree of dependence between solute concentration and discharge is determined by the coevolving coefficient of variation of solute concentrations and discharges, respectively (CVC CVQ). Chemostatic regimes are characterised by lower concentration variability compared to discharge variability, whereas chemodynamic behaviour is characterized by a higher concentration variability compared to discharge variability, showing a decoupled concentration discharge relation (Thompson et al., 2011). The combined approach of c–Q-relationship and CVC CVQ exhibits temporal variability in solute concentrations and can identify flow conditions with elevated solute levels. High solute concentrations are linked to eutrophication processes that harm aquatic ecosystems and pose risks to drinking water quality (Radach et al., 1990; van der Velde et al., 2010; Winter et al., 2020). Therefore, evaluating changes in solute export mechanisms (SEM) under changing climatic conditions might improve our ability to predict solute concentration levels and assess future environmental risks for water bodies.
Recent data from southern Germany (KLIWA, 2021) show a significant increase in temperatures, more frequent heatwaves and widespread soil droughts compared to historical climate data from 1931 to 2000 for this region. Comparing periods 1 and 2 reveals a segment of this gradual trend, as demonstrated by the significant changes in temperature and evaporation data (DWD, 2022). This validates the use of both periods for comparing SEM under climatically different conditions, with the gradual changes from period 1 to period 2 as a means to quantify potential climate-induced alterations in SEM. Further, trends toward lower groundwater levels, reduced spring discharges, and increase in maximum 1 d precipitation have been observed (KLIWA, 2021). Warmer and drier climate lowers the water table and extends residence times in the subsurface, leading to increased concentrations of geogenic minerals in groundwater (Botter et al., 2020; Li et al., 2022; Musolff et al., 2015). Consequently, altered climatic conditions, alongside with land-use changes and nutrient legacies, might affect mobilization of nutrients and geogenic minerals in south-German catchments as well.
This study examines monthly/biweekly time series (eight to 20 years) of nutrient and geogenic mineral concentrations and discharges, developing c–Q-relationships for 40 catchments in southern Germany considering landscape boundary conditions. These catchments experience varying levels of anthropogenic influence and climate sensitivity, allowing for the assessment of changing export dynamics. We hypothesize that warming temperatures, prolonged heatwaves, and intense 1 d precipitation events significantly impact solute mobilization, transport, and retention visible as changes in the c–Q relationship of specific solutes. SEM anomalies associated with recent climatic alterations are identified by comparing the current SEMs with those from the past decade (Period 1: prior to 1 January 2012). Seasonal effects (e.g., summer and winter) and variations in humidity levels (e.g., wet and dry years) are compared as well, serving as benchmarks for occurring variation of SEMs. Quantifying changes in SEMs under changing climatic conditions and identifying catchment properties, which favour such changes, will help future decision-making to improve catchment management strategies, counteracting changes in export mechanisms and reducing potential risks to ecosystem health.
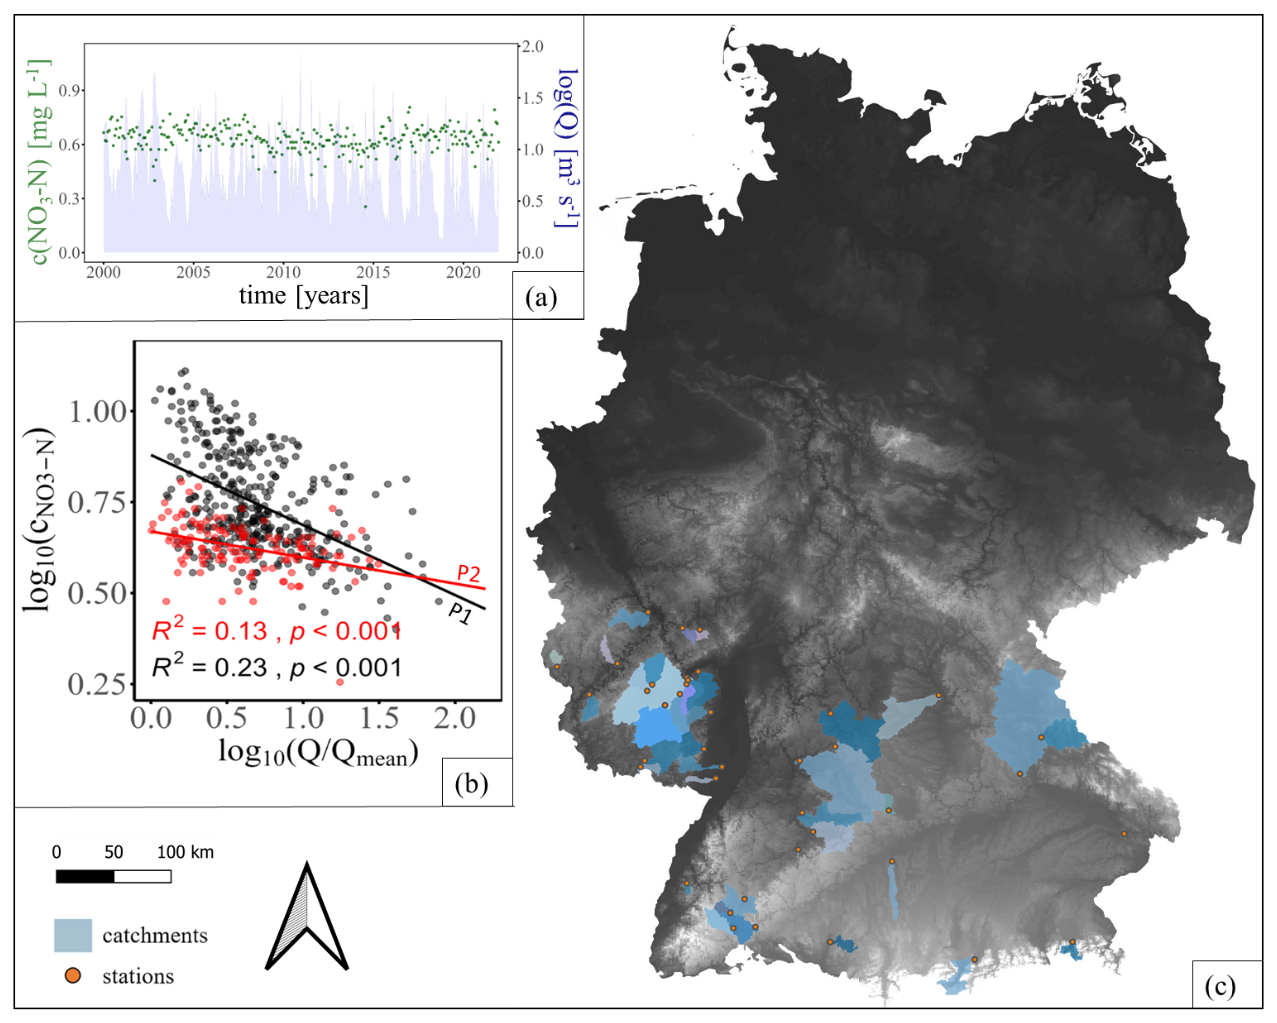
Figure 1(a) Time series of discharge and nitrate (NO3-N) in the Fils catchment. (b) c–Q-relationships for NO3-N in the Fils catchment, showing for period 1 (black, P1) and period 2 (red, P2). Differences between P1 and P2 were tested by ANCOVA (p<0.05) for each catchment (illustrated here for catchment Fils, p<0.001). (c) Study area in Southwest Germany with 40 catchments. Map of catchments with measuring stations (orange), with a black-white gradient indicating elevation (BKG, 2023). Map projection: UTM (EPSG: 25832).
2.1 Study Sites
The present study comprises quality-controlled discharge and water quality data from 40 stations in South and Southwest Germany. Discharge Q (m3 s−1) and water quality data C (mg L−1) are delivered by various federal agencies, covering catchments located in Rhineland Palatinate (RLP), Baden-Württemberg (BW), and Bavaria (BY; LfU Bayern, 2022; LfU RLP, 2022; LUBW, 2022). Subsequently, the catchments include different regions with contrasting climate and catchment characteristics (Tables S1–S2 in the Supplement). The study focuses on mid-mountain catchments in Eifel, Hunsrück, Palatinate Mountains, Black Forest, Swabian Alb, and Upper Palatinate Forest. Additionally, catchments are also located in Upper Rhine Lowlands, Württembergisches Unterland, and Franconia (Fig. 1). All regions vary in climate, geology, land cover, and altitude. Catchment altitude varies between 147.5 and 835 m a.s.l. Average yearly precipitation ranges from 527 mm yr−1 up to 1596 mm yr−1 (DWD, 2022). According to the Köppen and Geiger climate classification, the climate is humid continental (Dfb) in Bavaria and most parts of Baden-Wurttemberg (Beck et al., 2018). The influence of ocean climate (Cfb) increases in the Northwest of Baden-Wurttemberg and Rhineland Palatinate (Beck et al., 2018). Streams reveal nival and pluvial regimes. The mean discharge spans three orders of magnitude and varies from 0.41 to 49.73 m3 s−1.
The regional geology is heterogeneous with crystalline rocks in the Palatinate Mountains and Black Forest. Formations of carbonate rocks are located in Swabian Alb, Alps and Franconia, respectively. Further rock formations are Hunsrück schist in the Hunsrück, sandstone, and slate in the Eifel (BGR, 2006). Catchment sizes vary between 49 (Schutter) to 5434 km2 (Naab). However, the focus is on mid-scale catchments (< 1000 km2), which account for over 80 % of all catchments (Fig. 1). Arable land, pastures, or forests predominantly cover the majority of these catchments.
2.2 Data Selection and Data Structure
Discharge and water quality samples of public agencies typically are not sampled at the same locations, resulting in data selection criteria (see below)
- a.
Assuming that the general behaviour of discharge generation and solute mobilization is not changing abruptly within one catchment, a small distance between the respective gauges was an essential criterion for selecting streams. For that reason, only close stations (max. distance ca. 8 km) of discharge and water quality were accepted as one site in this study.
- b.
Between the sampling locations for discharge and water quality parameters no neighbouring urban area, inflows from subsidiary streams, or effluent discharges (e.g. wastewater discharge) should be present.
- c.
The water quality stations should provide data on Nitrate-nitrogene (NO3-N), Ammonia-nitrogene (NH4-N), soluble reactive phosphorus (SRP), total phosphorus (TP), total organic carbon (TOC), calcium (Ca2+), and magnesium (Mg2+) for analysis.
- d.
All water quality parameters were derived from grab samples taken at least monthly to bi-monthly interval.
- e.
Water quality samples should cover both period 1 and period 2 at least partly, while discharge measurements were available as daily averages.
- f.
The selected streams had to represent the heterogeneous conditions of regions in Southwest Germany.
All applied criteria reduced the number of appropriate measurement stations from 1004 for discharge and 1572 for water quality to 40 suitable catchments. Although these strict criteria may introduce bias towards certain catchment types, they were crucial in ensuring reliable c–Q coupling. Nevertheless, the selected catchments still represent a broad range of catchment sizes, altitudes and geological settings, representing large parts of southern Germany.
Further, alteration in SEM caused by varying humidity level, seasonal variation and changing climatic conditions across decades were determined by splitting the data set into various observation periods:
- a.
Whole observation period, comprising all measured solute concentrations.
- b.
Summer, comprising all solute concentrations measured from May to October.
- c.
Winter, comprising all solute concentrations measured from November to April.
- d.
Wet years, comprising all solute concentrations measured in years with total discharge [mm] above median.
- e.
Dry years, comprising all solute concentrations measured in years with total discharge [mm] below median.
- f.
Period 1, comprising all solute concentrations measured until 31 December 2011, representing previous decades.
- g.
Period 2, comprising solute concentration measured since 1 January 2012, representing recent years (2012–2022) with climatic conditions that are distinguishable from those of Period 1.
Two intervals (Period 1 and 2) have been selected to represent distinct phases of the gradual climatic change in Southwest Germany. The dividing date of the 1 January in 2012 is arbitrary with regard to the incremental changes in the hydro-climatic system. It has been selected to ensure sufficient sampling coverage (>8 years) for statistical rigor in both periods. The periods under study can be considered as snapshots along a continuous trend of rising temperatures and altered hydroclimatic conditions. Between period 1 and 2, mean annual air temperature increased from 8.68 to 9.70 °C, potential evapotranspiration from 578 to 693 mm, and actual evapotranspiration from 460 to 490 mm, while precipitation declined from 905 to 819 mm (not statistically significant; Fig. 2). Period 1 thus is considered being less influenced and serves as a reference for an incremental change, whereas period 2 reflects stronger and more frequent indications of ongoing changes in climatic conditions, including exceptionally dry years such as 2018, enabling their use as comparative frameworks for assessing climate-related effects on solute export mechanisms (Table S2). The differences between period 1 and period 2 align with the long-term trend analysis of KLIWA (2021), which show an increase in average air temperature by 1.4 to 1.8 °C per 90 years. Maximum 1 d precipitation amounts increased during the hydrological winter half-year (up to +33 %) and the summer half-year (up to +28 %), although there are regional decreases as well. Due to this variability, the maximum 1 d precipitation trends are not statistically significant; however, an overall increase in peak discharge events is evident for southwest Germany.
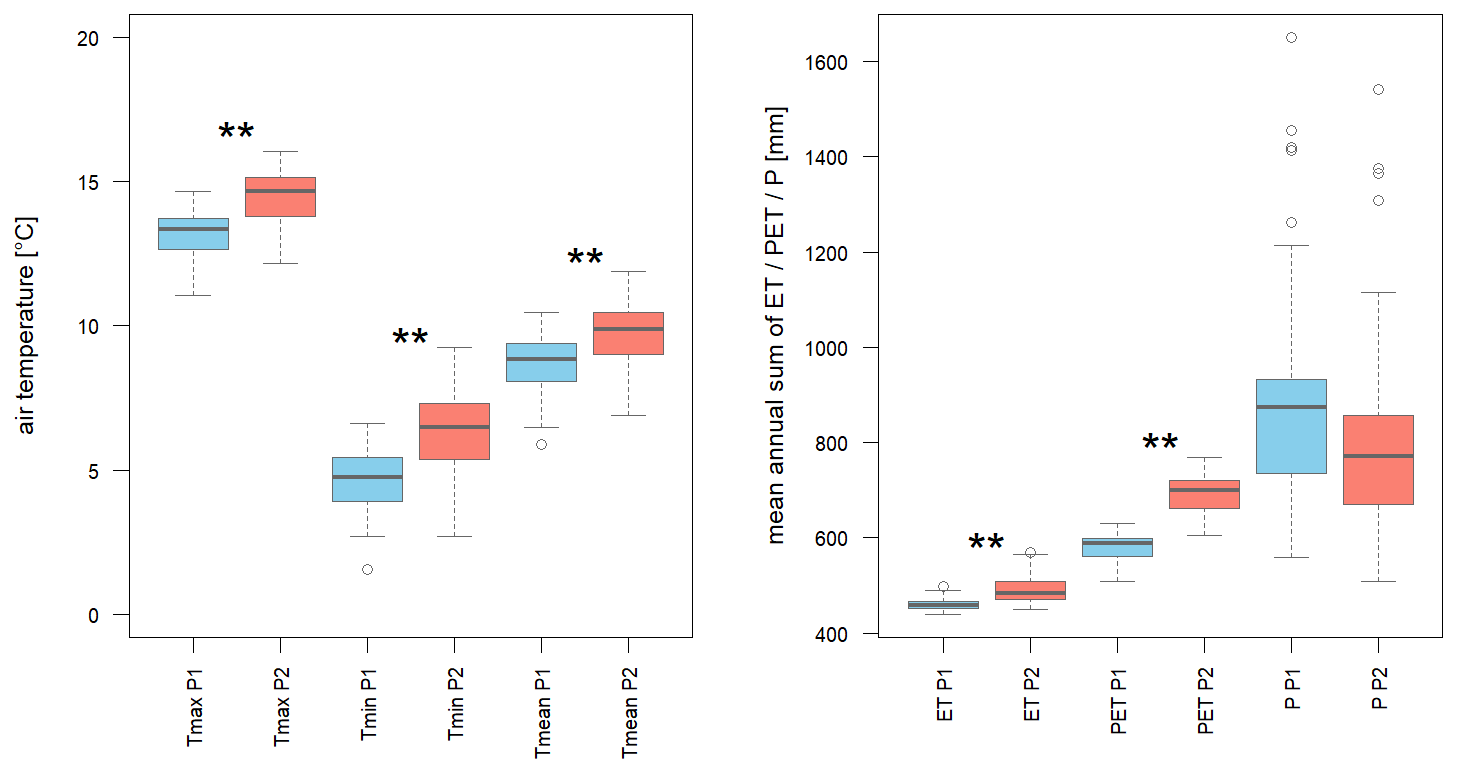
Figure 2Changes in air temperature (left) and mean annual sums of evapotranspiration (ET), potential evapotranspiration (PET), and precipitation (P, mm; right) between period 1 (P1) and period 2 (P2). Tmax: maximum air temperature (°C), Tmin: minimum air temperature (°C), Tmean: mean annual air temperature (°C). Boxplots represent climatic data from 40 observed catchments. Data obtained from the German Weather Service (DWD, 2022).
2.3 Data Treatment and Analysis
2.3.1 Trend Analysis of Solute Concentration
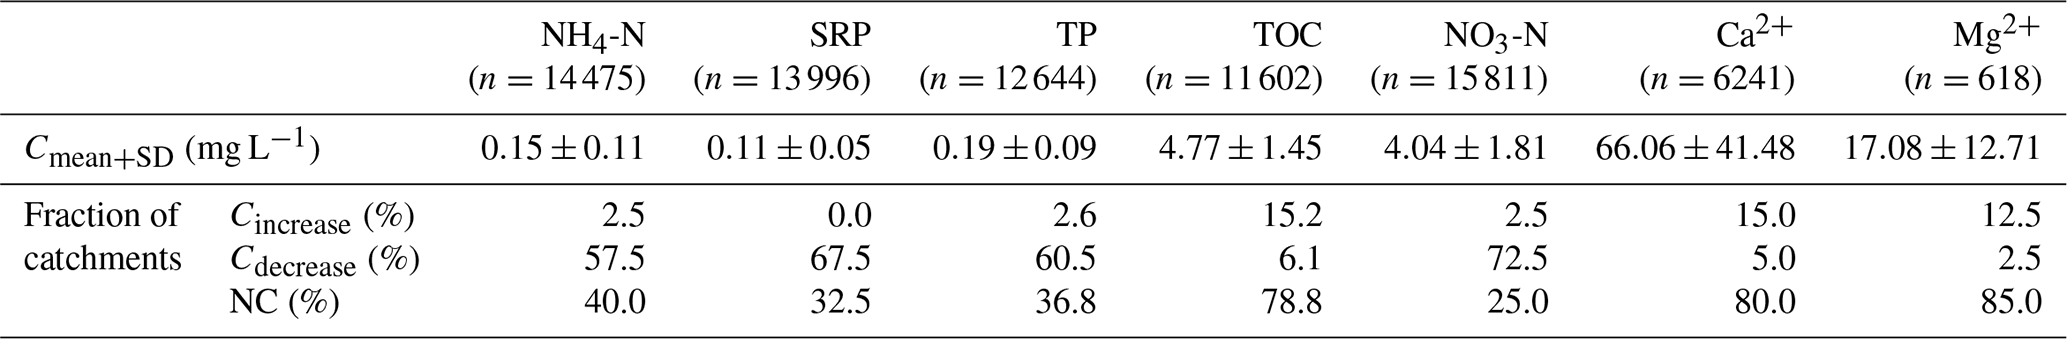
Trends in mean solute concentration (C) were analyzed separately for each catchment. Linear regression models (concentration vs. time) were applied and statistical significance was evaluated using F tests from ANOVA, corrected for multiple testing using the Benjamini–Hochberg procedure (p<0.05). Descriptive statistics (Cmean±SD in mg L−1) were calculated for each solute, and interannual trends were classified as increasing (Cincrease), decreasing (Cdecrease), or non-significant (NC) alteration (Table 2).
2.3.2 Assessment of c–Q-Relationship
Concentration–discharge (c–Q) relationships were quantified for each solute and catchment using a power-law function (Eq. 1; Musolff et al., 2015), which was then transformed into a linear relationship between C and Q in a double-logarithmic space (Eq. 2), where b defines the slope, whereas log10(a) defines the intercept.
The slope b was estimated for each solute and catchment with ≥20 samples during each observation period, normalizing the discharge by mean discharge (Qmean) to ensure comparability. Positive slopes (b>0) reflect enrichment (increasing concentrations with discharge), while negative slopes (b<0) indicate a dilution pattern (decreasing concentrations with discharge).
2.3.3 Assessment of Chemostatic and Chemodynamic Behaviour
A slope close to zero (b≈0) suggests that solute concentrations are largely independent of discharge variability. However, this does not necessarily imply low variability in solute concentrations (Musolff et al., 2015). In fact, high concentration variability can still occur despite the absence of correlation with discharge. To avoid misinterpreting such near-zero b slopes as indication of chemostatic behavior, we additionally used the CVC CVQ ratio as proposed by Musolff et al. (2015) and Thompson et al. (2011). Chemostatic and chemodynamic behaviour was assessed using the ratio of the coefficient of variation of solute concentration (CVC) to that of discharge (CVQ) (Eq. 3; Thompson et al., 2011). This metric was calculated for each catchment and solute, with the statistical descriptor standard deviation (σ) and mean (μ).
Solutes with CVC CVQ>0.5 were classified as chemodynamic (high concentration variability relative to discharge variability), whereas CVC CVQ≤0.5 indicated chemostatic behaviour. The threshold of 0.5 for distinguishing chemostatic (CVC CVQ≤0.5) from chemodynamic behaviour (CVC CVQ>0.5) was chosen following Thompson et al. (2011), who showed that conservative tracers typically yielded values around this level. This benchmark has been adopted in subsequent studies (Ebeling et al., 2021; Musolff et al., 2017) and provides a clear separation of solute groups in our dataset. Although alternative thresholds (e.g. 1) exist in the literature (Musolff et al., 2015), 0.5 was deemed most appropriate for our data structure and applied here as a classification tool. The CVC CVQ metric was applied jointly with c–Q-relationships across different observation periods to assess solute export mechanisms (SEM) in South and Southwest Germany. To capture variability, standard errors were calculated for all slope b, with error bars shown in Fig. 3. Differences in SEM related to humidity (wet vs. dry), season (winter vs. summer), and climatically different periods (P1 vs. P2) were formally tested using analysis of covariance (ANCOVA, p<0.05), enabling statistical comparison of regression slopes between the two intervals.
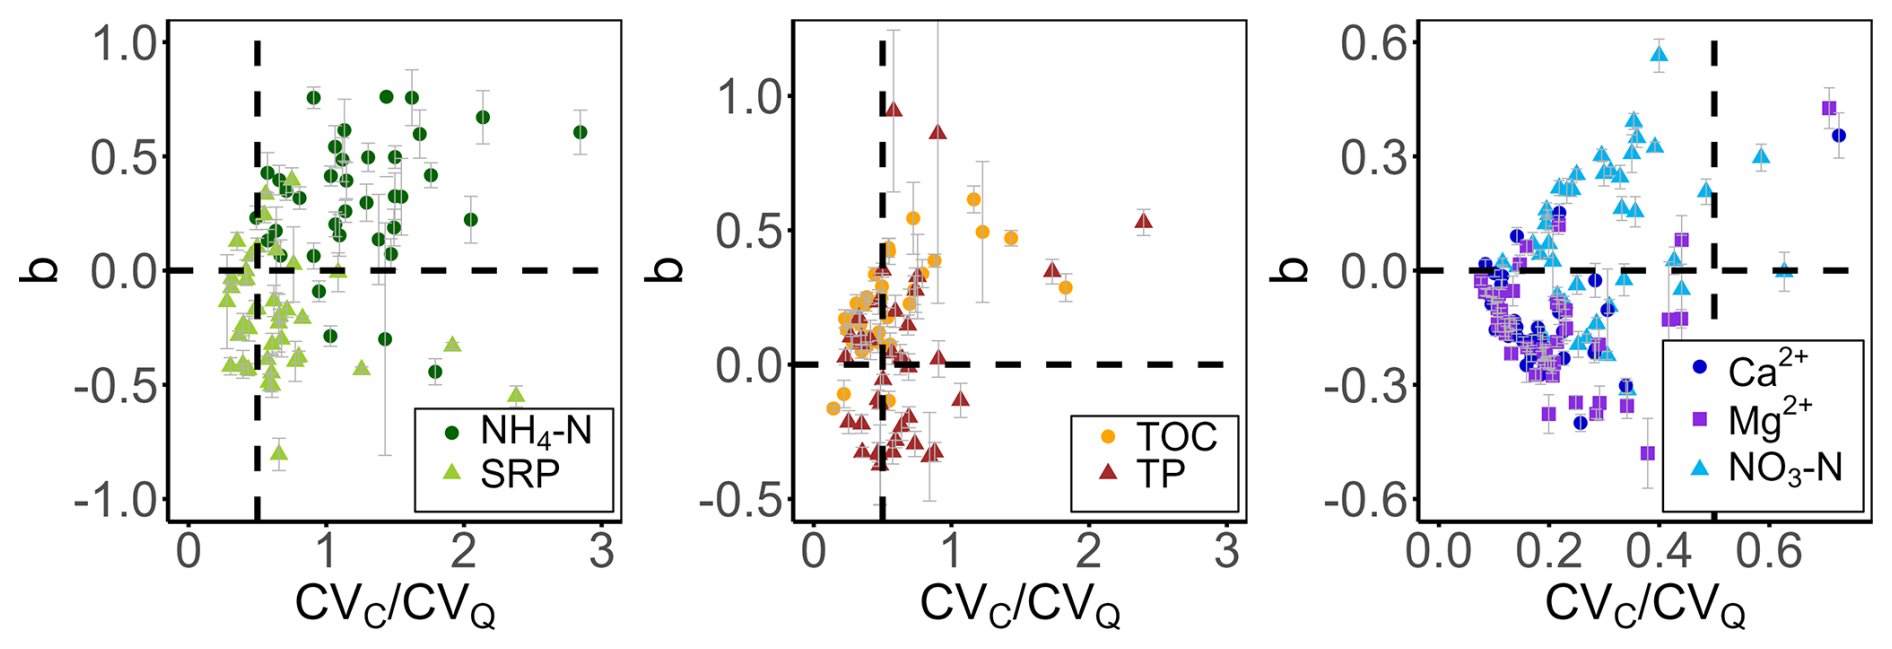
Figure 3Illustration of the SEM for ▴ SRP, • NH4-N, ▴ TP, • TOC, ▴ NO3-N, • Ca2+ and Mg2+ clusters, with error bars representing ±1 standard error. Clusters represent seasonal-dynamic solutes (green, left), long-term dynamic solutes (yellow/brown, middle), and long-term stable solutes (blue/violet, right). The vertical line separates chemostatic (left) from chemodynamic behaviour (right), while the horizontal line distinguishes enrichment (top) from dilution (bottom) patterns.
Table 1Catchment descriptors used in the advanced data analysis to assess controls on SEM, associated with a description and data source.
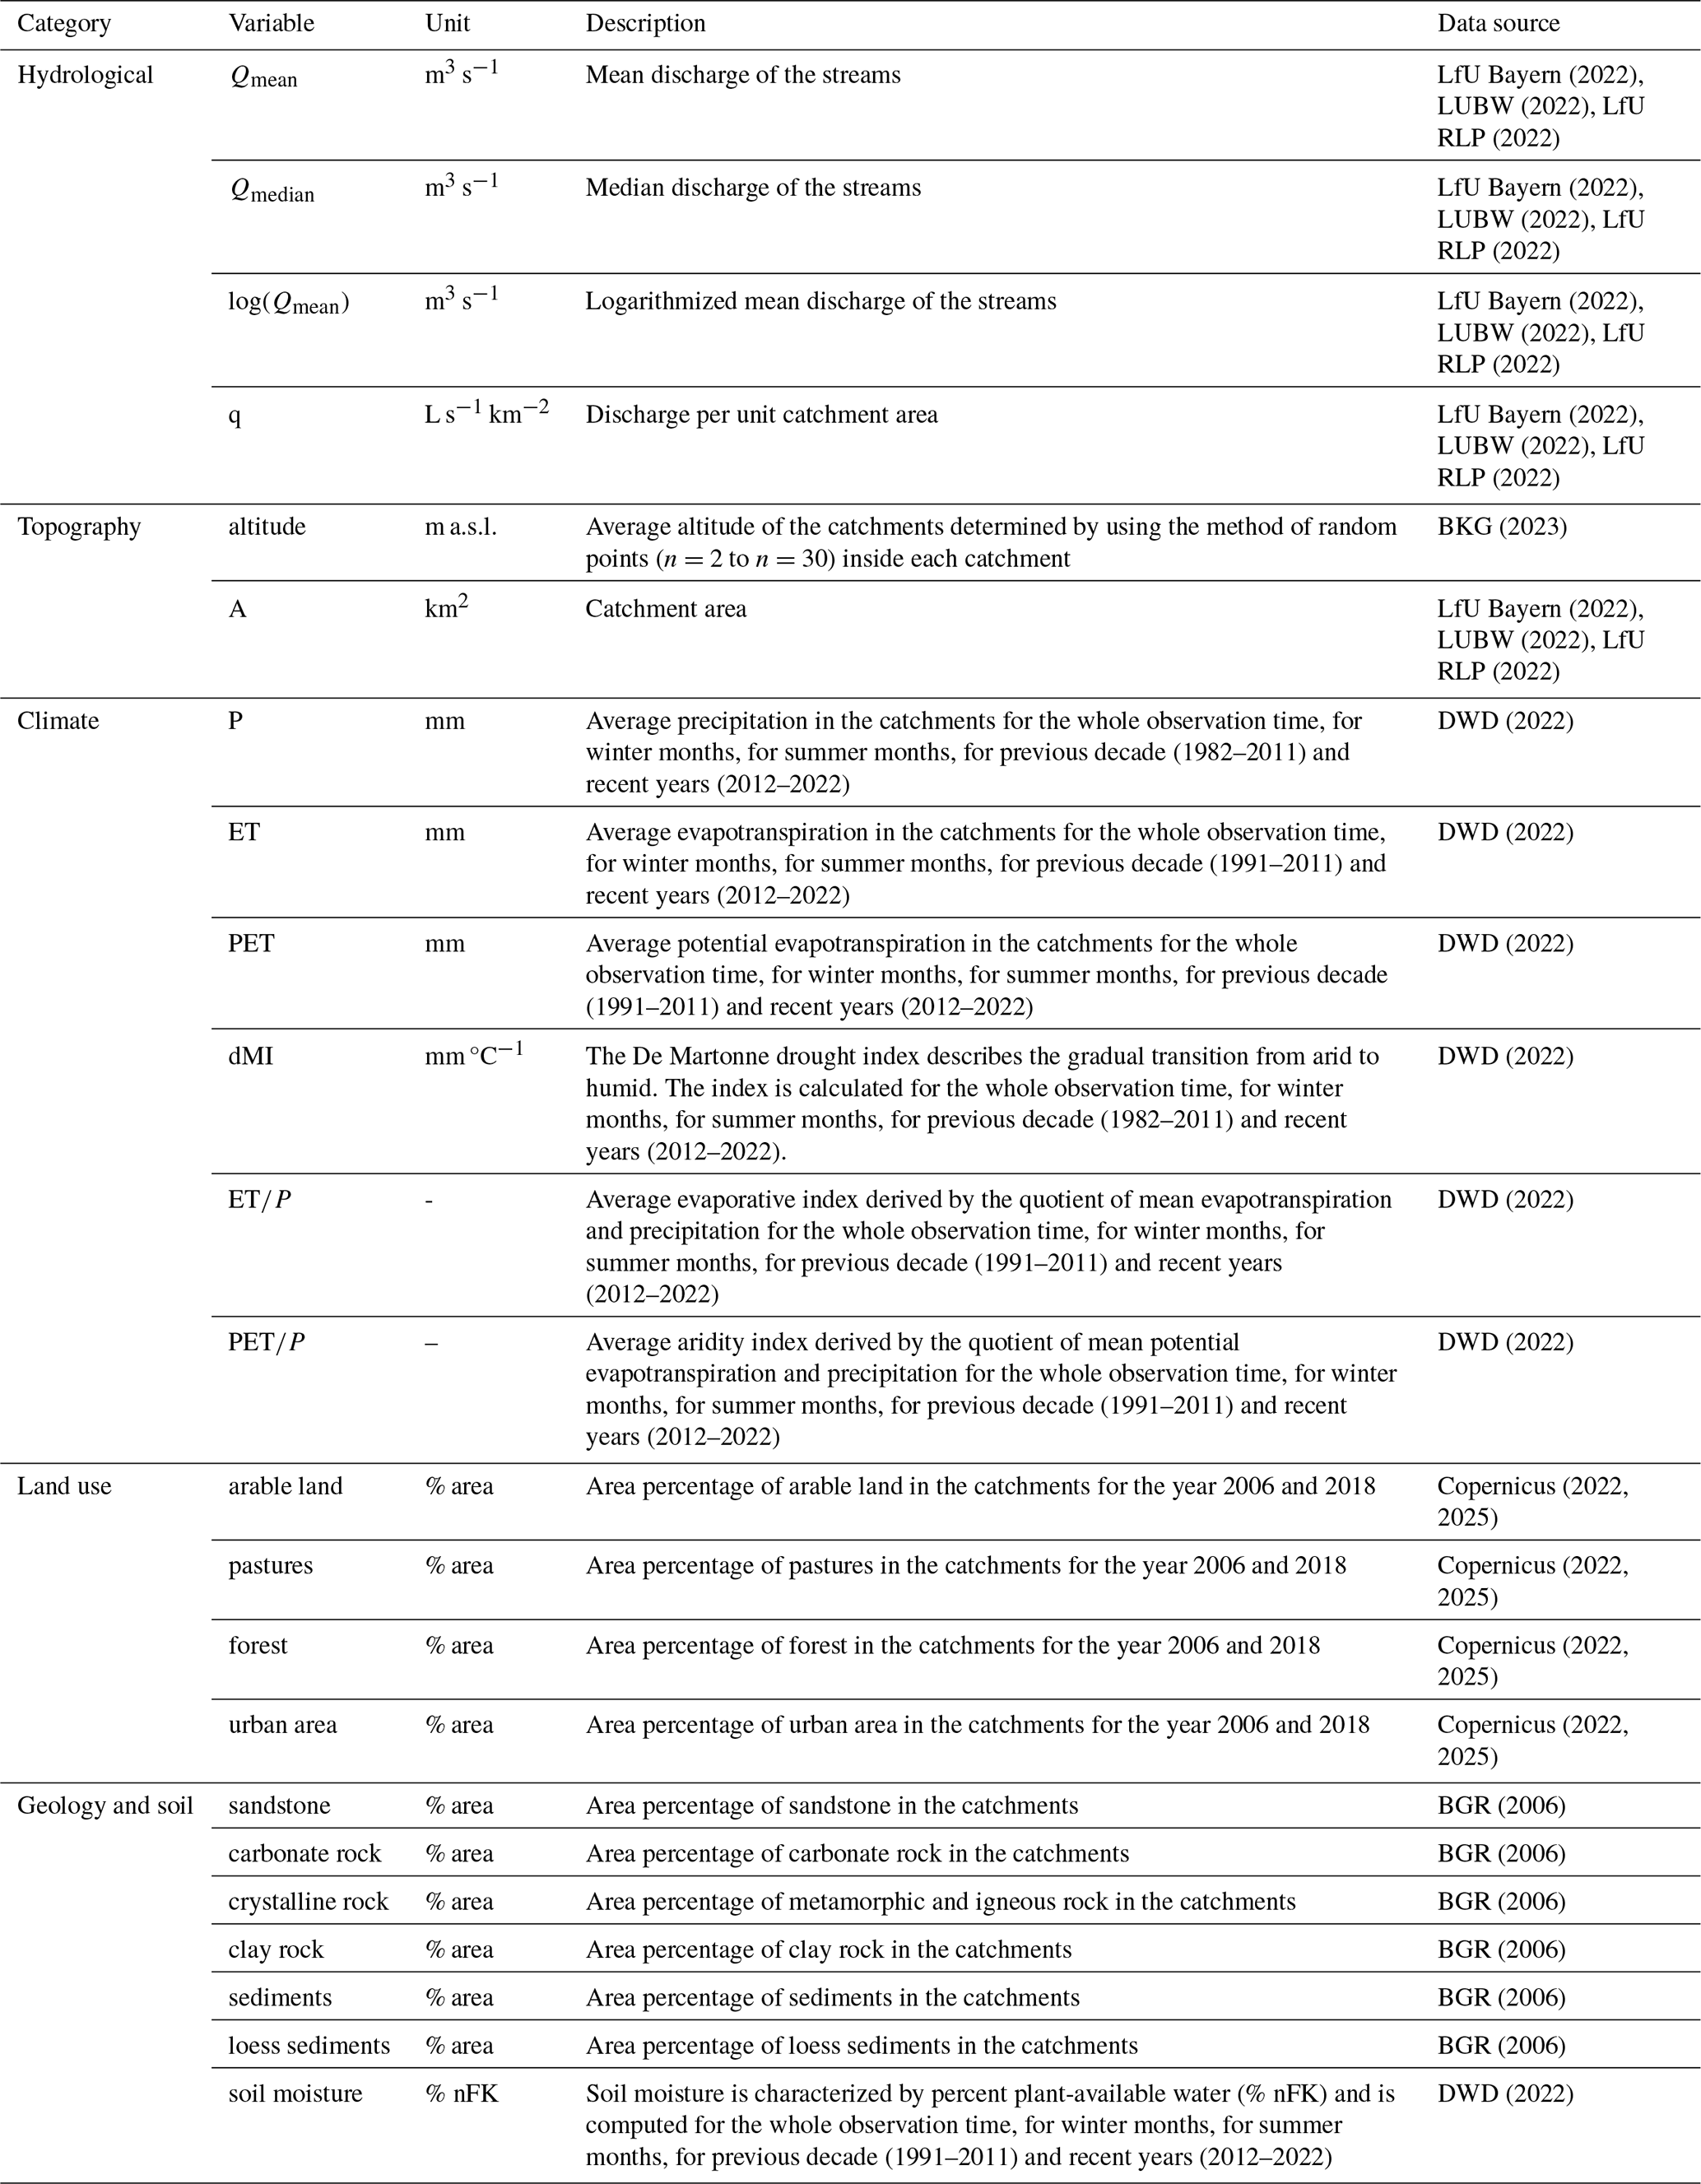
Table 2Descriptive statistics of mean solute concentrations (Cmean, mg L−1) and associated standard deviations (Cmean±SD) across all catchments. Interannual Trends in interannual solute concentrations are summarized as fraction of catchments (%) showing positive trends (Cincrease), negative trends (Cdecrease), or no significant trends (NC – no change). Trends were assessed using linear regression models (concentration vs. time), with p values derived from F tests and adjusted for multiple comparisons within each catchment dataset using the Benjamini–Hochberg procedure (p<0.05). The number of catchments included in the analysis is denoted by n.
2.3.4 Linking Catchment Characteristics to slope b
Catchment characteristics were grouped into several categories and compiled from institutional datasets (Table 1). Hydrological indices included mean discharge Qmean and median discharge Qmedian, the logarithm of mean discharge log(Qmean), and specific discharge (q; Eq. 4). Specific discharge q is the quotient of discharge Q and the catchment area A, whereby discharge in m3 s−1 was converted into discharge in L s−1.
Topographic characteristics comprised catchment altitude and area A, whereas climatic characteristics included precipitation P, evapotranspiration ET, potential evapotranspiration PET, the evaporative index , aridity index , and the De Martonne index (dMI; Eq. 5).
The dMI was used to characterize climatic conditions along the gradient from arid to humid and is defined as
with low values indicating dry regions and high values indicating wet regions (De Martonne, 1926; Blüthgen and Weischet, 1980; DWD, 2022). Additional categories included land use, geology, and soil properties.
Predominant land uses were determined as area percentages based on simplified classes (arable land, pasture, forest, urban, and unclassified), derived from the Corine Land Cover dataset for the years 2006 and 2018 (Copernicus, 2022, 2025). Shares of land uses were processed in QGIS (QGIS.org, 2022), with catchment shape and size provided by GDI RP (Rhineland-Palatinate) and the University of Freiburg for Bavaria and Baden-Württemberg (GDI RP, 2022; Stölzle and Stahl, 2023). Geological settings were categorized into sandstone, carbonate, crystalline, clay, sediments, and loess. As parent material strongly affects soil properties, geology and soil properties were combined. Soil moisture was obtained from the German Weather Service (DWD, 2022) as standardized values for a virtual sandy loam soil (37 % field capacity), expressed as percent plant-available water (% nFK).
Table 3Pearson correlation test between catchment descriptors of different categories and slope b showing influence of catchment characteristics on SEM: highly significant positive correlation ( p<0.01), significant positive correlation (+ p<0.05), significant negative correlation (− p<0.05), highly significant negative correlation ( p<0.01). At least moderate effect sizes (r>0.3) were observed for all correlations, with strong effect sizes (bold; r>0.5), indicating varying strengths of association. Differences between correlations in period 1 and 2 are determined by using ANCOVA (p<0.05) showing increased impact of control due to climate of period 2 (△), decreased impact of control due to climate of period 2 (∇), no change (O). Pearson correlation is corrected by Benjamini-Hochberg procedure.
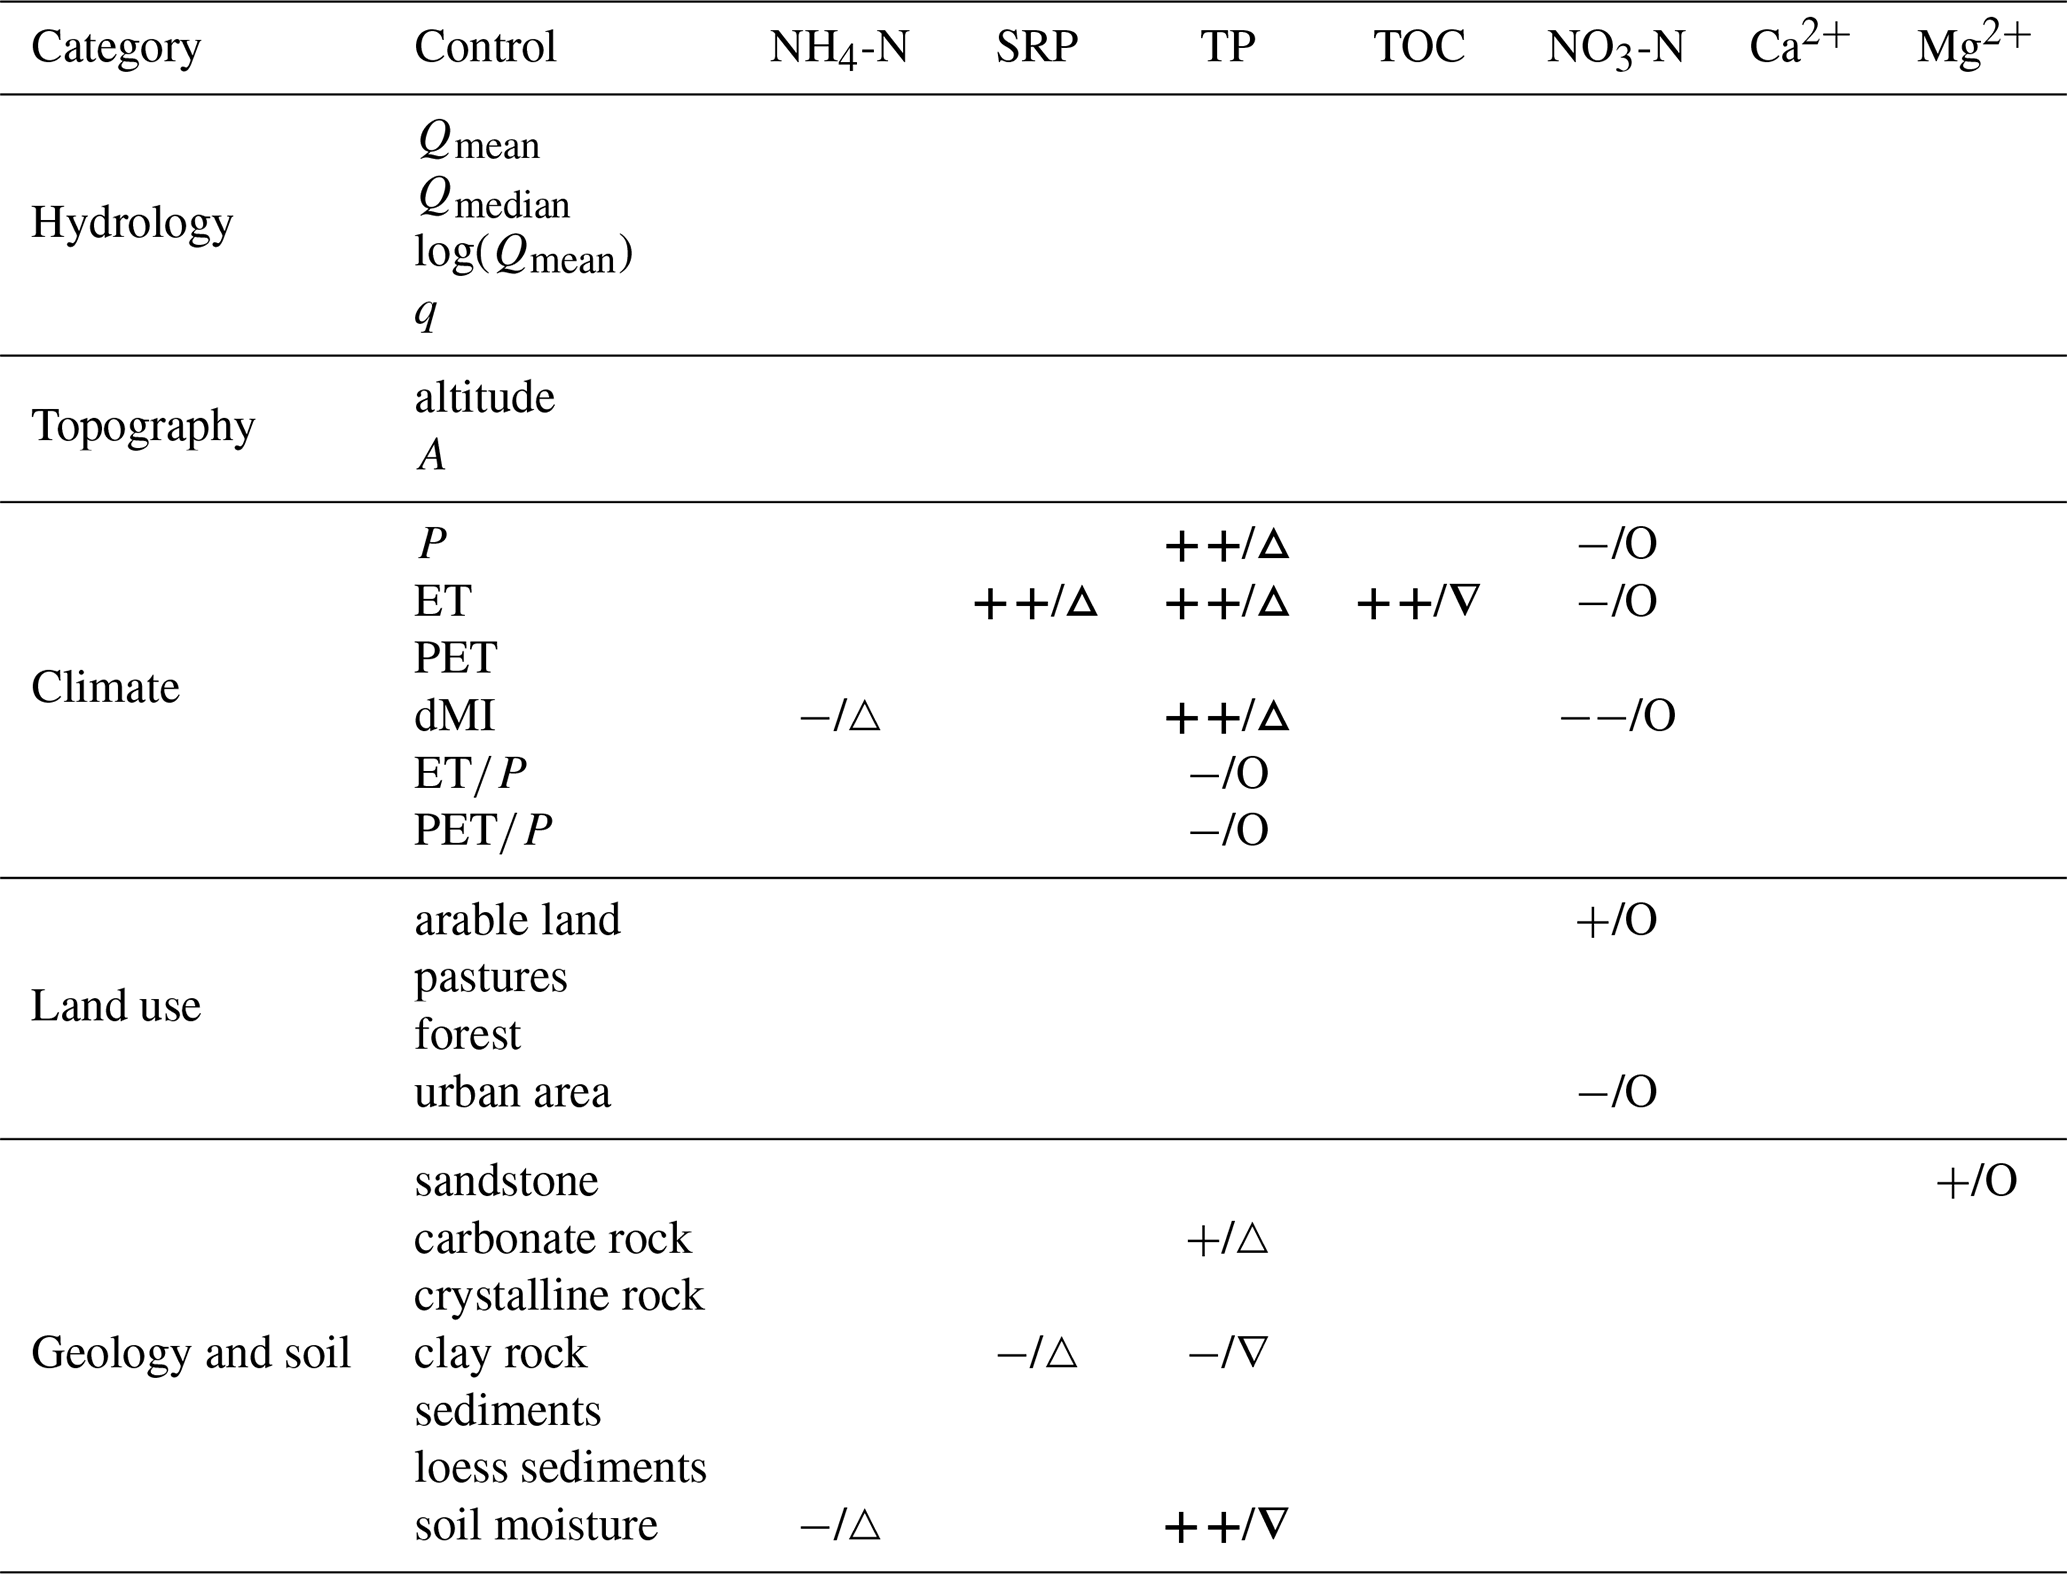
The predictive power of these controls was quantified using Pearson correlation coefficients, providing both the strength and direction of relationships between catchment characteristics and slope b. To ensure robust inference across the 23 tested variables, p values (p<0.05) were adjusted using the Benjamini–Hochberg correction, and Pearson's r was reported as a measure of effect size (Table 3). Temporal effects induced by climatically differences between period 1 and period 2 were assessed using linear models (Pearson correlation coefficient) relating catchment characteristics to slope b for period 1 (before 2012) and period 2 (since 2012). Differences between the two periods were formally evaluated by analysis of covariance (ANCOVA) to test for significant changes (p<0.05) in regression slopes (Table 3).
To examine whether changes in solute export mechanisms (SEM) between period 1 and period 2 were also related to land-use change, we calculated the difference in slope b (Δ-slope) for each catchment and water quality parameter between the two periods. We also calculated the difference in land-use share between 2006 and 2018 (Δ-land-use: percentage change in forest, pastures, arable land, and urban area, respectively). Pairwise correlations between Δ-slope and Δ-land-use were computed for each parameter–land-use combination. Normality of variables was tested using the Shapiro–Wilk test, with Pearson correlation applied when both variables were normally distributed (p>0.05) and Spearman correlation otherwise. All statistical analyses were conducted using the programming language R (Rstudio 4.2.0, 2022).
3.1 Assessment of Solute Mean Concentration
The analysis of in-stream solute concentrations reflects the static signatures and nutrient stress levels of anthropogenically impacted catchments, with trends possibly influenced by human activity and climatically changing conditions (Table 2). Mean nutrient concentrations ranged from 0.74–9.37 mg L−1 for NO3-N, 0.04–0.34 mg L−1 for NH4-N, 0.06–0.56 mg L−1 for TP, 0.02–0.27 mg L−1 for SRP, and 1.9–7.78 mg L−1 for TOC. Trend analysis across the full observation period for each catchment revealed significant decreases in mean concentrations in 57.5 % (NH4-N), 72.5 % (NO3-N), 60.5 % (TP), and 67.5 % (SRP) of catchments, as confirmed by ANCOVA (p<0.05). Geogenic solutes occurred at higher concentrations (Ca2+: 13–180.9 mg L−1; Mg2+: 2.57–55.12 mg L−1) and showed greater absolute variability, but with lower interannual variation compared to nutrients (Table 2).
3.2 Predominant SEM affected by temporal circumstances
Long-term slope b and CVC CVQ metrics in southern Germany revealed explicit solute export mechanisms (SEM) for nutrients and geogenic solutes, reflecting differences in mobilization, transport, and transformation processes influenced by seasonality, humidity, and climatically changing conditions (Table S4). Nutrients such as NH4-N, SRP, and TP exhibited more pronounced chemodynamic behaviour than conservative solutes like Ca2+ and Mg2+ (Fig. 3). When exhibiting chemodynamic behaviour, NH4-N showed dominant enrichment pattern (b>0), SRP tended toward dilution dynamics, and TP displayed strong enrichment behaviour (b>0.6) at elevated CVC CVQ ratios (>1). Under condition of high enrichment behaviour (b>1), TOC showed chemodynamic behaviour indicative of discharge-decoupled processes, whereas b<1 generally reflected both chemostatic and chemodynamic patterns. In contrast, Ca2+ and Mg2+ typically displayed dilution dynamics, while NO3-N combined dilution and enrichment pattern but retained an overall chemostatic signature.
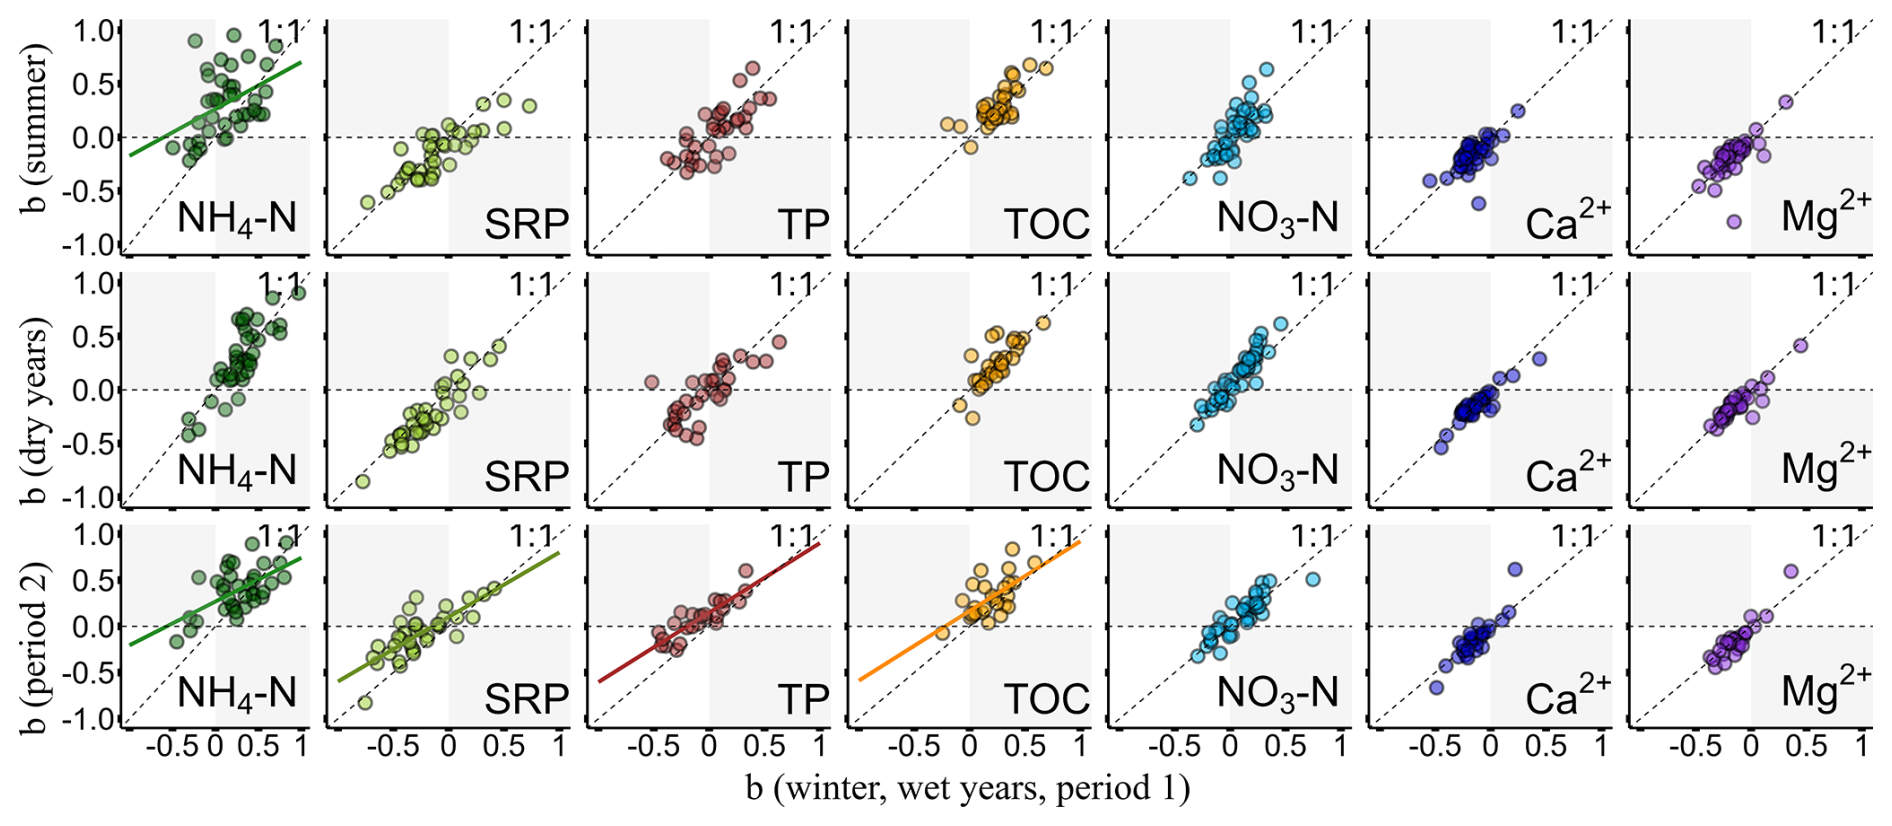
Figure 4Differences in solute export mechanisms for NO3-N, NH4-N, SRP, TP, TOC, Ca2+, and Mg2+ in response to temporal changes. Differences in solute export mechanisms between (top) summer and winter, (middle) between dry years and wet years and (bottom) between climatically different period 2 and period 1. Dots represent individual catchments. The b values (y axis and x axis) are slopes derived from c–Q-relationships, indicating export behavior (b<0: dilution; b>0: enrichment). Points above the 1:1 line indicate an increase in enrichment or a decrease in dilution behaviour, whereas points below the 1:1 line indicate a less pronounced enrichment or an increased dilution export pattern respectively. The gray areas indicate a directional shift in solute export.
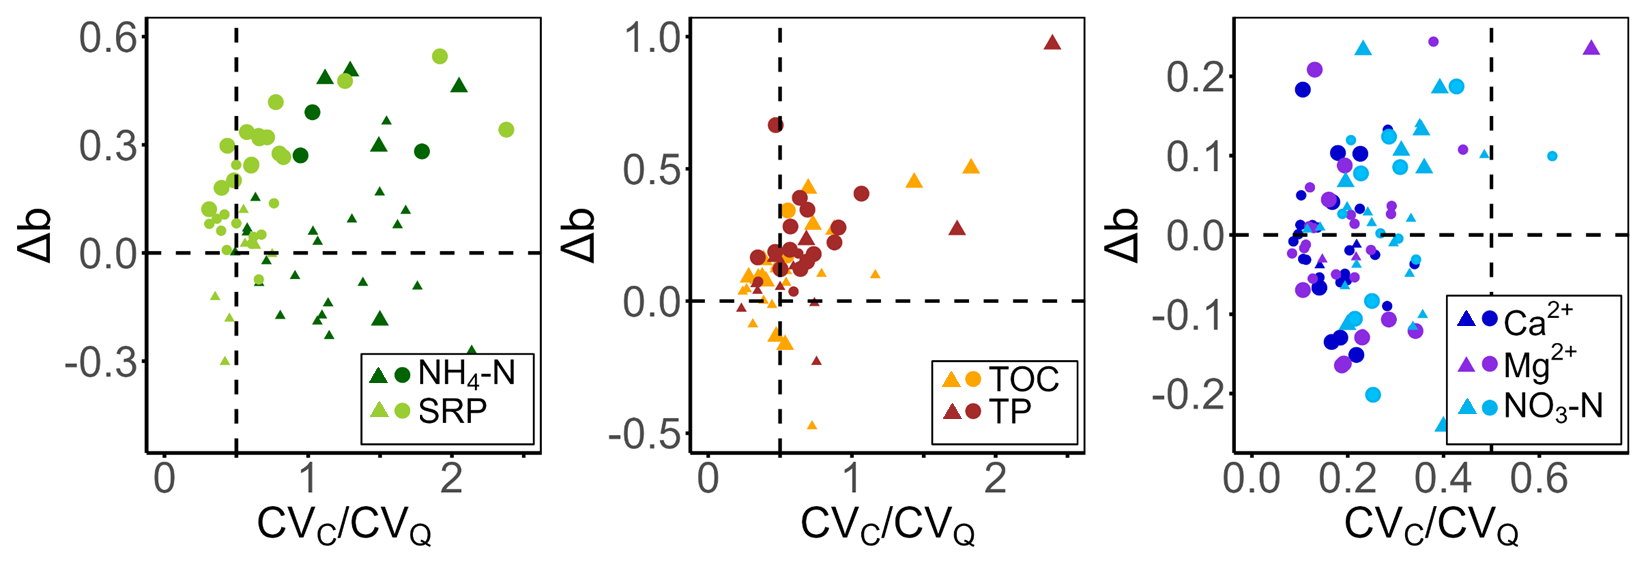
Figure 5Change in c–Q-relationships (Δb) for SRP, NH4-N, TP, TOC, NO3-N, Mg2+, and Ca2+ explained by changing climatic conditions. Positive Δb values indicate an increasing enrichment behaviour. ▴ represent catchments exhibiting enrichment behaviour in period 1, while • indicate catchments with dilution behaviour in period 1. Significant differences in slope b between period 1 and period 2 are highlighted by larger symbol sizes.
Temporal analyses revealed significant changes in SEM across seasons (NH4-N and SRP) and across decades (NH4-N, SRP, TP, and TOC). NH4-N exhibited the strongest seasonal variability, with pronounced enrichment pattern in summer and reduced enrichment dynamics in winter. SRP typically tend towards non-significant dilution behaviour during summer and enrichment behaviour in winter, highlighting its temporal variability (Fig. 4). Over the recent decade, however, dilution processes weakened for SRP, as indicated by a positive Δb, particularly in catchments that had displayed dilution SEM in earlier decades (Fig. 5). For both NH4-N and SRP, variability in Δb increased with higher CVC CVQ ratios.
In contrast, TP and TOC showed less pronounced seasonal changes. However in period 2, characterized by warmer, drier summers and sporadic intense precipitation events (KLIWA, 2021), TP and TOC shifted toward enrichment pattern indicated by a positive Δb. TP especially exhibited increasing slope b (Δb), predominantly in catchments with prior dilution dynamics. For both solutes, catchments with chemodynamic signatures predominantly shifted toward stronger enrichment behaviour (Fig. 5).
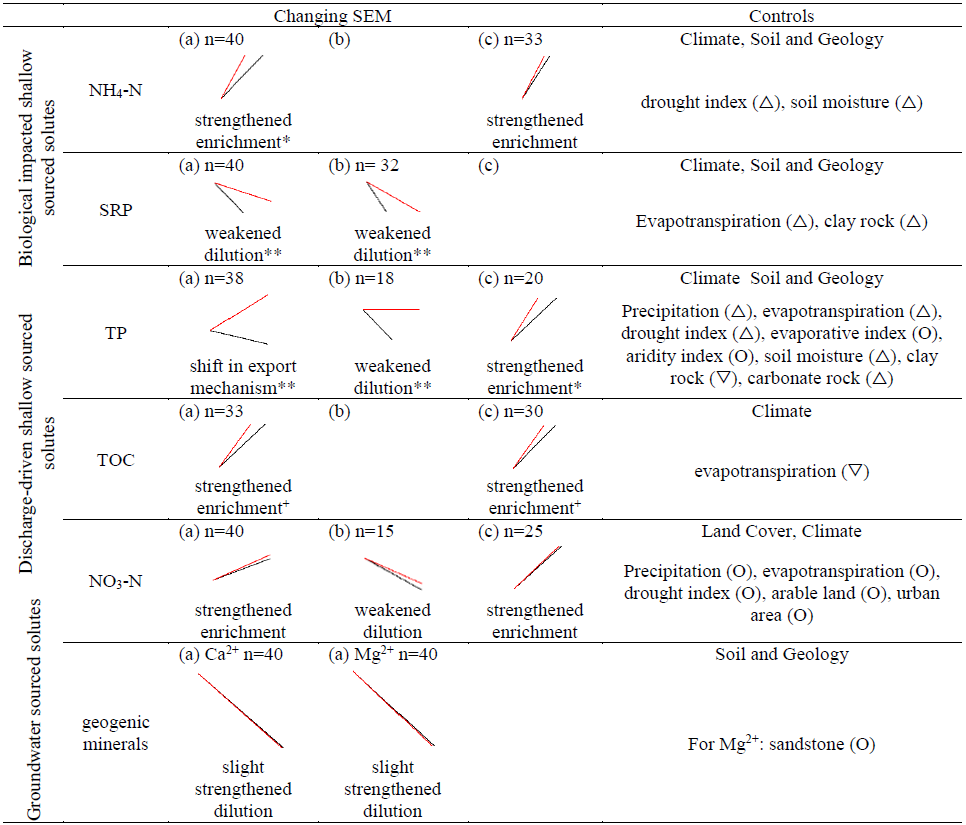
Table 4Changing SEM across period 1 (black) and period 2 (red) for SRP, NH4-N, TP, TPC, NO3-N, Ca2+, and Mg2+, along with their controlling factors. Significant differences were tested using the Kruskal-Wallis test corrected with Bonferroni correction (+ <0.1, * <0.05, ** <0.01). Symbols indicate increasing (△),decreasing (∇) or unchanged (O) control impact. Panels: (a) all catchments, (b) catchments with dilution behaviour in period 1 (n≥10), (c) catchments with enrichment behaviour in period 1 (n≥10). Trends are based on mean calculations.
NO3-N, Ca2+, and Mg2+ showed no significant responses to seasonal variability, humidity, or the climatic differences between period 1 and period 2 (Fig. 4). Changes in Δb for these solutes were minor (−0.25 to +0.25), with only slight, non-significant trends toward enrichment for NO3-N and dilution for Ca2+ and Mg2+ (Table 4). Overall, solutes with chemostatic signatures (NO3-N, Ca2+, Mg2+) displayed low temporal variability compared to reactive nutrients (NH4-N, SRP), which are influenced by biogeochemical processes. Additionally, no SEM changes were observed in response to variations between wet and dry years (Fig. 4).
3.3 Controls of SEM and their Changing Influence along Time
SEM of nutrients are influenced by distinct explanatory controls. The impact of these controls is potentially influenced by changing climatic conditions. Pearson correlation coefficients (ranging from 0.33 to 0.75, p<0.05 corrected by Benjamini-Hochberg procedure) were used to assess relationships between SEM (slope b) and explanatory controls for the decade before and after 1 January 2012. In addition, statistical differences between correlations for period 1 and period 2 were formally evaluated using analysis of covariance (ANCOVA). The obtained Pearson correlation coefficients indicate both positive and negative correlations (Table 3).Shallow-sourced nutrients are primarily influenced by near-surface environmental conditions, particularly climate (e.g. temperature and precipitation), as well as soil moisture and the decomposition of organic material on the ground and in the upper soil layers. In contrast, geogenic solutes such as Ca2+ and Mg2+ are predominantly controlled by geological weathering processes. In addition to climatic influences, land cover, soil moisture conditions and geological characteristics affect shallow-sourced solutes.
For NH4-N, soil moisture (−) shows negative correlations with slope b, indicating dilution behaviour in wet catchments and enrichment behaviour in dry catchments. During period 2, the impact of these controls intensified, leading to a stronger regulation of c–Q relationships by soil moisture. SRP is primarily influenced by the climatic factor evapotranspiration () and the geological factor clay rock (−), with both controls becoming more pronounced in the recent decade (period 2). High evapotranspiration enhances enrichment SEM, while high clay rock proportions in catchments promote dilution behaviour. TP, which includes both particle-bound and soluble reactive phosphorus, is influenced by a broader range of factors, including drought index (), precipitation (), evapotranspiration (), evaporative index (−), aridity index (−), soil moisture (), carbonate rock (+), and clay rock (−). While the influence of climatic controls (precipitation, evapotranspiration, dMI) and soil moisture has increased, geological controls have become less influencing in regulating SEM. Further, TOC, which is primarily governed by surface processes, is exclusively influenced by evapotranspiration (), with its regulatory impact on SEM diminishing in period 2.
Unlike the more reactive solutes, NO3-N exhibits chemostatic behaviour but remains influenced by multiple controls, including arable land (+), urban area (−), drought index (), precipitation (−), and evapotranspiration (−). Arable land, a diffuse source, supports enrichment behaviour, whereas urban areas, acting as potential point sources, promote dilution dynamics. Wet catchments (characterized by high soil moisture, high precipitation, and humidity inferring drought index values) are more likely to exhibit dilution SEM. Over time, the regulatory influence of explanatory controls on NO3-N export dynamics has remained stable, indicating a robust system. As expected, the SEM of geogenic solutes (Ca2+ and Mg2+) are largely unaffected by external controls. For Mg2+ the proportion of sandstone correlates positively with slope b, whereas for Ca2+, no significant regulatory controls on SEM were observed. Notably, in the recent period, the effect of sandstone proportion on Mg2+ export dynamics remained unchanged.
Solute concentration and SEM varied across temporal and spatial scales, influencing solute mobilization, transportation, storage, and transformation processes. Results indicate that solute concentrations and SEM are influenced by climatically changing periods and land-use changes.
4.1 Assessment of Solute Mean Concentration
Significant differences in mean nutrient and geogenic solutes concentrations were observed across catchments. Reactive solutes (NH4-N, SRP, TP) exhibited low mean concentrations, consistent with previous studies (Ebeling et al., 2021; Musolff et al., 2015). Low NH4-N concentrations reflect its rapid turnover, while phosphoric species are quickly taken up by plants, limiting their availability (Birgand et al., 2007; Martí and Sabater, 1996). By contrast, NO3-N concentrations averaged 4.04 mg L−1, reflecting agricultural inputs and persistent legacy effects (Aubert et al., 2013). Nutrient concentrations in Germany were historically elevated but have declined since 1990 due to reduced fertilizer use. However, NO3-N shows a slower decrease, which can be explained by legacy effects compared to NH4-N, TP, and SRP (Basu et al., 2010). Declines in NH4-N, TP, and SRP concentrations can also be attributed to prolonged droughts associated with the climate of period 2, as extended dry summer periods lead to lower water levels and reduced mean concentrations (Outram et al., 2016; Van Loon et al., 2019). In contrast, intense high-flow events increase nutrient export, but biweekly to monthly sampling likely misses these peaks, and hence, leads to potential underestimation of total nutrient loads. Nevertheless, the sampling frequency remained unchanged across both study periods. Thus, the observed changes in SEM are more likely explained by hydroclimatic shifts associated with changing climatic conditions rather than by sampling limitations. Still, further high-resolution monitoring would be valuably to better capture event-driven dynamics, as individual events can exhibit slope b values that deviate distinctively from the seasonal behaviour (Knapp et al., 2020; Winter et al., 2024).
TOC, is less reactive and more persistent, with carbon-rich landscape types (e.g. wetlands or riparian zones) serving as sources, visible in higher and more variable mean concentrations. However, interannual variability in TOC concentrations is less pronounced than for other nutrients, suggesting lower influence from anthropogenic actions. The mean concentrations of geogenic solutes (Ca2+ and Mg2+) are consistent with previous reports, and their spatial variability reflect the heterogeneous geology of the catchment regions (Musolff et al., 2015). These solutes, primarily governed by geological processes, showed only slight increases in mean concentration for some catchments (Ca2+: 15 %, Mg2+ 12.5 %). The persistence of the lithosphere and weathering processes contributed to low interannual variability. However, changing climatic conditions from period 1 to period 2, including warmer temperatures and lower groundwater levels, could promote higher residence times and enhanced weathering rates. This may lead to slight increase in solute concentrations, but further confirmation is needed (Li et al., 2022; Musolff et al., 2015).
4.2 Changes in SEM associated with Seasonality, Humidity Level and Changing Climatic Conditions
Changes in slope b over time reveal shifts in solute mobilization, transportation, and transformation processes, depending on seasonality, humidity levels, and responses to climatically different periods. SEM cluster into three groups: (1) seasonal-dynamic solutes, (2) long-term dynamic solutes, and (3) long-term stable solutes (Fig. 3).
4.2.1 SEM of Seasonal-Dynamic, Long-Term Dynamic and Long-Term Stable Solutesupple
Seasonal-dynamic solutes: mainly reactive nutrients (NH4-N, SRP, TP), exhibit chemodynamic behaviour with solute variability exceeding discharge variability due to biogeochemical processes (Musolff et al., 2015). Rapid uptake and turnover dominate their variability (Birgand et al., 2007; Martí and Sabater, 1996). However, in intensively managed catchments, homogeneous solute sources might mask biogeochemical effects and can lead to a chemostatic behaviour proportional to discharge, accordingly (Ali et al., 2017; Basu et al., 2011). Seasonal-dynamic solutes show chemodynamic enrichment behaviour when unevenly mobilized at higher discharges, while a dilution pattern occurs when deeper sources dominate during low flow (Basu et al., 2011; Ebeling et al., 2021; Zhi and Li, 2020). Dilution dynamics can also result from biological SRP release during low flow, acting as temporal point sources in sediments and riparian zones (Dupas et al., 2018; Ebeling et al., 2021; Smolders et al., 2017).
Long-term dynamic solutes: TOC, and particulate-bound TP, strongly correlate with discharge (CVC CVQ<0.5) and are less sensitive to transformation processes (Fig. 3, middle). TOC and TP show enrichment behaviour, when increased discharge and a rising water table activate surficial pathways and enable hydrological connectivity (Huntington and Wieczorek, 2021). Variability in TOC and TP concentrations can exceed discharge variability due to heterogeneous vertical and horizontal TOC sources in riparian zone and SRP-related biogeochemical processes, promoting chemodynamic tendencies (Ebeling et al., 2021; Rose et al., 2018; Stewart and Li, 2025).
Long-term stable solutes: NO3-N, Ca2+, and Mg2+ primarily display dilution patterns with negative slopes b (Fig. 3, right; Botter et al., 2019; Diamond and Cohen, 2018). NO3-N typically exhibits chemostatic behaviour, driven by widespread anthropogenic nitrogen inputs in intensively managed catchments, such as those in southern Germany. Historical fertilization has created significant nitrogen stores across soil layers, buffering biogeochemical processes. In contrast, natural systems without human impact exhibit chemodynamic NO3-N behaviour, a phenomenon, which is not observed in the anthropogenically affected southern Germany (Winter et al., 2020). Vertical heterogeneity in NO3-N sources influences SEM, with shallow sources causing chemostatic enrichment dynamics and groundwater-derived sources causing chemostatic dilution behaviour (Basu et al., 2011; Moatar et al., 2017). Low temporal concentration variability (CVC CVQ<0.5) and negative slope b for Ca2+ and Mg2+ indicate chemostatic dilution behaviour, driven by deep chemical weathering and steady groundwater release (Knapp et al., 2020; Musolff et al., 2015; Botter et al., 2020).
4.2.2 Alteration in SEM due to Seasonal and Humidity Variation
Seasonal-dynamic solutes: Biogeochemical processes vary over time, influenced by seasons, humidity (wet and dry years), and climatically changing conditions (period 1 and period 2). Seasonal-dynamic nutrients, especially NH4-N exhibit strong seasonal SEM fluctuations, with notable shifts between summer and winter (Figs. 4, S1). Seasonal effects, particularly temperature variations influence nutrient production and depletion via rapid biogeochemical turnover and rising amount of organic matter (Ebeling et al., 2021; Greaver et al., 2016; Hellwig et al., 2017). During extended summer droughts, lower discharge and soil saturation reduce hydrological connectivity and limit solute transport (Winter et al., 2022; Yang et al., 2018). Under these conditions, NH4-N accumulates from rising amount of decomposing organic material in shallow soils (Greaver et al., 2016). Sporadic hydrological reconnection mobilizes NH4-N during rising discharge, leading to intensified enrichment behaviour in summer (Fig. 4). SRP tends to show lower slope b in summer. Warm summer temperatures and low flow boost biological activity, promoting SRP dilution through instream point sources in riverbed and through terrestrial plant uptake in riparian zones. In winter, colder temperatures suppress these processes (Bieroza et al., 2024; Dupas et al., 2018; Martí and Sabater, 1996; Pohle et al., 2021; Smolders et al., 2017).
Long-term dynamic solutes: TP's particle-bound phase lowers its biogeochemical reactivity but supports mobilization during rising discharge, causing enrichment behaviour (Bieroza et al., 2024; Thompson et al., 2011; Martí and Sabater, 1996). Especially after prolonged dry periods, when hydrological connectivity is limited and TP accumulation is exceptionally high, wet periods with precipitation events can strongly trigger enrichment behaviour by mobilizing accumulated TP from sediments and soils (Bieroza et al., 2024; Thompson et al., 2011). Long-term dynamic solutes show limited temporal variation due to their reduced sensitivity to biogeochemical processes, and mainly tracking discharge, with higher flows in wet winters and lower in dry summers (Winter et al., 2020).
Long-term stable solutes (NO3-N, Ca2+, Mg2+) display non-significant temporal effects, driven by residence time and stable solute source. NO3-N's variability is buffered by legacy sources and slow biochemical processes (e.g., lower degradation rate; Basu et al., 2011; Dupas et al., 2018).
Seasonal influences rank highest for seasonal-dynamic solutes (NH4-N, SRP) affected by biogeochemical processes, followed by long-term dynamic (TP, TOC), then long-term stable solutes (NO3-N, Ca2+, Mg2+). The contrasting SEM patterns of seasonal-dynamic, long-term dynamic, and long-term stable solutes highlight the interplay between hydrological drivers, biogeochemical processes, and source distribution in shaping c–Q-relationships. While high-frequency monitoring allows these dynamics to be disentangled across temporal scales, low-resolution monitoring provides a complementary perspective. In the context of long-term c–Q-relationships, grab samples collected at biweekly to monthly intervals primarily capture seasonal patterns in nutrient export, while short-term event responses are largely missed. For nitrate, this is reflected in high concentrations associated with elevated winter discharge and reduced concentrations during summer low-flow conditions, thereby representing the characteristic positive c–Q-relationship. Event-driven dynamics are therefore only incidentally captured and need to be interpreted as deviations from the overarching seasonal signal. Further, long-term and low-resolution records of TOC and TP consistently show higher concentrations during high-flow conditions and lower concentrations during low-flow conditions (positive slope b), regardless of season (see Fig. 4, top panel). This indicates that their mobilization is governed by uniform hydrological transport processes throughout the year. In contrast, chemodynamic NH4-N displays higher concentrations during summer high-flow events compared to winter high-flow events, implying distinct seasonal mobilization and export dynamics.
Besides, years of low-discharge and high-discharge (see Fig. 4, middle panel) show no differences in SEM. Hence, mean annual discharge levels alone have minor effect on the SEM of nutrients. However, long-term variations in SEM influenced by changing climatic conditions, suggest broader changes in NH4-N, SRP, TP, and TOC SEM. Therefore, changes in humidity alone are insufficient to explain SEM alterations. Thus, broader climatic-induced processes evolving between period 1 and period 2 likely contribute to these shifts in SEM. Land-use and management changes or legacy effects may also contribute to these patterns. Land-use data from 2006 to 2018 (Table S2) indicate that several catchments experienced substantial shifts in land cover relative to their total area. However, statistical analyses show that land-use change does not significantly explain the observed shifts in SEM, respectively slope b (Table S5). Accordingly, the decadal differences in SEM align more consistently with observed climatic changes than with land-use dynamics. Nevertheless, legacy effects resulting from previous land-use or fertilizer management practices may still contribute to the observed patterns and cannot be completely excluded.
4.2.3 Alteration in SEM across Climatically Changing Periods
Comparing the climatically different Periods 1 and 2 (before and after 1 January 2012) captures a segment of the gradual alteration in regional climate and hence, might reflect ongoing climate-change-related developments. Since 2012, prolonged heatwaves, droughts, and intense sporadic 1 d precipitation events have significantly influenced seasonal-dynamic and long-term dynamic solutes (KLIWA, 2021; Payne et al., 2020). While subsurface weathering processes remain mostly stable, nutrients have become more sensitive to the effects of climatically changing conditions. Seasonal-dynamic and long-term dynamic solutes exhibit enhanced enrichment and reduced dilution behaviour in period 2, reflecting altered solute source distribution and mobilization (Figs. 4, 5, S1). Prolonged heat and drought boost decomposable organic matter production, increasing nitrogen and phosphorus availability. Warmer temperatures stimulate the mineralization of nutrients into inorganic forms by decomposers (Ainsworth and Long, 2005; Freeman et al., 2001; Huntington and Wieczorek, 2021). Additionally, elevated CO2 levels, enhanced plant growth, and fertilizer applications (e.g., manure) raise nutrient accumulation in upper soil layers (Huntington and Wieczorek, 2021; Kukal and Irmak, 2018, Stewart and Li, 2025). Drought reduces plant nutrient uptake, leading to further nutrient accumulation. Additionally, oxygenation of previously waterlogged soils suppresses nitrogen removal via denitrification, enhancing nutrient build-up (Bieroza et al., 2024; Gomez et al., 2011). Together, these effects increase internal sources of TOC, TP, SRP, NH4-N, and NO3-N in shallow soil layers compared to previous decades. Subsequently, changing climatic conditions in period 2 degrades soil structure and reduces soil moisture, lowering nutrient retention capacity (for SRP, TP), thus promoting leaching (Lucas et al., 2023). Combined with drier antecedent conditions, transport limitations, and sporadic high-intensity precipitation events, these factors intensify nutrient leaching during wet periods (Bieroza et al., 2024; Dupas et al., 2025; Huntington and Wieczorek, 2021; Lucas et al., 2023). Accumulated nutrients are transported via surface and subsurface flow during wet periods, especially in autumn and winter, when rising water tables and increased discharge enhance hydrological connectivity (Fig. 6; Bieroza et al., 2024; Winter et al., 2023). Both transport pathways amplify enrichment behaviour of all nutrients. However, in the case of NO3-N, variability can be buffered by deeper legacy sources in some catchments, which can mask enrichment patterns. These legacy nitrate pools could originate from decades of intensive fertilizer application and historical land management practices, including changes in fertilization regulations, and can sustain nitrate release over extended periods that are largely independent of short-term hydrological variability (Dupas et al., 2016). As a result, these long-term anthropogenic legacies exert a persistent influence on solute export mechanisms, potentially masking or attenuating enrichment patterns driven by contemporary hydrological conditions and climatic factors in some catchments (Dupas et al., 2016; Li et al., 2024). Consequently, legacy effects cannot be excluded as an additional potential driver of changes in SEM, alongside climatic influences. Further enrichment processes driven by changing climatic conditions (as observed in period 2) have weakened even SRP's usual dilution pattern during low flow.
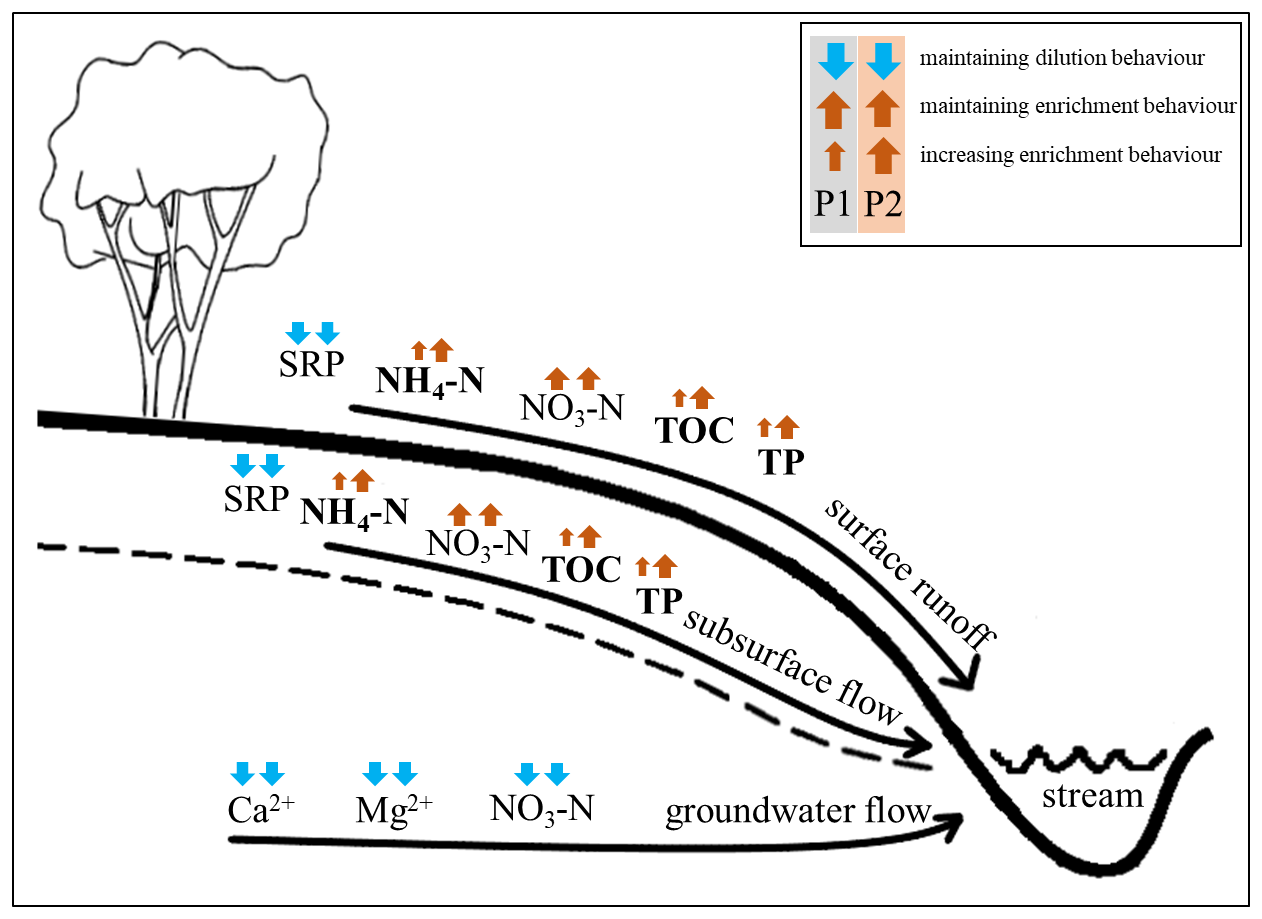
Figure 6Illustration of mobilization and transportation pathways for nutrients and geogenic minerals. Change in SEM based on changing climatic conditions illustrated by direction and size of the arrows. P1: period 1 (onwards 1 January 2012). P2: period 2 (after 1 January 2012; modified illustration Jordan et al., 1997).
Long-term stable solutes: NO3-N, Ca2+, and Mg2+ show non-significant changes in SEM. NO3-N exhibits stable SEM because extensive anthropogenic legacy stores counterbalance enrichment dynamics forced by climatic effects. Although warmer conditions increase substrate availability and biological activity, their impact remains minimal compared to historic human-applied NO3-N. Consequently, some catchments exhibit a slight, non-significant decrease in dilution and increase in enrichment behaviour, distinguishing NO3-N from other seasonal-dynamic and long-term dynamic nutrients.
Ca2+ and Mg2+ remain resilient due to largely undisturbed lithospheric weathering processes. Warmer temperatures and reduced discharge extend solute residence times, enhancing weathering rates, causing a minor, non-significant rise in dilution dynamics (Fig. 6; Botter et al., 2020; Li et al., 2022; Musolff et al., 2015).
4.3 Drivers and Controls Influencing Solute Export Dynamics
Seasonal-dynamic and long-term dynamic solutes exhibit increased enrichment and reduced dilution dynamics under the influence of changing climate. Catchment characteristics, including land cover, geology, pedosphere, and climate, significantly shape SEM in both period 1 and period 2, as confirmed by Pearson correlation coefficients (p<0.05).
For seasonal-dynamic NH4-N, humidity conditions expressed by the drought index (dMI) regulate SEM, driving dilution dynamics under wet conditions. Rapid turnover rates (e.g., uptake, transformation) deplete NH4-N sources as discharge rises and hydrological connectivity increases (Birgand et al., 2007; Martí and Sabater, 1996; Pohle et al., 2021). In drier catchments, drought reduces hydrological connectivity and limits solute transport particularly during prolonged heatwaves, enhancing accumulation, and intensifying enrichment dynamics. Warmer climatic conditions in period 2 amplifies the effects of drought (increasing impact of dMI on SEM), explained by extended transport limitations while increasing solute accumulation, ultimately intensifying enrichment dynamics.
For SRP, evapotranspiration and clay-rich soils are key controls. Low evapotranspiration sustains hydrological connectivity in shallow soil, linking terrestrial SRP sources to streams and promoting dilution via source depletion. Clay soils act as buffers, hindering SRP mobilization through adsorption-desorption processes (Basu et al., 2011; Thompson et al., 2011). In period 2, this buffering effect has intensified, highlighting rapid SRP leaching in areas lacking clay minerals. At the same time, higher evapotranspiration increasingly drives SRP accumulation and reduced hydrological connectivity in period 2, thereby weakening dilution behaviour in response to the altering climatic conditions.
TP SEM reflects mobilization through discharge and biogeochemical processes since TP occurs in both solid and soluble forms. Increased discharge activates preferential pathways, enhancing enrichment behaviour through sediment mobilization. TP SEM are influenced by drought index (dMI), precipitation, evapotranspiration, soil moisture, clay rock, and carbonate rock. Carbonate rock facilitates preferential flow, amplifying enrichment behaviour, while clay materials slow phosphorus mobilization (Basu et al., 2011; Thompson et al., 2011). Changing climatic conditions from period 1 to period 2 expands TP sources and transport limitation (control: evapotranspiration, soil moisture, drought index), intensifying mobilization during shortened wet periods in summer, as well as in autumn and winter when water table rises (control: precipitation). This enhances enrichment dynamics and weakens dilution patterns. In period 2, controls of climate, soil moisture and carbonate rock become stronger, whereas clay's impact on SEM declines.
For TOC, prolonged drought (control: evapotranspiration) leads to the accumulation of large TOC sources that are increasingly mobilized during shortened wet periods, thereby amplifying enrichment behaviour (Dupas et al., 2025).
SEM of NO3-N is regulated by several controls but maintains a distinctive chemostatic behaviour representing a long-term stable solute. Wet conditions, explained by high precipitation, and humidity inferred drought index values, enhance dilution dynamics. In contrast, arable land and high evapotranspiration rates promote enrichment behaviour. Fertilizer use on arable land accumulates nitrogen in the soil creating diffuse sources. Meanwhile, evapotranspiration-induced dryness reduces constant drainage and prevents source depletion. When hydrological connectivity is restored (e.g., during rainfall and rising water table), accumulated nutrients are rapidly mobilized, resulting in pronounced concentration increases. Urban areas typically create dilution behaviour due to steady contributions from point sources (Aubert et al., 2013; Basu et al., 2010; Dupas et al., 2018; Musolff et al., 2015). In recent years, the effects of land cover (urban area and arable land) on SEM have lessened, suggesting reduced anthropogenic disturbance due to improved wastewater treatment and decreased fertilizer use. Minor changes, like lower hydrological connectivity and increased NO3-N generation during prolonged heatwaves, slightly amplify enrichment behaviour and weaken dilution SEM. However, the increase in slope b remains primarily masked by anthropogenic NO3-N inputs, which continue to dominate SEM.
Consequently, in addition to climatic factors, other drivers may have influenced the observed changes in SEM. In particular, legacy effects and land use changes over the study period may have contributed to long-term solute transport dynamics. Historical changes in fertilization regulations and land management practices may have resulted in persistent nutrient stores that continue to affect present-day solute export within individual catchments (Dupas et al, 2016; Li et al., 2024). Nevertheless, our analyses indicate that climatic parameters exhibit a distinctly stronger explanatory power for changes in solute export mechanisms between the two climatically different periods than land use parameters and their dynamics over time (Table 4). While urban areas and arable land show a significant influence on NO3-N export, no significant influence was detected for NH4-N, SRP, TP, or TOC, highlighting a comparatively weaker influence of land use parameters relative to climatic controls. Additional analyses of land use change demonstrate that substantial changes occurred between 2006 and 2018, which may have influenced changes in SEM (Kong et al., 2022). However, despite these land use alterations, no significant correlations were identified between changes in SEM and changes in land use composition (Table S5). This suggests that, although land use change and nutrient legacy effects might contribute concurrently, the observed changes in SEM are predominantly associated with climatic variables and should be interpreted in this broader context. However, the potential concurrent influence of land use change and nutrient legacy effects should be considered when interpreting changes in solute export mechanisms. Unlike seasonal-dynamic and long-term dynamic solutes, Ca2+ and Mg2+ are mainly governed by geology, particularly sandstone. For Mg2+, sandstone significantly hinders the production of Mg2+ ions and weakens dilution dynamics. The climatic conditions in period 2 may extends lithosphere residence time, slightly but not significantly enhancing dilution dynamics (Botter et al., 2020; Li et al., 2022). However, despite changing climatic conditions, Ca2+ and Mg2+ export dynamics have remained stable over the decades, with regulatory controls maintaining a consistent influence on Mg2+ SEM. Changing climatic conditions from period 1 to period 2 markedly shifts controls on seasonal-dynamic and long-term dynamic solutes, strengthening climatic and soil moisture effects that drive enrichment SEM, while weakening drivers of dilution pattern. This trend may increase solute concentration peaks, risking ecosystem and human health by surpassing water quality standards (Outram et al., 2016; Radach et al., 1990; Winter et al., 2020). Effective catchment management strategies to counter enrichment behaviour are essential. Climate impacts on long-term stable solutes remain minor, though slight increases in Ca2+ and Mg2+ dilution dynamics are assumed due to longer residence times.
To examine alterations in SEM for nutrient solute concentrations, the ratio of concentration to discharge variability, and c–Q relationships were analysed for 40 catchments in southern Germany. Temporal influences on SEM were investigated by comparing slope b across different seasons, humidity levels, and climatically different periods. The study found that temporal effects on SEM vary among seasonal-dynamic, long-term dynamic, and long-term stable solutes. Seasonal-dynamic solutes, which include fractions mobilized by surface runoff and subsurface flow, show the highest alteration due to seasonal variations and, especially, due to effects caused by changing climatically conditions. Further, the findings confirm enhanced enrichment behaviour for seasonal-dynamic and long-term dynamic solutes, while geogenic solutes show a slight but non-significant increase in dilution export mechanisms in response to changing climate in period 2. The influence of controls on SEM across climatically different periods was assessed using the Pearson correlation coefficient.
Time series data reveal declining mean solute concentrations of nutrients. This decline might be attributed to a shift in transported nutrient loads toward short-duration, high water-level events that are not captured by low-resolution grab sampling. A further possible explanation is improved fertilizer management in agricultural landscapes in southern Germany. Under prevailing fertilizer application and land manage strategies, the export mechanisms of nutrients would be shaped by a combination of biogeochemical processes and hydrological connectivity. However, NO3-N is typically buffered by large and persistent sources, which limit changes in solute export due to changing climatic conditions, whereas nutrients such as NH4-N, SRP, and TP exhibit weaker buffering effects. However, the influence of mankind remains present for all water quality parameters. Seasonal-dynamic NH4-N and SRP are strongly influenced by biogeochemical processes and are therefore highly vulnerable to temporal fluctuations, exhibiting distinct seasonal and climate-driven alterations.
In contrast, long-term dynamic solutes such as TP and TOC are less affected by temporal changes, showing no clear seasonal patterns but rather interannual variations in response to climatically different periods. Nutrients are transported via surface runoff and subsurface flow. The gradual climatic change from period 1 to period 2 may serve as a good proxy for how future climatic changes could increasingly alter both transport pathways, leading to shifts in SEM. So, since 2012 (period 2), warmer temperatures, prolonged heatwaves, and sporadic but intense precipitation events have led to increased internal source accumulation and reduced hydrological connectivity. As a result, solute mobilization and transport are largely confined to near-surface pathways during shortened wet periods in summer and to rising water levels in winter, leading to intensified enrichment behaviour. Furthermore, enrichment processes have increasingly outweighed dilution mechanisms, particularly in the case of SRP.
In contrast, underground mobilization and transport processes remain largely resilient to climatic alterations. Consequently, Ca2+ and Mg2+ experience minimal influence from reduced discharge and show only a slight, non-significant increase in dilution behaviour. The SEM of nutrients is primarily shaped by controls related to hydrological connectivity, including climatic factors (precipitation, evapotranspiration, and drought index) and soil properties (soil moisture and clay content). In contrast, long-term stable Mg2+ is dominantly influenced by geological controls, such as sandstone formations.
The study highlights the urgent need to focus on nutrients, as enrichment export mechanisms continue to intensify. The expansion of extreme weather conditions, including heatwaves and droughts, will further amplify these processes. In the future, solute peak concentrations may increasingly exceed water quality benchmarks, posing risks to riverine ecosystems and human health through eutrophication and drinking water contamination (Radach et al., 1990; Winter et al., 2020). These findings should be incorporated into future decision-making to enhance catchment management and mitigate the increasing trend of solute accumulation. Developing efficient strategies to prevent the escalation of enrichment export mechanisms are imperative.
The database used in this study can be requested by the State Environmental Agency of Baden Württemberg (LUBW), the State Environmental Agency of Bavaria (LfU Bayern), and the Ministry for Climate Protection, Environment, Energy and Mobility of Rhineland Palatinate (LfU RLP).
The supplement related to this article is available online at https://doi.org/10.5194/hess-30-2059-2026-supplement.
SF and TS conceptualized the study. Further, SF set up the database and did the data analysis. Both SF and TS contributed to the final version of the manuscript, while TS supervised the project.
The contact author has declared that neither of the authors has any competing interests.
Publisher's note: Copernicus Publications remains neutral with regard to jurisdictional claims made in the text, published maps, institutional affiliations, or any other geographical representation in this paper. The authors bear the ultimate responsibility for providing appropriate place names. Views expressed in the text are those of the authors and do not necessarily reflect the views of the publisher.
We acknowledge the help of the State Environmental Agency of Baden Württemberg (LUBW), the State Environmental Agency of Bavaria (LfU Bayern), the Ministry for Climate Protection, Environment, Energy and Mobility of Rhineland Palatinate (LfU RLP), the Geodatenzentrum des Bundesamtes für Karthographie und Geodäsie (BKG) and especially Michael Stölzle, for the provision of DGM-based catchment boundaries. We also thank the anonymous reviewers and the editor for their constructive comments, which helped to substantially improve the quality of this manuscript.
The publication was funded/supported by the Open Access Fund of Universität Trier.
This paper was edited by Genevieve Ali and reviewed by two anonymous referees.
Ainsworth, E. A. and Long S. P.: What have we learned from 15 years of free-air CO2 enrichment (FACE)? A meta-analytic review of the responses of photosynthesis, canopy properties and plant production to rising CO2, New Phytologist, 165, https://doi.org/10.1111/j.1469-8137.2004.01224.x, 2005.
Ali, G., Wilson, H., Elliott, J., Penner, A., Haque, A., Ross, C., and Rabie, M.: Phosphorus export dynamics and hydrobiogeochemical controls across gradients of scale, topography and human impact, Hydrol. Process., 2017, 1–16, https://doi.org/10.1002/hyp.11258, 2017.
Aubert, A. H., Gascuel-Odoux, C., Gruau, G., Akkal, N., Faucheux, M., Fauvel, Y., Grimaldi, C., Hamon, Y., Jaffrézic, A., Lecoz-Boutnik, M., Molénat, J., Petitjean, P., Ruiz, L., and Merot, P.: Solute transport dynamics in small, shallow groundwater-dominated agricultural catchments: insights from a high-frequency, multisolute 10 yr-long monitoring study, Hydrol. Earth Syst. Sci., 17, 1379–1391, https://doi.org/10.5194/hess-17-1379-2013, 2013.
Basu, N. B., Destouni, G., Jawitz, J. W., Thompson, S. E., Loukinova, N. V., Darraq, A., Zanardo, S., Yaeger, M., Sivapalan, M., Rinaldo, A., Rao, P., and Suresh, C.: Nutrient loads exported from managed catchments reveal emergent biogeochemical stationarity, Geophys. Res. Lett., 37, 23, https://doi.org/10.1029/2010GL045168, 2010.
Basu, N. B., Thompson, S. E., and Rao, P. S. C.: Hydrologic and biogeochemical functioning of intensively managed catchments: A synthesis of top-down analyses, Water Resour. Res., 47, 10, https://doi.org/10.1029/2011wr010800, 2011.
Bayrisches Landesamt für Umwelt (LfU Bayern): Gewässerkundlicher Dienst Bayern, https://www.gkd.bayern.de/de/ (last access: 5 October 2022), 2022.
Beck, H. E., Zimmermann, N. E., McVicar, T. R., Vergopolan, N., Berg, A., and Wood, E. F.: Present and future Köppen-Geiger climate classification maps at 1-km resolution, Sci. Data, 5, 180214, https://doi.org/10.1038/sdata.2018.214, 2018.
Bieroza, M. Z., Hallberg, L., Livsey, J., and Wynants, M.: Climate change accelerates water and biogeochemical cycles in temperate agricultural catchments, Sci. Total Environ., 951, 175365, https://doi.org/10.1016/j.scitotenv.2024.175365, 2024.
Birgand, F., Skaggs, R. W., Chescheir, G. M., and Gilliam, J. W.: Nitrogen removal in stream of agricultural catchments – a literature review, Crit. Rev. Env. Sci. Tec., 37, 5, https://doi.org/10.1080/10643380600966426, 2007.
Blüthgen, J. and Weischet, W.: Allgemeine Klimageographie. 3rd revised edition, edited by: Weischet, W., Walter de Gruyter, Berlin and New York, 1980.
Botter, M., Burlando, P., and Fatichi, S.: Anthropogenic and catchment characteristic signatures in the water quality of Swiss rivers: a quantitative assessment, Hydrol. Earth Syst. Sci., 23, 1885–1904, https://doi.org/10.5194/hess-23-1885-2019, 2019.
Botter, M., Li, L., Hartmann, J., Burlando, P., and Fatichi, S.: Depth of solute generation is a dominant control on concentration-discharge relations, Water Resour. Res., 56, https://doi.org/10.1029/2019WR026695, 2020.
Bundesanstalt für Geowissenschaften und Rohstoffe (BGR): Produktcenter – Geologie – Geologische Karte der Bundesrepublik Deutschland 1:1.000.000 (GK1000), https://produktcenter.bgr.de/terraCatalog/Start.do (last access: 5 January 2023), 2006.
Copernicus: Europe's eyes on Earth: CORINE Land Cover, https://land.copernicus.eu/pan-european/corine-land-cover, last access: 30 December 2022.
Copernicus: Europe's eyes on Earth: CORINE Land Cover, Dataset: CORINE Land Cover 2006 (vector/raster 100 m), Europe, 6-yearly, https://land.copernicus.eu/en/products/corine-land-cover, last access: 5 December 2025.
De Martonne, E.: Une nouvelle fonction climatologique: L'indice d'aridite, La Meteorol, 449–458, 1926.
Deutscher Wetterdienst (DWD): Klimadaten zum direkten Download, https://opendata.dwd.de/climate_environment/CDC/grids_germany/, last access: 12 June 2022.
Diamond, J. S. and Cohen, M. J.: Complex patterns of catchment solute-discharge relationships for coastal plain rivers, Hydrol. Process., 32, 3, https://doi.org/10.1002/hyp.11424, 2018.
Dupas, R., Jomaa, S., Musolff, A., Borchardt, D., and Rode, M.: Disentangling the influence of hydroclimatic patterns and agricultural management on river nitrate dynamics from sub-hourly to decadal time scales, Sci. Total Environ., 571, https://doi.org/10.1016/j.scitotenv.2016.07.053, 2016.
Dupas, R., Tittel, J., Jordan, P., Musolff, A., and Rode, M.: Non-domestic phosphorus release in rivers during low-flow: Mechanisms and implications for sources identification, J. Hydrol., 560, 141–149, https://doi.org/10.1016/j.jhydrol.2018.03.023, 2018.
Dupas, R., Lintern, A., Musolff, A., Winter, C., Fovet, O., and Durand, P.: Water quality response to hydrological droughts can be predicted from long-term concentration-discharge relationships, Environ. Res.: Water, 1, 015001, https://doi.org/10.1088/3033-4942/adb906, 2025.
Ebeling, P., Kumar, R., Weber, M., Knoll, L., Fleckenstein, J. H., and Musolff, A.: Archetypes and Controls of Riverine Nutrient Export Across German Catchments, Water Resour. Res., 57, https://doi.org/10.1029/2020WR028134, 2021.
Freeman, C., Evans, C. D., Monteith, D. T., Reynolds, B., and Fenner, N.: Export of organic 888 carbon from peat soils, Nature, 412, 785–785, https://doi.org/10.1038/35090628, 2001.
Geodatenzentrum des Bundesamtes für Karthographie und Geodäsie (BKG): INSPIRE Downloaddienst des Digitalen Geländemodell Gitterweite 200 m für das Gebiet der Bundesrepublik Deutschland, https://sgx.geodatenzentrum.de/wms_dgm200_inspire?SERVICE=WMS&REQUEST=GetCapabilities, last access: 5 January 2023.
Gomez, R., Arce, M. I., Sanchez, J. J., and del Mar Sanchez-Montoya, M.: The effects of drying on sediment nitrogen content in a Mediterranean intermittent stream: a microcosms study, Hydrobiologia, 679, 43–59, https://doi.org/10.1007/s10750-011-0854-6, 2011.
Greaver, T. L., Clark, C. M., Compton, J. E., Vallano, D., Talhelm, A. F., Weaver, C. P., Band, L. E., Baron, J. S., Davidson, E. A., Tague, C. L., Felker-Quinn, E., Lynch, J. A., Herrick, J. D., Liu, L., Goodale, C. L., Novak, K. J., and Haeuber, R. A.: Key ecological responses to nitrogen are altered by climate change, Nat. Clim. Change, 6, 9, https://doi.org/10.1038/nclimate3088, 2016.
Hellwig, J., Stahl, K., and Lange, J.: Patterns in the linkage of water quantity and quality during low-flows, Hydrol. Process., 2017, 1–11, https://doi.org/10.1002/hyp.11354, 2017.
Huntington, T. G. and Wieczorek, M. E.: An increase in the slope of the concentration-discharge relation for total organic carbon in major rivers in New England, 1973 to 2019, Sci. Total Environ., 778, 146149, https://doi.org/10.1016/j.scitotenv.2021.146149, 2021.
Jordan, T. E., Correll, D. L., and Weller, D. E.: Relating nutrient discharges from watersheds to land use and streamflow variability, Water Resour. Res., 33, 11, https://doi.org/10.1029/97WR02005, 1997.
Klimaveränderung und Wasserwirtschaft (KLIWA): Klimawandel in Süddeutschland – Veränderungen von meteorologischen und hydrologischen Kenngrößen – Klimamonitoring im Rahmen der Kooperation KLIWA, Monitoringbericht 2021, 2021.
Knapp, J. L. A., von Freyberg, J., Studer, B., Kiewiet, L., and Kirchner, J. W.: Concentration–discharge relationships vary among hydrological events, reflecting differences in event characteristics, Hydrol. Earth Syst. Sci., 24, 2561–2576, https://doi.org/10.5194/hess-24-2561-2020, 2020.
Kong, X., Ghaffar, S., Determann, M., Friese, K., Jomaa, S., Mi, C., Shatwell, T., Rinke, K., and Rode, M.: Reservoir water quality deterioration due to deforestation emphasizes the indirect effects of global change, Water Res., 221, https://doi.org/10.1016/j.watres.2022.118721, 2022.
Kukal, M. S. and Irmak, S.: U.S. Agro-Climate in 20th Century: Growing Degree Days, First and Last Frost, Growing Season Length, and Impacts on Crop Yields, Sci. Rep., 8, 1, https://doi.org/10.1038/s41598-018-25212-2, 2018.
Landesamt für Umwelt Baden-Württemberg (LUBW): Hochwasservorhersagezentrale Baden-Württemberg, https://www.hvz.baden-wuerttemberg.de/, last access: 7 October 2022.
Landesamt für Vermessung und Geobasisinformation Rheinland-Pfalz (GDI RP): Catchment shape and area for Rhineland Palatinate [closed source], https://www.geoportal.rlp.de/article/Impressum/ (last access: 5 May 2022), 2022.
Li, L., Stewart, B., Zhi, W., Sadayappan, K., Ramesh, S., Kerins, D., Sterle, G., Harpold, A., and Perdrial, J.: Climate Controls on River Chemistry, Earth's Future, 10, https://doi.org/10.1029/2021EF002603, 2022.
Li, W., Nguyen, T. V., Cheng, X., Zhu, D., and Kumar, R.: Toward representing the subsurface nitrate legacy through a coupled StorAge selection function and hydrological model (SWAT-SAS), J. Hydrol., 637, https://doi.org/10.1016/j.jhydrol.2024.131386, 2024.
Lucas, E., Kennedy, B., Roswall, T., Burgls, C., and Toor, G. S.: Climate Change Effects on Phosphorus Loss from Agricultural Land to Water: A Review, Current Pollution Reports, 9, 623–645, https://doi.org/10.1007/s40726-023-00282-7, 2023.
Martí, E. and Sabater, F.: High variability in temporal and spatial nutrient retention in Mediterranean streams, Ecology, 77, 3, https://doi.org/10.2307/2265506, 1996.
Meixner, T. and Fenn, M.: Biogeochemical budgets in a Mediterranean catchment with high rates of atmospheric N deposition – Importance of scale and temporal asynchrony, Biogeochemistry, 70, https://doi.org/10.1007/s10533-003-4106-3, 2004.
Minaudo, C., Dupas, R., Gascuel-Odoux, C., Roubeix, V., Danis, P.-A., and Moatar, F.: Seasonal and event-based concentration-discharge relationships to identify catchment controls on nutrient export regimes, Adv. Water Resour., 131, https://doi.org/10.1016/j.advwatres.2019.103379, 2019.
Landesamt für Umwelt Rheinland-Pfalz (LfU RLP): Analysen und Messwerte, https://wasserportal.rlp-umwelt.de/servlet/is/1500/, last access: 25 October 2022.
Moatar, F., Abbott, B. W., Minaudo, C., Curie, F., and Pinay, G.: Elemental properties, hydrology, and biology interact to shape concentration-discharge curves for carbon, nutrients, sediment, and major ions, Water Resour. Res., 53, 2, https://doi.org/10.1002/2016wr019635, 2017.
Moatar, F., Floury, M., Gold, A. J., Meybeck, M., Renard, B., Ferréol, M., Chandesris, A., Minaudo, C., Addy, K., Piffady, J., and Pinay, G.: Stream solutes and particulates export regimes: A new framework to optimize their monitoring, Front. Ecol. Evol., 7, https://doi.org/10.3389/fevo.2019.00516, 2020.
Musolff, A., Schmidt, C. S. B., and Fleckenstein, J. H.: Catchment controls on solute export, Adv. Water Resour., 86, https://doi.org/10.1016/j.advwatres.2015.09.026, 2015.
Musolff, A., Fleckenstein, J. H., Rao, P. S. C., and Jawitz, J. W.: Emergent archetype patterns of coupled hydrologic and biogeochemical responses in catchments, Geophys. Res. Lett., 44, 4143–4151, https://doi.org/10.1002/2017GL072630, 2017.
Outram, F. N., Cooper, R. J., Sünnenberg, G., Hiscock, K. M., and Lovett, A. A.: Antecedent conditions, hydrological connectivity and anthropogenic inputs: Factors affecting nitrate and phosphorus transfers to agricultural headwater streams, Sci. Total Environ., 545–546, 184–199, https://doi.org/10.1016/j.scitotenv.2015.12.025, 2016.
Payne, A. E., Demory, M.-E., Leung, L. R., Ramos, A. M., Shields, C. A., and Rutz, J. J.: Responses and impacts of atmospheric rivers to climate change, Nat. Rev. Earth Environ., 1, 143–157, https://doi.org/10.1038/s43017-020-0030-5, 2020.
Pohle, I., Baggaley, N., Palarea-Albaladejo, J., Stutter, M., and Glendell, M.: A Framework for Assessing Concentration-Discharge Catchment Behavior From Low-Frequency Water Quality Data, Water Resour. Res., 57, https://doi.org/10.1029/2021WR029692, 2021.
QGIS.org: QGIS Geographic Information System. QGIS Association, http://www.qgis.org, last access: 14 December 2022.
Radach, G., Berg, J., and Hagmeier, E.: Long-term changes of the annual cycles of meteorological, hydrographic, nutrient and phytoplankton time-series at Helgoland and at Lv Elbe 1 in the German Bight, Cont. Shelf Res., 10, 305–328, https://doi.org/10.1016/0278-4343(90)90054-P, 1990.
Rose, L. A., Karwan, D. L., and Godsey, S. E.: Concentration-discharge relationships describe solute and sediment mobilization, reaction, and transport at event and longer timescales, Hydrol. Process., 32, 18, https://doi.org/10.1002/hyp.13235, 2018.
Rstudio 4.2.0: The R Project for Statistical Computing, https://www.r-project.org/, last access: 6 May 2022.
Schuetz, T., Gascuel-Odoux, C., Durand, P., and Weiler, M.: Nitrate sinks and sources as controls of spatio-temporal water quality dynamics in an agricultural headwater catchment, Hydrol. Earth Syst. Sci., 20, 843–857, https://doi.org/10.5194/hess-20-843-2016, 2016.
Stewart, B. and Li, L.: Mechanisms underlying near-universal export patterns of dissolved carbon from land to rivers, Glob. Biogeochem. Cycles, 39, https://doi.org/10.1029/2024GB008361, 2025.
Smolders, E., Baetens, E., Verbeeck, M., Nawara, S., Diels, J., Verdievel, M., Peeters, B., De Cooman, W., and Baken, S.: Internal loading and redox cycling of sediment iron explain reactive phosphorus concentrations in lowland rivers, Environ. Sci. Technol., 51, 5, https://doi.org/10.1021/acs.est.6b04337, 2017.
Stölzle, M. and Stahl, K.: University of Freiburg – Chair of Environmental Hydrological Systems – Catchment areas of Bavaria and Baden-Wurttemberg [closed source] (last access: 19 January 2023), 2023.
Thompson, S. E., Basu, N. B., Lascurain, J., Aubeneau, A., and Rao, P. S. C.: Relative dominance of hydrologic versus biogeochemical factors on solute export across impact gradients, Water Resour. Res., 47, 10, https://doi.org/10.1029/2010wr009605, 2011.
van der Velde, de R. G. H., Rozemeijer, J. C., van Geer, F. C., and Broers, H. P.: Nitrate response of a lowland catchment: on the relation between stream concentration and travel time distribution dynamics, Water Resour. Res., 46, 11, https://doi.org/10.1029/2010wr009105, 2010.
Van Loon, A. F., Rangecroft, S., Coxon, G., Breña Naranjo, J. A., Van Ogtrop, F., and Van Lanen, H. A. J.: Using paired catchments to quantify the human influence on hydrological droughts, Hydrol. Earth Syst. Sci., 23, 1725–1739, https://doi.org/10.5194/hess-23-1725-2019, 2019.
Westphal, K., Graeber, D., Musolff, A., Fang, Y., Jawitz, J. W., and Borchardt, D.: Multi-decadal trajectories of phosphorus loading, export, and instream retention along a catchment gradient, Sci. Total Environ., 667, https://doi.org/10.1016/j.scitotenv.2019.02.428, 2019.
Winter, C., Lutz, S. R., Musolff, A., Kumar, R., Weber, M., and Fleckenstein, J. H.: Disentangling the impact of catchment heterogeneity on nitrate export dynamics from event to long-term time scales, Water Resour. Res., 57, https://doi.org/10.1029/2020WR027992, 2020.
Winter, C., Tarasova, L., Lutz, S. R., Musolff, A., Kumar, R., and Fleckenstein, J. H.: Explaining the Variability in High-Frequency Nitrate Export Patterns Using Long-Term Hydrological Event Classification, Water Resour. Res., 58, https://doi.org/10.1029/2021WR030938, 2022.
Winter, C., Nguyen, T. V., Musolff, A., Lutz, S. R., Rode, M., Kumar, R., and Fleckenstein, J. H.: Droughts can reduce the nitrogen retention capacity of catchments, Hydrol. Earth Syst. Sci., 27, 303–318, https://doi.org/10.5194/hess-27-303-2023, 2023.
Winter, C., Jawitz J. W., Ebeling, P., Cohen, M. J., and Musolff, A.: Divergence Between Long-Term and Event-Scale Nitrate Export Patterns, Geophys. Res. Lett., 51, https://doi.org/10.1029/2024GL108437, 2024.
Yang, J., Heidbüchel, I., Musolff, A., Reinstorf, F., and Fleckenstein, J. H.: Exploring the dynamics of transit times and subsurface mixing in a small agricultural catchment, Water Resour. Res., 54, https://doi.org/10.1002/2017WR021896, 2018.
Zhi, W. and Li, L.: The Shallow and Deep Hypothesis: Subsurface Vertical Chemical Contrasts Shape Nitrate Export Patterns from Different Land Uses, Environ. Sci. Technol., 54, 19, 11915–11928, https://doi.org/10.1021/acs.est.0c01340, 2020.