the Creative Commons Attribution 4.0 License.
the Creative Commons Attribution 4.0 License.
 | 15 Apr 2026
Effects of the Three Gorges Dam Operation on the hydrological interaction between the Yangtze River and downstream aquifers
Qi Zhu
Ye Kang
Hui Liu
Luguang Liu
Xu Li
Eungyu Park
The construction of the Three Gorges Dam (TGD) has profoundly altered the groundwater cycle downstream. The obscure spatiotemporal patterns of exchange fluxes between the Yangtze River and groundwater hinder the resolution of water resources and environmental issues in the watershed. This study investigated the spatial extent of the Yangtze River's influence on adjacent groundwater in the Four-Lake Basin, the first river-lake wetland plain downstream of the TGD, using multiple clusters of monitoring wells installed along the river. A coupled SWAT-MODFLOW model was applied to quantify period-specific surface water-groundwater exchanges. A counterfactual scenario without TGD operation, holding other conditions constant is also simulated for comparison. The results show: (1) Under the combined influence of hydrogeological conditions and distance from the TGD, the influence range of the Yangtze River on confined groundwater is significantly greater in the upper section than in the lower section of the Four-Lake Basin, with a difference of approximately one order of magnitude. (2) River and groundwater exchanges exhibit pronounced seasonal and spatial characteristics: river-to-aquifer recharge dominates during drawdown and flooding periods, while aquifer-to-river discharge dominates during impounding and dry periods. Additionally, the interaction rates between river and aquifer are consistently higher in the upper section than in the lower one. (3) Relative to natural conditions, TGD operation dramatically dampens Yangtze River-groundwater interactions overall. The effect is most pronounced during the dry period in the upper section, when the interaction rate decreases by 40.6 %. These research outcomes serve as a vital theoretical foundation for assessing the effects of the TGD's regulation on the hydrological interaction in the riparian zone of the Yangtze River.
- Article
(17375 KB) - Full-text XML
- BibTeX
- EndNote


High-dam reservoirs play a critical role in flood mitigation, hydroelectric power generation, water supply, and navigation (Poff et al., 1997). To date, approximately 50 % of rivers worldwide are regulated by dams (Van Cappellen and Maavara, 2016). The dam's impact on the riparian hydrology and biogeochemistry is so pronounced (Palmer and Ruhi, 2019; Song et al., 2020; Maavara et al., 2020) that it can even surpass the effects of hydrological extremes (Dewey et al., 2022). The Three Gorges Dam (TGD), a mega-engineering structure on the mainstream of the Yangtze River, functions as a primary flow regulation structure controlling discharge in the middle reaches. Operational strategies, including early-autumn water impoundment and winter–spring regulated discharge, have substantially altered the river's natural hydrological regime (Wang et al., 2016; Guo et al., 2022).
Centrally located in the Middle Yangtze Basin, the Four-Lake Basin is the first large river-lake wetland system downstream of the TGD. It supports an integrated ecosystem of rivers, lakes, reservoirs, and farmlands (Zhang et al., 2023) and plays a vital role in flood regulation, ecological stabilization, and sustaining agricultural economies (Zhou et al., 2013). However, since the TGD became operational, nitrogen and phosphorus pollution in the water bodies of the middle Yangtze River basin, particularly in areas such as the Four-Lake Basin, has intensified (Gao et al., 2021; Hu et al., 2023a; Zhou et al., 2023). While extensive research has documented the impacts of the TGD on the regional water cycle (e.g., Deng et al., 2016; Xiong et al., 2020; Wu et al., 2023), the precise quantification of how TGD-induced river stage fluctuations affect groundwater levels and river-aquifer exchange fluxes, particularly at the basin scale, remains a critical and ongoing challenge.
Unlike surface-water-dominated systems, many lakes, rivers, and agricultural wetlands in the Four-Lake Basin interact with the Yangtze mainly through subsurface groundwater exchange (Deng et al., 2016). Yet the extent of the Yangtze's influence, which is a key driver of regional hydrological and ecological processes (Hu et al., 2023b; Lai et al., 2025), remains poorly quantified, hindering a clear understanding of groundwater cycling and its ecological consequences. Moreover, TGD operations have introduced significant spatiotemporal variations in water levels along the Yangtze mainstream. Combined with the high spatial heterogeneity of hydrogeological conditions in the riparian zone, these changes complicate efforts to characterize river-groundwater interactions. Although prior research has illuminated local-scale exchange processes (Wang and Wörman, 2019; Huang et al., 2023), such insights are insufficient for assessing basin-wide impacts, underscoring the need for broader monitoring and systematic investigation.
Since the TGD's completion, its effects on various downstream ecological components, such as lake levels (Huang et al., 2021), wetland evolution (Zhang et al., 2012), sediment transport (Yang et al., 2007), channel morphology (Sun et al., 2012; Yang et al., 2014), and eco-hydrological conditions affecting vegetation (Xie et al., 2014), have attracted considerable research attention. Nevertheless, the dam's impacts on groundwater systems remains inadequately understood, especially in terms of quantitative attribution isolated from other influencing factors. In the Four-Lake Basin, the presence of an intricate flood-control network further complicates the study of water interactions (World Bank, 2023).
While previous quantitative studies have examined hyporheic exchange in the Jianghan Plain (Du et al., 2018; Jiang et al., 2022), they do not fully account for the compounded effects of hydroclimate, TGD operations, spatial heterogeneity in hydrogeological conditions, and local flood-control and irrigation infrastructure on Yangtze-groundwater interactions in the Four-Lake Basin. To be more precise, in addition to being influenced by the Yangtze River, groundwater levels along the river are often affected by factors such as runoff generation and concentration, surface soil water infiltration, and recharge from the local surface water network. These factors make traditional groundwater numerical modeling approaches struggle to accurately capture fluctuations in the groundwater table, thereby introducing significant errors in characterizing the exchange processes between the Yangtze River and groundwater.
To address these complexities, the SWAT-MODFLOW model offers a robust physically-based framework. This coupled model has been extensively utilized worldwide to simulate complex regional surface water-groundwater (SW-GW) interactions, such as evaluating the effects of agricultural irrigation in the United States (Aliyari et al., 2019), assessing how climate and land-use changes impact groundwater quality in European river basins (Pulido-Velazquez et al., 2015), and analyzing nutrient transport in large river basins in China (Yang et al., 2024). Obviously, for the Sihu Basin which is distributed with numerous wetlands and water bodies such as rivers, lakes, and paddy fields along the Yangtze River, SWAT-MODFLOW demonstrates high feasibility in characterizing how the groundwater flow system within its complex Quaternary sedimentary formations is influenced by surface terminal water bodies under the regulation of the Three Gorges Reservoir.
Aiming to bridge these gaps, this study focuses on the interplay between the Yangtze River and groundwater in the Four-Lake Basin. Data from seven monitoring profiles will be used to identify the spatial influence of the Yangtze River on aquifer dynamics. Based on this influence range, the impact of surface water bodies on groundwater is clearly defined, thereby guiding the development of a field-calibrated SWAT-MODFLOW model to analyze the effects of TGD operations on SW-GW interactions. Ultimately, by constructing a counterfactual scenario without the dam, we aim to isolate and quantify the specific impact of the TGD, providing a quantitative assessment of its influence.
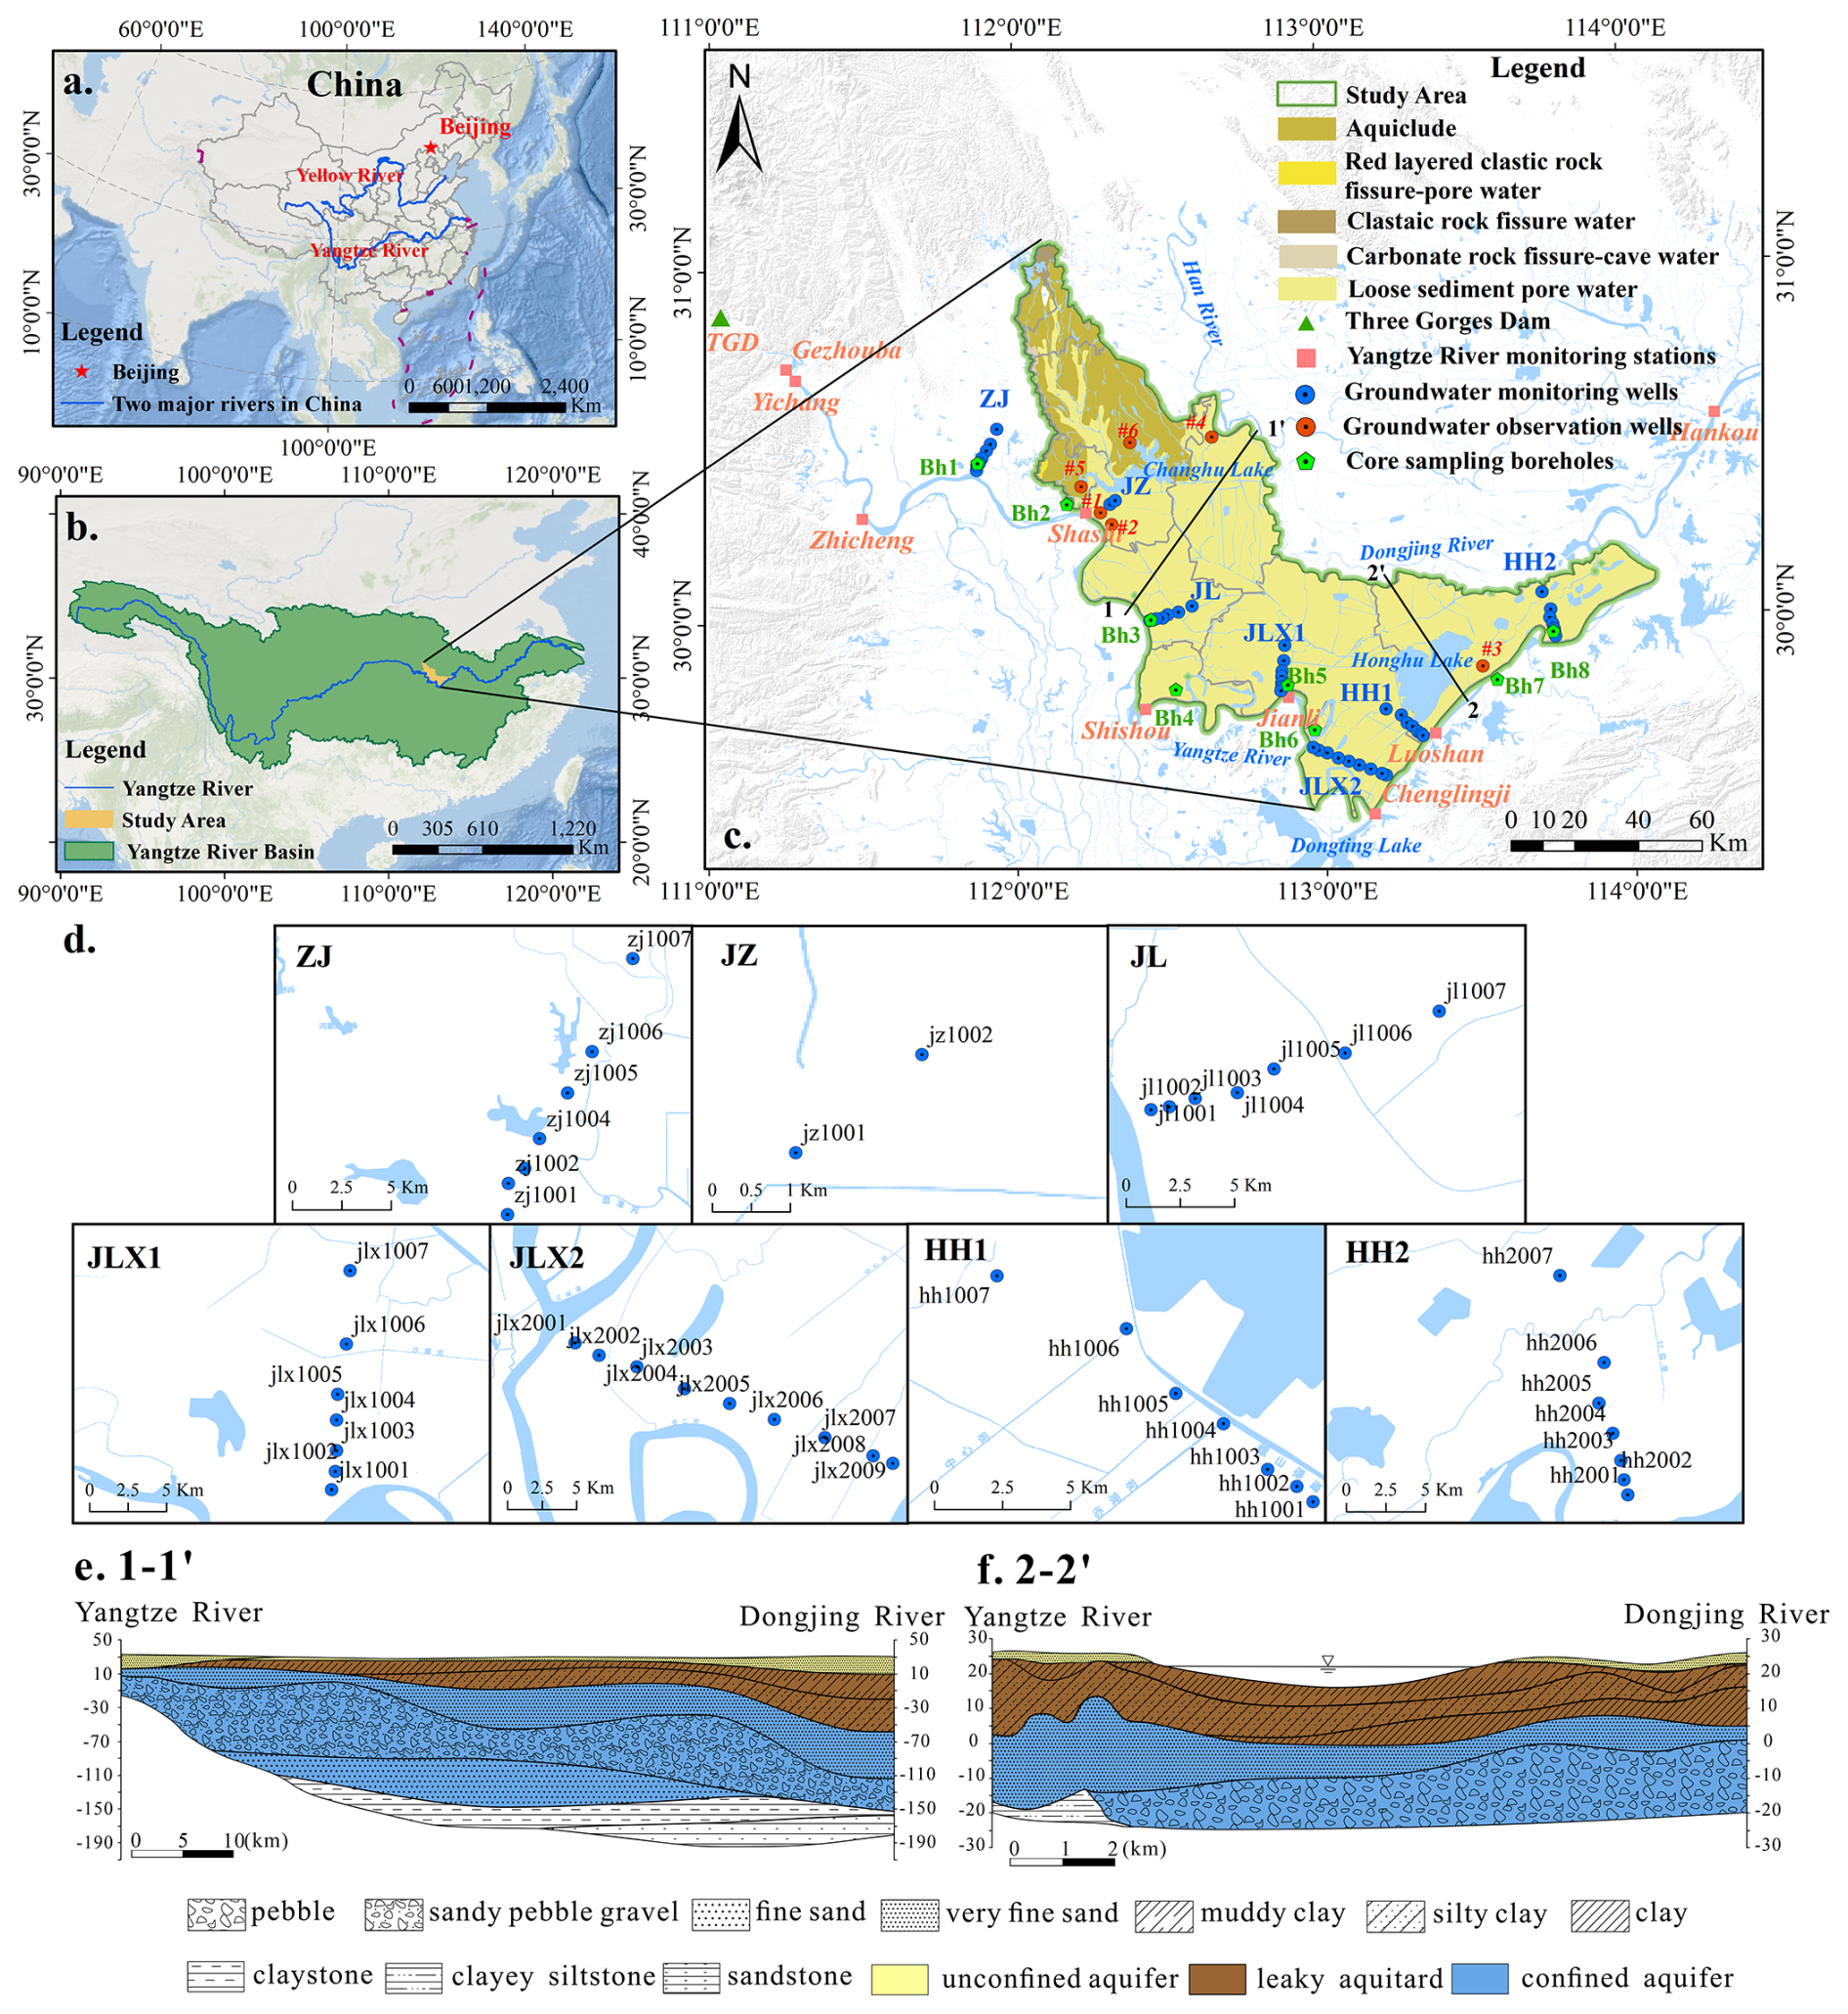
Figure 1Map of the study area and monitoring network in the Four-Lake Basin, showing (a) the regional context of the Yangtze River (adapted from the base map in Esri, 2023), (b) the basin location (adapted from the base map in Esri | Powered by Esri), (c) surface water and groundwater monitoring stations in the map indicating different types of groundwater, which is entirely compiled according to the internal survey data from the author's institution, (d) groundwater monitoring wells installed along each profile, (e) Stratigraphic profile 1-1′ near Jiangling (JL) Profile, and (f) Stratigraphic profile 2-2′ near Honghu (HH) Profile.
Situated downstream of the TGD on the middle Yangtze's northern bank, the Four-Lake Basin covers an area of about 11 547 km2 (Fig. 1). Its boundaries are formed by a combination of natural and artificial features. To the northwest lie the hills of Jingmen and Jiangling counties along with the Zhang River irrigation district; to the north is the watershed of the Han River Basin; and to the east and south, it is bordered by the Yangtze River. The basin's climate is characterized by a mean annual temperature of ∼15–17 °C, with annual precipitation and evaporation averaging 1269 and 1200 mm, respectively. Located in a flat alluvial plain with an average elevation of 27 m. the Four-Lake Basin features a dense network of interconnected lakes, rivers, and canals, among which Honghu and Changhu Lakes are the most prominent. The Four-Lake Main Channel, as the primary artery of the basin, connects these major lakes and their tributaries, ultimately discharging into the Yangtze River. Groundwater mainly receives combined recharge from precipitation and surface water. Only in a small portion of the northwestern upland areas does groundwater recharge occur predominantly from precipitation, followed by discharge toward the surrounding low-lying plains (Lan et al., 2025; Li et al., 2023). The groundwater table is generally shallow, typically lying ∼2–5 m below the surface, which facilitates widespread groundwater utilization.
The study area features a groundwater system composed of an unconfined aquifer and multiple confined aquifers. The unconfined aquifer, primarily distributed across the flat central and eastern basin, consists of silty clay, silt, and fine sand, with localized thin gravel layers. Its thickness typically ranges from 3 to 10 m. The upper confined aquifer, which is the most extensive in the region, is composed of clay, silty clay, muddy silty clay, sand, and gravel. Its thickness exhibits considerable spatial variation, generally increasing from the western and peripheral zones toward the central and eastern parts of the basin. In contrast, the lower confined aquifer is predominantly composed of gravel (Huang et al., 2023). Figure 1e and f illustrate the geological cross-sections for profiles 1-1′ and 2-2′ (locations indicated in Fig. 1c), respectively. From the upstream to the downstream of the basin, the thickness of the clay confining layer increases significantly, while the lithology of the underlying aquifer transitions from highly permeable gravel and pebbles to lower-permeability fine sand.
3.1 Data Sources
We established a network of groundwater monitoring profiles along the northern bank of the Yangtze River within the Four-Lake Basin, comprising seven distinct profiles-Zhijiang (ZJ), Jingzhou (JZ), Jiangling (JL), Jianli1 (JLX1), Jianli2 (JLX2), Honghu1 (HH1), and Honghu2 (HH2)-with a total of 46 monitoring wells (Fig. 1). Within each profile, wells were systematically positioned at distances of 1, 2, 3, 5, 7, 10, 15, 20, and 25 km from the landside toe of the Yangtze River embankment. Groundwater levels were monitored from 1 January to 31 December 2021, at regular 5 d intervals. The year 2021 was chosen for investigation due to the availability of a comprehensive dataset from 46 monitoring wells. These wells, arranged in systematic profiles, provide high spatial density for analyzing lateral water signal propagation. Additionally, the 5 d monitoring interval is sufficient to capture the seasonal and operational fluctuations induced by the TGD.
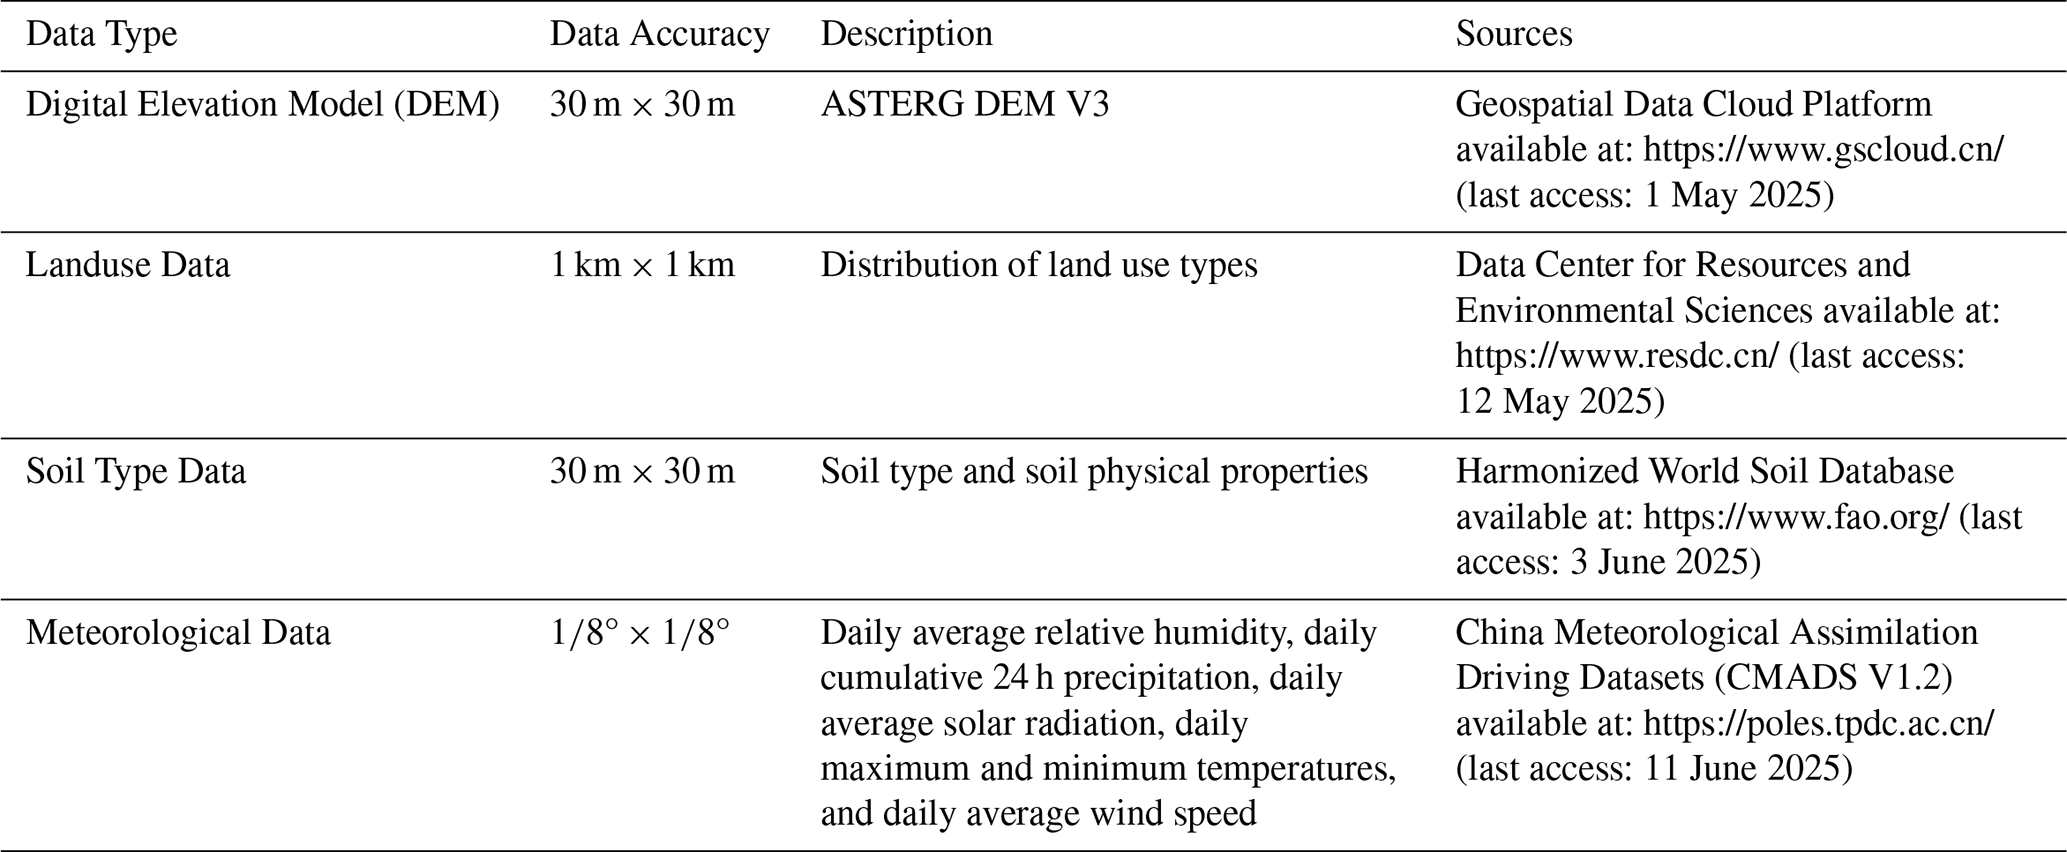
The SWAT model primarily required two types of data: spatial data (including elevation, land use, and soil type data) and meteorological data, with the specific data formats and sources listed in Table 1. The MODFLOW model necessitated hydrogeological parameters, recharge and discharge components, and calibration data derived from long-term groundwater level observations.
The calibration of the MODFLOW model utilized groundwater level data (2011–2013) obtained from a hydrogeological field investigation conducted in the Jianghan Plain during this period (Wen et al., 2017), nearly a decade after the impoundment of the TGD. To maintain consistency, the same timeframe was adopted for the surface hydrological modeling data in SWAT to facilitate the model's validation.
3.2 Research Methods
3.2.1 Spatial response analysis of water-level
Given that the unconfined aquifer along the Yangtze River is subject to multiple factors, including river stage, precipitation, surface water bodies, and human activities, the water level exhibits frequent fluctuations. This study, therefore, focuses on quantifying the lateral influence of the river on the more stable confined aquifer along its north bank. To this end, water-level data from the confined aquifer were collected through monitoring profiles to investigate the fluctuation patterns of both the river stage and the confined groundwater, as well as the spatial extent of the river's influence. The analytical procedure is detailed below:
-
Data collection and analysis. The river stages and corresponding groundwater levels from the seven monitoring profiles (ZJ, JJ, JL, JLX1, JLX2, HH1, and HH2) with complete 2021 datasets were selected for analysis (Fig. 1). For each month, the daily maximum water level of the Yangtze River was identified, and the corresponding groundwater levels in monitoring wells at various distances were recorded simultaneously. The differences between the maximum water levels of the Yangtze River and groundwater in consecutive months were calculated to derive the fluctuation amplitudes of both at a monthly interval. As shown in the subplot of the ZJ profile in Fig. A1 in the Appendix A, the legend “1/9–2/17” indicates that 9 January and 17 February represent the days when the peak water levels of the Yangtze River occurred in their respective months. The difference in water levels between these 2 d forms the black polyline in the figure. It is important to note that the monthly maximum water level of the Yangtze River was selected because the peak value is the most prominent and objectively identifiable feature, avoiding subjectivity in selecting dates during periods of mild fluctuation. Moreover, the high water level exerts the strongest driving force on the adjacent groundwater, theoretically maximizing the reflection of groundwater response to changes in the Yangtze River water level.
-
Construction and fitting of water-level spatial response equations. A critical step in this analysis was to develop empirical equations that quantify the response of groundwater levels to fluctuations in the Yangtze River stage at different distances from the river. Unlike previous studies, such as Wang and Wörman (2019), which focused mainly on temporal variations in groundwater, the present study employs the analytical solution proposed by Liu et al. (2021) to demonstrate the exponential attenuation of groundwater response amplitudes with distance from the riverbank under sinusoidal river-stage variations, which can be expressed as:
where y represents the variation amplitude of the groundwater level [m]; x represents the distance from the monitoring point to the riverbank [m]; a represents the change of the Yangtze River water level within a specific period [m]; b represents the attenuation coefficient []. For each monitoring profile shown in Fig. A1, eleven polylines derived from the monthly water level differences are generated. Then those polylines exhibiting abnormal patterns due to measurement errors or localized hydrological influences are excluded. For each remaining polyline, Eq. (1) is applied for fitting to inversely estimate the corresponding a and b values. The multiple b values from each profile are then averaged to obtain , which is a new profile-specific attenuation coefficient for Eq. (1).
-
Delineation of lateral influence extent. In hydrogeological practice, the intensity of river influence on lateral groundwater dynamics is commonly characterized by a dimensionless parameter R. Here, R is defined as the ratio of the groundwater level fluctuation amplitude to the simultaneous river stage fluctuation amplitude. It signifies the strength of the groundwater response to river fluctuations.
Therefore, by reformulating Eq. (1) and substituting the value of obtained from Step (2), the formula for calculating the R value for each monitoring profile can be expressed as
According to established criteria (He and Cai, 1999), when R<0.02, i.e., when the groundwater fluctuation falls below 2 % of the corresponding river stage fluctuation, the river is considered to have no significant influence on the groundwater. Thus, the distance from the riverbank corresponding to R=0.02 was taken as the maximum lateral influence extent of the Yangtze River on the confined aquifer. Therefore, with the value of obtained in Step (2), the value of x, which indicates the lateral influence range of the Yangtze River on groundwater, can be determined inversely by assigning a value to R.
3.2.2 SWAT-MODFLOW coupling model for the Four-Lake Basin
After delineating the spatial response range through the data-driven approach, one can clearly identify which surface water bodies, besides the Yangtze River, significantly affect groundwater along the river, justifying the necessity of considering them in a SW-GW interaction framework. The SWAT model for the Four-Lake Basin was developed in ArcSWAT, with all data sources detailed in Table 1. The modeling framework began with watershed delineation, dividing the basin into 35 subbasins based on Digital Elevation Model (DEM) data and the river network. Hydrologic Response Units (HRUs) were generated by overlaying land use classification, soil types, and slope categories, ultimately producing 428 HRUs as illustrated in Fig. 2. Meteorological data was extracted from the CAMADS v1.2 dataset at 288 monitoring stations within and around the basin (Fig. 2f). The simulation spanned a three-year warm-up period (2008–2010), followed by calibration (2011–2014) and validation (2015–2016) phases, all performed at a monthly temporal resolution.
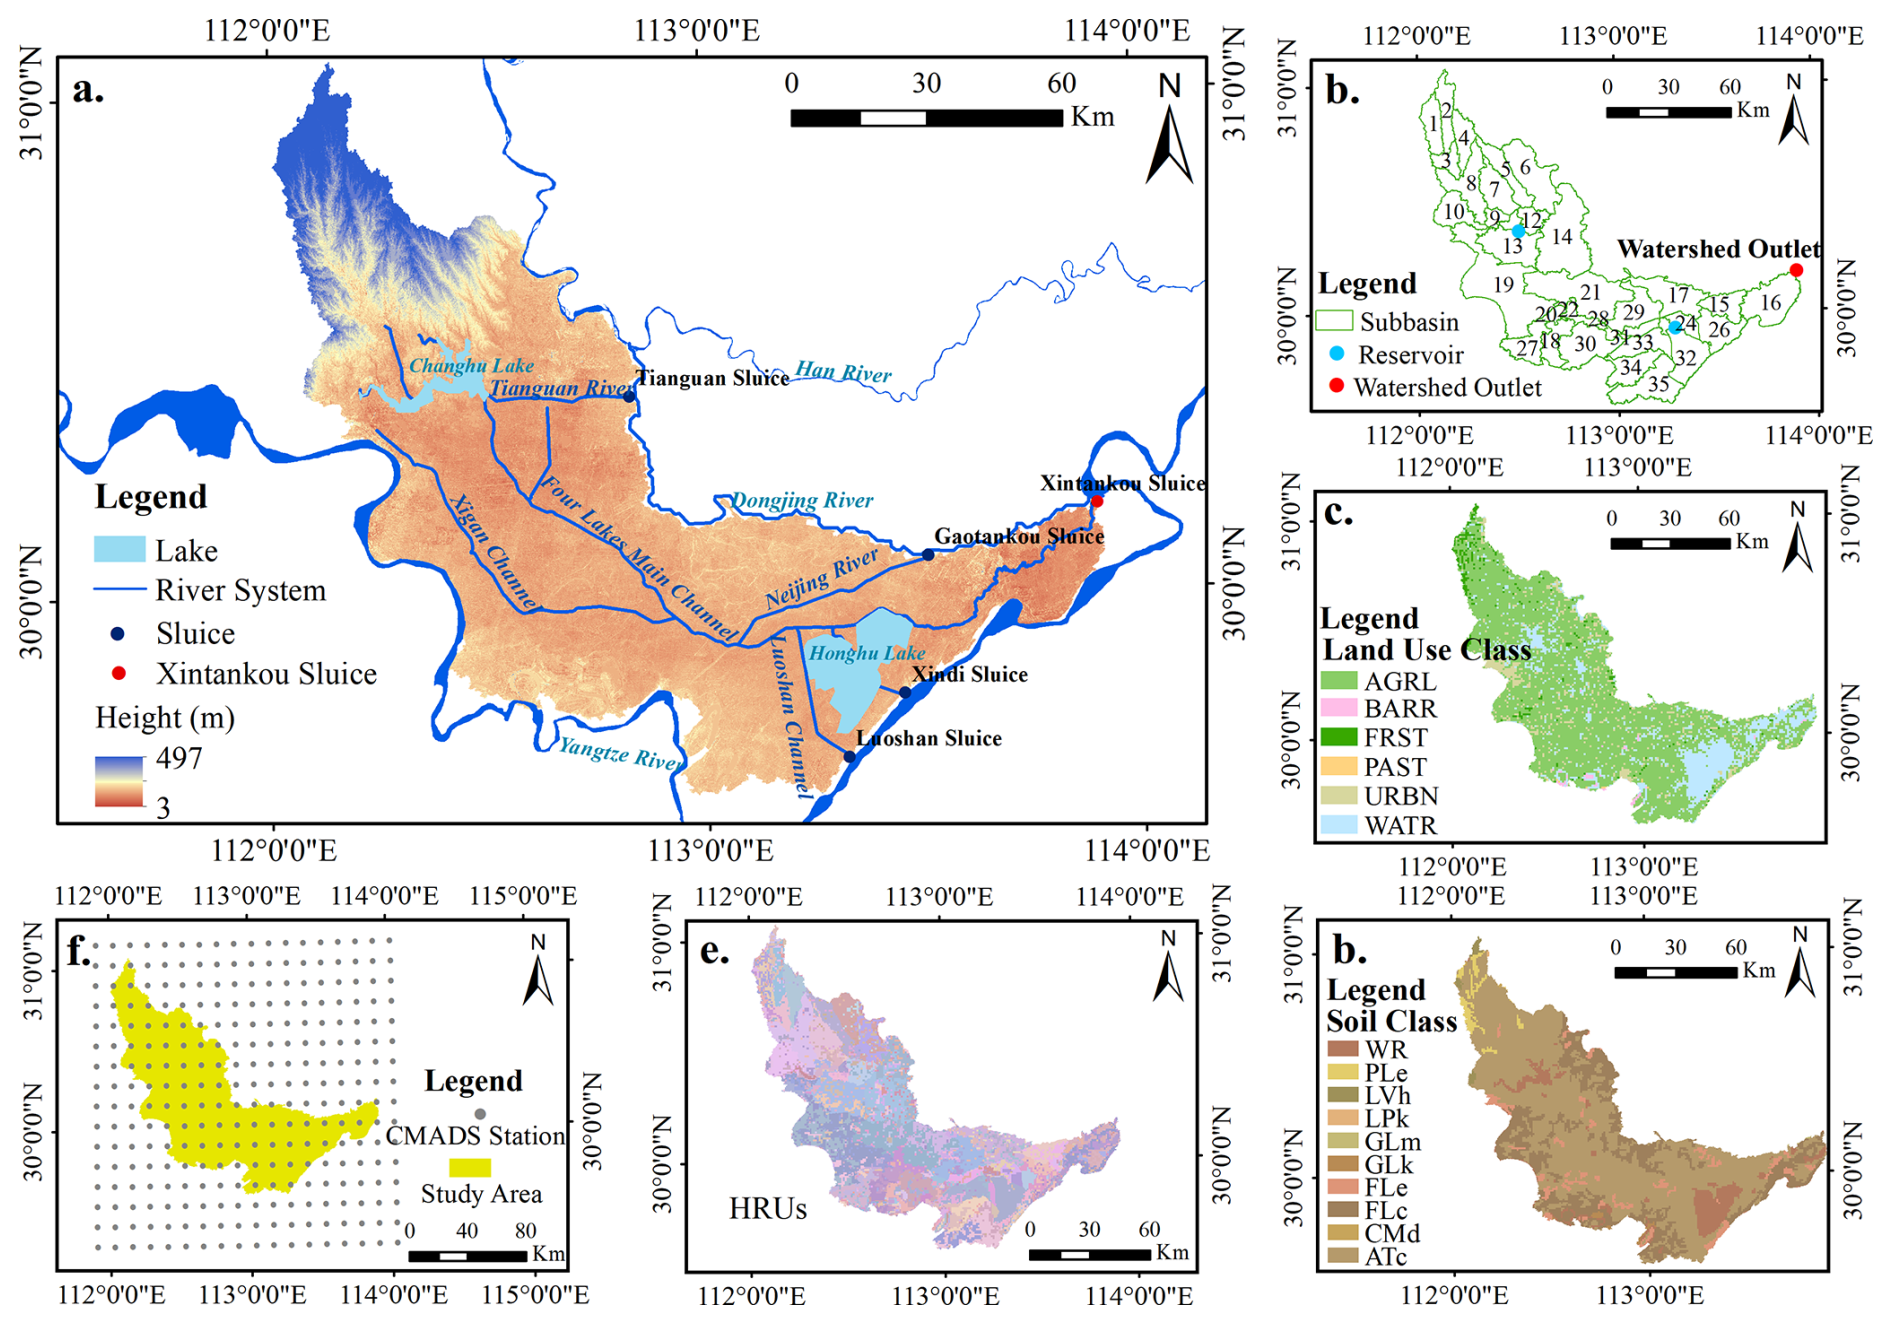
Figure 2The information of all the basic elements required for constructing the SWAT model: (a) Four-Lake Basin elevations, major water systems, and major sluices. (b) SWAT Model subbasins and watershed outlets. (c) Land use classification. (d) Soil classification. (e) SWAT Model HRUs. (f) CMADS V1.2 stations.
A groundwater numerical simulation using the finite difference method was performed with Visual MODFLOW Flex 9.0. Based on regional hydrogeological conditions and borehole lithological data, a heterogeneous, anisotropic, and transient groundwater flow model for the Four-Lake Basin was generalized into three layers: an unconfined aquifer, an aquitard, and a confined aquifer. The model was discretized horizontally into 1 km × 1 km grids and vertically into three layers based on hydrogeological stratification, resulting in 33 450 active cells. Hydrogeological parameter zones, values, and boundary conditions are detailed in Fig. A2 and Table A1 in the Appendix A.
The SWAT-MODFLOW coupled model was developed by establishing a one-way correspondence between SWAT Hydrologic Response Units (HRUs) and MODFLOW grid cells, in which SWAT provides spatially distributed groundwater recharge to MODFLOW, while groundwater feedback to SWAT is not explicitly simulated. This is reasonable because this study aims to investigate the interaction rate between Yangte River and groundwater instead of delineating the hydrodynamics of surface water; additionally, under the intensive regulation of artificial drainage and irrigation pumping stations in the Four-Lake Basin, the effect of surface water recharge on groundwater is substantially greater than the influence of groundwater discharge on surface water. The calibrated SWAT model provided monthly groundwater recharge (GW_RCHG) and actual evapotranspiration data, which were then assigned to the corresponding MODFLOW cells. These outputs were directly used as inputs for the Recharge (RCH) and Evapotranspiration (EVT) packages in MODFLOW, thereby driving the groundwater flow simulation.
4.1 The influence range of the Yangtze River on lateral groundwater
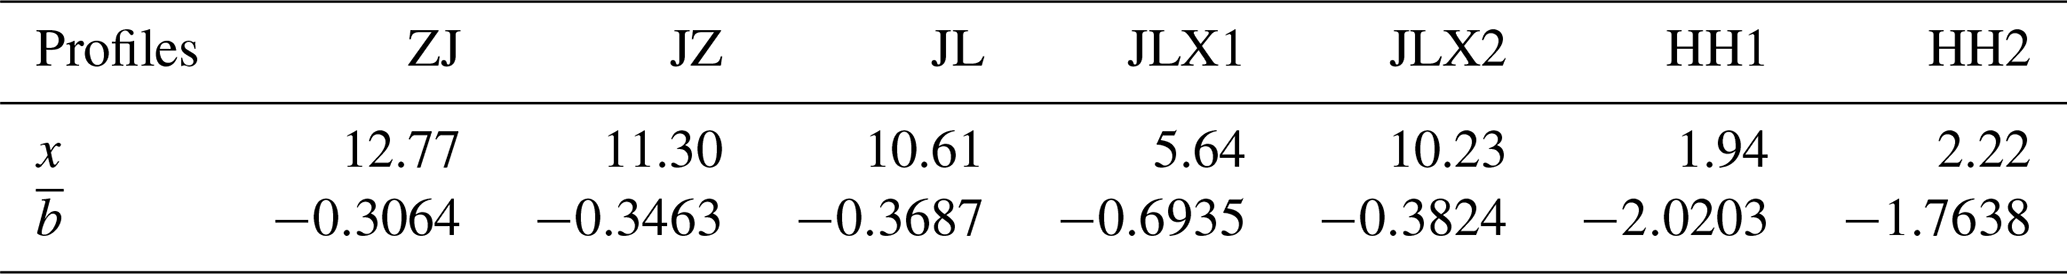
The response of confined groundwater levels to fluctuations in the Yangtze River stage was evaluated across seven monitoring profiles (ZJ, JZ, JL, JLX1, JLX2, HH1, and HH2) at increasing distances (x) from the river. As illustrated in Fig. A1, the sensitivity of groundwater levels to river stage diminishes with distance. One notable deviation is observed along the ZJ profile, where anomalously large groundwater fluctuations occur ∼5–10 km from the riverbank, possibly due to local hydrogeological heterogeneity or anthropogenic influences. The amplitude-distance relationships for both the Yangtze River and groundwater levels, fitted using Eq. (1) across all seven monitoring profiles, are shown in Fig. A3 in the Appendix A. For clarity, results from a representative period of the year are displayed. All fitted curves demonstrate a high goodness-of-fit (R2>0.9), indicating highly reliable correlations. Based on these relationships, the range of estimated b values and the corresponding fitting equations for each profile were calculated, as summarized in Table 2.
Table 2The range of estimated values of b and corresponding fitting equations for each profile.
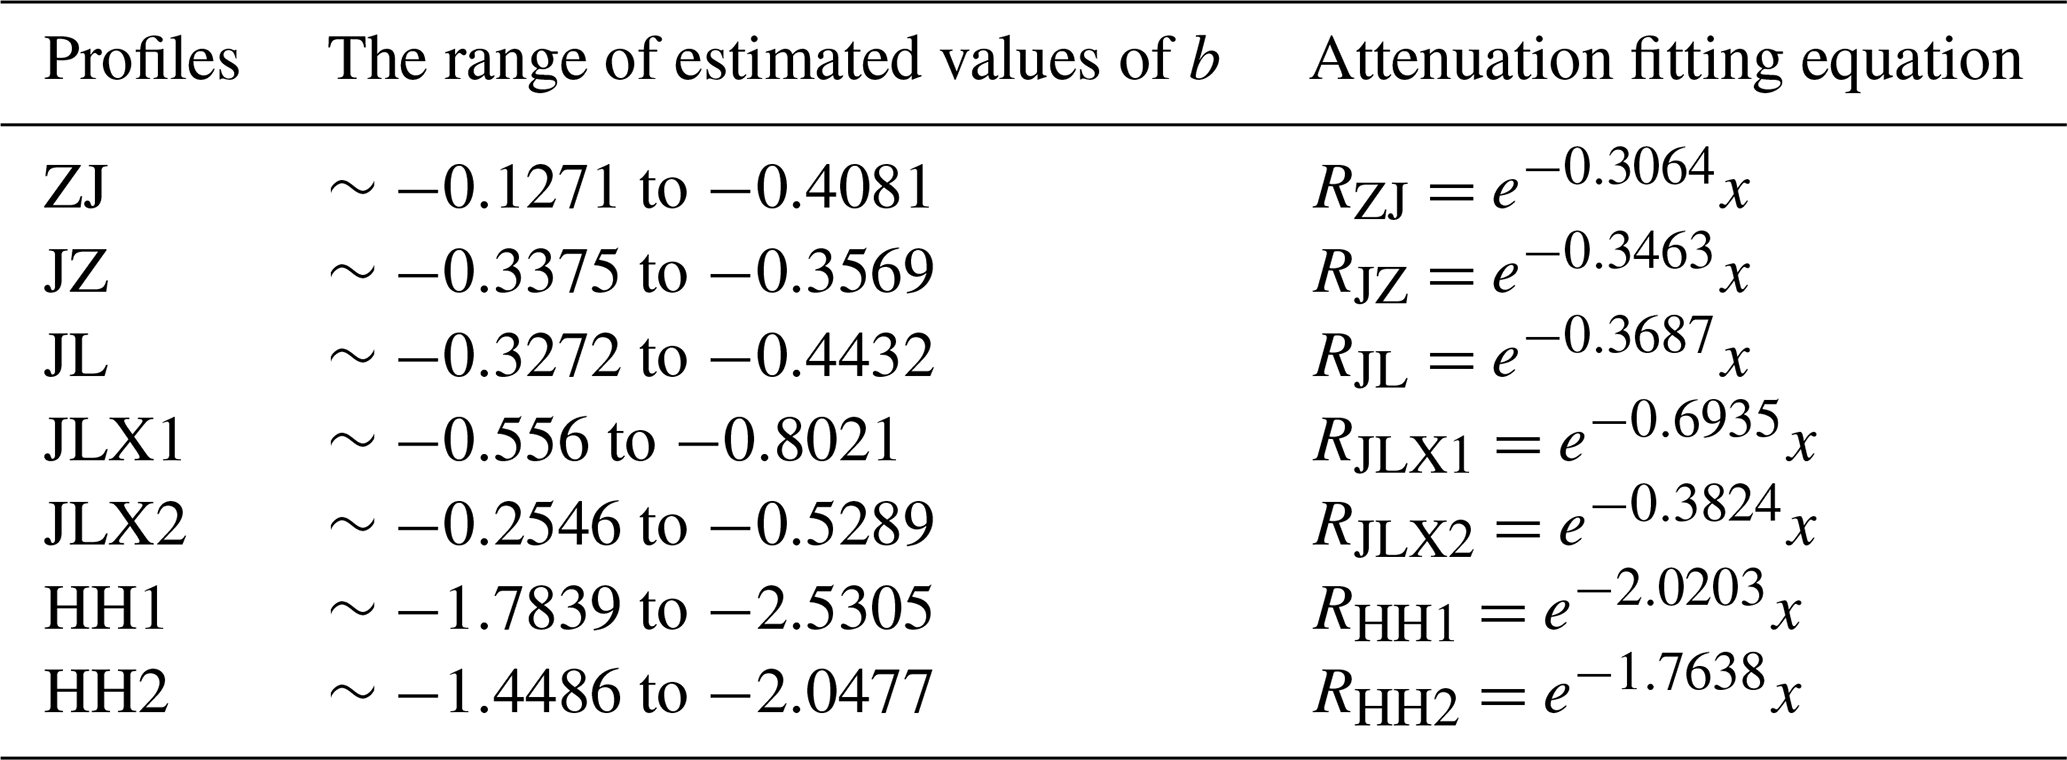
To quantify the intensity and maximum lateral extent of the Yangtze River's influence on the adjacent confined aquifer, the criterion defined in step (3) was applied. According to this criterion, the distance x corresponding to a relative groundwater fluctuation (R) of 0.02 represents the maximum influence distance. Table 3 presents the calculated maximum influence distances and the mean attenuation coefficients () for each monitoring profile. At the same time, Fig. 3 visually depicts the influence distances across a range of R values, including this maximum extent.
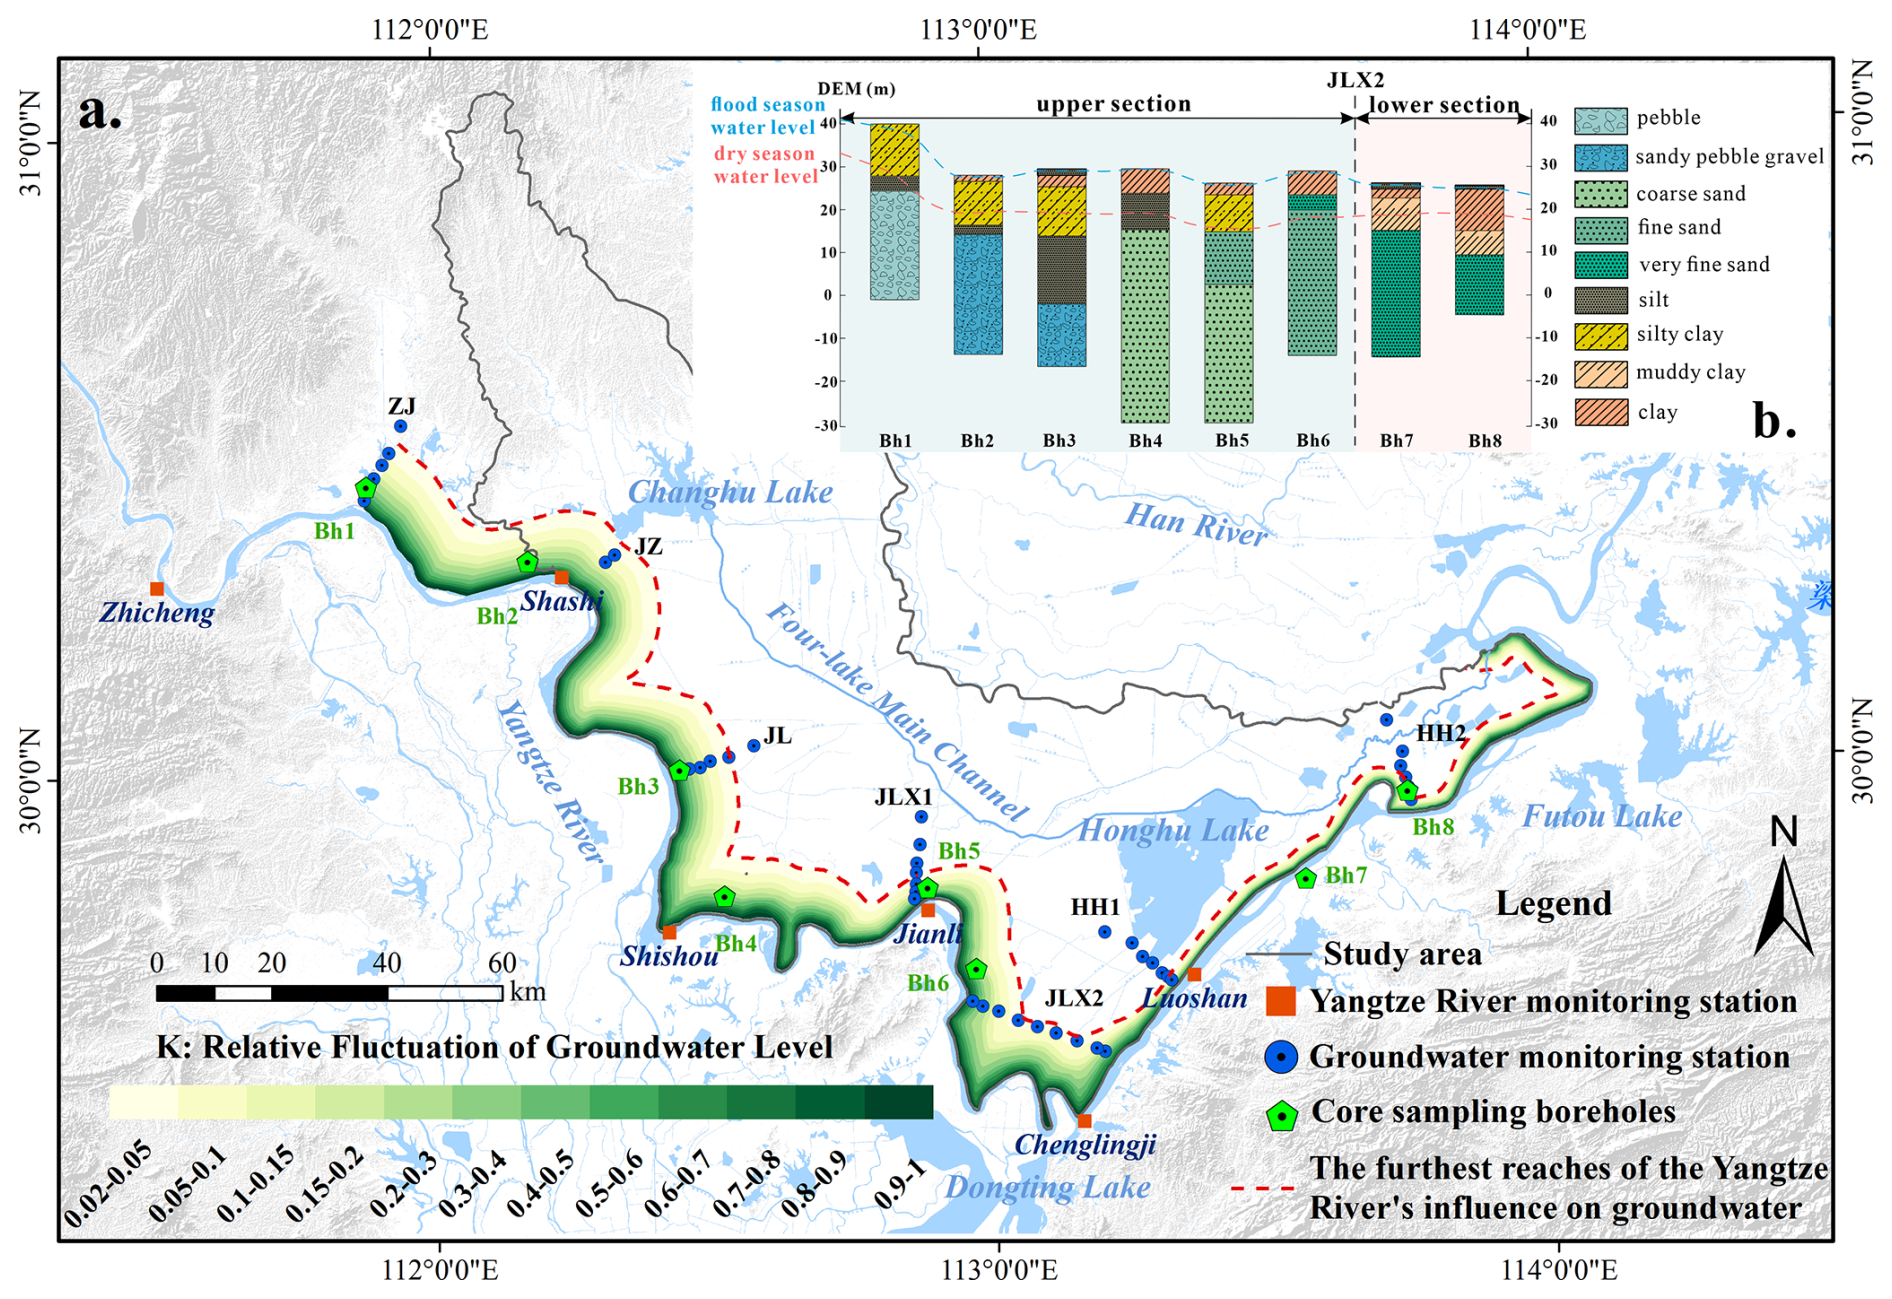
Figure 3Figure representing the effects of geological conditions on the lateral influences of Yangtze River on groundwater: (a) Different degrees and ranges of influence of the Yangtze River on the lateral confined groundwater in the Four-Lake Basin. (b) Lithologic logs of boreholes along the Yangtze River in the Four-Lake Basin.
Table 3Distance x from the riverbank corresponding to R=0.02 and average attenuation coefficient for each profile.
As summarized in Table 3 and Fig. 3, the influences of the Yangtze River on the confined groundwater in the Four-Lake Basin exhibits distinct spatial zoning, with JLX2 acting as a critical boundary. Consequently, the study area is divided into two independent segments, i.e., the ZJ-JLX2 reach and the JLX2-HH2 reach, which can be characterized by three key features:
Extended influence range: The ZJ-JLX2 segment shows a smaller attenuation coefficient () and a maximum influence distance of 12.77 km (Table 3), indicating more efficient pressure transmission through the aquifer system than in the JLX2-HH2 reach downstream.
Hydraulic head differences primarily drive groundwater response: Due to its proximity to the TGD, the ZJ-JLX2 segment experiences amplified river-stage fluctuations that propagate over long distances. In contrast, the JLX2-HH2 segment lies downstream of the Yangtze River after regulation by Dongting Lake, where river stage variations are markedly dampened, leading to a shorter propagation distance of hydraulic signals. Note that the Yangtze River's lateral influence range at the JLX1 profile is only 5.64 km, which differs significantly from other cross-sections within the reach. This is because the JLX1 profile is located precisely at the point where the Yangtze River channel bends inward toward the interior of the Four-Lake Basin. The proximity to both the internal water system of the basin and the densely populated area of Jianli City results in a significantly weak response of the JLX1 profile to water level fluctuations in the Yangtze River.
Favorable hydrogeological conditions: The JL profile, representative of the ZJ-JLX2 segment, consists of highly permeable gravel-cobble formations (Fig. 1e), which minimize hydraulic head loss and support long-distance transmission of river-induced fluctuations. Although the 2021 Yangtze River Sediment Bulletin indicates that the river incises into the confined aquifer in the JLX2-HH2 segment, Fig. 1f shows that near the profiles HH1 and HH2, the aquifer materials are dominated by fine sands. The resulting lower permeability and higher flow resistance cause rapid attenuation of head fluctuations, thus restricting the lateral extent of the river's influence.
Furthermore, the proximity of Honghu Lake to the HH1 and HH2 segment warrants consideration. Although not in direct hydraulic contact with the confined aquifer, this extensive shallow lake interacts dynamically with the overlying phreatic aquifer. As shown in Fig. 1f, the shallow aquitard in the vicinity of Honghu Lake exhibits significant spatiotemporal heterogeneity in thickness, facilitating localized hydraulic connectivity between the unconfined and confined aquifer systems. Under these conditions, Honghu Lake acts as a hydrological buffer; that is, its relatively stable water levels attenuate the transmission of Yangtze River stage fluctuations to adjacent groundwater systems. In addition, we generated the results shown in Fig. 3 for the period from 2022 to 2024, and compared the lateral influence range of the Yangtze River on coastal groundwater for each year from 2021 to 2024 (as shown in Fig. A4). The results indicate that this lateral influence range has not changed significantly in recent years, which may be attributed to the fact that annual precipitation in this region has remained consistently between 1000 and 1200 mm.
Based on the analysis of data-driven, the high goodness-of-fit (R2>0.9) across all profiles suggests a stable groundwater response to Yangtze River stage fluctuations. Moreover, the derived spatial variation in attenuation coefficients and influence distances is consistent with observed along-river differences in hydrogeological conditions, providing confidence in the robustness of this approach. These results also serve as an independent reference for interpreting the spatial patterns simulated by the coupled SWAT-MODFLOW model in later sections. It is also worth noting that since the establishment of the riparian monitoring network, annual precipitation in the study area has shown limited variability. As a result, findings from years other than 2021 do not differ substantially from those of 2021, which justifies its selection as a representative year in this study.
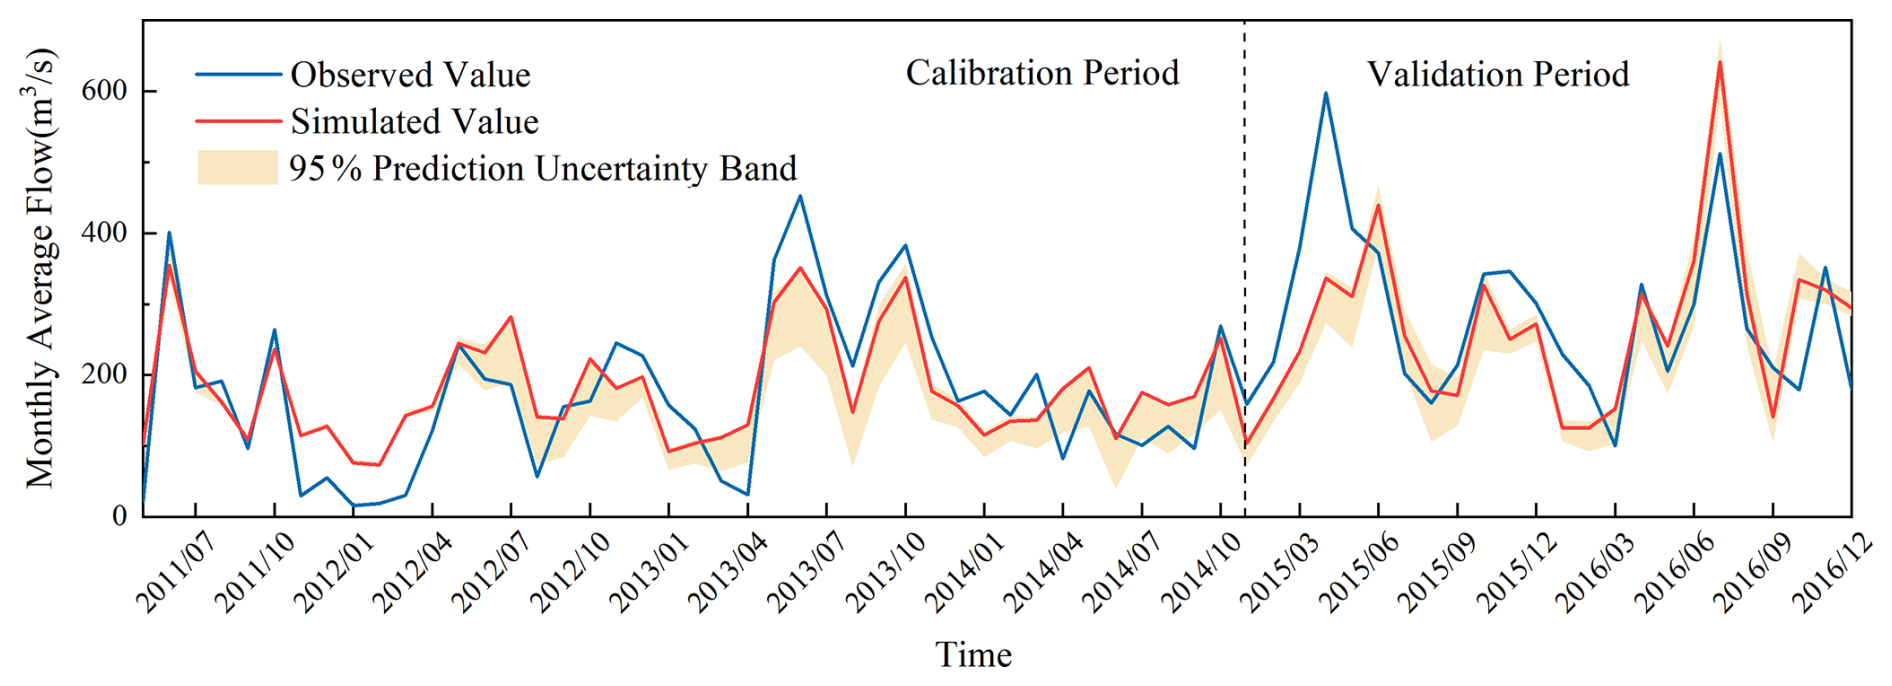
Figure 4The fitting between the simulated monthly flow that has been calibrated and the observed one.
4.2 Validation of the SWAT-MODFLOW model
Clearly, the results in Sect. 4.1 demonstrate that the lateral influence range of the Yangtze River encompasses various surface water bodies, highlighting the necessity of using the SWAT-MODFLOW model. The SWAT model for the Four-Lake Basin was calibrated and evaluated using SWAT-CUP, a dedicated tool for parameter calibration and uncertainty analysis for SWAT model. Sensitivity analysis, a key step within this process, was conducted with the SUFI-2 algorithm to identify the parameters exerting the greatest influence on the model outputs (Khaleghi and Hosseini, 2024). A total of 17 key parameters were selected for sensitivity analysis and calibration, with 1000 iterations conducted to optimize model performance. Table A2 summarizes the calibrated parameters, their fitted values, and sensitivity ranks. Monthly surface runoff data from the Xintankou station (outlet of sub-basin 16) from 2011 to 2016 were used for both model calibration (2011–2014) and validation (2015–2016). As shown in Fig. 4, the model performed well, achieving Nash-Sutcliffe efficiency (NSE) values of 0.7 and 0.65 during calibration and validation, respectively, and R2 values of 0.76 (calibration) and 0.67 (validation), indicating satisfactory agreement between simulated and observed runoff.
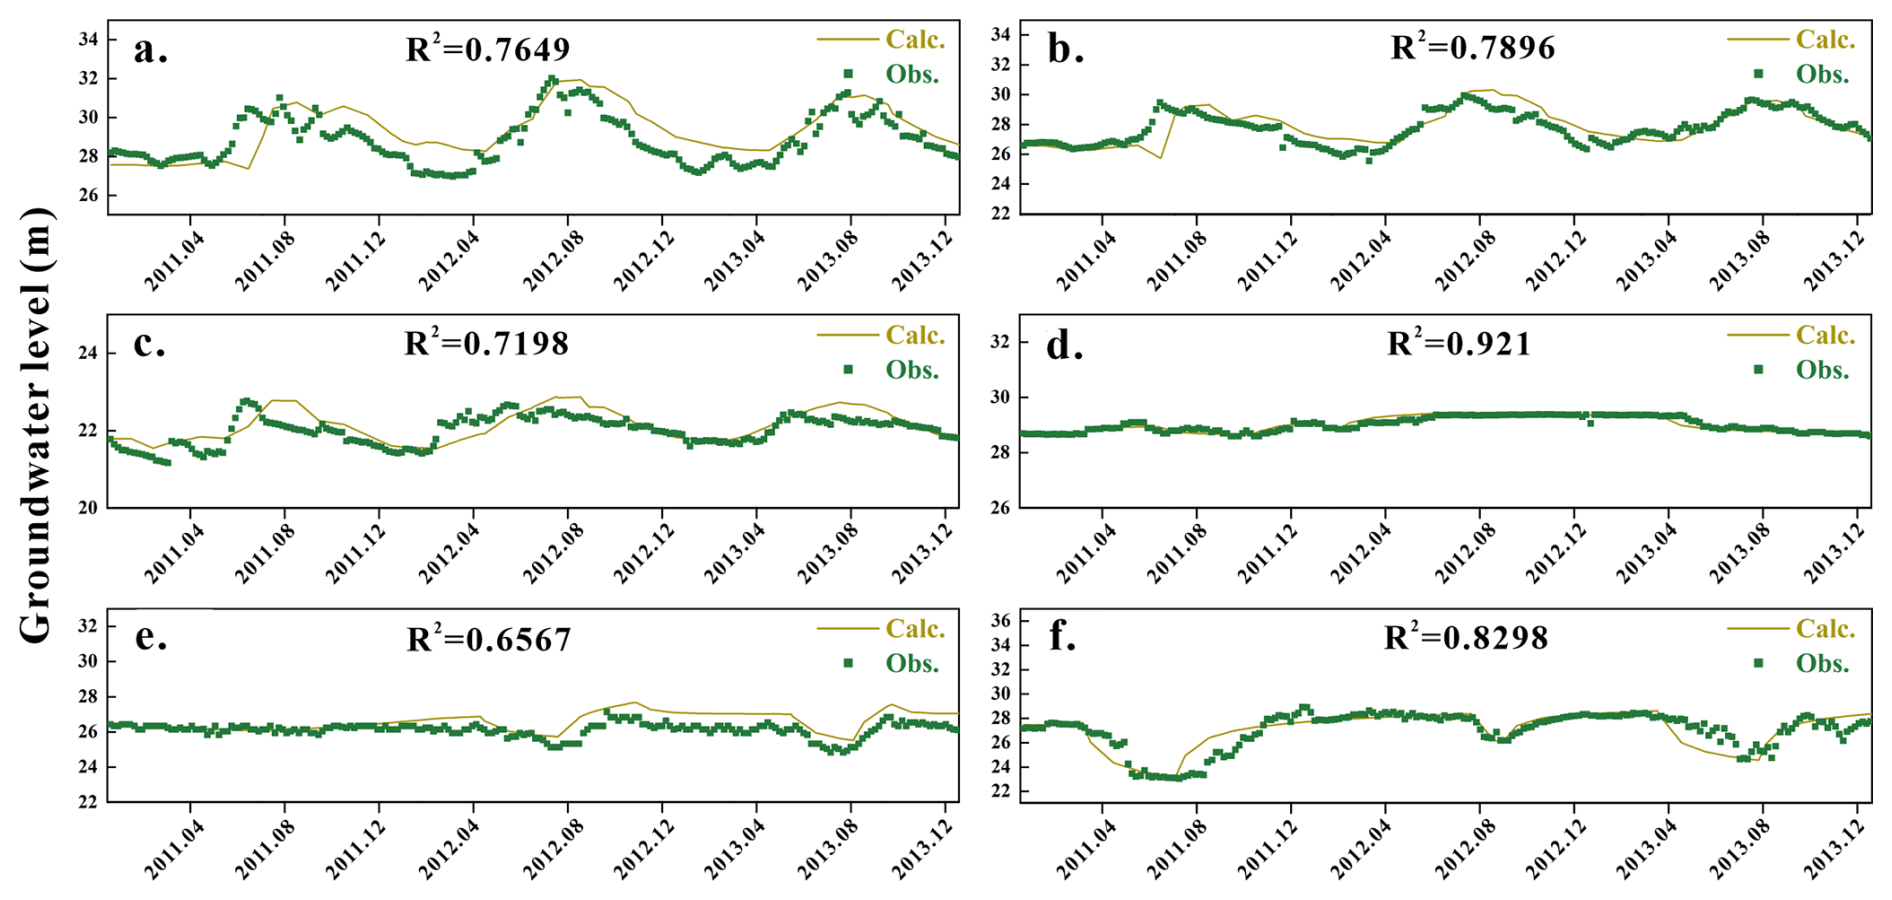
Figure 5Fitting between the observed groundwater levels and the calculated ones at six monitoring wells during the simulated period.
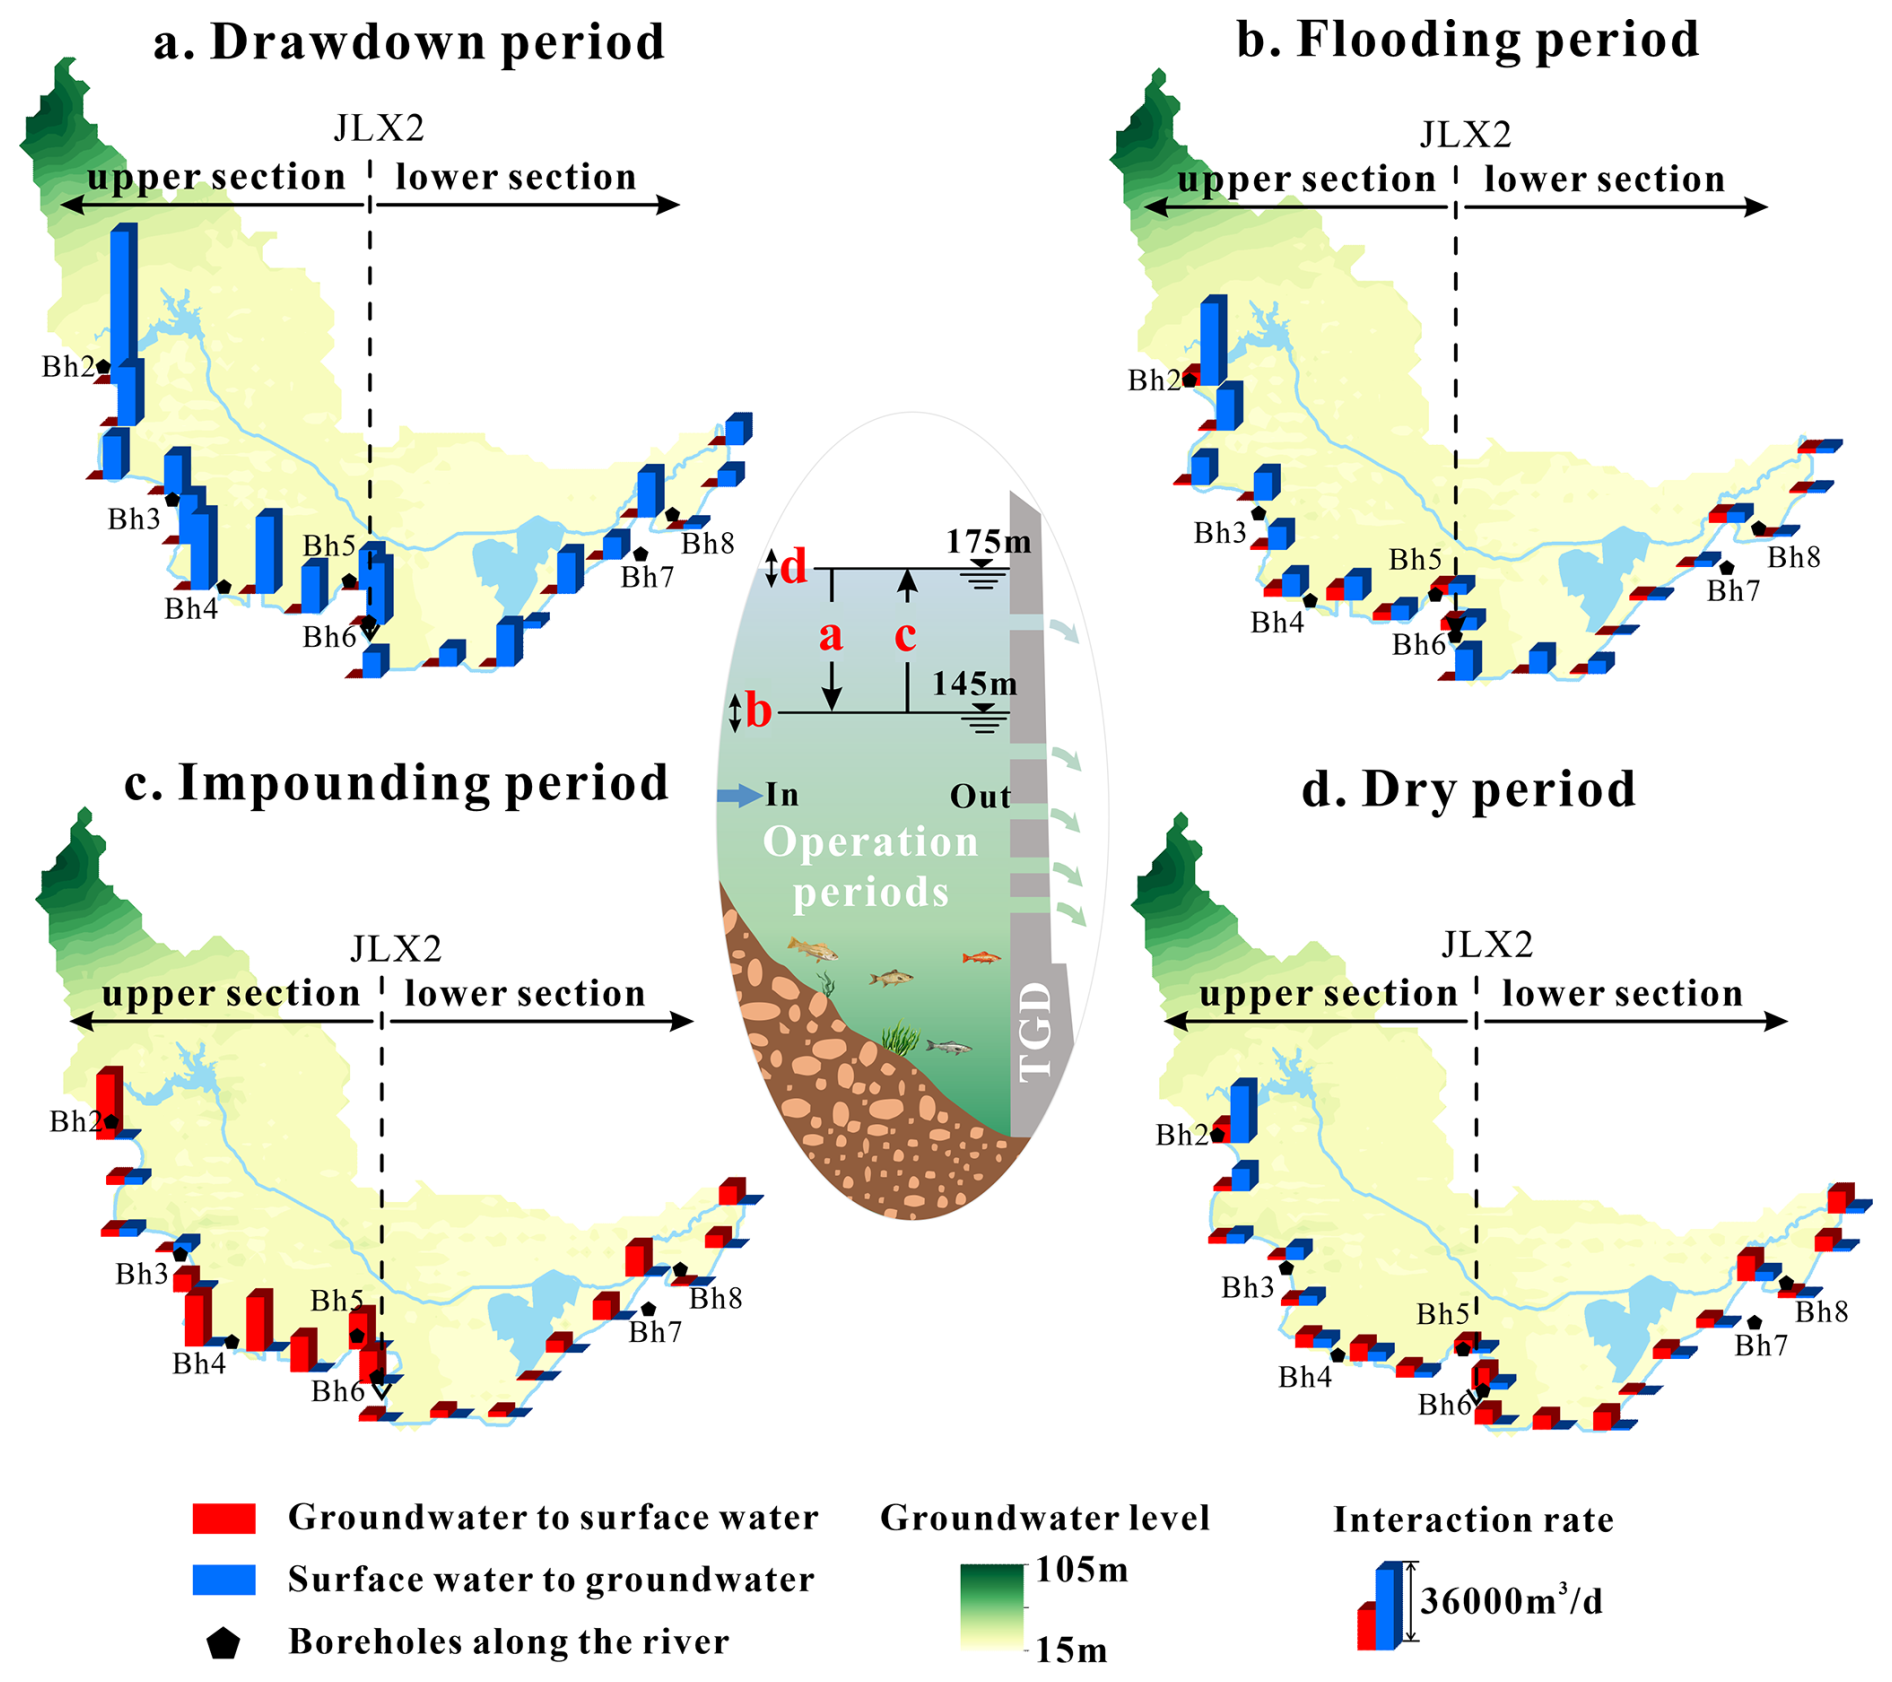
Figure 6Spatial variations in interaction rates (average of 2011 and 2013, m3 d−1) between the Yangtze River and groundwater in the Four-Lake Basin during the four operational periods of the TGD. Red histograms denote groundwater discharge to surface water; blue histograms denote surface-water recharge to groundwater. TGD operational periods: (a) Drawdown period, (b) Flooding period, (c) Impounding period and (d) Dry period. The vertical dashed line indicates a spatial demarcation for different interaction patterns along the river reach.
The coupled SWAT-MODFLOW model was calibrated against observed groundwater levels from six monitoring wells from 2011 to 2013 distributed near Yangtze River (Fig. 1). As shown in Fig. 5, the simulated groundwater levels agree well with the observed values throughout the simulation period, demonstrating the capability of the model to reproduce regional groundwater dynamics. These results confirm that the integrated model reliably captures the key characteristics of surface water-groundwater interactions in the Four-Lake Basin.
4.3 Yangtze River-groundwater interaction under TGD regulation: Spatiotemporal patterns
Figure 6 illustrates the daily exchange volume between the Yangtze River and groundwater in the mainstream within the Four-Lake Basin, calculated by the SWAT-MODFLOW model at 15 km intervals. The relative magnitudes are represented by bar charts, with blue and red indicating groundwater recharge from and discharge to the Yangtze River, respectively. The four subplots correspond to the four scheduling periods of the TGD: (a) Drawdown period. This period refers to the pre-flood water release phase, during which the water level of the TGD is lowered below the flood limit level through controlled discharge to prepare for flood peak retention and attenuation; (b) Flooding period. This period represents the subsequent flood season, during which the reservoir intercepts floods and adjusts the timing of downstream flood peaks; (c) Impounding period. This period denotes the post-flood water storage phase, where water at the end of the flood season is stored for use during dry periods; (d) Dry period. This period is set for the water stored in the previous period to release to supplement downstream flow during dry seasons. The results in the figure represent the daily average exchange rate over all days within each operational period.
As shown in Fig. 6, river-to-aquifer recharge dominates during both the drawdown period and the flooding period, while aquifer-to-river discharge prevails in the other two periods. Moreover, the recharge rate during the drawdown period is significantly higher than that during the flooding period. It occurs because during the drawdown period, the TGD gradually lowers the reservoir level from 175 m at the end of the previous winter to below 145 m (referenced to the Yellow Sea Datum) and releases the incoming spring flows upstream. The substantial outflow leads to a marked rise in the downstream river stage, amplifying the hydraulic gradient between the river and adjacent groundwater and driving strong river-to-aquifer recharge. During the flooding period, groundwater levels are considerably elevated due to rainfall infiltration and surface water recharge in the Four-Lake basin, which have been confirmed by our SWAT-MODFLOW simulation. Additionally, TGD operations during this period aim to attenuate downstream flood peaks for safety, thereby significantly reducing the hydraulic gradient between the river and groundwater compared to that during the drawdown period. It explains why the apparent river-groundwater exchange is weaker during the hydrologically more dynamic flooding period, as observed in Fig. 6b.
The intensity of aquifer-to-river discharge is higher during the impounding period than during the dry period. This difference arises because during the impounding period, groundwater levels remain elevated following the end of the flood season, while the TGD begins to impound upstream water in preparation for the dry-season water supply. This process enlarges the hydraulic gradient between groundwater and the Yangtze River. In contrast, during the dry period, groundwater levels have declined, and the TGD releases water to supplement downstream flow, which reduces the hydraulic gradient between groundwater and the river. It explains why the aquifer-to-river discharge intensity is stronger during the impounding period than during the dry period.
In addition, dividing the Yangtze River at the profile JLX2 into an upper section and a lower section (as shown in Fig. 6) reveals consistently higher exchange rates in the upper one. This pattern arises because the upper section is closer to and more influenced by TGD regulation than the lower section, leading to larger stage fluctuations and weaker along-stream attenuation, which together enhance the hydraulic gradient. In contrast, the lower section, characterized by a wider channel and greater hydraulic connectivity with tributaries, exhibit a comparatively weaker response to the Three Gorges Dam operations. As shown in Fig. A5 in the Appendix A, wavelet coherence analysis reveals that with increasing distance from the TGD, the downstream river stage exhibits a progressive damping in its response to reservoir release variations, accompanied by a lengthening phase lag (see Appendix A). Moreover, the along-river lithology profile in Fig. 3b reveals a distinct shift in aquifer composition: the upstream banks are dominated by highly permeable gravel and coarse sand, which sharply contrasts with the less permeable fine sand that constitutes the downstream deposits. The strong heterogeneity of the riparian stratigraphy is also a significant factor contributing to the weaker downstream interactive strength compared to that upstream. Notably, the spatial contrast in exchange intensity revealed by the SWAT-MODFLOW simulations is consistent with the lateral influence patterns identified in Sect. 4.1, indicating that along-river geological heterogeneity and Yangtze River stage variability jointly control the interaction between lateral groundwater and the Yangtze River.
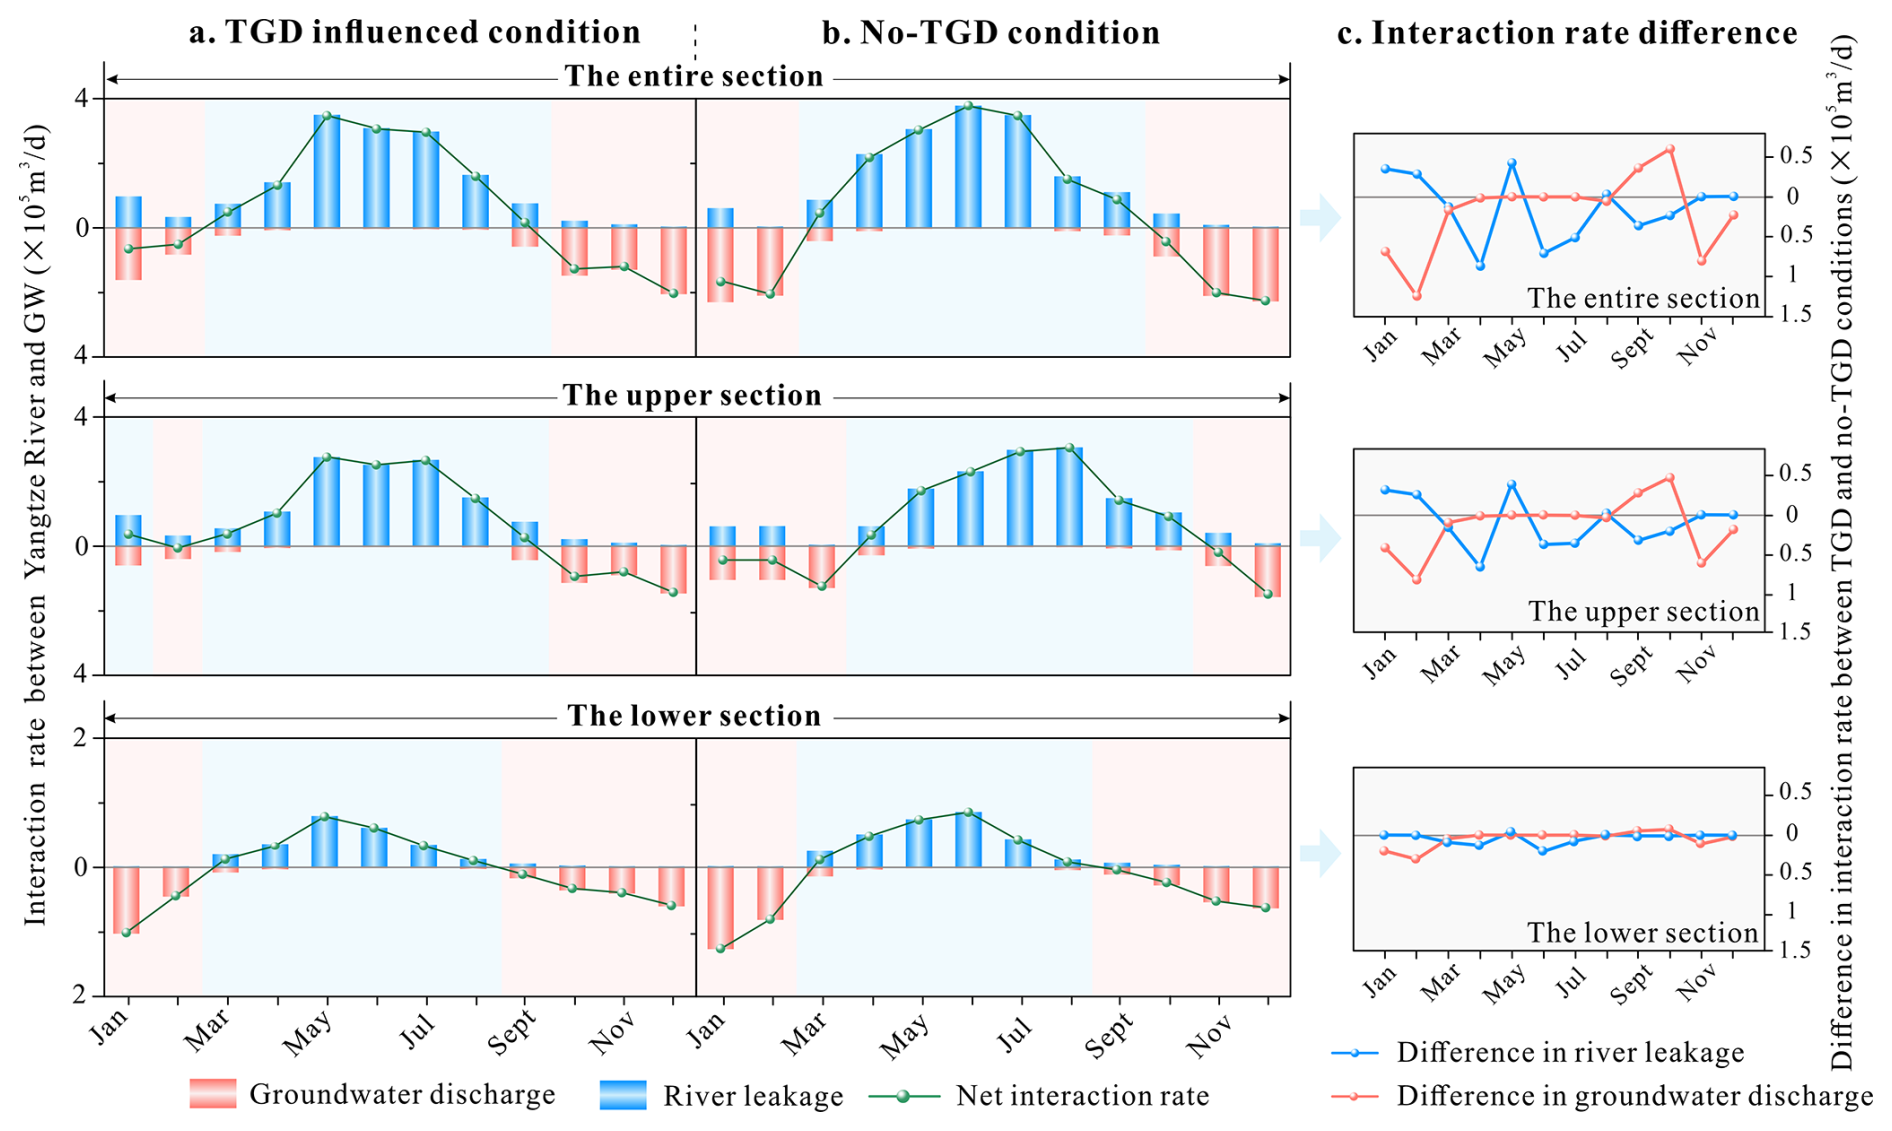
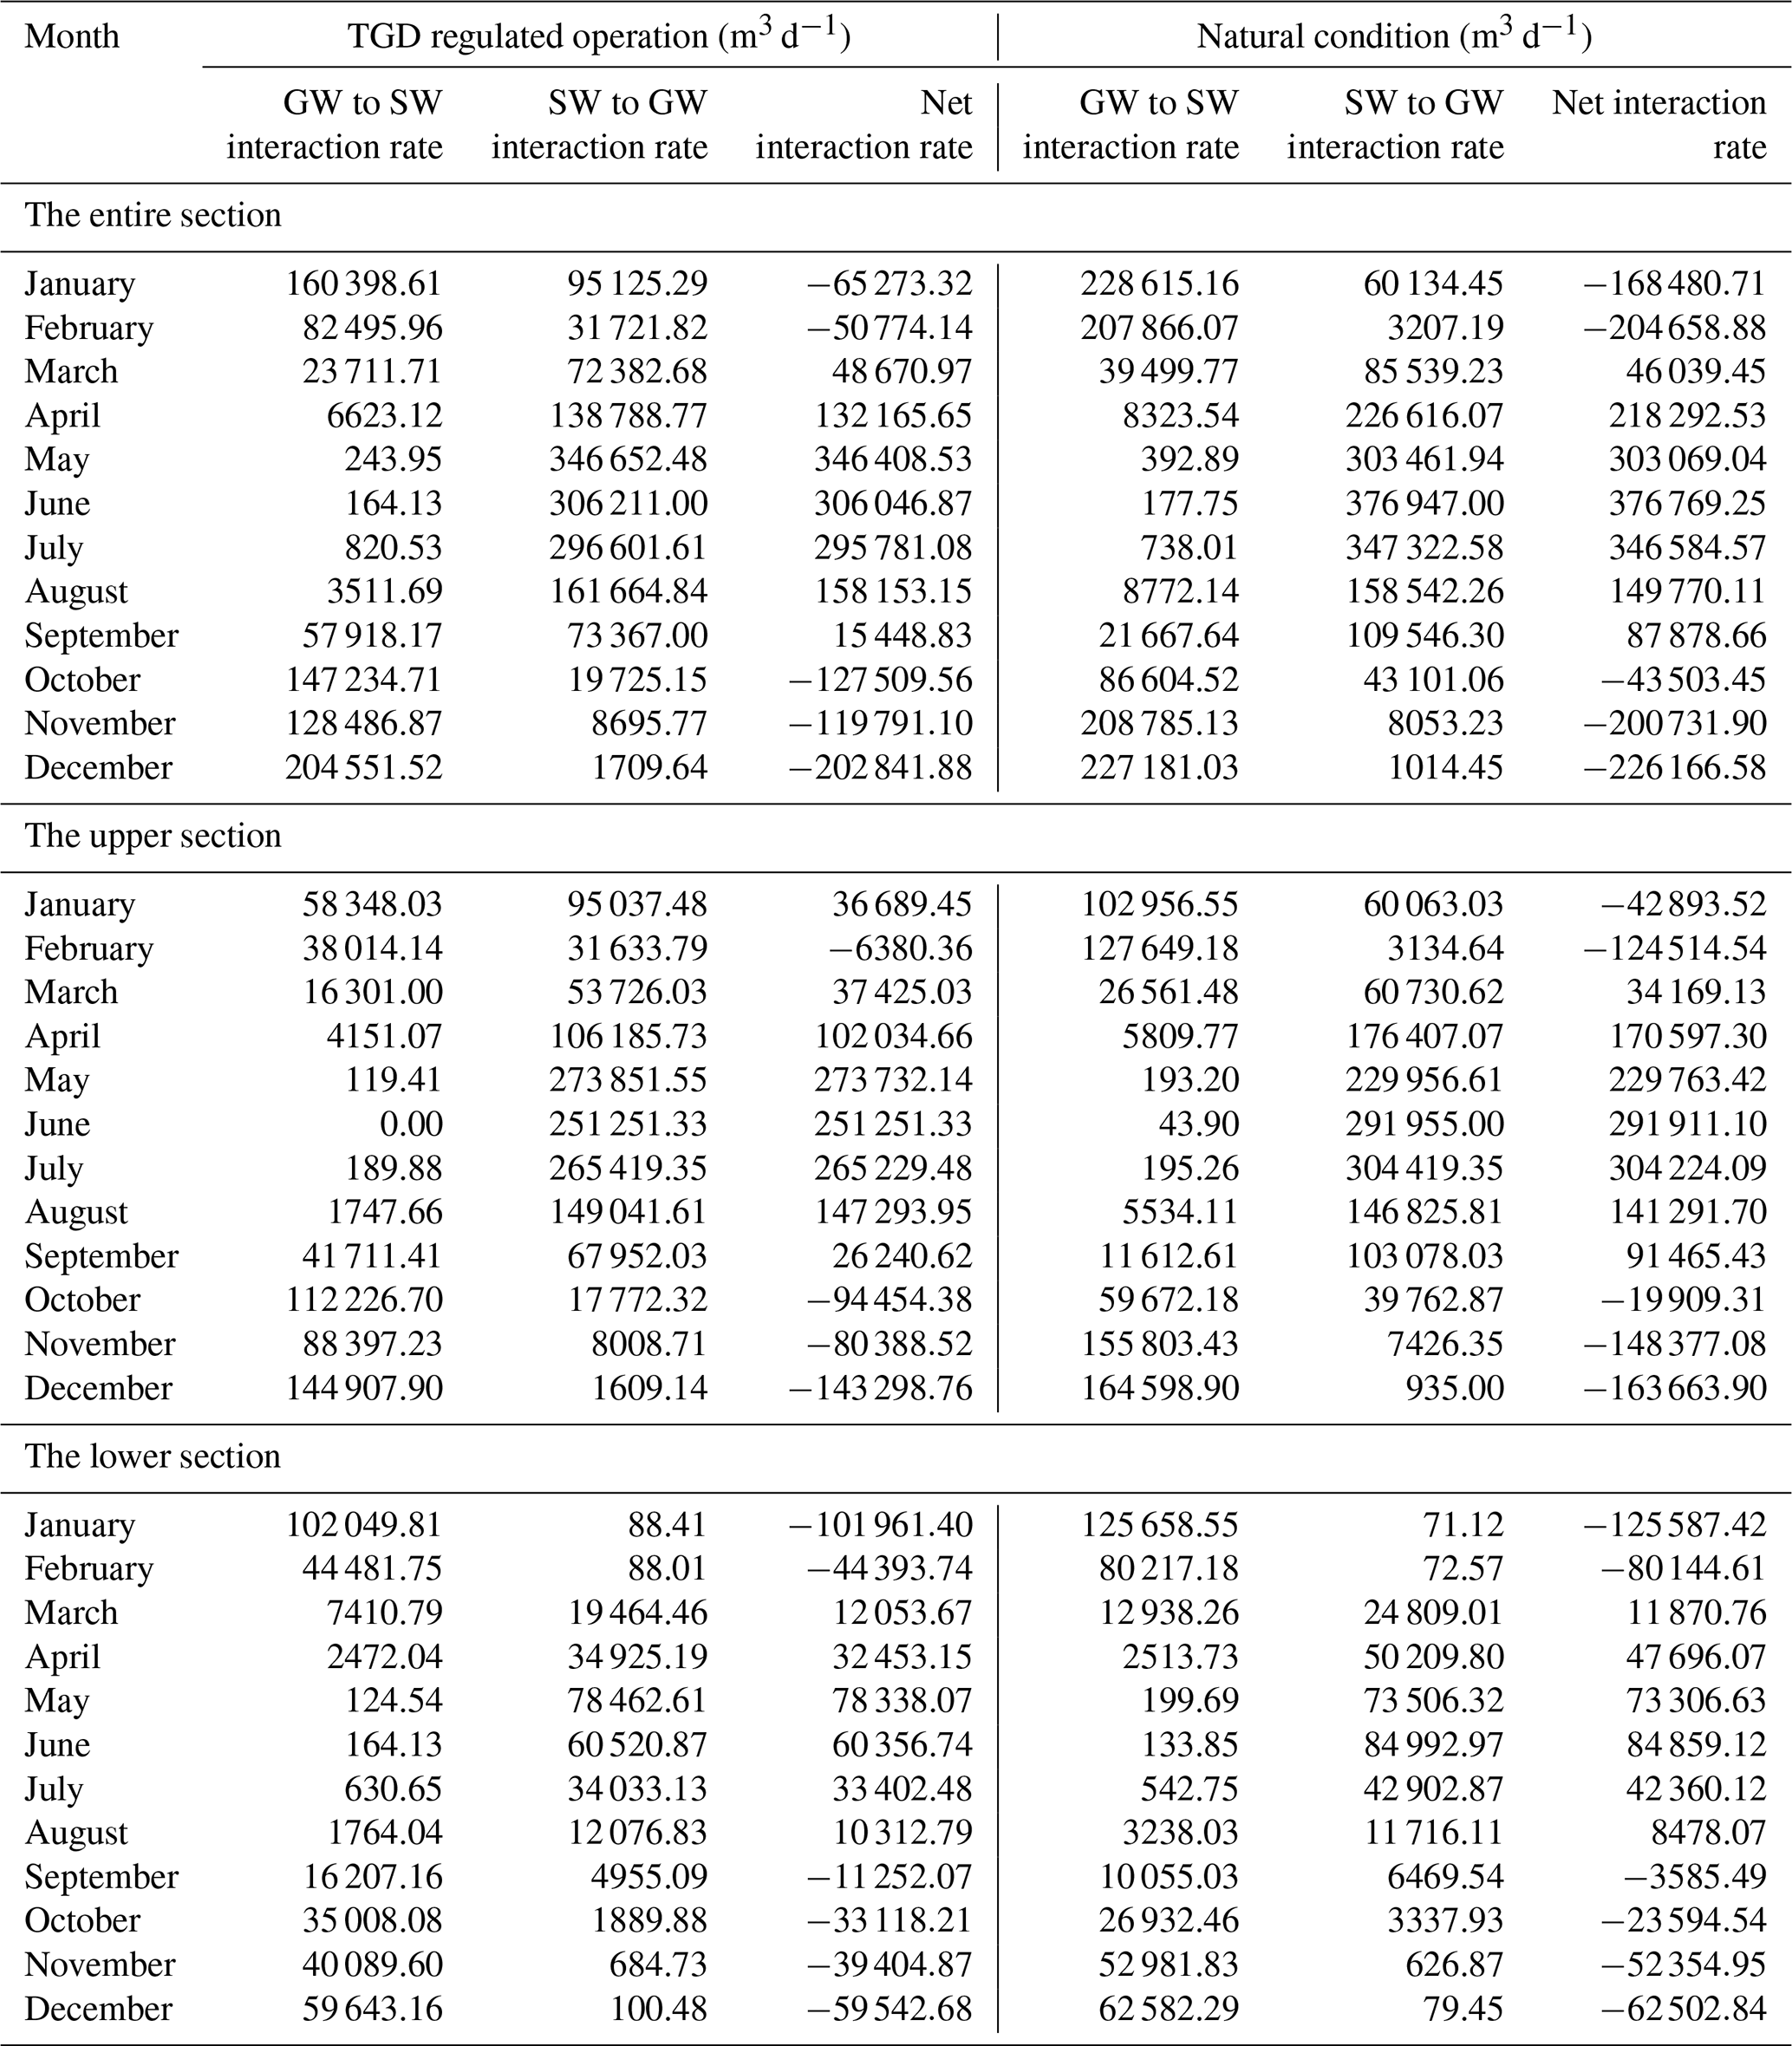
Figure 7Temporal variations in the river leakage rates, groundwater discharge rates and net exchange rates between the Yangtze River and groundwater under (a) TGD-influenced and (b) no-TGD conditions. Fluxes are positive for river leakage to the aquifer and negative for groundwater discharge to the river. (c) Figure of interaction rate difference between TGD and no-TGD conditions in river leakage and groundwater discharge. More detailed information can be found in Table A3.
4.4 Yangtze River-groundwater interaction with and without TGD: A counterfactual comparison
Against the backdrop of numerous factors influencing Yangtze River-groundwater interactions, this study isolated the effect of TGD regulation by implementing simulated “no-TGD” river stages from Wang et al. (2013) in the SWAT-MODFLOW model. All other input data, such as precipitation, evaporation, groundwater levels, and tributary/lake stages, remained unchanged. This setup produced the results of river leakage to groundwater and groundwater discharge to river shown in Fig. 7a and b, respectively: they illustrate the monthly variations in daily exchange rates between the Yangtze River and groundwater for the upper section, lower section, and the entire mainstream of the Four-Lake basin, demarcated by the Profile JLX2. Here, the daily interaction rate represents the monthly total interaction amount averaged over all the days in that month, visualized using bar charts: red bars indicate aquifer-to-river discharge, and blue bars represent river-to-aquifer recharge. The green line graph in Fig. 7a and b depict the net daily exchange, calculated as river leakage minus groundwater discharge. Figure 7a shows simulation results influenced by TGD operation (corresponding to those in Fig. 6), while Fig. 7b presents those without TGD. By subtracting the daily interaction rates in Fig. 7b from those in Fig. 7a, we obtain the differences in these rates between the scenarios with and without the TGD, as shown in Fig. 7c.
Figure 7b shows that regardless of TGD operation, the Yangtze Rive leakage to groundwater dominates from March to September in both the upper and lower sections of the Four-Lake basin. In contrast, groundwater discharge to the Yangzte River prevails from October to February of the following year. Across the entire section of stream, the peak net exchange rate occurs in June, reaching 3.77×10⁵ m3 d−1. Spatially, the net flow direction (river leakage versus groundwater discharge) differs between the upper and lower sections. In the upper section, the rate of river leakage to groundwater consistently exceeds the discharge rate, regardless of TGD regulation.
With a comparison between Fig. 7a and b by calculating the average net exchange rates for both flooding season (from June to September) and dry period (from November to April), one can find that TGD operations significantly suppress the natural river-groundwater exchange. Under TGD regulation, the net exchange rate across the entire section decreased by 19.3 % and 41.8 % during the flooding and dry periods, respectively, compared to natural conditions. This suppression was more pronounced in the upper section, where the net exchange dropped by 40.6 % during the dry period, contrasting with a decrease of 23.8 % in the lower section. In addition, it can be visually inferred from Fig. 7c that a considerable number of values lie below zero. This indicates that, compared to the natural conditions, TGD operations lead to a reduction in river leakage to groundwater for nine months of the year and a decrease in groundwater discharge to the river for ten months in the upper section. Notably, in the lower section, the fluxes in both directions (river leakage and groundwater discharge) are reduced throughout nearly the entire year.
These findings demonstrate that the TGD attenuates flood peaks and elevates low flows, thereby reducing the seasonal amplitude of river stages and narrowing the river-aquifer hydraulic gradient. Consequently, the exchange dynamics become more balanced and stable. The upper section, being directly subject to regulatory releases, exhibits a more pronounced response in net exchange, particularly during the dry season. As also evident from the mapped zone of the Yangtze River's lateral influence on groundwater in Fig. 3, the groundwater response to river stage changes is visibly weaker in the lower section, particularly near Honghu Lake, compared to the upper section. As shown by the net interaction curve for the upper section (Fig. 7), the period from January to March, which was naturally characterized by groundwater discharge to the river, transitions to a state of weak river leakage to the aquifer following the TGD-induced rise in dry-season river stage. This flow reversal occurs because the dry-season hydraulic gradient is inherently small; thus, even a modest stage increase can induce a substantial relative change, making the regulatory influence more pronounced during dry months than in the flood season.
This study has its potential sources of uncertainty, which arises from the spatial sparsity of observation well data used for model calibration and the inability of the one-way coupled model to simulate groundwater discharge to surface water. Besides, several limitations should be acknowledged: Firstly, the lateral influence distance of the Yangtze River was analyzed using the full-year observed amplitude of both river stage and groundwater level fluctuations, making it difficult to interpret how this result varies across different seasons or hydrological year types. Therefore, a more detailed characterization of intra-annual variability would require longer monitoring records with higher temporal resolution, which will be addressed in future work. Secondly, in such a riparian wetland environment, the sources of groundwater recharge along the riverbank has not been analyzed in detail. Future studies will therefore consider tracer-based investigations to further evaluate groundwater sources associated with major lakes, rivers, wetlands, and localized upland areas in the Four-Lake Basin. Thirdly, regarding the spatial influence of the Yangtze River on lateral groundwater, providing a calculation result without the TGD, similar to the numerical modeling approach, would greatly help deepen the discussion on this topic. However, the scarcity of observed groundwater data prior to the construction of the TGD has constrained the successful implementation of this idea.
This study integrated large-scale monitoring data from multiple profiles along the Yangtze River in the Four-Lake Basin, on which a spatial response analysis of water levels was performed followed by a coupled surface water-groundwater modeling framework. Then, the interactions between the Yangtze River and groundwater were systematically investigated through both qualitative and quantitative analyses. The key findings are as follows:
-
Spatial variability of the Yangtze River influence. The lateral influence zone of the Yangtze River on groundwater in the Four-Lake Basin has been quantified for the first time, revealing a band-like pattern with a high degree of spatial heterogeneity. The lateral influence range varies from 1.94 km (HH1 profile) to 12.77 km (ZJ profile) across the Four-Lake Basin.
-
Performance of the newly proposed model. Given the significant influence of rainfall and the surface water network on groundwater in the Four-Lake basin, the SWAT-MODFLOW model is capable of accurately quantifying the exchange fluxes between the Yangtze River and groundwater.
-
Spatial-temporal interaction dynamics between the Yangzte River and groundwater. Temporally, the Yangtze River leakage to groundwater is greater during the drawdown period than during the flooding period. Conversely, groundwater discharge to the Yangzte river is higher in the impounding period than in the dry period. This dynamic is dictated by the combined effects of seasonal TGD regulation and the local hydroclimate. Spatially, the interaction intensity between the Yangtze River and groundwater is markedly higher in the upper section of the Four-Lake Basin than the lower section, which is attributed to the integrated influences of the TGD, the thalweg configuration, and riparian hydrogeology.
-
The impacts of the TGD operation on the Yangtze River-groundwater interaction. By modulating river stages, TGD operations reduce temporal variability in Yangtze River–groundwater exchange rates, thereby promoting more balanced and stable dynamics. This effect is most direct and pronounced in the upper section during the dry period, whereas its influence attenuates downstream.
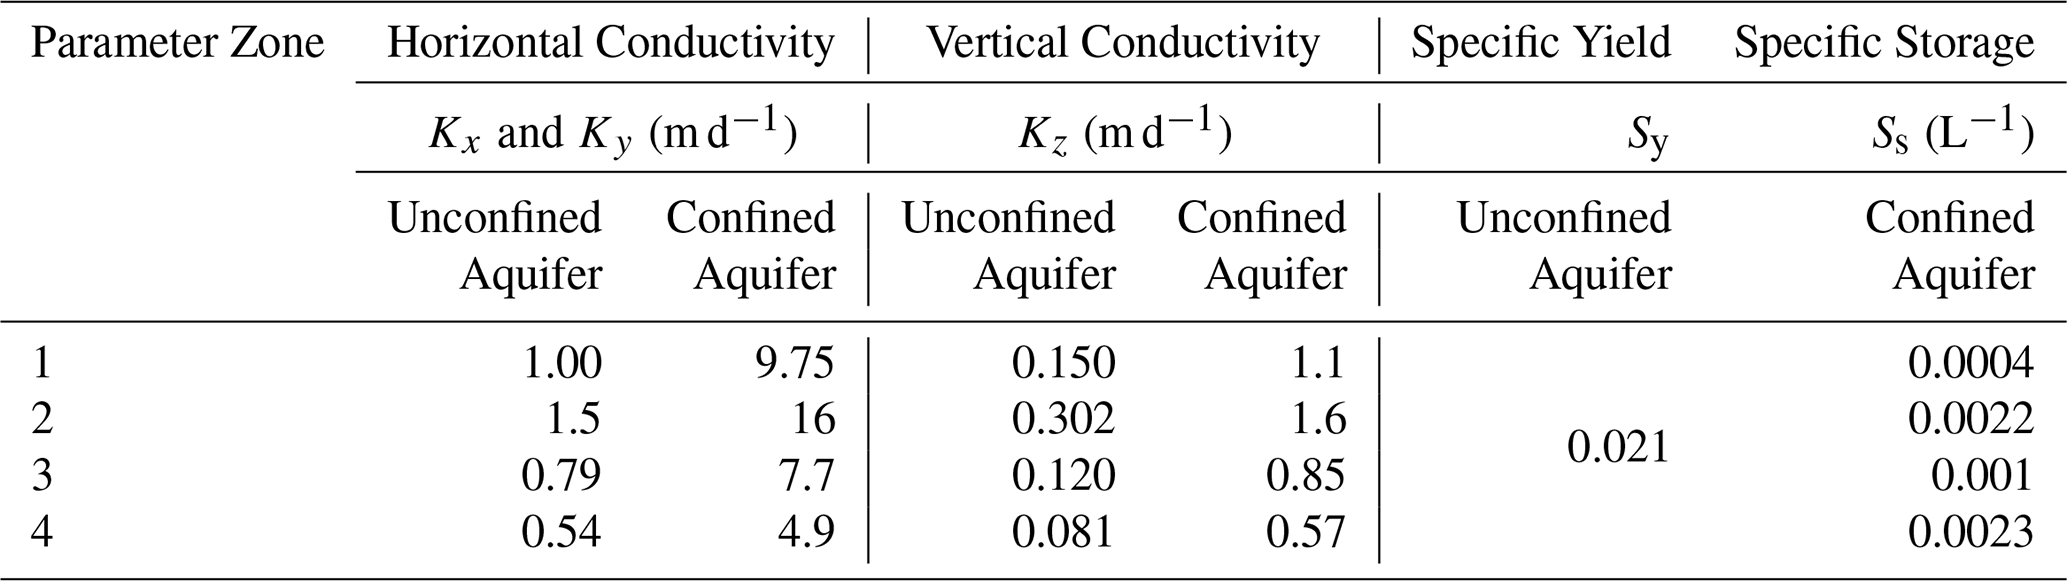
Table A2SWAT model calibrated parameters with adjusted values and sensitivity ranking.
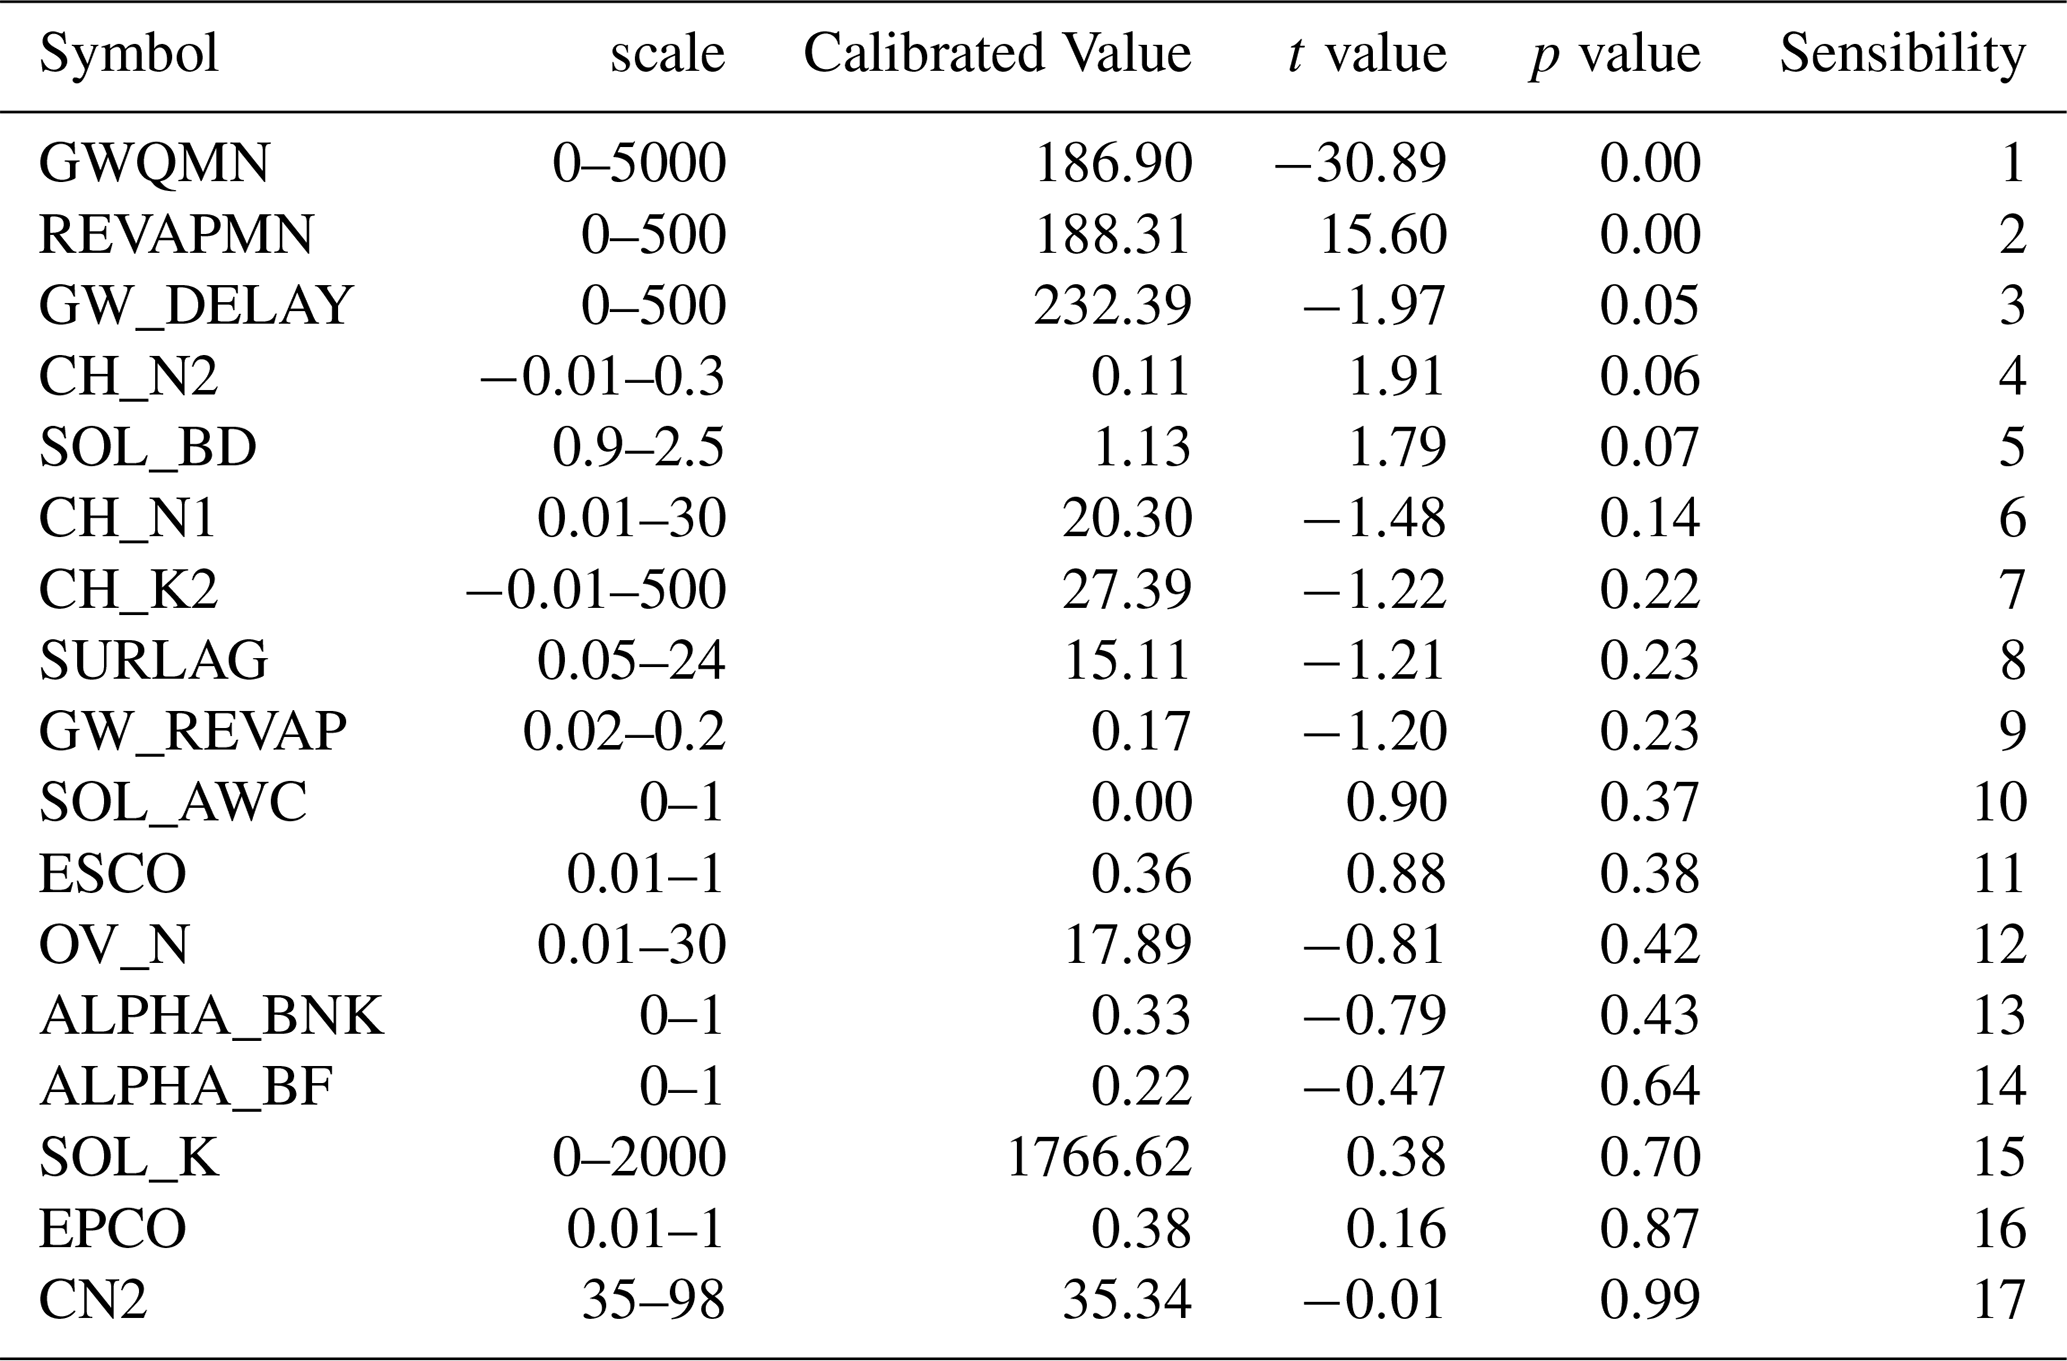
Table A3Average river leakage, groundwater discharge, and net exchange rates (average of 2011 to 2013) under TGD regulated operation and natural conditions between the Yangtze River and groundwater for the entire section, upper section, and lower section.
Wavelet coherence analysis of reservoir release and downstream river stage
Figure A5 is adapted from a previous study by the authors, in which continuous wavelet transform (CWT; Torrence and Compo, 1997) was applied to analyze the time–frequency relationship between discharge from the Three Gorges Reservoir and daily water levels at five hydrological stations along the middle Yangtze River (Shashi, Jianli, Luoshan, Hankou, and Jiujiang). The figure presents results for the year 2012 as a representative example.
In the wavelet coherence spectra, warm colors indicate high coherence and cool colors indicate low coherence. A downstream decrease in high-coherence regions is evident among the five stations, with the most pronounced attenuation occurring at Luoshan, suggesting a weakening influence of reservoir regulation with increasing distance and tributary inflow (notably from Dongting Lake). The arrows denote phase relationships between the two sets of time series data, showing a progressive increase in phase lag from upstream to downstream, which indicates delayed river-stage responses to reservoir discharge variations.
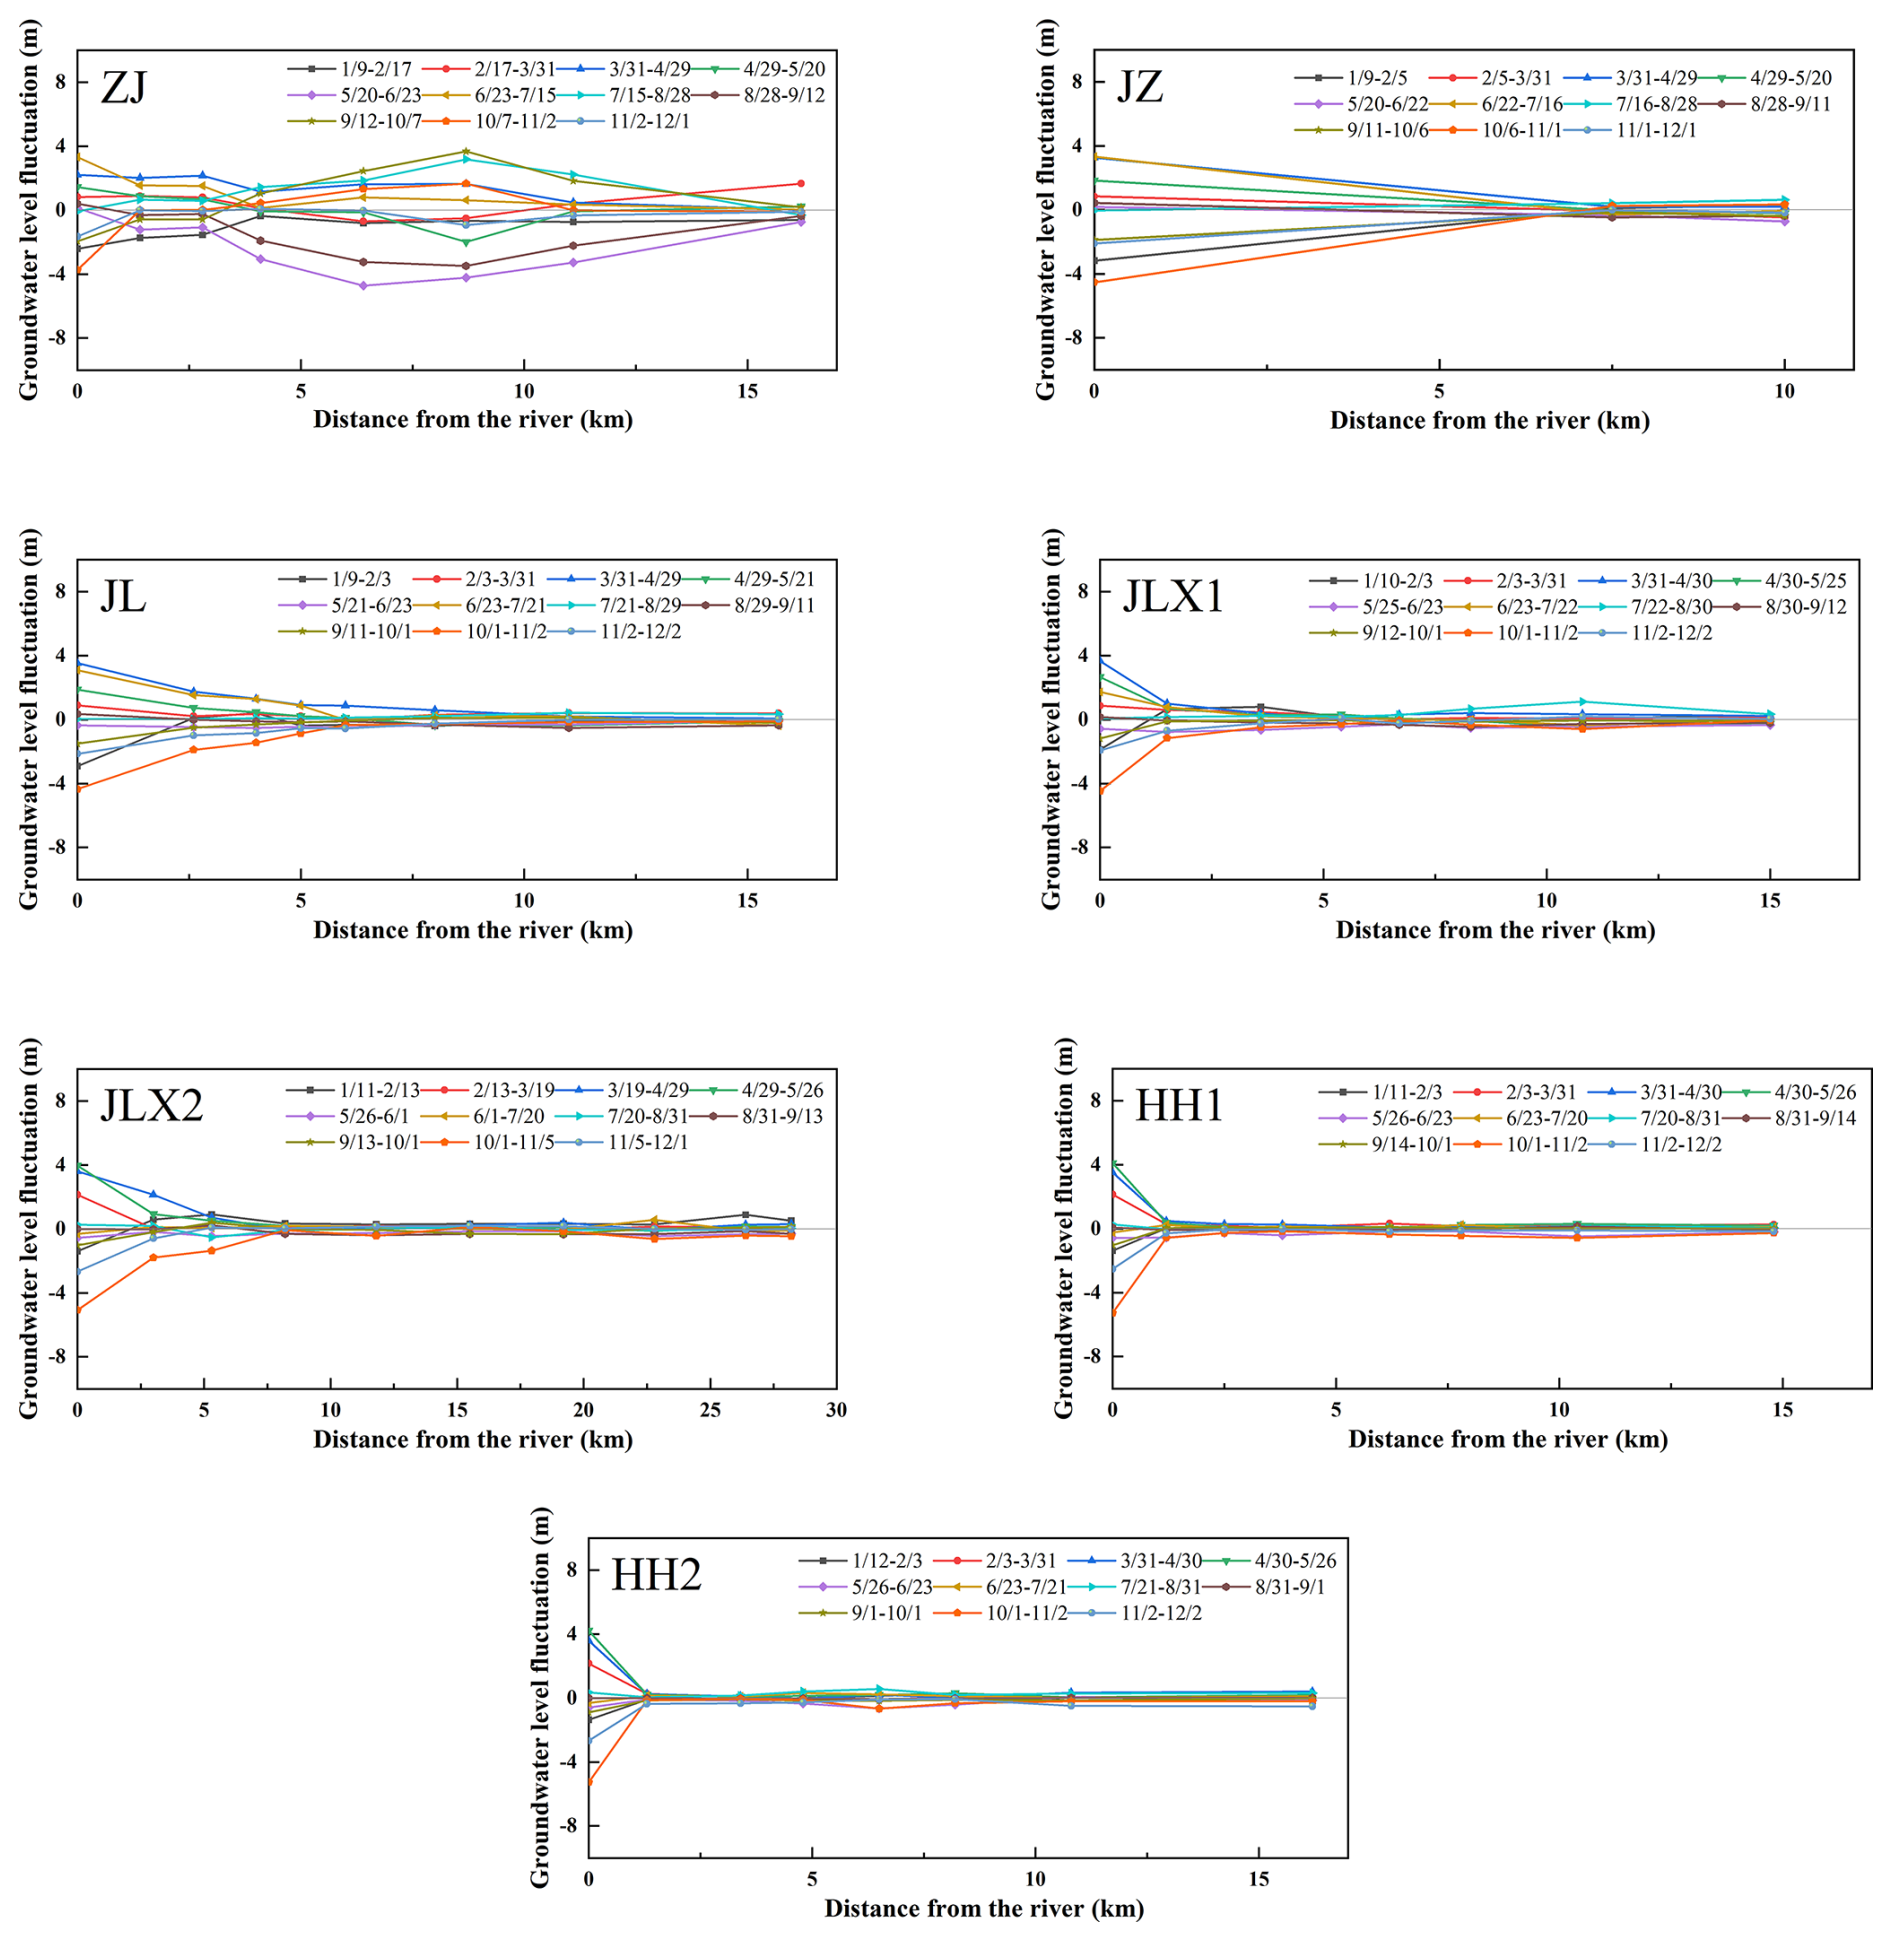
Figure A1Groundwater level fluctuation y versus distance from the river x for each monitoring profile. In the legend, the A and B in “A/B” represent month and data, respectively.
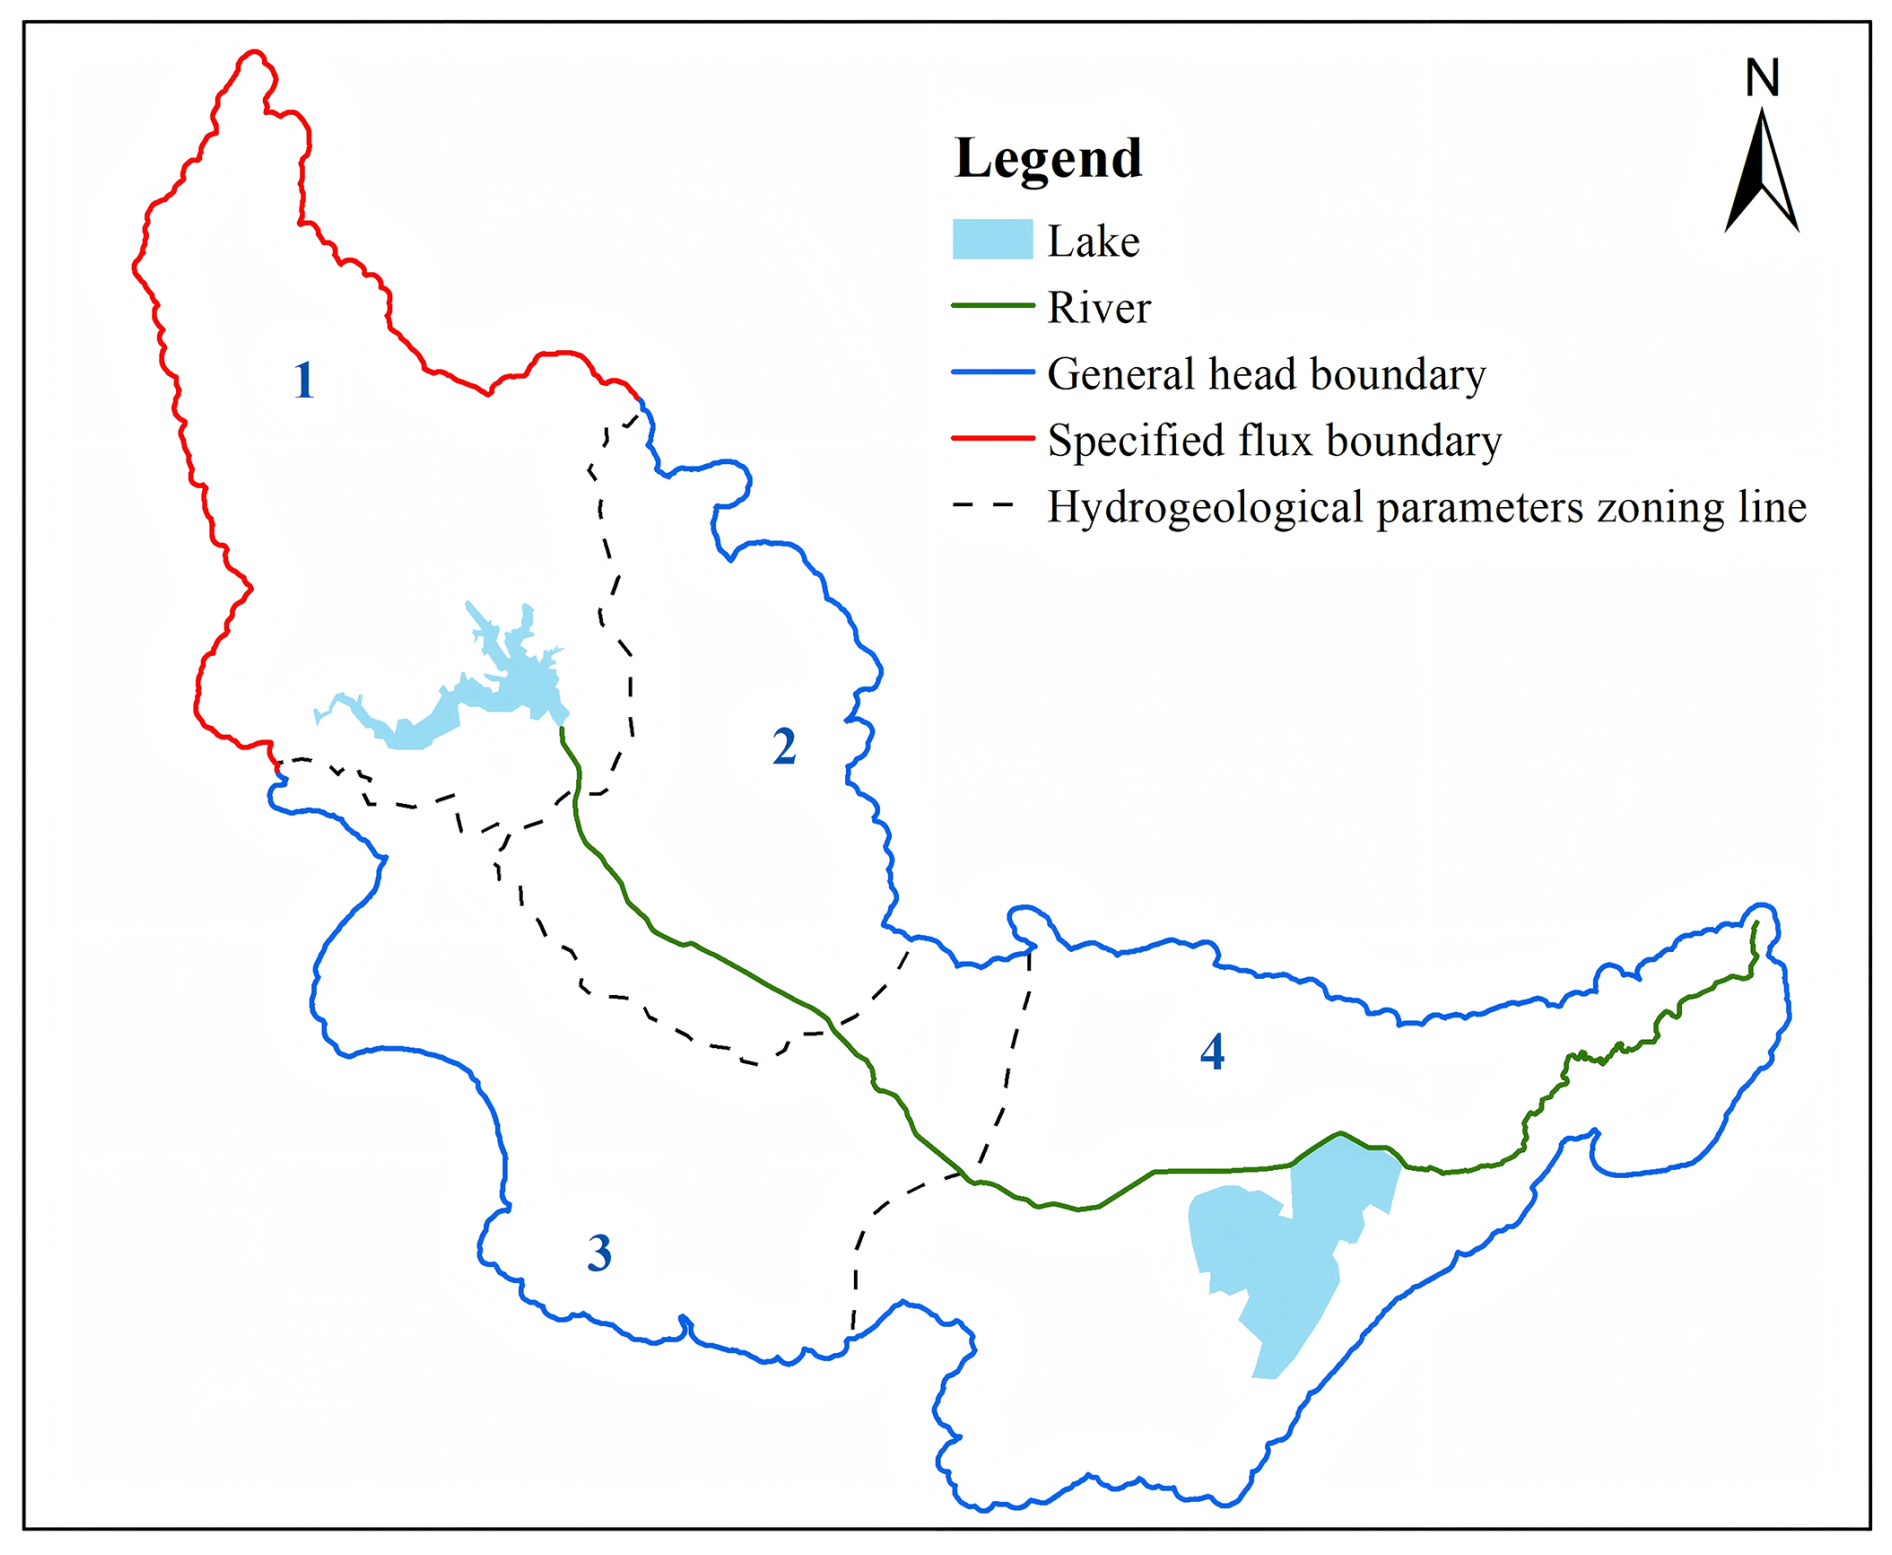
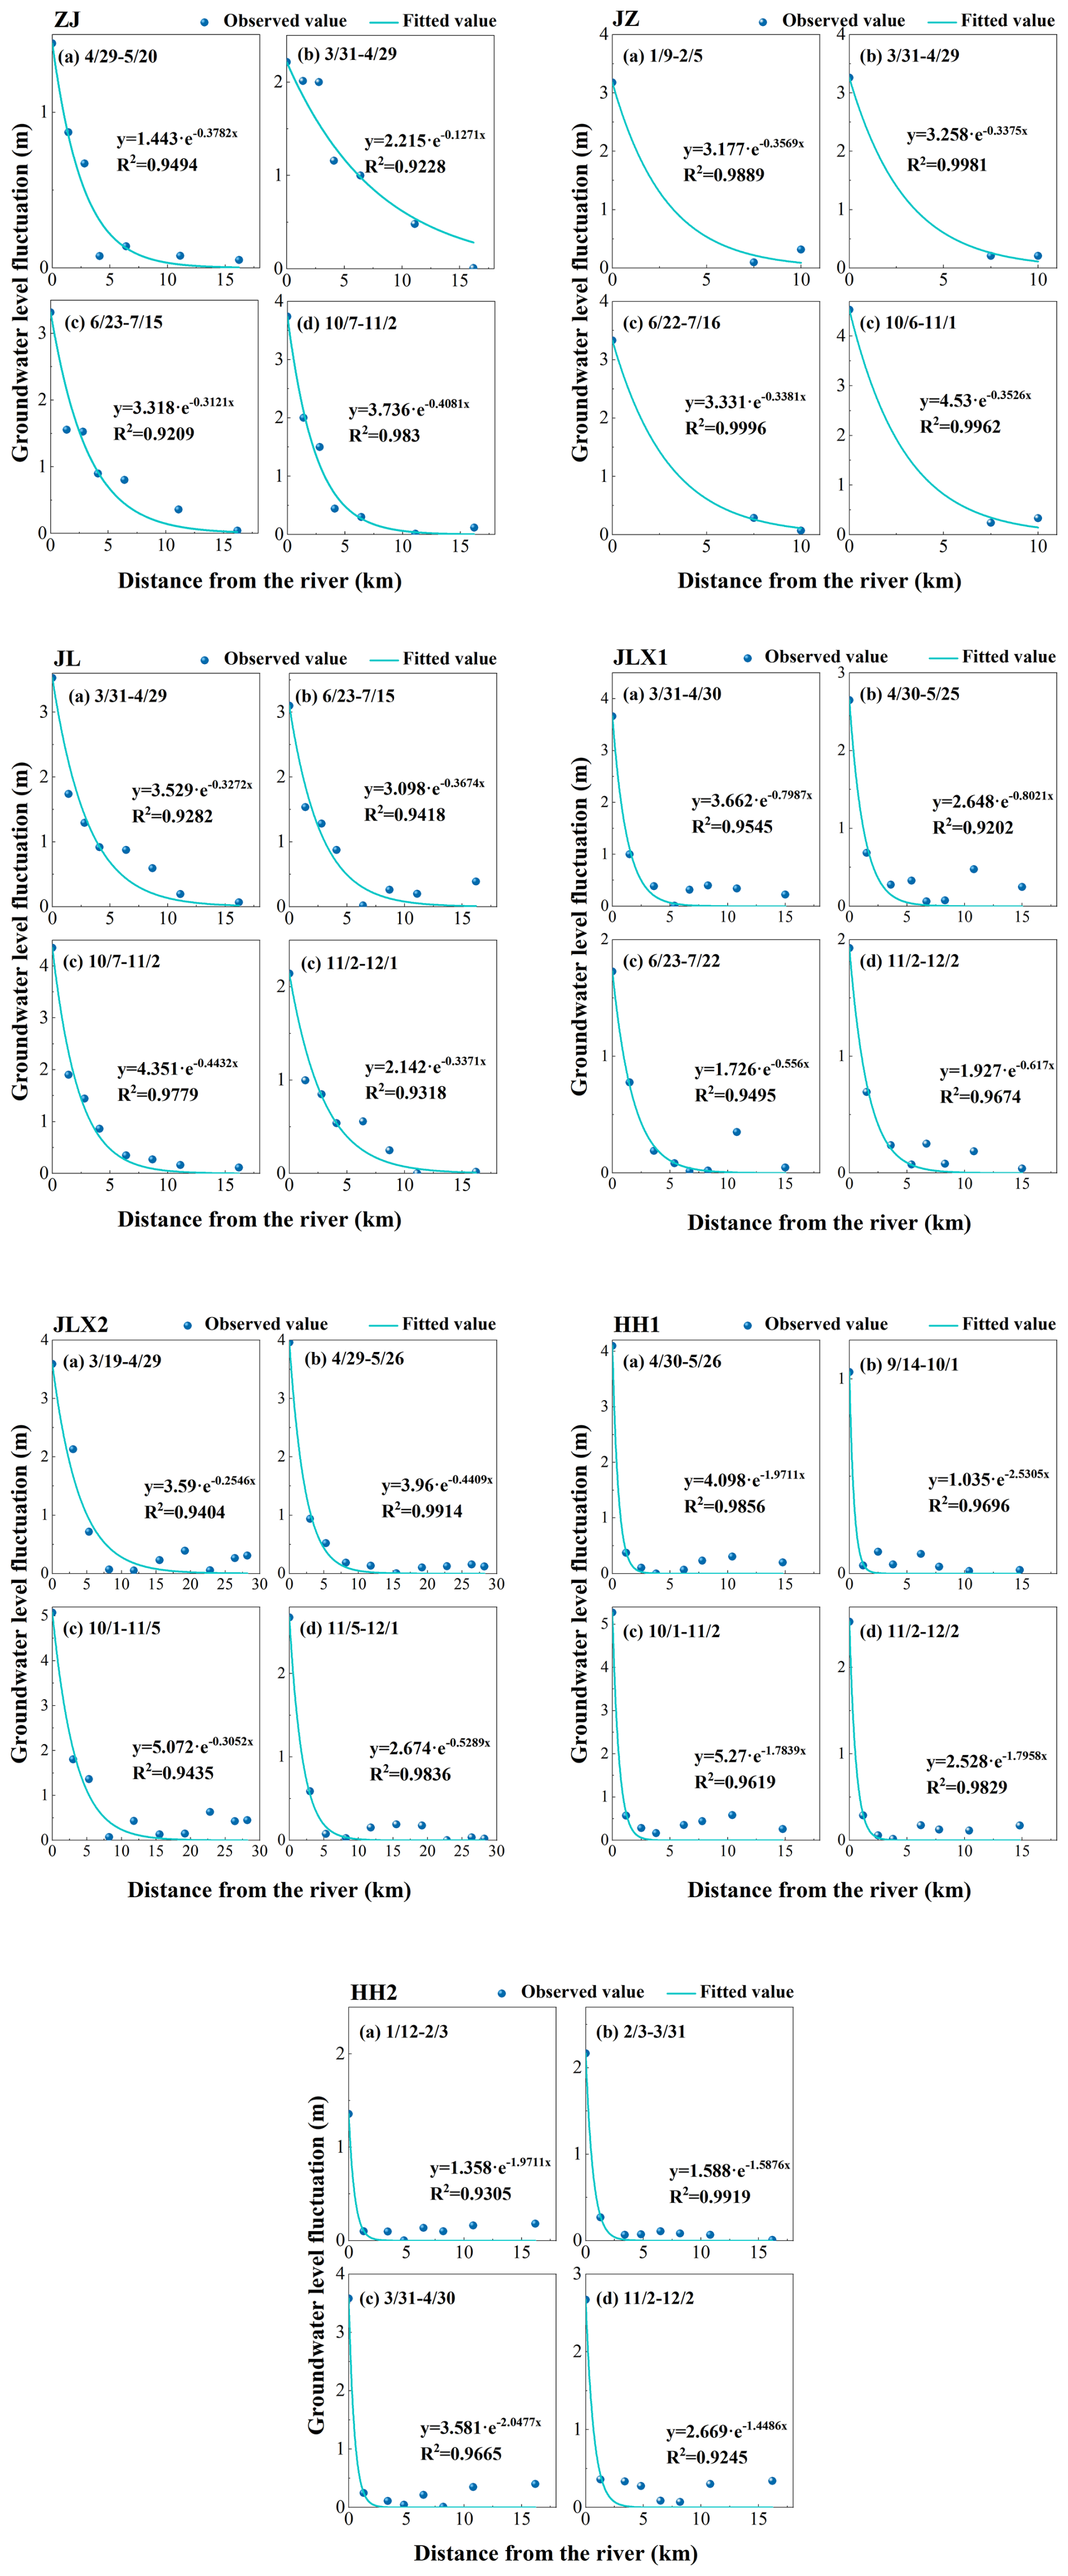
Figure A3The Fitting curves of groundwater level fluctuation versus distance from the river for each monitoring profile.
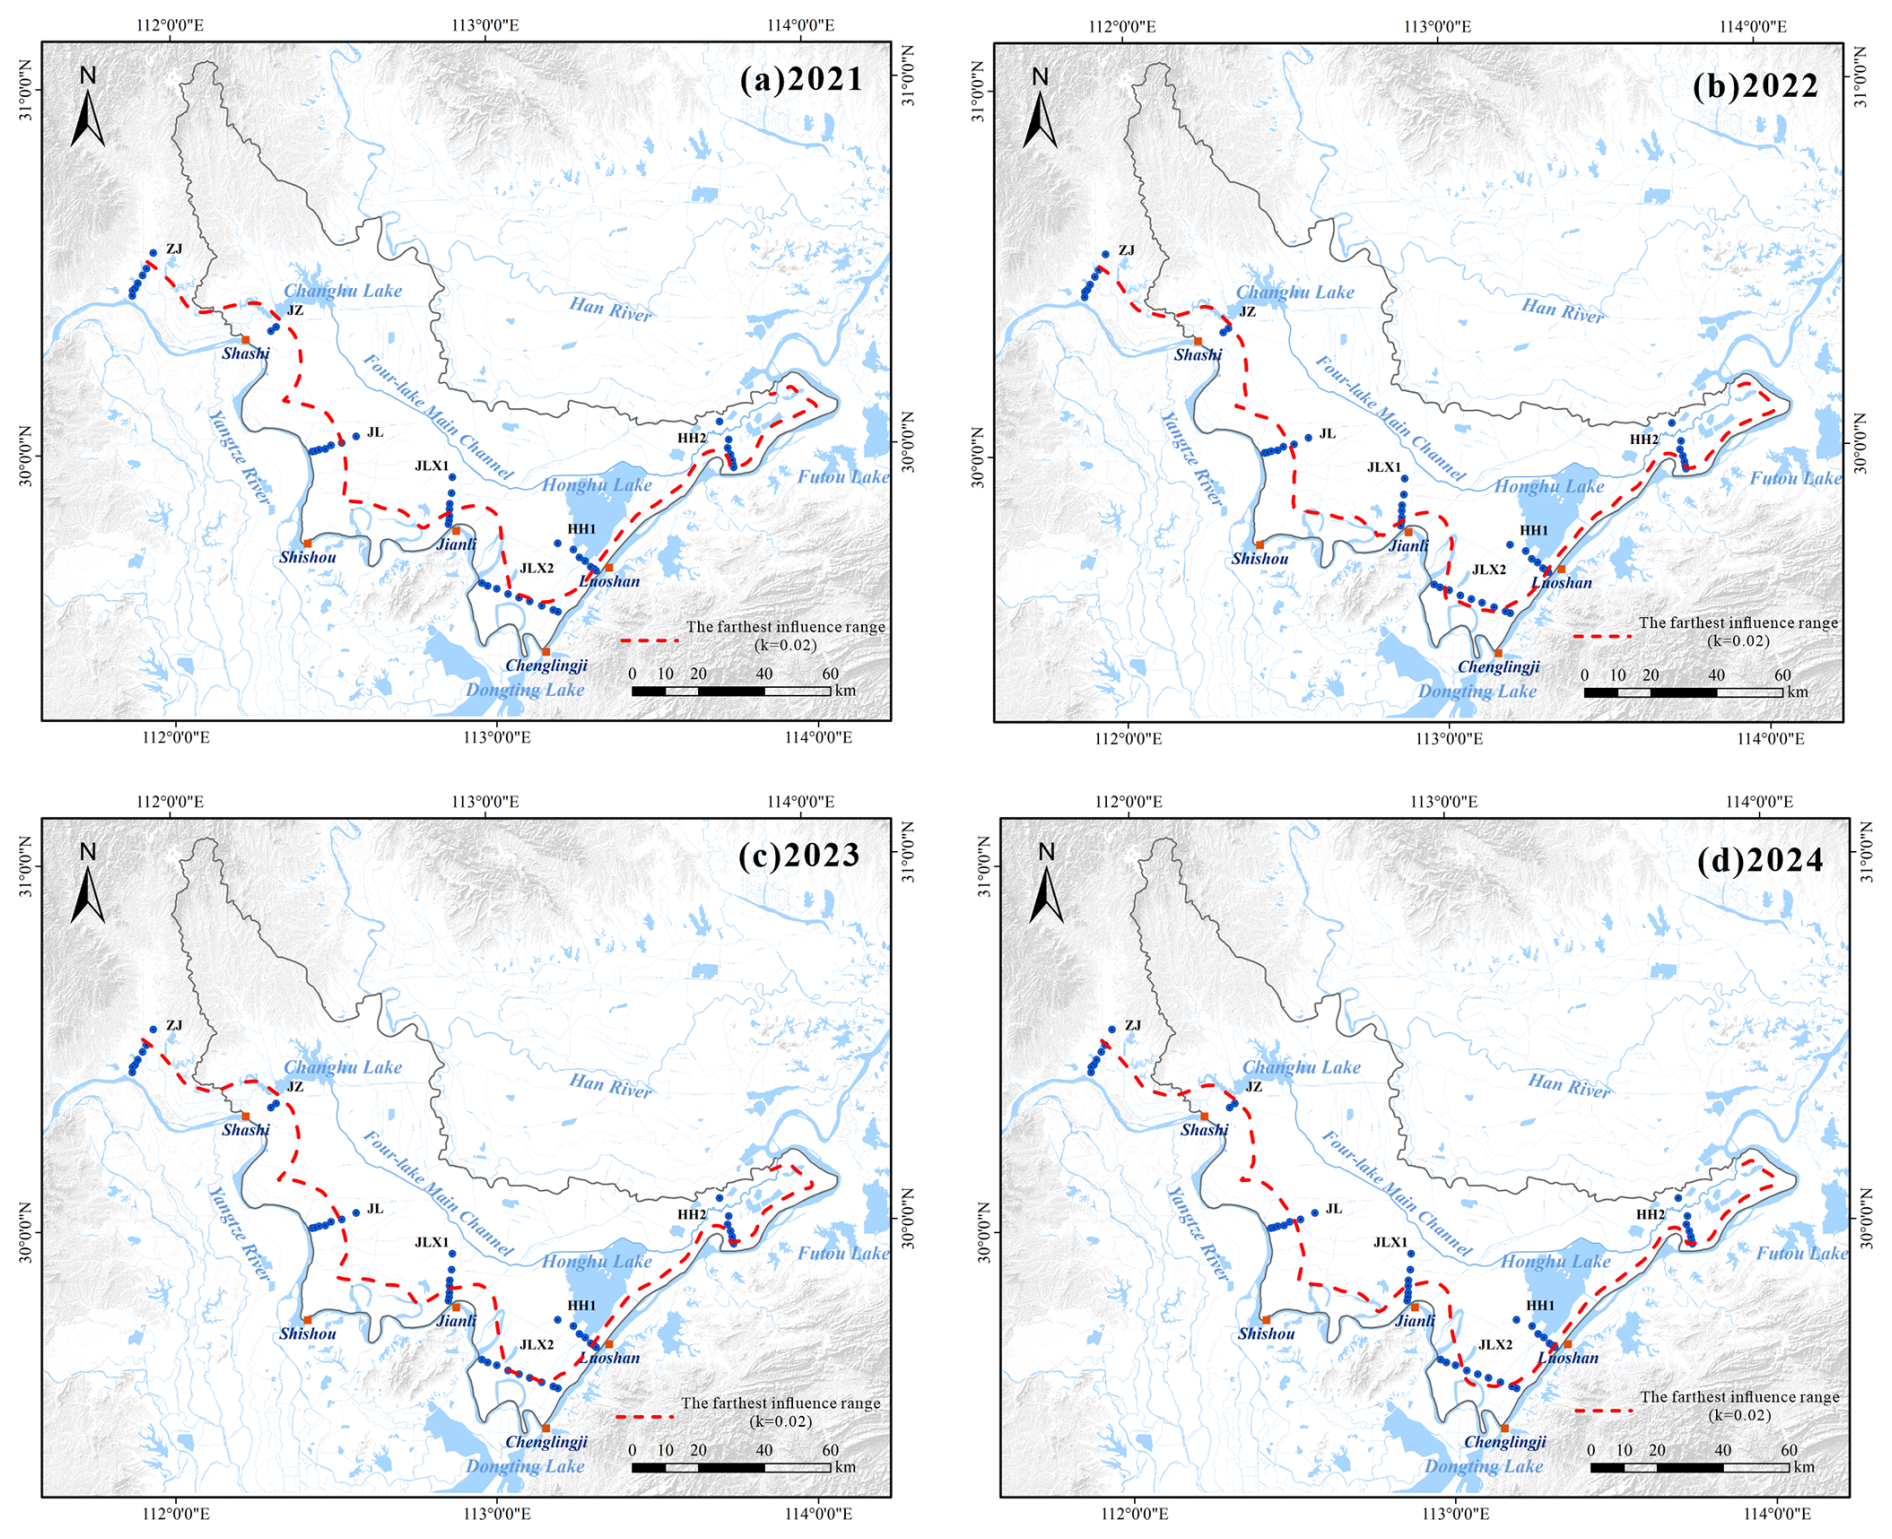
Figure A4The spatial distribution of influence range of Yangtze River in four different years.
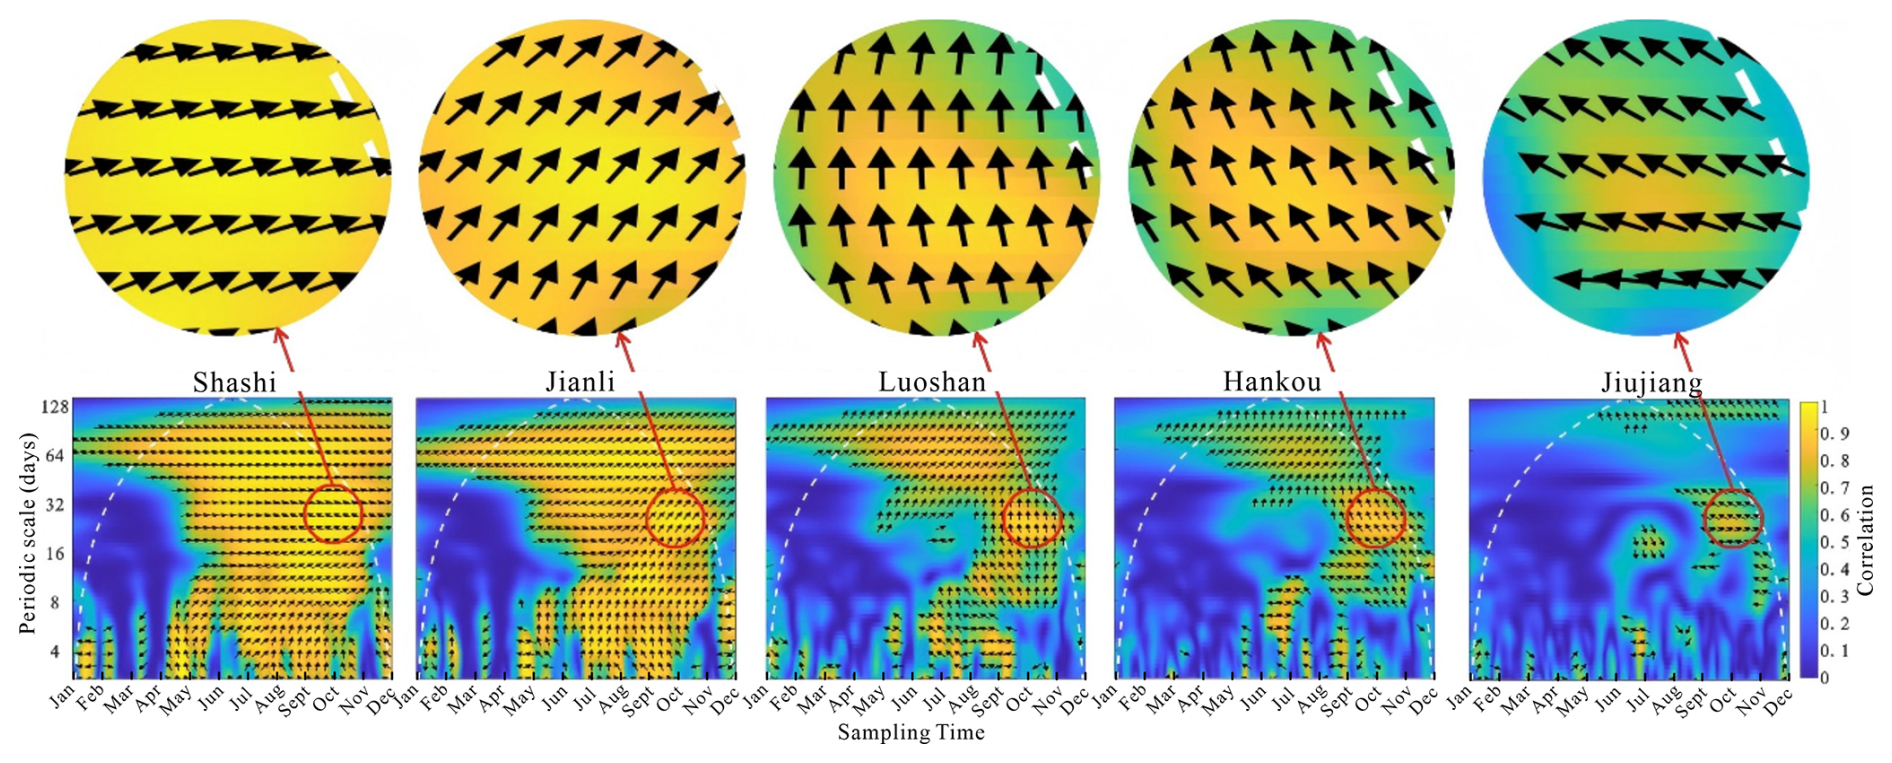
Figure A5Wavelet correlation between the Three Gorges Reservoir water level and the water levels at Shashi, Jianli, Luoshan, Hankou, and Jiujiang hydrological stations on the Yangtze River in 2012.
All raw data can be provided by the first author upon request.
QZ: conceptualization, formal analysis and writting; YK: methodology, investigation and drawing; ZW: project administration and software; HL: Funding acquisition and idea; LL: monitoring work; YL: field data collection; XL: model support, EP: supervision and validation.
The contact author has declared that none of the authors has any competing interests.
Publisher's note: Copernicus Publications remains neutral with regard to jurisdictional claims made in the text, published maps, institutional affiliations, or any other geographical representation in this paper. The authors bear the ultimate responsibility for providing appropriate place names. Views expressed in the text are those of the authors and do not necessarily reflect the views of the publisher.
We would like to appreciate the constructive comments of the handling editor and three anonymous reviewers, who help us improve the quality of the paper. It is worth mentioning that the handling editor has put great effort into carefully examining the figures, tables, punctuation, and typos in the manuscript. We sincerely admire the handling editor's diligent and responsible attitude. We sincerely thank Esri for providing the world map, which facilitated our processing as a base map to better represent the watershed information.
This research has been supported by the National Natural Science Foundation of China (grant nos. U2340206, U23A2042, 42572313, and 42272290) and the Natural Science Foundation of Hubei Province (grant no. 2023AFD194).
This paper was edited by Yonggen Zhang and reviewed by Márk Somogyvári and two anonymous referees.
Aliyari, F., Bailey, R. T., Tasdighi, A., Dozier, A., Arabi, M., and Zeiler, K.: Coupled SWAT-MODFLOW model for large-scale mixed agro-urban river basins, Environ. Model. Softw., 115, 200–210, https://doi.org/10.1016/j.envsoft.2019.02.014, 2019.
Deng, K., Yang, S., Lian, E., Li, C., Yang, C., and Wei, H.: Three Gorges Dam alters the Changjiang (Yangtze) river water cycle in the dry seasons: Evidence from H-O isotopes, Sci. Total Environ., 562, 89–97, https://doi.org/10.1016/j.scitotenv.2016.03.213, 2016.
Dewey, C., Fox, P. M., Bouskill, N. J., Dwivedi, D., Nico, P., and Fendorf, S.: Beaver dams overshadow climate extremes in controlling riparian hydrology and water quality, Nat. Commun., 13, 6509, https://doi.org/10.1038/s41467-022-34022-0, 2022.
Du, Y., Ma, T., Deng, Y., Shen, S., and Lu, Z.: Characterizing groundwater/surface-water interactions in the interior of Jianghan Plain, central China, Hydrogeol. J., 26, 1047–1059, https://doi.org/10.1007/s10040-017-1709-7, 2018.
Esri: World Ocean Base, ArcGIS Online [data set], https://services.arcgisonline.com/ArcGIS/rest/services/Ocean/World_Ocean_Base/MapServer (last access: 1 May 2025), 2023.
Gao, Y., Zhang, W., Li, Y., Wu, H., Yang, N., and Hui, C.: Dams shift microbial community assembly and imprint nitrogen transformation along the Yangtze River, Water Res., 189, 116579, https://doi.org/10.1016/j.watres.2020.116579, 2021.
Guo, W., Zhou, H., Jiao, X., Huang, L., and Wang, H.: Evaluation of hydrological regime alteration and ecological effects in the middle and lower of the Yangtze River, China, Water Supply, 22, 5957–5973, https://doi.org/10.2166/ws.2022.229, 2022.
He, B. and Cai, S.: The Three-Gorge Project and dynamics of shallow confined water in the area of the middle reaches of the Yangtze River, Resources and Environment in the Yangtze Basin, 8, https://kns.cnki.net/kcms2/article/abstract?v=y_SiIdm5mqtjiDtW rG2YebVWlVTs6iXdGLljs4wC1nUDBAj8ybgxxJ6MNsPUkBO W3TD8v3K0960DK0NKz5tAsAFGCl9Pjnfxmn35kBW2VP0QC GgrPqbd5ESGeXEbIEWfI3jLrBMFiEYYHJYXi2sBx-HHb NuGCQImTzXbwCIgv61IOhxjaxhSNQ==&uniplatform =NZKPT&language=CHS (last access: 9 April 2026), 1999.
Hu, M., Yao, M., Wang, Y., Pan, Z., Wu, K., Jiao, X., and Chen, D.: Influence of nitrogen inputs, dam construction and landscape patterns on riverine nitrogen exports in the Yangtze River basin during 1980–2015, J. Hydrol., 617, 129109, https://doi.org/10.1016/j.jhydrol.2023.129109, 2023a.
Hu, M., Zhou, P., and Chen, C.: Study on coupling of typical elements in surface water and groundwater in the middle reaches of the Yangtze River, China, J. Hydrol., 626, 130298, https://doi.org/10.1016/j.jhydrol.2023.130298, 2023b.
Huang, P., Zhou, A., Ma, C., Guo, J., Wang, Y., Fan, W., and Li, W.: Impact of the Three Gorges Dam on the spatial and temporal variation of groundwater level in Jianghan Plain using STL algorithm, Environ. Earth Sci., 82, 417, https://doi.org/10.1007/s12665-023-11110-y, 2023.
Huang, S., Xia, J., Zeng, S. Wang, Y., and She, D.: Effect of Three Gorges Dam on Poyang Lake water level at daily scale based on machine learning, J. Geogr. Sci., 31, 1598–1614, https://doi.org/10.1007/s11442-021-1913-1, 2021.
Jiang, X., Ma, R., Ma, T., and Sun, Z.: Modeling the effects of water diversion projects on surface water and groundwater interactions in the central Yangtze River basin, Sci. Total Environ., 830, 154606, https://doi.org/10.1016/j.scitotenv.2022.154606, 2022.
Khaleghi, M. R. and Hosseini, S. H.: Using SWAT and SWAT-CUP for hydrological simulation and uncertainty analysis of the arid and semiarid watersheds (Case study: Zoshk Watershed, Shandiz, Iran), Appl. Water Sci., 14, 266, https://doi.org/10.1007/s13201-024-02327-8, 2024.
Lai, X., Zou, H., Jiang, J., Jia, J., Liu, Y., and Wei, W.: Hydrological dynamics of the Yangtze River-Dongting lake system after the construction of the three Gorges dam, Sci. Rep., 15, 50, https://doi.org/10.1038/s41598-024-83751-3, 2025.
Lan, Y., He, Y., Yu, Q., and Song, Q.: Delineating sources of groundwater recharge in an arsenic-affected aquifer in Jianghan Plain using stable isotopes, Hydrol. Process., 39, e70050, https://doi.org/10.1002/hyp.70050, 2025.
Li, Y., Jing, G., Aiming, C., Jie, G., Yilin, W., Yao, Y., Youping, Z., and Bo, Y.: Characteristics of groundwater in the cold waterlogged paddy field of the Jianghan Plain, Resources Environment & Engineering, 37, 163, https://doi.org/10.16536/j.cnki.issn.1671-1211.2023.02.005, 2023.
Liu, Y., Wang, H., Wu, Y., Zhao, Y., and Ren, X.: Aquifer response to stream-stage fluctuations: field tests and analytical solution for a case study of the Yangtze River in Wuhan, China, Water, 13, 2388, https://doi.org/10.3390/w13172388, 2021.
Maavara, T., Chen, Q., Van Meter, K., Brown, L. E., Zhang, J., Ni, J., and Zarfl, C.: River dam impacts on biogeochemical cycling. Nat. Rev. Earth Env., 1, 103–116, https://doi.org/10.1038/s43017-019-0019-0, 2020.
Palmer, M. and Ruhi, A.: Linkages between flow regime, biota, and ecosystem processes: Implications for river restoration, Science, 365, 1264, https://doi.org/10.1126/science.aaw2087, 2019.
Poff, N. L., Allan, J. D., Bain, M. B., Karr, J. R., Prestegaard, K. L., Richter, B. D., Sparks, R. E., and Stromberg, J. C.: The natural flow regime, Bioscience, 47, 769–784, https://doi.org/10.2307/1313099, 1997.
Pulido-Velazquez, M., Peña-Haro, S., García-Prats, A., Mocholi-Almudever, A. F., Henriquez-Dole, L., Macian-Sorribes, H., and Lopez-Nicolas, A.: Integrated assessment of the impact of climate and land use changes on groundwater quantity and quality in the Mancha Oriental system (Spain), Hydrol. Earth Syst. Sci., 19, 1677–1693, https://doi.org/10.5194/hess-19-1677-2015, 2015.
Song, X., Chen, X., Zachara, J. M., Gomez-velez, J. D., Shuai, P., Ren, H., and Hammond, G. E.: dynamics control transit time distributions and biogeochemical reactions in a dam-regulated river corridor, Water Resour. Res., 56, e2019WR026470, https://doi.org/10.1029/2019WR026470, 2020.
Sun, Z., Huang, Q., Opp, C., Hennig, T., and Marold, U.: Impacts and implications of major changes caused by the Three Gorges Dam in the middle reaches of the Yangtze River, China, Water Resour. Manag., 26, 3367–3378, https://doi.org/10.1007/s11269-012-0076-3, 2012.
Torrence, C. and Compo, G. P.: A Practical Guide to Wavelet Analysis, B. Am. Meteorol. Soc., 79, 61, https://doi.org/10.1175/1520-0477(1998)079<0061:apgtwa>2.0.co;2, 1997.
Van Cappellen, P. and Maavara, T.: Rivers in the Anthropocene: Global scale modifications of riverine nutrient fluxes by damming, Ecohydrol. Hydrobiol., 16, 106–111, https://doi.org/10.1016/j.ecohyd.2016.04.001, 2016.
Wang, J. and Wörman, A.: Spectral analysis of river resistance and aquifer diffusivity in a river-confined aquifer system, Water Resour. Res., 55, 8046–8060, https://doi.org/10.1029/2018WR024639, 2019.
Wang, J., Sheng, Y., Gleason, C. J., and Wada, Y.: Downstream Yangtze River levels impacted by Three Gorges Dam, Environ. Res. Lett., 8, 044012, https://doi.org/10.1088/1748-9326/8/4/044012, 2013.
Wang, Y., Rhoads, B. L., and Wang, D.. Assessment of the flow regime alterations in the middle reach of the Yangtze River associated with dam construction: potential ecological implications, Hydrol. Process., 30, 3949–3966, https://doi.org/10.1002/hyp.10921, 2016.
Wen, Z., Zhan, H., Wang, Q., Liang, X., Ma, T., and Chen, C.: Well hydraulics in pumping tests with exponentially decayed rates of abstraction in confined aquifers, J. Hydrol., 548, 40–45, https://doi.org/10.1016/j.jhydrol.2017.02.046, 2017.
World Bank: Yangtze River Protection and Ecological Restoration Program Program for Results (Hubei), https://documents.worldbank.org/en/publication/documents-reports/documentdetail/099100925025514109 (last access: 9 April 2026), 2023.
Wu, X., Wang, L., Cao, Q., Niu, Z., and Dai, X.: Regional climate change and possible causes over the Three Gorges Reservoir Area, Sci. Total Environ., 903, 166263, https://doi.org/10.1016/j.scitotenv.2023.166263, 2023.
Xie, Y., Tang, Y., Chen, X., Li, F., and Deng, Z.: The impact of Three Gorges Dam on the downstream eco-hydrological environment and vegetation distribution of East Dongting Lake, Ecohydrology, 8, 738–746, https://doi.org/10.1002/eco.1543, 2014.
Xiong, J., Yin, J., Kyaw Tha Paw U, Zhao, S., Qiu, G., and Liu, Z.: How the three Gorges Dam affects the hydrological cycle in the mid-lower Yangtze River: a perspective based on decadal water temperature changes, Environ. Res. Lett., 15, 014002, https://doi.org/10.1088/1748-9326/ab5d9a, 2020.
Yang, S., Zhang, J., and Xu, X.: Influence of the Three Gorges Dam on downstream delivery of sediment and its environmental implications, Yangtze River, Geophys. Res. Lett., 34, https://doi.org/10.1029/2007GL029472, 2007.
Yang, S., Milliman, J. D., Xu, K., Deng, B., Zhang, X., and Luo, X.: Downstream sedimentary and geomorphic impacts of the Three Gorges Dam on the Yangtze River, Earth-Sci. Rev., 138, 469–486, https://doi.org/10.1016/j.earscirev.2014.07.006, 2014.
Yang, Y., Yuan, Y., Xiong, G., Yin, Z., Guo, Y., Song, J., Zhu, X., Wu, J., Wang, J., and Wu, J.: Patterns of nitrate load variability under surface water-groundwater interactions in agriculturally intensive valley watersheds, Water Res., 267, 122474, https://doi.org/10.1016/j.watres.2024.122474, 2024.
Zhang, Q., Li, L., Wang, Y., Werner, A., Xin, P., Jiang, T., and Barry, D.: Has the Three-Gorges Dam made the Poyang Lake wetlands wetter and drier?, Geophys. Res. Lett., 39, 28, https://doi.org/10.1029/2012GL053431, 2012.
Zhang, S., Zhai, X., Yang, P., Xia, J., Hu, S., Zhou, L., and Fu, C.: Ecological health analysis of wetlands in the middle reaches of Yangtze River under changing environment, Int. J. Digit. Earth, 16, 3125–3144, https://doi.org/10.1080/17538947.2023.2244471, 2023.
Zhou, M., Xia, J., Deng, S., Shen, J., and Mao, Y.: Modelling of phosphorus and nonuniform sediment transport in the Middle Yangtze River with the effects of channel erosion , tributary confluence and anthropogenic emission. Water Res., 243, 120304, https://doi.org/10.1016/j.watres.2023.120304 2023.
Zhou, Y., Wang, Y., Li, Y., Zwahlen, F., and Boillat, J.: Hydrogeochemical characteristics of central Jianghan Plain, China. Environ. Earth Sci., 68, 765–778, https://doi.org/10.1007/s12665-012-1778-9, 2013.