the Creative Commons Attribution 4.0 License.
the Creative Commons Attribution 4.0 License.
 | 08 Apr 2026
Increasing glacier runoff in northwestern Greenland simulated from 1950 to 2023
Koji Fujita
Increased river runoff due to ice melting in Greenland contributes to sea-level rise, as well as flooding in coastal settlements, posing serious risks to local communities. To investigate fluctuations of glacier runoff in Greenland and its atmospheric drivers, long-term variations in runoff from Qaanaaq Glacier, northwestern Greenland, were reconstructed from 1950 to 2023 using a glacier energy–mass balance model and climate reanalysis dataset. Exceptionally large daily runoff (top 0.1 %) has only happened since 1990, indicative of an increasing frequency of major runoff events in recent decades. The largest (8.5 m3 s−1 in 2023) and second largest (7.2 m3 s−1 in 2001) runoffs resulted in the destruction of roads in the settlement of Qaanaaq, demonstrating the significant effects on the local community. The two largest runoffs have been attributed to intense rainfall contributing 79 % and 78 % of the daily runoffs, respectively, due to enhanced moisture and heat transport caused by an atmospheric river. Long-term annual glacier runoff increased at a rate of 0.7 Mt per decade, associated with the atmospheric warming with 0.24 °C per decade during 1950–2023. Rainfall exhibited 2.2-fold increase from 1951–1960 to 2010–2020. The variations in annual glacier runoff are controlled mainly by synoptic-scale atmospheric conditions represented by the Greenland Blocking Index (r=0.69). Composite analysis of the climate reanalysis dataset suggests particularly high sensitivity of air temperature in northern Greenland to anticyclonic conditions over Greenland, which lead to strengthened warm southerly winds. Accurate representation of such extreme conditions in climate models is crucial for predicting glacier runoff and flood occurrence in Greenland.
- Article
(7260 KB) - Full-text XML
-
Supplement
(4074 KB) - BibTeX
- EndNote


The Greenland ice sheet has been losing mass over the past three decades, thereby contributing to a sea-level rise of 13.6±1.3 mm during 1992–2020 (Otosaka et al., 2023). More than half of the mass loss during 2000–2018 (55±5 %) was caused by negative surface mass balance (SMB) due to increased meltwater runoff (van den Broeke et al., 2016; Mouginot et al., 2019) associated with atmospheric warming and circulation changes over Greenland (Fettweis et al., 2013; van den Broeke et al., 2016). As a result of the mass loss, freshwater runoff from the Greenland ice sheet had been increasing at a rate of 16.9±1.8 km3 a−2 during 1992–2010 (Bamber et al., 2012).
Local glaciers and ice caps located along the periphery of the Greenland ice sheet are susceptible to climate warming because they are located at low elevations (Mernild et al., 2011; Hanna et al., 2012). While these regions constitute a relatively small area of Greenland (4 %–7 %, depending on the connectivity to the ice sheet) (Rastner et al., 2012), their ice mass loss had a high contribution (11±2 %, when 4 % of area in Greenland was considered as local) to that across Greenland during 2003–2019 (Khan et al., 2022). Khan et al. (2022) also noted that ice mass loss across Greenland was heterogeneous, with the greatest changes occurring in north Greenland ( Gt a−1), equivalent to 60 % of the mass loss from the local glaciers during 2018–2021. The substantial loss of ice in northern Greenland has been attributed to changes in atmospheric circulation. A recent poleward shift of the atmospheric ridge during summer has resulted in advection of a southerly warm air mass into northern Greenland (Fettweis et al., 2013; Tedesco et al., 2016). The circulation changes have also resulted in increased cloudiness and subsequent atmospheric warming due to decreased longwave heat loss, which enhanced rapid snowline retreat and an increase in meltwater runoff by increasing absorption of shortwave radiation by dark bare ice (Noël et al., 2019).
Increased runoff from local glaciers and the ice sheet poses serious problems for communities in Greenland. For example, the outlet stream from Qaanaaq Glacier in northwestern Greenland flooded in the summers of 2015 and 2016, which destroyed the roads in the settlement of Qaanaaq (Kondo et al., 2021). The increases in runoff were attributed to intense glacier ablation and rainfall. The outlet stream further flooded in the summers of 2022 and 2023. According to local residents in Qaanaaq, similar events occurred in 1997, 2001, and 2009, since the establishment of Qaanaaq Airport in 1991 (Kim Peterson, personal communication, 2018). Another flood has been reported in 2012 at Watson River, an outlet river from the ice sheet in central–western Greenland (Mikkelsen et al., 2016). The flood was attributed to an extreme melt event over the Greenland ice sheet on 11 July 2012, when surface melt covered up to 98 % of the entire ice sheet (Nghiem et al., 2012; Mikkelsen et al., 2016; van As et al., 2017). Damage on a bridge was also reported by Kobbefjord Research Station in southwestern Greenland near Nuuk after a rain event in 2022 (Kobbefjord Research Station, 2022). These events indicate an urgent need to understand the mechanisms of the rapid increase in glacier runoff to make reliable projections of future floods and mitigate their effects. These floods have been linked to extreme climatic conditions. However, no investigations have been conducted on flood occurrence in Greenland prior to 2012. Therefore, it is not clear whether the frequency and magnitude of large runoff events have been increasing owing to the atmospheric warming in the Arctic in recent decades.
Long-term variations in surface melt and runoff from the Greenland ice sheet have been related to large-scale climate variability. Previous studies have identified a significant negative correlation between the North Atlantic Oscillation (NAO) mode of atmospheric circulation and surface melting of the ice sheet (Chylek et al., 2004; Box et al., 2012; Hanna et al., 2013). The negative phase of the summer NAO index increases the prevalence of high pressure centered on Greenland, which enhances ice surface melting due to clear-sky conditions and a decrease in snowfall (Box et al., 2012; Fettweis et al., 2013). This condition also causes warm air advection to western Greenland and results in extreme ice sheet melting events (Hanna et al., 2014; Tedesco et al., 2016). Since the NAO is an indicator of the atmospheric circulation over the North Atlantic, the Greenland Blocking Index (GBI) is used as a more specific indicator of the conditions over Greenland (Hanna et al., 2013, 2016). The GBI is defined as the mean of the 500 hPa geopotential height over Greenland at 60–80° N and 20–80° W, and represents the prevalence of anticyclonic conditions over Greenland. Thus, the GBI is negatively correlated with the NAO. The correlation of the GBI with summer warmth in Greenland is stronger than that of the NAO, and thus is considered a good predictor of Greenland runoff (Hanna et al., 2013; Ahlstrøm et al., 2017). The occurrence of extreme Greenland blocking episodes has been increasing in recent decades (McLeod and Mote, 2016), and has possibly affected long-term variations in glacier runoff in the coastal regions of Greenland. However, our understanding of glacier runoff and its link to climate is limited due to the lack of river discharge measurements. Previous studies of glacier runoff have primarily focused on southern Greenland, where continuous river discharge observations are available (Rennermalm et al., 2012; Hasholt et al., 2013; Ahlstrøm et al., 2017; van As et al., 2017). Long-term records of glacier runoff using such reliable in situ measurements are scarce in northern Greenland.
In this study, we conducted glacier runoff modelling of Qaanaaq Glacier in northwestern Greenland. Long-term runoff variations were reconstructed for 1950–2023 using a glacier energy–mass balance model and a climate reanalysis dataset calibrated by field and satellite observations. We analyzed the mechanisms and atmospheric drivers of the rapid increase in runoff that potentially leads to flooding in Qaanaaq. We also investigated the effect of synoptic-scale atmospheric circulation on the annual climatic mass balance and runoff in northwestern Greenland.
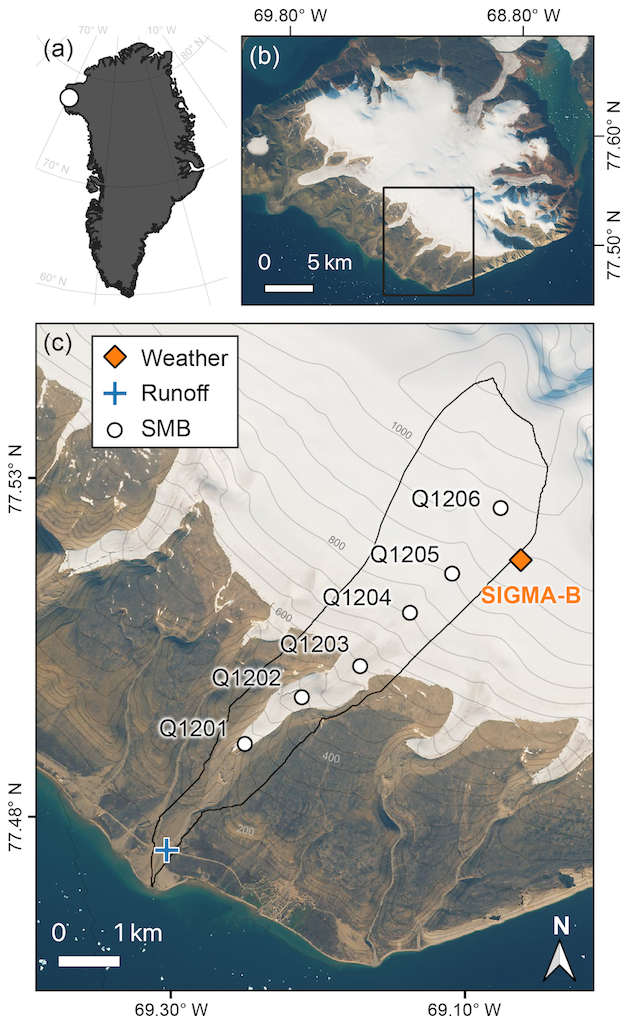
Figure 1(a) Location of the Qaanaaq region in Greenland. (b) Sentinel-2 image of Qaanaaq Ice Cap (21 August 2018), composed by SentinelFlow (v. 0.1.2). The black rectangle indicates the area shown in (c). (c) Sentinel-2 image of Qaanaaq Glacier (21 August 2018), showing the locations of the SIGMA-B weather station (diamond), runoff (cross) and surface mass balance (SMB) observations (circles). The black line shows the catchment of the outlet stream from Qaanaaq Glacier.
Qaanaaq Glacier is an outlet glacier from Qaanaaq Ice Cap in northwestern Greenland (77°28′ N, 69°14′ W; Fig. 1). The proglacial stream passes under a road connecting the settlement of Qaanaaq and Qaanaaq Airport, which is 2 km downstream from the glacier snout, before flowing into the ocean. Based on a digital elevation model (DEM) of ArcticDEM Mosaic, created by DEMs acquired within the period 2007–2022 (Porter et al., 2024), and a manually delineated glacier outline using Landsat 9 OLI-2 imagery (27 July 2023) show the catchment has a total area of 10.5 km2, of which 75 % is covered with ice from elevations of 230 to 1110 m a.s.l. (Fig. S1 in the Supplement).
Various studies have been conducted on Qaanaaq Glacier since 2012. The SMB has been measured since 2012 at six stake sites along the glacier flowline at elevations of 243–968 m a.s.l. (Sugiyama et al., 2014; Tsutaki et al., 2017) (Fig. 1c). The glacier-wide mass balance in 2012–2016 was and the mean equilibrium line altitude was 910 m a.s.l. (Tsutaki et al., 2017). An automatic weather station (AWS) was installed at the SIGMA-B site at 944 m a.s.l. on 19 July 2012 and has since been operational (Aoki et al., 2014a). A quality-controlled dataset of observed variables at SIGMA-B (air temperature, relative humidity, air pressure, wind speed and direction, radiation components and glacier surface height) is publicly available (Nishimura et al., 2023a).
Darkening of glacial ice has been reported in the middle reaches of Qaanaaq Glacier, causing a spatially variable surface albedo and melt rate (Sugiyama et al., 2014; Takeuchi et al., 2014). The darkening of Qaanaaq Glacier is attributed to impurities that are mainly cryoconite granules (Takeuchi et al., 2014), which grow in association with mineral particles on the glacier (Uetake et al., 2016). The minerals are supplied to the glacier surface by wind-blown deposition, as well as from englacial dust (Nagatsuka et al., 2016; Matoba et al., 2020).
3.1 Glacier energy–mass balance model
We calculated the glacier runoff using a glacier energy–mass balance model, GLIMB (e.g., Fujita and Ageta, 2000; Fujita and Sakai, 2014), which has been previously used for calculating the mass balance and runoff of various mountain glaciers (e.g., Sakai and Fujita, 2017; Khalzan et al., 2022; Minowa et al., 2023) and the Greenland ice sheet (Fujita et al., 2021). The model calculates the climatic mass balance based on the snow/ice melt rate, snowfall rate, evaporation rate, and refreezing rate of melt and rainwater. The surface energy balance (Q; in W m−2) was calculated as follows:
where α is the albedo (dimensionless), S is the downward shortwave radiation (W m−2), L is the downward longwave radiation (W m−2), ε is the longwave emissivity (assumed to be 0.98; dimensionless), σ is the Stefan–Boltzmann constant ( W m−2 K−4), and Ts is the surface temperature (°C) determined by an iterative calculation (Fujita and Ageta, 2000). The sensible (Hs) and latent (Hl) turbulent heat fluxes (W m−2) were estimated using a bulk aerodynamic method (Kondo, 1994). The conductive heat flux, (G; W m−2) was calculated from the temperature profile of the subsurface snow/ice computed within the model using the heat transfer equation (Fujita and Ageta, 2000). The energy flux toward the glacier surface was defined to be positive. The daily surface melt rate (M; m w.e. d−1) was calculated when the surface energy balance was positive as follows:
where td represents the length of a day in seconds (86 400 s), and ρw and lm represent the density of water (1000 kg m−3) and latent heat of fusion of ice (3.33×10⁵ J kg−1), respectively. On ice-free area, M represents snowmelt when snow cover was present.
The daily runoff depth (d; m d−1) was calculated as follows:
where Pr is the rainfall (m d−1), Ev is the evaporation rate on the glacier surface that is taken into account only if it is positive (i.e., condensation; m w.e. d−1), Rf is the refreezing rate (m w.e. d−1) calculated based on the subsurface snow/ice temperature profile (Fujita and Ageta, 2000), and RT is the retained liquid water within the snowpack given by the volumetric water content of the snow (Fujita and Ageta, 2000). The precipitation phase (snowfall or rainfall) was determined by assuming the probability of snowfall and rainfall depending on the air temperature (Fujita and Sakai, 2014). Daily river runoff (D; m3 s−1) was calculated using the daily runoff depth from the glacier (dg; m d−1) and ice-free terrain (df; m d−1) as follows:
where Ag and Af are the glacierized and ice-free areas within the catchment (m2) for the given elevation bin, z (Fig. S1), respectively.
The annual specific mass balance (b; m w.e. a−1) was obtained from the sum of the daily mass balance over a mass balance year as follows:
where Ps is the snowfall rate (m w.e. d−1) and t represents the days within the mass balance year. The glacier-wide annual mass balance (B; m w.e. d−1) was obtained by integrating the annual mass balance at elevation bins as follows:
The model input variables were air temperature, relative humidity, downward shortwave and longwave radiation, wind speed, precipitation, and temperature lapse rate. All variables were taken from the reanalysis dataset at daily time intervals. The influence of the strong nonlinearity of the Stefan–Boltzmann law on the temporal discretization is negligible in daily calculations compared with that in hourly calculations. The calculations were conducted for every day and 50 m elevation bins. We calculated the climatic mass balance within a mass balance year defined from 25 August (in the preceding year) to 24 August, based on the annual maximum (15 June) and minimum (24 August) in the averaged cumulative mass balance. Winter and summer mass balances were computed from 25 August (in the preceding year) to 15 June and 16 June to 24 August, respectively.
3.2 Meteorological reanalysis data
We used the ERA5-Land reanalysis dataset (grid spacing of 0.1° × 0.1°) produced by the European Centre for Medium-Range Weather Forecasts (Muñoz Sabater, 2019) as the input for GLIMB. The meteorological variables were calibrated by the observed variables at SIGMA-B during 2012–2020 (Nishimura et al., 2023a). To best represent the observations at SIGMA-B, linear regression equations were applied to the ERA5-Land dataset for air temperature, relative humidity, downward shortwave radiation, and wind speed (Fig. S2). After calibration, the air temperature in each 50 m elevation bin was calculated using the temperature lapse rate obtained from the daily ERA5 pressure level data (Hersbach et al., 2023a). We calculated the lapse rate by differentiating the air temperatures at 975 and 875 hPa geopotential heights. The elevations were equivalent to 285±80 and 1117±90 m (mean ± standard deviation) over the study period, respectively, which cover 95 % of the elevation range of Qaanaaq Glacier. The lapse rate calculated with this method was consistent with the observed lapse rate at Qaanaaq Glacier (Kondo et al., 2021) within 13 % difference.
The downward longwave radiation (L) was calculated as an elevation-dependent variable. L from ERA5-Land (LERA) is expressed by the Stefan–Boltzmann law as
where εeff is the effective atmospheric emissivity (van den Broeke et al., 2004; Ruckstuhl et al., 2007) and TERA is the air temperature from ERA5-Land. After calibrating the air temperature with SIGMA-B data (Tcalib) using a linear regression equation (Fig. S2a), the corresponding downward longwave radiation from ERA5-Land (Lcalib) is expressed as
We compared Lcalib with the observed L at SIGMA-B and corrected it with a linear regression equation in the same manner as the other meteorological variables (Fig. S2e). After correction, Lcalib was used to calculate L in each elevation bin (Lz) with the air temperature (Tz) being
A previous study noted an underestimation bias in precipitation in climate reanalysis data due to relatively coarse grid spacing that is difficult to resolve given the terrain effect on precipitation (Box et al., 2023). Precipitation is not observed at the SIGMA-B site, and thus we calibrated daily precipitation for ERA5-Land by applying a multiplier (rp) that was tuned to minimize the discrepancy between the modelled and measured glacier surface height at SIGMA-B from 2013 to 2019 by iterative calculations. Surface height was calculated by assuming fresh snow density and snow densification parameters that were optimized using a Monte Carlo simulation in a previous study to best reproduce the observed snow surface height and albedo in the accumulation zone of the northwestern region of the Greenland ice sheet (Fujita et al., 2021). The performance was evaluated with the mean error (ME) between the modelled and observed surface height.
ERA5 reanalysis data were also used to analyze the synoptic-scale climatic conditions (grid spacing of 0.25° × 0.25°). We used the daily precipitation, surface air temperature, and vertically integrated water vapor transport from the ERA5 single-level data (Hersbach et al., 2023b), as well as the 500 hPa geopotential height and air temperature and wind speed at 850 hPa geopotential height from the ERA5 pressure-level data (Hersbach et al., 2023a). To better resolve the spatial patterns of precipitation with finer scales, we also analyzed the Copernicus Arctic Regional Reanalysis (CARRA) (Schyberg et al., 2020), which is available at a spatial resolution of 2.5 km, focusing on periods of particularly high runoff. The CARRA reanalysis was also used as a higher-resolution reference to evaluate the performance of precipitation variability represented in ERA5-Land.
3.3 Glacier surface albedo
Snow surface albedo was calculated with the scheme of Kondo and Xu (1997), which assumes an exponential reduction of snow albedo with time after a fresh snowfall. We utilized parameters optimized by a Monte Carlo simulation in the previous study in northwestern Greenland (Fujita et al., 2021). We modified the fresh snow albedo to 0.7 instead of the optimized value of 0.897, based on the snow surface albedo observed by SIGMA-B (Nishimura et al., 2023a).
The bare ice albedo of Qaanaaq Glacier is spatially variable, depending on the altitude due to ice darkening. To consider the spatial variability, we measured the bare ice albedo using satellite imagery at the six stake sites and the SIGMA-B site (Fig. 1c). We analyzed Landsat 8 OLI surface reflectance imagery using Google Earth Engine. The total shortwave albedo was calculated from the previously proposed conversion formulae using narrowband reflectance measurements (Liang, 2001). We analyzed 146 images acquired during 2013–2023 with a cloud coverage of <10 %. Pixels covered with clouds or cloud shadows were eliminated using the quality assessment band provided in the Landsat 8 dataset. Radiometric saturation was also detected and eliminated using the saturation quality assessment band. The filtered images were manually inspected to ensure the remaining pixels were not covered with clouds or cloud shadows. We used the mean albedo values after the disappearance of the snow cover to use representative value for bare ice albedo. Albedo measured by the satellite at the SIGMA-B site was compared with that observed by the SIGMA-B AWS (Fig. S3). The comparison showed agreement between the two observed values, with a root-mean-square error (RMSE) of 0.07 and ME of 0.06, which indicate there is an overestimation bias in the satellite-derived surface albedo. The bias was eliminated by applying a linear regression correction (Fig. S3g), and this albedo was subsequently used for GLIMB. After the bias correction, RMSE between the two observations was 0.02.
3.4 Validation data
In situ glaciological and hydrological data at Qaanaaq Glacier were used to validate GLIMB. We used the annual SMB data obtained during 2012–2016, which cover four mass balance years (Tsutaki et al., 2017). Runoff observations of the outlet stream from Qaanaaq Glacier were used to validate the glacier runoff calculations. The runoff was measured in the summer periods during 2017–2019 at 1.4–2.0 km from the glacier terminus (Mankoff et al., 2020; Kondo et al., 2021).
3.5 Return period of the annual maximum runoff
We analyzed the return period of the calculated annual maximum daily runoff based on probability exceedance. The annual maximum values were fitted to the two-parameter Gumbel distribution (Gumbel, 1941). The parameters of the probability distribution function were estimated with the probability-weighted moments method (Greenwood et al., 1979). The goodness of the fit was evaluated with the probability plot correlation coefficient (PPCC) (Vogel, 1986). The result confirmed that PPCC >0.97, indicative of significance at the 95 % level for the given number of samples.
4.1 Model performance
As a result of tuning, the precipitation multiplier, rp, was determined to be 1.41. The multiplier was consistent with that from a previous study in Greenland, which was reported to be rp=1.4, based on rainfall measurements on the ice sheet compared with ERA5 data (Box et al., 2023). The calculated surface height at the SIGMA-B site captures the observed variations with a RMSE and ME of 0.19 and 0.12 m, respectively (Fig. S4a). The surface albedo also exhibited a good agreement with the observations (RMSE and ME of 0.07 and 0.01, respectively) (Fig. S4b). The time-series of the calibrated daily precipitation from ERA5-Land was further compared with that from the CARRA reanalysis dataset (Fig. S5). Although extreme precipitation events (>60 mm d−1) were not reproduced in ERA5-Land, overall performance exhibited good agreement with RMSE of 2.1 mm. The comparison indicates that the precipitation variability is well captured in the calibrated ERA5-Land precipitation, even when compared with the higher spatial resolution dataset.
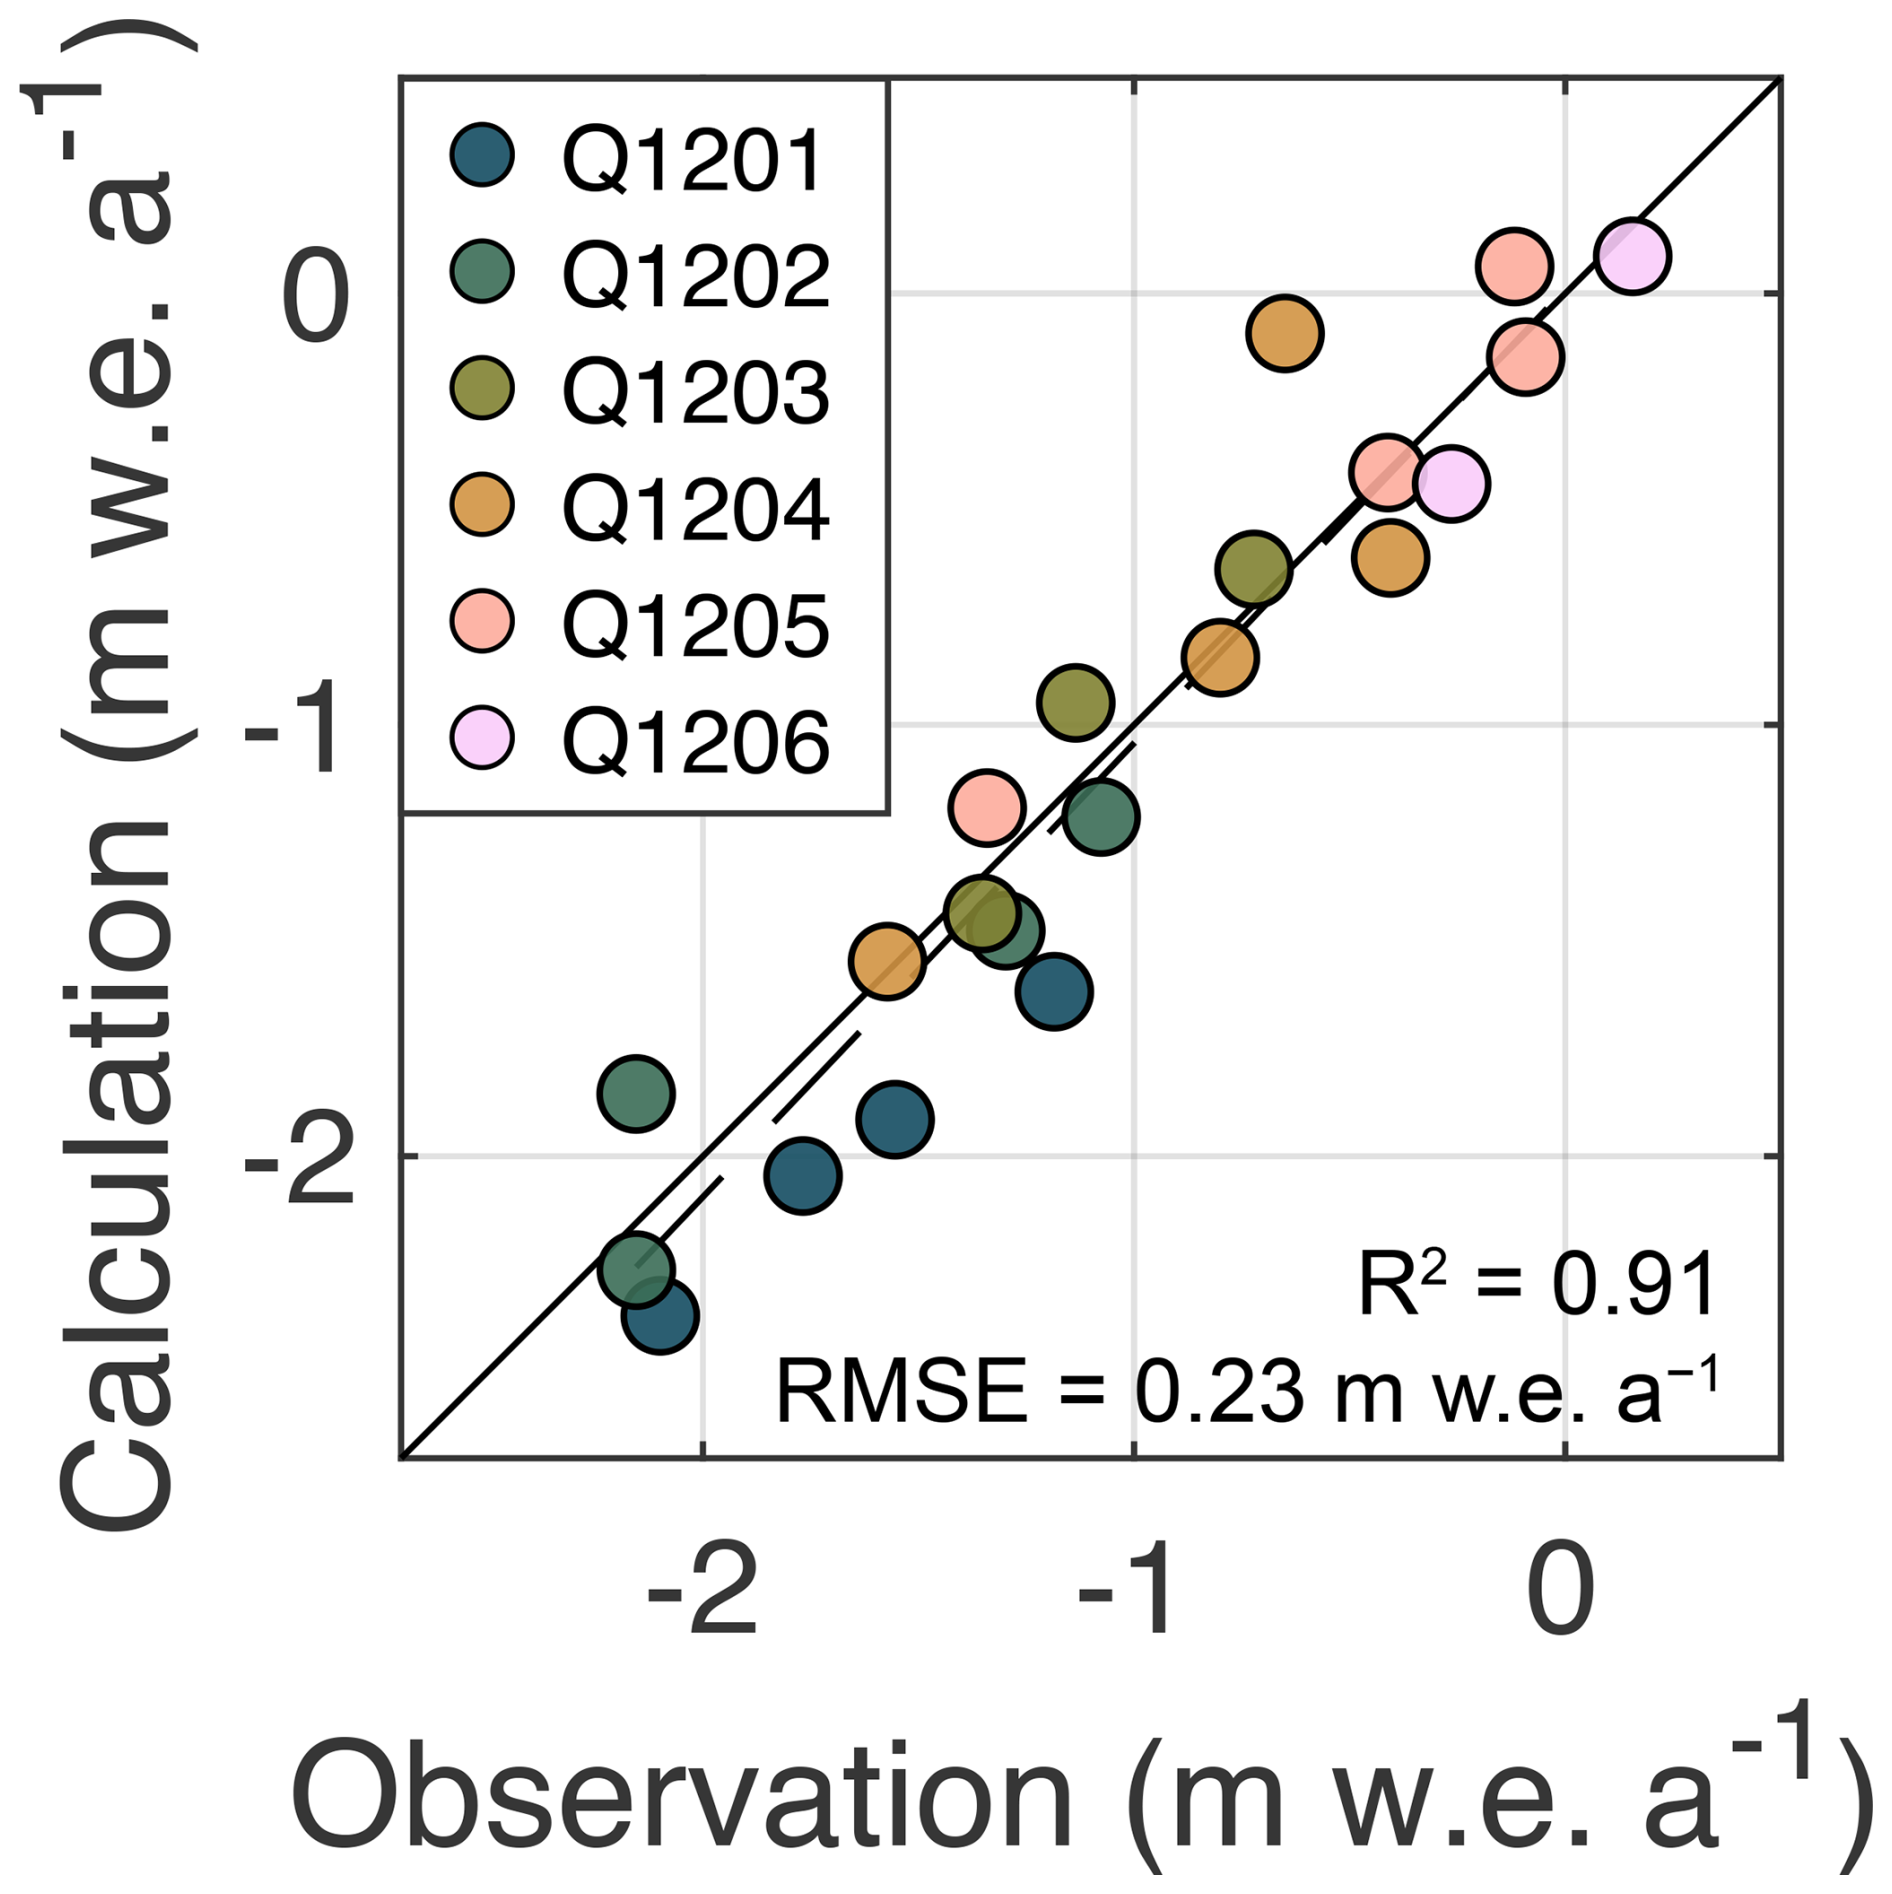
Figure 2Observed versus calculated surface mass balance in 2012–2016. The colors indicate stake sites (Fig. 1c). The dashed line indicates a linear regression through the data. The coefficient of determination of the regression (R2) and RMSE between the calculated and observed surface mass balance are also shown.
The calculated climatic mass balance was compared with the observations made on the glacier during 2012–2016 (Fig. 2). The calculated annual SMB at each site ranged from −2.37 to 0.09 , which agrees with the range of observed SMBs (−2.15 to 0.16 m w.e. a−1). The spatiotemporal variations in SMB were well reproduced with the RMSE between the calculated and observed SMB of 0.23 , indicating a sufficiently good performance for reconstructing the glacier variability. Substantially negative SMBs of below −1.5 were also well reproduced with a RMSE of 0.25 (13 % of the mean), indicating good agreement even during periods of intense ablation.
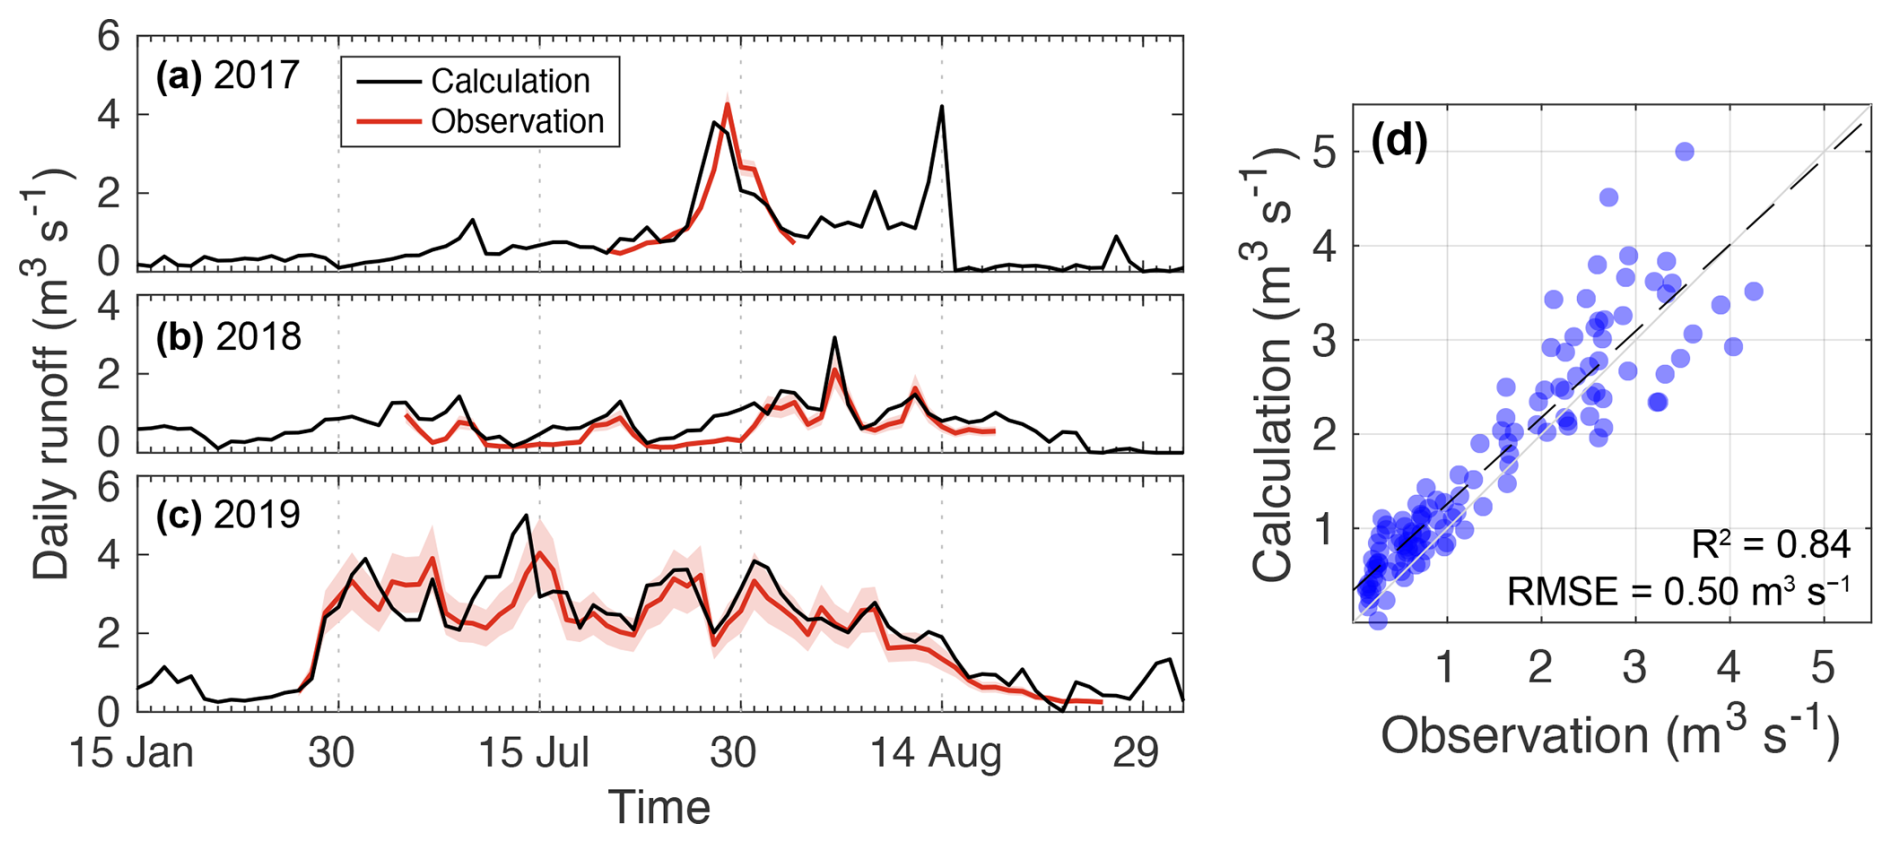
Figure 3(a–c) Calculated (black) and observed (red) daily runoff with uncertainties (shading) for Qaanaaq Glacier in the summers of 2017–2019. (d) Observed versus calculated daily runoff. The dashed line is a linear regression of the data. The coefficient of determination of the regression (R2) and RMSE between the calculated and observed runoff are also shown.
The calculated glacier runoff agreed well with the observed proglacial discharge (Fig. 3). The Nash–Sutcliffe coefficient (Nash and Sutcliffe, 1970) of the calculated glacier runoff versus the observed discharge was 0.80, which is well above the threshold values proposed for accurate hydrological models (Moriashi et al., 2007). The RMSE between the calculated and observed runoff was 0.50 m3 s−1. The model tends to overestimate smaller runoffs (Fig. 3d), resulting in an overall ME of 0.22 m3 s−1. The calculated runoff agreed well with the observed seasonal variability in runoff, including the initiation and cessation of summer runoff, which was particularly well captured by the hydrograph in 2019 (Fig. 3c). The rapid increase in daily runoff on 29 July 2017 was also reproduced by the model (Fig. 3a), suggesting the calculations can be used to investigate periods of high runoff. Although we did not apply a routing model to calculate the discharge time-series, the results were reliable. This is consistent with a previous hydrological study conducted on Qaanaaq Glacier (Kondo et al., 2021) as well as Arctic glaciers (Hodgkins, 1997), which suggested a relatively short routing delay caused by the supraglacial stream rather than draining into the glacier bed. This delay is crucial in reproducing the hourly time-series of the hydrograph (Kondo et al., 2021), but is not significant for the daily runoff modelling conducted in this study.
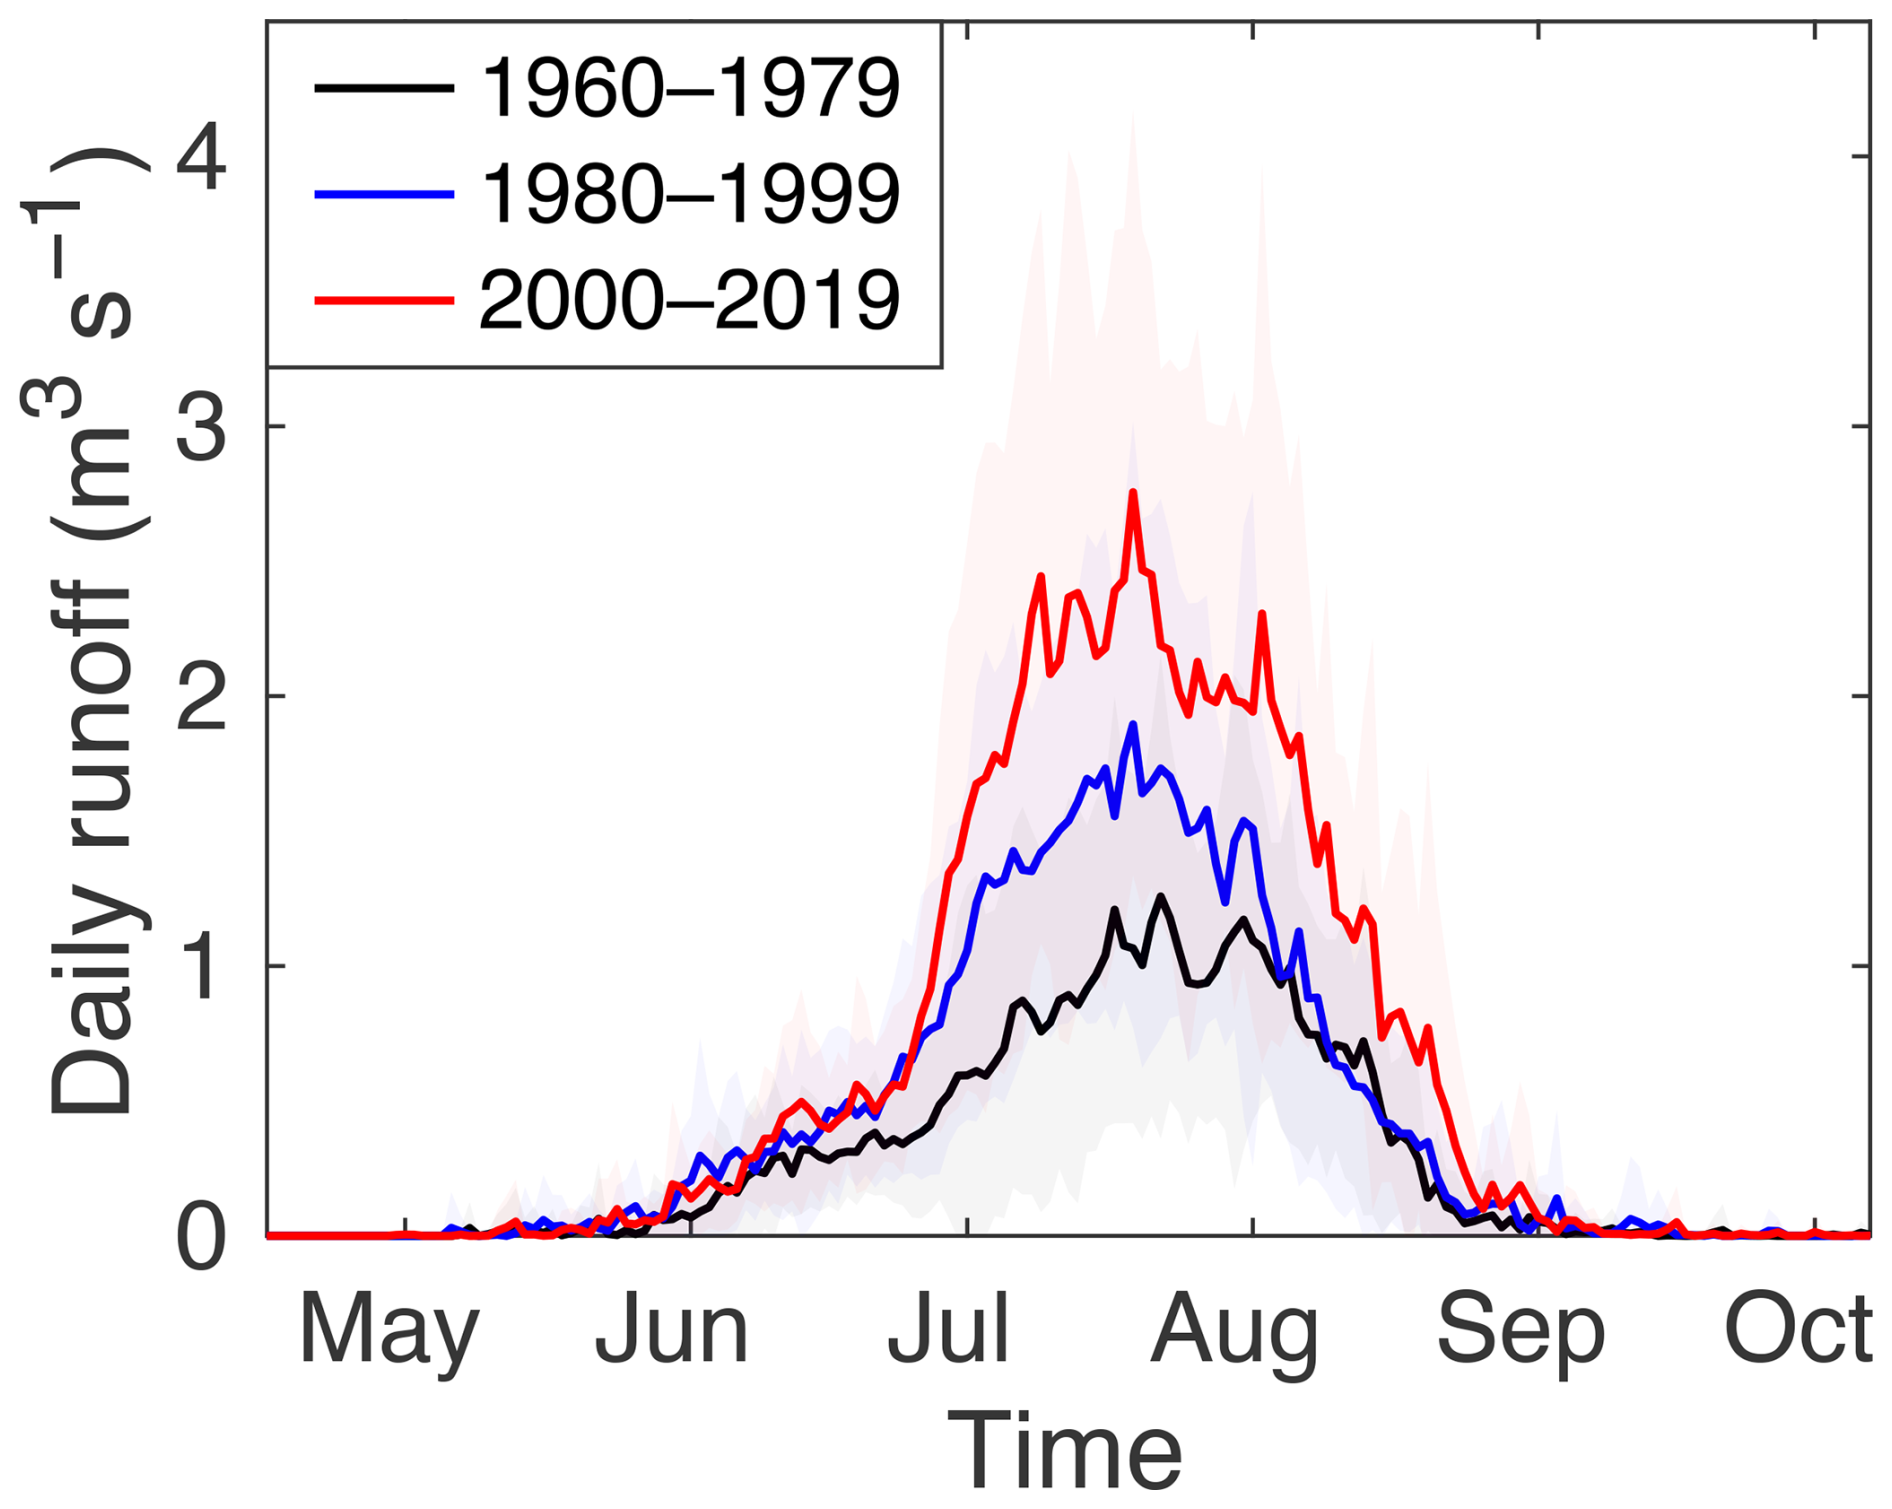
Figure 4Daily runoff averaged for the periods 1960–1979 (black), 1980–1999 (blue), and 2000–2019 (red). The shading represents one standard deviation for the corresponding period.
4.2 Daily and seasonal runoff
GLIMB with calibrated variables was used to calculate the daily runoff of Qaanaaq Glacier during 1950–2023. The daily values in summer (June, July, and August) averaged 0.9 m3 s−1. The runoff typically increases from mid-May to mid-July, and decreases from early August, with the mean number of runoff days being 108±11 (with one standard deviation) (Fig. 4). Hydrographs averaged over 20-year intervals showed an increase in runoff from 1960 to 2020. Mean daily runoff in the summer period increased from 0.6 m3 s−1 in 1960–1979 to 0.8 and 1.2 m3 s−1 in 1980–1999 and 2000–2019, respectively, indicating a 2.1-fold increase over 60 years. The mean number of runoff days increased by 16 % from 1960–1979 (100±7 d) to 2000–2019 (116±11 d).
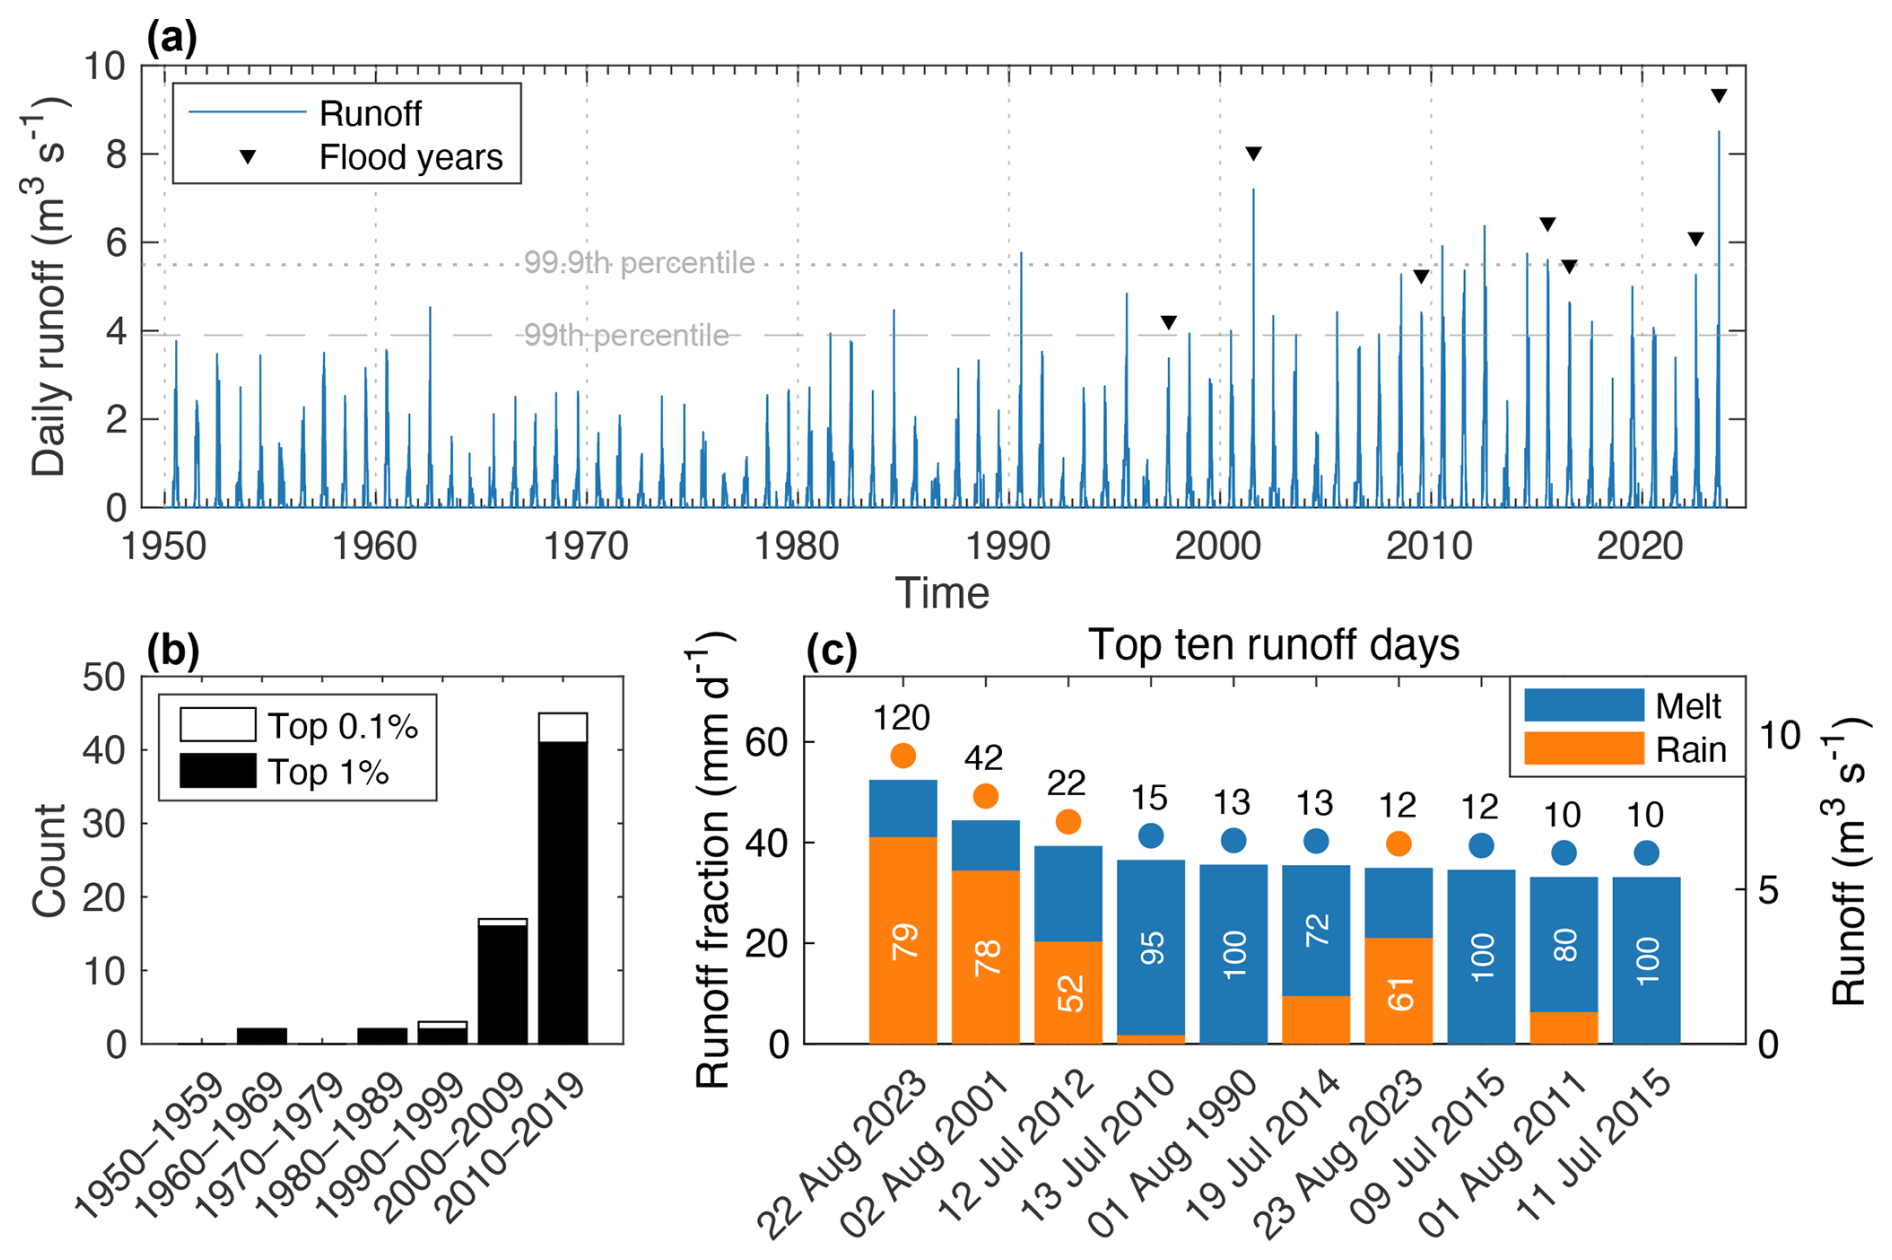
Figure 5(a) Calculated daily runoff (blue line). Inverted triangles indicate flood events at Qaanaaq. The horizontal dashed and dotted lines are the 99th and 99.9th percentiles of non-zero daily runoff, respectively. (b) Histogram of the calculated daily runoff exceeding the 99th (black) and 99.9th (white) percentiles for the decadal periods. (c) Runoff depth on the 10 largest runoff days showing the percentage contributions of glacier melt (blue) and rainfall (orange). The colors of the circles and white numbers represent the dominant component and its percentage contribution, respectively. The numbers above the circles indicate the return period (years) of the daily runoff.
A long-term time-series of daily runoff shows multi-decadal variations in the occurrence of high runoff (Fig. 5a). A relatively high annual maximum runoff was obtained for 1950–1962, which was followed by consistently lower runoff during 1963–1979, with daily runoff never exceeding the 99th percentile (3.9 m3 s−1) (Fig. 5a). Thereafter, runoff increased gradually in recent decades, resulting in a 1.7-fold greater mean annual maximum since 1990 as compared with the prior period. Exceptionally large runoff events exceeding the 99.9th percentile (5.5 m3 s−1) have all occurred since 1990 (Fig. 5a and b). Furthermore, the frequency of such events increased even more after 2000, with 91 % and 88 % of days exceeding the 99th and 99.9th percentiles, respectively (Fig. 5b). These runoff peaks were triggered by both rainfall and melt, indicating a range of factors contributing to each event (Fig. 5c).
The largest daily runoff over the past 74 years was calculated for 22 August 2023 (8.5 m3 s−1), and was >3σ above the mean annual maximum (Fig. 5a and c). The value had a return period of 120 years, exceeding the 100-year runoff event threshold (8.3 m3 s−1) (Fig. S6). The second largest runoff was calculated for 2 August 2001 (7.2 m3 s−1) and was >2σ above the mean annual maximum. These two high-runoff days coincided with the destruction of roads in Qaanaaq Village, demonstrating clear evidence of substantial societal effects. Heavy rainfall occurred on these two largest runoff days (43 and 37 mm d−1 over the catchment in 2023 and 2001, respectively), which accounted for 79 % and 78 % of the runoff on these 2 d, respectively (Fig. 5c). The third largest daily runoff was equivalent to 6.4 m3 s−1 on 12 July 2012 during a period of extreme surface melting over the Greenland ice sheet (Nghiem et al., 2012; Fausto et al., 2016). While this event is known to have resulted in significant surface melting and runoff from the ice sheet, approximately half of the daily runoff (52 %) was attributed to rainwater on Qaanaaq Glacier (Fig. 5c). On the same day, rainfall was observed by an in situ field campaign at the SIGMA-A site (1490 m a.s.l.) located on the Greenland ice sheet, 65 km inland from Qaanaaq Glacier (Aoki et al., 2014b). Rainfall was estimated as 100 mm during 10–14 July 2012 based on the ERA-Interim reanalysis data corrected by in situ bucket measurements (Niwano et al., 2015). The fourth, fifth, and sixth largest daily runoffs were calculated to have occurred on 13 July 2010, 1 August 1990, and 19 July 2014, with values of 5.9, 5.8, and 5.7 m3 s−1, respectively. The bulk of these daily runoff events was derived from glacier melt (95 %, 100 %, and 72 %, respectively).
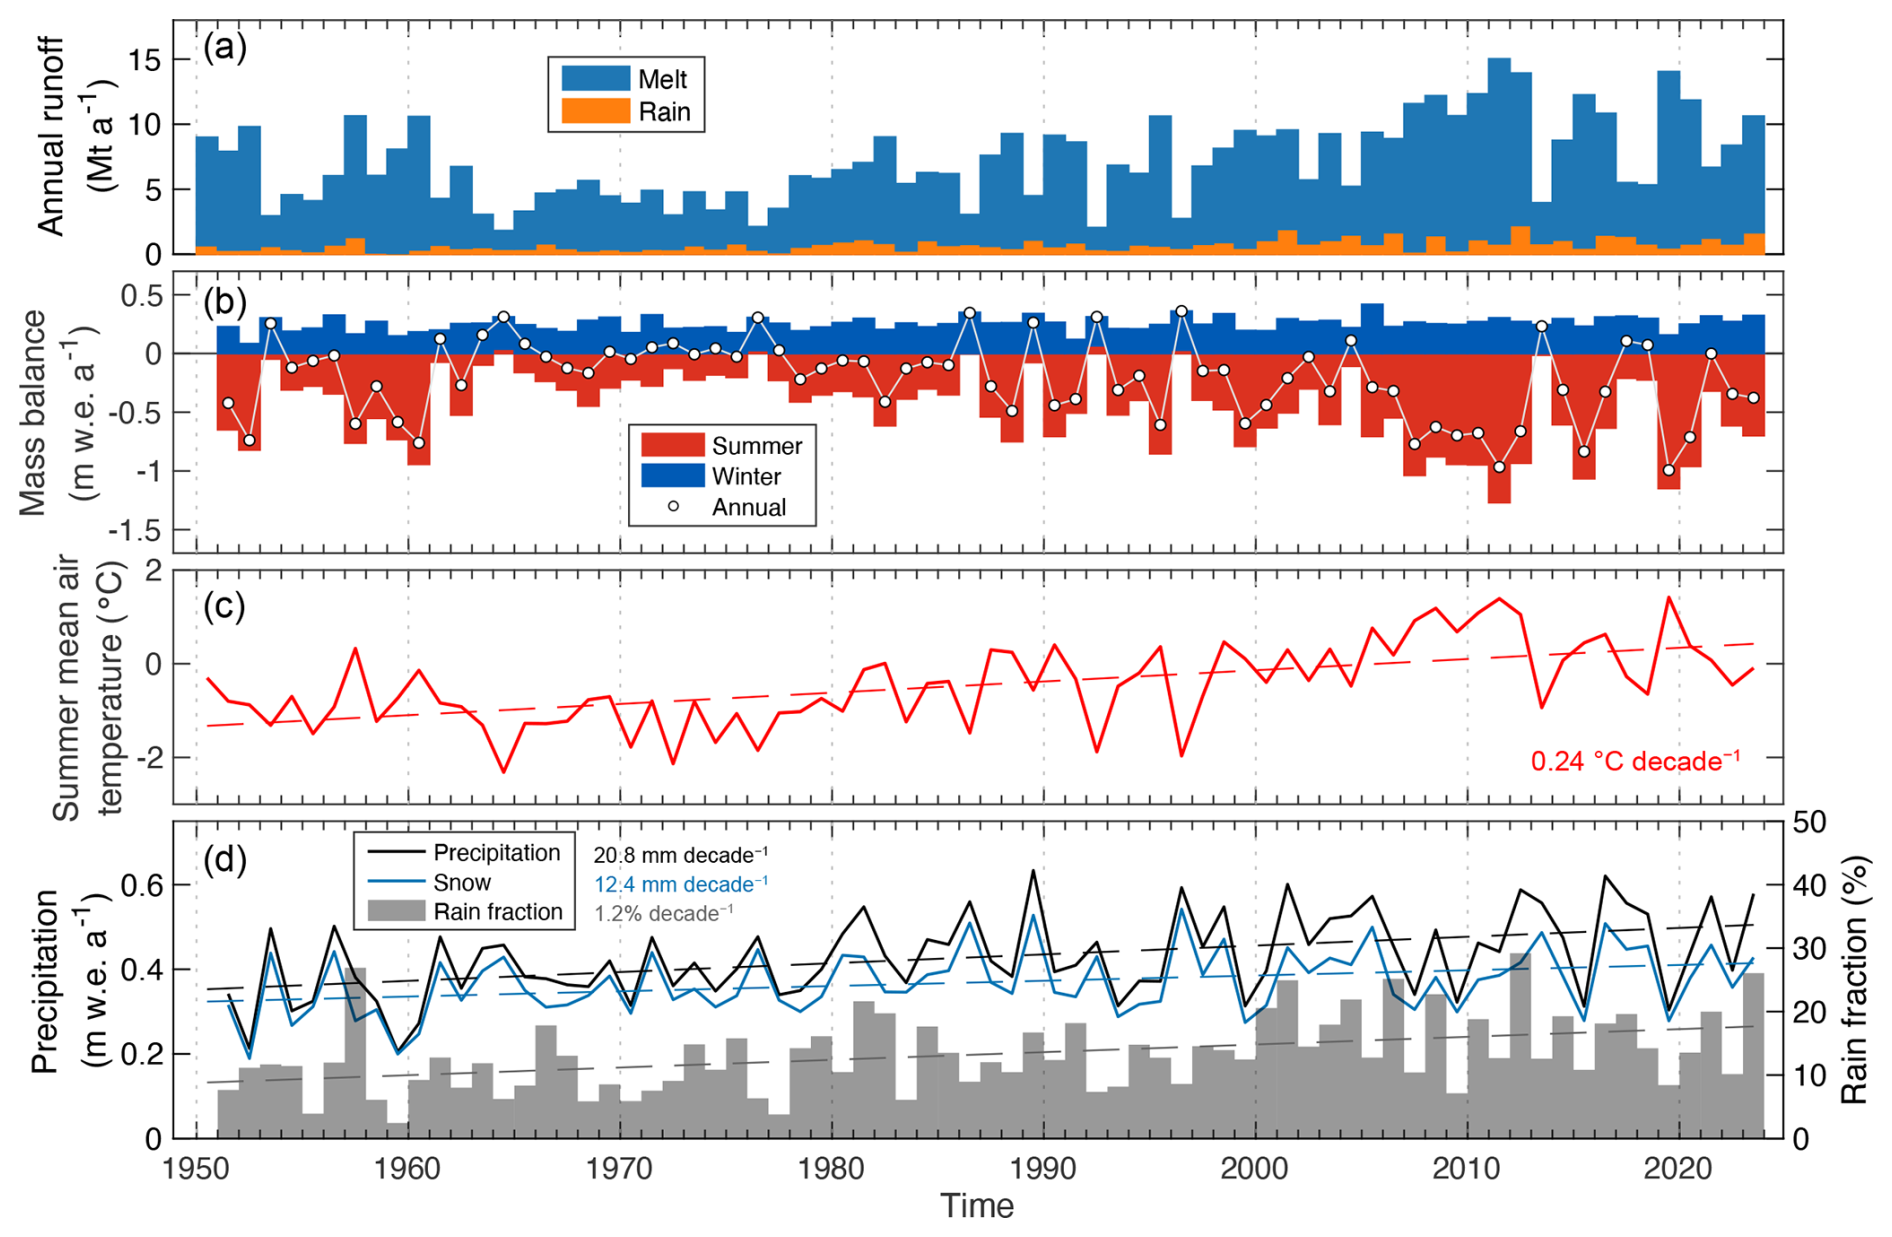
Figure 6(a) Annual runoff and the contribution of snow/ice melt (blue) and rain (orange). (b) Calculated glacier-wide summer (red), winter (blue), and annual (dot) mass balances. (c) Summer mean air temperature at the SIGMA-B site taken from ERA5-Land. (d) Precipitation (black), snowfall (light blue), and rain fraction (bars) averaged over the catchment. The dashed lines in (c) and (d) are linear regressions of the data with p<0.01. The trend slope of the regression is also shown.
4.3 Annual runoff and glacier mass balance
Long-term annual runoff variations are predominantly determined by snow/ice melt, with the contribution from rainfall being consistently low (mean of 12 %) (Fig. 6a). The interannual variability of the annual runoff exhibits a standard deviation of 3.2 Mt a−1, equivalent to 44 % of the average (7.1 Mt a−1). The largest and second largest annual runoff were calculated for 2011 and 2019 with values of 15.0 and 14.0 Mt a−1, respectively, coinciding with high summer mean air temperatures (1.4 °C at SIGMA-B for both years). The annual variations exhibited patterns similar to those of the annual maximum daily runoff, characterized by relatively high values in the 1950s, lower values in the 1960s and 1970s, and a subsequent increase in the following decades (Fig. 6a). An increasing trend of annual runoff during 1965–2023 (0.12 Mt a−2; p<0.001) was associated with warming air temperatures in the same period (0.33 °C per decade) (Fig. 6c). The annual variations were also characterized by substantially suppressed runoff, including the five lowest values in 1964, 1992, 1976, 1996, 1953 (Fig. 6a).
The variations in annual glacier runoff are well explained by the summer glacier mass balance, as indicated by their high correlation (r=0.96; p<0.001) (Figs. 6a, b, and S7). For example, relatively high runoff during 1957–1960 coincided with negative summer mass balance. This period corresponded with the years when the summer mean temperature remained near average (Fig. 6c), while precipitation was substantially reduced (Fig. 6d), suggesting snowfall was important for summer glacier ablation and runoff by modulating glacier surface conditions during the ablation season. An increasingly negative summer mass balance during 1965–2023 (−0.10 m w.e. a−1 per decade) explains the increase in annual runoff during this period. Suppressed annual runoff, including the five lowest values (Fig. 6a), corresponded with a glacier mass budget surplus (Fig. 6b) due to the low summer air temperatures and/or greater snowfall (Fig. 6c and d).
The average annual climatic mass balance was −0.21 with a standard deviation of 0.33 for the period 1951–2023. The most negative mass balance was −0.99 in 2019 and the most positive was 0.36 in 1996. The annual mass balance showed similar variations as the summer mass balance, having a significantly higher correlation (r=0.99; p<0.001) than with the winter mass balance (r=0.33; p<0.01) (Fig. S7). The annual mass balance was also correlated with the summer mean air temperature (; p<0.001) and snowfall within the mass balance year (r=0.56; p<0.001). After the mass loss in 1957–1960 and mostly positive mass balance in 1961–1965, the annual mass balance decreased at a rate of −0.09 m w.e. a−1 per decade by 2023 due to the increasingly negative summer mass balance. As a result of the mostly negative mass balance throughout the study period, the cumulative mass loss has been 15.7 m w.e. when averaged over the entire glacier.
The contribution of rainfall to the annual runoff was consistently low over the entire period. Overall, total precipitation has been increasing over the past 74 years at a rate of 20.8 mm per decade (Fig. 6d). This rate exceeds that of snowfall (12.4 mm per decade), and thus the rain fraction of the total precipitation has been increasing at 1.2 % per decade. As a result, rainfall exhibited a 2.2-fold increase from 1951–1960 to 2010–2020. No significant correlation was found between the annual runoff and total precipitation (; p>0.05), but a weak correlation was observed with rainfall (r=0.31; p<0.01) and snowfall (; p<0.05) (Fig. S7). The negative correlation with snowfall suggests suppressed/enhanced glacier runoff coincided with greater/less snowfall.
5.1 Synoptic controls on high daily runoff
Our results demonstrate that the frequency and magnitude of large daily runoff have been increasing significantly since 2000 (Fig. 5a and b). These runoff events were driven by both rainfall and glacier melt, with the top three daily runoff events being caused primarily by rainfall (Fig. 5c). The two largest runoff events resulted in the destruction of roads in Qaanaaq, which highlights the importance of understanding the mechanisms of such events. We note that not all the flood events observed in Qaanaaq were related to a large runoff (Fig. 5a). For example, a moderate runoff (3.4 m3 s−1) was calculated on the day of a flood in 1997 observed by the local residents, which was close to the mean annual maximum of 3.3 m3 s−1. This unclear relationship is due to the complexity of flood occurrence, which is not only related to runoff magnitude, but also infrastructure vulnerability. We also note that our model may not adequately reproduce thick firn formed prior to 1950, and ice layers within the firn, which can impede downward water infiltration and thereby facilitate runoff from the accumulation area (Machguth et al., 2016; Mikkelsen et al., 2016). These complex supraglacial hydrological processes may partly explain the unclear relationship between flood occurrence and the runoff magnitudes.
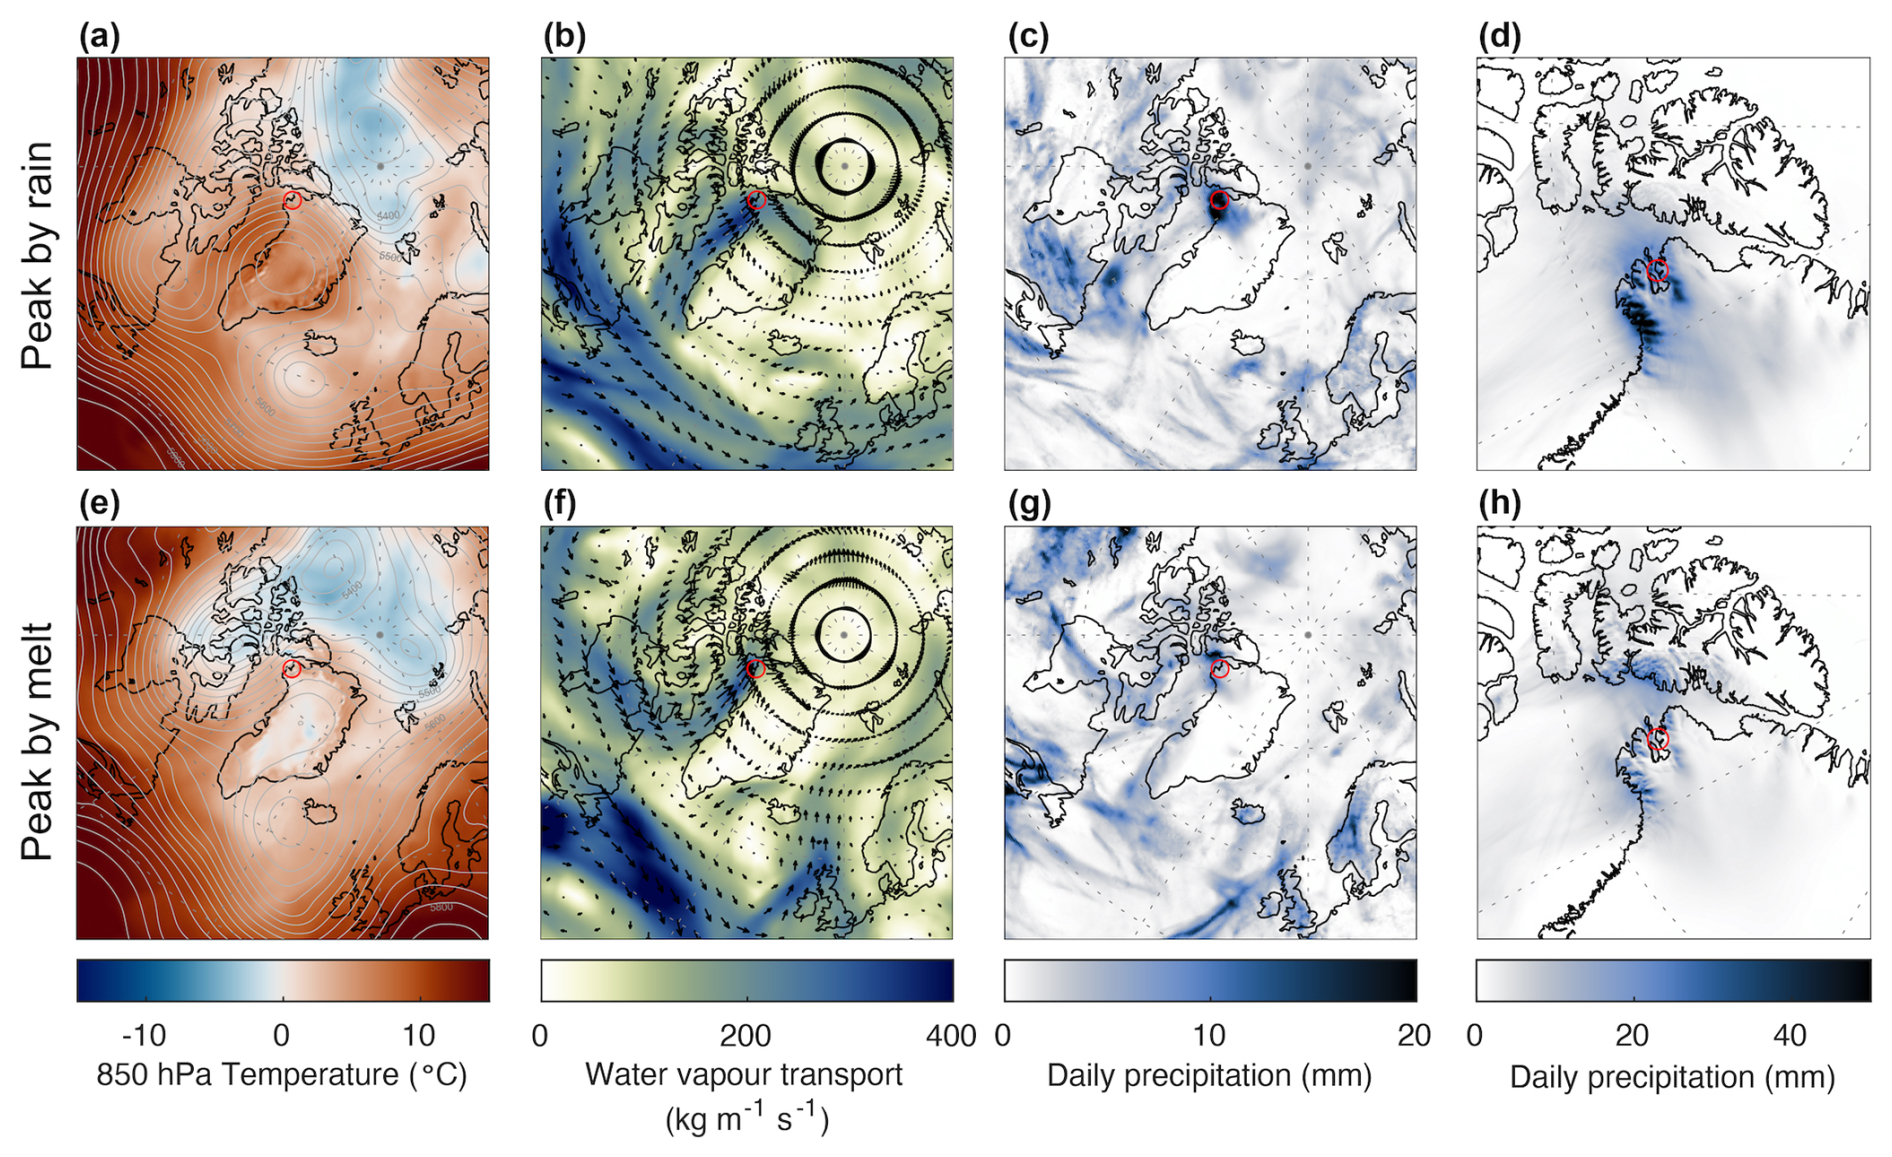
Figure 7Composites of the ERA5 reanalysis data during the three largest runoff days caused by (a–c) rain and (e–g) glacier melt. Composites of the CARRA reanalysis data for the same days were also shown (d, h). (a, e) Air temperature at 850 hPa geopotential (color) and 500 hPa geopotential height (gray contours). (b, f) Vertically integrated water vapor transport (color) and wind vectors at 850 hPa geopotential (arrows). (c, g) Daily precipitation from ERA5. (d, h) Daily precipitation from CARRA. The red circles indicate the location of Qaanaaq.
To identify the mechanisms of the particularly high peak runoff, we analyzed the atmospheric conditions during the top-ranked runoff days. We extracted top three days for which more than half of the runoff originated from rainwater (22 August 2023, 2 August 2001, and 12 July 2012) (Fig. 5c). For the extracted days, we created composites for the daily atmospheric reanalysis of the 500 hPa geopotential height, air temperature and wind speed at 850 hPa geopotential, vertically integrated water vapor transport, and precipitation (Fig. 7a–d). The results showed that an atmospheric ridge centered over Greenland strengthened southerly warm air advection onto the northern ice sheet, which delivered considerable water vapor to northwestern Greenland along Baffin Bay (Fig. 7a and b). In northwestern Greenland, the wind was directed toward the inland part of the ice sheet, as indicated by the pressure contour that crosses the Greenlandic coastline from west to east (Fig. 7a and b), where the location corresponds to the intense precipitation at Qaanaaq. The rainfall reached 23 mm d−1 in the composite from ERA5 (Fig. 7c), which was twice the average annual maximum intensity. The precipitation patterns were further resolved by CARRA reanalysis dataset with a finer spatial resolution, showing intensive precipitation exceeding 60 mm d−1 along the coast of the northwestern part of the ice sheet, including 28 mm of daily precipitation at Qaanaaq (Fig. 7d). From the ERA5 dataset, the air temperature at 850 hPa geopotential height (∼1400 m a.s.l.) was >2.9 °C at the nearest grid to Qaanaaq for all the analyzed days. The results suggest warm and humid air transported from the south caused heavy rainfall as a result of orographic uplift, given the geometry of the ice sheet and local ice caps located along the coast.
Exceptionally strong moisture transport to northwestern Greenland was observed on the largest runoff day of 22 August 2023. Concentrated poleward water vapor transport exceeding 600 kg m−1 s−1 was identified for >1500 km along Baffin Bay, due to the strong wind (>20 m s−1 at an 850 hPa geopotential), enhanced by low- and high-pressure systems located over the Canadian Arctic Archipelago and Greenland, respectively (Fig. S8a and b). The moisture transport resulted in the substantial rainfall and runoff at Qaanaaq (Fig. S8c). This feature is consistent with atmospheric river formation, which is defined as a narrow band of strong water vapor transport exceeding 150 kg m−1 s−1 (Mattingly et al., 2018). Strong moisture transport exceeding 150 kg m−1 s−1 was also observed during the other rain-induced peak runoffs on 2 August 2001 and 12 July 2012, suggesting atmospheric river contributed to rainfall events in Qaanaaq. An atmospheric river resulted in light rain (3.4 mm) at Summit station on the Greenland ice sheet in the summer of 2021 (Box et al., 2022), as well as extreme melting events over the Greenland ice sheet, such as in 2012 (Neff et al., 2014; Fausto et al., 2016). Together with the recent increase in the activity of atmospheric rivers over Greenland (Mattingly et al., 2016, 2018), our results highlight the importance of such extreme climatic conditions for flood occurrence in northern Greenland.
We next investigated the conditions required for the peak runoff caused by glacier melt. Weather conditions were analyzed for the top three melt-induced peak runoff events (13 July 2010, 1 August 1990, and 19 July 2014) (Fig. 5c). The surface energy balance calculations indicate a substantial increase in the sensible heat flux during these melt events, reaching an average of 137 W m−2. The contribution was twice greater than that from net shortwave radiation (61 W m−2) on these days, which differs from the typical conditions during the annual maximum runoff, when the shortwave radiation (72 W m−2) was 1.7 times greater than the sensible heat (43 W m−2). Net longwave radiation was also larger during the melt-induced peak runoff (3 W m−2) than the period averaged for the annual maximum (−10 W m−2). From the ERA5-Land reanalysis data taken from the nearest grid to SIGMA-B, strong winds (mean of 8.9 m s−1) and a high mean air temperature (4.4 °C) were obtained for the glacier, suggesting warm and strong winds with cloudy conditions resulted in the elevated sensible heat flux. The weather and heat conditions are similar to the situation during the flood event in Qaanaaq during the summer of 2015, which caused intense melt of Qaanaaq Glacier (Kondo et al., 2021).
To investigate the atmospheric conditions that led to intense glacier ablation, composites of the three largest melt-induced runoff days were created for the atmospheric variables in the same way as for the rain-induced runoff (Fig. 7e–h). Similar to the periods of rain-induced peak runoff, relatively high pressure was located over Greenland. Additionally, low-pressure trough was located over the Canadian Arctic Archipelago (Fig. 7e). This pressure pattern resulted in a warm southerly air flow toward Qaanaaq along Baffin Bay, resembling the wind pattern during the rain-induced runoff events (Fig. 7f). As a result, the composite means of wind speed and air temperature at 850 hPa geopotential height reached 15.8 m s−1 and 2.9 °C, respectively, at Qaanaaq. The southerly contains considerable amounts of water vapor (Fig. 7f), but not much precipitation was observed at Qaanaaq (mean of 3.1 and 8.8 mm d−1 from ERA5 and CARRA, respectively) (Fig. 7g and h). This is because the wind vector was directed toward Ellesmere Island in the Canadian Arctic Archipelago, where daily precipitation reached 21 and 36 mm d−1 from ERA5 and CARRA reanalysis, respectively. Therefore, dominant influences from the low-pressure system in the Canadian Arctic resulted in strong and warm winds, but less precipitation at Qaanaaq.
The foregoing analysis shows there were similar atmospheric conditions for both the rain- and melt-induced peak runoff events, characterized by the transport of warm and humid air mass from the south along the western coast of Greenland. Previous studies showed that the maximum latitude of the high-pressure ridge over Greenland shifted poleward during recent summer periods, which increased ice sheet runoff in more northern regions of Greenland (Fettweis et al., 2013; Tedesco et al., 2016). Our results demonstrate that such atmospheric conditions are important not only for the mass balance of the ice sheet, but for the occurrence of peak runoff potentially leading to flooding on the coast of northwestern Greenland. Furthermore, the northwestern region has been identified as the area experiencing the greatest increase in rainfall in Greenland, given the four-fold increase over the period 1980–2019 (Niwano et al., 2021). Although no trend has been reported for extreme rainfall intensity in the northern region, care should be taken for monitoring rainfall associated with the changes in the atmospheric circulation that favors warm air transport into northern Greenland.
5.2 Climatic controls on glacier mass loss
Our mass balance estimates for Qaanaaq Glacier were compared with the previously reported glacier-wide elevation changes measured by satellite. Elevation change rates on Qaanaaq Glacier, as obtained by laser altimetry (Khan et al., 2022), were and (assuming an ice density of 890 kg m−3) during 2003–2009 and 2008–2019, respectively, which are consistent with our modelling results during these periods (−0.46 and −0.37 m w.e. a−1). Another study reported a value of for 2010–2020 based on DEMs (Hugonnet et al., 2021), which is also consistent with our calculated value of −0.43 . The good agreement of the results with the geodetically derived mass loss confirms that our results quantitatively capture the key variations in Qaanaaq Glacier, although we assumed a fixed altitude–area distribution. We assessed the effect of the assumption of the fixed altitude–area distribution by calculating a runoff time-series using a DEM and the glacier extent derived from aerial photographs in 1985 (AeroDEM; Korsgaard et al., 2016). The comparison showed a 7 % increase in the mean annual runoff, which has little effect on the interannual variations of runoff as well as the increasing trend over recent decades (Fig. S9). The occurrence of large peak runoff events also remained largely unaffected by the changed hypsometry, given that the daily runoff prior to 1990 never exceeded the 99.9th percentile, which is consistent with the original calculation.
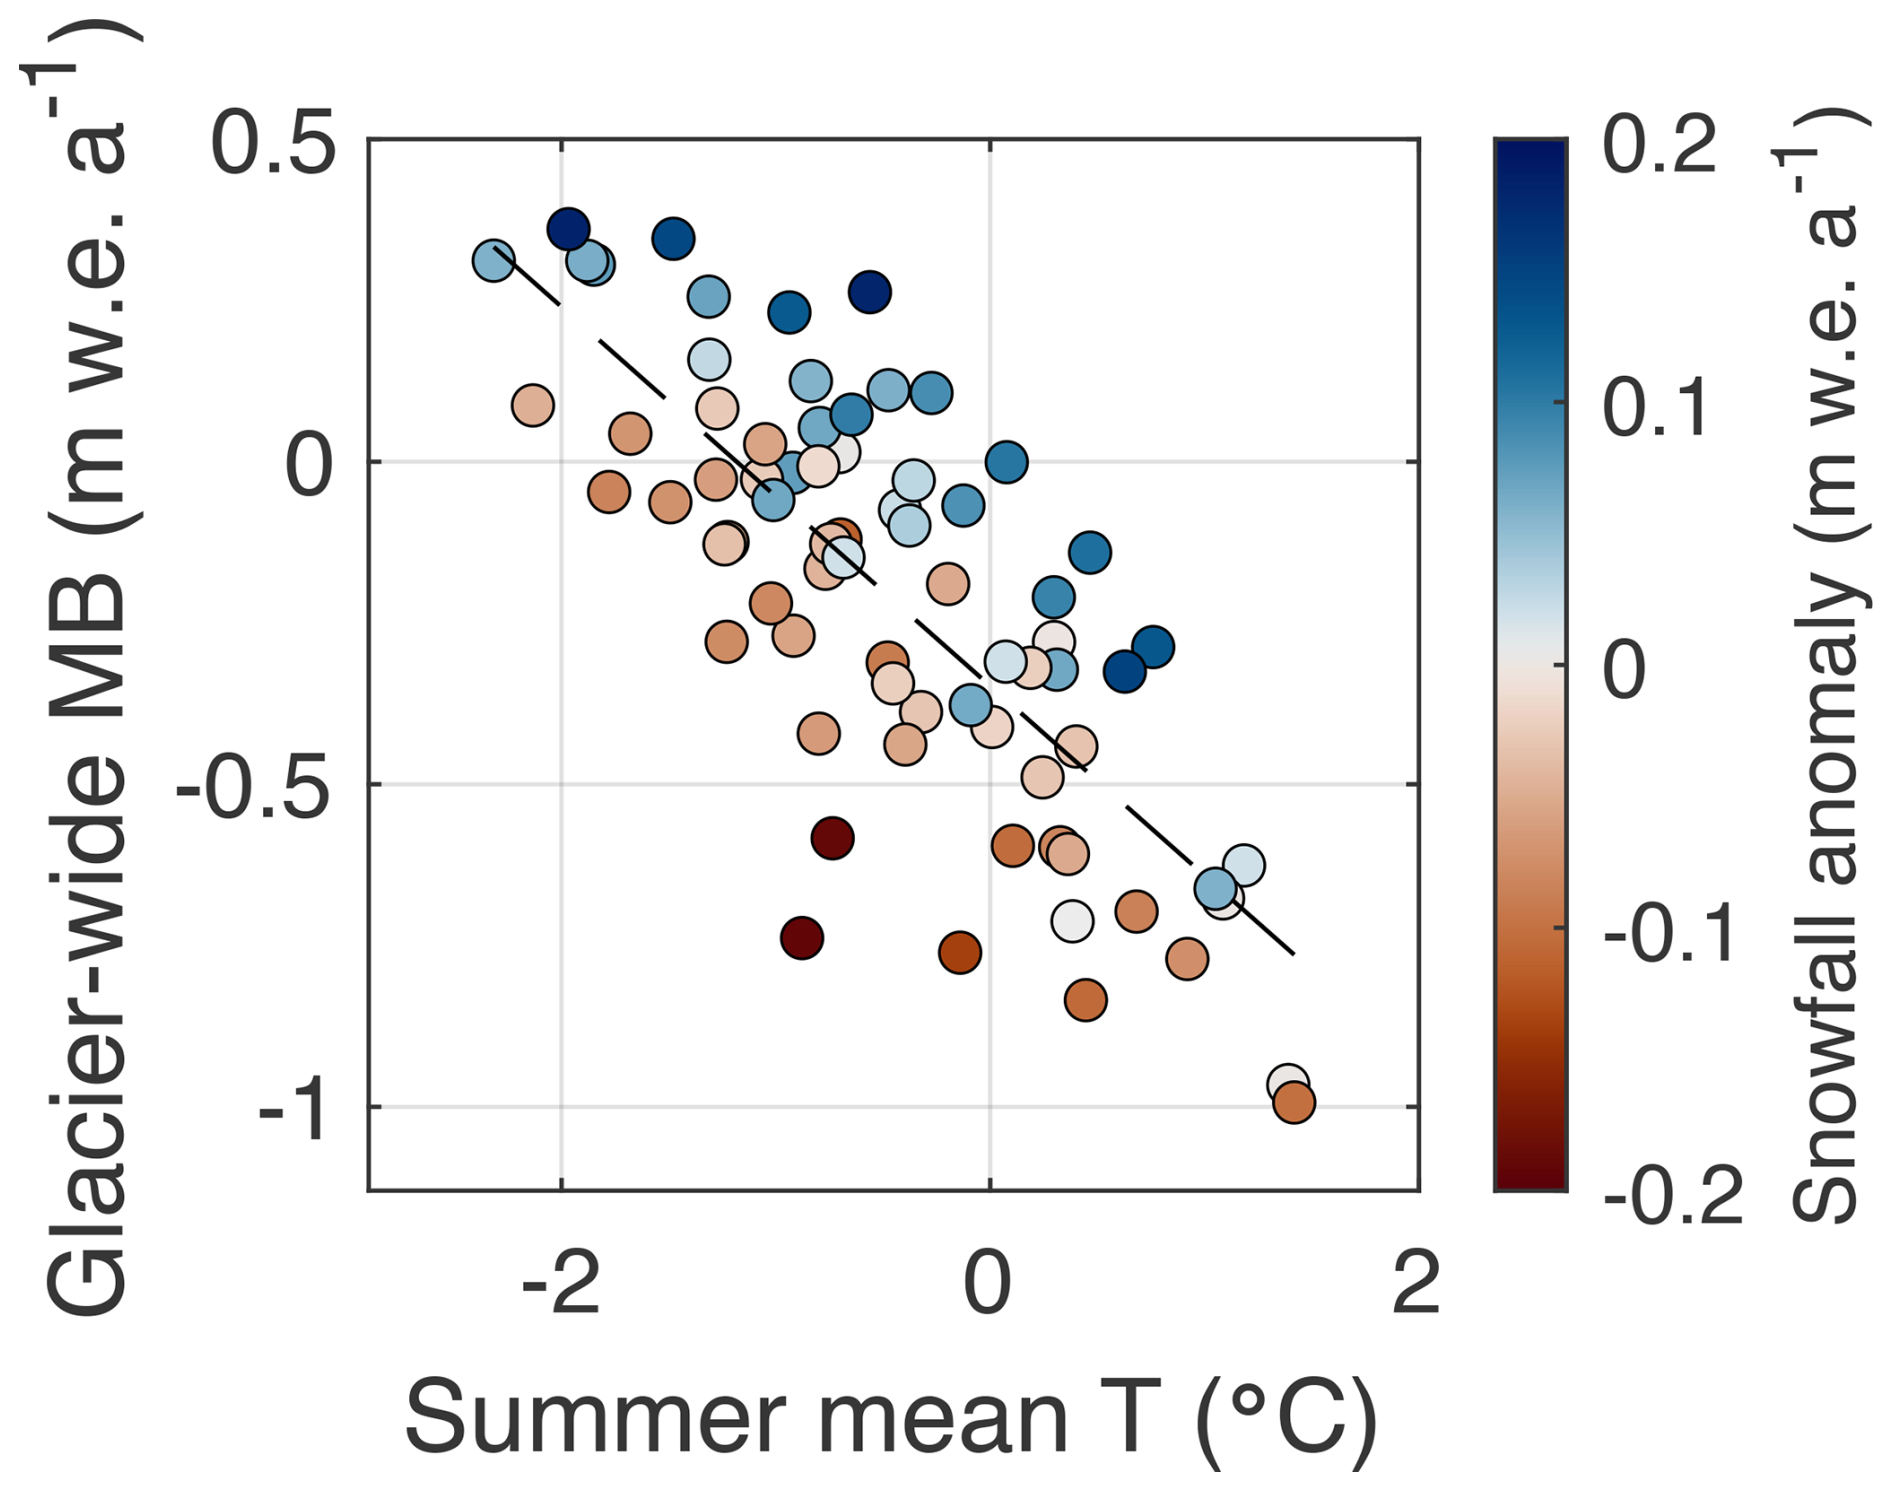
Figure 8Summer mean air temperature (T) versus glacier-wide mass balance (MB). Symbol colors indicate the snowfall anomaly in the corresponding mass balance year. The dashed line indicates a linear regression through the data.
Glacial meltwater accounts for 88 % of the total river runoff, and thus glacier fluctuations are a key control on the runoff variations. Glacier mass balance is strongly affected by summer climatic conditions and glacier ablation. The high correlation between the annual climatic mass balance and summer air temperature or snowfall suggests these are significant controls on the runoff. Multiple regression analysis further highlighted their importance, showing these two variables explain 88 % of the variability of the annual mass balance, with a RMSE of 0.12 (Fig. S10; Table S1 in the Supplement). The relationships between climatic mass balance, summer air temperature, and snowfall are shown in Fig. 8. The linear regression revealed the sensitivity of the mass balance to the summer air temperature, which predicted 0.29 of ice mass loss with a 1 °C warming in air temperature. The plot also indicates the mass balance being positive/negative during greater/lesser snowfall as shown in the deviation from the linear regression line (Fig. 8). The amount of snowfall has a stronger effect on the mass balance by affecting glacier melt, rather than increasing the accumulation. Snowfall in the mass balance year modulates the timing of snowline retreat, which influences absorption of shortwave radiation on the dark ice surface. For example, substantially less snowfall (33 % less than average) was recorded in 1960, the year of the most negative mass balance prior to 2000, which resulted in exceptionally rapid snowline retreat. Based on the model calculations, the snowline rose to 1075 m a.s.l. by 2 July, which was 400 m above the average on this day. As a result of the rapid disappearance of snow cover, absorption of shortwave radiation in the summer of 1960 (115 W m−2) was 1.5-fold greater than the average (79 W m−2). Although increasing summer air temperature is the primary driver of the decreasing mass balance, the results suggest the snowfall amount is a secondary control on glacier fluctuations.
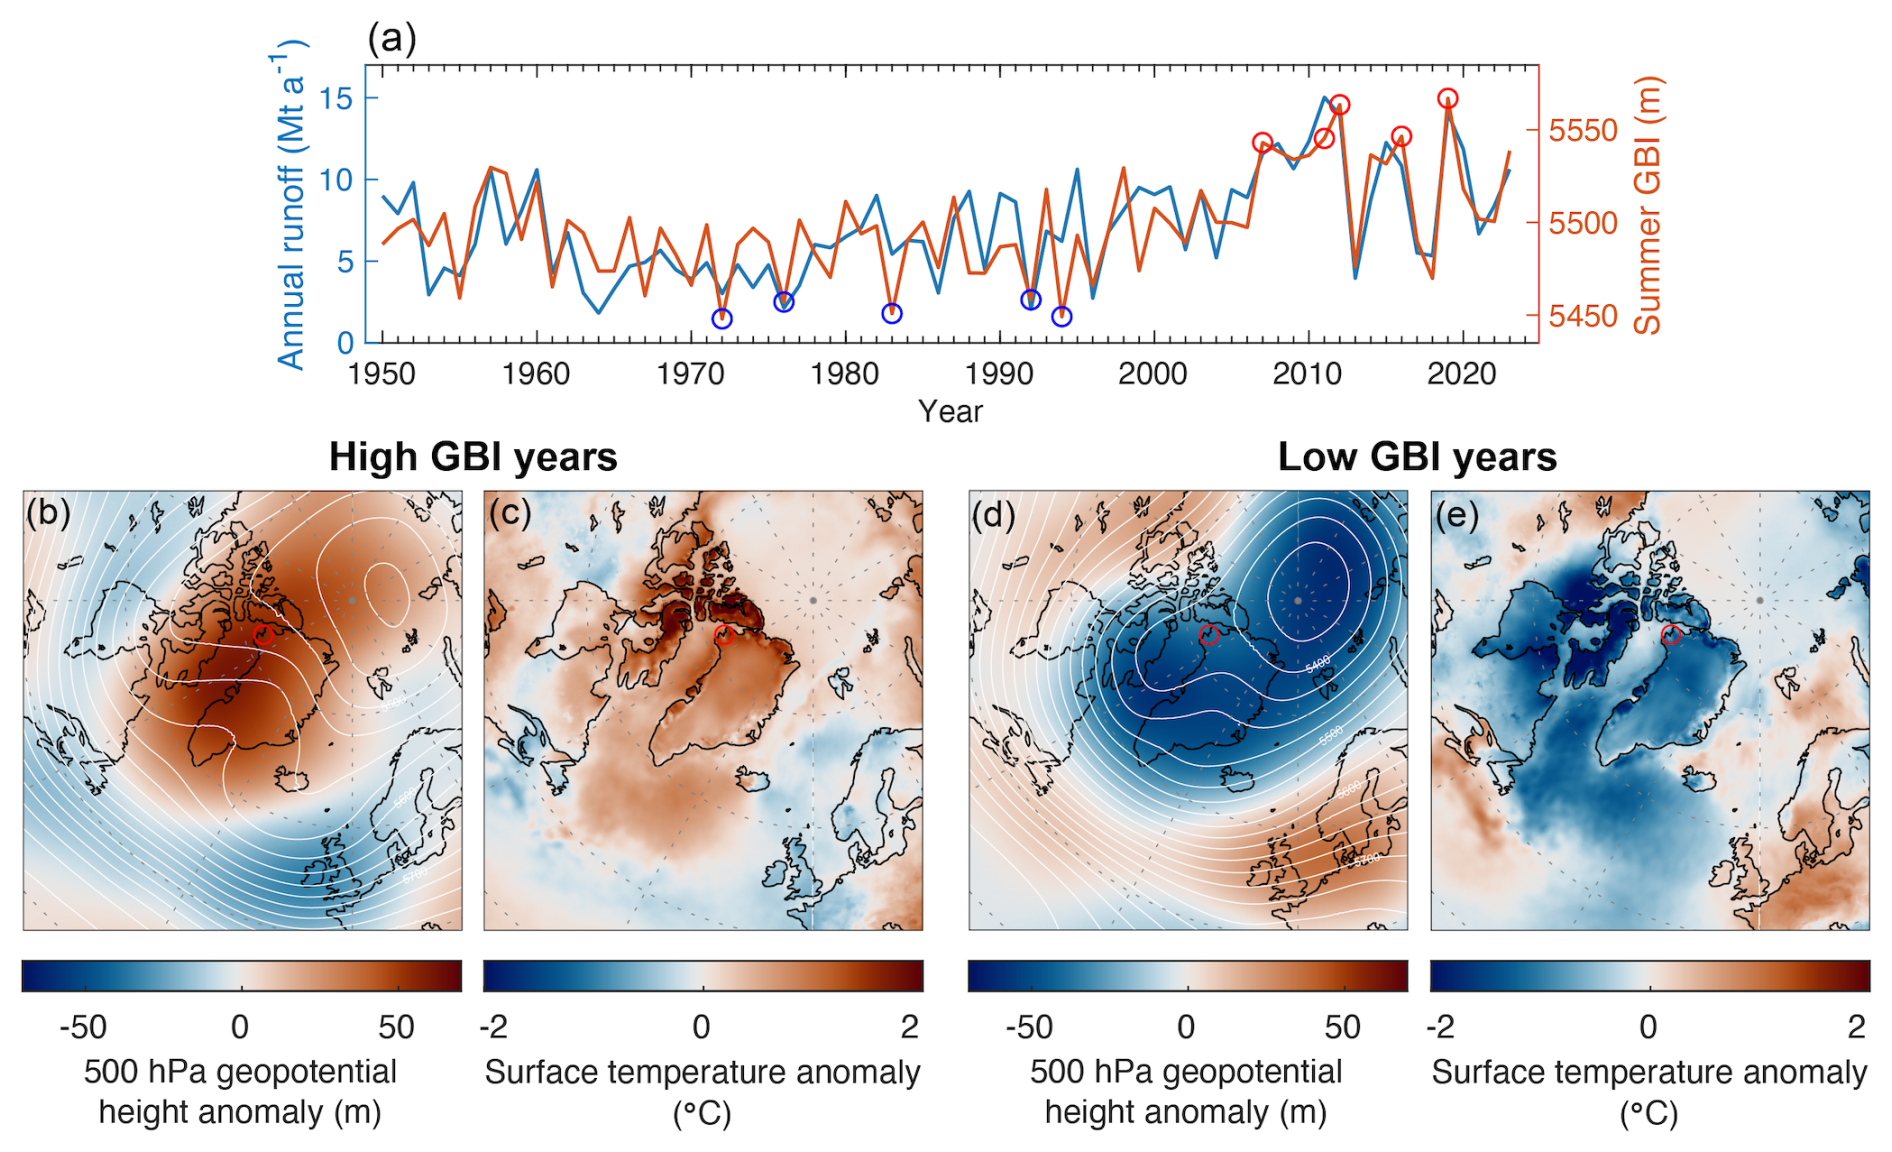
Figure 9(a) Modelled annual runoff (blue line) and the Greenland Blocking Index (GBI) in summer (orange line). Circles indicate the five years with the highest (red) and lowest (blue) summer GBI. Composites of ERA5 reanalysis data for 500 hPa geopotential height (white lines) and its anomaly from the temporal trend (color) are shown for the five years with the (b) highest and (d) lowest summer GBI. Composites of ERA5 reanalysis data for the surface air temperature anomaly from the temporal trend are shown for the five years with the (c) highest and (e) lowest summer GBI. The red circles indicate the location of Qaanaaq.
To identify the synoptic-scale climatic conditions affecting annual glacier runoff, we examined climate indices. We found the most significant correlation was with the GBI during summer (June, July, and August), with a coefficient r=0.69 (p<0.001) (Fig. 9a). The correlation is stronger than that with the summer NAO (; p<0.001), suggesting a more direct link with the atmospheric conditions over Greenland as represented by the GBI. The atmospheric conditions during high/low-GBI periods were analyzed by creating composites for 500 hPa geopotential height and surface air temperature anomalies for the five years with the highest/lowest summer GBI (Fig. 9b–e; Table S2). High summer GBI resulted in similar atmospheric conditions as observed during large daily runoff events, which were characterized by an atmospheric ridge over Greenland that resulted in strengthened southerly winds into northern Greenland (Fig. 9b). This is consistent with previously reported atmospheric conditions during the negative NAO phase (Fettweis et al., 2013; McLeod and Mote, 2016). The composite for the surface air temperature anomaly showed pronounced warming in northern Greenland, as well as the Canadian Arctic Archipelago, with a greater magnitude than in the southern region (Fig. 9c). Conversely, the surface temperature in the north cooled during the five years with the lowest summer GBI (Fig. 9e), due to a southward shift of the cold air mass in the polar region (Fig. 9d). Therefore, the significant correlation between annual runoff of Qaanaaq Glacier and the GBI is due to the high sensitivity of air temperatures in the north to anticyclonic conditions over Greenland. The pronounced increase in annual runoff since 2000 coincided with the years with the top-ranked summer GBI (Fig. 9a), indicative of the effects of large-scale atmospheric variability. The results are consistent with recent large-scale circulation changes reported over Greenland (Noël et al., 2019). Qaanaaq Glacier is located in the region with the most pronounced increase in summer cloud cover and subsequent atmospheric warming. Our results highlight the importance of monitoring glacier hydrology in northwestern Greenland, given its direct response to recent changes in atmospheric circulation.
The high sensitivity of the air temperature in northern Greenland to blocking events highlights the importance of synoptic-scale atmospheric conditions over Greenland for accurately predicting future runoff variability. Our results demonstrate that a similar pressure pattern corresponded with increases in runoff on both long and short timescales. However, such atmospheric circulation patterns are not captured by the Earth system models used in CMIP5 and CMIP6, as none of these models reproduced the recent trend of increasing GBI (Hanna et al., 2018; Maddison et al., 2024). Inadequate representation of the atmospheric conditions leads to an underestimation of the glacier runoff and flood occurrence in northern Greenland.
To investigate long-term glacier runoff variations in northwestern Greenland, we conducted runoff modelling using a glacier energy–mass balance model and climate reanalysis dataset for 1950–2023. Our results identified an increase in the occurrence of large daily runoff events in recent decades, with all the exceptionally large runoff events (>99.9th percentile) having occurred since 1990. The largest (8.5 m3 s−1 in 2023) and second largest (7.2 m3 s−1 in 2001) daily runoff events coincided with flood events observed in Qaanaaq, which demonstrated substantial impacts on the society of the Greenlandic coast. These rapid increases in runoff were due to intense rainfall (contributions of 79 % and 78 %, respectively) caused by an atmospheric river directed toward Qaanaaq, which in turn was generated by an anticyclone centered over Greenland. The pressure pattern strengthened the advection of warm and humid southerly air to the north. High daily runoff was also caused by intense glacier melting triggered by strong and warm winds, due to southerly winds strengthened by a low-pressure system located over the Canadian Arctic Archipelago.
Long-term annual glacier runoff increased at a rate of 0.7 Mt per decade during 1950–2023, associated with the atmospheric warming with 0.24 °C per decade and 2.2-fold increase of rainfall from 1951–1960 to 2010–2020. The variations in annual glacier runoff were significantly affected by synoptic-scale atmospheric conditions as represented by the GBI (r=0.69; p<0.001). Analysis of the atmospheric conditions in periods of high summer GBI showed that stronger warming occurred in northern Greenland and the Canadian Arctic Archipelago than in the south, suggesting high sensitivity of glacier melt in the northern regions. The warming during high-GBI periods was caused by strengthened warm air advection due to Greenland blocking, highlighting the significant effect of anticyclonic conditions over Greenland on both short- and long-term glacier runoff in northwestern Greenland. Given the inadequate representation of Greenland blocking by climate models, these models are likely to substantially underestimate future glacier runoff and flood occurrence.
The ERA5, ERA5-Land, and CARRA reanalysis dataset is available through Climate Data Store (https://cds.climate.copernicus.eu/, last access: 31 August 2025). Meteorological data at SIGMA-B is available from Nishimura et al. (2023a) through Arctic Data archive System (https://doi.org/10.17592/001.2022041306, Nishimura et al., 2023b). Surface mass balance data measured at Qaanaaq Glacier are available from Tsutaki et al. (2017). Proglacial discharge measurements at Qaanaaq Glacier are available from Mankoff et al. (2020) and Kondo et al. (2021) through https://doi.org/10.22008/hokkaido/data/meltwater_discharge/qaanaaq (Kondo, 2020). The modelling outputs of this study are deposited and available at Zenodo, https://doi.org/10.5281/zenodo.18856829 (Kondo and Fujita, 2026).
The supplement related to this article is available online at https://doi.org/10.5194/hess-30-1849-2026-supplement.
KF designed the study and methodology. KK undertook the data curation, formal analysis, and investigation. KK wrote the original draft. KF reviewed and edited the manuscript.
The contact author has declared that neither of the authors has any competing interests.
Publisher's note: Copernicus Publications remains neutral with regard to jurisdictional claims made in the text, published maps, institutional affiliations, or any other geographical representation in this paper. The authors bear the ultimate responsibility for providing appropriate place names. Views expressed in the text are those of the authors and do not necessarily reflect the views of the publisher.
We would like to thank S. Sugiyama and T. Imazu for fruitful discussions.
This research was funded by Arctic Challenge for Sustainability (ArCS II) Project (grant no. JPMXD1420318865). Ken Kondo was supported by Grant-in-Aid for JSPS Research Fellows (grant no. 24KJ0108).
This paper was edited by Carlo De Michele and reviewed by Jason Box, Charalampos Charalampidis, and one anonymous referee.
Ahlstrøm, A. P., Petersen, D., Langen, P. L., Citterio, M., and Box, J. E.: Abrupt shift in the observed runoff from the southwestern Greenland ice sheet, Sci. Adv., 3, e1701169, https://doi.org/10.1126/sciadv.1701169, 2017.
Aoki, T., Matoba, S., Uetake, J., Takeuchi, N., and Motoyama, H.: Field activities of the “Snow Impurity and Glacial Microbe effects on abrupt warming in the Arctic” (SIGMA) Project in Greenland in 2011–2013, Bull. Glaciol. Res., 32, 3–20, https://doi.org/10.5331/bgr.32.3, 2014a.
Aoki, T., Matoba, S., Yamaguchi, S., Tanikawa, T., Niwano, M., Kuchiki, K., Adachi, K., Uetake, J., Motoyama, H., and Hori, M.: Light-absorbing snow impurity concentrations measured on Northwest Greenland ice sheet in 2011 and 2012, Bull. Glaciol. Res., 32, 21–31, https://doi.org/10.5331/bgr.32.21, 2014b.
Bamber, J., van den Broeke, M., Ettema, J., Lenaerts, J., and Rignot, E.: Recent large increases in freshwater fluxes from Greenland into the North Atlantic, Geophys. Res. Lett., 39, L19501, https://doi.org/10.1029/2012GL052552, 2012.
Box, J. E., Fettweis, X., Stroeve, J. C., Tedesco, M., Hall, D. K., and Steffen, K.: Greenland ice sheet albedo feedback: thermodynamics and atmospheric drivers, The Cryosphere, 6, 821–839, https://doi.org/10.5194/tc-6-821-2012, 2012.
Box, J. E., Wehrlé, A., van As, D., Fausto, R. S., Kjeldsen, K. K., Dachauer, A., Ahlstrøm, A. P., and Picard, G.: Greenland Ice Sheet Rainfall, Heat and Albedo Feedback Impacts From the Mid-August 2021 Atmospheric River, Geophys. Res. Lett., 49, e2021GL097356, https://doi.org/10.1029/2021GL097356, 2022.
Box, J. E., Nielsen, K. P., Yang, X., Niwano, M., Wehrlé, A., van As, D., Fettweis, X., Køltzow, M. A. Ø., Palmason, B., Fausto, R. S., van den Broeke, M. R., Huai, B., Ahlstrøm, A. P., Langley, K., Dachauer, A., and Noël, B.: Greenland ice sheet rainfall climatology, extremes and atmospheric river rapids, Meteorol. Appl., 30, e2134, https://doi.org/10.1002/met.2134, 2023.
Chylek, P., Box, J. E., and Lesins, G.: Global Warming and the Greenland Ice Sheet, Clim. Change, 63, 201–221, https://doi.org/10.1023/B:CLIM.0000018509.74228.03, 2004.
Fausto, R. S., van As. D., Box, J. E., Colgan, W., Langen, P. L., and Mottram, R. H.: The implication of nonradiative energy fluxes dominating Greenland ice sheet exceptional ablation area surface melt in 2012, Geophys. Res. Lett., 43, 2649–2658, https://doi.org/10.1002/2016GL067720, 2016.
Fettweis, X., Hanna, E., Lang, C., Belleflamme, A., Erpicum, M., and Gallée, H.: Brief communication ”Important role of the mid-tropospheric atmospheric circulation in the recent surface melt increase over the Greenland ice sheet”, The Cryosphere, 7, 241–248, https://doi.org/10.5194/tc-7-241-2013, 2013.
Fujita, K. and Ageta, Y.: Effect of summer accumulation on glacier mass balance on the Tibetan Plateau revealed by mass-balance model, J. Glaciol., 46, 244–252, https://doi.org/10.3189/172756500781832945, 2000.
Fujita, K. and Sakai, A.: Modelling runoff from a Himalayan debris-covered glacier, Hydrol. Earth Syst. Sci., 18, 2679–2694, https://doi.org/10.5194/hess-18-2679-2014, 2014.
Fujita, K., Matoba, S., Iizuka, Y., Takeuchi, N., Tsushima, A., Kurosaki, Y., and Aoki, T.: Physically Based Summer Temperature Reconstruction From Melt Layers in Ice Cores, Earth Space Sci., 8, e2020EA001590, https://doi.org/10.1029/2020EA001590, 2021.
Greenwood, J. A., Landwehr, J. M., Matalas, N. C., and Wallis, J. R.: Probability weighted moments: Definition and relation to parameters of several distributions expressable in inverse form, Water Resour. Res., 15, 1049–1054, https://doi.org/10.1029/WR015i005p01049, 1979.
Gumbel, E. J.: The return period of flood flows, Ann. Math. Stat., 12, 163–190, 1941.
Hanna, E., Mernild, S. H., Cappelen, J., and Steffen, K.: Recent warming in Greenland in a long-term instrumental (1881–2012) climatic context: I. Evaluation of surface air temperature records, Environ. Res. Lett., 7, 045404, https://doi.org/10.1088/1748-9326/7/4/045404, 2012.
Hanna, E., Jones, J. M., Cappelen, J., Mernild, S. H., Wood, L., Steffen, K., and Huybrechts, P.: The influence of North Atlantic atmospheric and oceanic forcing effects on 1900-2010 Greenland summer climate and ice melt/runoff, Int. J. Climatol., 33, 862–880, https://doi.org/10.1002/joc.3475, 2013.
Hanna, E., Fettweis, X., Mernild, S. H., Cappelen, J., Ribergaard, M. H., Shuman, C. A., Steffen, K., Wood, L., and Mote, T. L.: Atmospheric and oceanic climate forcing of the exceptional Greenland ice sheet surface melt in summer 2012, Int. J. Climatol., 34, 1022–1037, https://doi.org/10.1002/joc.3743, 2014.
Hanna, E., Cropper, T. E., Hall, R. J., and Cappelen, J.: Greenland Blocking Index 1851–2015: a regional climate change signal, Int. J. Climatol., 36, 4847–4861, https://doi.org/10.1002/joc.4673, 2016.
Hanna, E., Fettweis, X., and Hall, R. J.: Brief communication: Recent changes in summer Greenland blocking captured by none of the CMIP5 models, The Cryosphere, 12, 3287–3292, https://doi.org/10.5194/tc-12-3287-2018, 2018.
Hasholt, B., Bech Mikkelsen, A., Holtegaard Nielsen, M., and Andreas Dahl Larsen, M.: Observations of Runoff and Sediment and Dissolved Loads from the Greenland Ice Sheet at Kangerlussuaq, West Greenland, 2007 to 2010, Z. Geomorphol., Supplementary Issues, 57, 3–27, https://doi.org/10.1127/0372-8854/2012/S-00121, 2013.
Hersbach, H., Bell, B., Berrisford, P., Biavati, G., Horányi, A., Muñoz Sabater, J., Nicolas, J., Peubey, C., Radu, R., Rozum, I., Schepers, D., Simmons, A., Soci, C., Dee, D., and Thépaut, J.-N.: ERA5 hourly data on pressure levels from 1940 to present, Copernicus Climate Change Service (C3S) Climate Data Store (CDS) [data set], https://doi.org/10.24381/cds.bd0915c6, 2023a.
Hersbach, H., Bell, B., Berrisford, P., Biavati, G., Horányi, A., Muñoz Sabater, J., Nicolas, J., Peubey, C., Radu, R., Rozum, I., Schepers, D., Simmons, A., Soci, C., Dee, D., and Thépaut, J.-N.: ERA5 hourly data on single levels from 1940 to present, Copernicus Climate Change Service (C3S) Climate Data Store (CDS) [data set], https://doi.org/10.24381/cds.adbb2d47, 2023b.
Hodgkins, R.: Glacier hydrology in Svalbard, Norwegian high arctic, Quat. Sci. Rev., 16, 957–973, https://doi.org/10.1016/S0277-3791(97)00032-2, 1997.
Hugonnet, R., McNabb, R., Berthier, E., Menounos, B., Nuth, C., Girod, L., Farinotti, D., Huss, M., Dussaillant, I., Brun, F., and Kääb, A.: Accelerated global glacier mass loss in the early twenty-first century, Nature, 592, 726–731, https://doi.org/10.1038/s41586-021-03436-z, 2021.
Khalzan, P., Sakai, A., and Fujita, K.: Mass Balance of Four Mongolian Glaciers: In-situ Measurements, Long-Term Reconstruction and Sensitivity Analysis, Front. Earth Sci., 9, 785306, https://doi.org/10.3389/feart.2021.785306, 2022.
Khan, S. A., Colgan, W., Neumann, T. A., van den Broeke, M. R., Brunt, K. M., Noël, B., Bamber, J. L., Hassan, J., and Bjørk, A. A.: Accelerating Ice Loss From Peripheral Glaciers in North Greenland, Geophys. Res. Lett., 49, e2022GL098915, https://doi.org/10.1029/2022GL098915, 2022.
Kobbefjord Research Station [NuukNERO]: “#Extreme rain has flushed the #bridge at the station away! The river is #uncrossable… Interesting part of the #field #season left… #Crazy #weather. Photos by Claus Stampe Spile, who was on a hike… ”, X, https://x.com/NuukNERO/status/1573959848991014913 (last access: 6 October 2025), 25 September 2022.
Kondo, J.: Meteorology of the Water Environment-Water and Heat Balance of the Earth's Surface, Asakura Shoten Press, Tokyo, 1994 (in Japanese).
Kondo, K.: Discharge measurement at the outlet stream of Qaanaaq Glacier in the summer 2017–2019, GEUS Dataverse, V2 [data set], https://doi.org/10.22008/hokkaido/data/meltwater_discharge/qaanaaq, 2020.
Kondo, K. and Fujita, K.: Modelling outputs of runoff and mass balance at Qaanaaq Glacier in northwestern Greenland (1950–2023), Zenodo [data set], https://doi.org/10.5281/zenodo.18856829, 2026.
Kondo, J. and Xu, J.: Seasonal Variations in the Heat and Water Balances for Nonvegetated Surfaces, J. Appl. Meteor., 36, 1676–1695, https://doi.org/10.1175/1520-0450(1997)036<1676:SVITHA>2.0.CO;2, 1997.
Kondo, K., Sugiyama, S., Sakakibara, D., and Fukumoto, S.: Flood events caused by discharge from Qaanaaq Glacier, northwestern Greenland, J. Glaciol., 67, 500–510, https://doi.org/10.1017/jog.2021.3, 2021.
Korsgaard, N. J., Nuth, C., Khan, S. A., Kjeldsen, K. K., Bjørk, A. A., Schomacker, A., and Kjær, K. H.: Digital elevation model and orthophotographs of Greenland based on aerial photographs from 1978–1987, Sci. Data, 3, 160032, https://doi.org/10.1038/sdata.2016.32, 2016.
Liang, S.: Narrowband to broadband conversions of land surface albedo I Algorithms, Remote Sens. Environ., 76, 213–238, https://doi.org/10.1016/S0034-4257(00)00205-4, 2001.
Machguth, H., MacFerrin, M. van As D., Box, J. E., Charalampidis, Colgan, W., Fausto, R. S., Meijer, H. A. J., Mosley-Thompson, E., and van de Wal, R. S. W.: Greenland meltwater storage in firn limited by near-surface ice formation, Nat. Clim. Change, 6, 390–393, https://doi.org/10.1038/nclimate2899, 2016.
Maddison, J. W., Catto, J. L., Hanna, E., Luu, L. N., and Screen, J. A.: Missing Increase in Summer Greenland Blocking in Climate Models, Geophys. Res. Lett., 51, e2024GL108505, https://doi.org/10.1029/2024GL108505, 2024.
Mankoff, K. D., Noël, B., Fettweis, X., Ahlstrøm, A. P., Colgan, W., Kondo, K., Langley, K., Sugiyama, S., van As, D., and Fausto, R. S.: Greenland liquid water discharge from 1958 through 2019, Earth Syst. Sci. Data, 12, 2811–2841, https://doi.org/10.5194/essd-12-2811-2020, 2020.
Matoba, S., Hazuki, R., Kurosaki, Y., and Aoki, T.: Spatial Distribution of the Input of Insoluble Particles Into the Surface of the Qaanaaq Glacier, Northwestern Greenland, Front. Earth Sci., 8, 542557, https://doi.org/10.3389/feart.2020.542557, 2020.
Mattingly, K. S., Ramseyer, C. A., Rosen, J. J., Mote, T. L., and Muthyala, R.: Increasing water vapor transport to the Greenland Ice Sheet revealed using self-organizing maps, Geophys. Res. Lett., 43, 9250–9258, https://doi.org/10.1002/2016GL070424, 2016.
Mattingly, K. S., Mote, T. L., and Fettweis, X.: Atmospheric River Impacts on Greenland Ice Sheet Surface Mass Balance, J. Geophys. Res.-Atmos., 123, 8538–8560, https://doi.org/10.1029/2018JD028714, 2018.
McLeod, J. T. and Mote, T. L.: Linking interannual variability in extreme Greenland blocking episodes to the recent increase in summer melting across the Greenland ice sheet, Intl. J. Climatol., 36, 1484–1499, https://doi.org/10.1002/joc.4440, 2016.
Mernild, S. H., Knudsen, N. T., Lipscomb, W. H., Yde, J. C., Malmros, J. K., Hasholt, B., and Jakobsen, B. H.: Increasing mass loss from Greenland's Mittivakkat Gletscher, The Cryosphere, 5, 341–348, https://doi.org/10.5194/tc-5-341-2011, 2011.
Mikkelsen, A. B., Hubbard, A., MacFerrin, M., Box, J. E., Doyle, S. H., Fitzpatrick, A., Hasholt, B., Bailey, H. L., Lindbäck, K., and Pettersson, R.: Extraordinary runoff from the Greenland ice sheet in 2012 amplified by hypsometry and depleted firn retention, The Cryosphere, 10, 1147–1159, https://doi.org/10.5194/tc-10-1147-2016, 2016.
Minowa, M., Skvarca, P., and Fujita, K.: Climate and Surface Mass Balance at Glaciar Perito Moreno, Southern Patagonia, J. Climate, 36, 625–641, https://doi.org/10.1175/JCLI-D-22-0294.1, 2023.
Moriashi, D. N., Arnold J. G., Van Liew M. W., Bingner R. L., Harmel R. D., and Veith T. L.: Model Evaluation Guidelines for Systematic Quantification of Accuracy in Watershed Simulations, Transactions of the ASABE, 50, 885–900, https://doi.org/10.13031/2013.23153, 2007.
Mouginot, J., Rignot, E., Bjørk, A. A., van den Broeke, M., Millan, R., Morlighem, M., Noël, B., Scheuchl, B., and Wood, M.: Forty-six years of Greenland Ice Sheet mass balance from 1972 to 2018, P. Natl. Acad. Sci. USA, 116, 9239–9244, https://doi.org/10.1073/pnas.1904242116, 2019.
Muñoz Sabater, J.: ERA5-Land hourly data from 1950 to present, Copernicus Climate Change Service (C3S) Climate Data Store (CDS) [data set], https://doi.org/10.24381/cds.e2161bac, 2019.
Nagatsuka, N., Takeuchi, N., Uetake, J., Shimada, R., Onuma, Y., Tanaka, S., and Nakano, T.: Variations in Sr and Nd Isotopic Ratios of Mineral Particles in Cryoconite in Western Greenland, Front. Earth Sci., 4, https://doi.org/10.3389/feart.2016.00093, 2016.
Nash, J. E. and Sutcliffe, J. V.: River flow forecasting through conceptual models part I – A discussion of principles, J. Hydrol., 10, 282–290, https://doi.org/10.1016/0022-1694(70)90255-6, 1970.
Neff, W., Compo, G. P., Martin Ralph, F., and Shupe, M. D.: Continental heat anomalies and the extreme melting of the Greenland ice surface in 2012 and 1889, J. Geophys. Res.-Atmos., 119, 6520–6536, https://doi.org/10.1002/2014JD021470, 2014.
Nghiem, S. V., Hall, D. K., Mote, T. L., Tedesco, M., Albert, M. R., Keegan, K., Shuman, C. A., DiGirolamo, N. E., and Neumann, G.: The extreme melt across the Greenland ice sheet in 2012, Geophys. Res. Lett., 39, 2012GL053611, https://doi.org/10.1029/2012GL053611, 2012.
Nishimura, M., Aoki, T., Niwano, M., Matoba, S., Tanikawa, T., Yamasaki, T., Yamaguchi, S., and Fujita, K.: Quality-controlled meteorological datasets from SIGMA automatic weather stations in northwest Greenland, 2012–2020, Earth Syst. Sci. Data, 15, 5207–5226, https://doi.org/10.5194/essd-15-5207-2023, 2023a.
Nishimura, M., Aoki, T., Niwano, M., Matoba, S., Tanikawa, T., Yamaguchi, S., Yamasaki, T., and Fujita, K.: Quality-controlled datasets of Automatic Weather Station (AWS) at SIGMA-B site from 2012 to 2020: Level 1.3, 2.00, Arctic Data archive System (ADS), Japan [data set], https://doi.org/10.17592/001.2022041306, 2023b.
Niwano, M., Aoki, T., Matoba, S., Yamaguchi, S., Tanikawa, T., Kuchiki, K., and Motoyama, H.: Numerical simulation of extreme snowmelt observed at the SIGMA-A site, northwest Greenland, during summer 2012, The Cryosphere, 9, 971–988, https://doi.org/10.5194/tc-9-971-2015, 2015.
Niwano, M., Box, J. E., Wehrlé, A., Vandecrux, B., Colgan, W. T., and Cappelen, J.: Rainfall on the Greenland Ice Sheet: Present-Day Climatology From a High-Resolution Non-Hydrostatic Polar Regional Climate Model, Geophys. Res. Lett., 48, e2021GL092942, https://doi.org/10.1029/2021GL092942, 2021.
Noël, B., van de Berg, W. J., Lhermitte, S., and van den Broeke, M. R.: Rapid ablation zone expansion amplifies north Greenland mass loss, Sci. Adv., 5, eaaw0123, https://doi.org/10.1126/sciadv.aaw0123, 2019.
Otosaka, I. N., Shepherd, A., Ivins, E. R., Schlegel, N.-J., Amory, C., van den Broeke, M. R., Horwath, M., Joughin, I., King, M. D., Krinner, G., Nowicki, S., Payne, A. J., Rignot, E., Scambos, T., Simon, K. M., Smith, B. E., Sørensen, L. S., Velicogna, I., Whitehouse, P. L., A, G., Agosta, C., Ahlstrøm, A. P., Blazquez, A., Colgan, W., Engdahl, M. E., Fettweis, X., Forsberg, R., Gallée, H., Gardner, A., Gilbert, L., Gourmelen, N., Groh, A., Gunter, B. C., Harig, C., Helm, V., Khan, S. A., Kittel, C., Konrad, H., Langen, P. L., Lecavalier, B. S., Liang, C.-C., Loomis, B. D., McMillan, M., Melini, D., Mernild, S. H., Mottram, R., Mouginot, J., Nilsson, J., Noël, B., Pattle, M. E., Peltier, W. R., Pie, N., Roca, M., Sasgen, I., Save, H. V., Seo, K.-W., Scheuchl, B., Schrama, E. J. O., Schröder, L., Simonsen, S. B., Slater, T., Spada, G., Sutterley, T. C., Vishwakarma, B. D., van Wessem, J. M., Wiese, D., van der Wal, W., and Wouters, B.: Mass balance of the Greenland and Antarctic ice sheets from 1992 to 2020, Earth Syst. Sci. Data, 15, 1597–1616, https://doi.org/10.5194/essd-15-1597-2023, 2023.
Porter, C., Howat, I., Noh, M. J., Husby, E., Khuvis, S., Danish, E., Tomko, K., Gardiner, J., Negrete, A., Yadav, B., Kilassen, J., Kelleher, C., Cloutier, M., Bakker, J., Enos, J., Arnold, G., Bauer, G., and Morin, P.: ArcticDEM – Mosaics, Version 4.1, Polar Geosphacial Center [data set], https://doi.org/10.7910/DVN/3VDC4W, 2024.
Rastner, P., Bolch, T., Mölg, N., Machguth, H., Le Bris, R., and Paul, F.: The first complete inventory of the local glaciers and ice caps on Greenland, The Cryosphere, 6, 1483–1495, https://doi.org/10.5194/tc-6-1483-2012, 2012.
Rennermalm, A. K., Smith, L. C., Chu, V. W., Forster, R. R., Box, J. E., and Hagedorn, B.: Proglacial river stage, discharge, and temperature datasets from the Akuliarusiarsuup Kuua River northern tributary, Southwest Greenland, 2008–2011, Earth Syst. Sci. Data, 4, 1–12, https://doi.org/10.5194/essd-4-1-2012, 2012.
Ruckstuhl, C., Philipona, R., Morland, J., and Ohmura, A.: Observed relationship between surface specific humidity, integrated water vapor, and longwave downward radiation at different altitudes, J. Geophys. Res.-Atmos., 112, 2006JD007850, https://doi.org/10.1029/2006JD007850, 2007.
Sakai, A. and Fujita, K.: Contrasting glacier responses to recent climate change in high-mountain Asia, Sci. Rep., 7, 13717, https://doi.org/10.1038/s41598-017-14256-5, 2017.
Schyberg, H., Yang, X., Køltzow, M. A. Ø., Amstrup, B., Bakketun, Å., Bazile, E., Bojarova, J., Box, J. E., Dahlgren, P., Hagelin, S., Homleid, M., Horányi, A., Høyer, J., Johansson, Å., Killie, M. A., Körnich, H., Le Moigne, P., Lindskog, M., Manninen, T., Nielsen Englyst, P., Nielsen, K. P., Olsson, E., Palmason, B., Peralta Aros, C., Randriamampianina, R., Samuelsson, P., Stappers, R., Støylen, E., Thorsteinsson, S., Valkonen, T., and Wang, Z. Q.: Arctic regional reanalysis on single levels from 1991 to present, Copernicus Climate Change Service (C3S) Climate Data Store (CDS) [data set], https://doi.org/10.24381/cds.713858f6, 2020.
Sugiyama, S., Sakakibara, D., Matsuno, S., Yamaguchi, S., Matoba, S., and Aoki, T.: Initial field observations on Qaanaaq ice cap, northwestern Greenland, Ann. Glaciol., 55, 25–33, https://doi.org/10.3189/2014AoG66A102, 2014.
Takeuchi, N., Nagatsuka, N., Uetake, J., and Shimada, R.: Spatial variations in impurities (cryoconite) on glaciers in northwest Greenland, Bull. Glaciol. Res., 32, 85–94, https://doi.org/10.5331/bgr.32.85, 2014.
Tedesco, M., Mote, T., Fettweis, X., Hanna, E., Jeyaratnam, J., Booth, J. F., Datta, R., and Briggs, K.: Arctic cut-off high drives the poleward shift of a new Greenland melting record, Nat. Commun., 7, 11723, https://doi.org/10.1038/ncomms11723, 2016.
Tsutaki, S., Sugiyama, S., Sakakibara, D., Aoki, T., and Niwano, M.: Surface mass balance, ice velocity and near-surface ice temperature on Qaanaaq Ice Cap, northwestern Greenland, from 2012 to 2016, Ann. Glaciol., 58, 181–192, https://doi.org/10.1017/aog.2017.7, 2017.
Uetake, J., Tanaka, S., Segawa, T., Takeuchi, N., Nagatsuka, N., Motoyama, H., and Aoki, T.: Microbial community variation in cryoconite granules on Qaanaaq Glacier, NW Greenland, FEMS Microbiol. Ecol., 92, fiw127, https://doi.org/10.1093/femsec/fiw127, 2016.
van As, D., Bech Mikkelsen, A., Holtegaard Nielsen, M., Box, J. E., Claesson Liljedahl, L., Lindbäck, K., Pitcher, L., and Hasholt, B.: Hypsometric amplification and routing moderation of Greenland ice sheet meltwater release, The Cryosphere, 11, 1371–1386, https://doi.org/10.5194/tc-11-1371-2017, 2017.
van den Broeke, M., Reijmer, C., and van de Wal, R.: Surface radiation balance in Antarctica as measured with automatic weather stations, J. Geophys. Res.-Atmos., 109, 2003JD004394, https://doi.org/10.1029/2003JD004394, 2004.
van den Broeke, M. R., Enderlin, E. M., Howat, I. M., Kuipers Munneke, P., Noël, B. P. Y., van de Berg, W. J., van Meijgaard, E., and Wouters, B.: On the recent contribution of the Greenland ice sheet to sea level change, The Cryosphere, 10, 1933–1946, https://doi.org/10.5194/tc-10-1933-2016, 2016.
Vogel, R. M.: The Probability Plot Correlation Coefficient Test for the Normal, Lognormal, and Gumbel Distributional Hypotheses, Water Resour. Res., 22, 587–590, https://doi.org/10.1029/WR022i004p00587, 1986.