the Creative Commons Attribution 4.0 License.
the Creative Commons Attribution 4.0 License.
 | 01 Apr 2026
Assessing the suitability of global evapotranspiration products over irrigated areas
Pierre Laluet
Chiara Corbari
Oscar Baez-Villanueva
Sophia Walther
Yongqiang Zhang
Joaquín Muñoz-Sabater
Clément Albergel
Wouter Dorigo
Reliable estimation of evapotranspiration (ET) over irrigated croplands is crucial for agricultural water management, hydrological modeling, and monitoring of land–atmosphere exchanges. Yet, the reliability of global ET datasets in these environments remains insufficiently assessed. Here, we evaluate six widely used global ET products (FLUXCOM RS, GLEAM4.3a, PMLv2, ERA5-Land, MOD16A2, and SSEBop v6.1), covering a wide range of modeling approaches, to assess their ability to capture irrigation-related ET signals. The assessment combines spatial and seasonal evaluations across diverse agro-climatic regions, using three complementary references: a map of area equipped for irrigation, the OpenET ensemble, and eddy covariance measurements from irrigated croplands. Results reveal marked differences in how the products represent irrigation-related ET variability. PMLv2, SSEBop v6.1, and FLUXCOM RS generally show stronger and more consistent agreement with the reference datasets in terms of spatial patterns and seasonal dynamics, although differences in ET magnitude remain between them. MOD16A2 and GLEAM4.3a capture temporal irrigation-related variability across most regions but show more variable spatial agreement with irrigation extent and generally lower ET magnitudes. ERA5-Land exhibits the weakest correspondence, reflecting limitations linked to its precipitation-driven soil-water-balance and stress formulations. Differences among products mainly reflect how vegetation water stress is represented and the extent to which irrigation-sensitive variables (e.g., land surface temperature and vegetation properties) are incorporated. This multi-scale evaluation provides guidance for selecting ET products in irrigated regions and highlights priorities for improving the representation of irrigation in global ET models.
- Article
(8392 KB) - Full-text XML
- BibTeX
- EndNote


Evapotranspiration (ET), defined here as the sum of transpiration, soil evaporation, and interception loss, is the largest flux of water returning from land to the atmosphere, accounting for more than 60 % of global terrestrial precipitation on average (Oki and Kanae, 2006; Dorigo et al., 2021). Beyond its hydrological role, ET also regulates key energy and carbon exchanges between the land surface and the atmosphere, linking the water, energy, and carbon cycles (Seneviratne et al., 2010; Fisher et al., 2017). In irrigated regions, accurately quantifying ET is particularly important. Although they cover only about 2.5 % of the global land surface, irrigation hotspots are key regional drivers of environmental change (McDermid et al., 2023). Irrigation enhances latent heat fluxes, reduces sensible heat fluxes, and contributes to mitigating extreme heat events (Thiery et al., 2017, 2020; Asmus et al., 2023). It also modifies soil moisture, land surface temperature (LST), albedo, and local atmospheric dynamics, with broader effects on precipitation and climate feedbacks (McDermid et al., 2019; Lunel et al., 2024).
A wide range of global ET products has been developed in recent decades and is now publicly available. They differ substantially in methodology and input data. Some rely on machine learning, such as FLUXCOM (Jung et al., 2019) and X-BASE (Nelson and Walther et al., 2024). Others are semi-mechanistic remote sensing–driven models that combine physical formulations for the main fluxes with empirical or machine-learning approaches to parameterize more complex processes, for example, MOD16A2 (Mu et al., 2011), PMLv2 (Zhang et al., 2019), GLEAM4 (Miralles et al., 2025), or ETMonitor (Zheng et al., 2022). Other approaches are based on simplified energy balance formulations, such as SSEBop (Senay, 2018). In addition, several products are derived from land surface models and reanalyses, such as ERA5-Land (Muñoz-Sabater et al., 2021), GLDAS (Rodell et al., 2004), or MERRA-2 (Gelaro et al., 2017). Across these products, the type of input data varies widely, ranging from meteorological reanalyses, to Earth Observation (EO) variables such as vegetation indices, LST, and albedo, to in situ measurements used for training or calibration.
Global ET products are used for a wide range of scientific applications, including climate studies and model evaluations. For instance, Wang et al. (2021) assessed the realism of ET simulations in CMIP6 climate models by benchmarking them against GLEAM v3.3. ET products are also used to study land–atmosphere interactions; for example, Chen and Dirmeyer (2019) analyzed the impacts of irrigation on LST using ET data from MOD16A2, GLEAM v3, and DOLCE (Hobeichi et al., 2018). In hydrological applications, Alfieri et al. (2022) used GLEAM v3.5a to calibrate a hydrological model in the Po Valley, while Liu et al. (2022) combined PMLv2, GLEAM v3.2, and MOD16A2 with GRACE-derived water storage changes to calibrate a global water balance model across large catchments. ET products have also been used in drought research; for example, Hong et al. (2023) used GLEAM v3.6a to investigate the relationships between ET and drought dynamics in southeastern China.
Another important application of global ET products is the quantification of irrigation water use. Kragh et al. (2023) estimated irrigation water use in the Indo-Gangetic Plain by comparing ET from FLUXCOM (Remote Sensing version; RS), MOD16A2, PMLv2, and ERA5-Land with ET simulations from a hydrological model run without irrigation. Similarly, Zhang and Long (2021) used SSEBop and other EO-based ET datasets to estimate irrigation water use across the contiguous United States (CONUS), while Zipper et al. (2024) estimated net irrigation in the U.S. Great Plains as the difference between effective precipitation and the OpenET ensemble (Volk et al., 2024).
Assessing the quality of global ET datasets is critical to ensure their reliable use in agricultural, climate, hydrological, and land–atmosphere studies. However, most existing evaluations have focused on large-scale or global assessments. These typically rely on in situ flux tower measurements – as in the LandFlux-EVAL project (Mueller et al., 2013) or the GEWEX LandFlux initiative (McCabe et al., 2016) – or on ET inferred as the residual term of the water balance (e.g., Liu et al., 2016; Lehmann et al., 2022). Many intercomparison efforts have also been conducted as part of the development and evaluation of new ET datasets, typically benchmarking them against existing ET products globally, such as in GLEAM4 (Miralles et al., 2025), FLUXCOM (Jung et al., 2019), ETMonitor (Zheng et al., 2022), or PMLv2 (Zhang et al., 2019). Beyond global evaluations, several studies have assessed the performance of ET products at regional scales. For instance, Etchanchu et al. (2025) evaluated 20 ET products using flux tower observations in a semi-arid region of West Africa, whereas Pascolini-Campbell et al. (2020) and Weerasinghe et al. (2020) used GRACE-based estimates to benchmark ET datasets over large watersheds in the CONUS and over Africa, respectively.
Yet, irrigated croplands remain largely underrepresented in existing evaluation efforts. Only a handful of studies have explicitly targeted intensively irrigated regions. For example, McNamara et al. (2021) evaluated multiple ET products in the Nile Basin using GRACE-derived ET estimates and identified PMLv2 and WaPOR (FAO, 2018) as the best-performing datasets. In northern Thailand, Sriwongsitanon et al. (2020) intercompared several products over an irrigated catchment and found that MOD16A2 best reproduced the spatial distribution of irrigation. More recently, Crow et al. (2025) evaluated the sensitivity of a thermal infrared (TIR)-based ET product (ALEXI; Anderson et al., 1997) and microwave soil moisture observations (SMAP; Entekhabi et al., 2010) to irrigation signals across the CONUS. Using the MIrAD-US irrigation map and flux tower measurements as references, they found that ALEXI-based ET captured irrigation-related spatial and seasonal patterns more clearly than SMAP soil moisture.
These studies demonstrate that some global ET datasets capture irrigation signals more effectively than others, yet existing evaluations remain limited in both spatial coverage and methodological scope. Consequently, our understanding of product reliability over irrigated areas remains very limited, and no comprehensive assessment has yet been conducted across diverse geographic and climatic settings while systematically analyzing multiple global ET datasets.
To address this gap, we present a multi-scale, multi-source assessment of six widely used global ET products: FLUXCOM RS, ERA5-Land, SSEBop v6.1, GLEAM4.3a, PMLv2, and MOD16A2. Our evaluation integrates three complementary assessments conducted at different spatial scales and based on distinct reference datasets. First, we assess the spatial coherence between ET products and irrigation infrastructure maps across seven major irrigated regions in the CONUS, Europe, and South Asia. Second, we evaluate the seasonal dynamics of ET by comparing the products with ensemble estimates from OpenET, which provides an independent multi-model benchmark, over four irrigated areas in the CONUS. Finally, we conduct a local-scale assessment using eddy covariance tower data from two irrigated sites in the Po Valley, Italy.
2.1 Global ET products
The six selected ET products represent diverse modeling strategies and input data sources, spanning machine learning approaches, energy balance formulations, and reanalysis-driven land surface models. None of these products explicitly represents irrigation through prescribed water applications; instead, irrigation effects may be represented implicitly, or through specific stress-related treatments, depending on the nature of the input data and on how vegetation water stress is formulated within each model.
2.1.1 FLUXCOM RS
FLUXCOM RS (Jung et al., 2019) is based on a machine learning algorithm trained on data from 224 flux towers from the FLUXNET La Thuile synthesis dataset and the CarboAfrica network (Valentini et al., 2014). Among these, 27 sites are croplands, including seven irrigated ones. The model uses MODIS-based predictors – LST, land cover type, fraction of absorbed photosynthetically active radiation (fAPAR), enhanced vegetation index (EVI) – as well as net radiation (Rn) from CERES.
2.1.2 GLEAM4.3a
GLEAM4.3a (Miralles et al., 2025) is a hybrid ET model combining physically based process representations with machine-learning-based parameterizations. Rainfall interception is estimated using the van Dijk–Bruijnzeel model (van Dijk and Bruijnzeel, 2001), and potential evapotranspiration (PET) is calculated using the Penman equation accounting for wind speed, vegetation height, and vapour pressure deficit (VPD). GLEAM4.3a solves a multi-layer soil water balance and includes an irrigation-related treatment based on dynamic irrigated area maps and crop phenology information (Baez-Villanueva et al., 2026). Over pixels identified as irrigated and during the irrigated growing season, soil moisture is reset to field capacity, increasing root-zone water availability. ET is then estimated by constraining PET with a multiplicative evaporative stress factor inferred through machine learning using soil moisture and environmental predictors. Surface soil moisture from ESA CCI (Dorigo et al., 2017) is also assimilated to constrain soil moisture dynamics.
2.1.3 ERA5-Land
ERA5-Land (Muñoz-Sabater et al., 2021) is a reanalysis product built on the H-TESSEL land surface model. ET is physically modeled using the Penman–Monteith equation, based on net radiation (Rn), soil heat flux, aerodynamic resistance (ra), surface resistance (rs), and VPD. Rn is computed from ERA5 radiative fluxes, while the remaining terms are derived from ERA5 atmospheric fields and pre-defined land-surface properties. Although ERA5-Land does not directly assimilate satellite observations, satellite information can still influence the product indirectly through the atmospheric forcing inherited from ERA5. Vegetation water stress is represented through the formulation of rs, which depends on root-zone soil moisture simulated by the model's soil water balance and on VPD.
2.1.4 MOD16A2
MOD16A2 (Mu et al., 2011) is based on a modified version of the Penman–Monteith equation that integrates MODIS-derived surface and vegetation properties (LAI, fAPAR, albedo) with meteorological inputs from the NASA GMAO (GEOS-5) reanalysis, including air temperature and VPD. Water stress is represented through the surface resistance term (rs), which combines stomatal regulation based on VPD and minimum air temperature (Tmin) with canopy scaling driven by MODIS LAI and fAPAR.
2.1.5 SSEBop v6.1
SSEBop v6.1 (Senay et al., 2023) is based on a simplified surface energy balance approach. In version 6.1 used here, ET is calculated as the product of a reference evapotranspiration (ET0) – taken from climatological Penman–Monteith fields provided by TerraClimate (Abatzoglou et al., 2018) – and an evaporative fraction (ETf) derived from VIIRS-based LST (Hulley et al., 2018). ETf is determined by comparing each pixel’s LST to a dynamically estimated “cold/wet” reference temperature representing maximum ET conditions. This reference temperature is computed locally within a 5 × 5 km moving window using NDVI–LST relationships to identify well-watered vegetation, following the FANO algorithm of Senay et al. (2023).
2.1.6 PMLv2
PMLv2 (Zhang et al., 2019) uses a semi-mechanistic model based on a modified Penman–Monteith equation. Vegetation water stress is accounted for via VPD derived from GLDAS-2.1 simulations and regulates both stomatal conductance and surface resistance. The model’s VPD response is calibrated separately for each biome using observations from 95 flux towers, including 11 in the cropland biome – four of which are irrigated. Model inputs include MODIS-derived variables (LAI, albedo, and emissivity) as well as daily meteorological forcings from GLDAS-2.1, such as precipitation, air temperature, humidity, radiation, and wind speed.
2.1.7 Dataset harmonization and preprocessing
For intercomparison purposes, all ET datasets were resampled to a common 0.1° grid (that of GLEAM4.3a) to ensure spatial consistency. Products with native resolution finer than 0.1° were aggregated using area-weighted averaging, while ERA5-Land (native 0.1°) was bilinearly interpolated to ensure grid alignment. Monthly means were then computed for all datasets.
2.1.8 Overview of the ET datasets
Figure 1 illustrates the average ET during the peak irrigation season (July–August) across the CONUS for the period 2012–2020, for each product. Table 1 summarizes the datasets’ spatial and temporal resolutions, available periods, and data sources. Note that SSEBop v6.1 covers a shorter period (2012–2025), while the others extend back to 2001 or 2000.
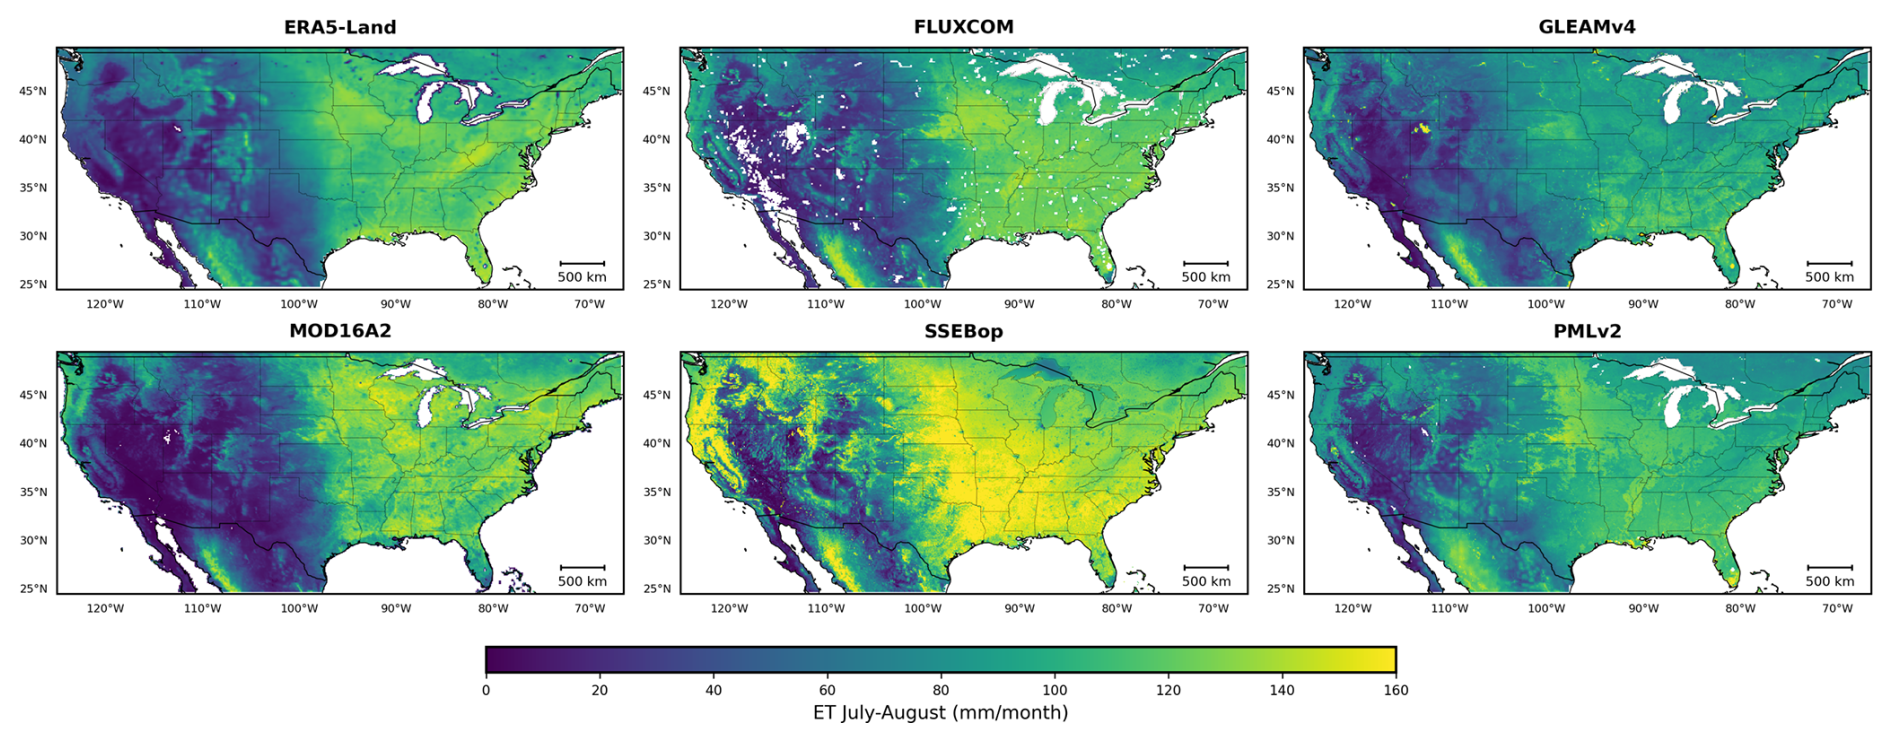
Figure 1Mean ET (2012–2020) during the peak irrigation season (July–August) over the CONUS for the six ET products, after resampling all datasets onto the common 0.1° GLEAM4.3a grid.
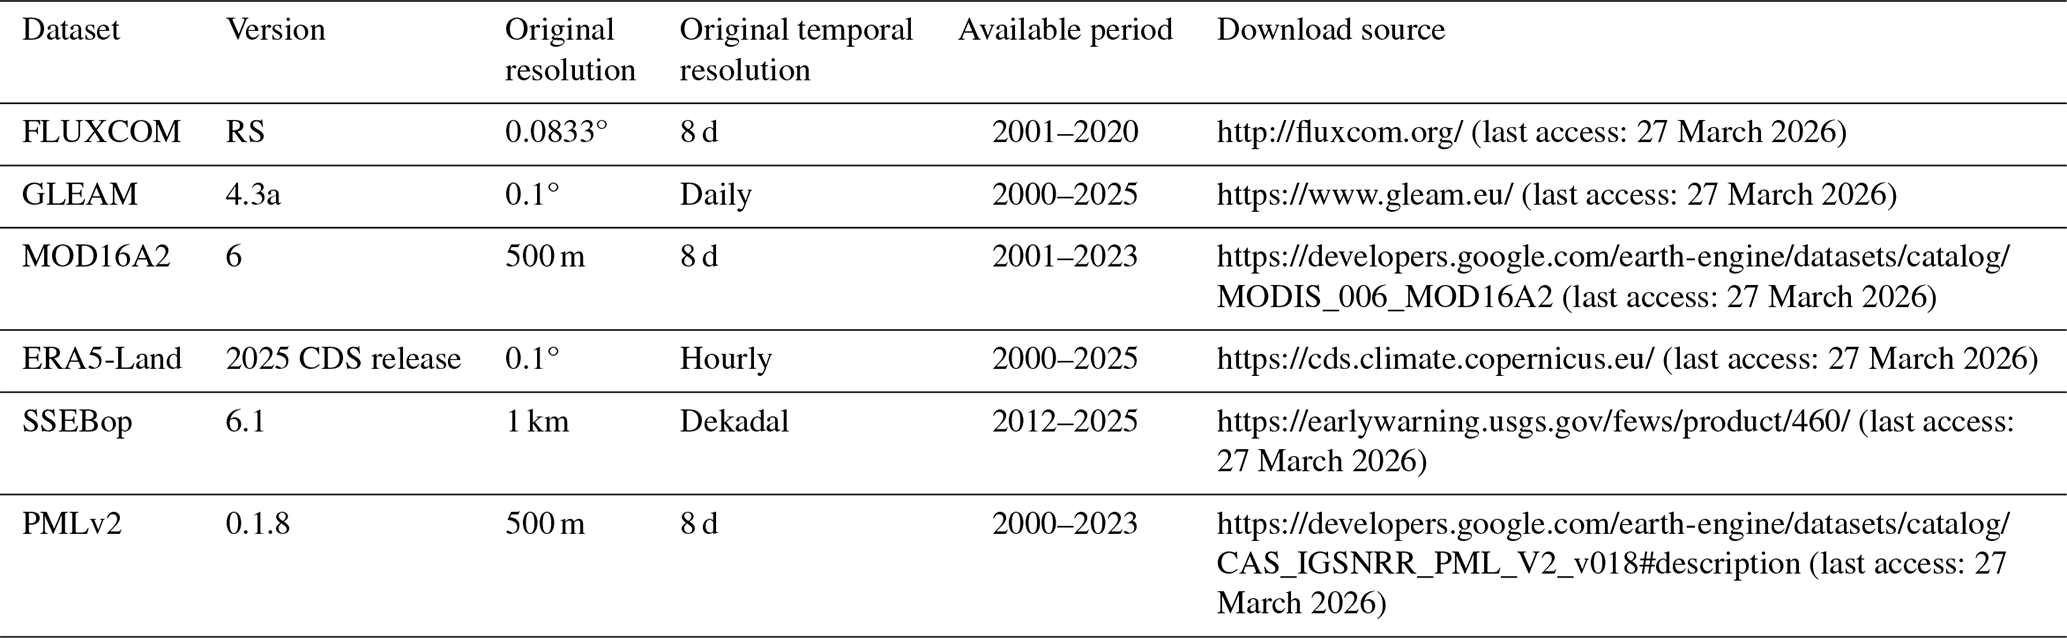
Table 1Main characteristics and download sources of the six assessed ET products.
2.2 Datasets used for evaluation
2.2.1 Map of area equipped for irrigation
The Global Map of Irrigated Areas version 5 (GMIAv5; Siebert et al., 2013), provided at a spatial resolution of 0.0833°, compiles subnational statistical information from administrative units, national census data, and international reports on irrigated areas for the period 2000–2008. In addition, GMIAv5 includes a country-level quality-control flag ranging from “very poor” to “excellent”, which reflects the availability, detail, and internal consistency of the underlying national statistics. For instance, the data quality is rated as “very good” for Italy and Spain, and “good” for the United States, India, and Pakistan. We used this map to evaluate whether the ET products can capture the spatial extent of irrigated areas. The underlying assumption is that, within a given grid cell, a higher degree of area equipped for irrigation should correspond to higher ET during the irrigation season. To test this hypothesis, we rescaled the GMIAv5 dataset to match the spatial resolution and grid geometry of the ET products, and computed Pearson’s correlation coefficient between the percentage of land equipped for irrigation and the corresponding mean ET during the peak irrigation season for each product.
2.2.2 OpenET
The OpenET platform (Melton et al., 2022) represents a consensus effort to operationalize multiple well-established ET models under a common framework, combining six models to estimate ET. Four of these are based on surface energy balance approaches: METRIC (Allen et al., 2007), DisALEXI (Anderson et al., 2007), geeSEBAL (Bastiaanssen et al., 1998), and SSEBop (Senay et al., 2013). In addition, the platform includes PT-JPL (Fisher et al., 2008), a simplified formulation of the Penman–Monteith equation, and SIMS (Melton et al., 2012), an agro-hydrological model that incorporates crop-specific phenology and irrigation schedules. All six models rely on Landsat 30 m imagery, using LST and vegetation parameters derived from optical and thermal bands.
Among the OpenET models, SSEBop is also included in the set of global ET products evaluated in this study. However, the version assessed here (v6.1) differs from the one used in OpenET in two key aspects: (i) v6.1 derives LST from VIIRS rather than Landsat, and (ii) v6.1 computes reference evapotranspiration (ET0) using meteorological inputs from TerraClimate, whereas OpenET uses gridMET.
OpenET was selected as a benchmark for the CONUS (where the platform currently provides coverage) because it provides a unique ensemble of independently developed models, widely used in operational water management and irrigation monitoring (e.g. Allen et al., 2007; Senay et al., 2016; Knipper et al., 2019; Volk et al., 2024). While not a direct ground truth, OpenET offers a spatially explicit reference constrained by satellite data for assessing the relative consistency of global ET products in irrigated regions. Accordingly, it is used here not as an absolute validation dataset, but as an additional benchmark to evaluate the agreement in spatial and seasonal ET dynamics across independent modeling approaches. In this study, we use the OpenET ensemble product, defined as the median of the six model estimates.
2.2.3 Eddy covariance measurements
To evaluate the performance of the selected datasets against in situ measurements, we used data from two eddy-covariance towers located in irrigated croplands of the Po Valley, northern Italy: Landriano (45.31° N, 9.27° E) and Livraga (45.18° N, 9.57° E) as shown in Fig. 2.
Both towers are installed in irrigated maize fields. The Landriano site provides data for 2008–2011 (Masseroni et al., 2013), and Livraga for 2011–2014 (Nana et al., 2014). Data processing followed standard community protocols, including Webb–Pearman–Leuning (WPL) corrections, filtering of non-stationary periods, and coordinate rotation. Missing values were linearly interpolated, and the resulting time series were aggregated to monthly means to match the temporal resolution of the global ET products.
A key challenge when using eddy covariance tower data for product evaluation lies in the spatial scale mismatch: tower footprints typically range from 100 to 300 m, whereas the ET products analyzed here have a resolution of approximately 10 km. To mitigate this discrepancy, we ensured that both towers are located within homogeneous agricultural landscapes dominated by irrigated maize. Figure 2 shows the 0.1° grid cells (in red) from the analyzed ET datasets, overlaid with irrigated maize plots (in green) as identified by the 2021 WorldCereal database (Van Tricht et al., 2023). The grid cell containing the Livraga site includes 46 % irrigated maize, while the one containing the Landriano site includes 34 %. The remaining areas are mostly classified as temporary crops (e.g., soybean, rice, or other annuals), which are not labeled as irrigated in the WorldCereal dataset, although both soybean and rice are in practice often irrigated in the Po Valley. These two sites were not involved in the training or calibration of any of the evaluated ET products.
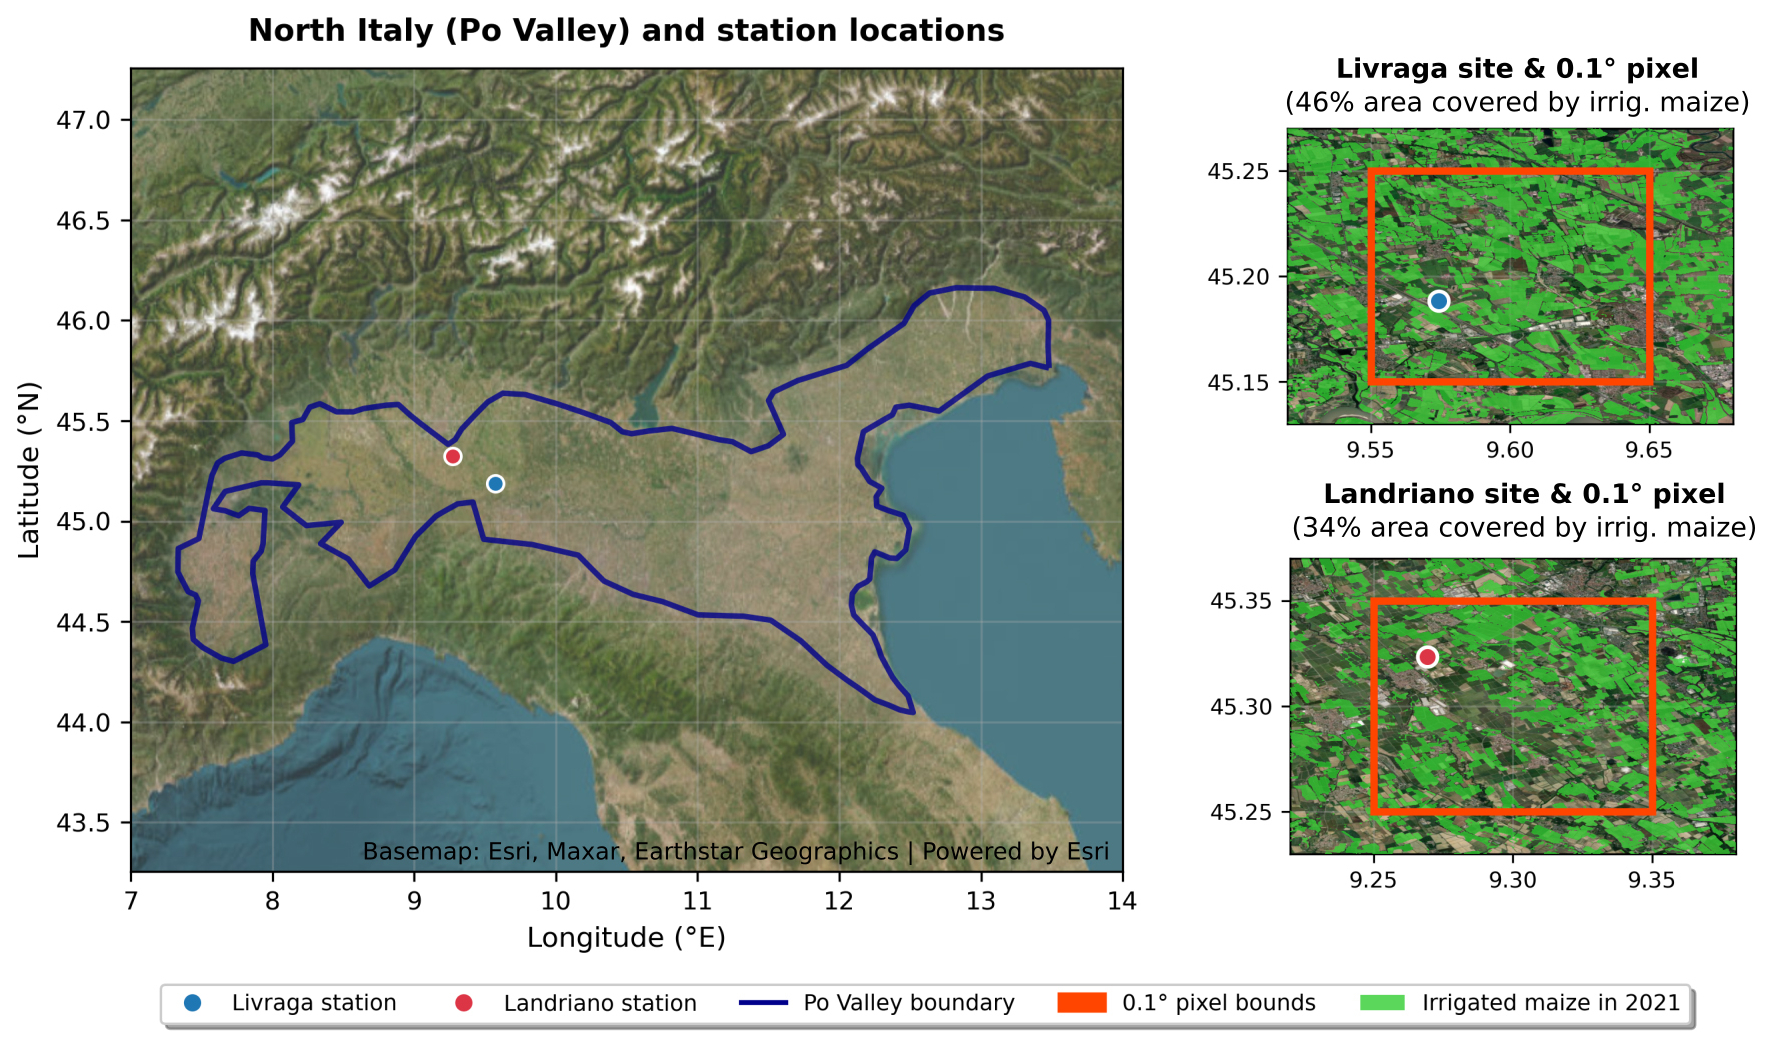
Figure 2Left: location of the two irrigated maize flux sites (Landriano and Livraga) in the Po Valley, northern Italy. Right: Contour of the 0.1° pixels from the ET datasets (in red), including the tower locations; green areas show irrigated maize plots from the 2021 WorldCereal database.
2.3 Study areas
We selected seven intensively irrigated regions distributed across the CONUS, Europe, and South Asia, as shown in Fig. 3. The figure also shows the percentage of land area equipped for irrigation, as reported by GMIAv5 (Siebert et al., 2013).
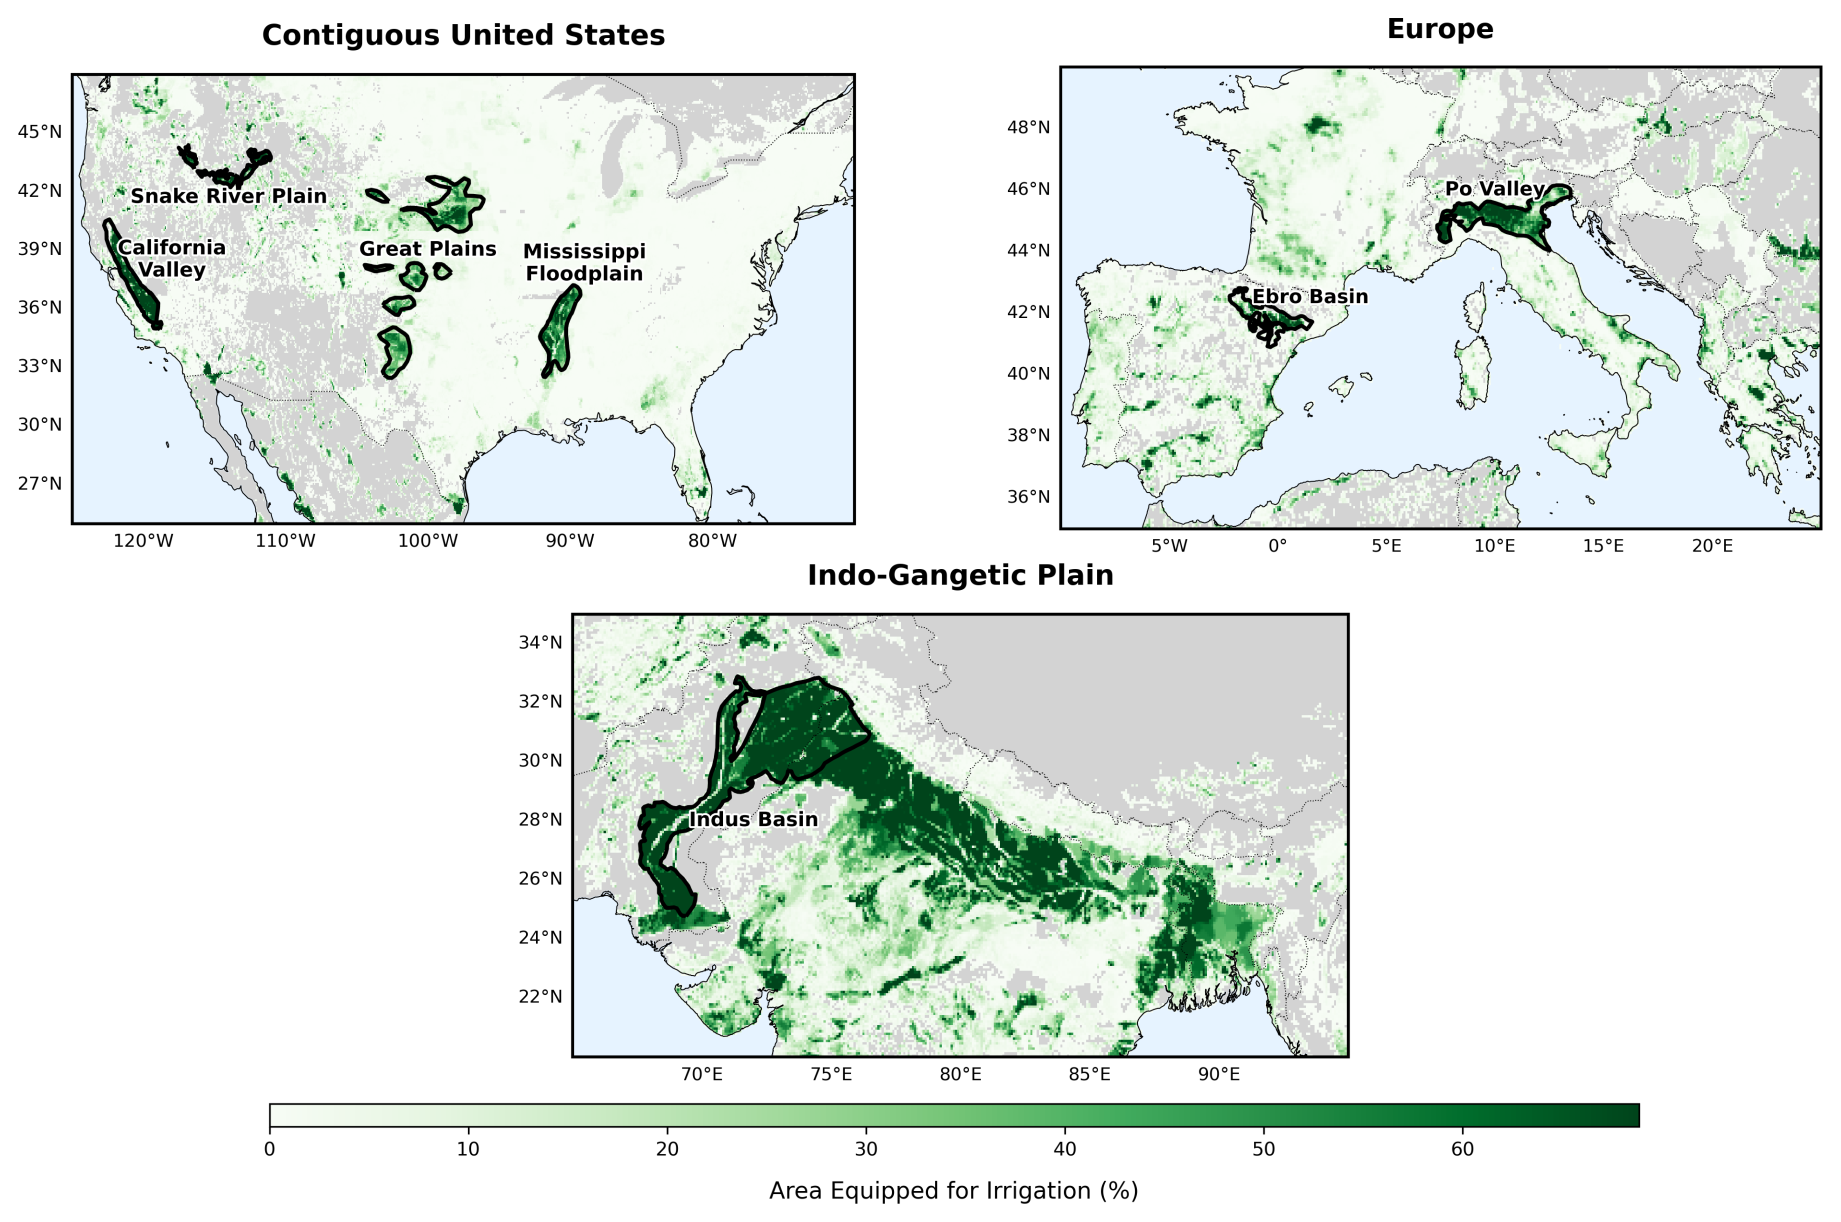
Figure 3Locations of the seven irrigated regions analyzed in this study, with percentage of area equipped for irrigation from GMIAv5 (Siebert et al., 2013).
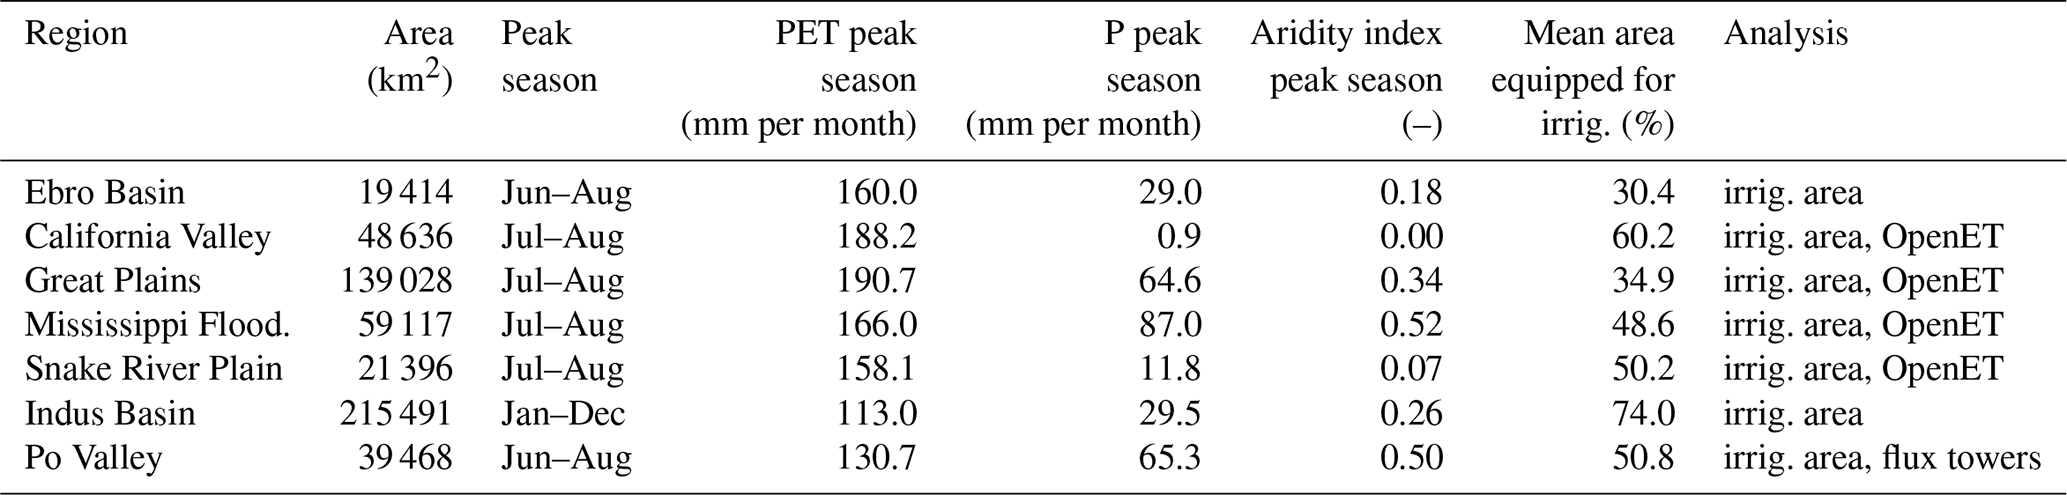
Table 2 summarizes the main characteristics of the selected regions, including total area, timing of the peak irrigation season, and average monthly precipitation (from MSWEP v2.8; Beck et al., 2019), PET from GLEAM4.3a, and aridity index (), all computed over the peak irrigation season. The table also reports the average percentage of land equipped for irrigation and specifies the type of evaluation conducted in each region: spatial correspondence with irrigated area (irrig. area), comparison with the OpenET ensemble (OpenET), or performance evaluation against in situ eddy covariance data (flux towers).
Table 2Main characteristics of the seven irrigated regions, including climate indicators and specific assessments conducted in each region.
2.4 Evaluation metrics
We quantified the agreement between ET products and the reference datasets using three standard metrics: Pearson’s correlation coefficient (R), root mean square deviation (RMSD), and mean bias (defined as ETproduct − ETreference). For the comparison against eddy-covariance measurements and OpenET, all metrics were computed over the growing-season months only. For the evaluation against the map of areas equipped for irrigation, we assessed spatial consistency by computing pixel-wise correlations between ET and the fraction of area equipped for irrigation.
3.1 Comparison with area equipped for irrigation: spatial evaluation
Figure 4 and Table 3 summarize the relationship between mean ET during the peak irrigation season (as defined in Table 2) and the percentage of area equipped for irrigation. Figure 4 presents pixel-wise scatterplots for each product and study region, showing how mean ET during the peak irrigation season varies with the proportion of irrigated area within each grid cell. Table 3 reports the corresponding Pearson correlation coefficients, with additional rows summarizing average correlations separately for arid/semi-arid and humid regions. Regions were classified as arid/semi-arid or humid based on their long-term aridity index (Table 2); California Valley, Snake River Plain, Ebro Basin, and Indus Basin are considered arid/semi-arid, while the Great Plains, Mississippi Floodplain, and Po Valley are classified as humid.
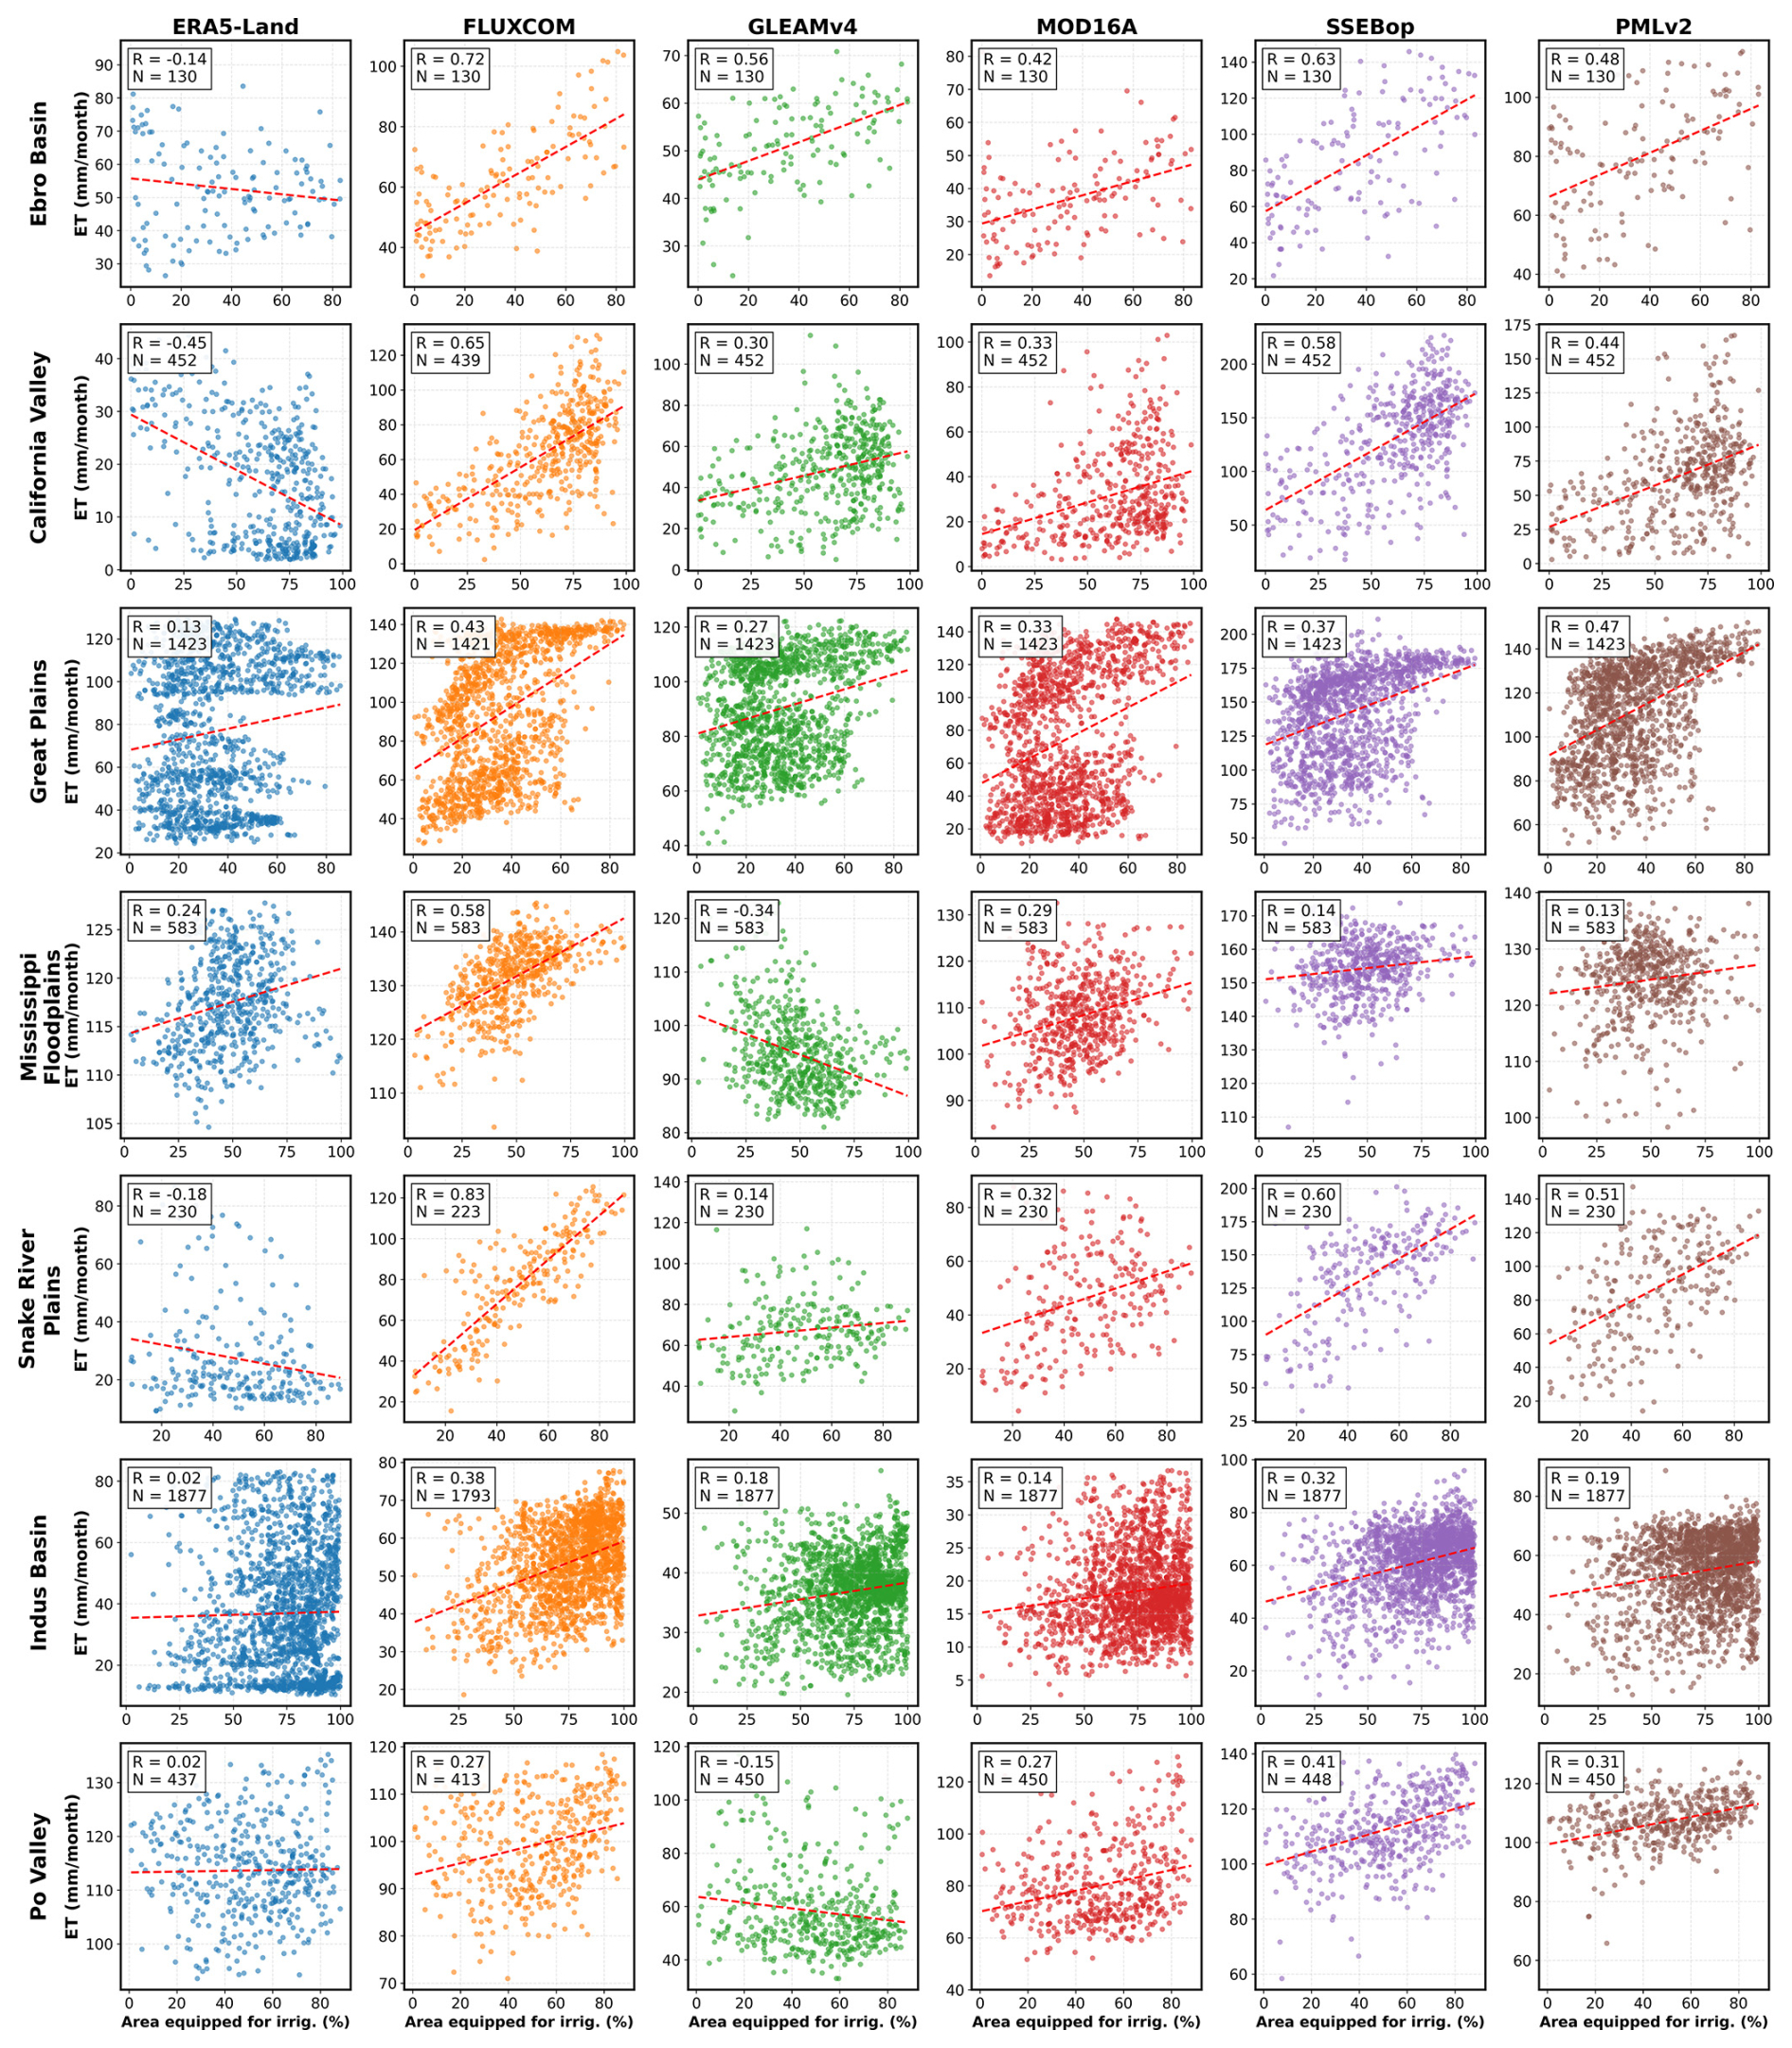
Figure 4Scatterplots showing the pixel-wise relationship between mean ET during the peak irrigation season (as defined in Table 2) and the fraction of area equipped for irrigation, for each ET product and irrigated region. N denotes the number of valid grid cells included in each correlation analysis.
Table 3Pearson correlation coefficients between mean ET during the peak irrigation season and the percentage of land equipped for irrigation for each ET product and irrigated region. Values ≥0.30 are highlighted in bold.
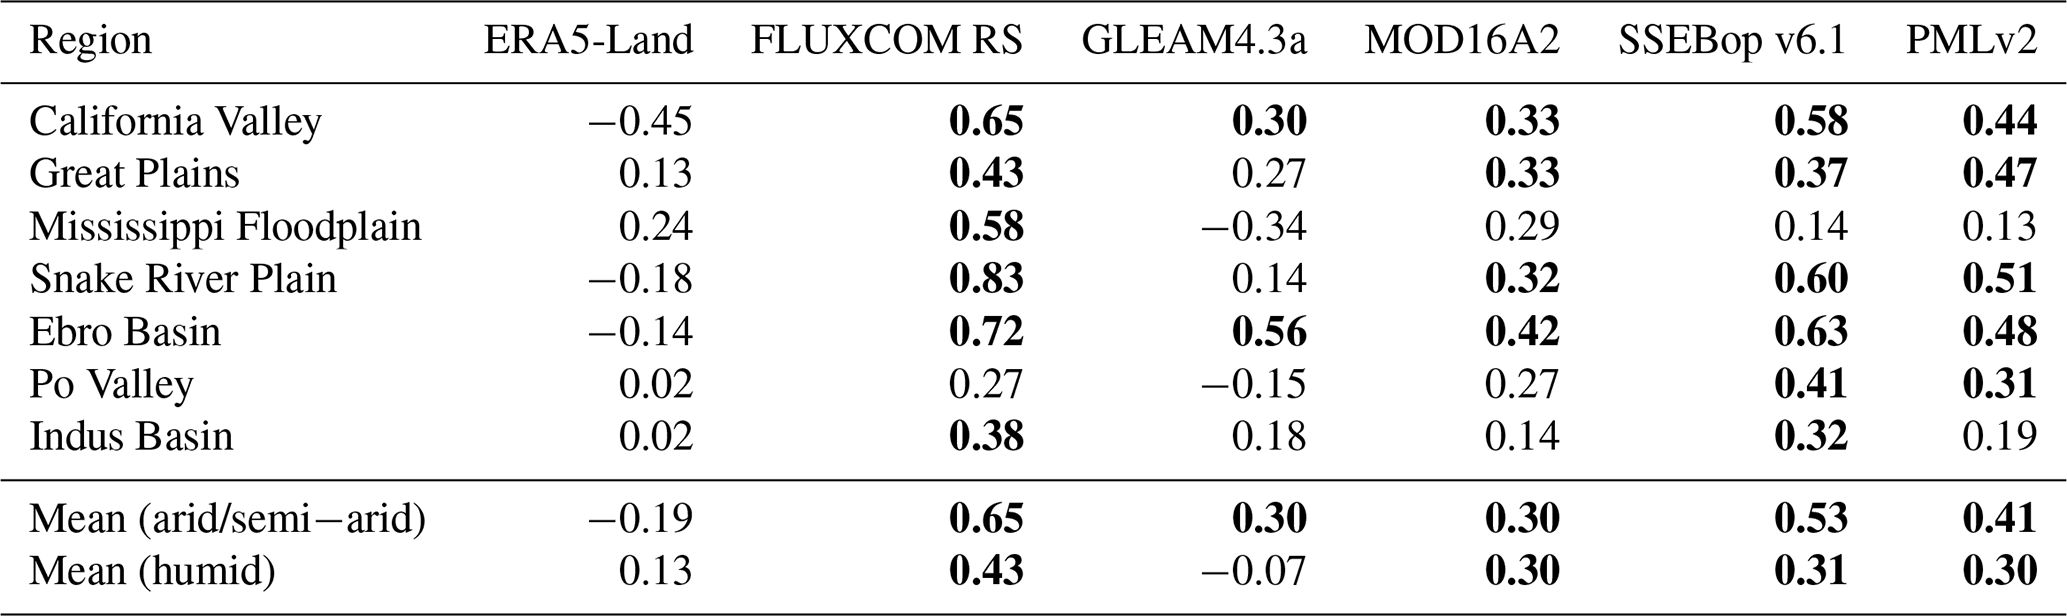
The results highlight substantial differences in the ability of the six ET products to reproduce irrigation-related spatial patterns. In arid and semi-arid regions, FLUXCOM RS shows the strongest correspondence with the fraction of land equipped for irrigation (mean R=0.65), followed by SSEBop v6.1 (R=0.53) and PMLv2 (R=0.41). MOD16A2 and GLEAM4.3a both show mean correlations of R=0.30, while ERA5-Land exhibits weak correspondence (R= −0.19). In humid regions, FLUXCOM RS also exhibits the highest average correlation (R=0.43), while MOD16A2, SSEBop v6.1, and PMLv2 show similar mean correlations (R≈0.30). ERA5-Land shows weak correspondence (R=0.13). For GLEAM4.3a, correlations vary across regions, ranging from R=0.27 in the Great Plains to R= −0.15 in the Po Valley and R= −0.34 in the Mississippi Floodplain.
These patterns are consistent with strong hydro-climatic controls on the detectability of irrigation signals. Highest correlations are generally observed in arid and semi-arid basins such as the Snake River Plain, Ebro Basin, and California Valley, where irrigation induces sharp ET contrasts relative to surrounding non-irrigated areas. In contrast, correlations are systematically lower in more humid regions, including the Mississippi Floodplain and the Po Valley, where background moisture availability reduces the ET contrast between irrigated and rainfed croplands. A notable exception is the Indus Basin, which, despite its arid climate and extensive irrigation, exhibits relatively weak correlations for both PMLv2 and MOD16A2.
3.2 Comparison with OpenET: seasonal dynamics and magnitude assessment
Figure 5 shows the time series of the six ET products (colored lines) compared with the OpenET ensemble (black line) from 2016 to 2023 across four major irrigated regions in the CONUS: the California Valley, Snake River Plain, Mississippi Floodplain, and Great Plains. The corresponding seasonal cycles are also displayed. Table 4 reports statistical metrics describing the agreement between the ET products and OpenET during the main irrigation season (April–September). Metrics include the Pearson correlation coefficient (R), RMSD, mean bias, and average ET, all computed over April–September.
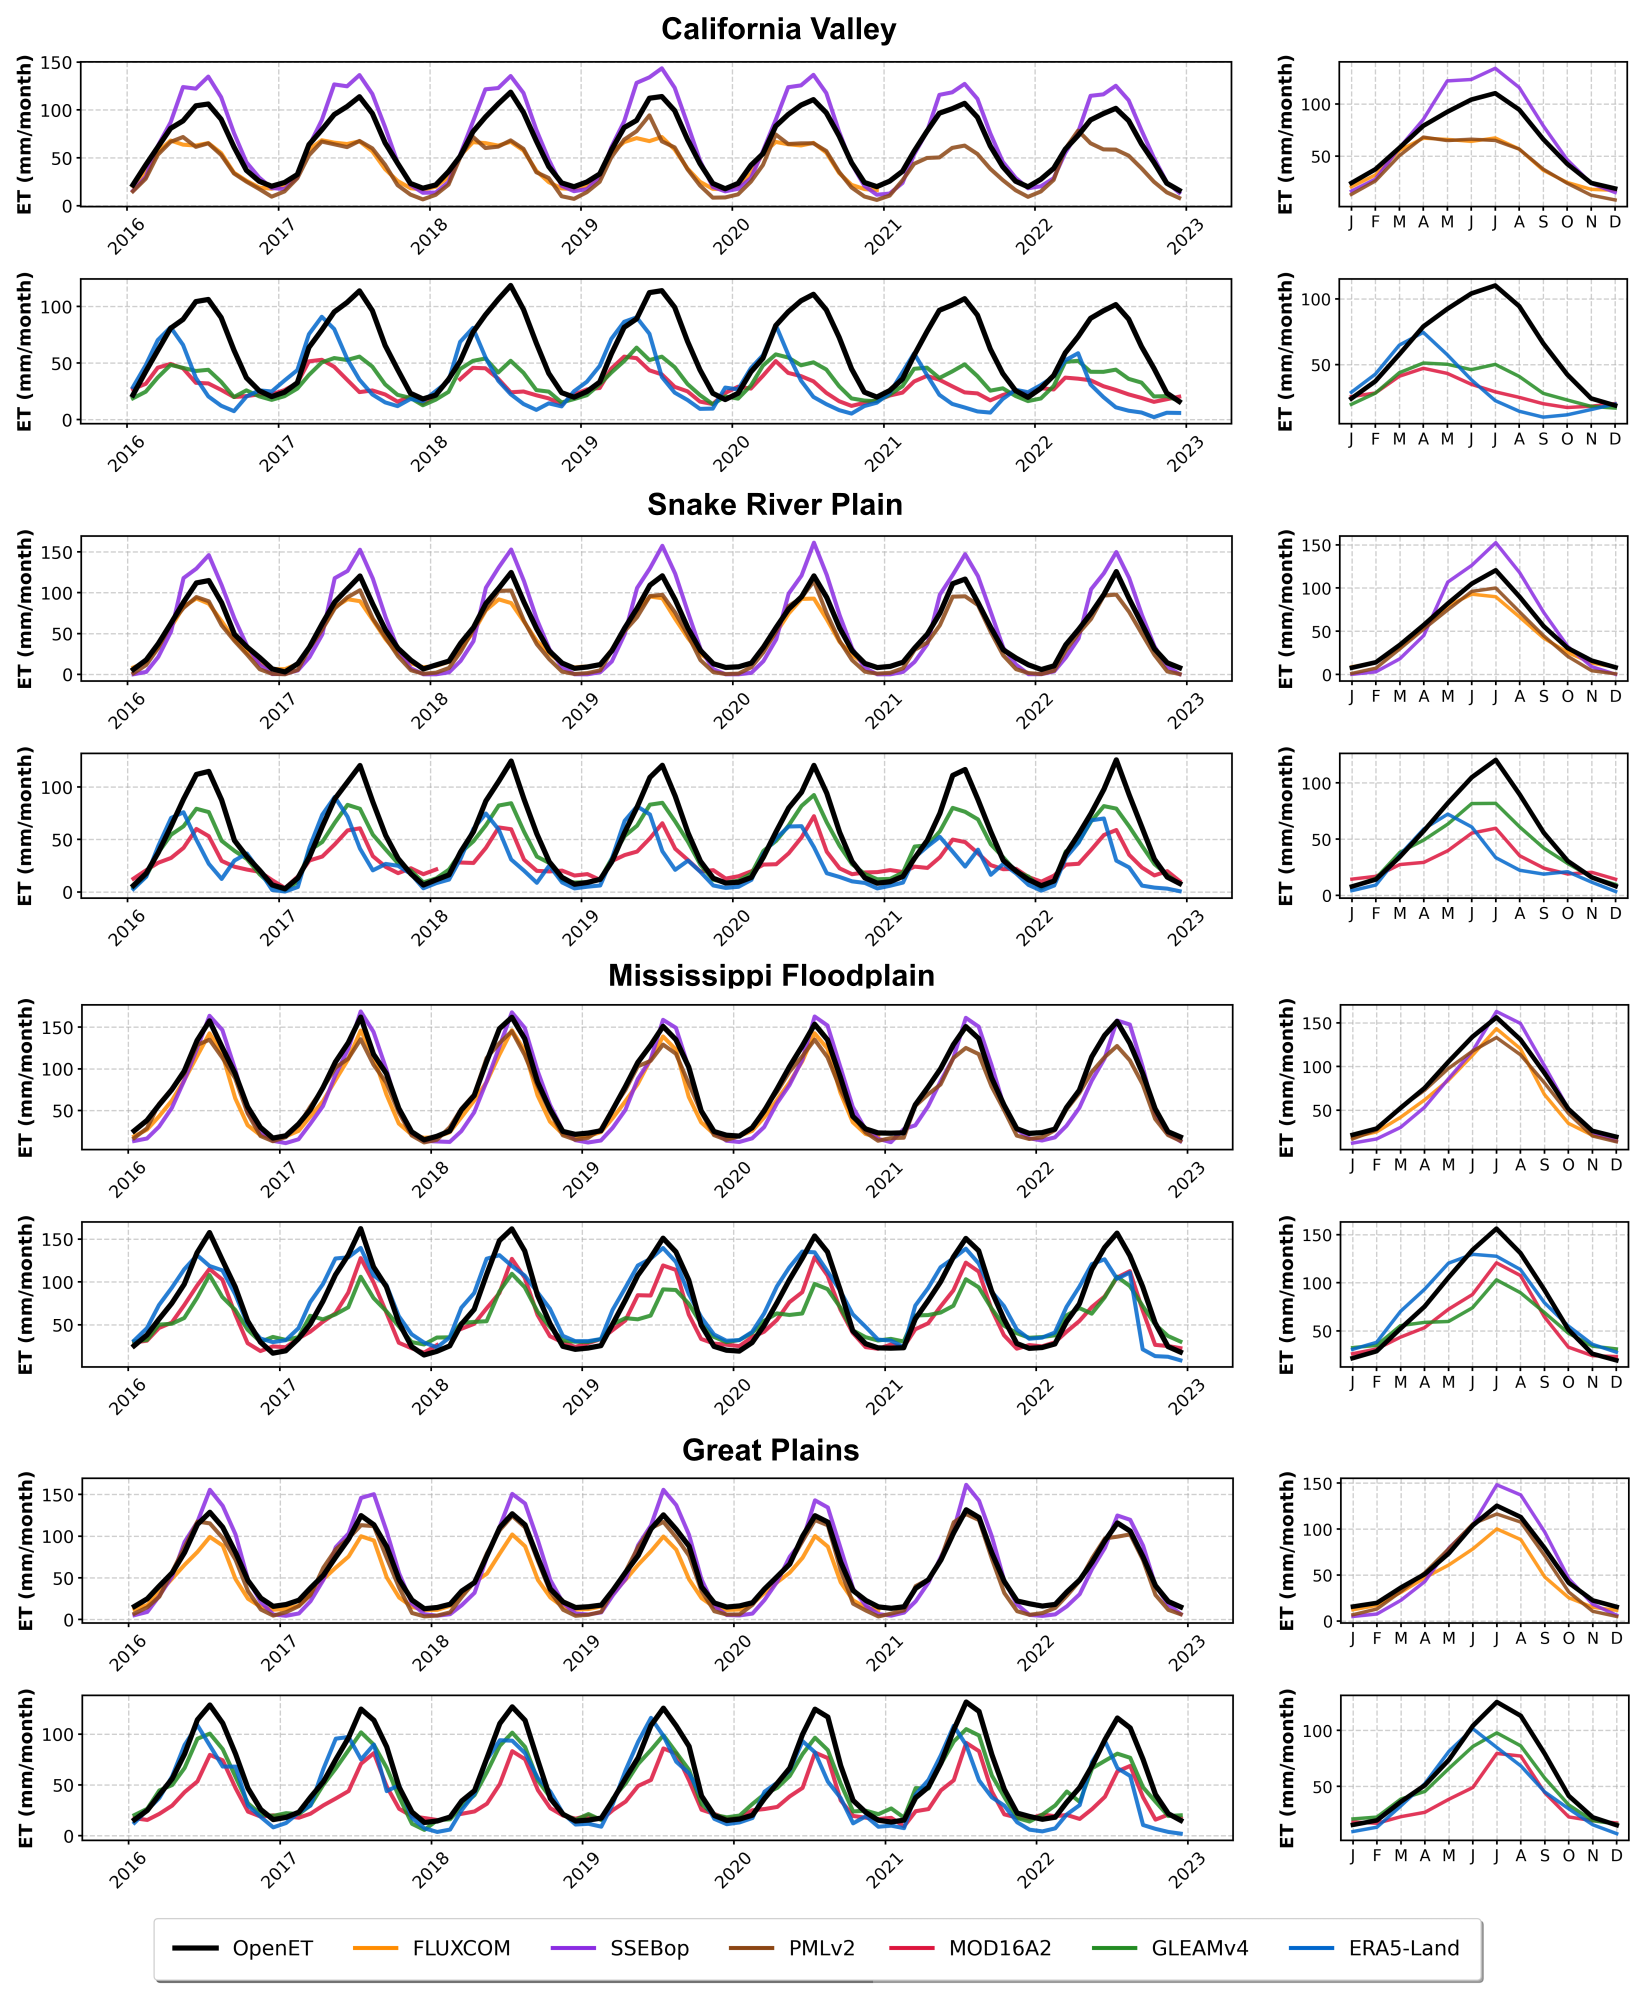
Figure 5Left: monthly time series of mean ET from the six global products (colored) and OpenET (black) from 2016 to 2023 over four major irrigated regions in the CONUS. Right: the corresponding seasonal cycles.
Table 4Statistical comparison between ET products and OpenET across four irrigated regions in the CONUS during the main irrigation season (April–September). Metrics include the Pearson correlation coefficient (R), RMSD, mean bias, and mean ET. For OpenET, the mean seasonal ET is reported.
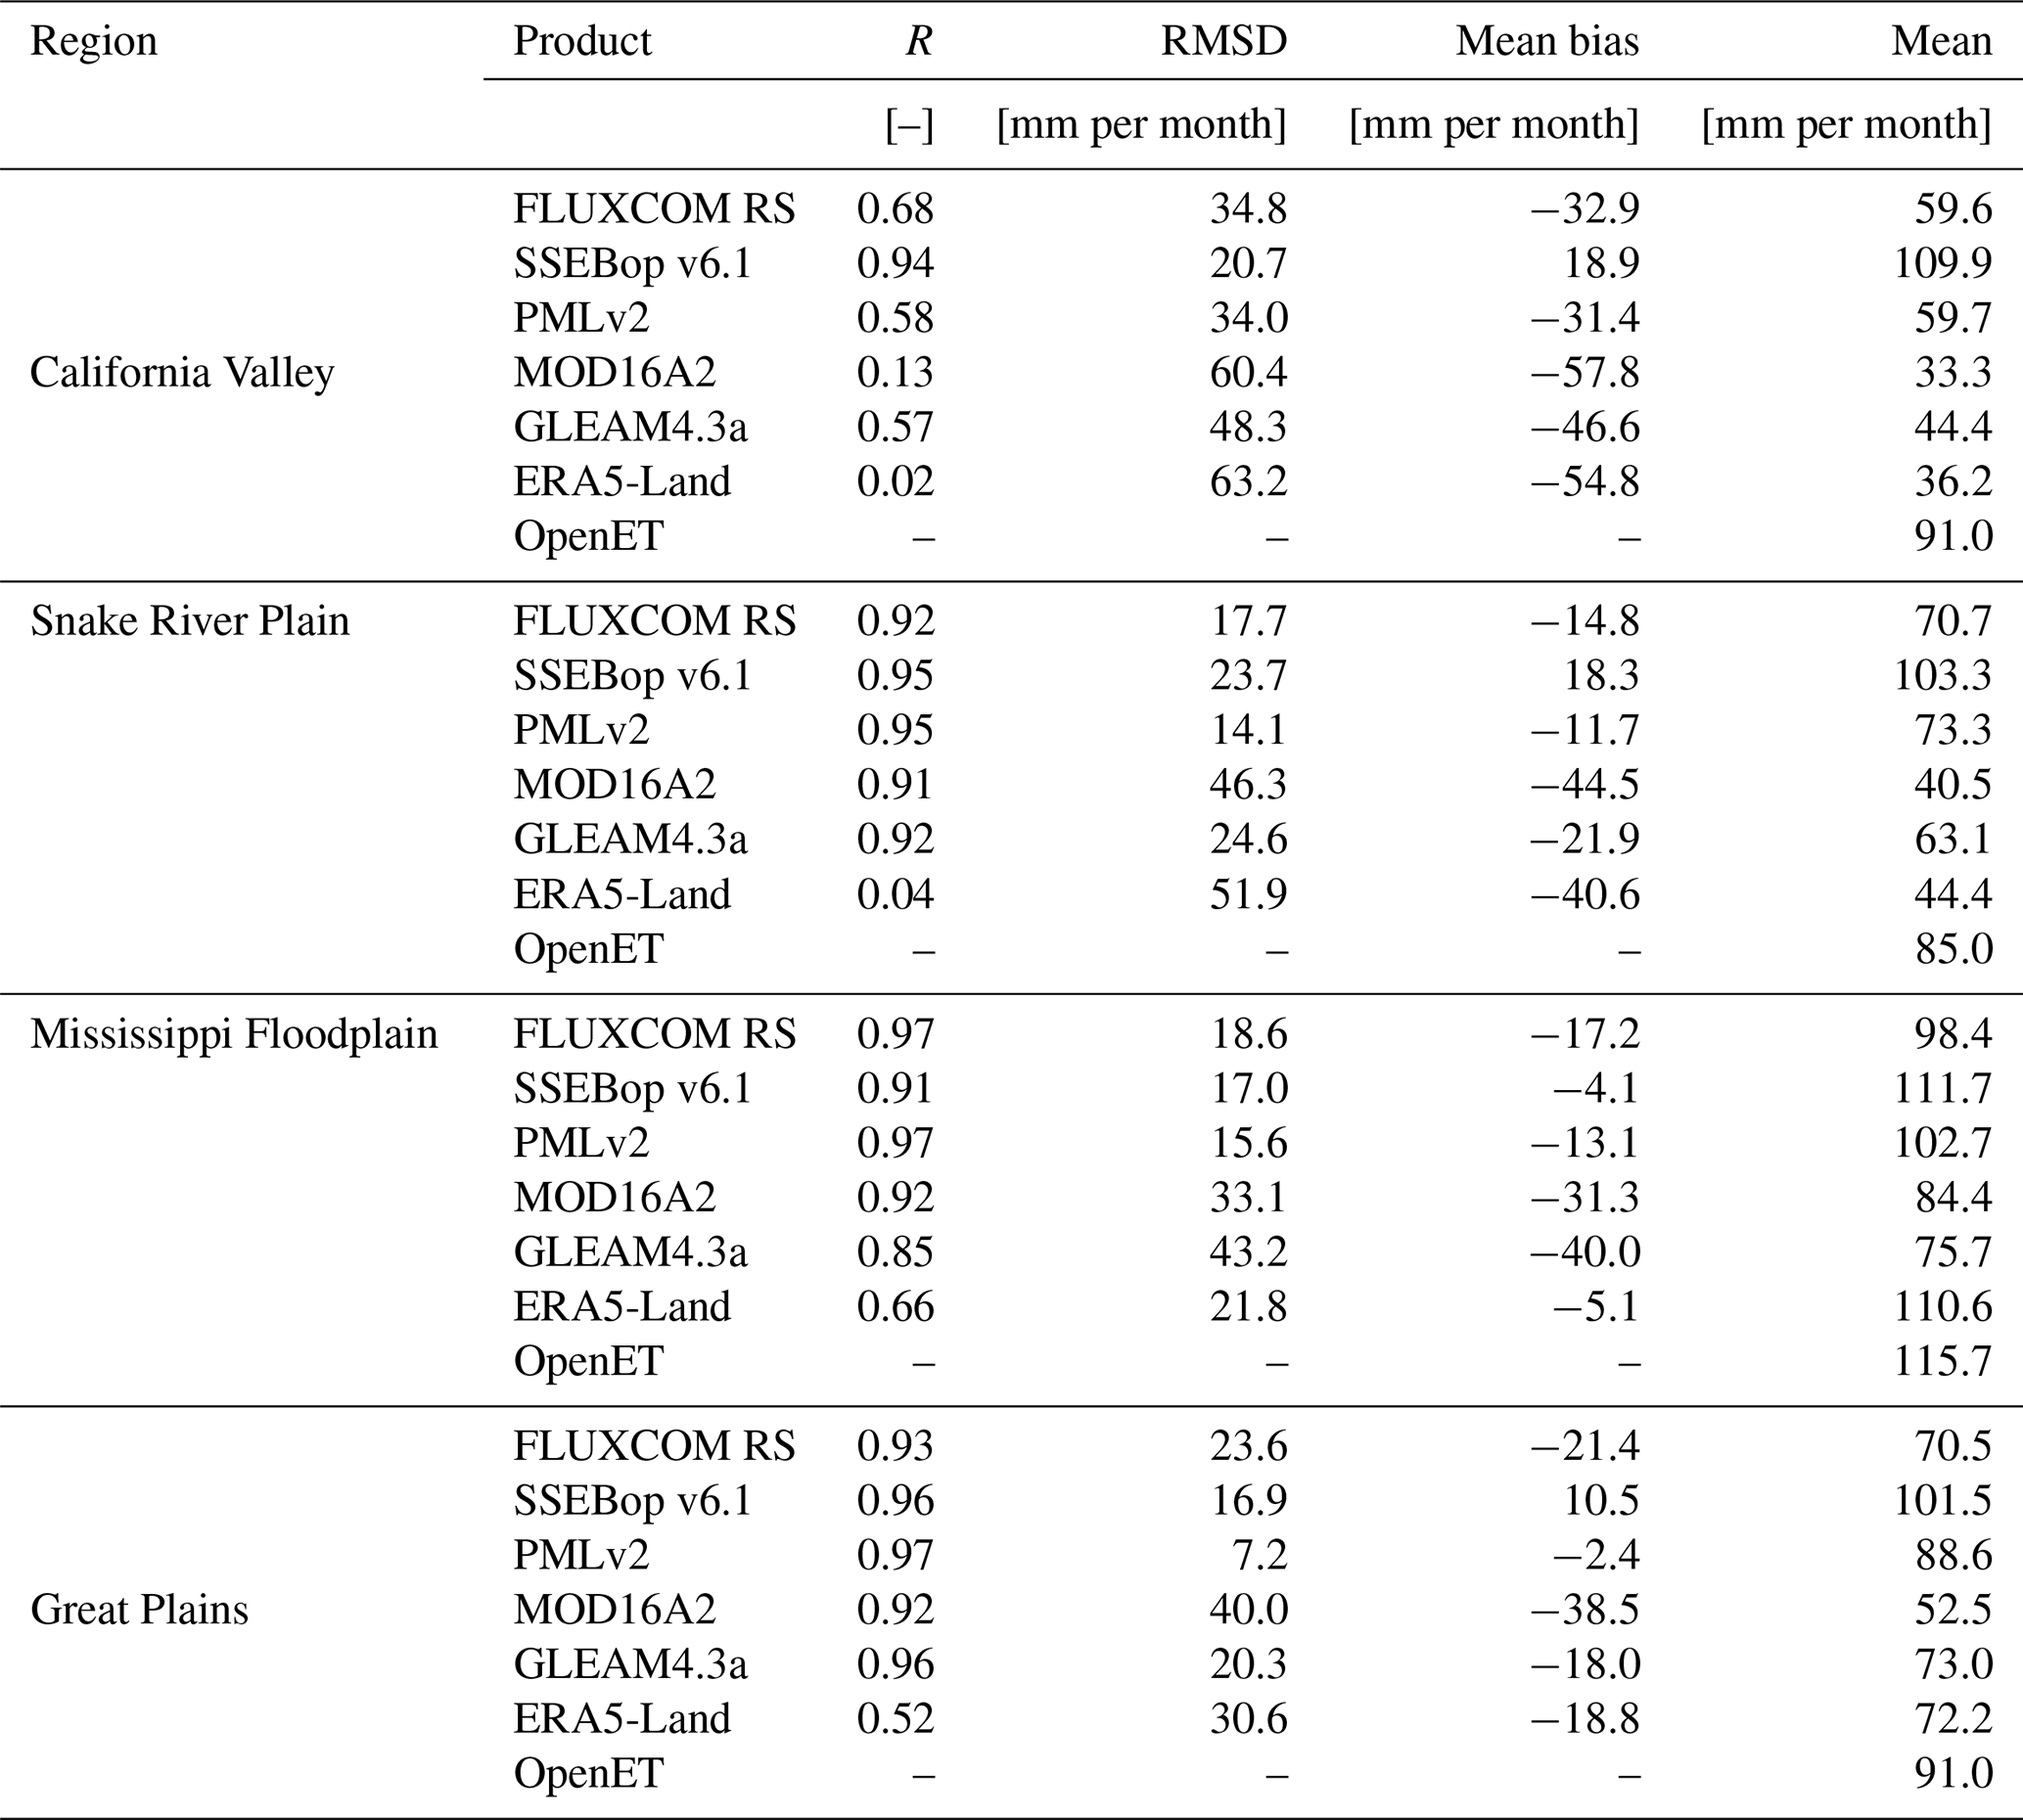
Clear differences emerge in the magnitude and seasonal variability of ET across products. SSEBop v6.1 stands out with the highest average ET during the irrigation season (106.6 mm per month), closely aligning with the magnitude and temporal dynamics of OpenET, with a mean bias of +10.9 mm per month and a very high correlation (R=0.94). In contrast, MOD16A2 yields the lowest mean ET (52.7 mm per month), showing substantially lower values than OpenET during the irrigation season (mean bias of −43.0 mm per month) and a weaker correspondence in temporal variability (R=0.72). Overall, most products estimate lower ET than OpenET during the irrigation season, with the largest negative bias relative to the benchmark observed for MOD16A2 and ERA5-Land, and more moderate, region-dependent negative bias for GLEAM4.3a.
Across regions, FLUXCOM RS, PMLv2, SSEBop v6.1, and GLEAM4.3a typically show high correlations with OpenET, while MOD16A2 shows strong correlations in most regions but very weak correspondence in the California Valley. In the California Valley, only SSEBop v6.1 shows very strong agreement with OpenET (R=0.94), whereas the other products exhibit more moderate correlations and substantial negative bias relative to the benchmark. In contrast, in the Snake River Plain and Great Plains, all products except ERA5-Land show high correlations with OpenET (R>0.9), even if systematic underestimation of ET magnitude remains.
Beyond these statistical metrics, differences also emerge in the timing and shape of seasonal peaks. OpenET and SSEBop v6.1 show a consistent maximum in July, reflecting peak irrigation demand, and this seasonal pattern is generally reproduced by MOD16A2, FLUXCOM RS, PMLv2, and GLEAM4.3a. In the California Valley, however, the July peak is weaker in FLUXCOM RS, PMLv2, and GLEAM4.3a, and largely absent in MOD16A2. In the more arid regions (California Valley and Snake River Plain), ERA5-Land tends to peak earlier in spring and shows a marked decline in ET during summer.
3.3 Comparison with eddy-covariance data: seasonal dynamics and magnitude assessment
Figure 6 shows the time series of the six ET products (colored lines) compared with flux tower measurements (black line) at two irrigated maize sites in the Po Valley: Livraga (top) and Landriano (bottom). The corresponding seasonal cycles are also shown. Table 5 summarizes the agreement of each dataset with the tower measurements during the April–September irrigation season. Metrics include the Pearson correlation coefficient (R), RMSD, mean bias, and mean ET, all calculated over the irrigated season (April–September). The table also reports the number of months included in the metrics computation. Reported R values are accompanied by two-tailed significance levels (p<0.05 (*), p<0.01 (), p<0.001 (), ns = not significant).
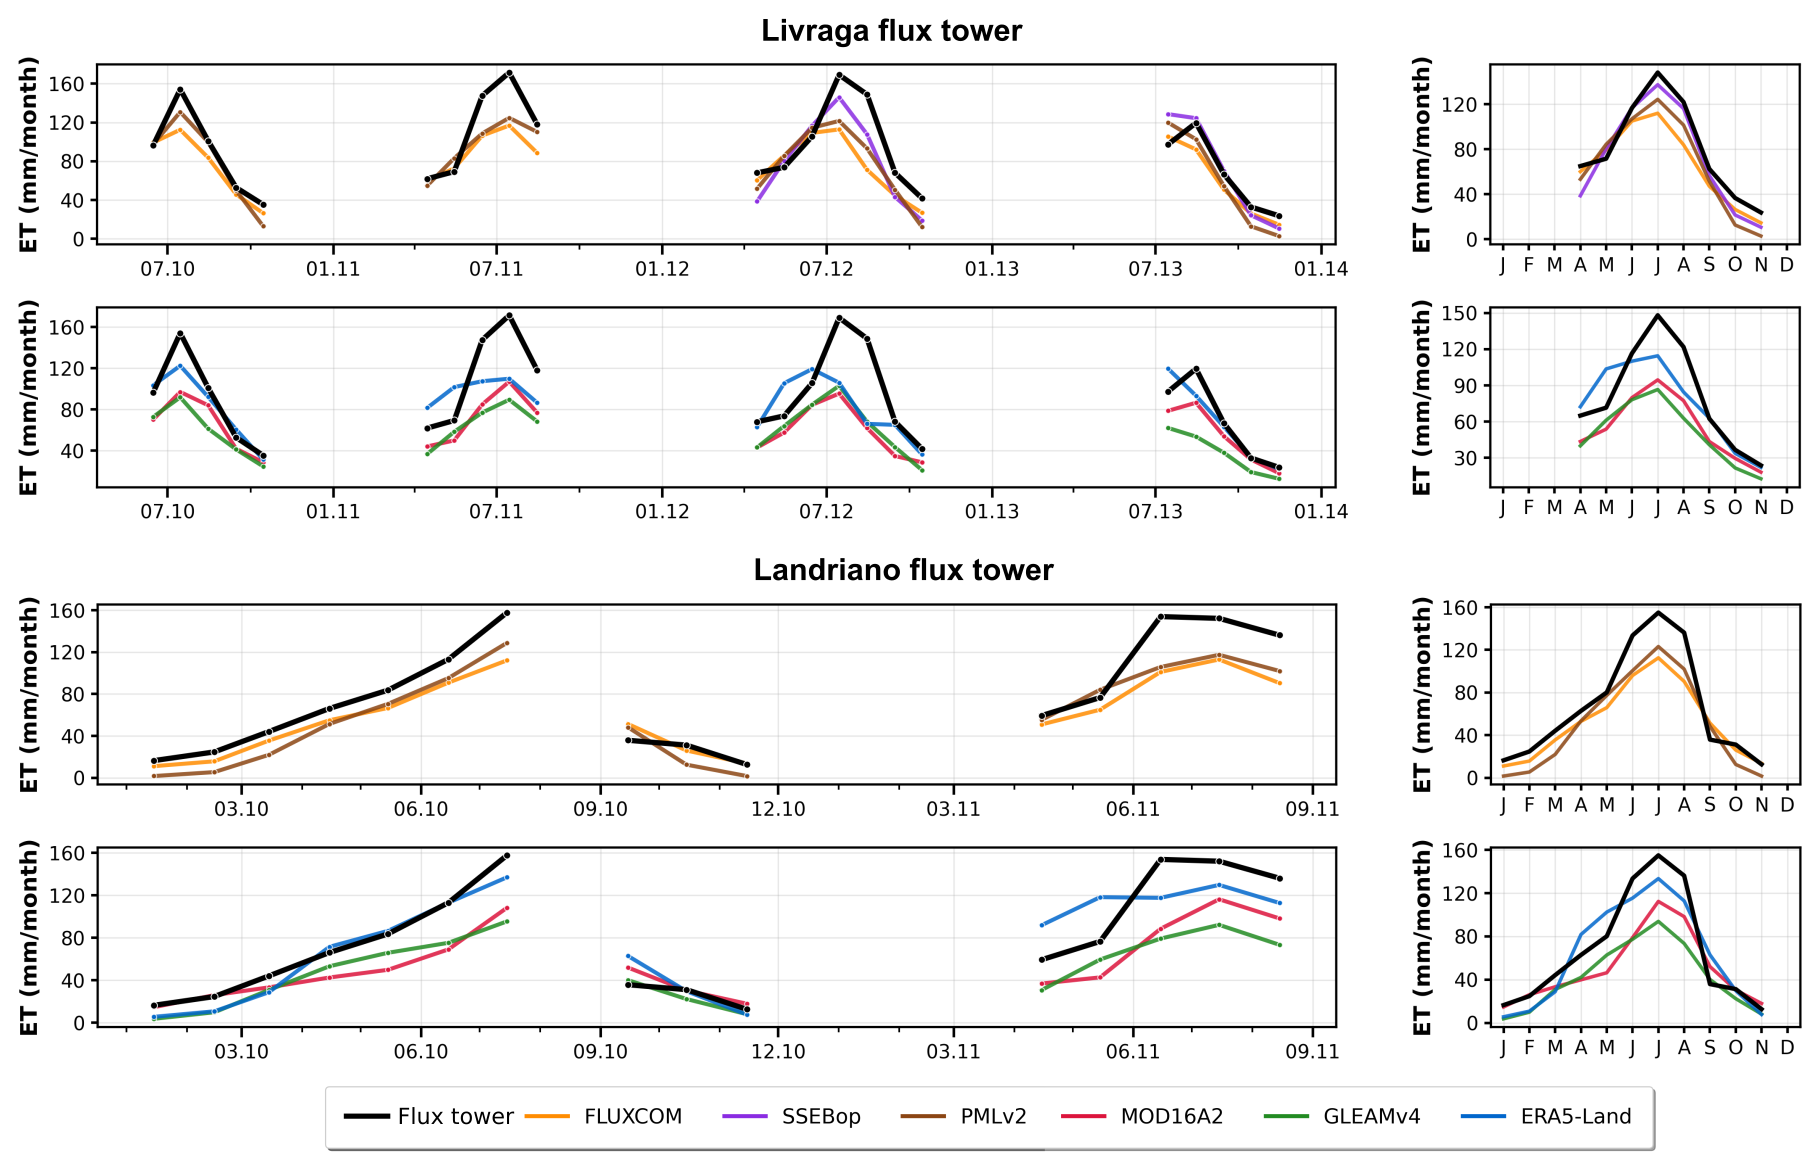
Figure 6Left: monthly ET time series from the six global products (colored) and eddy-covariance measurements (black) at the Livraga (top) and Landriano (bottom) sites. Right: the corresponding seasonal cycles.
Table 5Comparison of the six ET products with eddy-covariance measurements at the Livraga and Landriano sites during the main irrigation season (April–September). Metrics include the Pearson correlation coefficient (R), RMSD, mean bias, and mean ET, along with the number of months (N) and correlation significance levels (* p<0.05, p<0.01, p<0.001; ns = not significant).
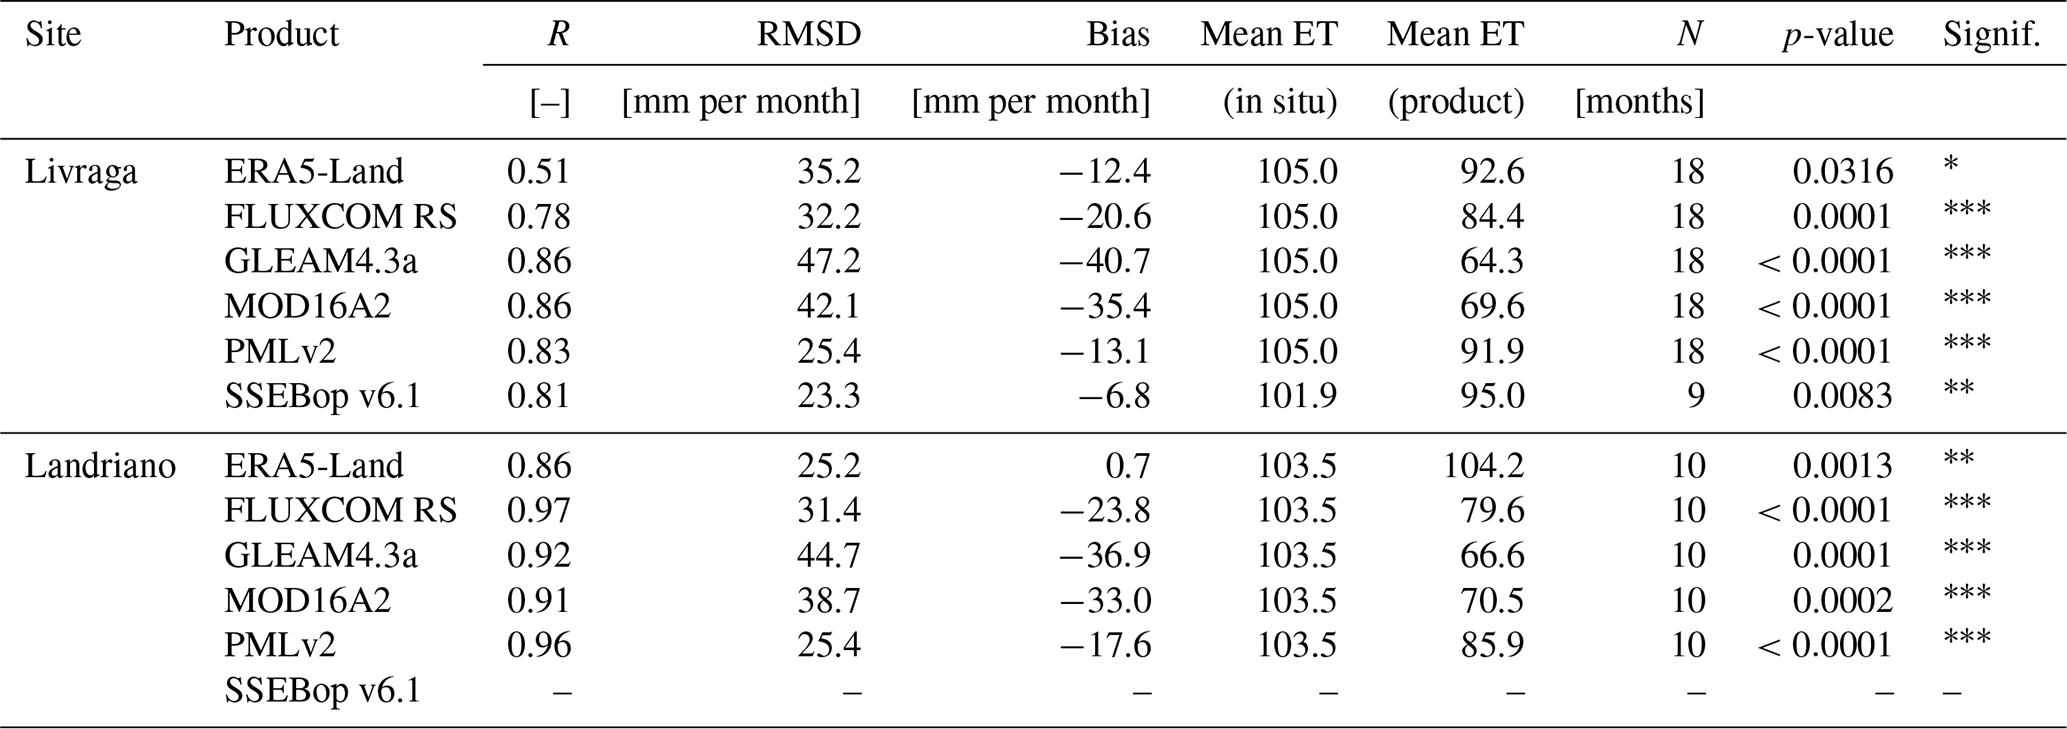
FLUXCOM RS, PMLv2, MOD16A2, and GLEAM4.3a show strong temporal agreement with the flux tower data at both sites, with mean correlation coefficients of 0.88, 0.90, 0.91, and 0.89, respectively. SSEBop v6.1 also shows a high correlation (R=0.81) during the nine-month period when data overlap at Livraga. Notably, FLUXCOM RS and PMLv2 exhibit very similar seasonal dynamics and mean ET magnitudes. In contrast, ERA5-Land shows weaker temporal correspondence, with average correlations of 0.69.
Regarding magnitude differences, PMLv2 and SSEBop v6.1 display the lowest mean RMSD values (25.4 and 23.3 mm per month on average, respectively), followed by FLUXCOM RS (31.8), ERA5-Land (30.2), MOD16A2 (40.4), and GLEAM4.3a (46.0 mm per month). All products tend to underestimate ET relative to tower measurements, with the strongest negative biases observed for MOD16A2 and GLEAM4.3a.
3.4 Interannual variability of ET products and sensitivity to drought
Figure 7 shows time series of monthly ET anomalies during the irrigation season (April–September) in the California Valley for the six ET datasets (first six rows), together with NDVI anomalies from MODIS and precipitation anomalies from MSWEP v2.8 (last two rows). ET, NDVI, and precipitation anomalies were computed over the common period 2001–2020, except for SSEBop v6.1, for which anomalies were calculated over 2012–2020 due to data availability. The 5th (P5) and 95th (P95) percentiles were computed over 2012–2020 for the ET datasets to ensure comparability of anomaly magnitudes. The yellow-shaded area highlights the 2014 irrigation season, during which severe water restrictions were implemented across the California Valley (California Department of Water Resources, 2021). Table 6 summarizes the June and July 2014 anomalies and corresponding z-scores relative to the 2012–2020 reference distribution.
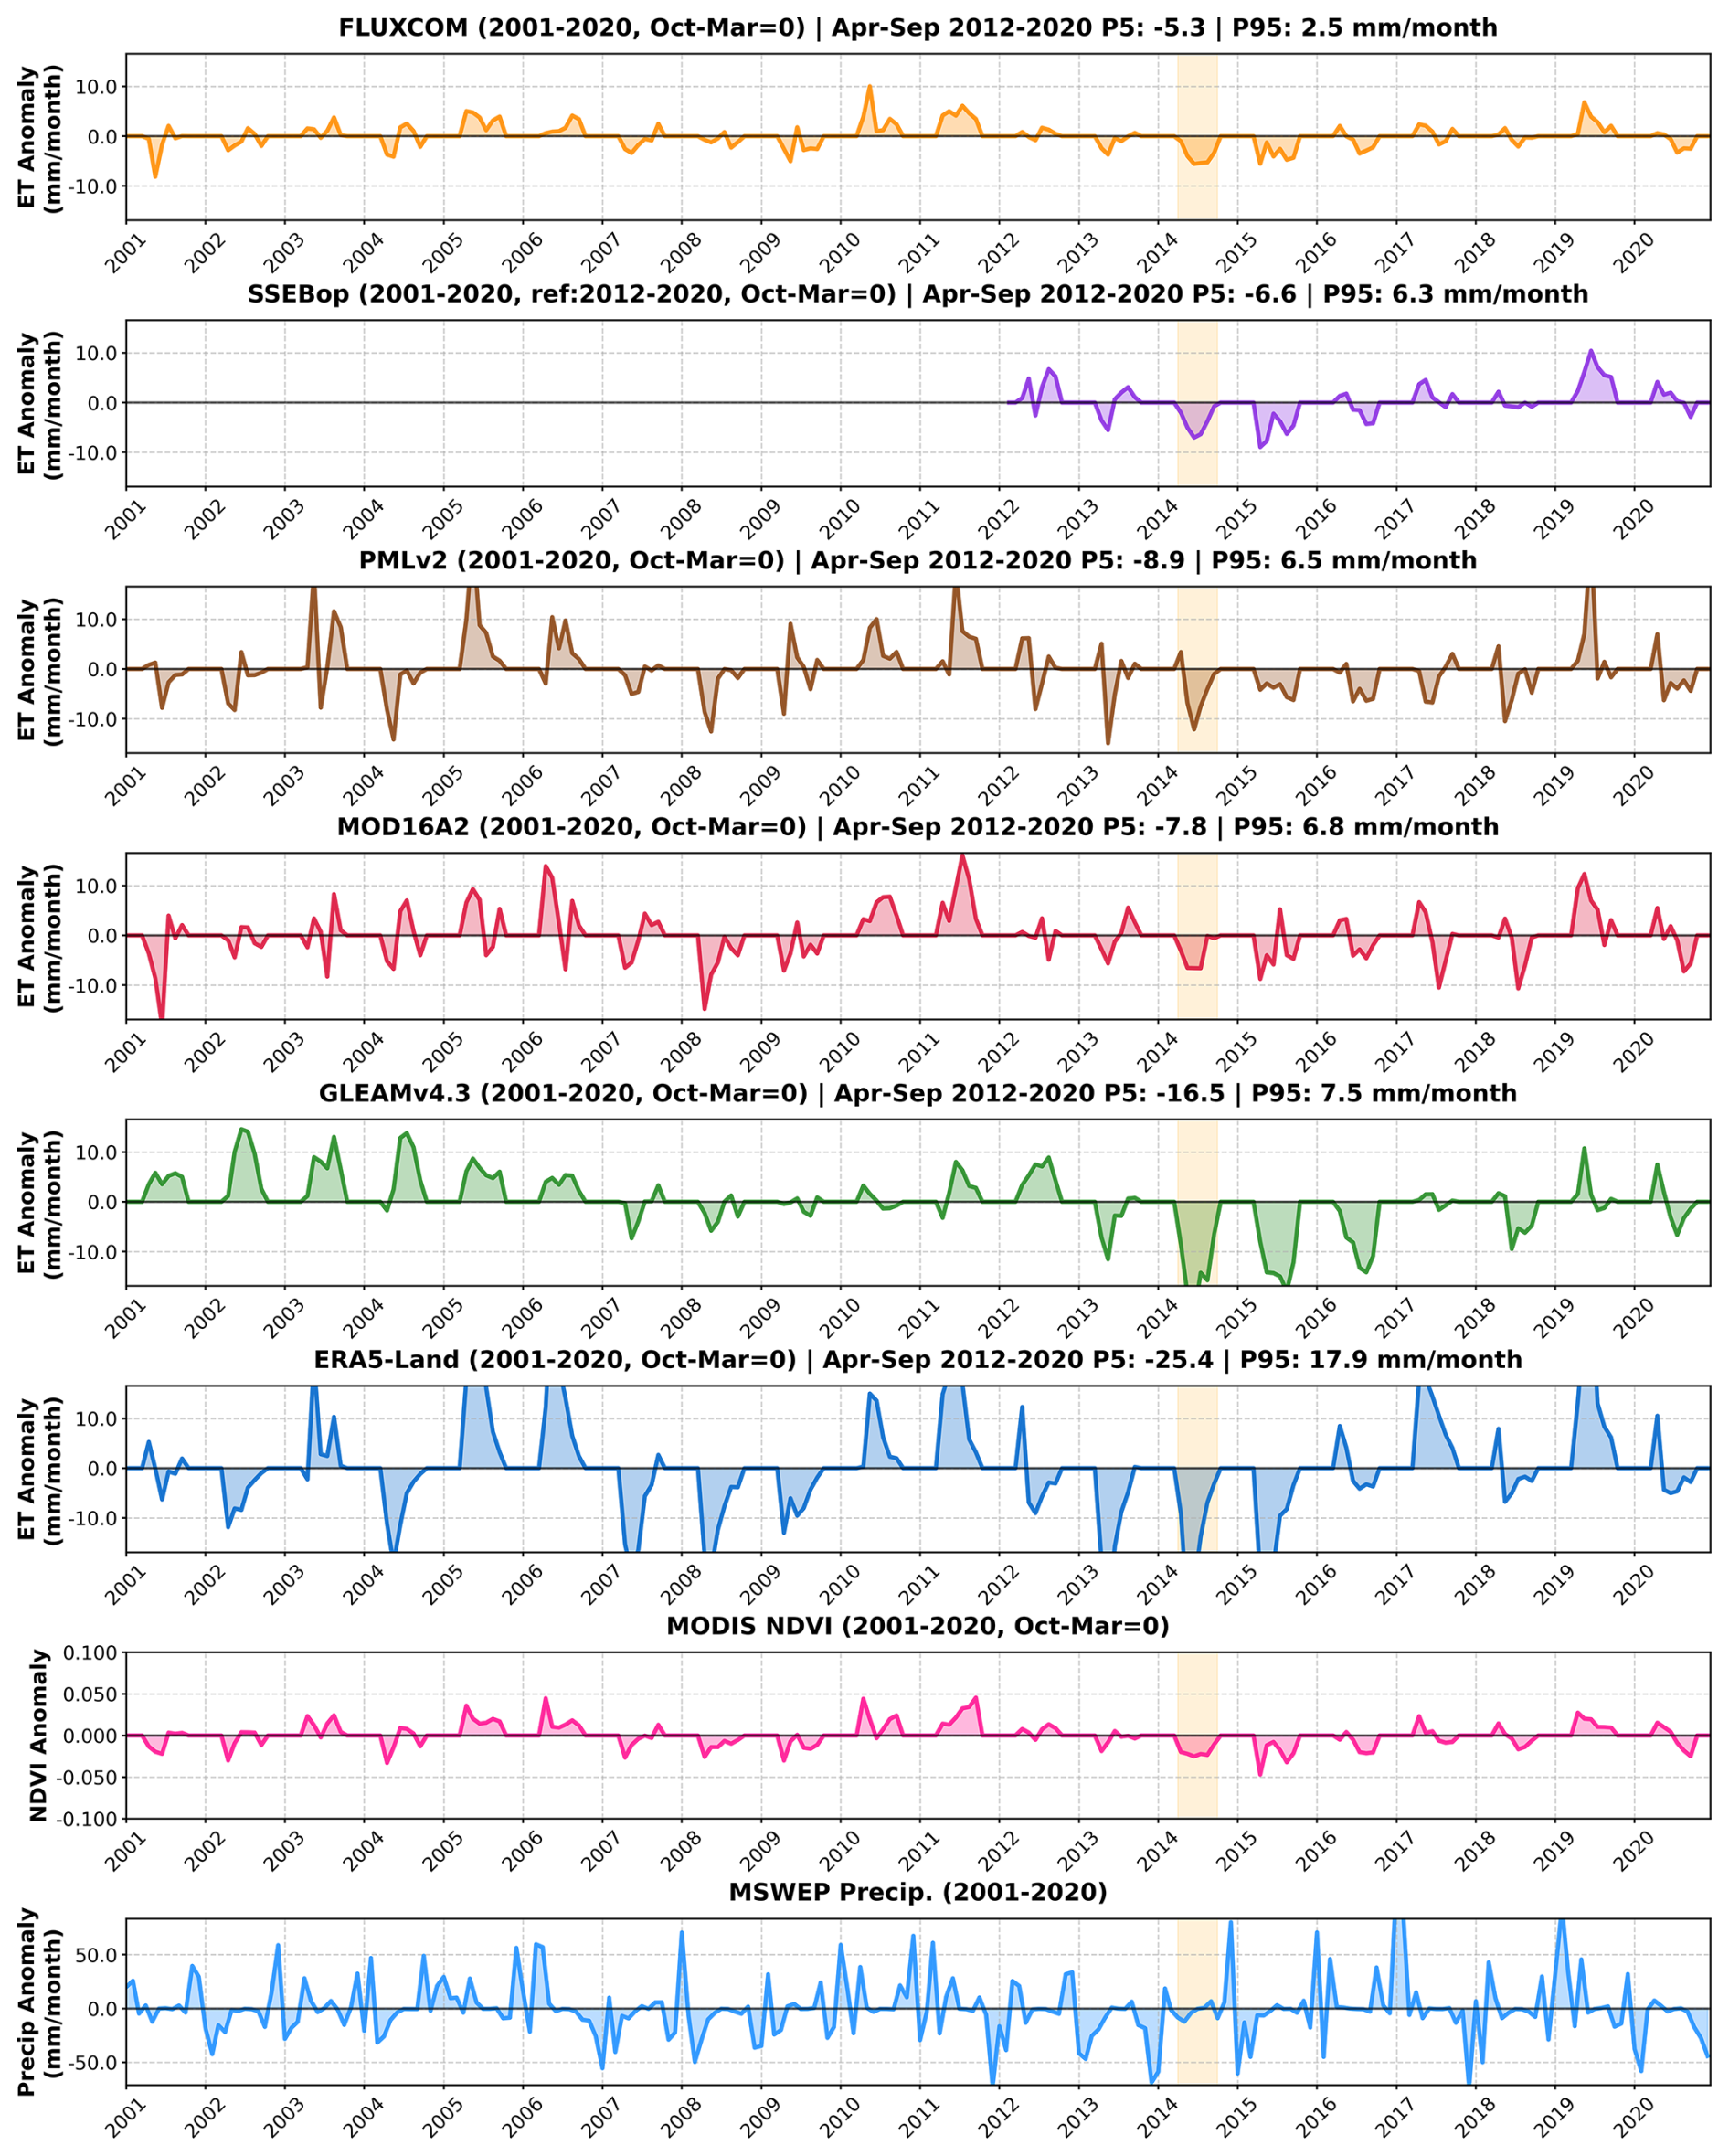
Figure 7Monthly anomalies during the irrigation season (April–September) in the California Valley for the six ET datasets (first six rows) and MODIS NDVI (second-to-last row), and MSWEP v2.8 precipitation (last row). The shaded area indicates the 2014 irrigation restrictions.
Table 6ET anomalies and corresponding z-scores (computed over 2012–2020) for June and July 2014 in the California Valley during the irrigation restrictions.
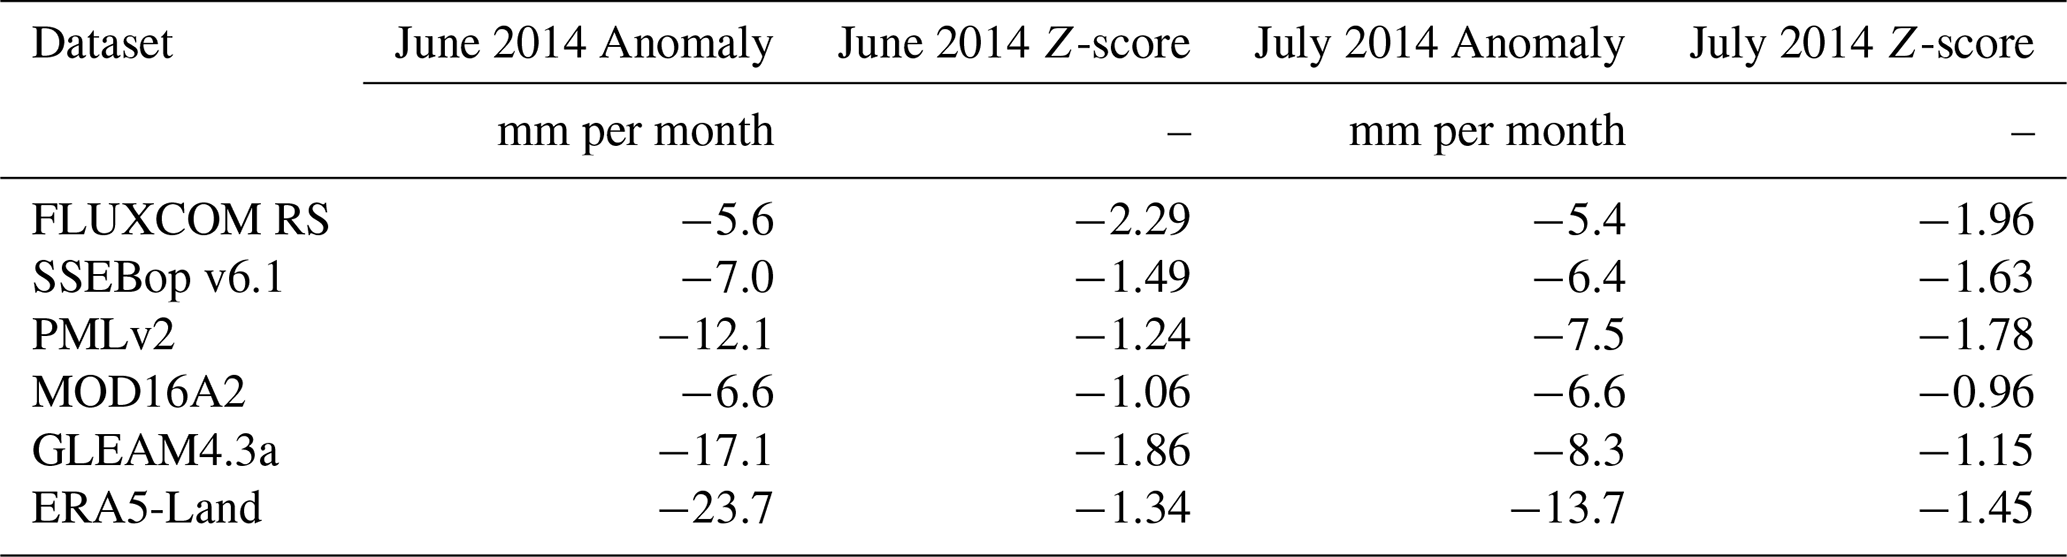
The amplitude of interannual ET anomalies varies substantially across datasets. ERA5-Land exhibits the largest variability (P5 = −25.4, P95 = 17.9 mm per month), followed by GLEAM4.3a (P5 = −16.5, P95 = 7.5 mm per month). In contrast, FLUXCOM RS shows comparatively low variability (P5 = −5.3, P95 = 2.5 mm per month), while SSEBop v6.1, PMLv2, and MOD16A2 fall within an intermediate range.
During the 2014 irrigation season, all datasets capture marked negative ET anomalies. Relative to their own historical variability, FLUXCOM RS shows the strongest standardized response, with z-scores of −2.29 (June) and −1.96 (July). GLEAM4.3a (−1.86 in June and −1.15 in July), SSEBop v6.1 (−1.49, −1.63), ERA5-Land (−1.34, −1.45), and PMLv2 (−1.24, −1.78) also indicate substantial negative anomalies. MOD16A2 exhibits comparatively lower z-scores (−1.06, −0.96), suggesting that although absolute anomalies are negative, the 2014 event appears less exceptional relative to its internal variability.
To further interpret the observed ET variability, precipitation anomalies from MSWEP v2.8 are examined. These show pronounced interannual and intra-seasonal variability during the irrigation season in the California Valley. In 2014, strong negative precipitation anomalies coincide with severe drought conditions, irrigation restrictions, and marked negative ET anomalies across all products, indicating a combined drought- and management-driven suppression of ET. In other years, the correspondence between precipitation and ET anomalies is weaker, suggesting that ET variability cannot be explained by precipitation alone but reflects a combination of climatic forcing and irrigation management.
Based on the assessment results, FLUXCOM RS, PMLv2, and SSEBop v6.1 show the most consistent overall agreement with reference datasets over irrigated areas. Although a strict ranking is difficult to establish, FLUXCOM RS exhibits the strongest spatial correspondence with irrigated areas, whereas PMLv2 shows the most consistent agreement with OpenET and flux tower observations in terms of both seasonal dynamics and ET magnitude. Notably, FLUXCOM RS and PMLv2 display very similar ET patterns across regions and generally produce slightly lower ET estimates, while SSEBop v6.1 tends to yield higher values that are closer to OpenET and tower-based magnitudes.
MOD16A2 and GLEAM4.3a show more variable agreement. Both datasets capture temporal irrigation-related variability across most regions, but tend to underestimate ET magnitude more strongly than the other products and show weaker spatial correspondence with irrigated area compared to FLUXCOM RS, PMLv2, and SSEBop v6.1. ERA5-Land shows limited skill for representing irrigation effects, with weak spatial correspondence to irrigated areas and reduced agreement with reference datasets in terms of seasonal dynamics.
These findings are consistent with previous studies that have compared global ET datasets across irrigated and agricultural regions. Zhang et al. (2019) reported lower MOD16A2 values compared to PMLv2 over croplands, while Kragh et al. (2023) similarly reported that FLUXCOM RS and PMLv2 show comparable behavior in the Indo-Gangetic Plain. Likewise, Zheng et al. (2022) showed that FLUXCOM, PMLv2, and MOD16 captured irrigation signals in several major irrigated basins (Nile Delta, central Indus Basin, and Heihe River Basin), with FLUXCOM generally producing higher ET values in irrigated zones than PMLv2 and MOD16.
4.1 Factors shaping ET product behavior over irrigated areas
4.1.1 FLUXCOM RS
The FLUXCOM RS machine learning model is trained on data from 224 flux towers, including 27 cropland sites, seven of which are irrigated. Among the nine input features used for ET prediction, six are potentially sensitive to irrigation. One of them is the plant functional type (PFT), which assigns pixels to vegetation classes, such as cropland. Because this class was trained on flux tower data from cropland sites – about 25 % of which are irrigated (7 out of 27) – irrigation effects may be implicitly represented in cropland areas. Other key predictors include LST, a variable highly responsive to irrigation and used in four of the input features, as well as vegetation parameters such as EVI and fAPAR, which are included in three.
4.1.2 PMLv2
In PMLv2, the stomatal response to VPD is parameterized separately for each biome, including croplands, using flux tower observations from 95 sites. For the cropland biome, the calibration relies on 11 towers, 4 of which are irrigated, meaning that irrigation effects are partially incorporated into the cropland-specific stomatal parameters. These parameters are then applied to all pixels classified as cropland, which may improve the representation of surface resistance, and consequently canopy transpiration, in irrigated areas. PMLv2 also incorporates several MODIS-derived variables that are sensitive to irrigation signals, such as LAI and surface albedo.
4.1.3 SSEBop v6.1
In SSEBop v6.1, ET is computed as the product of a reference evapotranspiration (ET0) and an evaporative fraction (ETf) derived from LST relative to a dynamically estimated cold/wet reference temperature (Tc). In version 6.1, the Tc benchmark is defined using the FANO algorithm, which identifies cold/wet reference pixels from the local NDVI–LST relationship within a 5 × 5 km moving window. Because both LST and NDVI respond strongly to irrigation, SSEBop v6.1 can capture irrigation signals in spatial patterns and seasonal dynamics. However, SSEBop v6.1 generally produces higher ET values than the other products, which may reflect a positive bias in the Penman–Monteith ET0 from TerraClimate or a limited reduction of ETf under water-stressed conditions.
4.1.4 MOD16A2
In MOD16A2, ET is estimated using a modified Penman–Monteith equation, where stomatal stress is represented through a surface resistance term (rs) driven by MODIS-derived vegetation properties (LAI and fAPAR) and meteorological variables, including VPD and air temperature. Unlike FLUXCOM RS and SSEBop v6.1, MOD16A2 does not use LST, and its surface resistance parameters are prescribed for each land-cover class rather than calibrated. Although rs varies with vegetation conditions, this prescribed parameterization, combined with the absence of LST information, likely limits the model’s sensitivity to irrigation.
4.1.5 ERA5-Land
In ERA5-Land, ET is computed using the H-TESSEL land surface model, where soil moisture and VPD are determined by precipitation and atmospheric fields from ERA5. While ERA5 assimilates a wide range of atmospheric observations, neither ERA5 nor ERA5-Land assimilate land-surface observations (such as soil moisture or vegetation properties) directly. In our analysis, we do not detect a significant irrigation-related signal being transferred through the atmospheric forcing into ERA5-Land. Because irrigation is not represented (i.e. no irrigation water inputs are prescribed), the model typically maintains low soil moisture and high surface resistance (rs) over irrigated croplands – especially in semi-arid regions – thereby suppressing transpiration. In addition, ERA5-Land uses prescribed, climatological LAI rather than satellite-derived values, which further limits its ability to reflect irrigation-induced vegetation changes.
4.1.6 GLEAM4.3a
GLEAM4.3a estimates soil moisture using a multi-layer water-balance scheme driven by MSWEP v2.8 precipitation. In version 4.3a, irrigation is represented by resetting root-zone soil moisture to field capacity over pixels identified as irrigated, and during irrigated periods derived from crop-phenology information, prior to the calculation of vegetation water stress (Baez-Villanueva et al., 2026). This treatment increases soil water availability and reduces vegetation stress in irrigated areas, enabling GLEAM4.3a to represent irrigation effects. However, because this irrigation treatment relies on prescribed irrigation extent and timing datasets, its impact on ET is sensitive to uncertainties in these inputs, and to the fact that area equipped for irrigation does not necessarily correspond to irrigation being applied in a given season.
4.1.7 Role of input data discrepancies
Beyond differences in model design choices, discrepancies in input datasets may also contribute to variations among ET products over irrigated areas. The products evaluated here rely on different sources of meteorological forcing (e.g., GLDAS for PMLv2, TerraClimate for SSEBop v6.1, ERA5 for ERA5-Land), satellite observations (e.g., MODIS-based vegetation variables in PMLv2 and FLUXCOM RS; VIIRS LST in SSEBop v6.1), and ancillary vegetation or land-cover datasets. Differences in these inputs can affect stress or energy-balance constraints in different ways across models. Consequently, part of the inter-product spread over irrigated regions likely reflects a combination of differences in model design choices and inconsistencies in the underlying meteorological and satellite inputs.
4.1.8 Role of climate conditions and irrigation practices
Beyond differences in model structure and input data, climate conditions and irrigation practices also influence how irrigation signals manifest in ET and, consequently, how easily they can be detected by different products. Regional climate conditions affect the magnitude and seasonality of irrigation-related ET enhancements. In arid and semi-arid regions, irrigation tends to produce stronger contrasts in ET relative to surrounding rainfed areas, whereas in more humid environments these contrasts are generally weaker. Irrigation methods (e.g., surface, sprinkler, or drip systems) further influence the timing and spatial localization of water inputs, thereby shaping how irrigation signals appear in ET fields. Such management-related differences may partly contribute to regional contrasts in product performance, particularly in areas characterized by perennial crops and localized irrigation systems, such as the California Valley.
4.1.9 Summary of factors shaping ET product performance over irrigated areas
A key factor influencing how ET products behave over irrigated areas is how they represent vegetation water stress, and particularly which variables drive the formulation of that stress. Products in which surface resistance or stress factors respond to irrigation-sensitive variables – such as LST or vegetation indices – tend to capture irrigation signals more effectively and, therefore, produce higher ET in irrigated regions. In contrast, models in which water stress is tightly coupled to a precipitation-driven soil water balance – such as ERA5-Land – generally exhibit reduced sensitivity to irrigation, leading to lower ET estimates in intensively irrigated croplands. Another important factor is the inclusion of in situ flux tower data from irrigated croplands during model training or calibration. Products such as FLUXCOM RS and PMLv2, which incorporate such sites, tend to show stronger consistency with irrigation-related signals compared to products that do not use such data.
4.1.10 Applicability to other irrigated regions
Although the present analysis focuses on selected irrigated regions in the CONUS, Europe, and South Asia, similar questions arise in other major irrigation hotspots worldwide. In East Asia, for example, the North China Plain has experienced rapid irrigation expansion in recent decades (Meier et al., 2018; McDermid et al., 2023; Mehta et al., 2024). The sensitivities identified here are likely relevant for such regions, as several ET products rely on remote-sensing constraints (e.g., LST and vegetation properties) that respond to irrigation through similar physical mechanisms. Regional climate conditions, crop types, and irrigation practices may, however, influence the magnitude and detectability of these signals.
4.2 Considerations on the reference data used for evaluating the ET products
4.2.1 Map of area equipped for irrigation
When assessing the spatial consistency of the ET products using GMIAv5, it is important to recognize that this dataset represents irrigation infrastructure rather than the areas that are actually irrigated at a given time. In reality, the extent of active irrigation varies within and between years depending on water availability, management practices, and policy constraints. This temporal variability is not captured in the dataset and may therefore influence, to some extent, the spatial correlations with ET. The GMIAv5 dataset is also subject to uncertainties in the underlying national statistics, which differ in quality, reference period, and spatial resolution across countries.
A temporal mismatch also exists between the reference period of GMIAv5 (around 2005) and the time span of the ET products analyzed here. While the map remains broadly representative of irrigation patterns during the 2000–2010 decade, irrigated areas have expanded in several regions since then. Mehta et al. (2024) documented pronounced increases in the area equipped for irrigation in the southern Indus Basin, as well as more moderate growth in the Great Plains, the Mississippi Floodplain, and the Po Valley. Such temporal changes should be considered when interpreting relationships between mean peak-season ET and the mapped irrigation extent. Nevertheless, despite the expansion of irrigated land in some regions since 2005, GMIAv5 still captures the dominant irrigation patterns relevant for the study period.
The relationship between mean peak-season ET and the area equipped for irrigation also depends on how clearly irrigation alters surface variables such as LST and vegetation properties. These signals tend to be more pronounced in semi-arid regions (e.g., California Valley, Snake River Plain, Ebro Basin), which contribute to higher correlations with irrigation extent. In more humid areas (e.g., Po Valley, Mississippi Floodplain), rainfall-driven variability can partly mask irrigation effects. In addition, in the Indus Basin, the limited spatial variability of the GMIAv5 map – with most pixels showing uniformly high irrigation fractions – further constrains correlation-based analyses.
4.2.2 OpenET
OpenET provides an independent, high-resolution benchmark for evaluating global ET products, combining six modeling approaches that differ substantially in their algorithms and input datasets. However, it remains an ensemble of model simulations rather than direct observations, and therefore inherits the assumptions and limitations of its component models. Volk et al. (2024) found that OpenET tends to underestimate ET over croplands, including irrigated sites, with a mean bias of −5.3 mm per month and an average RMSD of about 20 mm per month relative to in situ flux tower data (metrics computed over the full year, including non-irrigated periods).
Across several regions, Volk et al. (2024) also reported that OpenET often overestimates ET in vineyards and that RMSD values for orchards can reach up to 28 mm per month. This is particularly relevant for the California Valley, where irrigated agriculture is dominated by perennial crops such as orchards and vineyards. Such crop-specific biases likely contribute to the larger discrepancies observed between OpenET and some global products in this region.
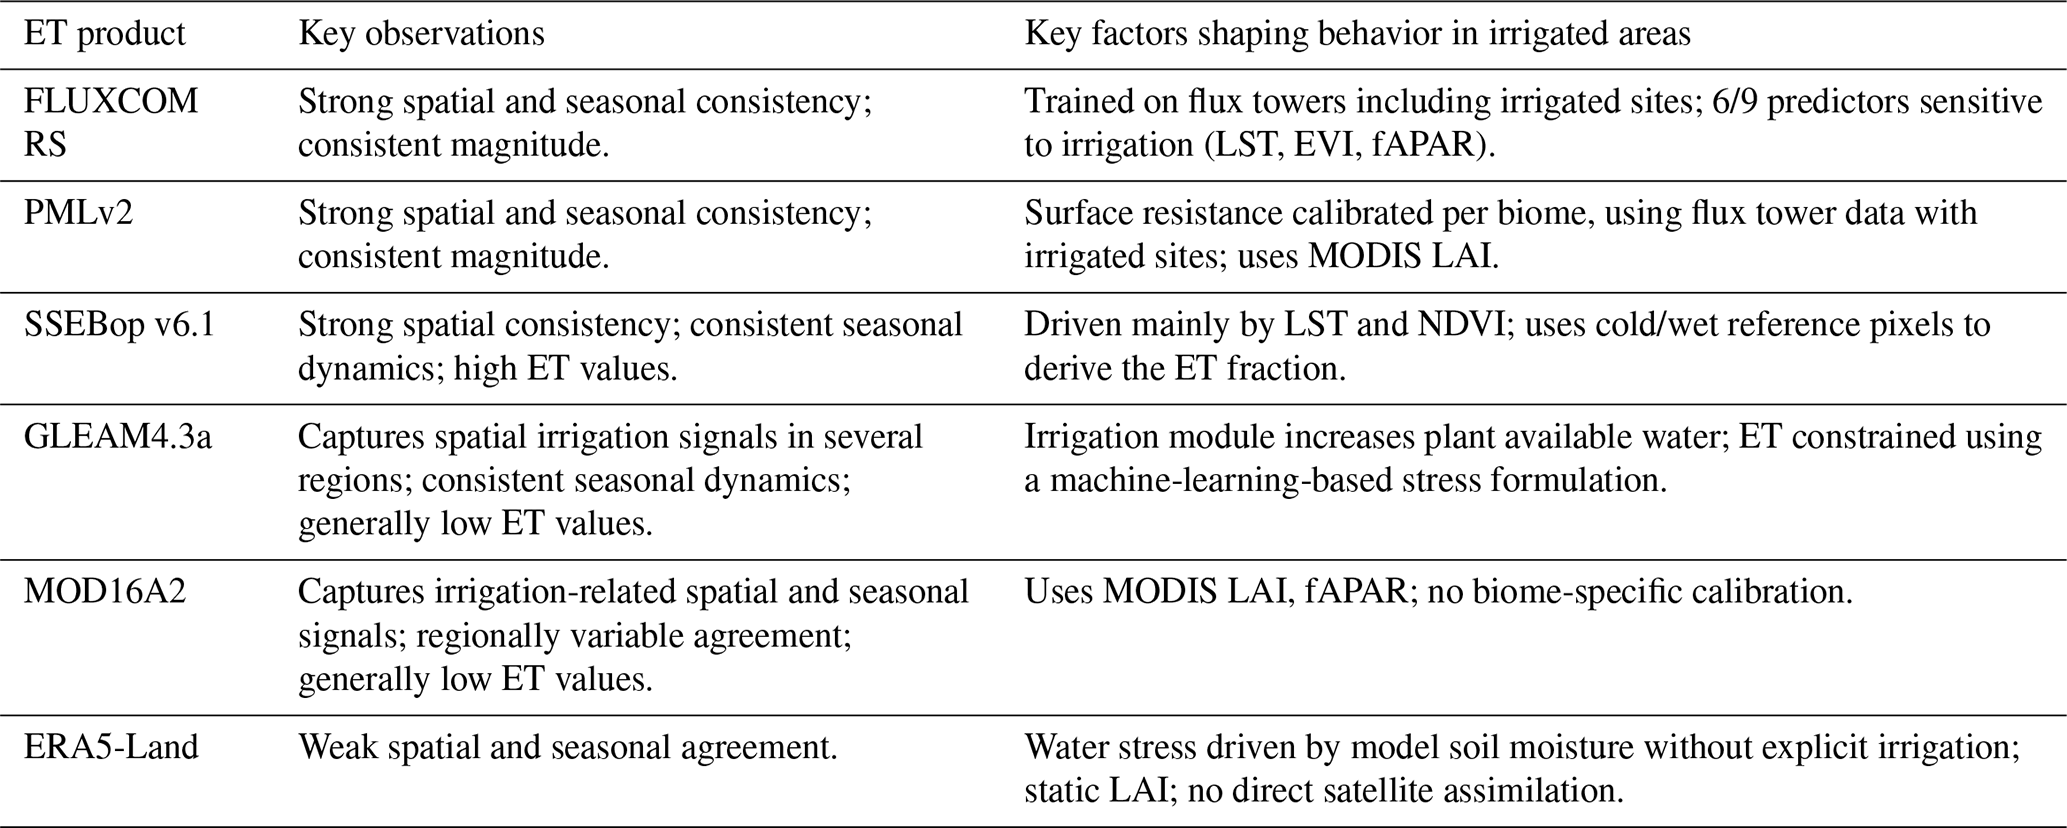
Table 7Summary of ET product characteristics over irrigated areas: key observations and factors shaping model responses.
4.2.3 Eddy covariance measurements
Comparisons with eddy covariance data rely on the assumption that irrigation at the instrumented field is broadly representative of conditions within the corresponding 0.1° pixel. This assumption is reasonable in the present study, as both the Livraga and Landriano towers are located in irrigated maize fields surrounded predominantly (though not entirely) by similar irrigated crops. However, variations in irrigation schedules, crop management, or water availability across neighboring fields may still lead to discrepancies between tower-based observations and pixel-averaged ET estimates. In addition, subpixel heterogeneity in land cover, particularly the presence of non-irrigated fields, can further contribute to such differences. While beyond the scope of the present study, future analyses could further explore these site–pixel discrepancies by evaluating ET products at their native spatial resolutions.
This study presents the first evaluation of six global ET products over irrigated croplands using three independent reference sources: irrigation infrastructure maps, the OpenET ensemble, and eddy‐covariance measurements. By assessing spatial patterns, seasonal dynamics, and ET magnitude across diverse agro-climatic regions, we provide a comprehensive comparison of how these products represent irrigation-related ET variability.
The results reveal clear differences among the six datasets. Table 7 summarizes, for each product, key observations and factors likely contributing to the observed patterns. FLUXCOM RS, PMLv2, and SSEBop v6.1 show the strongest overall consistency, capturing irrigation-related spatial patterns and seasonal dynamics across most regions. FLUXCOM RS and PMLv2 exhibit notably similar behavior, whereas SSEBop v6.1 tends to produce higher ET values. MOD16A2 and GLEAM4.3a show more regionally variable agreement with the reference datasets and generally lower ET estimates. ERA5-Land displays weaker overall agreement.
Overall, differences among products primarily reflect (i) how vegetation water stress is represented – whether it responds to irrigation-sensitive variables such as LST and vegetation indices, includes a dedicated irrigation-related stress adjustment, or relies more strongly on precipitation-driven soil-water-balance formulations – and (ii) whether flux tower observations from irrigated croplands were included during model training or calibration.
These findings highlight several opportunities for improving the representation of irrigation in global ET products. Strengthening the representation of vegetation water stress – by integrating observations that directly respond to irrigation (e.g., LST, vegetation indices), or by calibrating models with flux tower data from irrigated croplands – can enhance the ability of ET products to capture irrigation-driven dynamics. Beyond model development, improved validation efforts are also important. Expanding flux tower networks to better represent the diversity of irrigated systems and climatic conditions would help reduce regional uncertainties and provide stronger constraints for future ET model refinement.
Together, these advances will contribute to more reliable global ET estimates. Such improvements are essential for agricultural water management, drought monitoring, and climate impact assessments, as well as for broader applications such as hydrological modeling, ecosystem monitoring, and water policy design. By identifying the strengths and weaknesses of current global ET products in irrigated landscapes, this study helps users and developers make more informed choices and supports the development of more accurate and resilient tools for global water monitoring and management.
The datasets used in this study are available from the following sources: FLUXCOM RS (http://fluxcom.org/, last access: 27 March 2026); PMLv2 (https://developers.google.com/earth-engine/datasets/catalog/CAS_IGSNRR_PML_V2_v018, last access: 27 March 2026); SSEBop v6.1 (https://earlywarning.usgs.gov/fews/product/460/, last access: 27 March 2026); MOD16A2 (https://developers.google.com/earth-engine/datasets/catalog/MODIS_006_MOD16A2, last access: 27 March 2026); ERA5-Land (https://cds.climate.copernicus.eu/, last access: 27 March 2026); GLEAM4 (https://www.gleam.eu/, last access: 27 March 2026); FAO Global Map of Area Equipped for Irrigation (https://www.fao.org/aquastat/en/geospatial-information/global-maps-irrigated-areas/latest-version, last access: 27 March 2026); WorldCereal global crop maps (https://esa-worldcereal.org/en/products/global-maps, last access: 27 March 2026); OpenET (https://openetdata.org, last access: 27 March 2026). The eddy-covariance measurements used in this study are not publicly available but can be obtained from the data provider upon request.
PL designed the study, performed the analysis, and prepared the manuscript. WD and CC contributed to the study design and interpretation of the results. CC provided the flux tower measurements. OBV, YZ, SW, and JMS provided the ET datasets and contributed to methodological interpretation. CA contributed through critical feedback and manuscript review. All authors contributed to manuscript revision.
The contact author has declared that none of the authors has any competing interests.
Publisher's note: Copernicus Publications remains neutral with regard to jurisdictional claims made in the text, published maps, institutional affiliations, or any other geographical representation in this paper. The authors bear the ultimate responsibility for providing appropriate place names. Views expressed in the text are those of the authors and do not necessarily reflect the views of the publisher.
We acknowledge the data providers of the MOD16A2, GMIAv5, OpenET, and flux tower datasets. We thank Bill Kustas (USDA) for helpful discussions and advice on OpenET, and Gabriel Senay (USGS) for insightful input, particularly on the interpretation of SSEBop results.
This research has been supported by the European Space Agency (Climate Change Initiative – Anthropogenic Water Use (CCI-AWU) precursor project (contract no. 4000142449/23/I-NB) and Climate Change Initiative – Land Evaporation (CCI-E) project (contract no. AO/1-12490/24/I-LR)).
This paper was edited by Xing Yuan and reviewed by two anonymous referees.
Abatzoglou, J. T., Dobrowski, S. Z., Parks, S. A., and Hegewisch, K. C.: TerraClimate, a high-resolution global dataset of monthly climate and climatic water balance from 1958–2015, Scientific Data, 5, 170191, https://doi.org/10.1038/sdata.2017.191, 2018. a
Alfieri, L., Avanzi, F., Delogu, F., Gabellani, S., Bruno, G., Campo, L., Libertino, A., Massari, C., Tarpanelli, A., Rains, D., Miralles, D. G., Quast, R., Vreugdenhil, M., Wu, H., and Brocca, L.: High-resolution satellite products improve hydrological modeling in northern Italy, Hydrol. Earth Syst. Sci., 26, 3921–3939, https://doi.org/10.5194/hess-26-3921-2022, 2022. a
Allen, R. G., Tasumi, M., and Trezza, R.: Satellite-Based Energy Balance for Mapping Evapotranspiration with Internalized Calibration (METRIC) – Model, J. Irrig. Drain. E., 133, 380–394, https://doi.org/10.1061/(ASCE)0733-9437(2007)133:4(380), 2007. a, b
Anderson, M. C., Norman, J. M., Kustas, W. P., Houborg, R., Starks, P. J., and Agam, N.: A two-source time-integrated model for estimating surface fluxes using thermal infrared remote sensing, Remote Sens. Environ., 60, 195–216, https://doi.org/10.1016/S0034-4257(96)00215-5, 1997. a
Anderson, M. C., Kustas, W. P., and Norman, J. M.: Upscaling Flux Observations from Local to Continental Scales Using Thermal Remote Sensing, Agron. J., 99, 240–254, https://doi.org/10.2134/agronj2005.0096S, 2007. a
Asmus, C., Hoffmann, P., Pietikäinen, J.-P., Böhner, J., and Rechid, D.: Modeling and evaluating the effects of irrigation on land–atmosphere interaction in southwestern Europe with the regional climate model REMO2020–iMOVE using a newly developed parameterization, Geosci. Model Dev., 16, 7311–7337, https://doi.org/10.5194/gmd-16-7311-2023, 2023. a
Baez-Villanueva, O. M., A., C.-O., Schellekens, J., Modanesi, S., Laluet, P., Massari, C., Söchting, M., Mahecha, M., Bonte, O., Massant, J., Corbari, C., Dari, J., Delbare, K., Dorigo, W., Beck, H. E., Boone, A., and Miralles, D. G.: Incorporating irrigation effects into high-resolution daily land evaporation modelling over the Iberian Peninsula, in preparation, 2026. a, b
Bastiaanssen, W. G. M., Menenti, M., Feddes, R. A., and Holtslag, A. A. M.: A remote sensing surface energy balance algorithm for land (SEBAL): 1. Formulation, J. Hydrol., 212–213, 198–212, https://doi.org/10.1016/S0022-1694(98)00253-4, 1998. a
Beck, H. E., Wood, E. F., Pan, M., Fisher, C. K., Miralles, D. G., van Dijk, A. I. J. M., McVicar, T. R., and Adler, R. F.: MSWEP V2 Global 3-Hourly 0.1° Precipitation: Methodology and Quantitative Assessment, B. Am. Meteorol. Soc., 100, 473–500, https://doi.org/10.1175/BAMS-D-17-0138.1, 2019. a
California Department of Water Resources: Report to the Legislature on the 2012–2016 Drought, Tech. rep., California Natural Resources Agency, https://water.ca.gov/-/media/DWR-Website/Web-Pages/Water-Basics/Drought/Files/Publications-And-Reports/CNRA-Drought-Report-final-March-2021.pdf (last access: 8 August 2025), 2021. a
Chen, L. and Dirmeyer, P. A.: Global observed and modelled impacts of irrigation on surface temperature, Int. J. Climatol., 39, 2587–2600, https://doi.org/10.1002/joc.5973, 2019. a
Crow, W. T., Anderson, M. C., Volk, J. M., and Colliander, A.: Value of microwave soil moisture and thermal-infrared evapotranspiration retrievals for the mapping of irrigation coverage, Int. J. Appl. Earth Obs., 143, 104773, https://doi.org/10.1016/j.jag.2025.104773, 2025. a
Dorigo, W., Dietrich, S., Aires, F., Brocca, L., Carter, S., Cretaux, J.-F., Dunkerley, D., Enomoto, H., Forsberg, R., Güntner, A., Hegglin, M. I., Hollmann, R., Hurst, D. F., Johannessen, J. A., Kummerow, C., Lee, T., Luojus, K., Looser, U., Miralles, D. G., Pellet, V., Recknagel, T., Vargas, C. R., Schneider, U., Schoeneich, P., Schröder, M., Tapper, N., Vuglinsky, V., Wagner, W., Yu, L., Zappa, L., Zemp, M., and Aich, V.: Closing the Water Cycle from Observations across Scales: Where Do We Stand?, B. Am. Meteorol. Soc., 102, E1897–E1935, https://doi.org/10.1175/BAMS-D-19-0316.1, 2021. a
Dorigo, W. A., Wagner, W., Albergel, C., Albrecht, F., Balsamo, G., Brocca, L., Chung, D., Ertl, M., Forkel, M., Gruber, A., Haas, E., Hamer, P. D., Hirschi, M., Ikonen, J., de Jeu, R., Kidd, R., Lahoz, W., Liu, Y.-Y., Miralles, D. G., and Lecomte, P.: ESA CCI Soil Moisture for improved Earth system understanding: State-of-the-art and future directions, Remote Sens. Environ., 203, 185–215, https://doi.org/10.1016/j.rse.2017.07.001, 2017. a
Entekhabi, D., Njoku, E. G., O'Neill, P. E., Kellogg, K. H., Crow, W. T., Edelstein, W. N., Entin, J. K., Goodman, S. D., Jackson, T. J., Johnson, J., Kimball, J., Piepmeier, J. R., Koster, R. D., Martin, N., McDonald, K. C., Moghaddam, M., Moran, S., Reichle, R., Shi, J. C., Spencer, M. W., Thurman, S. W., Tsang, L., and Van Zyl, J.: The Soil Moisture Active Passive (SMAP) Mission, P. IEEE, 98, 704–716, https://doi.org/10.1109/JPROC.2010.2043918, 2010. a
Etchanchu, J., Demarty, J., Dezetter, A., Farhani, N., Thiam, P. B., Allies, A., Bodian, A., Boulet, G., Chahinian, N., Diop, L., Mainassara, I., Ndiaye, P. M., Ollivier, C., Olioso, A., and Roupsard, O.: Multiscale analysis of existing actual evapotranspiration products over agropastoral Sahel, J. Hydrol., 651, 132585, https://doi.org/10.1016/j.jhydrol.2024.132585, 2025. a
FAO: WaPOR, FAO’s portal to monitor water productivity through open access of remotely sensed derived data, Rome: Food and Agriculture Organization of the United Nations, http://www.fao.org/land-water/databases-and-software/wapor/en/ (last access: 27 March 2026), 2018. a
Fisher, J. B., Tu, K. P., and Baldocchi, D. D.: Evapotranspiration models based on the Penman–Monteith equation and energy balance, Remote Sens. Environ., 112, 901–919, https://doi.org/10.1016/j.rse.2007.06.025, 2008. a
Fisher, J. B., Melton, F., Middleton, E., Hain, C., Anderson, M., Allen, R., McCabe, M. F., Hook, S., Baldocchi, D., Townsend, P. A., Kilic, A., Tu, K., Miralles, D. G., Perret, J., Lagouarde, J.-P., Waliser, D., Purdy, A. J., French, A., Schimel, D., Famiglietti, J., Stephens, G., and Wood, E. F.: The future of evapotranspiration: Global requirements for ecosystem functioning, carbon and climate feedbacks, agricultural management, and water resources, Water Resour. Res., 53, 2618–2626, https://doi.org/10.1002/2016WR020175, 2017. a
Gelaro, R., McCarty, W., Suárez, M. J., Todling, R., Molod, A., Takacs, L., Randles, C. A., Darmenov, A., Bosilovich, M. G., Reichle, R., Wargan, K., Coy, L., Cullather, R., Draper, C., Akella, S., Buchard, V., Conaty, A., Silva, A. M. d., Gu, W., Kim, G.-K., Koster, R., Lucchesi, R., Merkova, D., Nielsen, J. E., Partyka, G., Pawson, S., Putman, W., Rienecker, M., Schubert, S. D., Sienkiewicz, M., and Zhao, B.: The Modern-Era Retrospective Analysis for Research and Applications, Version 2 (MERRA-2), J. Climate, 30, 5419–5454, https://doi.org/10.1175/JCLI-D-16-0758.1, 2017. a
Hobeichi, S., Abramowitz, G., Evans, J., and Ukkola, A.: Derived Optimal Linear Combination Evapotranspiration (DOLCE): a global gridded synthesis ET estimate, Hydrol. Earth Syst. Sci., 22, 1317–1336, https://doi.org/10.5194/hess-22-1317-2018, 2018. a
Hong, S., Deng, H., Zheng, Z., Deng, Y., Chen, X., Gao, L., Chen, Y., and Liu, M.: The influence of variations in actual evapotranspiration on drought in China's Southeast River basin, Sci. Rep., 13, 21336, https://doi.org/10.1038/s41598-023-48663-8, 2023. a
Hulley, G. C., Malakar, N. K., Islam, T., and Freepartner, R. J.: NASA's MODIS and VIIRS Land Surface Temperature and Emissivity Products: A Long-Term and Consistent Earth System Data Record, IEEE J. Sel. Top. Appl., 11, 522–535, https://doi.org/10.1109/JSTARS.2017.2779330, 2018. a
Jung, M., Koirala, S., Weber, U., Ichii, K., Gans, F., Camps-Valls, G., Papale, D., Schwalm, C., Tramontana, G., and Reichstein, M.: The FLUXCOM ensemble of global land-atmosphere energy fluxes, Scientific Data, 6, 74, https://doi.org/10.1038/s41597-019-0076-8, 2019. a, b, c
Knipper, K. R., Kustas, W. P., Anderson, M. C., Alsina, M. M., Hain, C. R., Alfieri, J. G., Prueger, J. H., Gao, F., McKee, L. G., and Sanchez, L. A.: Using high-spatiotemporal thermal satellite ET retrievals for operational water use and stress monitoring in a California vineyard, Remote Sens., 11, 2124, https://doi.org/10.3390/rs11182124, 2019. a
Kragh, S. J., Fensholt, R., Stisen, S., and Koch, J.: The precision of satellite-based net irrigation quantification in the Indus and Ganges basins, Hydrol. Earth Syst. Sci., 27, 2463–2478, https://doi.org/10.5194/hess-27-2463-2023, 2023. a, b
Lehmann, F., Vishwakarma, B. D., and Bamber, J.: How well are we able to close the water budget at the global scale?, Hydrol. Earth Syst. Sci., 26, 35–54, https://doi.org/10.5194/hess-26-35-2022, 2022. a
Liu, W., Wang, L., Zhou, J., Li, Y., Sun, F., Fu, G., Li, X., and Sang, Y.-F.: A worldwide evaluation of basin-scale evapotranspiration estimates against the water balance method, J. Hydrol., 538, 82–95, https://doi.org/10.1016/j.jhydrol.2016.04.006, 2016. a
Liu, X., Yang, K., Ferreira, V. G., and Bai, P.: Hydrologic Model Calibration With Remote Sensing Data Products in Global Large Basins, Water Resour. Res., 58, e2022WR032929, https://doi.org/10.1029/2022WR032929, 2022. a
Lunel, T., Boone, A. A., and Le Moigne, P.: Irrigation strongly influences near-surface conditions and induces breeze circulation: Observational and model-based evidence, Q. J. Roy. Meteor. Soc., 150, 2798–2819, https://doi.org/10.1002/qj.4736, 2024. a
Masseroni, D., Ercolani, G., Corbari, C., and Mancini, M.: Accuracy of turbulent flux measurements through the use of high frequency data by eddy covariance tower: the case study of Landriano (PV), Italy, Italian Journal of Agrometeorology, https://air.unimi.it/handle/2434/231850 (last access: 27 March 2026), 2013. a
McCabe, M. F., Ershadi, A., Jimenez, C., Miralles, D. G., Michel, D., and Wood, E. F.: The GEWEX LandFlux project: evaluation of model evaporation using tower-based and globally gridded forcing data, Geosci. Model Dev., 9, 283–305, https://doi.org/10.5194/gmd-9-283-2016, 2016. a
McDermid, S., Nocco, M., Lawston-Parker, P., Keune, J., Pokhrel, Y., Jain, M., Jägermeyr, J., Brocca, L., Massari, C., Jones, A. D., Vahmani, P., Thiery, W., Yao, Y., Bell, A., Chen, L., Dorigo, W., Hanasaki, N., Jasechko, S., Lo, M.-H., Mahmood, R., Mishra, V., Mueller, N. D., Niyogi, D., Rabin, S. S., Sloat, L., Wada, Y., Zappa, L., Chen, F., Cook, B. I., Kim, H., Lombardozzi, D., Polcher, J., Ryu, D., Santanello, J., Satoh, Y., Seneviratne, S., Singh, D., and Yokohata, T.: Irrigation in the Earth system, Nature Reviews Earth & Environment, 4, 435–453, https://doi.org/10.1038/s43017-023-00438-5, 2023. a, b
McDermid, S. S., Montes, C., Cook, B. I., Puma, M. J., Kiang, N. Y., and Aleinov, I.: The Sensitivity of Land–Atmosphere Coupling to Modern Agriculture in the Northern Midlatitudes, J. Climate, 32, 465–484, https://doi.org/10.1175/JCLI-D-17-0799.1, 2019. a
McNamara, I., Baez-Villanueva, O. M., Zomorodian, A., Ayyad, S., Zambrano-Bigiarini, M., Zaroug, M., Mersha, A., Nauditt, A., Mbuliro, M., Wamala, S., and Ribbe, L.: How well do gridded precipitation and actual evapotranspiration products represent the key water balance components in the Nile Basin?, J. Hydrol.: Regional Studies, 37, 100884, https://doi.org/10.1016/j.ejrh.2021.100884, 2021. a
Mehta, P., Siebert, S., Kummu, M., Deng, Q., Ali, T., Marston, L., Xie, W., and Davis, K. F.: Half of twenty-first century global irrigation expansion has been in water-stressed regions, Nature Water, 2, 254–261, https://doi.org/10.1038/s44221-024-00206-9, 2024. a, b
Meier, J., Zabel, F., and Mauser, W.: A global approach to estimate irrigated areas – a comparison between different data and statistics, Hydrol. Earth Syst. Sci., 22, 1119–1133, https://doi.org/10.5194/hess-22-1119-2018, 2018. a
Melton, F. S., Johnson, L. F., Lund, C. P., Pierce, L. L., Michaelis, A. R., Hiatt, S. H., Guzman, A., Adhikari, D. D., Purdy, A. J., Rosevelt, C., Votava, P., Trout, T. J., Temesgen, B., Frame, K., Sheffner, E. J., and Nemani, R. R.: Satellite Irrigation Management Support With the Terrestrial Observation and Prediction System: A Framework for Integration of Satellite and Surface Observations to Support Improvements in Agricultural Water Resource Management, IEEE J. Sel. Top. Appl., 5, 1709–1721, https://doi.org/10.1109/JSTARS.2012.2214474, 2012. a
Melton, F. S., Huntington, J., Grimm, R., Herring, J., Hall, M., Rollison, D., Erickson, T., Allen, R., Anderson, M., Fisher, J. B., Kilic, A., Senay, G. B., Volk, J., Hain, C., Johnson, L., Ruhoff, A., Blankenau, P., Bromley, M., Carrara, W., Daudert, B., Doherty, C., Dunkerly, C., Friedrichs, M., Guzman, A., Halverson, G., Hansen, J., Harding, J., Kang, Y., Ketchum, D., Minor, B., Morton, C., Ortega-Salazar, S., Ott, T., Ozdogan, M., ReVelle, P. M., Schull, M., Wang, C., Yang, Y., and Anderson, R. G.: OpenET: Filling a Critical Data Gap in Water Management for the Western United States, J. Am. Water Resour. As., 58, 971–994, https://doi.org/10.1111/1752-1688.12956, 2022. a
Miralles, D. G., Bonte, O., Koppa, A., Baez-Villanueva, O. M., Tronquo, E., Zhong, F., Beck, H. E., Hulsman, P., Dorigo, W., Verhoest, N. E. C., and Haghdoost, S.: GLEAM4: global land evaporation and soil moisture dataset at 0.1° resolution from 1980 to near present, Scientific Data, 12, 416, https://doi.org/10.1038/s41597-025-04610-y, 2025. a, b, c
Mu, Q., Zhao, M., and Running, S. W.: Improvements to a MODIS global terrestrial evapotranspiration algorithm, Remote Sens. Environ., 115, 1781–1800, https://doi.org/10.1016/j.rse.2011.02.019, 2011. a, b
Mueller, B., Hirschi, M., Jimenez, C., Ciais, P., Dirmeyer, P. A., Dolman, A. J., Fisher, J. B., Jung, M., Ludwig, F., Maignan, F., Miralles, D. G., McCabe, M. F., Reichstein, M., Sheffield, J., Wang, K., Wood, E. F., Zhang, Y., and Seneviratne, S. I.: Benchmark products for land evapotranspiration: LandFlux-EVAL multi-data set synthesis, Hydrol. Earth Syst. Sci., 17, 3707–3720, https://doi.org/10.5194/hess-17-3707-2013, 2013. a
Muñoz-Sabater, J., Dutra, E., Agustí-Panareda, A., Albergel, C., Arduini, G., Balsamo, G., Boussetta, S., Choulga, M., Harrigan, S., Hersbach, H., Martens, B., Miralles, D. G., Piles, M., Rodríguez-Fernández, N. J., Zsoter, E., Buontempo, C., and Thépaut, J.-N.: ERA5-Land: a state-of-the-art global reanalysis dataset for land applications, Earth Syst. Sci. Data, 13, 4349–4383, https://doi.org/10.5194/essd-13-4349-2021, 2021. a, b
Nana, E., Corbari, C., and Bocchiola, D.: A model for crop yield and water footprint assessment: Study of maize in the Po valley, Agr. Syst., 127, 139–149, https://doi.org/10.1016/j.agsy.2014.03.006, 2014. a
Nelson, J. A., Walther, S., Gans, F., Kraft, B., Weber, U., Novick, K., Buchmann, N., Migliavacca, M., Wohlfahrt, G., Šigut, L., Ibrom, A., Papale, D., Göckede, M., Duveiller, G., Knohl, A., Hörtnagl, L., Scott, R. L., Dušek, J., Zhang, W., Hamdi, Z. M., Reichstein, M., Aranda-Barranco, S., Ardö, J., Op de Beeck, M., Billesbach, D., Bowling, D., Bracho, R., Brümmer, C., Camps-Valls, G., Chen, S., Cleverly, J. R., Desai, A., Dong, G., El-Madany, T. S., Euskirchen, E. S., Feigenwinter, I., Galvagno, M., Gerosa, G. A., Gielen, B., Goded, I., Goslee, S., Gough, C. M., Heinesch, B., Ichii, K., Jackowicz-Korczynski, M. A., Klosterhalfen, A., Knox, S., Kobayashi, H., Kohonen, K.-M., Korkiakoski, M., Mammarella, I., Gharun, M., Marzuoli, R., Matamala, R., Metzger, S., Montagnani, L., Nicolini, G., O'Halloran, T., Ourcival, J.-M., Peichl, M., Pendall, E., Ruiz Reverter, B., Roland, M., Sabbatini, S., Sachs, T., Schmidt, M., Schwalm, C. R., Shekhar, A., Silberstein, R., Silveira, M. L., Spano, D., Tagesson, T., Tramontana, G., Trotta, C., Turco, F., Vesala, T., Vincke, C., Vitale, D., Vivoni, E. R., Wang, Y., Woodgate, W., Yepez, E. A., Zhang, J., Zona, D., and Jung, M.: X-BASE: the first terrestrial carbon and water flux products from an extended data-driven scaling framework, FLUXCOM-X, Biogeosciences, 21, 5079–5115, https://doi.org/10.5194/bg-21-5079-2024, 2024. a
Oki, T. and Kanae, S.: Global Hydrological Cycles and World Water Resources, Science, 313, 1068–1072, https://doi.org/10.1126/science.1128845, 2006. a
Pascolini-Campbell, M. A., Reager, J. T., and Fisher, J. B.: GRACE-based Mass Conservation as a Validation Target for Basin-Scale Evapotranspiration in the Contiguous United States, Water Resour. Res., 56, e2019WR026594, https://doi.org/10.1029/2019WR026594, 2020. a
Rodell, M., Houser, P. R., Jambor, U., Gottschalck, J., Mitchell, K., Meng, C.-J., Arsenault, K., Cosgrove, B., Radakovich, J., Bosilovich, M., Entin, J. K., Walker, J. P., Lohmann, D., and Toll, D.: The Global Land Data Assimilation System, B. Am. Meteorol. Soc., 85, 381–394, https://doi.org/10.1175/BAMS-85-3-381, 2004. a
Senay, G.: Satellite Psychrometric Formulation of the Operational Simplified Surface Energy Balance (SSEBop) Model for Quantifying and Mapping Evapotranspiration, Appl. Eng. Agric., 34, 555–566, https://doi.org/10.13031/aea.12614, 2018. a
Senay, G. B., Budde, M. E., Verdin, J. P., and Melesse, A. M.: Operational evapotranspiration mapping using remote sensing and weather datasets: A new parameterization for the SSEB approach, J. Am. Water Resour. As., 49, 577–591, https://doi.org/10.1111/jawr.12057, 2013. a
Senay, G. B., Friedrichs, M., Singh, R. K., and Velpuri, N. M.: Evaluating Landsat 8 evapotranspiration for water use mapping in the Colorado River Basin, Remote Sens. Environ., 185, 171–185, https://doi.org/10.1016/j.rse.2015.12.043, 2016. a
Senay, G. B., Parrish, G. E. L., Schauer, M., Friedrichs, M., Khand, K., Boiko, O., Kagone, S., Dittmeier, R., Arab, S., and Ji, L.: Improving the Operational Simplified Surface Energy Balance Evapotranspiration Model Using the Forcing and Normalizing Operation, Remote Sens., 15, 260, https://doi.org/10.3390/rs15010260, 2023. a, b
Seneviratne, S. I., Corti, T., Davin, E. L., Hirschi, M., Jaeger, E. B., Lehner, I., Orlowsky, B., and Teuling, A. J.: Investigating soil moisture–climate interactions in a changing climate: A review, Earth-Sci. Rev., 99, 125–161, https://doi.org/10.1016/j.earscirev.2010.02.004, 2010. a
Siebert, S., Henrich, V., Frenken, K., and Burke, J.: Update of the digital global map of irrigation areas to version 5, Food and Agriculture Organization of the United Nations (FAO), https://openknowledge.fao.org/items/6029153b-831c-4275-b71d-501b72a1480d (last access: 27 March 2026), 2013. a, b, c
Sriwongsitanon, N., Suwawong, T., Thianpopirug, S., Williams, J., Jia, L., and Bastiaanssen, W.: Validation of seven global remotely sensed ET products across Thailand using water balance measurements and land use classifications, J. Hydrol.: Regional Studies, 30, 100709, https://doi.org/10.1016/j.ejrh.2020.100709, 2020. a
Thiery, W., Davin, E. L., Lawrence, D. M., Hirsch, A. L., Hauser, M., and Seneviratne, S. I.: Present-day irrigation mitigates heat extremes, J. Geophys. Res.-Atmos., 122, 1403–1422, https://doi.org/10.1002/2016JD025740, 2017. a
Thiery, W., Visser, A. J., Fischer, E. M., Hauser, M., Hirsch, A. L., Lawrence, D. M., Lejeune, Q., Davin, E. L., and Seneviratne, S. I.: Warming of hot extremes alleviated by expanding irrigation, Nat. Commun., 11, 290, https://doi.org/10.1038/s41467-019-14075-4, 2020. a
Valentini, R., Arneth, A., Bombelli, A., Castaldi, S., Cazzolla Gatti, R., Chevallier, F., Ciais, P., Grieco, E., Hartmann, J., Henry, M., Houghton, R. A., Jung, M., Kutsch, W. L., Malhi, Y., Mayorga, E., Merbold, L., Murray-Tortarolo, G., Papale, D., Peylin, P., Poulter, B., Raymond, P. A., Santini, M., Sitch, S., Vaglio Laurin, G., van der Werf, G. R., Williams, C. A., and Scholes, R. J.: A full greenhouse gases budget of Africa: synthesis, uncertainties, and vulnerabilities, Biogeosciences, 11, 381–407, https://doi.org/10.5194/bg-11-381-2014, 2014. a
van Dijk, A. I. J. M. and Bruijnzeel, L. A.: Modelling rainfall interception by vegetation of variable density using an adapted analytical model. Part 1. Model description, J. Hydrol., 247, 230–238, https://doi.org/10.1016/s0022-1694(01)00392-4, 2001. a
Van Tricht, K., Degerickx, J., Gilliams, S., Zanaga, D., Battude, M., Grosu, A., Brombacher, J., Lesiv, M., Bayas, J. C. L., Karanam, S., Fritz, S., Becker-Reshef, I., Franch, B., Mollà-Bononad, B., Boogaard, H., Pratihast, A. K., Koetz, B., and Szantoi, Z.: WorldCereal: a dynamic open-source system for global-scale, seasonal, and reproducible crop and irrigation mapping, Earth Syst. Sci. Data, 15, 5491–5515, https://doi.org/10.5194/essd-15-5491-2023, 2023. a
Volk, J. M., Huntington, J. L., Melton, F. S., Allen, R., Anderson, M., Fisher, J. B., Kilic, A., Ruhoff, A., Senay, G. B., Minor, B., Morton, C., Ott, T., Johnson, L., Comini de Andrade, B., Carrara, W., Doherty, C. T., Dunkerly, C., Friedrichs, M., Guzman, A., Hain, C., Halverson, G., Kang, Y., Knipper, K., Laipelt, L., Ortega-Salazar, S., Pearson, C., Parrish, G. E. L., Purdy, A., ReVelle, P., Wang, T., and Yang, Y.: Assessing the accuracy of OpenET satellite-based evapotranspiration data to support water resource and land management applications, Nature Water, 2, 193–205, https://doi.org/10.1038/s44221-023-00181-7, 2024. a, b, c, d
Wang, Z., Zhan, C., Ning, L., and Guo, H.: Evaluation of global terrestrial evapotranspiration in CMIP6 models, Theor. Appl. Climatol., 143, 521–531, https://doi.org/10.1007/s00704-020-03437-4, 2021. a
Weerasinghe, I., Bastiaanssen, W., Mul, M., Jia, L., and van Griensven, A.: Can we trust remote sensing evapotranspiration products over Africa?, Hydrol. Earth Syst. Sci., 24, 1565–1586, https://doi.org/10.5194/hess-24-1565-2020, 2020. a
Zhang, C. and Long, D.: Estimating Spatially Explicit Irrigation Water Use Based on Remotely Sensed Evapotranspiration and Modeled Root Zone Soil Moisture, Water Resour. Res., 57, e2021WR031382, https://doi.org/10.1029/2021WR031382, 2021. a
Zhang, Y., Kong, D., Gan, R., Chiew, F. H. S., McVicar, T. R., Zhang, Q., and Yang, Y.: Coupled estimation of 500 m and 8-day resolution global evapotranspiration and gross primary production in 2002–2017, Remote Sens. Environ., 222, 165–182, https://doi.org/10.1016/j.rse.2018.12.031, 2019. a, b, c, d
Zheng, C., Jia, L., and Hu, G.: Global land surface evapotranspiration monitoring by ETMonitor model driven by multi-source satellite earth observations, J. Hydrol., 613, 128444, https://doi.org/10.1016/j.jhydrol.2022.128444, 2022. a, b, c
Zipper, S., Kastens, J., Foster, T., Wilson, B. B., Melton, F., Grinstead, A., Deines, J. M., Butler, J. J., and Marston, L. T.: Estimating irrigation water use from remotely sensed evapotranspiration data: Accuracy and uncertainties at field, water right, and regional scales, Agr. Water Manage., 303, 109036, https://doi.org/10.1016/j.agwat.2024.109036, 2024. a