the Creative Commons Attribution 4.0 License.
the Creative Commons Attribution 4.0 License.
 | 04 Mar 2026
How does integrating multi-scale monitoring and compound-specific isotope analysis improve the evaluation of S-metolachlor degradation in agro-ecosystems?
Guillaume Drouin
Jenna Lohmann
Benoit Guyot
Gwenaël Imfeld
Sylvain Payraudeau
The presence of pesticides in surface water poses a significant risk to the quality of drinking water resources. A critical challenge in water quality management involves quantifying the export, degradation, and persistence of pesticides at the catchment scale. Compound-specific isotope analysis (CSIA) may help to evaluate the contribution of pesticide biodegradation in topsoil and water, as it is generally unaffected by non-degradative processes such as dilution, sorption, and volatilisation. In this study, multi-scale monitoring with CSIA was combined with a mass balance approach to determine the source apportionment and degradation contribution to the overall dissipation of S-metolachlor, a widely used herbicide, in the Souffel catchment (115 km2) during a corn and sugar beet growing season. WWTPs contributed to 52 ± 18 % of the input mass based on daily discharges. However, S-metolachlor from non-point and point sources could not be clearly distinguished due to similar stable isotope signatures. The mass balance, including topsoil, river water, sediment, and wastewater treatment plant (WWTP) effluent, showed that 99±5 % ( SD) of S-metolachlor applied during the study period was degraded over the five-month growing season. Most degradation occurred in the topsoil, with only 12.3±3.1 % degraded in the river. CSIA-based estimates of S-metolachlor degradation corroborated the mass balance results, indicating that 95±20 % of S-metolachlor was degraded over the growing season. Our results demonstrate that pesticide CSIA, applied from upstream to downstream, enabled robust estimation of pesticide degradation across an entire catchment. We anticipate that CSIA will enhance surface water management by improving the diagnosis of pesticide off-site transport and degradation. This approach can support the development of efficient regulatory strategies aimed at preserving and restoring aquatic ecosystems.
- Article
(3355 KB) - Full-text XML
-
Supplement
(1487 KB) - BibTeX
- EndNote


At the European scale, the slightly upward trend in total pesticides sales from 2011 to 2018 highlights the increasing reliance of human activities on pesticides (European Environment Agency and Mourelatou, 2018), although a decrease of 12 % was observed from 2018 to 2022 (Eurostat, 2024). As a consequence of past and current pesticide use, widespread contamination affects all environmental compartments, including soils, surface water, groundwater and air (Tang et al., 2021). Between 2013 and 2022, 9 % to 25 % of monitored rivers and lakes in Europe reported pesticide concentration exceeding EU effect threshold (European Environment Agency, 2024). S-metolachlor, a herbicide, was among the three most frequently detected pesticides during this period (European Environment Agency, 2024).
Of all surface waters, low Strahler order rivers are among the most vulnerable aquatic systems to pesticide off-site transport from agricultural areas (Halbach et al., 2021; Spycher et al., 2018; Toth et al., 2024), as they are closely connected to their catchment (Engelhardt et al., 2014). Processes controlling pesticide loads entering rivers depend on transportation, as well as pesticide accumulation and degradation patterns, involving various compartments from the topsoil (i.e., 0 to 10 cm) to the river (Rasmussen et al., 2015). While biodegradation is recognised as the primary degradation process in agriculturally impacted catchments (Fenner et al., 2013), the interplay of hydrological dynamics and bio-physico-chemical processes on its contribution to overall pesticide dissipation, i.e., the observed concentration decline, remains poorly understood at the catchment scale. This uncertainty hinders the effective implementation of surface water protection measures, as apparent pesticide dissipation may obscure underlying persistence and accumulation at the catchment scale.
Hot spots of pesticide biodegradation at the catchment scale are primarily found in topsoils, surface waters, and the river hyporheic zone (Fenner et al., 2013). In a previous study, S-metolachlor biodegradation in topsoil was estimated to be as much as 93 % three months after application (Alvarez-Zaldívar et al., 2018). Pesticide off-site transport to surface waters can occur in the dissolved phase via leaching or runoff, as well as in particulate form during intense rainfall event (Meite et al., 2018). The transport of particle-bound pesticides typically prolongs their transit time within the topsoil, thereby reducing their availability and the duration for biodegradation to occur (Menz et al., 2018). In addition, the hyporheic zone of rivers has been proposed as a highly reactive zone for contaminant biodegradation (Krause et al., 2017), leveraging redox and biogeochemical gradients generated by water flows and favoring microbial activities (Boano et al., 2014; Peralta-Maraver et al., 2018). Despite substantial efforts to study dissipation processes at the catchment scale, tracking pesticide degradation under environmental conditions remains highly challenging. Conventional approaches, based primarily on pesticide concentrations and the detection of transformation products (TPs), reflect both non-degradative dissipation and degradation across catchment compartments, but provide limited knowledge on the specific pathways and the extent of the degradation.
In this context, compound-specific isotope analysis (CSIA) offers a promising tool for detecting and quantifying contaminant degradation in the environment (Elsner, 2010). However, its application to pesticide degradation in mid-scale agricultural catchments (from 50 to 500 km2) remains largely unexplored. Contaminant molecules containing lighter isotopes (e.g., 12C) typically undergo faster degradation compared to their heavier counterparts (e.g., 13C), which may result in a reaction-specific kinetic isotope effect. Consequently, the non-degraded fraction of the contaminant becomes enriched in the heavier isotopologues. Thus, monitoring changes of the isotope signature (e.g., δ13C) over time enables the evaluation of degradation and potentially facilitates the quantification of the degradation extent, provided that condition-specific reference isotopic fractionation values have been determined. CSIA has been utilised for the past two decades to assess the biodegradation of legacy industrial contaminants in groundwater (Hunkeler et al., 2008; Elsner and Imfeld, 2016). Pesticide CSIA has been employed to examine degradation of the insecticide profenofos in agricultural plots (Masbou et al., 2025), the herbicide S-metolachlor in an small 47 ha agricultural catchment (Alvarez-Zaldívar et al., 2018) and the fungicide dimethomorph in a vineyard catchment (43 ha), from topsoil (Masbou et al., 2023) to the storm basin collecting runoff at the catchment outlet (Gilevska et al., 2023). Moreover, isotope-fractionation reactive transport models based on CSIA data have been developed to support source apportionment at the hillslope scale (Lutz and Van Breukelen, 2014) and to predict pesticide biodegradation (Lutz et al., 2017). However, pesticide CSIA has not yet been utilised to aid in interpreting the dynamics of pesticide transport and dissipation processes within larger catchments (>100 km2) that encompass river systems (Elsner and Imfeld, 2016).
This study investigated the transport and degradation of S-metolachlor from topsoil to the river network within a mid-scale (115 km2) agricultural catchment. S-metolachlor, a widely used herbicide (Food and Agriculture Organization of the United Nations, 2019), was selected as a model compound of synthetic pesticide due to its extensive application in corn and sugar beet crops until its recent ban in Europe (European Commission, 2024), as well as the persistence of its TPs. The study aimed to (i) assess the potential of CSIA data collected along the river network to distinguish between topsoil and river degradation of S-metolachlor, (ii) quantify the river network contribution to overall degradation at the catchment scale, and (iii) differentiate between pesticide sources, including diffuse agricultural applications and point-source inputs from wastewater treatment plants (WWTP). To achieve these objectives, a multi-scale sampling strategy was applied, integrating S-metolachlor mass balance, in-stream transit time analysis, and CSIA data from sources to the catchment outlet.
2.1 Catchment description
The Souffel catchment (115 km2) is located northwest of Strasbourg (Bas-Rhin, France; catchment outlet coordinate: 48°38′20′′ N, 7°44′35′′ E; Fig. 1). The catchment has an average slope of 2.4±2.2 % ( SD; 0 %–86 % min–max) with a total of 73 km of rivers comprising segments that range from the first to third order according to the Strahler classification system (National dataset BD TOPO® 2019, http://www.ign.fr/, last access: 1 February 2019). The mean annual precipitation recorded from 1975 to 2018 at the nearest national weather station, located in Entzheim (13 km to the south; MétéoFrance, coordinates 48°32′24′′ N, 7°37′48′′ E), was 648±91 mm. In the year of the study, 2019, the recorded precipitation was 579 mm. The distribution of crop types within this catchment is uniform, with cropland accounting for 84.5 % of the total area (Büttner and Kosztra, 2014; http://land.copernicus.eu, last access: 11 February 2019). In 2019, the predominant crops were corn, wheat, and sugar beet, which occupied 41.4 %, 20.6 %, and 4.8 % of the agricultural land, respectively (National Agricultural Plot Database – Registre Parcellaire Graphique, http://www.ign.fr, last access: 14 April 2022). Corn and sugar beet, under conventional farming practices, typically receive applications of herbicide products containing S-metolachlor (https://ephy.anses.fr, last access: May 2019; see Table S1 in the Supplement).
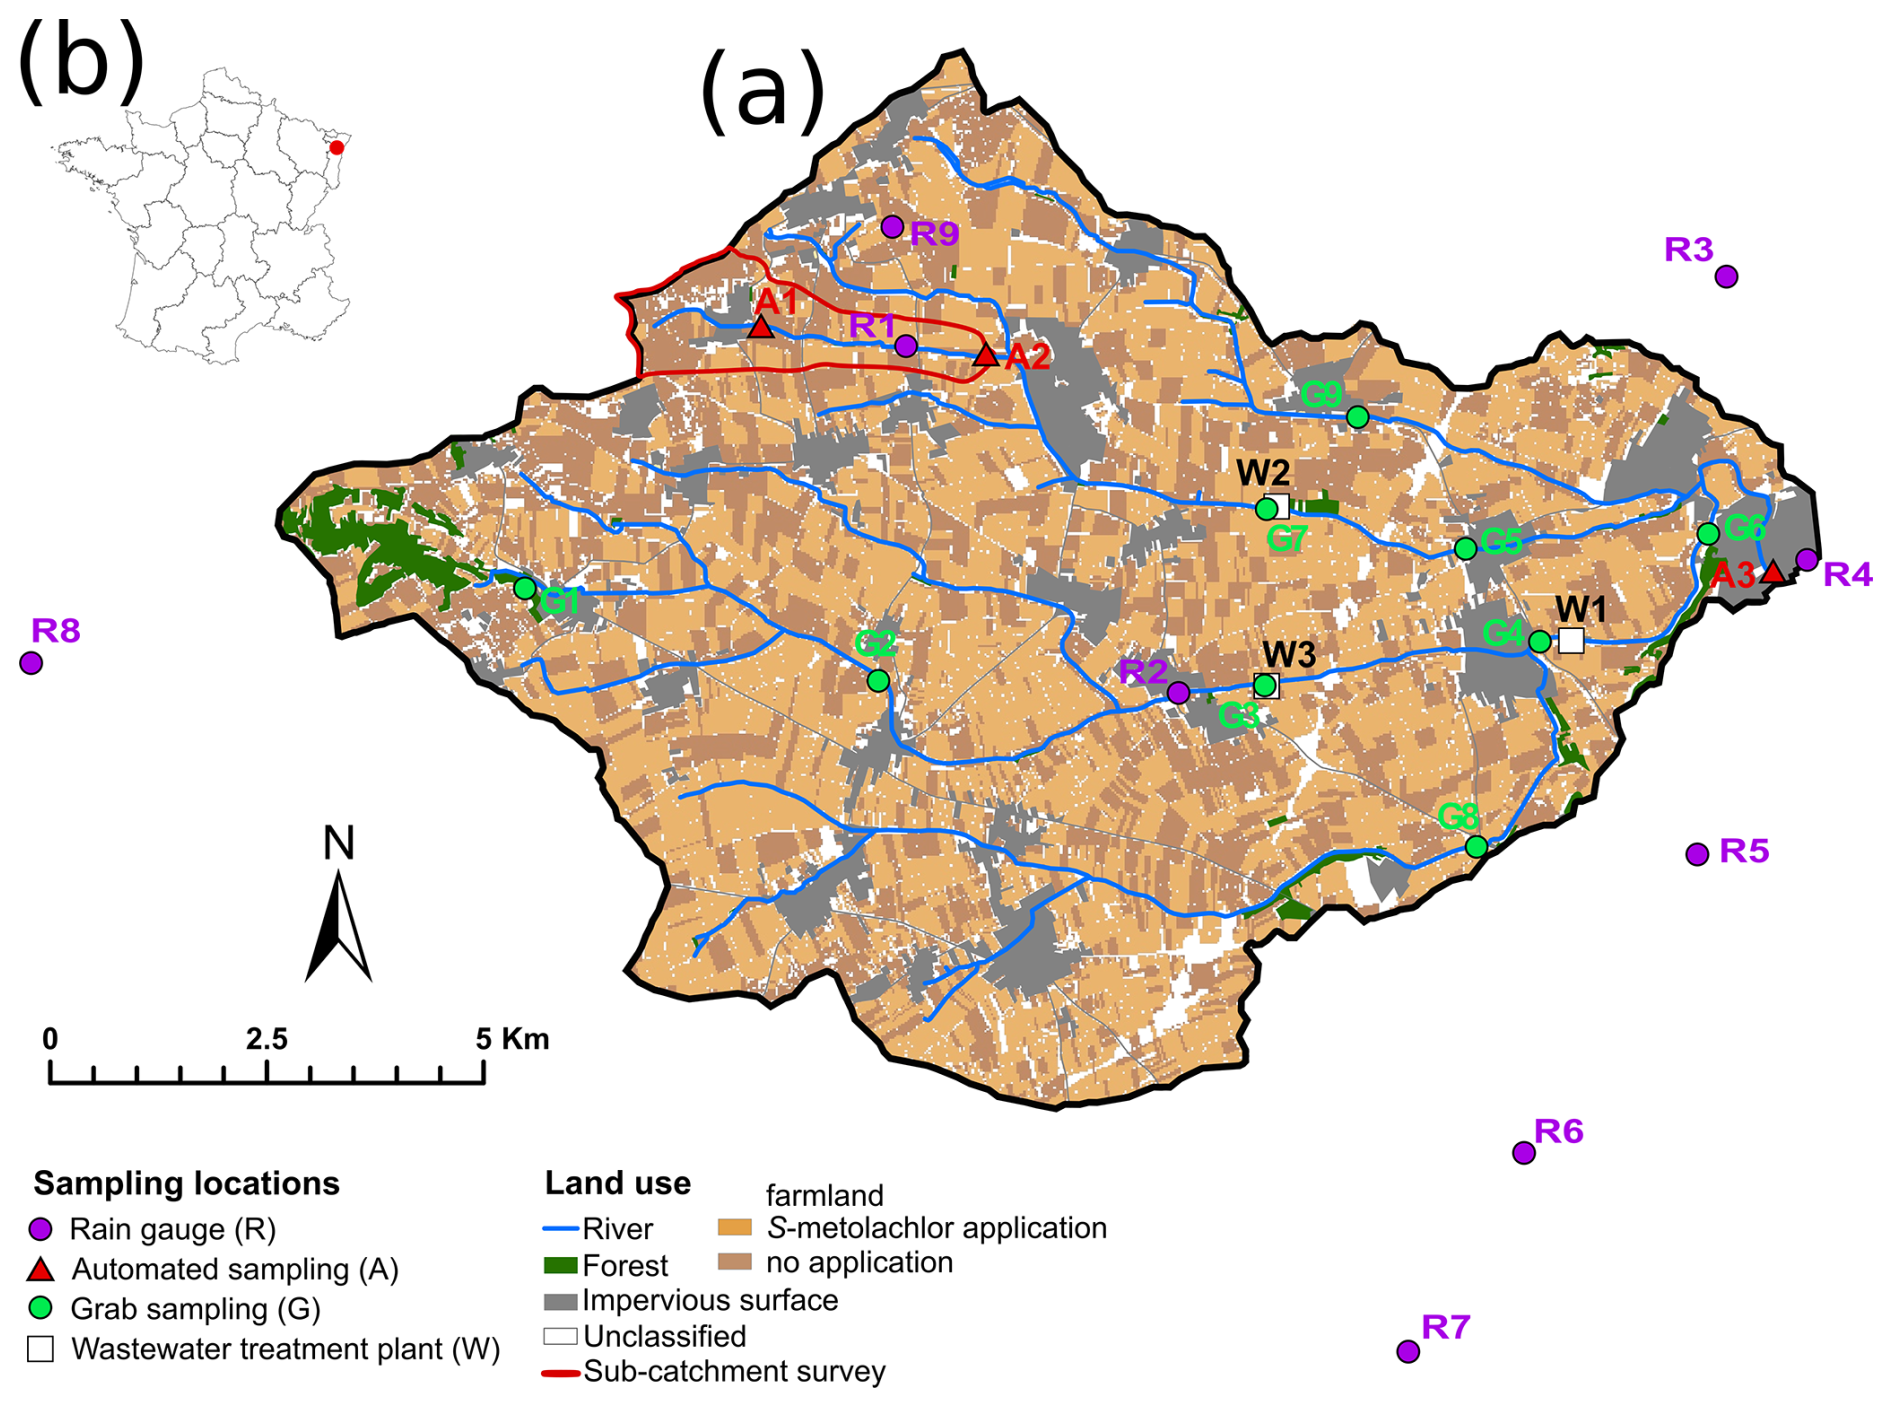
Figure 1The Souffel catchment (a), located in France (b), featuring sampling locations (monthly grab in green; n=9 G1 to G9, high-resolution in red; n=3 A1 to A3 and WWTP effluents in white; n=3 W1 to W3) and the associated land uses. The area of S-metolachlor applications in 2019 was estimated on crops with reported S-metolachlor authorisation (https://ephy.anses.fr/, last access: 20 May 2022; corns, beets) using the Registre Parcellaire Graphique (http://www.ign.fr, last access: 14 April 2022). Rainfall was quantified using nine rain gauges: R1 (deployed by our team for this study to characterise sub-hourly intensity), hourly stations R7 (MeteoFrance), R3–R6 (Strasbourg Eurometropole), and R2, R8 to R9 from citizen climate stations (http://www.wunderground.com, last access: 20 June 2020). The targeted sub-catchment, Avenheimerbach river, is delineated in red.
2.2 S-metolachlor applications
Determination of S-metolachlor applications rates at the catchment scale is crucial to establish the mass balance used to demonstrate the potential of combining multi-scale sampling and CSIA to estimate S-metolachlor degradation. Application estimates were derived from a survey conducted in the Avenheimerbach sub-catchment in 2019 (Fig. 1) and then extrapolated to the entire catchment, as detailed below. This sub-catchment is considered representative by local farming authorities due to its similar farming practices for corn and sugar beet compared to the entire Souffel catchment (Table S2 in the Supplement). The survey of pesticide application practices included the 60 farmers owning fields in the Avenheimerbach sub-catchment (3.6 km2, containing 94 % farmland; Fig. 1, red sub-catchment). The survey's responses covered 57 % of the plots, with 43 % potentially receiving S-metolachlor applications under reported homogeneous conditions. Two sequential applications of S-metolachlor were administered to sugar beet fields, with each application ranging from 576 to 672 g ha−1, on 18 April (±1 d) and 29 April (±2 d). Subsequently, a single application of S-metolachlor, with doses varying from 160 to 1000 g ha−1, was applied to corn fields between 14 May and 3 June, with a median application date of 20 May. These application rates and timings are consistent with the climatic conditions and vegetation stages observed in the Souffel catchment during 2019, as corroborated by local agricultural advisers and pesticide suppliers. Therefore, the S-metolachlor application amounts were extrapolated to the entire catchment for the calculation of the mass balance (Sect. S1.2 and S1.5 in the Supplement). Multiple scenarios for the application doses of S-metolachlor were evaluated, considering national regulations, recommendations from local farmer advisers, and survey results. This approach was employed to explicitly address uncertainty related to the extrapolation of application rates at the catchment scale (Table S1 in the Supplement). In total, an estimated 3163±116 kg of S-metolachlor (Table S10 in the Supplement) were applied across the study area during the study period.
2.3 Sampling schemes
The multi-scale data collection aims to: (i) characterise the main hydrological pathways from fields to rivers, (ii) quantify the extent of S-metolachlor degradation in topsoil and rivers, and (iii) determine S-metolachlor source apportionment, distinguishing between diffuse agricultural applications and WWTP point sources. The adopted strategy involved high frequency flow proportioned sampling at three nested scales (Fig. 1): the upstream (A1) and downstream (A2) parts of the first order Avenheimerbach sub-catchment, and the outlet of the catchment (A3). Additionally, a monthly sampling scheme was implemented to examine upstream-to-downstream river processes and differentiate contributions from multiple sources, including diffuse agricultural inputs and three-point sources corresponding to WWTP effluents (W1 to W3, Fig. 1). The sampling campaign was carried out over a period of 215 d, from 1 March to 1 October 2019. This duration was chosen to encompass the application periods of S-metolachlor as well as the growing seasons for both sugar beets and corn. An additional independent dataset from eight locations (Fig. S7 in the Supplement) provided by the Rhin-Meuse Water Agency was used to support evidence of S-metolachlor degradation. This dataset included monthly measurements of three TPs of S-metolachlor: metolachlor ethane sulfonic acid (ESA), metolachlor oxanilic acid (OXA) and metolachlor NOA 413173, from January to December 2019. These three TPs do not encompass all possible degradation pathways of S-metolachlor; instead, they represent a subset of particular concern for groundwater used as a drinking resource. This concern arises from their high mobility, persistence, and are frequent detection across Europe (Baran et al., 2022; Menger et al., 2021; Pasquini et al., 2025). Moreover, each is subject to regulatory thresholds for groundwater quality (European Commission, 2011). Water samples from eight monitoring sites (Fig. S7 in the Supplement) were analysed monthly by an ISO/IEC 17025-accredited laboratory (Eurofins Hydrologie Est, COFRAC) using validated methods (NF EN ISO, 1997) for pesticide residues (Table S14 in the Supplement). The data are expressed as S-metolachlor mass-equivalent loads (MELSM), calculated as shown in Eq. (1).
where MolWSM and MolW denote the molar weight of S-metolachlor, and that of its TPs, respectively. The proportion of each TPs, i.e. %ESA, %OXA and %NOA, can be expressed as the ratio of the associated mass equivalent loads on the sum of TPs mass equivalent loads and SM loads (Rose et al., 2018). However, the monthly grab sampling protocol employed by the Water Agency, conducted without simultaneous discharge measurements, precluded accurate integration of TPs concentrations into the mass balance calculations.
2.3.1 Continuous monitoring at three nested scales
Continuous flow proportional sampling was employed to quantify pesticide degradation at diverse sub-catchment size (outlets at location A1, A2 and A3 in Fig. 1, respectively 2.3, 3.6 and 115 km2) between 1 March and 1 October, covering 215 d. This approach enabled the estimation of representative weekly average concentrations and loads, which were used to calculate seasonal mass balances and export coefficients. The autosamplers, flowmeter and multiparameter probe deployed at each location are detailed in the Supplement (Table S3). Discharge, with an average precision of 15 %, along with pH, electrical conductivity and water temperature, were recorded continuously at a 2 min frequency at the outlet A1, A2 and A3. Samples were collected over defined discharge volumes, adjusted weekly, from 840 to 1860 m3 at locations A1 and A2, and from 1500 to 1960 m3 at A3, to account for the seasonal decline in baseflow. Water samples (up to twelve 330 mL glass bottles) were collected weekly and merged into composite samples, represented water collected over a 4.9 to 21 h period (22.8 ± 0.8 h; mean ± SD). The sampling window was determined based on hydrograph characteristics, allowing separation of baseflow and high-flow conditions. Hourly rainfall data were collected in nine rain gauges (Fig. 1; ITES, MétéoFrance, Strasbourg Eurometropole and open-source data, http://www.wunderground.com, last access: 20 June 2020) covering the Souffel catchment area (R1 to R9, Fig. 1 and Table S4 in the Supplement). Rainfall events were separated by at least 24 h of no rainfall and classified using R-v.3.5.0 with the hydromad package v.0.9-27 (Andrews et al., 2011).
2.3.2 Monthly sampling of water, sediment and topsoil
Eleven sampling locations for water and riverbed sediment were selected along the Souffel river (G1 to G9 and A1 to 3 in Fig. 1). Site G1 was near the primary source, characterised by a land cover of 32 % forest and 68 % cropland. Sites G2 to G9 were selected using a stratified random sampling approach within the agricultural areas to ensure a homogeneous cropland cover ranging from 84 % to 94 %. Additionally, WWTPs within the catchment area (W1 to W3 in Fig. 1) were sampled as potential secondary sources of S-metolachlor, likely originating from various pathways, including infiltration from crop topsoil into underground sewage networks, agricultural runoff, household usage and improper disposal during pesticide preparation or equipment cleaning (Gerecke et al., 2002). Grab samples of river water and wastewater treatment plant (WWTP) effluent were collected on a monthly basis, specifically on 13 March, 2 April, 15 May, 12 June, 17 July, 21 August, and 1 October. These samples were gathered using 2 L high-density polyethylene (HDPE) bottles and subsequently analysed for S-metolachlor concentration and compound-specific isotope analysis (CSIA). In addition, 150 mL samples were collected in HDPE bottles and subjected to on-site filtration using 0.45 µm cellulose acetate filters for further hydrochemical analysis (Table S5 in the Supplement). At each location, conductivity, pH, water temperature and flow were measured in the river (Table S3 in the Supplement).
Sediment samples were collected monthly from the riverbed at sites G1, G3 to G9 and A1 to A3 (Fig. 1) to evaluate whether the sediment acted as a sink or source of S-metolachlor. The top 5 cm of the riverbed sediment were collected using a clean scraper and transferred into plastic bags. Sampling at G2 was not possible due to a gravel riverbed. Additionally, topsoil samples (0 to 10 cm) were collected from sugar beet and corn fields at two locations within the surveyed sub-catchment (within a 100 m radius of sites A1 and A2 in Fig. 1) to quantify S-metolachlor dissipation over the season. At each location, four subsamples were combined and thoroughly mixed. All water, sediment and topsoil samples were stored in dark, sealed containers at 4 °C and processed for S-metolachlor extraction within 2 d of collection.
2.4 S-metolachlor extraction, quantification, and compound-specific isotope analysis (CSIA)
Water samples from continuous and grab sampling were initially pre-filtered using qualitative filters (Grade 1, Whatman) and subsequently filtered through glass filters (GF/5, 0.4 µm average pore size, Macherey-Nagel) with a bottle-top vacuum filtration unit. The resulting filtrate was extracted and concentrated by solid-phase extraction (SPE) using SolEx C18 cartridges (1 g phase, 40–63 µm particle size, Thermos Fischer Scientific). The filters were initially collected and subsequently dried at ambient temperature within a desiccator to ascertain the total suspended solids (TSS). Following this, the filters were frozen prior to the extraction of S-metolachlor.
To quantify solid-bound S-metolachlor, 34 % of the filters (n=93) were selected based on the highest concentrations observed in the aqueous phase (≥0.02 µg L−1) and the mass of TSS retained on the filter (≥13 mg L−1). S-metolachlor was extracted from these filters by solid-liquid extraction, as previously described (Gilevska et al., 2022). Topsoil and wet riverbed sediment samples were homogenised and sieved through a 2 mm mesh, followed by centrifugation at 2400 relative centrifugal force (RCF) for 20 min to eliminate excess water. Subsamples of the topsoil and wet riverbed sediment were collected for further hydrochemical analysis (Table S5 in the Supplement). Approximately 20 g of dried mass equivalent from the wet sediment or topsoil samples underwent solid-liquid extraction, following the same procedure used for TSS.
S-metolachlor concentrations were quantified using a validated gas chromatography–mass spectrometry (GCMS) method (Droz et al., 2021). The environmental quantification limits ranging from 0.01 to 0.03 µg L−1 for water and 0.4 to 2.5 µg kg−1 for riverbed sediment or topsoil, with an analytical reproducibility of 4.3 %.
Compound-specific isotope analysis (CSIA) of carbon in S-metolachlor was conducted in accordance with established protocols for gas chromatography–isotope ratio mass spectrometry (GC-IRMS) (Gilevska et al., 2022). In brief, the isotope ratios for each sample were measured in triplicate, with a typical analytical uncertainty of ±0.5 ‰. These measurements are expressed as delta values δ13C relative to the Vienna PeeDee Belemnite (V-PDB) standard:
where δ13C represents the isotope signature of the carbon and is the isotope ratio of 13C to 12C isotopes in a given sample or a standard. The δ13C linearity is defined as the range of injected carbon mass within which the δ13C values of S-metolachlor remain consistent within ±0.5 ‰ (Jochmann et al., 2006), which was established from 6 to 300 ng for C. The minimal detectable change of isotope signature (Δδ13Cmin), above which isotope fractionation can be attributed to degradation, is determined by propagating the uncertainties associated with measurements and sample preparation (Eq. S1 in the Supplement). For S-metolachlor, Δδ13Cmin was 1 ‰ in water and 2 ‰ in sediment. However, as the origin of the isotope fractionation cannot be identified a priori in environmental samples, a conservative threshold of 2 ‰ was applied for all samples.
2.5 Data analysis
2.5.1 S-metolachlor loads and mass balance
The S-metolachlor loads were estimated at the sub-catchment and catchment outlets (A1 to A3 in Fig. 1) on a daily time-step using Eq. (3):
where , and represent the exported load, the instantaneous water discharge, and the average S-metolachlor concentration at station Aj during period i, respectively. S-metolachlor concentrations were obtained from composite water samples, representing period-averaged values. In contrast, discharge data were available at high temporal resolution and used in their instantaneous form. By pairing these representative concentrations with continuous flow measurements, we accounted for temporal variability in hydrological conditions, enabling a more accurate estimate of total pesticide mass export over the monitoring period, rather than isolated load snapshots. Area-normalised daily water discharges (m3 s−1 ha−1) and S-metolachlor loads (g ha−1) (Shaw et al., 2019) were used to compare S-metolachlor exports at sites A1 to A3. Due to missing water samples or flow measurements caused by acquisition failures following extreme floods or severe weather events during the agricultural season, continuous flow and concentration time series covered 62 %, 59 %, and 76 % of the total monitoring period at sites A1, A2, and A3, respectively. Missing data at sites A1 and A2 were reconstructed using the upstream–downstream relationship described in the Supplement (Fig. S2).
Daily loads of S-metolachlor were computed for each grab sampling event conducted in the river at sites G1 to G9, as well as for the effluents from WWTP (W1 to W3). This calculation was performed by multiplying the instantaneous concentrations of S-metolachlor by the corresponding discharge rates. Discharge in the river was measured using a handheld electromagnetic water flow meter, while discharge data for WWTP effluents were provided by the respective WWTP managers. For the three river reaches receiving WWTP effluents (upstream locations G3, G4 and G7), source apportionment of S-metolachlor was estimated using mass mixing (Eq. 4). The approach combined the daily contributions from the WWTPs (Lwwtp) and the upstream river (Lriver) to determine the contribution of the WWTP (xwwtp) to the total S-metolachlor load in the river reach.
At the outlet A3, mass conservation was assumed to estimate the contribution of point and non-point sources to the total S-metolachlor load. A seasonal mass balance, detailed in the Supplement (Sect. S1.5), was calculated over the 215 d study period and compared with CSIA data. The analysis accounted for relevant processes occurring in the catchment, as described by Eq. (5):
where mapp represents the pesticide mass applied across the catchment in 2019, based on the application scenarios detailed in Table S1 in the Supplement. denotes the residual pesticide stock present in the 2018 topsoil prior to the first S-metolachlor application in 2019. mwwtp accounts for the S-metolachlor effluent discharged from WWTPs, while mexp represents the exported load measured at the catchment outlet (A3, Fig. 1). The terms mvol and mphoto correspond to the estimated masses lost due to volatilisation and photodegradation, respectively, with detailed assumptions and references provided in Sect. S1.5.1 and S1.5.2 of the Supplement. mhydro represents the mass degraded by hydrolysis, which was considered negligeable for S-metolachlor under the study field and river conditions (Masbou et al., 2018). Additionally, mwat,bio and msoil,bio represent the S-metolachlor masses biodegraded in river and agricultural fields, respectively. The pseudo first-order rate constants for S-metolachlor have been previously determined for water-sediment systems (Droz et al., 2021) and agricultural topsoil (Alvarez-Zaldívar et al., 2018). Finally, mres refers to the residual S-metolachlor measured in topsoil after the 215 d study period.
2.5.2 Degradation estimation and source apportionment using CSIA
The extent of S-metolachlor degradation (B) in river and WWTP water samples was determined using carbon isotope signatures (δ13C) through the CSIA approach (Eq. 6) (Alvarez-Zaldívar et al., 2018). A median carbon isotopic enrichment factor for S-metolachlor ( ‰) was derived from laboratory-controlled biodegradation experiments conducted under a range of conditions reported in the literature (Table S7 in the Supplement). The contribution of photolysis to ε(bulk,C) was considered negligible, based on findings by Van Breukelen (2007) (Sect. S1.8 in the Supplement).
Estimating S-metolachlor degradation in the topsoil of corn and sugar beet fields was hindered by strong matrix effects, which compromised reliable δ13C measurements. Therefore, degradation dynamics and extent were inferred from monthly S-metolachlor concentration data (Sect. 2.3.2) using a degradation model that relates dissipation, degradation, and stable isotope fractionation. This model, previously validated in a nearby agricultural headwater catchment with similar soils and farming practices (Sect. S1.6 in the Supplement; Payraudeau et al., 2025), was applied to independently simulate topsoil S-metolachlor concentrations and corresponding δ13C values locations A1 and A2 with higher temporal resolution. Modelled S-metolachlor concentrations were then validated against observed topsoil measurement (Fig. S1 in the Supplement).
The utility of CSIA data for distinguishing point and non-point sources of S-metolachlor was evaluated using an isotope mixing approach (Eq. 7):
where , , represent the isotope signatures measured at the outlet (A3), in the WWTP effluents, and the predicted signatures in the river from upstream agricultural areas, respectively. The term xwwtp denotes the proportion of the daily S-metolachlor load at the outlet originating from WWTP effluents. The proportion xwwtp was calculated using a stable isotope mixing model (Eq. 8).
This mixing model was applied exclusively to CSIA data exhibiting significant degradation (Δδ13C≥2 ‰).
The predominant hydrological processes governing the off-site transport of S-metolachlor from topsoil to river systems are first summarised. Subsequently, dissipation and export patterns of S-metolachlor were analysed by integrating multi-scale sampling with a mass balance approach. Finally, S-metolachlor degradation along the topsoil-to-river continuum was estimated using CSIA data, with a focus on: (1) the use of stable isotope ratios of S-metolachlor as an indicator of degradation in upstream topsoil, (2) the specific contribution of the river to the overall catchment-scale degradation, and (3) the apportionment of multiple pesticide sources, including diffuse agricultural applications and point sources from WWTPs.
3.1 Dominance of lateral subsurface flows in S-metolachlor load and significance of WWTPs contribution
Hydro-climatic patterns and key hydrological processes, potentially driving pesticide off-site transport were characterised using a sampling approach that combined upstream to downstream monitoring and sampling at monthly to sub-hourly time scales. Compared to the previous twenty years (March to October 2000 to 2019; http://www.hydro.eaufrance.fr, last access: 15 January 2020), the total discharge was five times lower with an area-normalized discharge at the outlet (A3) of 0.828 ± 0.986 m3 d−1 ha−1 (± SD; Fig. 2e). During the seven-month period from March to the end of September 2019 was the fifth driest year in the past two decades, with total precipitation reaching 418 ± 79 mm (2000–2019 average). In terms of temperature, it was also the third warmest year, with a mean of 16.3 °C, compared to the 2000–2019 average of 15.7 ± 0.7 °C. These data are based on records from the Météo-France station in Entzheim, located approximately 10 km south of the catchment. This is one order of magnitude lower than that of the neighboring rivers to the south and the north of the study area during the study period (6.55 m3 d−1 ha−1 for the Bruche River and 3.85 m3 d−1 ha−1 for the Zorn River; http://www.hydro.eaufrance.fr, last access: 15 January 2020). This difference is consistent with longer-term data (1980 to 2000; http://www.hydro.eaufrance.fr, last access: 15 January 2020), and highlights the limited capacity of the Souffel catchment in 2019 to dilute pesticide loads compared to neighbouring rivers with mountainous upstream areas. Area-normalised discharges calculated at grab sampling locations (G1 to G9 and A1 to A3; Fig. 1) were close to the 1:1 line (Figs. S2 and S3 in the Supplement). This suggests homogeneous hydrological responses and water distribution (Shaw et al., 2019) between the eleven sub-catchments and associated river reaches. No significant differences of the river hydrochemistry were observed between locations and sampling times (Table S12 in the Supplement; Tukey's test; p value >0.05), although WWTP hydrochemistry significantly differed from river samples (Sect. S2.7 in the Supplement). The three WWTP effluents contributed to 49±6 % of the total water discharge at the catchment outlet during the high-flow period (March to June). During low-flow conditions, river–groundwater interactions further reduce surface water discharge, causing wastewater treatment plant (WWTP) effluents to contribute up to 100 % of the total flow (Fig. S6 in the Supplement). This effect was even more pronounced for S-metolachlor loads (Fig. S5b in the Supplement), highlighting a sharp decline in diffuse upstream inputs roughly three months after the last herbicide applications, while point-source emissions from the WWTP continued.
The hydrological response time of the catchment area, defined as the time between the peak of a rainfall event (Fig. 2a) and the peak of the associated discharge (Fig. 2e) at the main outlet A3, ranged between 1.2 and 12 h. This suggests the co-occurrence of both rapid runoff and slower sub-surface contributions to the river (Gericke and Smithers, 2017). The hydro-climatic dataset was also used to investigate the contributions of these fast flow processes. Seventeen rainfalls events were recorded over the 215 d of the study (Fig. 2a, March to October 2019), with a cumulative rainfall of 358±50 mm ( SD between stations R1 to R9).
The intensity of rainfall and the saturated hydraulic conductivity of the topsoil were compared for 17 rainfall events to estimate the likelihood of surface runoff. Between 1 March and 1 October, only events 9 and 15 were classified as heavy rainfall (>7.5 mm h−1) (Monjo, 2016), while 14 events were categorised as light (<2.5 mm h−1), and one event as moderate (2.5–7.6 mm h−1). Although events 8 and 12 exhibited high intensity over short period (Fig. 2a), their total rainfall depths were low. Compared to the estimated saturated hydraulic conductivity of the topsoil, ranging from 6 to 60 mm h−1 during corn and sugar beet growing seasons in a similar brown and calcic soil catchment (Lefrancq et al., 2017b), only events 9 and 15 were likely to generate moderate surface runoff. This suggests that preferential flow paths in the subsurface were likely the dominant transport mechanism for the other rainfall events. Furthermore, the absence of correlation between TSS concentration at the outlets (A1, A2, and A3) and rainfall events supports this hypothesis. Average TSS concentrations were 3662±9745, 1401±2578 and 578±938 mg L−1 ( SD) at A1, A2, and A3, respectively, with maximum values of 49 605, 10 998 and 5967 mg L−1 (Fig. 2b and e). The lower TSS concentrations associated with subsurface flow compared to surface runoff further reinforce this hypothesis. Additionally, the limited extent of contributing surface runoff areas, as illustrated by the Wetness index (Sect. S2.2 and Fig. S4 in the Supplement), supports the hypothesis that subsurface flow may be the primary contributor to discharge at the outlet.
At the outlet (A3), lower electrical conductivity values were consistently observed during rainfall events, with an average drop from 0.852±0.097 to 0.133±0.045 mS cm−1 ( SD). Consequently, discharge at the outlet was inversely correlated with conductivity (R2=0.53; p value <0.01). This suggests that river water during the wet season primarily originated from subsurface flow, as rainwater ( mS cm−1) entering the river likely had limited contact time with topsoil (Leu et al., 2004). Combined with earlier analysis showing that rainfall intensity rarely exceeded topsoil hydraulic conductivity, indicating limited surface runoff, these results suggest that rapid transport from fields near the A1–A2 river reach (2.2 km) was primarily driven by lateral subsurface flow. The seasonal ratio of 3.1, derived from mean concentrations of 56.8 ± 12.3 % for ESA and 16.7 ± 4.4 % for OXA across the eight Water Agency sites (n=88; Table S13 in the Supplement), aligns with the distinct ratio patterns reported by Rose et al. (2018), which are indicative of dominant hydrological pathways. Specifically, this ratio supports the predominance of subsurface flow in the hydrological functioning of the Souffel catchment. Additionally, during dry periods, electrical conductivity was markedly higher at site A2 ( mS cm−1) compared to site A1 ( mS cm−1; mean ± SD), suggesting mixing between groundwater and surface water.

Figure 2Dynamics of rainfall, river discharge, suspended solid and S-metolachlor concentration at the outlet of the sub-catchment A1, A2 (left panel) and Souffel catchment A3 (right panel) in 2019. (a) Rainfall at location R1 (Fig. 1), (b, e) River discharge at A1 & A2 and total suspended solids at A3, (c, f) S-metolachlor concentrations in dissolved phase (nA1=58; nA2=68; nA3=176) and (d, g) Cumulative area-normalised load in dissolved phase. Dashed vertical line in (b) and (e) represents the timing of the seven grab sampling campaigns. The shaded gray area in (c), (d), (f), (g) indicates the dates ofS-metolachlor application.
3.2 S-metolachlor dissipation and mass export patterns
In addition to in-stream transit time, both horizontal and vertical hyporheic exchange flows can affect the dissipation and biodegradation of S-metolachlor at the river scale by enhancing the mixing of nutrients and S-metolachlor in the water column with microbial degraders in the riverbed sediments (Schaper et al., 2018). Although quantifying hyporheic exchange along the 73 km of river reaches was beyond the scope of this study, multiple lines of evidence indicate that such flows were limited in the study system. First, the riverbed sediment was classified a silt loam (Gerakis and Baer, 1999), with a composition of clay (<2 µm) at 14.6±3.5 % ( SD), silt (2 to 50 µm) at 65.5±11.5 %, and sand (50 to 2000 µm) at 19.9±13.7 % (n=22), and had a low organic carbon content ( %). This composition indicates low permeability ( cm s−1) (Ren et al., 2018), which limits hyporheic exchange flows (Kunkel and Radke, 2011). Second, S-metolachlor was detected in only 10 % of riverbed sediment samples, with low concentrations (<12 µg kg−1) throughout the sampling season, indicating that sediments were not a significant source or sink for the water column. Regular grab samples revealed that sediments became anoxic within a few centimetres, potentially reducing biodegradation rates by up to a factor of seven (Droz et al., 2021). This is consistent with observations during low-discharge periods (July to October), when the water mass balance between the two river branches (A1 and A2) and their confluence was unequal (Fig. S2, Supplement), and the combined daily discharge from upstream WWTPs exceeded the outlet discharge (Fig. S6, Supplement). During these low-flow periods, an estimated 10±10 % of the river volume infiltrated through the riverbed, a process known to limit sediment reactivity (Kunkel and Radke, 2011). Furthermore, the Souffel River's low turbulence during baseflow, lack of channel tortuosity, waterfalls, or dams, and generally low discharge further constrain hyporheic exchange flows (Voermans et al., 2018). Consequently, the potential for S-metolachlor biodegradation associated with hyporheic exchange flows is considered negligible.
Throughout the five-month growing season, S-metolachlor was quantified in 88 % of the composite samples collected along the river from upstream to downstream (dissolved phase, n=254; Fig. 2c; detailed per location in Table S9 in the Supplement), including at the outlets A1 to A3 and grab sampling locations G1 to G9. Dissolved-phase concentrations ranged from 0.02 to 54.6 µg L−1, with an average of 1.13±4.28 µg L−1 ( SD; Fig. 2f, at A3). In the particulate phase, S-metolachlor concentrations were below the detection limit for all samples (1.2 µg kg−1 TSS; n=86). S-metolachlor was quantified in 11 % of sediment samples (n=76), with concentrations ranging from 1.7 to 11.9 µg kg−1. Multi-scale sampling revealed low background concentrations in the river before S-metolachlor application in April and May 2019 (from March to early April: 0.1±0.3 µg L−1; SD; n=30), suggesting substantial dissipation of S-metolachlor applied during the previous 2018 season.
Monthly comparisons of upstream and downstream S-metolachlor concentrations from April to October 2019, across the 11 river reaches (A1 to A3 and G1 to G9), revealed three distinct patterns (Fig. 3a). In 90 % of cases (n=59) concentrations did not vary significantly between upstream and downstream, as underlined by the 1:1 slope (Fig. 3a). This suggests a homogeneous distribution of S-metolachlor across the Souffel catchment (Gericke and Smithers, 2014), with no significant in-river dissipation.
A significant increase in S-metolachlor concentrations (95 % confidence interval) was observed at specific river reaches and sampling dates (n=5). Two key events were identified: (i) diffuse agricultural applications in April led to a marked concentration increase between the upstream site (G1) and its downstream counterpart (G2), and (ii) point-source inputs from WWTP discharges were detected on 2 April (Fig. 3a). In contrast, two instances (n=2) showed significant decreases in S-metolachlor concentrations, specifically between G2 and G3 on 2 April and between G9 and the outlet in June.
Overall, seasonal dynamics of S-metolachlor from point and non-point sources highlighted its transport within the catchment. Mass contributions from WWTP effluents (xwwtp; Eq. 4) and upstream non-point agricultural sources (1−xwwtp) were estimated using daily WWTP discharge data and S-metolachlor concentrations. WWTP discharges accounted for the majority of pesticide load over short periods, while non-point source contributions from topsoils toward rivers were smaller but more consistent. The proportion of WWTP-derived S-metolachlor (xwwtp) varied throughout the season (Fig. S5b in the Supplement), ranging from 0 % to 100 % of the discrete daily load observed on a monthly basis at the catchment outlet, with an average contribution of 53 % from March to June. This aligns with a previous study at WWTP W1, which reported an xwwtp at 53±24 %, with up to 100 % mass contribution on certain days during the 2015 to 2016 period (Agence de l'eau Rhin-Meuse, 2021). Consequently, it was estimated that approximately 9 % of the total off-site S-metolachlor export during rainfall events 1 and 2 in April 2019 (Table S10) originated from the WWTPs. Several sources may explain the presence of S-metolachlor in the WWTPs. S-metolachlor could originate from: (i) water infiltration from crop topsoil into the underground sewage network or ditch system (Wendell et al., 2024), (ii) agricultural runoff, which carries pesticides from crop topsoil to stormwater that eventually reaches the WWTP (Sutton et al., 2019), (iii) household usage, which is not approved in Europe, or (iv) releases from the sewage system during pesticide preparation or sprayer clean-out at farmyards lacking properly regulated closed-loop washing stations (Le Foll et al., 2017). The timing of S-metolachlor detection in the WWTP effluent coincided with its application at the catchment scale. Although a diagnosis of the wastewater network by the WWTP manager (personal communication) supports the fourth hypothesis as the most probable source, a other potential sources cannot be excluded without further investigation.
From 1 March to 1 October, low mass export coefficients of dissolved S-metolachlor were observed at catchment outlets A1, A2, and A3. These coefficients corresponded to 0.09 % (25.6±4 g) at A1, 0.06 % (39.6±3 g) at A2 (Fig. 2d) and 0.04 % to 0.12 % at A3 (4.87±1.00 kg, Fig. 2g) (Tables S1 and S11 in the Supplement). These results aligned with the 2019 hydro-climatic patterns (Sect. 3.1), which indicated light to moderate rainfall intensities and lateral subsurface flows as the predominant transport mechanism, with occasional surface runoff events. The observed export coefficients fall within the range of previous reported S-metolachlor concentration during entire agricultural seasons (0.072 % to 8 %) (Boithias et al., 2011; Alvarez-Zaldívar et al., 2018; Rose et al., 2018; Lefrancq et al., 2017a). Such low coefficients are consistent with the slow transfer of S-metolachlor from topsoil to the river via subsurface flow, as suggested in Sect. 3.1 and previously demonstrated in a nearby catchment.
Although subsurface flow was the primary driver of S-metolachlor export, notable export events of S-metolachlor were related to post-application rainfall events. Combined rainfall events 3 and 4, as well as rainfall event 5, accounted for 21 % and 47 %, respectively, of the total export at outlet A3 (Fig. 2g, Table S10). Notably, the highest export occurred during the low-intensity rainfall event 5 (1.6±0.2 mm h−1). Given the high and spatially uniform S-metolachlor load across the catchment (Fig. 1; Table S1 in the Supplement) and the timing of herbicide application, the mass reservoir during events 1 to 7 (up to 15 June) can be considered effectively semi-infinite relative to runoff volumes. This implies that once hydrological connectivity was established, S-metolachlor was readily mobilised (Stieglitz et al., 2003). Consequently, pesticide export was transport-limited, accounting for 91 % of the total seasonal load. As the season progressed and S-metolachlor stores in the catchment were depleted, source dynamics shifted to a mass-limited regime, consistent with previous observations (Peter et al., 2020; Fairbairn et al., 2016). Overall, S-metolachlor transport at the catchment scale was mainly governed by the application dose and timing, its dissipation in the topsoil, and prevailing hydro-climatic conditions.
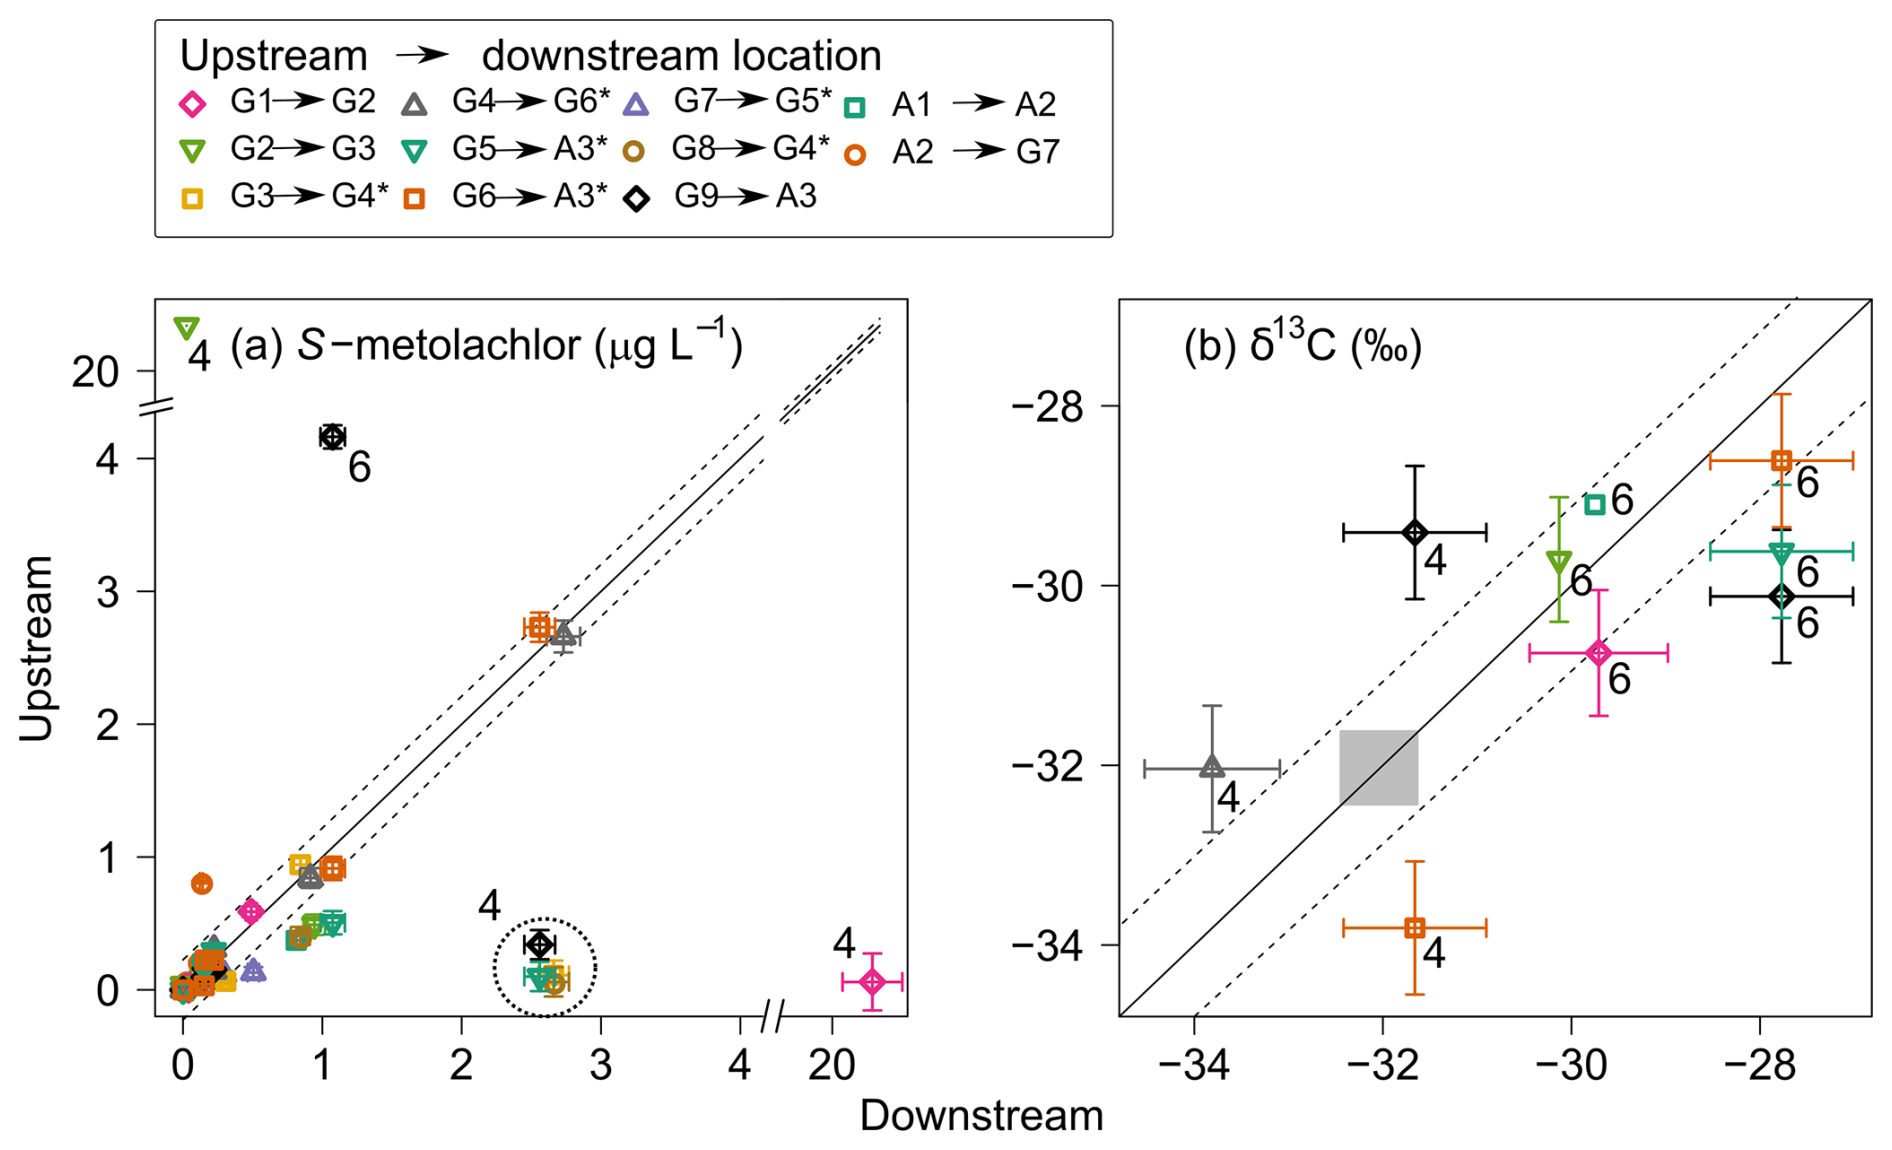
Figure 3Dynamic of S-metolachlor from upstream to downstream for the river reaches. S-metolachlor (a) concentrations and (b) carbon stable isotope composition (δ13C) in April (label 4) and June (label 6). The black solid line illustrates a 1:1 relationship, whereas the dashed line signifies the 95 % confidence interval associated with the measurements. The grey zone illustrates the initial isotope composition of S-metolachlor commercial formulation ( ‰). Error bars denote the propagated uncertainty from triplicate measurements for both concentration and δ13C. Asterisks (*) denotes reaches receiving WWTP effluent.
As demonstrated above, the combination of discharge data, hydrochemistry and S-metolachlor patterns from multi-scale sampling revealed the primary processes governing off-site transport and enabled the estimation of S-metolachlor dissipation and export coefficients. To construct the mass balance of S-metolachlor at the catchment scale from the application date to October 2019 (Sect. S2.5 in the Supplement), data from previous laboratory work (Drouin et al., 2021; Droz et al., 2021) were integrated with soil and river sampling results (Eq. 5; Table S11 in the Supplement). The resulting mass balance, which incorporated inputs from soil, river water, sediment, and WWTP effluent, was nearly closed (<2 % discrepancy). It indicated that 98.9±4.7 % (mean ± SD) of the applied S-metolachlor was degraded over the season, based on uncertainty scenarios related to application estimates (Sect. 1.2). Although constructing such a mass balance and quantifying pesticide degradation at the catchment scale is feasible, it demands extensive analytical and sampling efforts, which considerably limit its routine application by water and territorial management agencies. The following section presents additional insights into S-metolachlor degradation derived from combining CSIA with the multi-scale sampling approach at the catchment scale.
3.3 S-metolachlor degradation from topsoil to river outlet and source apportionment using CSIA
The isotope signature of S-metolachlor observed in the river reflects degradation processes occurring in both agricultural topsoil and the river itself. While the extent of S-metolachlor degradation in topsoil can be estimated from direct measurements of its isotopic signature, using the concentration change model described in Sect. S.1.6 of the Supplement, assessing degradation in the river water phase requires multi-scale monitoring. The topsoil model integrates observed dissipation, degradation, and shifts in the carbon stable isotope ratios of S-metolachlor. Predicted concentrations closely matched those measured in topsoil samples collected between March and October (Fig. S1, Supplement), indicating rapid degradation in 2019, with over 80 % of the applied S-metolachlor degraded within the first two months post-application. These findings are consistent with observations from a nearby agricultural catchment (Alvarez-Zaldívar et al., 2018). The predicted δ13C isotope signatures from topsoil followed a clear seasonal trend post-application (Fig. 4), contributing to the assessment of topsoil degradation at the catchment scale.
Assuming constant lateral inputs of S-metolachlor on a daily timescale, comparing predicted δ13C in topsoil with observed δ13C values in the river from upstream to downstream allowed for quantification of in-river S-metolachlor degradation. However, accurate GC-IRMS analysis of S-metolachlor in the river water required a minimum amount of 20 ng of carbon per measurement. As a result, low-concentration samples lacking sufficient volume for preconcentration could not be analysed. Consequently, only a subset of in-stream samples (Fig. 4) met the criteria for reliable isotopic measurement. Results indicated that in-river S-metolachlor degradation between upstream and downstream locations was below the sensitivity of the CSIA method (δ13C=1 ‰, <43 % degradation). Consequently, the isotope signature at the outlet primarily reflects topsoil degradation at the catchment scale. This assumption was supported by a mass balance approach (Table S11 in the Supplement), which estimated 13±3 % in-river degradation. Combined CSIA and mass balance analyses revealed a limited extent of in-river degradation, consistent with the short in-stream transit times from upstream sites to the main outlet, ranging from 2.4 h to 8 d depending on discharge and location, with an average of 28±31 h ( SD). These in-stream transit times are considerably shorter than the biodegradation half-life of S-metolachlor in the water column ( d) (Droz et al., 2021).
At the catchment scale, the extent of biodegradation estimated in October using CSIA (95±20 %, SD) was consistent with the overall biodegradation estimated by the mass balance (99±5 %, SD). The higher uncertainty associated with CSIA primarily stems from analytical challenges, such as detecting subtle isotope shifts near the instrumental detection limit, potential matrix interferences, and propagation of uncertainty inherent to Rayleigh-type modelling. Nevertheless, these limitations are partly counterbalanced by key advantages of CSIA, including lower sampling requirements, reduced data demands, and fewer assumptions relative to the mass balance approach.
In addition to estimating catchment-scale degradation, δ13C measurements enabled to identify hotspots and hot moments of pesticide degradation within the river network. Although limited to nine upstream-downstream δ13C pairs from monthly grab samples (Fig. 3b, three in April and six in June), CSIA data revealed consistent degradation trends. In April, δ13C values were close to those of the applied commercial S-metolachlor (Fig. 3b; ‰; Table S8 in the Supplement), suggesting the export of non-degraded S-metolachlor into the river. By June, δ13C values indicated that approximately 60 % of the initial S-metolachlor mass had degraded, marking a degradation hot moment following its application. This rapid degradation is consistent with the observed decline in S-metolachlor export, attributed to the reduced mass available for transport from upstream sites (A1 and A2; high-frequency monitoring, Fig. 2d) to downstream (A3; Fig. 2g). S-metolachlor TPs further supported this degradation trend. Following spring application, a seasonal increase was observed in the proportion of TPs (sum of ESA, OXA, and NOA) relative to MELSM (Eq. 1). Mean TPs proportions were 55.4±29.9 % (n=26) in spring, 84.3±17.4 % (n=16) in summer, 86.4±9.7 % (n=22) in fall, and 95.6±2.9 % (n=24) in winter (Sect. 2.8: Table S13 and Fig. S7 in the Supplement).
The limited number of upstream–downstream δ13C pairs did not reveal distinct degradation hotspots. This observation is consistent with the 1:1 upstream–downstream concentration relationship (Fig. 3a), the uniform distribution of S-metolachlor across corn and sugar beet fields (Fig. 1), and the relatively homogeneous lateral and hyporheic exchange along the river (see Sect. 3.1).

Figure 4Carbon stable isotope fractionation () of S-metolachlor in river (n=61) water across the growing season compared to the predicted topsoil δ13C values (Fig. S1 in the Supplement). The colored dashed lines indicate the median uncertainty in the topsoil values within ±0.5 ‰ (see Table S7 in the Supplement). The shaded light grey area represents the minimal change in isotope signature (Δδ13Cmin, calculated as per Eq. S1 in the Supplement) in water, beyond which significant isotope fractionation can be attributed to degradation, thereby representing the threshold for detecting biodegradation. The dark grey segment denotes the estimated date of S-metolachlor application ascertained from the farmer survey within sub-catchment G11. The green line represents the average δ13C value from wastewater treatment plant data (n=9). The black dash line represents the Δδ13C=0 ‰ value. Error bars encompass the propagation of uncertainty associated with Δδ13C.
The final application of CSIA, combined with a multi-scale sampling approach, focused on distinguishing the sources of S-metolachlor, specifically differentiating between WWTP and agricultural non-point pollution. From April to October, the isotope signature of S-metolachlor at the WWTP inlets remained consistent ( ‰; n=9), showing an enrichment in δ13C of 2 ‰ compared to the δ13C value of the commercial formulation. This enrichment corresponds to approximately 80 % S-metolachlor degradation (Fig. 4). Consequently, in rivers with substantial WWTP effluent contributions, an enriched δ13C value of S-metolachlor early after the application may indicate a WWTP-derived source. Several mechanisms may explain the constant isotopic shift in S-metolachlor at WWTP inlets. A likely explanation is partial S-metolachlor degradation within WWTPs (Gerecke et al., 2002). Alternatively, some sources previously identified as plausible entry pathways, such as sprayer clean-out or runoff inputs, may introduce S-metolachlor with isotopic signatures slightly altered from those of the original commercial formulations. Disentangling these contributions will require further targeted investigation, which could support the development of more effective mitigation strategies.
Unlike the expected decline in δ13C values from agricultural non-point sources following S-metolachlor application, the constant δ13C values of WWTP-derived S-metolachlor can help differentiate these two sources. For instance, variations in δ13C exceeding 2 ‰ () in June for river reaches G6 → A3, G5 → A3 and G9 → A3 (Fig. 3b) cannot be solely be attributed to WWTP effluent. The observed variations in between upstream and downstream sites suggest the influence of additional processes superimposed on the dominant topsoil degradation signal. These may include minor in-stream biodegradation, potentially occurring near the detection limits of our CSIA method, or inputs from a downstream point source containing S-metolachlor that has already undergone partial degradation.
However, the δ13C values of point and non-point sources were very similar (Fig. 4), limiting the utility of CSIA for quantifying their individual contribution. Mass balance calculations integrating all sampling days over the season indicate that WWTP effluent contributed between 50 % and over 80 % of the S-metolachlor load at the catchment outlet. This aligns with previous observations, such as those from the US, where S-metolachlor was detected in 74 % of WWTPs and accounted for an estimated 47 % of the total S-metolachlor mass in rivers (Sutton et al., 2019).
4.1 Wastewater treatment plant as a major river source of S-metolachlor
The integration of multi-scale sampling with a mass balance approach revealed an unexpected contribution of point sources, linked to WWTP effluent, to the overall S-metolachlor load at the catchment outlet. In response, collaboration between WWTP operators and agricultural advisors has initiated forensic investigations within the sewage network and awareness-raising efforts targeting farmers. These actions aim to improve understanding and mitigation of point-source contributions of S-metolachlor and other pesticides.
This study also underscores limitations of C-CSIA in distinguishing between point and non-point contributions to S-metolachlor loads. This limitation likely arises from the similarity of biodegradation processes occurring in both topsoil and in WWTPs, leading to similar degradation reactions and insufficient differences in δ13C values of end members for isotopic mixing models to be effective. However, multi-element CSIA may potentially provide additional insights into differentiating S-metolachlor sources. For instance, sensitive analysis of isotopic fractionation of additional elements, in particular chlorine (Ponsin et al., 2019), may help if the cleavage mechanisms for these elements differ between WWTP degradation processes and those in topsoil or river environments. Comprehensive datasets on isotopic fractionation of herbicides linked to key degradation processes in the environment, such as biodegradation, photolysis, and hydrolysis, remain scarce. While fractionation values have been reported for some herbicides, including S-metolachlor and atrazine, their applicability beyond the original environmental conditions requires rigorous validation. Therefore, further research into herbicide degradation pathways specific to WWTPs is crucial for improving their effectiveness in mitigating micropollutants from urban sources. Such studies would advance our understanding of pesticide residues transformation within WWTPs and support the development of targeted strategies to reduce pollutant loads in aquatic systems.
4.2 Potential of CSIA to evaluate S-metolachlor degradation in mid-scale catchment
This study demonstrates that C-CSIA at the catchment outlet effectively reflects the extent of S-metolachlor degradation in topsoil across scales ranging from a small sub-catchment (3.6 km2) to the entire catchment (115 km2). These findings are consistent with observations from small headwater catchments (e.g., 47 ha) (Alvarez-Zaldívar et al., 2018), but will need further investigation to confirm a potential scaling-up. A key advantage of CSIA is its independence from concentration data, mass balance calculations, and the need to identify TPs, offering a significant advantage over other methods for estimating degradation extent. Consequently, theoretically the concept could be applied to any catchment as long we were able to collect and concentrate enough material for reliable C-CSIA measurement without any dissolved organic matter background that might interfere with the C-CSIA measurement. In addition, to expand CSIA applications to other compounds at the catchment scale, the stable isotope composition of active substances in pesticide formulations, such as δ13C, δ15N or δ37Cl, should be characterized, have similar isotope signature across the catchment and compiled into accessible database similar as ISOTOPEST database (Masbou et al., 2024).
Reliable evaluation of degradation using C-CSIA alone requires a minimum isotope signature change (Δδ13Cmin) of 2 ‰, which limits detection to biodegradation extents above 80 % for S-metolachlor. However, recent advancement in chlorine isotope analysis, with its high isotopic fractionation for S-metolachlor ( ‰) (Ponsin et al., 2019), may overcome these limitations, potentially enabling the sensitive detection of degradation extents lower than 50 % in the future.
A key limitation of C-CSIA for S-metolachlor is the relatively high carbon mass required (i.e., 20 ng per measurement in this study) for accurate GC-IRMS measurement. This constraint may typically limit its applicability to scenarios where sufficient residual pesticide remains, generally corresponding to degradation extents below 95 %. However, pre-concentration techniques such as solid-phase extraction (Gilevska et al., 2022) enabled reliable δ13C measurements in river samples through October, even when degradation exceeded 95 %.
Monthly grab sampling at the catchment outlet, combined with CSIA, proved to be an effective approach for monitoring ongoing degradation following pesticide application. This method reduces both monitoring and analytical costs compared to intensive, spatially and temporally distributed sampling campaigns, making it a practical option for agencies responsible for pesticide degradation monitoring. Nevertheless, high-frequency monitoring at the outlet remains essential for accurately quantifying pesticide export and evaluating reactive transport dynamics at the catchment scale.
A notable finding of this study is the limited contribution of the river to S-metolachlor degradation. This highlights the need for farmer advisors and water agencies to acknowledge the low natural attenuation capacity of rivers and prioritise measures to prevent pesticide entry into aquatic systems. In the Souffel River, a minimum in-stream transit time of approximately 17 d would be required to allow for significant degradation and a measurable shift. This constraint illustrates why, in small agricultural catchments with short in-stream transit times and limited hyporheic reactivity, the use of C-CSIA to assess ongoing degradation is limited. In contrast, larger catchments (Strahler order > 5) or systems with highly reactive river–sediment interfaces typically exhibit longer in-stream transit times and stronger biogeochemical gradients, which can enhance degradation processes and increase the applicability of C-CSIA.
Altogether, this study shows that combining CSIA with multi-scale sampling enhances the ability to diagnose pesticide off-site transport and degradation, supporting the development of strategies to preserve and restore aquatic ecosystems. In particular, multi-element CSIA, including δ13C, δ15N or δ37Cl (Hofstetter et al., 2024; Höhener et al., 2022), may further help to evaluate the specific contribution of rivers to pesticide degradation and identify prevailing degradation pathways in smaller Strahler order catchment. Multi-scale sampling across eleven river reaches provided valuable hydrological and chemical data, while high-frequency monitoring with nested catchments offered insights into the effects of losing and gaining streamflow conditions on S-metolachlor transport and reactivity. However, maintaining three stream gauge stations with associated sampling devices and weekly maintenance was proved challenging, therefore only the main outlet station was operational by the end of this study. Although S-metolachlor is no longer approved in the European Union due to its high leaching potential and risks to groundwater and human health (European Commission, 2024), the framework developed in this study enables quantification of its transport and degradation as a legacy contaminant from topsoil to river networks in agricultural catchments. In summary, pesticide CSIA offers a promising approach for estimating degradation extents across entire catchments with minimal sampling and analytical effort. In the future, combining multi-scale monthly grab sampling with CSIA of both the parent compound and its associated TPs could provide an effective approach for identifying degradation hotspots and hot moments within river networks, while simultaneously capturing associated hydrological and hydrochemical patterns.
The datasets used in this study is available in Zenodo at https://doi.org/10.5281/zenodo.6414880 (Droz et al., 2025).
The supplement related to this article is available online at https://doi.org/10.5194/hess-30-1291-2026-supplement.
BD and GD performed conceptualisation, data curation, formal analysis, investigation and writing – original draft. JL performed formal analysis, investigation and writing – review & editing. BG performed conceptualisation, investigation and writing – review & editing. SP and GI performed conceptualisation, funding acquisition, project administration, supervision and writing – review & editing.
The contact author has declared that none of the authors has any competing interests.
Publisher's note: Copernicus Publications remains neutral with regard to jurisdictional claims made in the text, published maps, institutional affiliations, or any other geographical representation in this paper. The authors bear the ultimate responsibility for providing appropriate place names. Views expressed in the text are those of the authors and do not necessarily reflect the views of the publisher.
We gratefully acknowledge Margaret Johnson, Martine Trautmann, Colin Fourtet, Thierry Perrone, Eric Pernin, Jérémy Masbou, François Chabaux, Nolwenn Lesparre, Dimitri Rambourg, Agnès Herrmann, and Sylvain Benarioumlil (University of Strasbourg), as well as Laurent Mergnac (Syndicat des Eaux et de l'Assainissement Alsace-Moselle, SDEA), for their contributions to both laboratory and field operations. We also extend our sincere thanks to Guillaume Ryckelynck (Région Grand Est), Blandine Fritsch (Chambre d'Agriculture Alsace), Marie Manceau and Rémy Gentner (Eurométropole Strasbourg), Quentin Morice (Direction Régionale de l'Environnement, de l'Aménagement et du Logement, DREAL), and the Mundolsheim city council for their essential support in coordinating field activities and providing spatial datasets.
Guillaume Drouin received financial support from the French Ministry for the Ecological Transition. Boris Droz was supported by a fellowship jointly funded by the Région Grand Est and the Rhine-Meuse. This research was funded by the Région Grand Est, the AERM (grant no. 170293), and the National School for Water and Environmental Engineering (École Nationale du Génie de l'Eau et de l'Environnement de Strasbourg, ENGEES).
This paper was edited by Nunzio Romano and reviewed by Stefanie Lutz and Violaine Ponsin.
Agence de l'eau Rhin-Meuse: Système d'information sur l'eau Rhin-Meuse (SIERM), https://rhin-meuse.eaufrance.fr, last access: 23 December 2021.
Alvarez-Zaldívar, P., Payraudeau, S., Meite, F., Masbou, J., and Imfeld, G.: Pesticide degradation and export losses at the catchment scale: Insights from compound-specific isotope analysis (CSIA), Water Res., 139, 198–207, https://doi.org/10.1016/j.watres.2018.03.061, 2018.
Andrews, F. T., Croke, B. F. W., and Jakeman, A. J.: An open software environment for hydrological model assessment and development, Environ. Model. Softw., 26, 1171–1185, https://doi.org/10.1016/j.envsoft.2011.04.006, 2011.
Baran, N., Rosenbom, A. E., Kozel, R., and Lapworth, D.: Pesticides and their metabolites in European groundwater: Comparing regulations and approaches to monitoring in France, Denmark, England and Switzerland, Sci. Total Environ., 842, 156696, https://doi.org/10.1016/j.scitotenv.2022.156696, 2022.
Boano, F., Harvey, J. W., Marion, A., Packman, A. I., Revelli, R., Ridolfi, L., and Wörman, A.: Hyporheic flow and transport processes: Mechanisms, models, and biogeochemical implications, Rev. Geophys., 52, 603–679, https://doi.org/10.1002/2012RG000417, 2014.
Boithias, L., Sauvage, S., Taghavi, L., Merlina, G., Probst, J. L., and Perez, J. M.: Occurrence of metolachlor and trifluralin losses in the Save river agricultural catchment during floods, J. Hazard. Mater., 196, 210–219, https://doi.org/10.1016/j.jhazmat.2011.09.012, 2011.
Büttner, G. and Kosztra, B.: Addendum of CLC2006: Technical Guidelines, Version 2, EEA, 2014.
Drouin, G., Droz, B., Leresche, F., Payraudeau, S., Masbou, J., and Imfeld, G.: Direct and indirect photodegradation of atrazine and S-metolachlor in agriculturally impacted surface water and associated C and N isotope fractionation, Environ. Sci. Process. Impacts, 23, 1791–1802, https://doi.org/10.1039/D1EM00246E, 2021.
Droz, B., Drouin, G., Maurer, L., Villette, C., Payraudeau, S., and Imfeld, G.: Phase transfer and biodegradation of pesticides in water-sediment systems explored by compound-specific isotope analysis and conceptual modeling, Environ. Sci. Technol., 55, 4720–4728, https://doi.org/10.1021/acs.est.0c06283, 2021.
Droz, B., Drouin, G., Lohmann, J., Guyot, B., Payraudeau, S., and Imfeld, G.: Data for “How does integrating multi-scale monitoring and compound-specific isotope analysis improve the evaluation of S-metolachlor degradation in agro-ecosystems?” (v1.0), Zenodo [data set], https://doi.org/10.5281/zenodo.6414880, 2025.
Elsner, M.: Stable isotope fractionation to investigate natural transformation mechanisms of organic contaminants: principles, prospects and limitations, J. Environ. Monit., 12, 2005–2031, https://doi.org/10.1039/C0EM00277A, 2010.
Elsner, M. and Imfeld, G.: Compound-specific isotope analysis (CSIA) of micropollutants in the environment – current developments and future challenges, Curr. Opin. Biotechnol., 41, 60–72, https://doi.org/10.1016/j.copbio.2016.04.014, 2016.
Engelhardt, I., Barth, J. A. C., Bol, R., Schulz, M., Ternes, T. A., Schüth, C., and van Geldern, R.: Quantification of long-term wastewater fluxes at the surface water/groundwater-interface: An integrative model perspective using stable isotopes and acesulfame, Sci. Total Environ., 466–467, 16–25, https://doi.org/10.1016/j.scitotenv.2013.06.092, 2014.
European Commission: Commission Regulation (EU) No 546/2011 of 10 June 2011 implementing Regulation (EC) No 1107/2009 of the European Parliament and of the Council as regards uniform principles for evaluation and authorisation of plant protection products., Off. J. Eur. Union, L 155, 127–175, 2011.
Eurostat: EU pesticides database, https://food.ec.europa.eu/plants/pesticides/eu-pesticides-database_en, last access: 15 April 2024.
European Commission: Commission implementing regulation (EU) 2024/20 of 12 December 2023: Concerning the non-renewal of the approval of the active substance S-metolachlor, in accordance with Regulation (EC) No 1107/2009 of the European Parliament and of the Council, and amending Commission Implementing Regulation (EU) No 540/2011, Official Journal of the European Union L 20, 1–5, 2024.
European Environment Agency: Pesticides in rivers, lakes and groundwater in Europe, https://www.eea.europa.eu/ims/pesticides-in-rivers-lakes-and, last access: 15 April 2024.
European Environment Agency and Mourelatou, A.: Environmental indicator report 2018: in support to the monitoring of the Seventh Environment Action Programme, Publications Office, 29 pp., https://doi.org/10.2800/180334, 2018.
Fairbairn, D. J., Arnold, W. A., Barber, B. L., Kaufenberg, E. F., Koskinen, W. C., Novak, P. J., Rice, P. J., and Swackhamer, D. L.: Contaminants of emerging concern: Mass balance and comparison of wastewater effluent and upstream sources in a mixed-use watershed, Environ. Sci. Technol., 50, 36–45, https://doi.org/10.1021/acs.est.5b03109, 2016.
Fenner, K., Canonica, S., Wackett, L. P., and Elsner, M.: Evaluating pesticide degradation in the environment: Blind spots and emerging opportunities, Science, 341, 752–758, https://doi.org/10.1126/science.1236281, 2013.
Food and Agriculture Organization of the United Nations: FAOSTAT, http://www.fao.org/faostat/, last access: 20 March 2019.
Gerakis, A. and Baer, B.: A computer program for soil textural classification, Soil Sci. Soc. Am. J., 63, 807–808, https://doi.org/10.2136/sssaj1999.634807x, 1999.
Gerecke, A. C., Schärer, M., Singer, H. P., Müller, S. R., Schwarzenbach, R. P., Sägesser, M., Ochsenbein, U., and Popow, G.: Sources of pesticides in surface waters in Switzerland: Pesticide load through waste water treatment plants – current situation and reduction potential, Chemosphere, 48, 307–315, https://doi.org/10.1016/S0045-6535(02)00080-2, 2002.
Gericke, O. J. and Smithers, J. C.: Review of methods used to estimate catchment response time for the purpose of peak discharge estimation, Hydrol. Sci. J., 59, 1935–1971, https://doi.org/10.1080/02626667.2013.866712, 2014.
Gericke, O. J. and Smithers, J. C.: Direct estimation of catchment response time parameters in medium to large catchments using observed streamflow data, Hydrol. Process., 31, 1125–1143, https://doi.org/10.1002/hyp.11102, 2017.
Gilevska, T., Wiegert, C., Droz, B., Junginger, T., Prieto-Espinoza, M., Borreca, A., and Imfeld, G.: Simple extraction methods for pesticide compound-specific isotope analysis from environmental samples, MethodsX, 9, 101880, https://doi.org/10.1016/j.mex.2022.101880, 2022.
Gilevska, T., Payraudeau, S., and Imfeld, G.: Evaluating pesticide degradation in artificial wetlands with compound-specific isotope analysis: A case study with the fungicide dimethomorph, Sci. Total Environ., 900, 165767, https://doi.org/10.1016/j.scitotenv.2023.165767, 2023.
Halbach, K., Moder, M., Schrader, S., Liebmann, L., Schafer, R. B., Schneeweiss, A., Schreiner, V. C., Vormeier, P., Weisner, O., Liess, M., and Reemtsma, T.: Small streams-large concentrations? Pesticide monitoring in small agricultural streams in Germany during dry weather and rainfall, Water Res., 203, 117535, https://doi.org/10.1016/j.watres.2021.117535, 2021.
Hofstetter, T. B., Bakkour, R., Buchner, D., Eisenmann, H., Fischer, A., Gehre, M., Haderlein, S. B., Höhener, P., Hunkeler, D., Imfeld, G., Jochmann, M. A., Kümmel, S., Martin, P. R., Pati, S. G., Schmidt, T. C., Vogt, C., and Elsner, M.: Perspectives of compound-specific isotope analysis of organic contaminants for assessing environmental fate and managing chemical pollution, Nature Water, 2, 14–30, https://doi.org/10.1038/s44221-023-00176-4, 2024.
Höhener, P., Guers, D., Malleret, L., Boukaroum, O., Martin-Laurent, F., Masbou, J., Payraudeau, S., and Imfeld, G.: Multi-elemental compound-specific isotope analysis of pesticides for source identification and monitoring of degradation in soil: a review, Environ. Chem. Lett., 20, 3927–3942, https://doi.org/10.1007/s10311-022-01489-8, 2022.
Hunkeler, D., Meckenstock, R. U., Lollar, B. S., Schmidt, T. C., and Wilson, J. T.: A guide for assessing biodegradation and source identification of organic ground water contaminants using compound specific isotope analysis (CSIA), Environmental Protection Agency (EPA), Washington, DC, US, 68, 2008.
Jochmann, M. A., Blessing, M., Haderlein, S. B., and Schmidt, T. C.: A new approach to determine method detection limits for compound-specific isotope analysis of volatile organic compounds, Rapid Commun. Mass Spectrom., 20, 3639–3648, https://doi.org/10.1002/rcm.2784, 2006.
Krause, S., Lewandowski, J., Grimm, N. B., Hannah, D. M., Pinay, G., McDonald, K., Martí, E., Argerich, A., Pfister, L., Klaus, J., Battin, T., Larned, S. T., Schelker, J., Fleckenstein, J., Schmidt, C., Rivett, M. O., Watts, G., Sabater, F., Sorolla, A., and Turk, V.: Ecohydrological interfaces as hot spots of ecosystem processes, Water Resour. Res., 53, 6359–6376, https://doi.org/10.1002/2016WR019516, 2017.
Kunkel, U. and Radke, M.: Reactive tracer test to evaluate the fate of pharmaceuticals in rivers, Environ. Sci. Technol., 45, 6296–6302, https://doi.org/10.1021/es104320n, 2011.
Le Foll, S., Royal, S., Sapin, M., and Touraine, M.: Arrêté du 4 mai 2017 relatif à la mise sur le marché et à l'utilisation des produits phytopharmaceutiques et de leurs adjuvants visés à l'article L. 253-1 du code rural et de la pêche maritime, Journal Officiel de la République Française – Lois et décrets, 108, 115, 2017.
Lefrancq, M., Payraudeau, S., Guyot, B., Millet, M., and Imfeld, G.: Degradation and transport of the chiral herbicide S-metolachlor at the catchment scale: Combining observation scales and analytical approaches, Environ. Sci. Technol., 51, 13231–13240, https://doi.org/10.1021/acs.est.7b02297, 2017a.
Lefrancq, M., Van Dijk, P., Jetten, V., Schwob, M., and Payraudeau, S.: Improving runoff prediction using agronomical information in a cropped, loess covered catchment, Hydrol. Process., 31, 1408–1423, https://doi.org/10.1002/hyp.11115, 2017b.
Leu, C., Singer, H., Stamm, C., Müller, S. R., and Schwarzenbach, R. P.: Simultaneous assessment of sources, processes, and factors influencing herbicide losses to surface waters in a small agricultural catchment, Environ. Sci. Technol., 38, 3827–3834, https://doi.org/10.1021/es0499602, 2004.
Lutz, S. R. and Van Breukelen, B. M.: Combined source apportionment and degradation quantification of organic pollutants with CSIA: 2. Model validation and application, Environ. Sci. Technol., 48, 6229–6236, https://doi.org/10.1021/es4054016, 2014.
Lutz, S. R., Velde, Y. V. D., Elsayed, O. F., Imfeld, G., Lefrancq, M., Payraudeau, S., and Van Breukelen, B. M.: Pesticide fate on catchment scale: conceptual modelling of stream CSIA data, Hydrol. Earth Syst. Sci., 21, 5243–5261, https://doi.org/10.5194/hess-21-5243-2017, 2017.
Masbou, J., Drouin, G., Payraudeau, S., and Imfeld, G.: Carbon and nitrogen stable isotope fractionation during abiotic hydrolysis of pesticides, Chemosphere, 213, 368–376, https://doi.org/10.1016/j.chemosphere.2018.09.056, 2018.
Masbou, J., Payraudeau, S., Guyot, B., and Imfeld, G.: Dimethomorph degradation in vineyards examined by isomeric and isotopic fractionation, Chemosphere, 313, 137341, https://doi.org/10.1016/j.chemosphere.2022.137341, 2023.
Masbou, J., Hohener, P., Payraudeau, S., Martin-Laurent, F., and Imfeld, G.: Stable isotope composition of pesticides in commercial formulations: The ISOTOPEST database, Chemosphere, 352, 141488, https://doi.org/10.1016/j.chemosphere.2024.141488, 2024.
Masbou, J., Grail, C., Payraudeau, S., Ruiz, L., Muddu, S., Riotte, J., and Imfeld, G.: Dissipation of the insecticide profenofos in tropical agricultural soils (Berambadi catchment, South India): insight from compound-specific isotope analysis (CSIA), J. Hazard. Mater., 488, 137428, https://doi.org/10.1016/j.jhazmat.2025.137428, 2025.
Meite, F., Alvarez-Zaldívar, P., Crochet, A., Wiegert, C., Payraudeau, S., and Imfeld, G.: Impact of rainfall patterns and frequency on the export of pesticides and heavy-metals from agricultural soils, Sci. Total Environ., 616–617, 500–509, https://doi.org/10.1016/j.scitotenv.2017.10.297, 2018.
Menger, F., Bostrom, G., Jonsson, O., Ahrens, L., Wiberg, K., Kreuger, J., and Gago-Ferrero, P.: Identification of pesticide transformation products in surface water using suspect screening combined with national monitoring data, Environ. Sci. Technol., 55, 10343–10353, https://doi.org/10.1021/acs.est.1c00466, 2021.
Menz, J., Müller, J., Olsson, O., and Kümmerer, K.: Bioavailability of antibiotics at soil–water interfaces: A comparison of measured activities and equilibrium partitioning estimates, Environ. Sci. Technol., 52, 6555–6564, https://doi.org/10.1021/acs.est.7b06329, 2018.
Monjo, R.: Measure of rainfall time structure using the dimensionless n-index, Clim. Res., 67, 71–86, https://doi.org/10.3354/cr01359 2016.
NF EN ISO: Method 11369: Water quality – Determination of selected plant treatment agents – Method using high performance liquid chromatography with UV detection after solid-liquid extraction, Association Francaise de Normalisation 19, 1997.
Pasquini, L., Lardy-Fontan, S., and Rosin, C.: Pesticide transformation products: A potential new source of interest for drinking water, Environ. Sci. Pollut. Res. Int., 32, 4619-4635, https://doi.org/10.1007/s11356-025-35979-3, 2025.
Payraudeau, S., Alvarez-Zaldivar, P., van Dijk, P., and Imfeld, G.: Constraining topsoil pesticide degradation in a conceptual distributed catchment model with compound-specific isotope analysis (CSIA), Hydrol. Earth Syst. Sci., 29, 4179–4197, https://doi.org/10.5194/hess-29-4179-2025, 2025.
Peralta-Maraver, I., Reiss, J., and Robertson, A. L.: Interplay of hydrology, community ecology and pollutant attenuation in the hyporheic zone, Sci. Total Environ., 610–611, 267–275, https://doi.org/10.1016/j.scitotenv.2017.08.036, 2018.
Peter, K. T., Hou, F., Tian, Z., Wu, C., Goehring, M., Liu, F., and Kolodziej, E. P.: More than a first flush: Urban creek storm hydrographs demonstrate broad contaminant pollutographs, Environ. Sci. Technol., 54, 6152–6165, https://doi.org/10.1021/acs.est.0c00872, 2020.
Ponsin, V., Torrentó, C., Lihl, C., Elsner, M., and Hunkeler, D.: Compound-specific chlorine isotope analysis of the herbicides atrazine, acetochlor and metolachlor, Anal. Chem., 91, 14290–14298, https://doi.org/10.1021/acs.analchem.9b02497, 2019.
Rasmussen, J. J., Wiberg-Larsen, P., Baattrup-Pedersen, A., Cedergreen, N., McKnight, U. S., Kreuger, J., Jacobsen, D., Kristensen, E. A., and Friberg, N.: The legacy of pesticide pollution: An overlooked factor in current risk assessments of freshwater systems, Water Res., 84, 25–32, https://doi.org/10.1016/j.watres.2015.07.021, 2015.
Ren, X., Zeng, G., Tang, L., Wang, J., Wan, J., Liu, Y., Yu, J., Yi, H., Ye, S., and Deng, R.: Sorption, transport and biodegradation – An insight into bioavailability of persistent organic pollutants in soil, Sci. Total Environ., 610–611, 1154–1163, https://doi.org/10.1016/j.scitotenv.2017.08.089, 2018.
Rose, C. E., Coupe, R. H., Capel, P. D., and Webb, R. M. T.: Holistic assessment of occurrence and fate of metolachlor within environmental compartments of agricultural watersheds, Sci. Total Environ., 612, 708–719, https://doi.org/10.1016/j.scitotenv.2017.08.154, 2018.
Schaper, J. L., Posselt, M., McCallum, J. L., Banks, E. W., Hoehne, A., Meinikmann, K., Shanafield, M. A., Batelaan, O., and Lewandowski, J.: Hyporheic exchange controls fate of trace organic compounds in an urban stream, Environ. Sci. Technol., 52, 12285–12294, https://doi.org/10.1021/acs.est.8b03117, 2018.
Shaw, S. B., Beslity, J. O., and Colvin, M. E.: Working toward a more holistic set of hydrologic principles to teach non-hydrologists: Five simple concepts within catchment hydrology, Hydrol. Process., 33, 2258–2262, https://doi.org/10.1002/hyp.13485, 2019.
Spycher, S., Mangold, S., Doppler, T., Junghans, M., Wittmer, I., Stamm, C., and Singer, H.: Pesticide risks in small streams – How to get as close as possible to the stress imposed on aquatic organisms, Environ. Sci. Technol., 52, 4526–4535, https://doi.org/10.1021/acs.est.8b00077, 2018.
Stieglitz, M., Shaman, J., McNamara, J., Engel, V., Shanley, J., and Kling, G. W.: An approach to understanding hydrologic connectivity on the hillslope and the implications for nutrient transport, Global Biogeochem. Cycles, 17, 1105, https://doi.org/10.1029/2003gb002041, 2003.
Sutton, R., Xie, Y., Moran, K. D., and Teerlink, J.: Occurrence and sources of pesticides to urban wastewater and the environment, in: Pesticides in Surface Water: Monitoring, Modeling, Risk Assessment, and Management, ACS Symposium Series, 1308, American Chemical Society, 63–88, https://doi.org/10.1021/bk-2019-1308.ch005, 2019.
Tang, F. H. M., Lenzen, M., McBratney, A., and Maggi, F.: Risk of pesticide pollution at the global scale, Nat. Geosci., 14, 206–210, https://doi.org/10.1038/s41561-021-00712-5, 2021.
Toth, J., Fugère, V., and Viviane Yargeau, V.: Relationship between stream size, watershed land use, and pesticide concentrations in headwater streams, Environ. Pollut., 349, 123940, https://doi.org/10.1016/j.envpol.2024.123940, 2024.
Van Breukelen, B. M.: Quantifying the degradation and dilution contribution to natural attenuation of contaminants by means of an open system Rayleigh equation, Environ. Sci. Technol., 41, 4980–4985, https://doi.org/10.1021/es062846u, 2007.
Voermans, J. J., Ghisalberti, M., and Ivey, G. N.: A model for mass transport across the sediment-water interface, Water Resour. Res., 54, 2799–2812, https://doi.org/10.1002/2017WR022418, 2018.
Wendell, A. K., Guse, B., Bieger, K., Wagner, P. D., Kiesel, J., Ulrich, U., and Fohrer, N.: A spatio-temporal analysis of environmental fate and transport processes of pesticides and their transformation products in agricultural landscapes dominated by subsurface drainage with SWAT, Sci. Total Environ., 945, 173629, https://doi.org/10.1016/j.scitotenv.2024.173629, 2024.