the Creative Commons Attribution 4.0 License.
the Creative Commons Attribution 4.0 License.
 | 02 Mar 2026
Climate change effects on river droughts in Bavaria using a hydrological large ensemble
Benjamin Poschlod
Laura Sailer
Alexander Sasse
Anastasia Vogelbacher
Ralf Ludwig
Europe and Germany have been hit by severe meteorological droughts in recent years, which have resulted in extreme low flow conditions in streams. Climate projections expect an intensification and increase in the frequency of the associated meteorological drivers. In this study, we investigate the impact of climate change on rare and extreme river droughts in a catchment with a pluvial regime, a northern tributary to the Danube (Wörnitz river) and in a river catchment with nivo-pluvial regime in the Pre-Alps (Ammer river). We employ a unique physically-based modelling chain, where the hydrological model WaSiM (Water balance Simulation Model) is driven by 50 members of the single model initial-condition large ensemble (SMILE) of the Canadian Regional Climate Model version 5 under the high-emission scenario RCP8.5. This results in a hydrological SMILE yielding 1500 simulated years for each of the investigated 30 year periods of a reference (1980–2009; REF), a current (2010–2039; CUR), a near future (2040–2069; NF), and a far future climate (2070–2099; FF). We investigate the seasonality, univariate and bivariate return periods of peak low flow and duration, and explore the climatic drivers causing the alterations.
The Wörnitz catchment shows a summer low flow regime, with climate change affecting the seasonality so that the river droughts are projected to extend further into the autumn. The typical bivariate 100 year event (REF: 7 d peak low flow = 1.96 m3 s−1; event duration = 171 d) shifts to a 30 year (CUR), 17 year (NF), and 6 year (FF) event. In the reference climate of the Ammer catchment, the intensity of winter low flows dominates over summer low flows. However, the low-flow regime is projected to transition from winter-dominated to summer-dominated conditions during the current climate with more intense summer river droughts in the near and far future. While there is a tendency for cold-dry winters to cause low flow conditions in February during the reference climate, future winter low flows shift towards November/December and are triggered by the hot and dry pre-conditions of an antecedent summerly river drought. The most probable bivariate 100 year summer low flow event (REF: 7 d peak low flow = 4.9 m3 s−1, event duration = 60 d) is drastically altered to occur every 34 years (CUR), 8 years (NF), and 2.5 years (FF).
In both catchments, there is an increase in the autocorrelation of peak low flows from one summer to the next, which emphasises the causality and increasing importance of lagged effects and preconditions in the course of climate change. We identify hotter and drier summer seasons as the main driver, with the positive interdependency between heat and drought in climate change intensifying, further exacerbating extremes.
Thereby, the study highlights the opportunities of a hydrological SMILE for the investigation of river droughts. Due to the large sample size of the driving climate simulations, we can robustly assess very rare events in the two catchments and generate bivariate design values narrowing down uncertainties of extreme value statistics in the light of a well characterized internal climate variability. In turn, all results are subject to scenario and model uncertainties, as the simulations are carried out with one hydrological model driven by one climate model under one emission scenario.
- Article
(9002 KB) - Full-text XML
-
Supplement
(1863 KB) - BibTeX
- EndNote


Droughts over Europe trigger a variety of ecological, economic, and societal impacts (AghaKouchak et al., 2023; Stahl et al., 2016). Their frequency and intensity are projected to increase in a warmer climate (Naumann et al., 2021). Generally, drought can be classified into three types (van Loon et al., 2016): meteorological drought, agricultural drought, and hydrological drought referring to a precipitation deficit, soil moisture deficit, and streamflow deficit, respectively. Often, they occur in temporal order (Stephan et al., 2021), where a meteorological drought leads to a soil moisture deficit, which after some delay may induce riverine low flows. The recent European droughts in 2018–2023 (Bakke et al., 2020; Blauhut et al., 2022; Toreti et al., 2022; Toreti et al., 2023) also caused river low flow.
Riverine low flow directly impacts navigability of waterways (Meißner et al., 2017; Conradt et al., 2023), public water supply (Dahlmann et al., 2022; Stahl et al., 2016), agricultural water demand for irrigation (Naumann et al., 2021; Stahl et al., 2016; Stephan et al., 2021), industrial water demand for cooling and production (Stahl et al., 2016), hydropower (Naumann et al., 2021; Stahl et al., 2016), and it may negatively affect the water quality (Otop et al., 2023; Wolff and van Vliet, 2021). Impacts are related to the extremity of the hydrological drought event, which can be diagnosed by intensity (streamflow), duration (time below a certain streamflow threshold), and deficit (cumulative deficit during the event; Brunner et al., 2022; Brunner, 2023). The quantitative measures, how hydrological droughts are assessed cover baseflow, low flow indices, flow percentiles, volume deficit, event duration, annual flow minima, or exceedance probabilities (Brunner et al., 2022; Piniewski et al., 2022).
While trends in hydrological droughts are already detectable in the observations for some European catchments (Brunner et al., 2023; Peña-Angulo et al., 2022), future changes are to be assessed in simulation studies. Decreases in river low flow and increases in drought duration are projected for Southern and Western Europe, while the opposite development is projected for Northern, Eastern Europe and the Alps (Cammalleri et al., 2020; Forzieri et al., 2014; Marx et al., 2018; Muelchi et al., 2021; Roudier et al., 2016). In Central Europe, there is less coherence between studies (Piniewski et al., 2022).
The generation mechanisms of hydrological droughts depend strongly on catchment properties and the local climate (Brunner et al., 2022). Van Loon and van Lanen (2012) and van Loon et al. (2015) qualitatively identify eight different types of river drought generation mechanisms according to the meteorological drivers and seasonality. Brunner et al. (2022) translate this typology into a quantitative classification based on precipitation deficits, air temperature, and anomalies of snow-water-equivalent.
Most large catchments in Europe are heavily managed rather than natural (Brown et al., 2018; Hogeboom et al., 2018), and adjustment of human regulation may serve as adaptation measures to changing climate conditions (Arheimer et al., 2017; Bhaduri et al., 2016, Brunner et al., 2019a). Hence, information about future hydrological drought conditions can contribute to the dimensioning of reservoirs, dams, and channels, where management strategies rely on design values (Ehsani et al., 2017).
For such future low flow projections, hydrological models driven by climate model simulations are applied. In a common model chain, either one or an ensemble of global earth system models are employed, which may be statistically or dynamically downscaled via regional climate models. These climate simulations are run under one or more emission scenarios. Due to model-inherent biases, a bias adjustment is recommended for hydrological impact modelling (Willkofer et al., 2018). Then, one or more hydrological models are set up to simulate streamflow.
Climate simulations are governed by model uncertainty, scenario uncertainty, and internal climate variability (ICV; Bosshard et al., 2013; Lehner et al., 2020), which also propagate non-linearily to the simulated streamflow (Brunner et al., 2021). Furthermore, bias adjustment is to be applied with care (Maraun, 2016), where different methods lead to different streamflow results (Teutschbein and Seibert, 2012; Tootoonchi et al., 2022). Lastly, hydrological models differ, which results in differing streamflow simulations, when driven by the same climate (Melsen et al., 2018; Mendoza et al., 2016). Commonly, hydrological studies address one or more of these sources of uncertainty. Model uncertainties can be addressed by using ensembles of several climate and hydrological models. The limited knowledge about future emissions can be accounted for by applying a range of emission scenarios or warming levels. Single model initial-condition large ensembles (SMILE) are employed to address ICV (Deser et al., 2020). In hydrology, SMILEs are still fairly new, yet they show great potential for exploring variability in mean flows (Poschlod et al., 2020) and floods (Brunner et al., 2021; Faghih and Brissette, 2023; Willkofer et al., 2024). Hydroclimatic extremes are subject to major uncertainties due to ICV, where the SMILE provides a large sample size, which allows for the investigation of very rare events with moderate extreme value statistical uncertainties (Lang and Poschlod, 2024). Hence, in this study, we want to explore the potential of a unique hydrological 50-member SMILE for the assessment of extreme hydrological droughts under climate change. We focus on two example catchments in southern Germany reflecting the dichotomy of low flow drivers, where one catchment in the Pre-Alps is influenced by snow and rain dynamics in the reference climate (Poschlod and Daloz, 2024), while the runoff generation in the other catchment is mainly rainfall-driven. This study aims to investigate the behaviour of very rare hydrological droughts up to 1000 year return periods and the importance of ICV for low flow events. We aim to identify shifts of the dominant hydroclimatic drivers and the climate change effects on seasonality, intensity and frequency of drought events. Further, we illustrate the value of a hydrological SMILE for the detection of changes and the robust assessment of extremes. Thereby, we construct bivariate return periods of hydrological droughts, considering peak and duration of low flow events, illustrating drastic effects of climate change on such bivariate design events.
2.1 Study catchments
Rivers in southern Germany show a variety of streamflow regimes (Poschlod et al., 2020). We select the catchment of the river Wörnitz at gauge Harburg (Fig. 1), a northern tributary to the Danube. It shows a pluvial regime with the highest (lowest) monthly discharge in March (August). The majority of the 1570 km2 is elevated between 400 and 550 m, with middle mountain ranges in the west extending until 700 m. The land cover consists of 69 % agricultural areas, 26 % forest, and 5 % artificial surfaces (Loritz et al., 2024). For a reference period of 1980–2009, the mean temperature amounts to 8.3 °C and the annual precipitation is 820 mm.
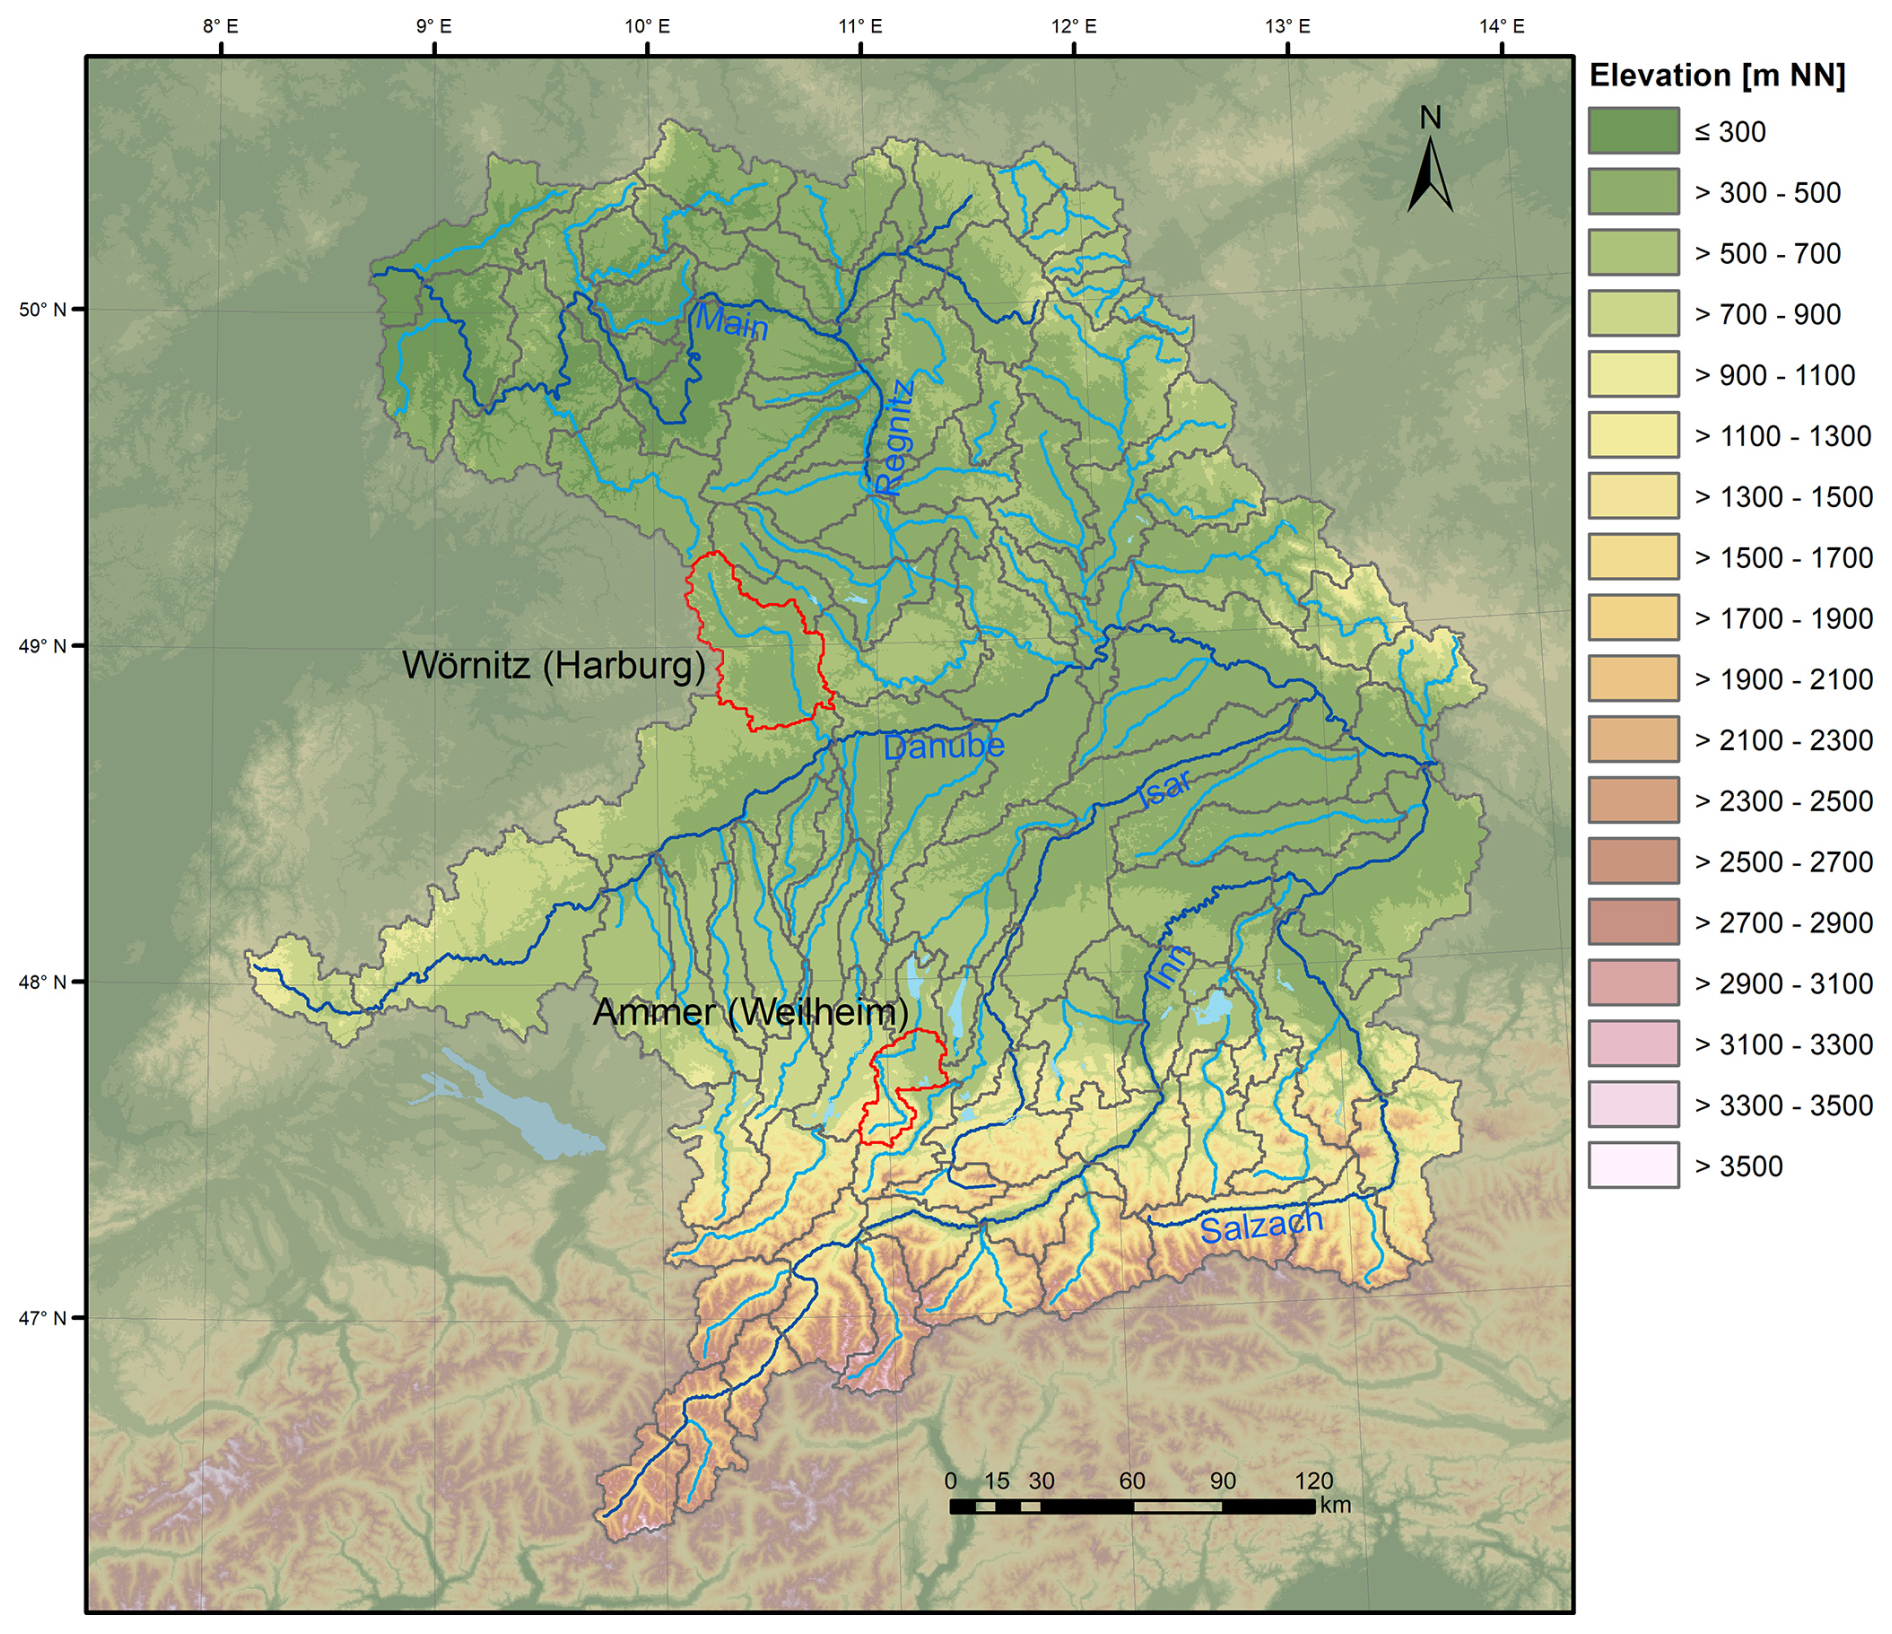
Figure 1Topography and location of the two study catchments Wörnitz (Harburg) and Ammer (Weilheim) in southern Germany. Elevation is taken from the European Digital Elevation Model (EU-DEM; EEA, 2018).
Further, we choose the catchment of the river Ammer at gauge Weilheim (Fig. 1) representative for a nivo-pluvial regime with the highest (lowest) monthly discharge in April (February). It covers 608 km2 with an elevation range between 550 and 2150 m above sea level. Due to the complex topography and its strong north-south gradient, the landscape can be categorized into the pre-alpine hill country and moorland in the north and the Swabian-Upper Bavarian foothills of the Alps in the southern part of the catchment (Kunstmann et al., 2006). Also, the land cover shows a gradient with agricultural areas (mainly pasture) in the north and forest in the south, resulting in a half-half distribution averaged over the entire catchment area (Ludwig et al., 2003; Marx et al., 2006). For the reference climate, the mean annual temperature is 7.0 °C and the annual precipitation amounts to 1390 mm. The Ammer is the main tributary to Lake Ammersee (Bueche et al., 2020).
The choice of the two river catchments is motivated by the fact that, despite their spatial proximity, they represent two fundamentally different climates and hydrological regimes resulting in deviating precipitation patterns, importance of snow dynamics, flow seasonality, and flood dynamics (Poschlod et al., 2020; Poschlod and Daloz, 2024; Willkofer et al., 2024). Further, both catchments are headwater catchments with little human influence, and their low flow conditions are well reproduced in the hydrological modelling (see next section).
2.2 Hydrological simulations
The hydroclimatic modelling chain was designed within the scope of the ClimEx project (Climate Change and Hydrological Extreme Events) aiming to explore hydrological extremes (Willkofer et al., 2024). For the exploration of extreme events a large homogeneous sample size is beneficial. This is achieved by applying a SMILE as driving climate. The Canadian Earth System Model version 2 large ensemble (CanESM2-LE) consists of 50 independent ensemble members simulating the global climate for 1950–2099 at 2.8° resolution under the high-emission scenario RCP8.5 (Fyfe et al., 2017). As this spatial resolution is too coarse for hydrological impact assessments, these 50 ensemble members are dynamically downscaled with the Canadian Regional Climate Model version 5 (CRCM5) at 0.11° resolution (equalling 12 km; Leduc et al., 2019). The CanESM2-LE setup stems from the CMIP5 phase, while the RCP8.5 was used as the highest-emission scenario from the Representative Concentration Pathways in the IPCC 5th assessment report. Compared to the multi-model ensemble of the coordinated downscaling experiment EURO-CORDEX under RCP8.5, the driving climate of the CRCM5-LE shows stronger signals of drying and increasing temperatures during summer (von Trentini et al., 2019). While the use of the high-emission scenario and the rather hot and dry regional climate model must be considered when interpreting the results, this climate scenario allows for the full range of warming and the exploration of low-probability/high-impact futures as well as the potential warming in the 22nd century. The choice of the CRCM5-LE as driving climate for the hydrological impact simulations is further motivated by the availability of high-resolution large ensembles over Europe, with the CRCM5-LE combining the advantages of high resolution (0.11°) and large ensemble size (50 members) compared to the other available high-resolution large ensembles described by Aalbers et al. (2018; 0.11°, 16 members) and by Brönnimann et al. (2018; 0.44°, 21 members).
For a bias adjustment and further statistical downscaling of the CRCM5 simulations, a sub-daily climate reference (SDCLIREF) data set at 3-hourly temporal resolution and 500 m spatial resolution is created based on interpolated meteorological point observations (Willkofer et al., 2020). It comprises precipitation, air temperature, relative humidity, incoming shortwave radiation, and wind speed. As the temporal and spatial coverage of sub-daily meteorological observations is not sufficient for a robust interpolation, daily observations are disaggregated to 3-hourly resolution applying the Method of Fragments (Poschlod et al., 2018; Westra et al., 2012). The native sub-daily measurements and the disaggregated data are spatially interpolated following the methodology by Rauthe et al. (2013) achieving a final resolution of 500 m. In a next step, the bias of the five meteorological variables in the CRCM5-LE is adjusted via quantile mapping (Mpelasoka and Chiew, 2009) preserving the spread of the 50 ensemble members (Willkofer et al., 2020). Furthermore, the bias-adjusted CRCM5-LE is statistically downscaled to 500 m resolution preserving mass and energy (Marke, 2008).
The hydrological modelling applies the Water balance simulation Model (WaSiM; Schulla, 2021), a spatially distributed hydrological model including modules to simulate evapotranspiration, soil water transfer, groundwater, snow accumulation and snow melt, and glaciers. While most of the modules follow physically-based process descriptions, also conceptual relationships are applied. Based on the water balance, the model computes the generation of discharge and the routing of the streams run at 3-hourly time steps (Schulla, 2021). In our setup, evapotranspiration is modelled with the Penman-Monteith approach (Monteith, 1965). The static parameters governing groundwater, soil, and land cover remain constant over the whole simulation period.
The hydrological years of 2004–2010 and 1995–2002 are used for the calibration and validation of WaSiM, respectively. There, the simulated discharge driven by SDCLIREF is compared to observed discharge, provided by the state water authority (LfU, 2025). Due to the focus of the ClimEx project on high flows, the calibration is carried out using a weighted combination of performance metrics recommended by Moriasi et al. (2007): the Nash and Sutcliffe efficiency (NSE; Nash and Sutcliffe, 1970; 50 % weight) and its logarithmic version (logNSE; 15 % weight), the Kling-Gupta efficiency (KGE; Gupta et al., 2009; 25 % weight), and the ratio of root mean squared error to standard deviation (RSR; 10 % weight; Willkofer et al., 2020). This combined objective function is optimized during the calibration process, which involves manual alternation of WaSiM parameters governing spatially distributed processes as well as automatic parameter estimation for catchment-specific parameters (Willkofer et al., 2020). The validation evaluates the performance metrics NSE, logNSE, KGE, and RSR as well as the percentage bias of mean flow. After the successful validation, the bias-adjusted and statistically downscaled CRCM5-LE simulations are used to drive the hydrological model resulting in the unique hydrological large ensemble WaSiM-LE.
For a detailed description of the setup, we refer the reader to Leduc et al. (2019) for the climate modelling, to Willkofer et al. (2018) for the bias adjustment, to Willkofer et al. (2020) for the WaSiM calibration, and to Poschlod et al. (2020) as well as to Willkofer et al. (2024) for the hydrological modelling. The choice of the objective function and the selection of the time periods for calibration and validation reflect the initial project focus of ClimEx on floods, whereas there is a second follow-up project (“ClimEx II”) with focus on droughts and low flows. This study is conducted at the transition phase from ClimEx I to ClimEx II as a preparation for the second phase in order to explore uncertainties due to climate change and internal variability to provide insights for the hydrological model setup, calibration, bias adjustment, and required ensemble size. Furthermore, the study explores the benefit from the hydrological SMILE for low flow investigation. This enables to adjust the modelling setup accordingly in the next project phase, ClimEx II. Further, we consider the results of this study to be of interest to the scientific community when designing impact studies on droughts and low flows, raising awareness of uncertainties due internal climate variability and low sample size.
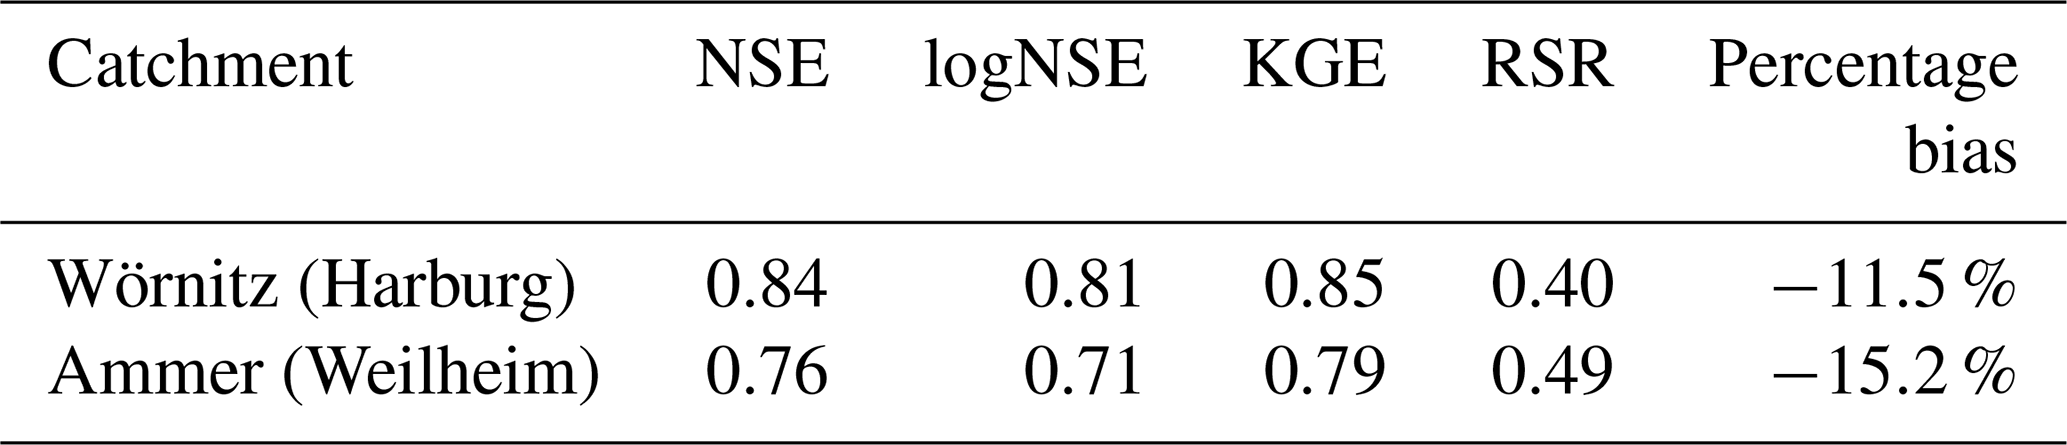
For this study, we focus on the hydrological simulations between 1980–2099 for the Wörnitz and Ammer. We select 1980–2009 as reference period (REF) and divide the simulations into 2010–2039 (current climate: CUR), 2040–2069 (near future: NF), and 2070–2099 (far future: FF). With 50 ensemble members, this results in 1500 simulated years per 30 year period. Both catchments are head catchments, where no major water management structures, such as reservoirs, dams or channels, are implemented. The spatial distribution of land use and land cover is assumed to stay constant. As the simulations stemming from the ClimEx project are designed to represent floods, we have to ensure their applicability for low flow assessments. The validation results for the simulations of these two catchments are given in Table 1 indicating a sufficiently good model performance. The logNSE values above 0.7 diagnose that low flow conditions are well reproduced during the validation (Parra et al., 2019). Flow duration curves (see Fig. S1 in the Supplement) demonstrate that the hydrological model chain is able to well represent the characteristics of low flows for the two catchments in this study, while mean flows are slightly underestimated reflecting the bias reported in Table 1.
Table 1Performance metrics of the discharge validating WaSiM simulations driven by the climatological reference SDCLIREF against discharge observations.
3.1 Summer and winter low flow
The German hydrological year extends from November to October, whereas for low flow also April–March is a common assessment period (LfU, 2021). Here, we divide the hydrological year into winter half (November–April) and summer half (May–October).
For the quantification of low flow intensity, we apply the lowest discharge per hydrological (half) year, considering 7 d windows (L7Q), where the river flow is averaged over a moving window of 7 d and the minimum value is chosen as L7Q. The mean of the annual L7Q indices over a longer time period (e.g. 30 years) is referred to as ML7Q. These two metrics are used operationally by the low flow monitoring (LfU, 2020). We further define the low flow event duration. Therefore, we count the number of consecutive days, where L7Q is below the ML7Q of the reference period 1980–2009. We treat events as separate if they are separated by at least one day on which L7Q > ML7Q, as the L7Q index is based on 7 d moving windows. We assign an event to the winter (summer) period, if the majority of the event duration is in the winter (summer) half year. We assess summer and winter low flows in the Ammer catchment, while only investigating summer low flows in the Wörnitz catchment due to its pronounced regime with wet winter seasons.
A comparison between discharge observations, WaSiM driven by meteorological observations and the WaSiM-LE driven by the CRCM5-LE reveals that the L7Q intensity is underestimated by 5 % to 10 % in the simulations (Fig. S2). The observed summerly event duration in the Wörnitz catchment is slightly overestimated by up to 30 d for the longest events, while observed event durations in the Ammer catchment are well within the ensemble spread for summer and winter (Fig. S3).
3.2 Extreme value statistical assessment
The flowchart in Fig. S4 provides an overview of the methodological workflow of the extreme value statistical assessment. The theoretical foundation of this framework is explained in the following sections.
3.2.1 Univariate return levels
Extreme Value Theory (EVT) is a statistical framework addressing extreme deviations from the median of probability distributions. Hence, it is applied to study the behaviour of processes, when they take unusually large or small values (Coles, 2001). The aim is to derive occurrence probabilities of rare events and their according intensity, size, duration or any other feature. In Earth system sciences, it is commonly applied to unusually large values (Hamdi et al., 2021), e.g. riverine flood discharge (Basso et al., 2021; Villarini et al., 2011), coastal flood water levels (Caruso and Marani, 2022), extreme rainfall intensities (Poschlod and Koh, 2024), extreme snow depths (Le Roux et al., 2020), or high temperature (Parey et al., 2019) but is also applicable to small values such as low flows (Raynal-Villasenor and Raynal-Gutierrez, 2014) or drought (Naumann et al., 2018).
There are two common strategies in classical EVT: Block maxima or minima sampling associated with the Generalized Extreme Value (GEV) distribution and Peak over (under) threshold sampling associated with the Generalized Pareto (GP) distribution. Note that the practical application of the GEV on minima only slightly differs from the more common application on maxima: the minima are negatively transformed by multiplication with −1 before the distribution parameters are fitted. Applying the negative transformation, the lowest value of the minima series becomes the highest value of the transformed series and vice versa. Then, the common workflow of GEV for block maxima can be applied (Hewa et al., 2007). Further note that data censoring due to zero flows has to be handled, which however does not occur in our study catchments.
For the low flow intensity, we sample the L7Q per hydrological half year and apply a negative transformation, which is per definition a block maximum sampling. However, the L7Q is not necessarily considered to be “extreme” in any half year. Hence, we allow for larger block sizes, such as two or three consecutive winter (summer) half years. Following the Fisher–Tippett–Gnedenko theorem (Fisher and Tippett, 1928; Gnedenko, 1943), the GEV distribution describes the block maxima M for a sufficiently large sample size. It approximates the exceedance probability
with the parameters μ (location), σ (scale) and ξ (shape). The shape parameter governs the tail behaviour of the distribution. The return level z can then be calculated by inverting Eq. (1) (Coles, 2001) and transforming the discharges back to positive values.
For the event durations, we apply a peak over threshold sampling. There, we sample all values s above a threshold u considering them as extreme values (Balkema and de Haan, 1974; Pickands, 1975). For a random variable S, the GP distribution (Davison and Smith, 1990; Martins and Stedinger, 2001) describes the exceedances with the corresponding cumulative distribution function (CDF)
Thereby, y is defined as the event duration excess over the threshold u. The event duration threshold u must be chosen suitably: selecting u too low may violate the asymptotic assumptions of the GP distribution, while choosing u too high may result in too few exceedances, leading to high estimation uncertainty and reduced statistical power. The scale parameter β describes the spread of the distribution, and the shape parameter ξ governs the tail behaviour of the GP distribution (Coles, 2001). The calculation of return levels requires to account for the exceedance rate, which is the number of events per year nY. Then, the N-year return level zN is derived by
with (Coles, 2001).
We estimate the GEV and GP parameters in a Bayesian framework applying a Markov chain Monte Carlo algorithm (Bocharov, 2022; Foreman-Mackey et al., 2013). We check the goodness of fit via the Anderson–Darling test at the significance level of α=0.05. Within each 30 year period, we assume stationarity as simplification.
The two theoretical frameworks of the GEV and GP do not contradict each other, but rather correspond as one framework can be expressed by the other (Goda, 2011; Serinaldi and Kilsby, 2014; Wang and Holmes, 2020). Here, the choice of the respective framework is motivated by the data and the definition of intensity (L7Q) and event duration (consecutive days, where L7Q > ML7Q).
3.2.2 Bivariate return levels
For the combination of the extremal behaviour of low flow intensity and event duration, we calculate bivariate return periods. Gräler et al. (2013) provide an overview of different approaches to derive multivariate return periods in hydrology with an application to flood events. Tu et al. (2018) propose a multivariate design combination of drought properties to better capture the impact on regional water supply. Following Tu et al. (2018), we use copulas to describe the bivariate dependence structure. With I as the unite interval [0,1], the bivariate copula C is the joint distribution on with uniform margins (Zscheischler and Fischer, 2020). Hence, for two random variables X and Y with the CDFs and , the copula C expresses the joint distribution function as (Sklar, 1959; Zscheischler and Seneviratne, 2017)
with the marginal CDFs and Based on the copula fitted to the data, one can directly define four “hazard scenarios”, where Salvadori et al. (2016) provide an intuitive graphical representation (Fig. 1 therein). Here, we explore bivariate exceedance probabilities with the joint survival distribution
following Salvadori et al. (2013) with the marginal survival functions and and the survival copula (AghaKouchak et al., 2014; Zscheischler et al., 2017). For any given , there is a unique survival critical layer (or isoline), on which the set of realizations of X and Y have the same probability : , where is the survival critical layer associated with the probability t (AghaKouchak et al., 2014; Salvadori et al., 2011).
is the Kendall's survival function associated with and the probability t defined as
With an average interarrival time of 1 for X and Y, the survival Kendall's return period is calculated as (AghaKouchak et al., 2014)
The bivariate survival Kendall's return period has been applied by AghaKouchak et al. (2014) in order to analyse the 2014 drought in California and by Zscheischler et al. (2017) in order to explain crop yield variability in Europe based on temperature and precipitation.
In this study, we use the Multivariate Copula Analysis Toolbox (MvCAT; Sadegh et al., 2017) to fit the copula as it considers 26 different bivariate copula families. The copula parameters are estimated via a gradient-based local optimization (Sadegh et al., 2017), and the best copula is chosen according to the Bayesian Information Criterion (BIC, Schwarz, 1978), which measures the trade-off between model fit and model complexity.
3.2.3 Bivariate design events
For a given probability t, there are numerous bivariate combinations on survival the critical layer , which are associated with the same bivariate survival Kendall's return period. For the selection of a bivariate design event, a common approach is to choose the “most likely design scenario” (Gräler et al., 2013; Sadegh et al., 2018). Therefore, weighted samples are drawn from the critical layer , with the copula density function as weight (Sadegh et al., 2018). The bivariate combination with the highest density is then chosen as the most likely design scenario. Note that this design pair of peak low flow and low flow duration is not necessarily the most impactful realization. However, it can be interpreted as the “typical” bivariate realization, where the water management should be designed accordingly to withstand this design scenario for a given return period (Salvadori et al., 2014).
3.3 The Budyko framework
Budyko (1951) found that climate aridity governs the long-term partitioning of precipitation into river discharge and evaporation formalizing the ratio of mean annual evaporation E and mean annual precipitation P as:
with the mean annual potential evaporation Ep. The framework is based on an empirical foundation, where the resulting Budyko curve is found to capture around 90 % of the inter-catchment variability in evaporative fractions across various catchments in Europe (Budyko, 1951). We refer the reader to Berghuijs et al. (2020) for an insightful commentary on the Budyko framework.
4.1 Climatic and hydrological drivers
River discharge is driven by catchment-specific features, human management and the climatic conditions. As the first two factors are kept constant in this simulation experiment, the changes in river discharge and low flow conditions can be attributed to climate change. Figure 2 presents the seasonal course of air temperature, precipitation, evaporation, soil moisture in the rootzone, snow, and snow storage for the reference climate and future projections. As WaSiM is a spatially distributed model run at 500 m resolution, the climatic and hydrological drivers are averaged over the two catchment areas upstream of the river gauges. Compared to the reference climate, the annual temperature in the Wörnitz catchment is projected to increase by +1.0 °C (CUR), +2.3 °C (NF), and +4 °C (FF), respectively. In the Ammer catchment, slightly higher increases are simulated with +1.1 °C (CUR), +2.5 °C (NF), and +4.3 °C (FF). This leads to an increase of evaporation, especially in the summer season, which in turn induces lower soil moisture conditions. The annual precipitation sums change by less than 6 % in the future periods for both catchments. However, the seasonality shifts, where precipitation is projected to increase in the winter and decrease in the summer.
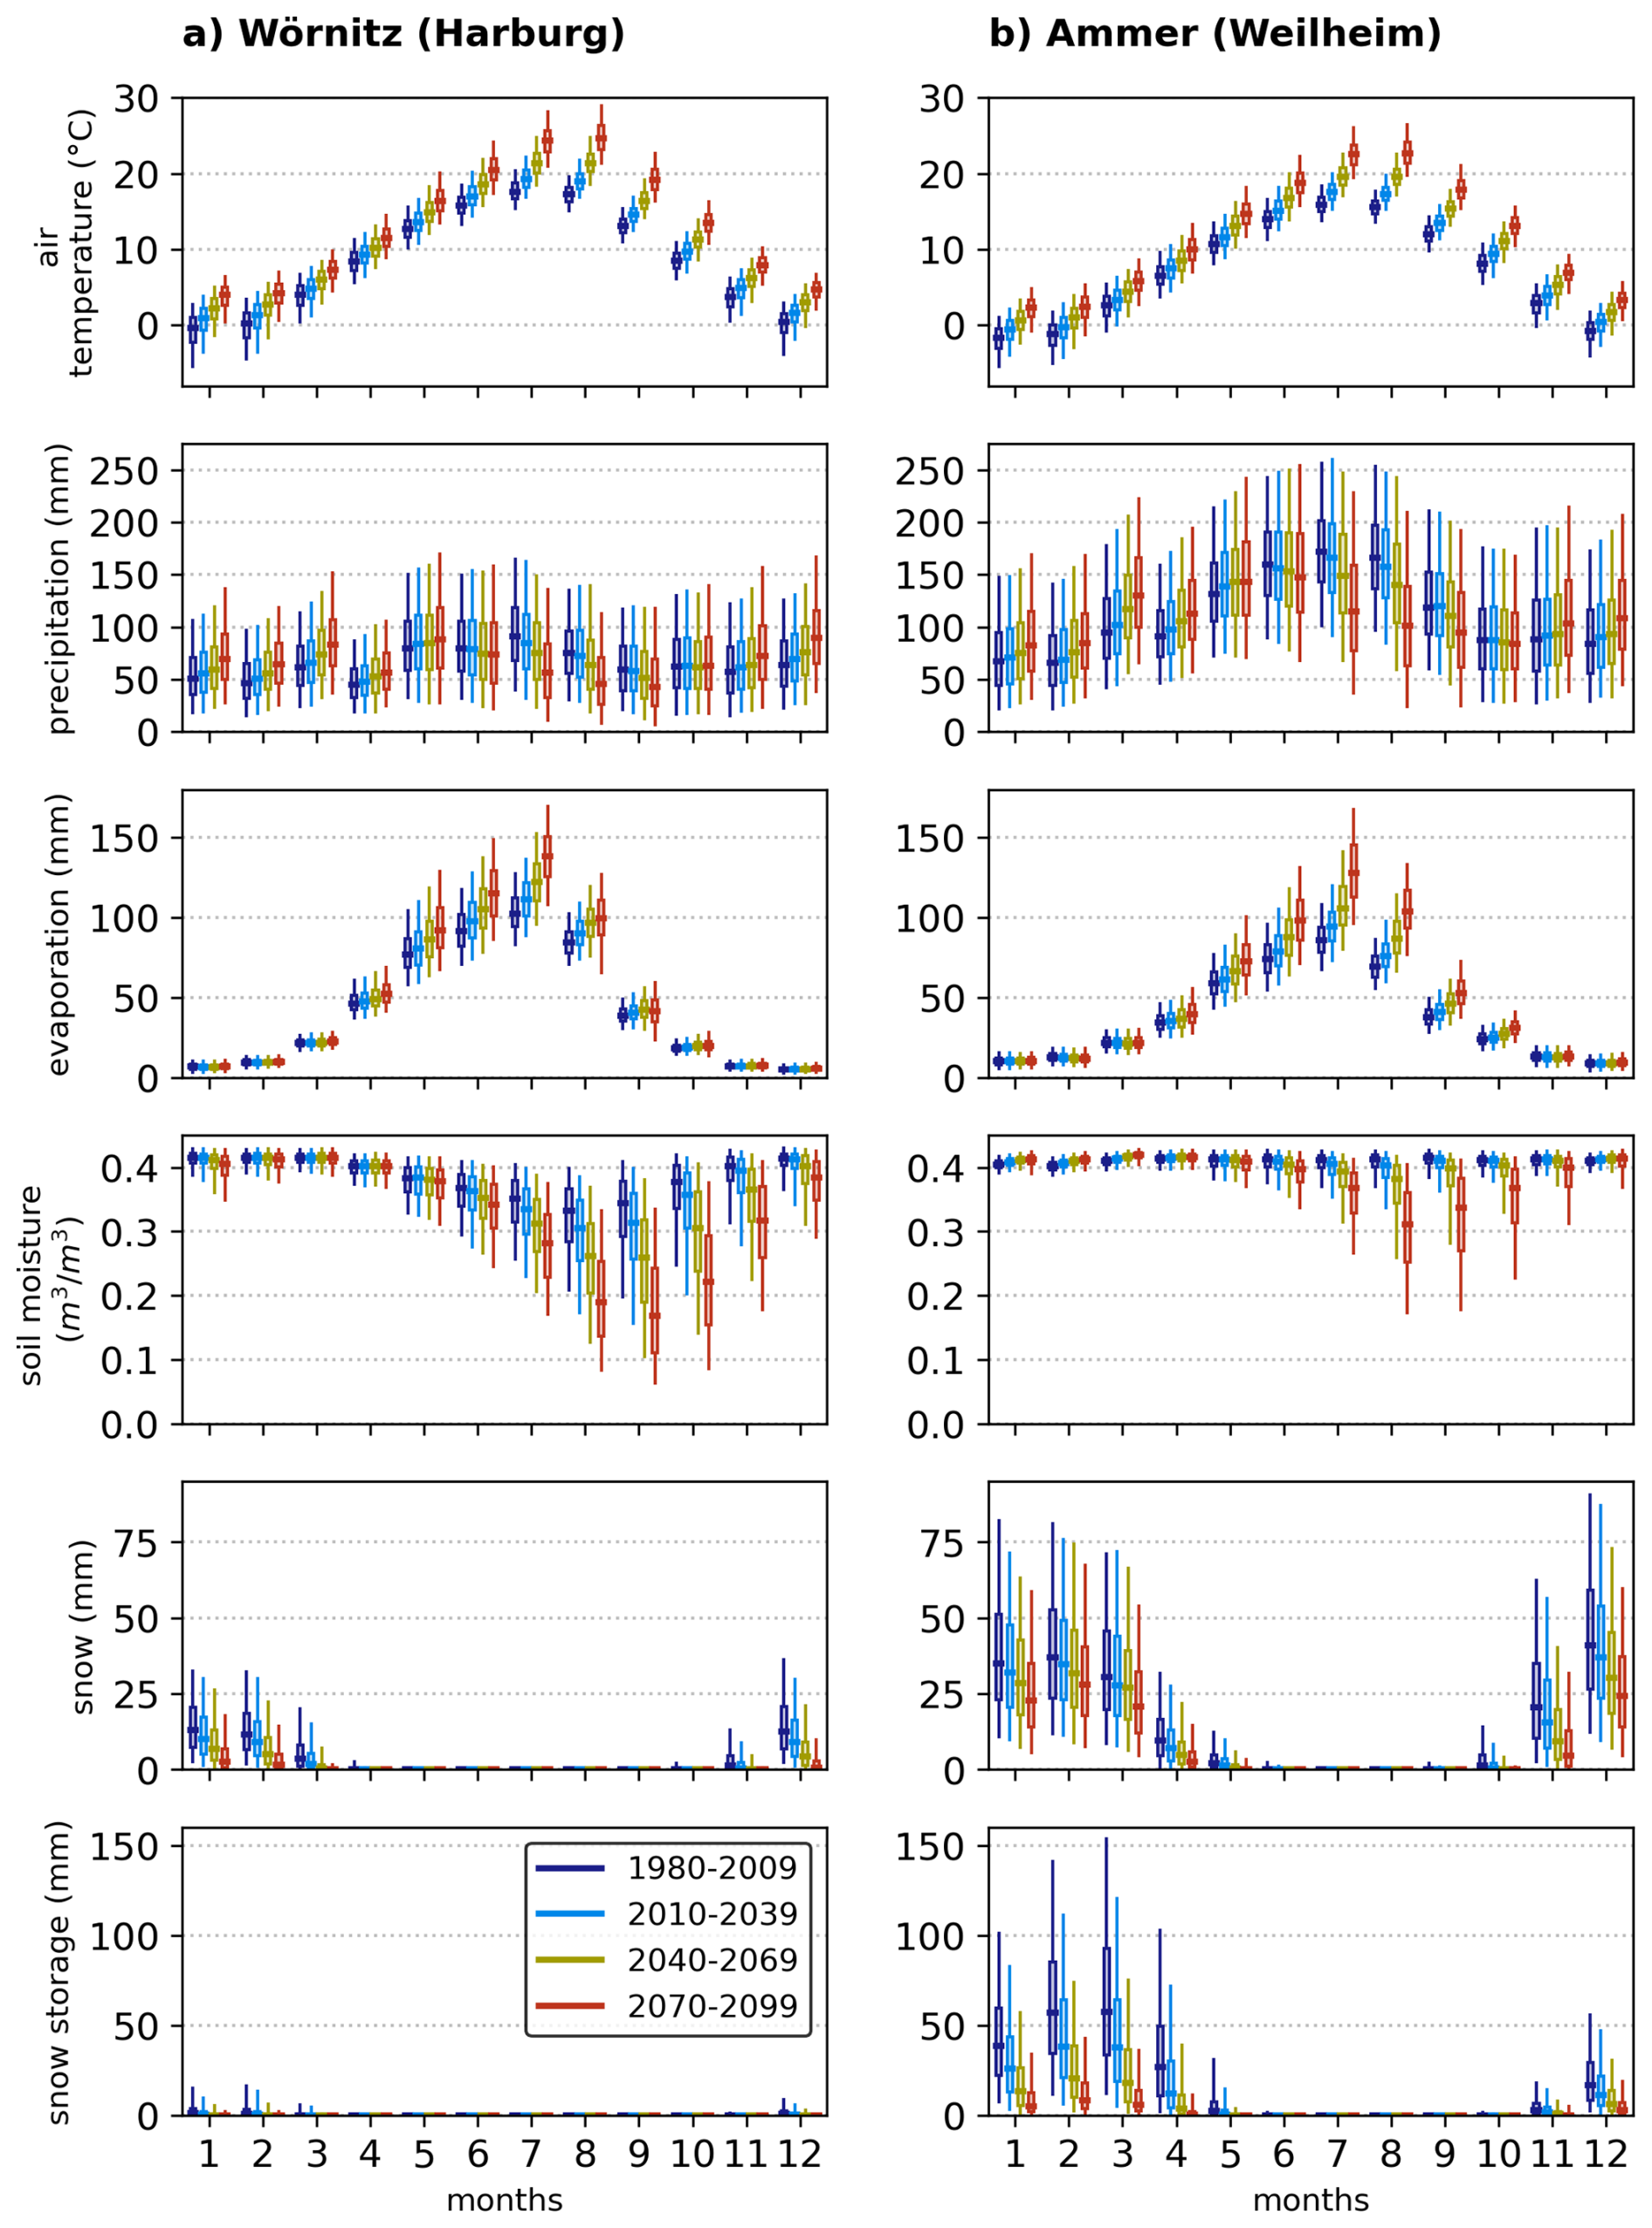
Figure 2Climatic and hydrological drivers in the (a) Wörnitz and (b) Ammer catchments. The centerline of the boxplots shows the median over all 50 members and 30 years per period. The boxes represent the inter-quartile range of the 1500 years, where the whiskers extend to the 5th and 95th percentiles, respectively. An alternative figure focussing on the changes compared to the reference period is given in the Supplement (Fig. S5).
Due to the temperature increase and the summerly precipitation decrease, soil moisture conditions during summer are projected to be drier in the future. This depletion of soil moisture is even more pronounced for drought years (see the lower whiskers for the 5th percentile). In the Ammer catchment, the median soil moisture conditions are close to saturation over the whole year in the reference climate. For the near and far future, the soils are projected to dry out stronger during summer. In the Wörnitz catchment, the soil moisture is projected to decrease in summer and shift the seasonality towards drier soils later in the year. Snow dynamics play a minor role in the Wörnitz catchment, with a projected decease of snowfall. In the Ammer catchment, snow storage reaches over 50 mm snow water equivalent during February and March of the reference climate. Snowfall and snow storage are projected to strongly decrease.
4.2 Drying and Seasonality, duration
The alterations of the hydroclimatic conditions affect the riverine flow regime and low flow intensities. For the annual L7Q with no separation of summer and winter low flow, Fig. 3 shows the median drying tendencies with an earlier onset for Wörnitz than for Ammer. The annual median over 50 members results in a relatively smooth temporal progression despite using an extreme metric (L7Q).
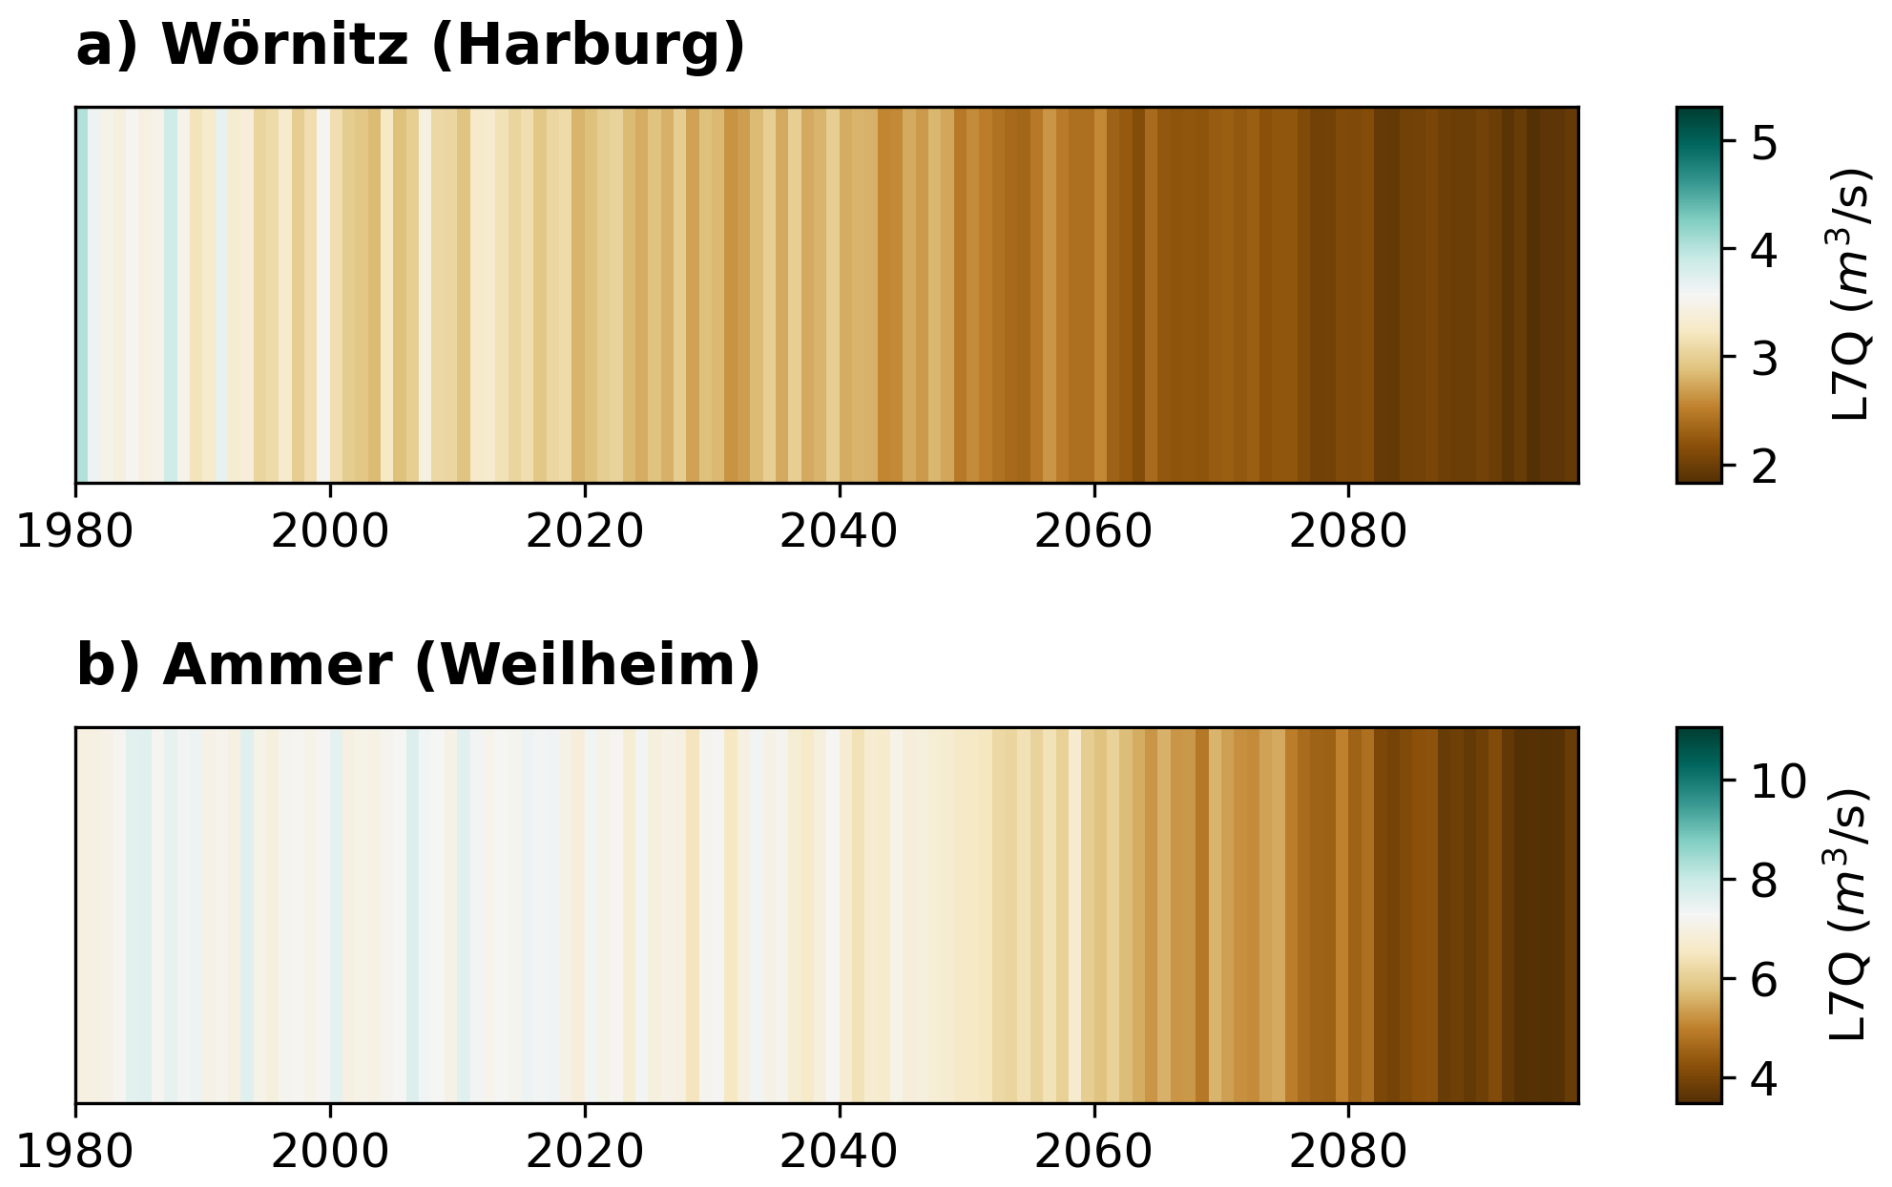
Figure 3“Drying stripes” (inspired by the warming stripes by Hawkins, 2018): With the ML7Q of 1980–2009 as reference, the temporal course of the annual L7Q visualizes the projections of low flow intensity. Each annual stripe pools all 50 members and represents the median of these 50 years.
Summer events dominate the annual L7Q in the Wörnitz catchment, with constant shifts towards later in the year with future warming (Fig. 4). In the Ammer catchment, the low flow events in the reference period are mostly in winter with most events in February. In the current climate, the simulations show a broad distribution of events throughout the year, while summer events dominate in the two future periods.
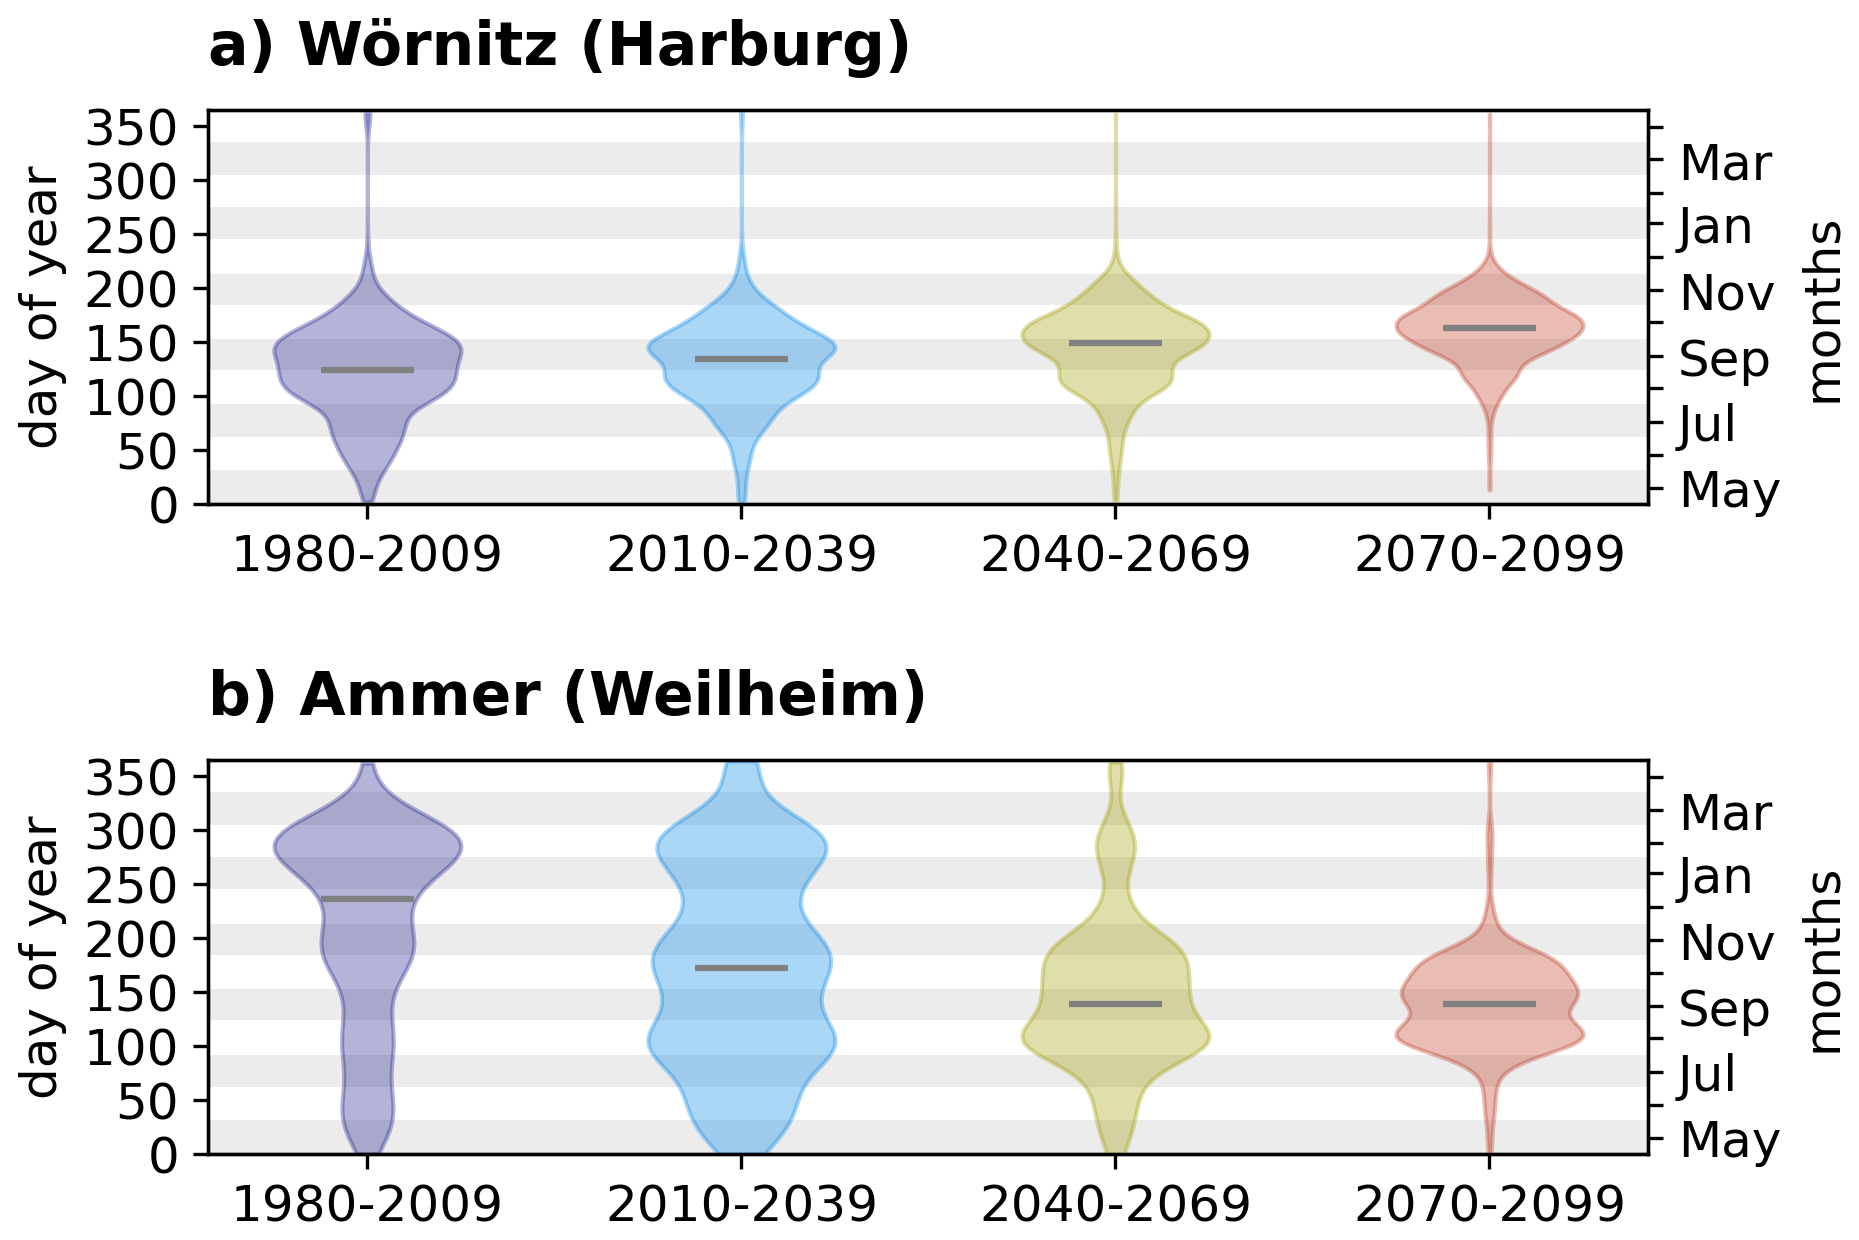
Figure 4Seasonality of the annual L7Q events. The violin plots provide kernel density estimates, where the grey line shows the median of all events in the respective 30 year period. Per time period, all 30 years times 50 members are pooled, allowing the kernel density estimate to be based on 1500 years.
While Figs. 3 and 4 focus on the peak low flow intensity and its date, the event duration and its seasonality are also affected by a changing climate. For eight categories of event duration (see Table 2), Fig. 5 shows the event seasonality for summer low flows in the Wörnitz catchment as well as summer and winter low flows in the Ammer catchment.
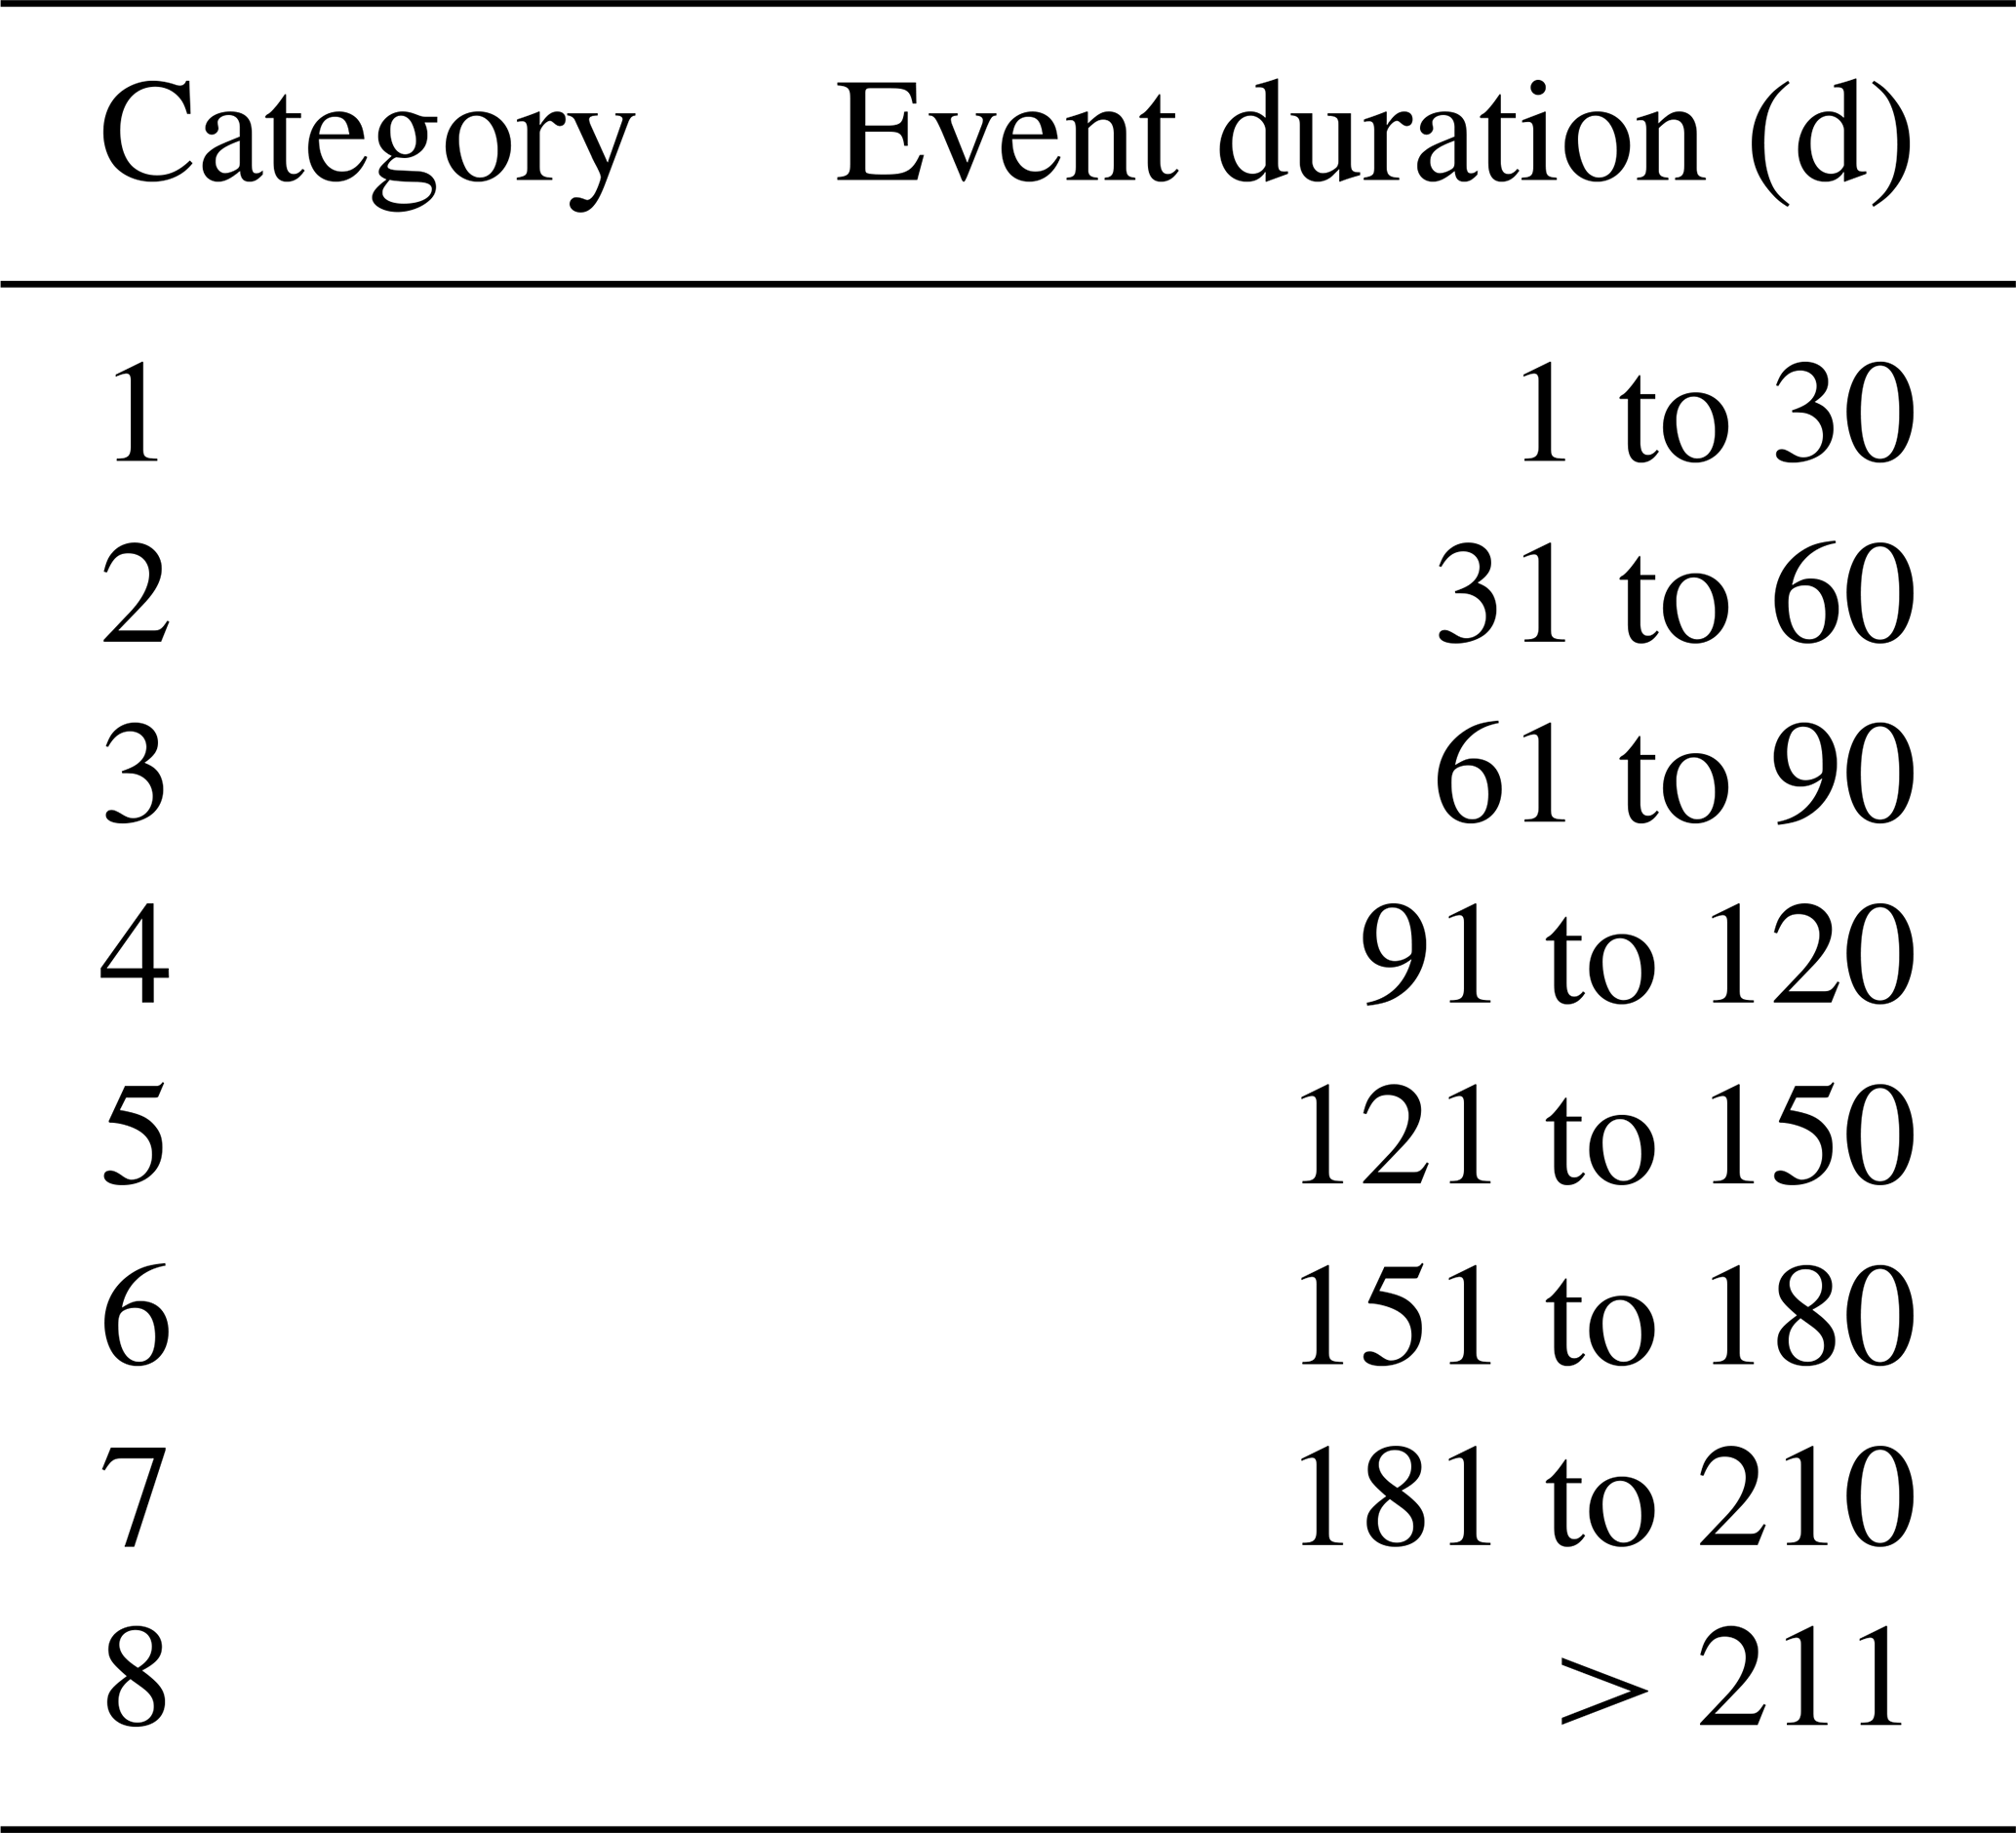
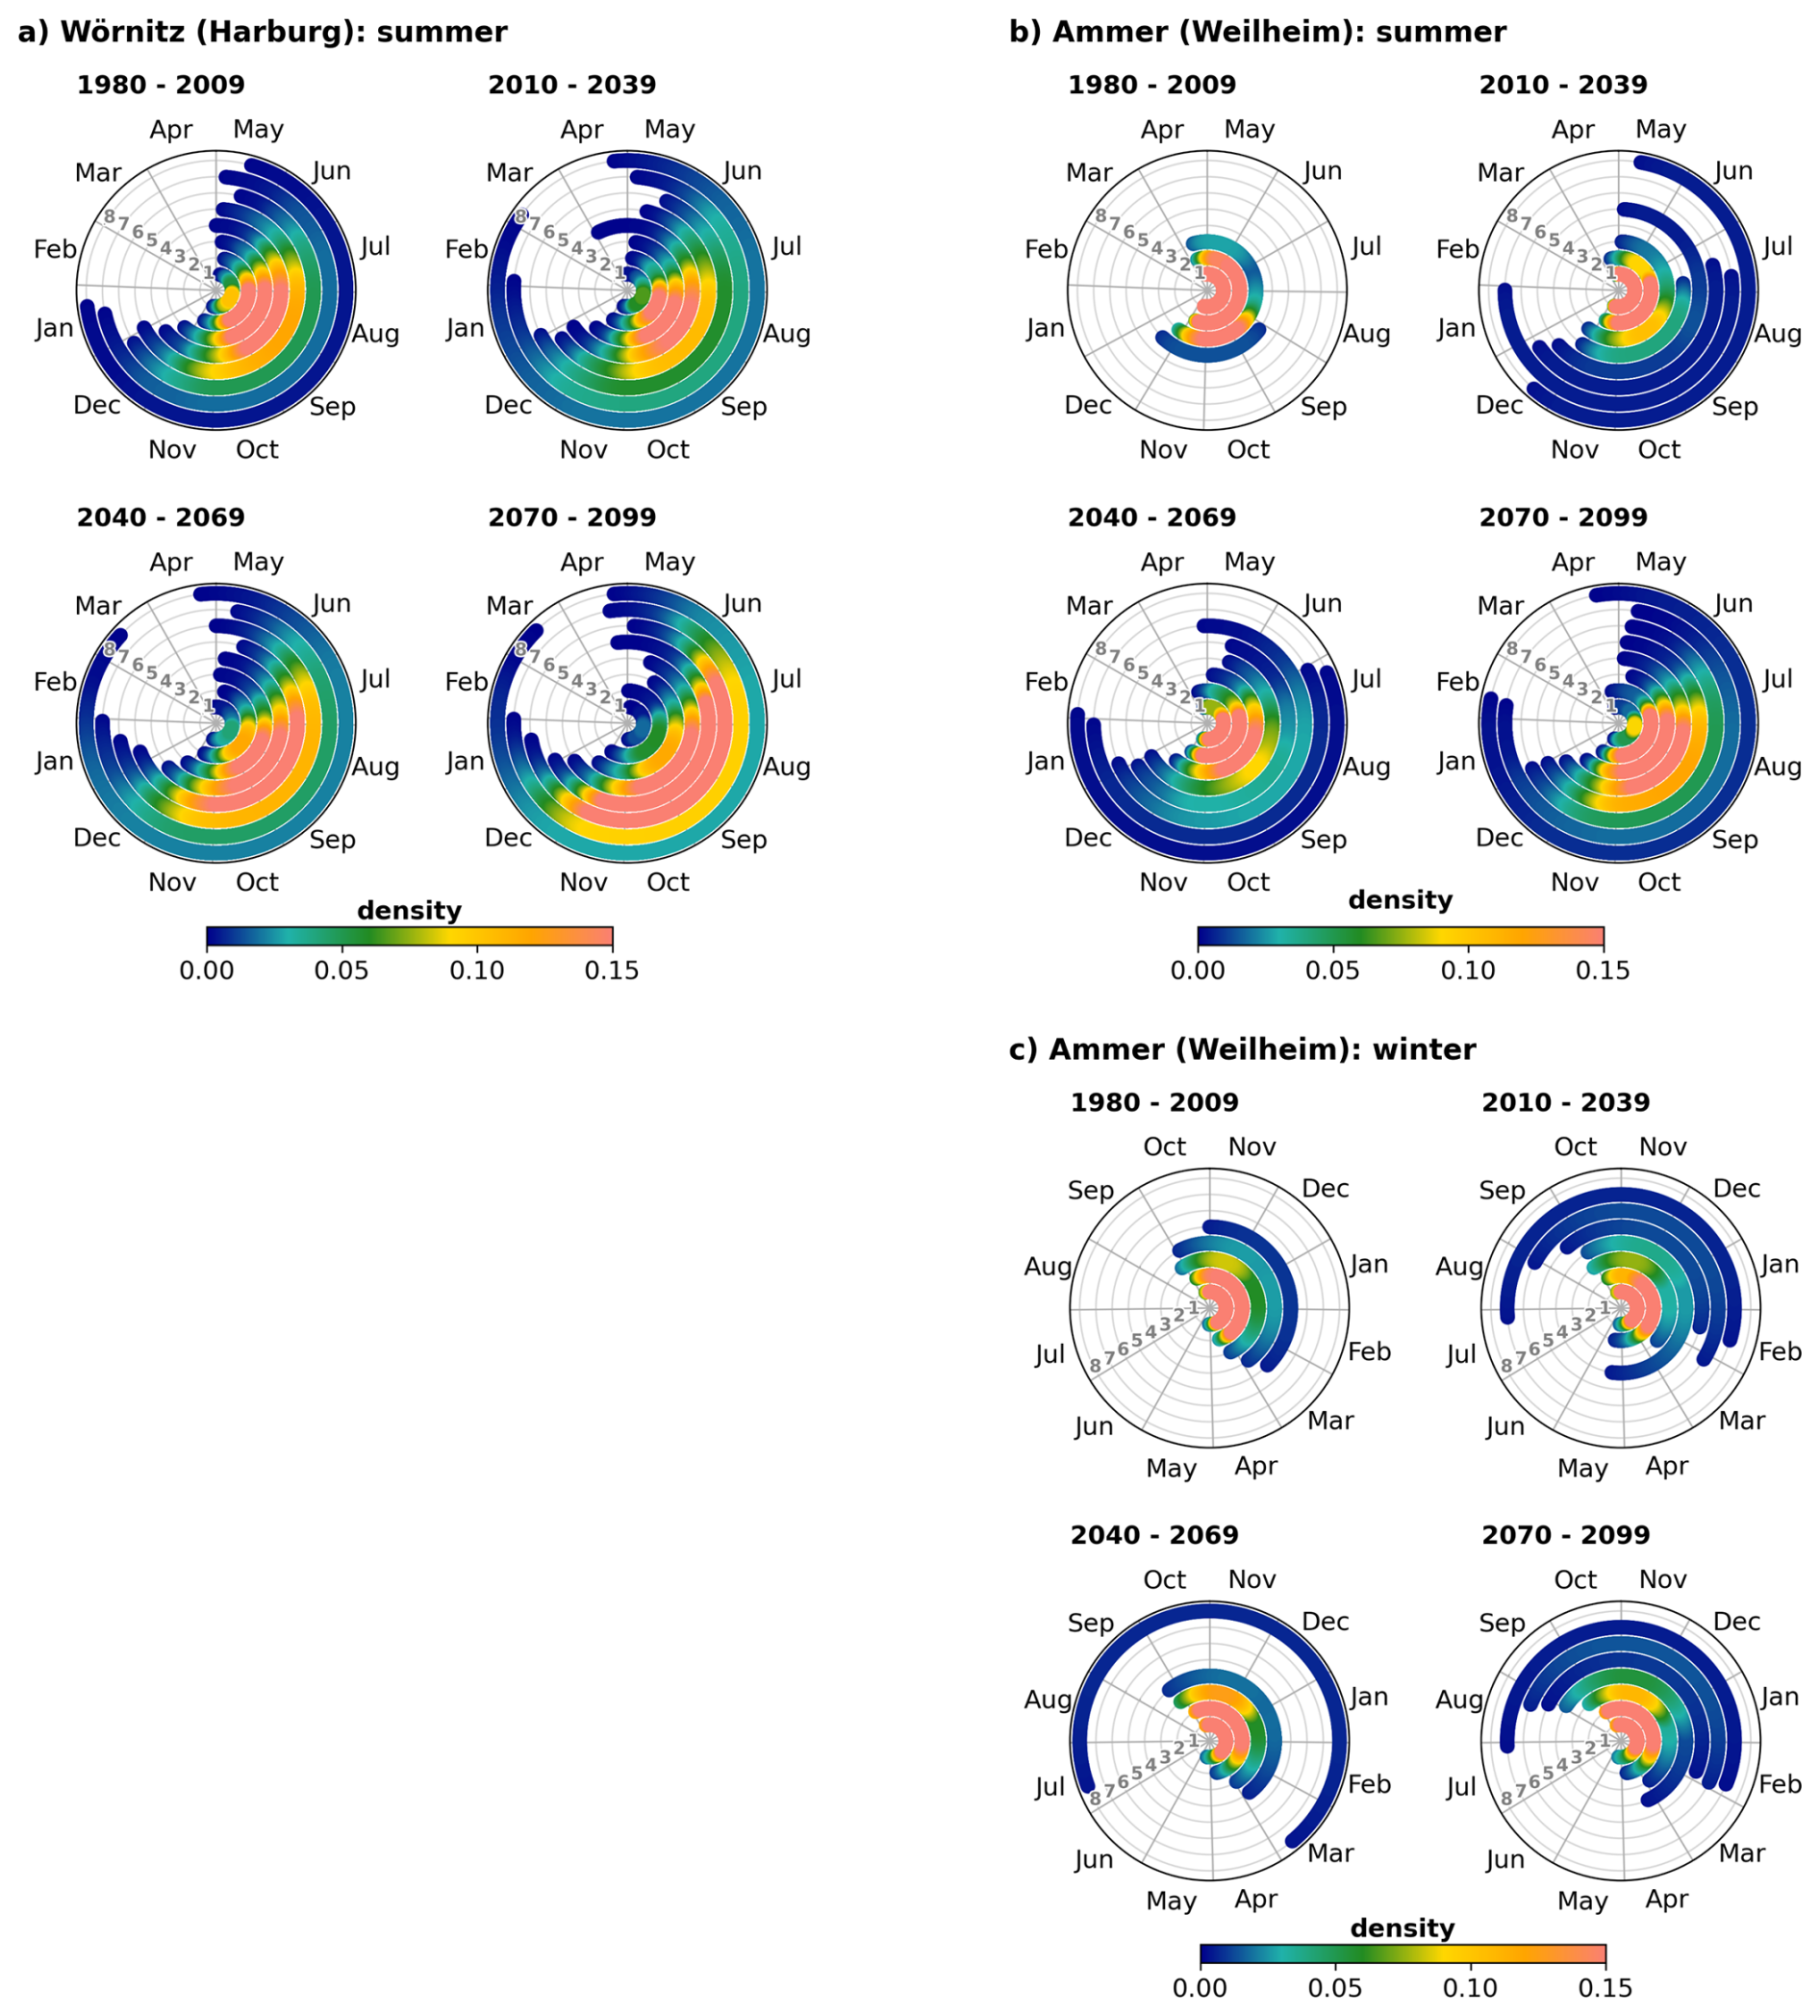
Figure 5Seasonality and event duration for summer low flow events in the (a) Wörnitz catchment during summer and Ammer catchment during (b) summer and (c) winter. Per time period, all events from the 30 years times 50 members are pooled. The density colour code depicts the occurrence of low flow events within the simulated 1500 years. Inset Numbers (1–8) indicate the event duration for 8 categories ranging from category 1 (<30 d) to category 8 (>211 d). See Table 2 for details.
The summer low flow events are projected to extend towards longer event durations and to shift later in the year (Fig. 5a and b). For the Wörnitz, the typical low flow events (highest density in Fig. 5a) in the reference period cover 31–120 d centred around August and September. In the far future period, prolonged events of 91–180 d centred around August to October are most common. In the Ammer catchment during the reference period, typical summer low flows cover 1–90 d at any time between May and November (Fig. 5b). Until the far future, they are projected to occur mainly from July to November and extend to durations ranging from 31–120 d. Winter low flows are shorter and typically last 1–60 d at any time between November and March.
4.3 Return levels of low flow intensity and duration
The L7Q indices are well represented by the GEV distribution (Fig. 6) passing the goodness-of-fit test for all time periods and catchments. Due to the large sample size of 50 members times 30 annual indices, the extreme value statistical uncertainties are small. The L7Q is projected to intensify during summer for both catchments and across all return periods. For the winter low flow in the Ammer catchment, the intensification is less pronounced. The current climate only slightly differs from the reference period. The near future shows a lower L7Q for 5 year and rarer events. In the far future, a strong decline of the low flow discharge is projected across all event probabilities.
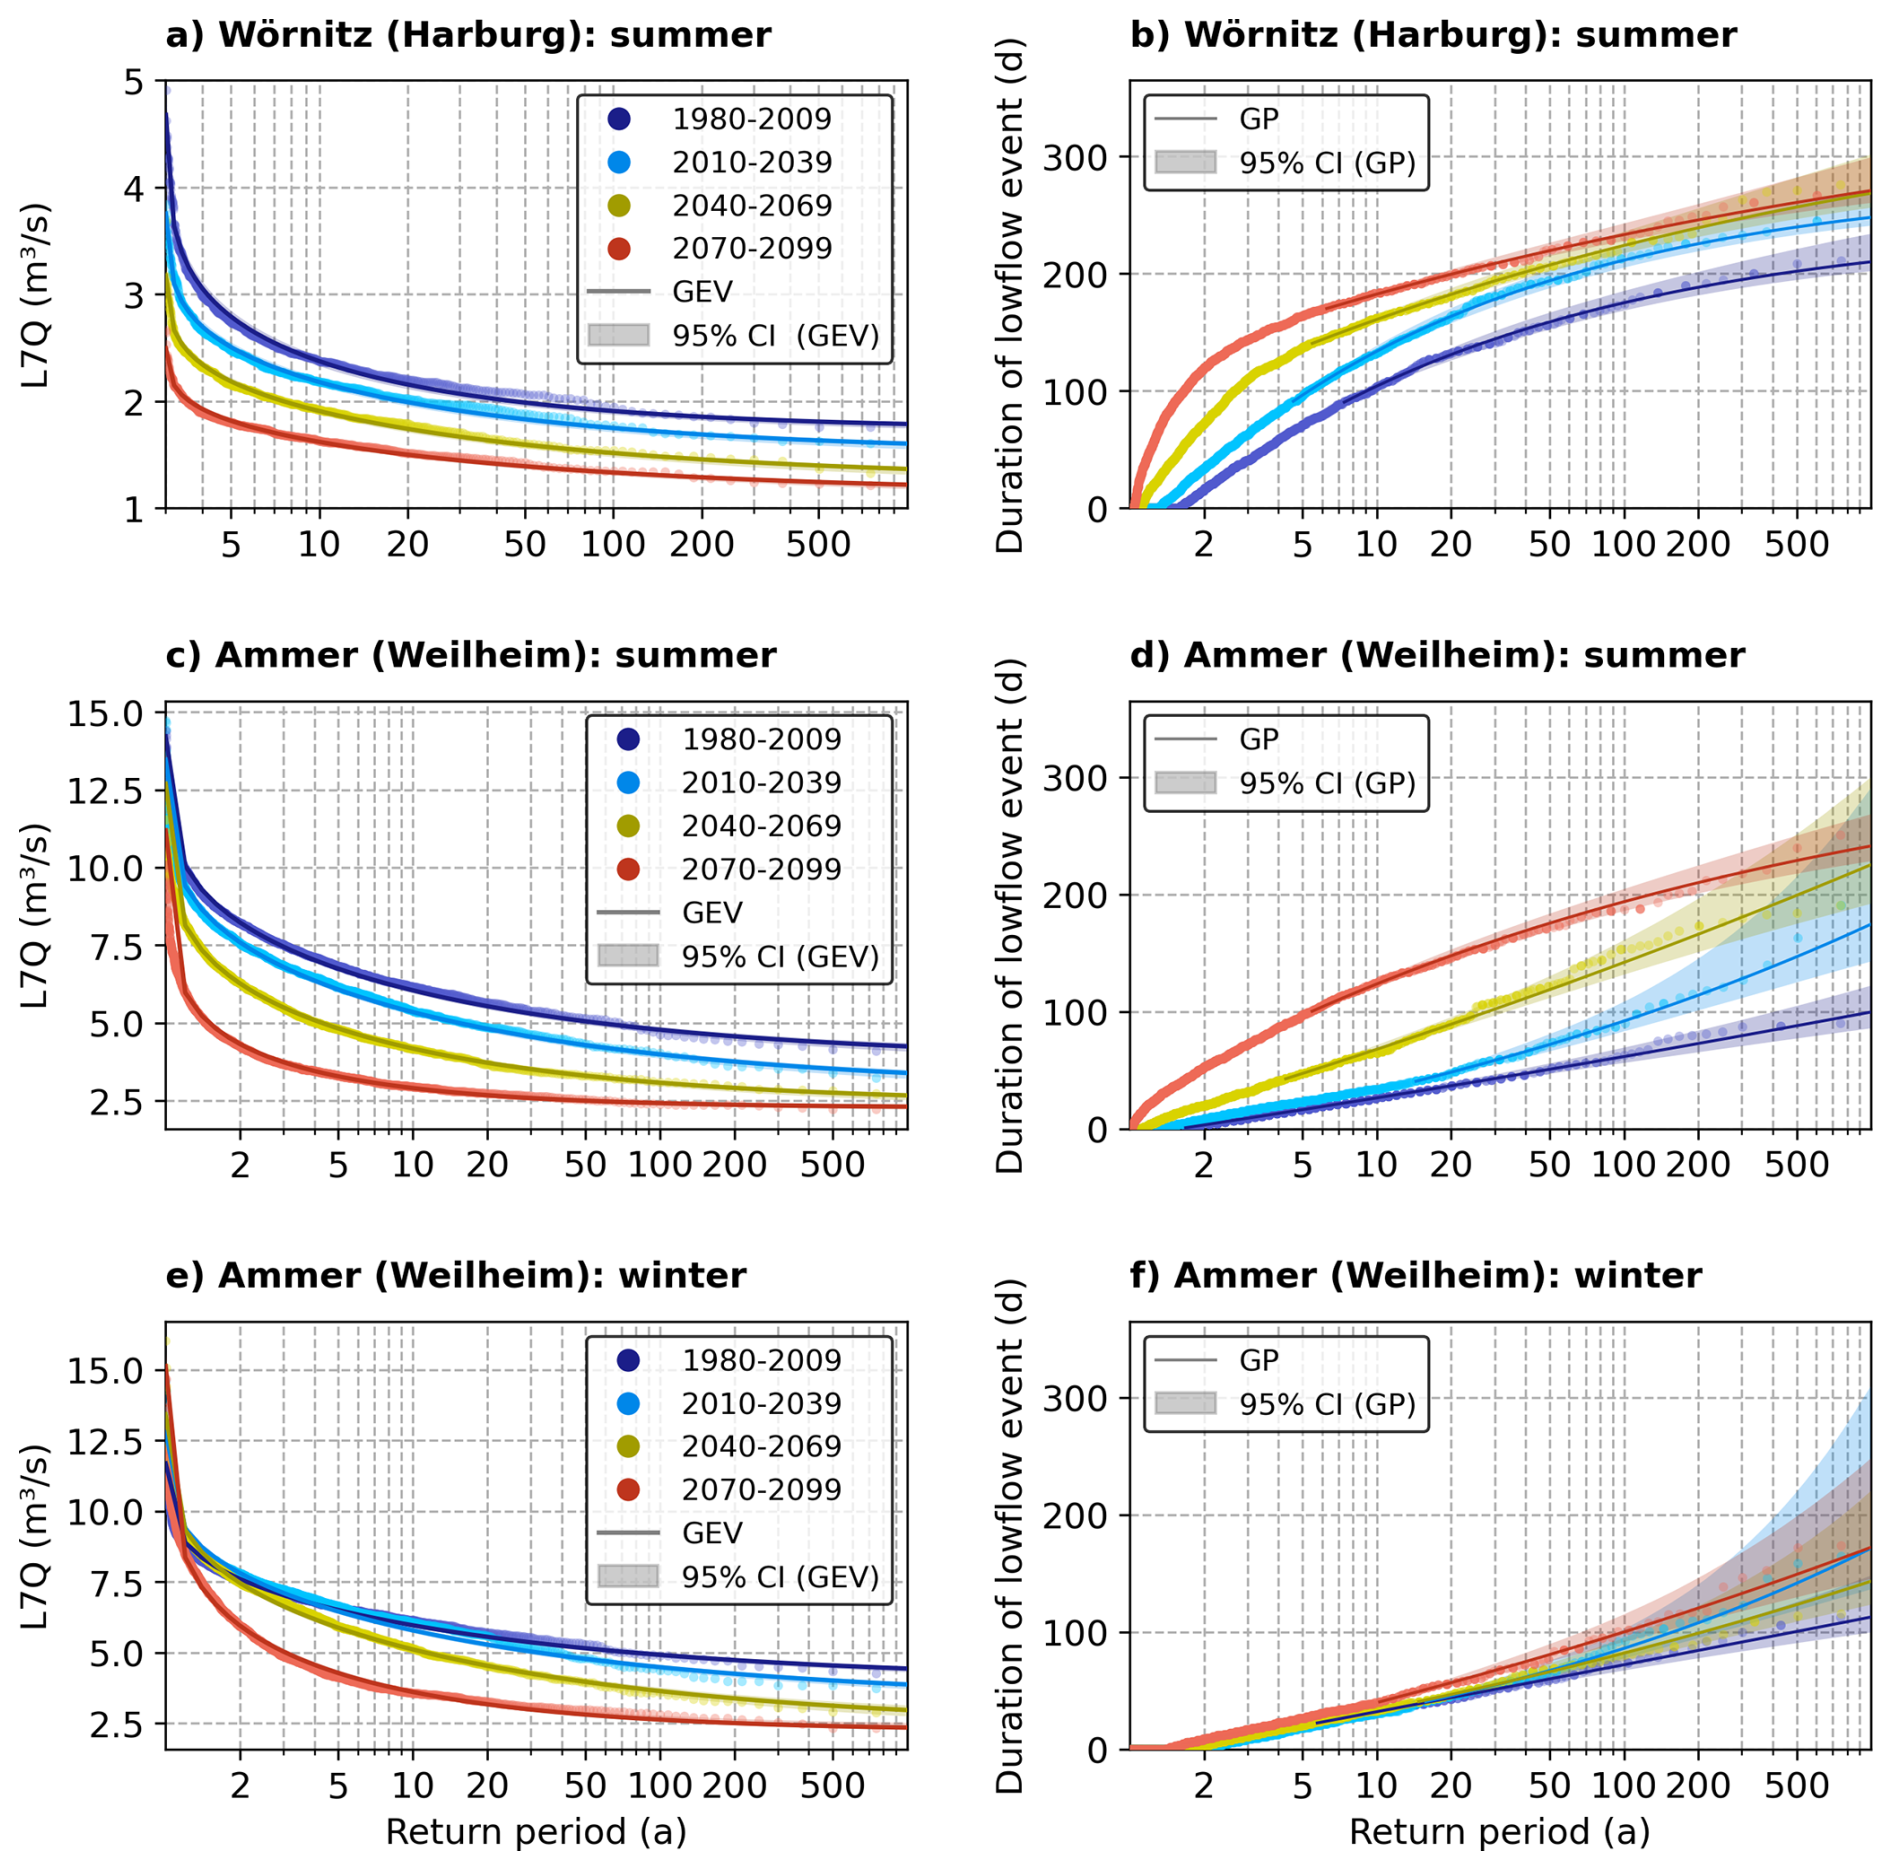
Figure 6Univariate return levels of 7 d low-flow discharge peaks L7Q (a, c, e) and event duration (b, d, f) for both study catchments. Per time period, all 50 members are pooled to a total of 1500 years. The coloured dots are plotted via Weibull plotting positions.
For the event duration, the GP distribution is applicable above a duration threshold, which varies over the catchments, seasons and time periods. The threshold is in the range of the respective 2 to 15 year return periods (see Fig. 6b, d, and f; where the line starts). Due to the sample size of the WaSiM-LE, the extreme value statistical evaluation shows relatively small uncertainties. The width of the confidence intervals depends on the sample size above the chosen threshold.
During summer, event durations are increasing in a warmer climate for both catchments. It is notable, that the GP distributions show a light tail (ξ<0) in the Wörnitz catchment, indicating that there is an upper limit for the duration of very rare events caused by the interruption of low flow events in the wet months of February and March (Fig. 5a). Three periods (CUR, NF, FF) show similar durations for very rare events above the 100 year return period (Fig. 6b). However, the moderate extremes up to 5 year events show a strong increase with warming.
In the Ammer catchment, the event durations increase across the different return periods (Fig. 6d), where three periods (REF, CUR, NF) show a slightly heavy tailed behaviour (ξ>0). With the strong warming until FF, the durations increase, but the distribution shifts towards a light tail. During winter, no clear changes are detected, only a tendency for longer events in the far future period.
The bivariate distribution of L7Q and event duration reveals a high dependence between both event characteristics during the summer season (Fig. 7). All possible realizations of bivariate 10 year and 100 year events are given by the grey isolines, where the black star marker represents the most likely combination. Hence, a typical 10 year summer low flow event in the Wörnitz catchment in the reference period (L7Q=2.44 m3 s−1; event duration = 95 d) is projected to occur every 5.2 a (CUR), 3.0 a (NF), and 1.7 a (FF). The typical 100 year event (L7Q=1.96 m3 s−1; event duration = 171 d) shifts to a 30 year (CUR), 17 year (NF), and 6 year (FF) event.
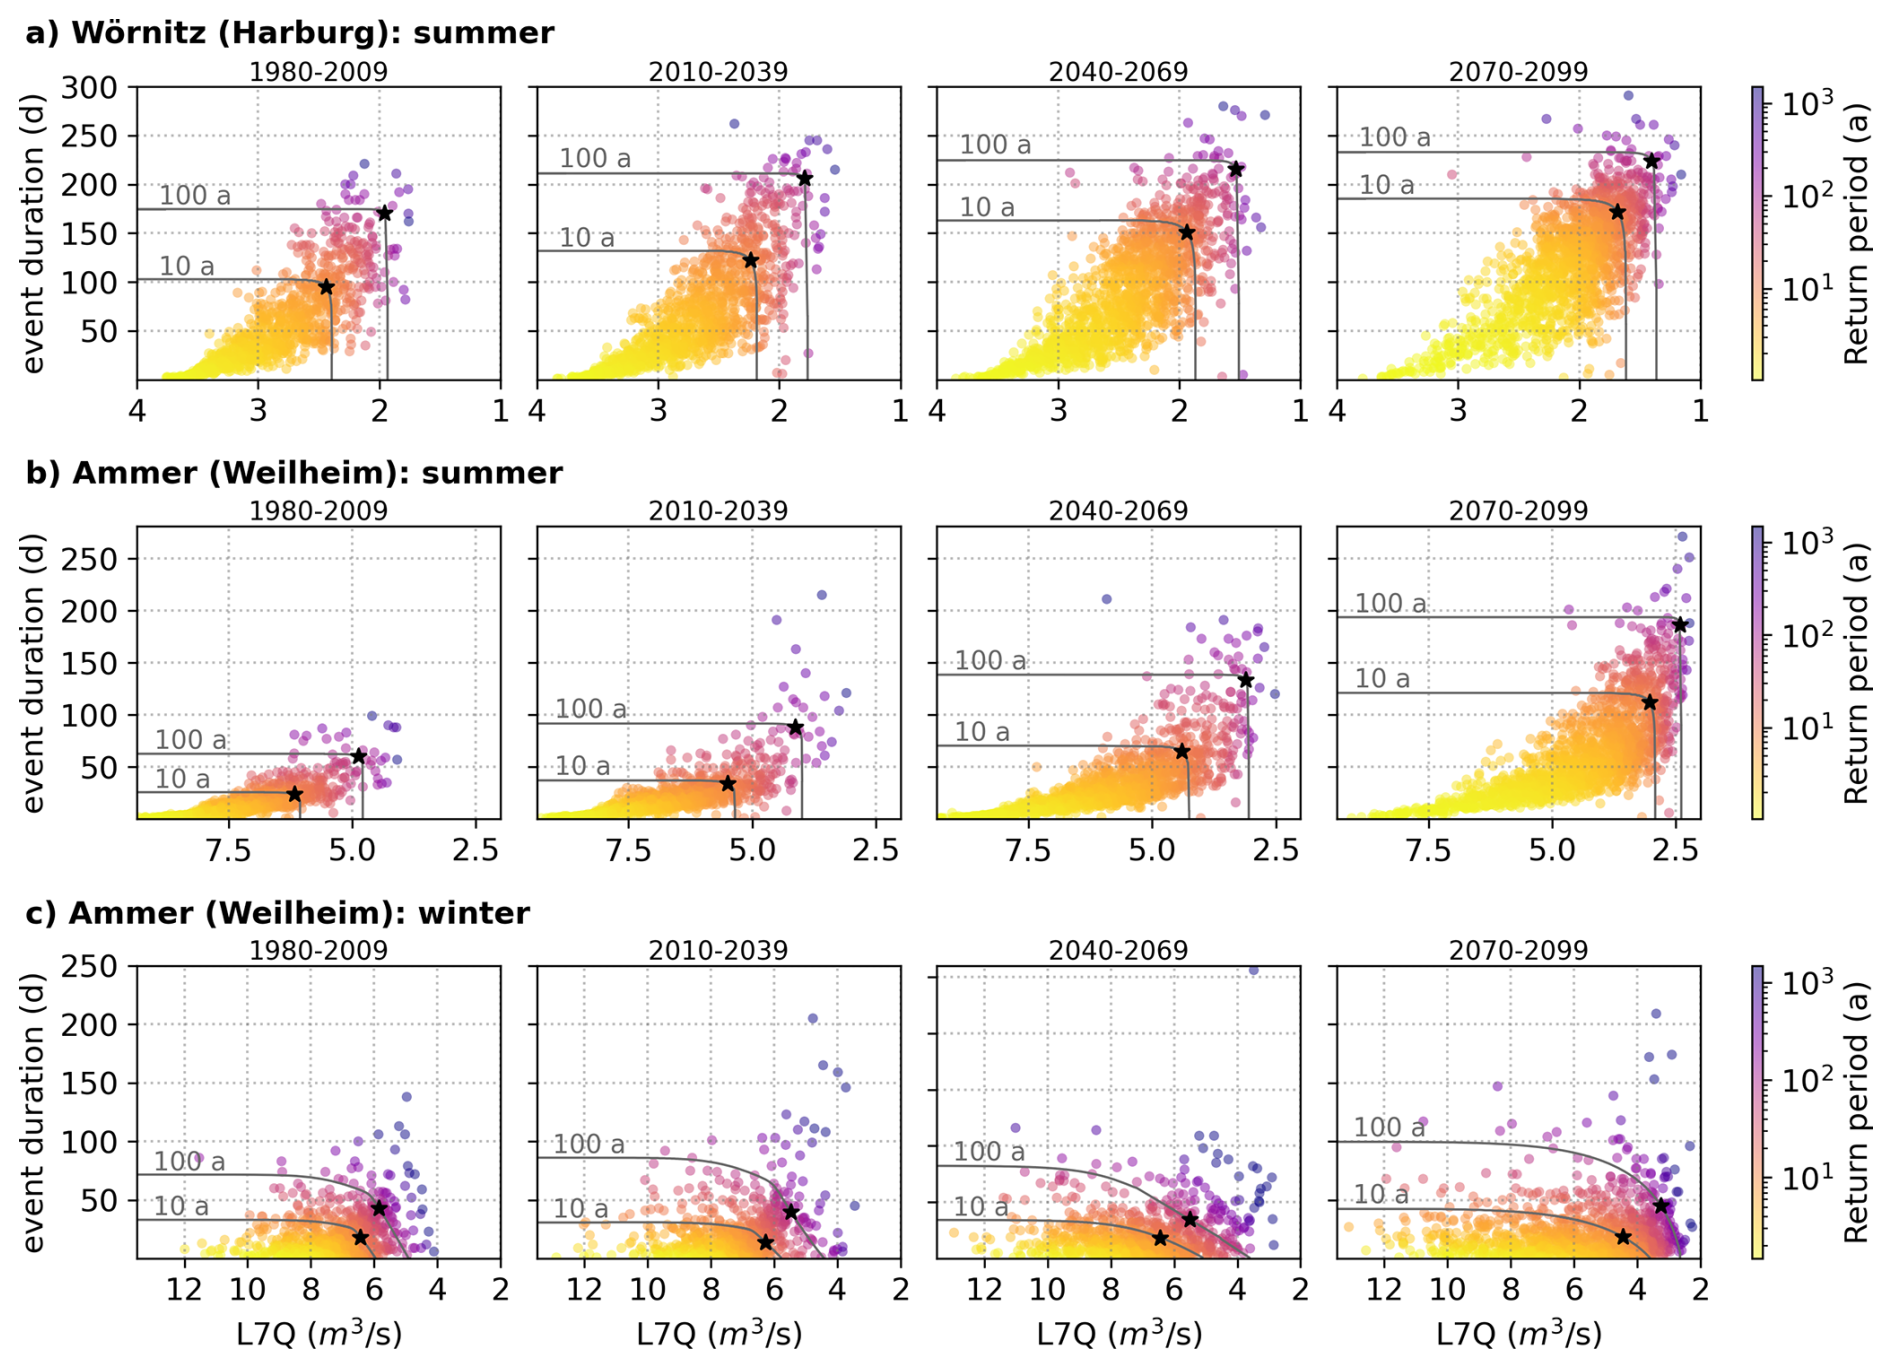
Figure 7Bivariate survival Kendall's return levels of event duration and L7Q. The grey isolines show the 10 year and 100 year return levels, where the black star marker represents the most likely combination of L7Q and event duration for the respective bivariate return periods. For a direct visual comparison of the changes in the isolines between the time periods, Fig. S6 is provided.
In the Ammer catchment, the projected changes during summer are even more drastic. The most probable 10 year event is characterized by a 7 d peak low flow of 6.2 m3 s−1 and a duration of 24 d. Those characteristics are reached every 6 years (CUR), 2.5 years (NF), and 1.3 years (FF). This indicates that a moderate extreme event of the reference period is projected to become the “new normal” until 2070–2099 under high greenhouse gas emissions. The 100 year event (L7Q=4.9 m3 s−1, event duration = 60 d) is altered to occur every 34 years (CUR), 8 years (NF), and 2.5 years (FF).
In the winter, the dependence between event intensity and duration is less pronounced. The most likely bivariate characteristics of a 10 year event during the reference period show similar values as the summerly 10 year event with 6.4 m3 s−1 7 d peak low flow and 18 d. The 100 year event is only slightly more intense (5.8 m3 s−1) extending to 43 d. Due to the differing dependence structure, the bivariate return level values deviate stronger from their univariate counterparts of the marginal distributions. Under warmer climate conditions, the 10 year (100 year) events of the reference period occur every 15 (92) years in the current climate, 12 (62) years in the near future, and 5 (20) in the far future, respectively.
4.4 Summer low flow
In a warmer climate, the results show more intense peak low flows, longer event durations and an extension of events towards later in the year for both study catchments. We refer those changes to the alterations of the hydroclimatic drivers (Fig. 2). In the Ammer catchment during the reference period, the rank correlation between the bivariate event rarity and hydroclimatic drivers (averaged over the summer half year) shows a weak correlation for temperature, moderate correlations for evaporation, precipitation, and the climatic water balance, and strong correlation for the soil moisture (Fig. 8b). The strength of the rank correlation is projected to increase in a warmer climate, with strong correlation for all drivers in the far future. We reason that events prolong in a warmer climate covering larger parts of the summer half year (Fig. 5b), which is why the dependence with the governing hydroclimatic drivers increases. Secondly, we find an increase of the autocorrelation of L7Q comparing the previous and following summer season (Fig. 9b).
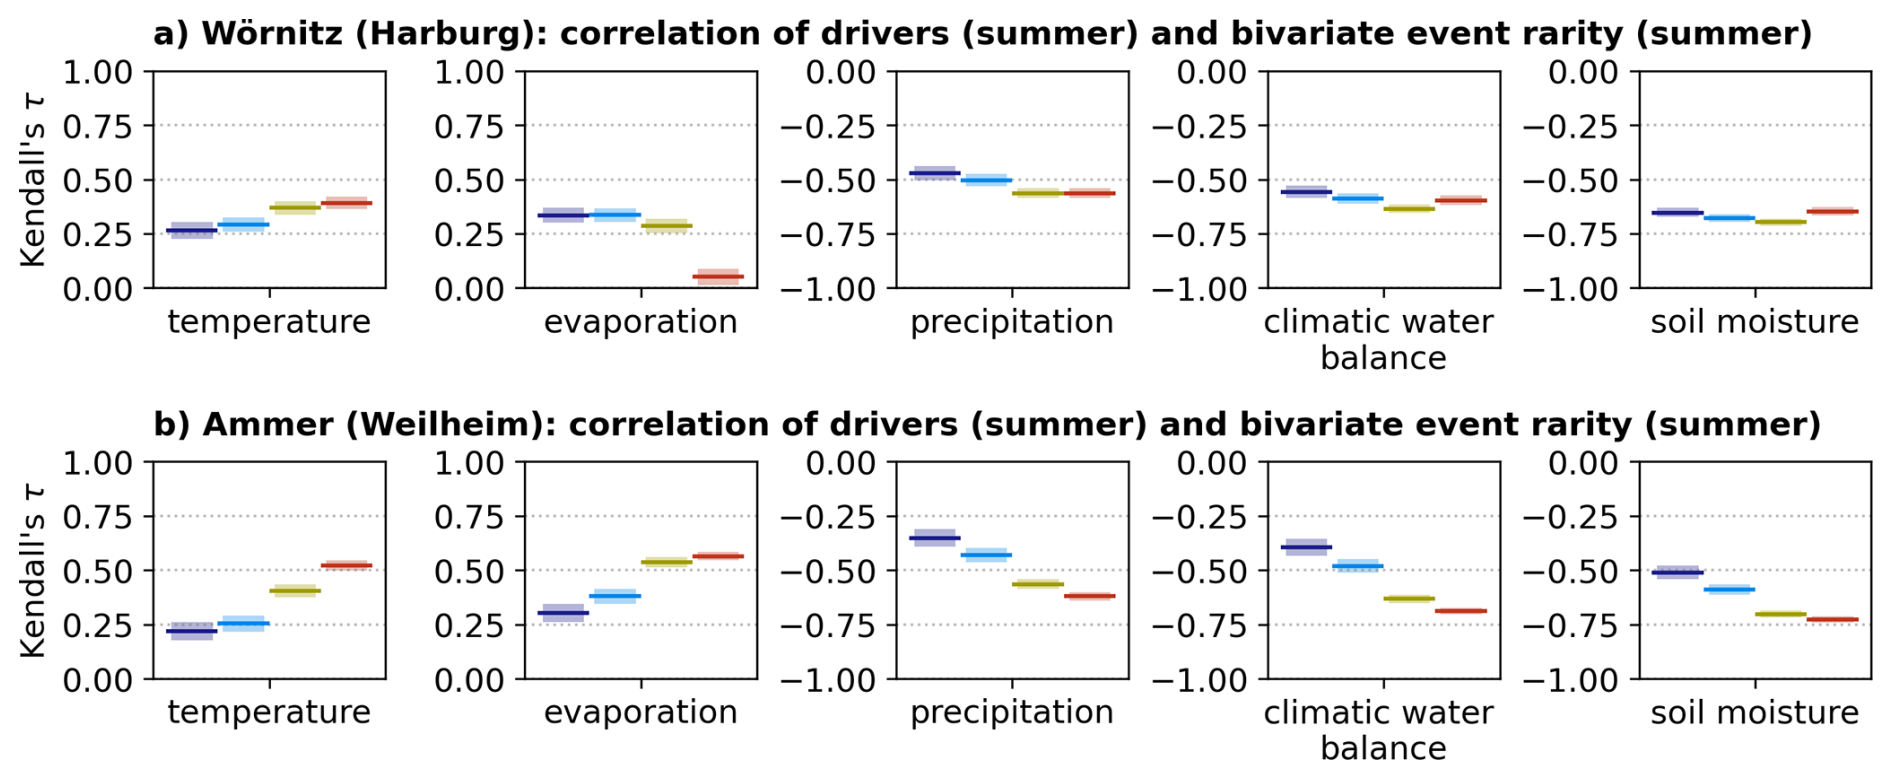
Figure 8Rank correlation between climatic and hydrological drivers and the bivariate event rarity in the summer half year for the (a) Wörnitz catchment and (b) Ammer catchment. The colours refer to the respective time periods as in the previous Figs. 2, 4, and 6. Per time period, all 50 members are pooled to a total of 1500 years. Drivers are averaged over the summer half year. The climatic water balance is defined as precipitation minus potential evaporation. The transparent ranges provide 95 % confidence intervals for Kendall's τ.
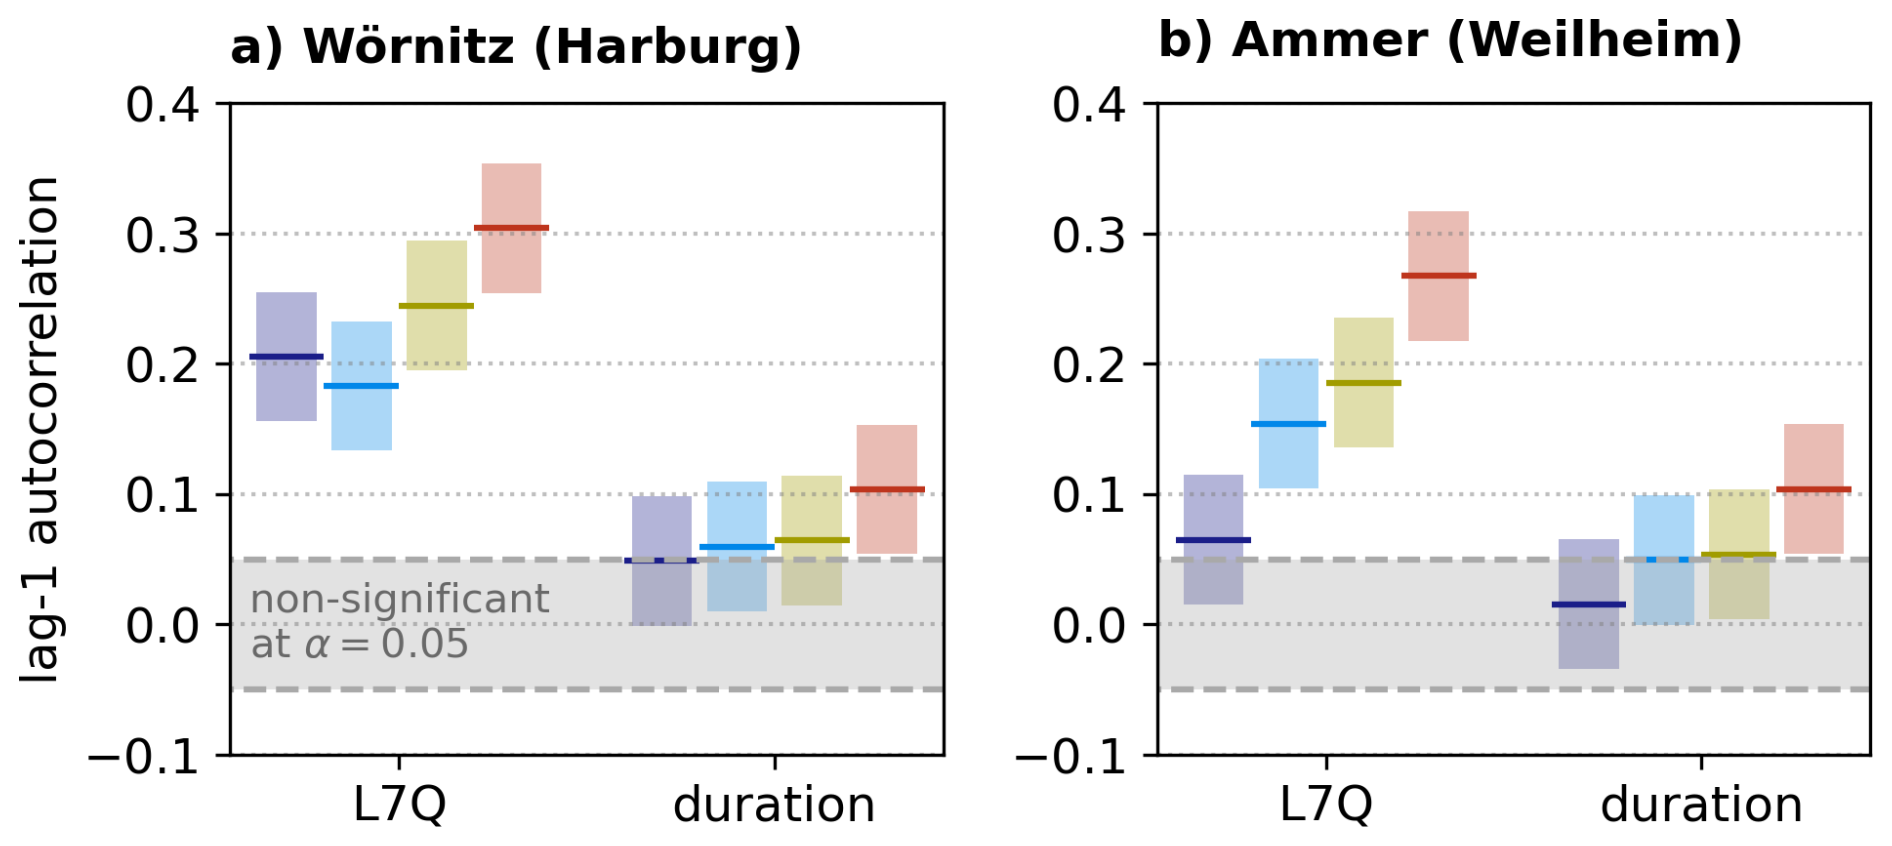
Figure 9Lag-1-autocorrelation for L7Q and low flow duration in the summer half year for the (a) Wörnitz catchment and (b) Ammer catchment. The colours refer to the respective time periods as in the previous Figs. 2, 4, and 6. Per time period, all 50 members are pooled to a total of 1500 years. The lag relates to the previous summer half year. The coloured transparent ranges provide 95 % confidence intervals for the autocorrelation, while the grey transparent range represents no significant autocorrelation (α=0.05).
This indicates that the pre-conditions of the previous year gain influence on the conditions in the following year with the potential for multi-year river droughts highlighting the importance of lagged effects under climate change for the assessment of drought risks (Bevacqua et al., 2024). Furthermore, we find an increase of inter-driver dependence, notably for temperature and precipitation in both catchments. Figure 10 illustrates that hotter (colder) summers are more likely to be drier (wetter) in the future periods. This stronger dependence has also been found for compound hot and dry summers during June, July, and August over Europe (Felsche et al., 2024) propagating to soil moisture droughts (Boehnisch et al., 2025).
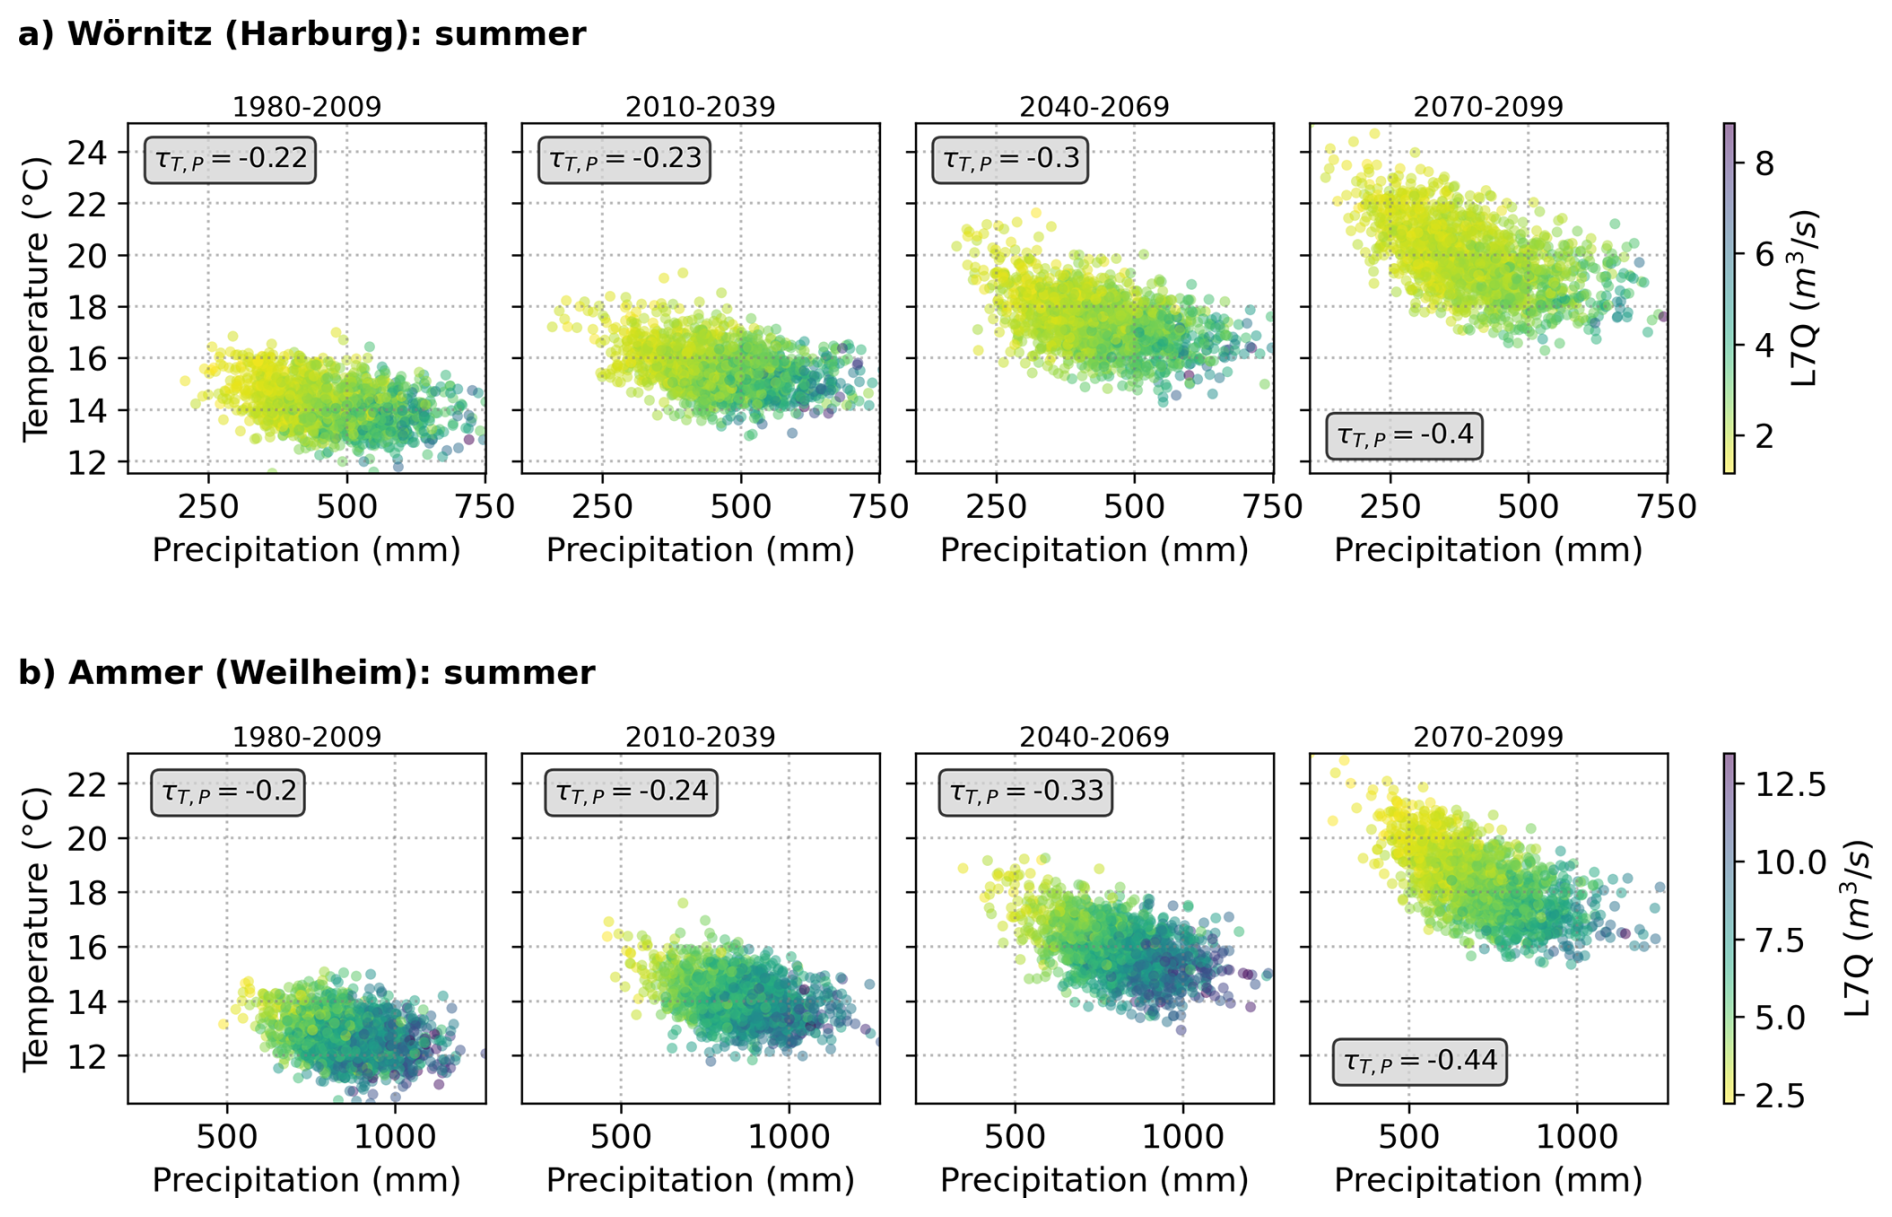
Figure 10Bivariate scatter plots of summer (May to October) temperature and precipitation. The scatter plot shows one dot per year, adding up to a total of 1500 dots pooling the 50 members. The color scale connects the climatic conditions to the respective summer L7Q.
In the Wörnitz catchment, a positive autocorrelation of L7Q is already significant for the reference climate and is projected to further increase in the near and far future (Fig. 9a). We also find increases of the dependence between the bivariate event rarity and hydroclimatic drivers (Fig. 8a), where the changes are however less pronounced than in the Ammer catchment. The rank correlation of bivariate event rarity and evaporation drops from a moderate level in the reference and current climate to almost zero in the far future (Fig. 8a). We argue that under the high emission scenario, the water availability for evaporation is limited especially during dry summers, where the potential evaporation largely exceeds the precipitation. This shift is illustrated by Fig. 11 within the Budyko framework. Here, we find that both catchments move along the Budyko curve, towards higher evaporative fractions. In the far future, the climate aridity of the Wörnitz catchment shows a spread around 1.0, indicating that it is projected to shift to arid conditions until the far future.
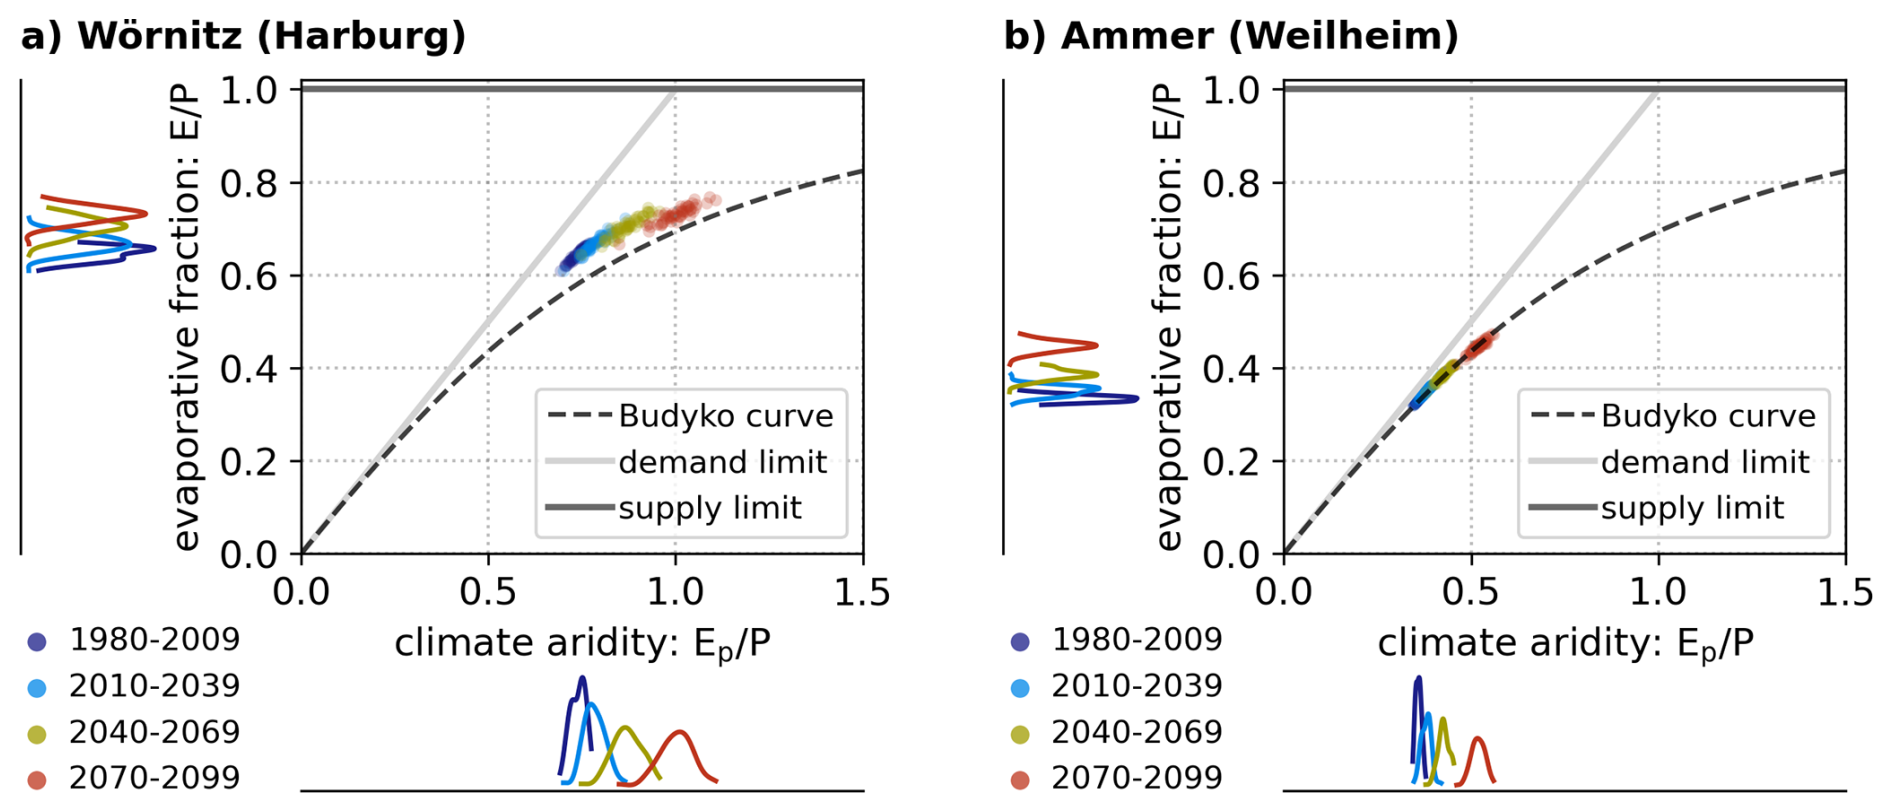
Figure 11Evaporative fractions in the Budyko framework of both study catchments for four climate periods. Each dot refers to the average conditions of one member per 30 year climate period, where the spread of the dots represents the range of internal climate variability between the 50 members.
4.5 Winter low flow
River droughts in cold climates can be caused by different drivers (van Loon et al., 2015). Van Loon and van Lanen (2012) have identified eight categories, where three subtypes of cold snow season droughts are governed by cold temperature anomalies. Cold temperatures can either induce an earlier onset of the snow season, or extend the season with later snowmelt. In mild winter climates, a cold anomaly can affect the water availability during the whole season, as precipitation falls as snow preventing from infiltration to the groundwater and runoff to the river (van Loon et al., 2015). Warm snow season droughts are governed by temperature and precipitation. In harsh climates, an earlier than normal snowmelt peak can induce a drought afterwards. In milder winter climates, joint negative snowmelt anomalies and rainfall deficit can cause low flows. Snowmelt droughts and glaciermelt droughts are induced by negative anomalies of meltflow during the respective seasons. Lastly, a rain-to-snow season drought develops as rainfall deficit during the summer and autumn, which is then acerbated by a rather sudden temperature drop during winter, which does not allow the system to recover (van Loon et al., 2015). Compared to the investigated catchments in cold climates by van Loon et al. (2015), the reference climate of the Ammer would be a mild winter climate with a mean annual air temperature of 7 °C without glacier influence. Even though the catchment is considered a mild winter climate compared to cold climates, the seasonality of low flows and their intensity shows that winter low flows dominate in the reference climate (Figs. 4 and 6). However, there is a shift towards dominating summer events in the future climates. Such shifts are also projected for nivo-pluvial catchments in Austria under RCP8.5 until end of the century (Hanus et al., 2021).
Hence, during the reference climate, the Ammer catchment is mostly prone to rain-to-snow season droughts, cold snow season droughts with negative temperature anomalies during the winter season, and warm snow season droughts with joint negative snowmelt anomalies and rainfall deficit. Due to the mix of potential drivers for these different river drought types, a correlation analysis between hydroclimatic drivers averaged over the whole winter season and the drought metric will be less conclusive than for the summer events (Haslinger et al., 2014). As the dependence structure between L7Q and event duration is weaker in winter than in summer (see Fig. 7b and c), a correlation analysis is conducted separately for L7Q and event duration instead of a single analysis for the bivariate event rarity.
There, a weak positive rank correlation between temperature and L7Q as well as precipitation and L7Q, and a negative correlation between temperature and event duration as well as precipitation and event duration in the reference climate indicate that there is a tendency for colder and drier winters intensifying and prolonging river droughts (Fig. 12). The sign of correlation is projected to switch in the future periods, where warmer winters weakly correlate with more extreme drought events. We interpret this as a projected decline of cold snow season droughts in a warmer climate. Furthermore, the same analysis for the hydroclimatic drivers of the antecedent summer (Fig. 13) reveals that there is a strong projected increase in the correlation of all antecedent drivers and the following winter L7Q. We refer this behaviour to a higher number of L7Q events, which are preconditioned by intense summer river droughts. Either these river droughts start in summer and extend over the winter, so that the longer part is in the winter season and the L7Q event is counted as a “winter L7Q event”. Or an intense summer drought extends into the winter, with the longer part in the summer, which is why it would not be counted as a “winter event”. However, this event can be interrupted by a wet spell, which increases the L7Q above the ML7Q, followed by another dry spell, causing the discharge to decrease below the ML7Q as the system has not recovered yet. Then, the second part of the event counts as “winter event”. Both described types of the river drought progressions explain the increasing importance of antecedent summer conditions for the winter L7Q. However, for the winter event duration the antecedent driver conditions are weakly correlated (Fig. 13b). There, the moisture conditions during winter govern the event duration (Fig. 12b). Generally, winter event durations stay shorter than their summerly counterparts. In the reference and current climate, snowmelt and rainfall lead to a recovery until April for almost all years (see Figs. 2 and 5c). This also applies for the future climates, where the combination of higher rainfall and low evaporation ends eventual drought events in April (see Figs. 2 and 5c).
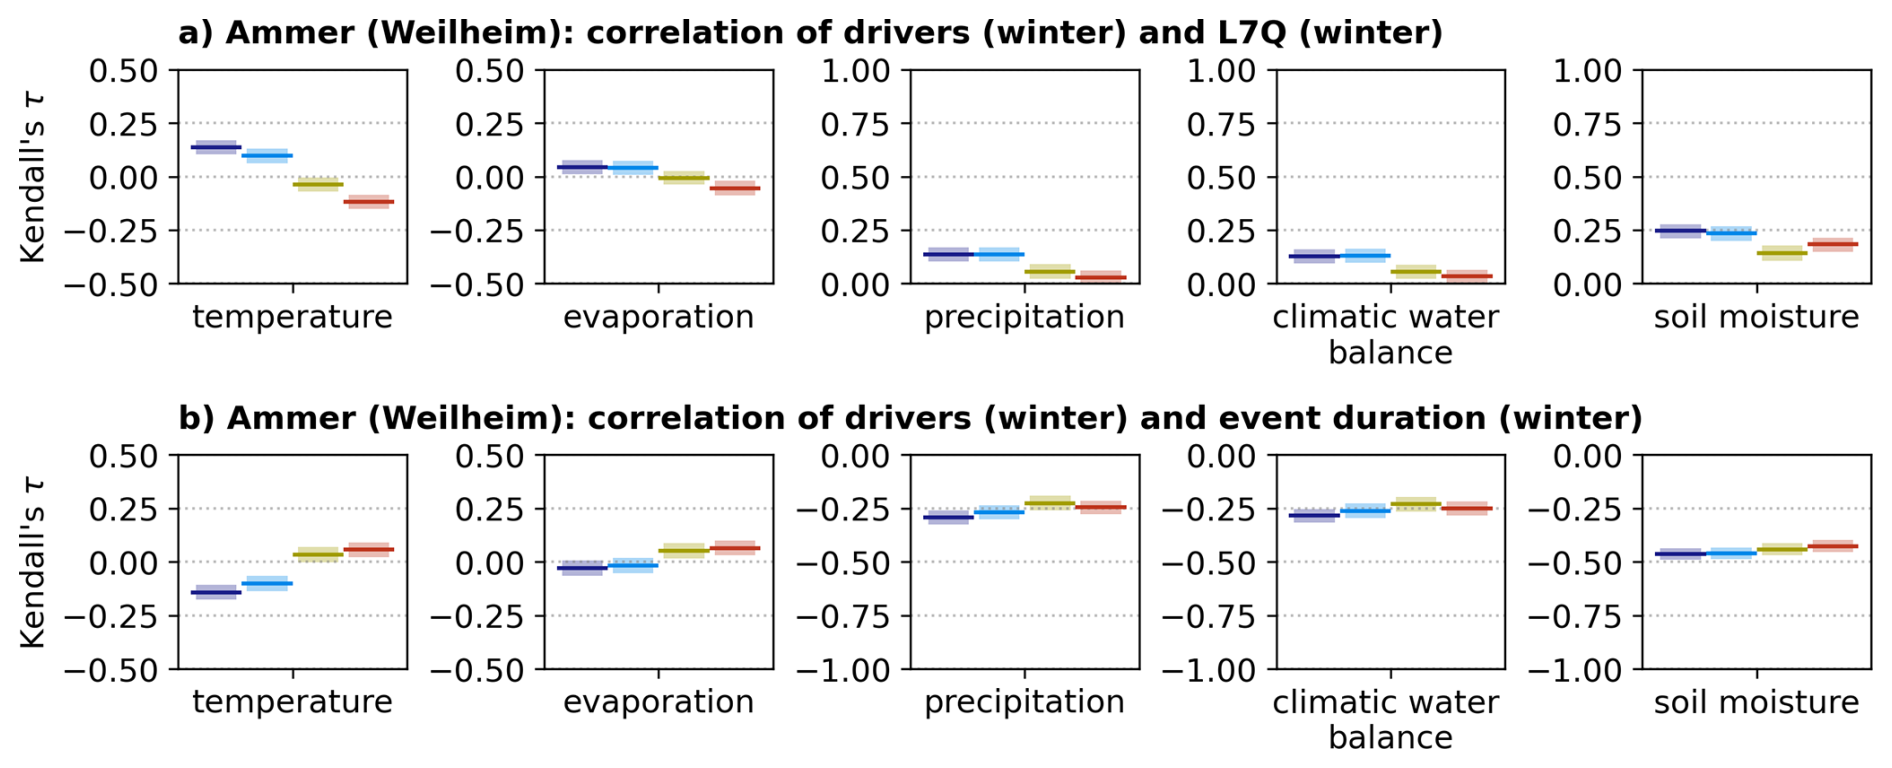
Figure 12Kendall's rank correlation between winter climatic drivers and (a) winter low-flow intensity L7Q, as well as between winter climatic drivers and (b) winter low-flow event duration. The colours refer to the respective time periods as in the previous Figs. 2, 4, and 6. Per time period, all 50 members are pooled to a total of 1500 years. The transparent ranges provide 95 % confidence intervals for Kendall's τ.
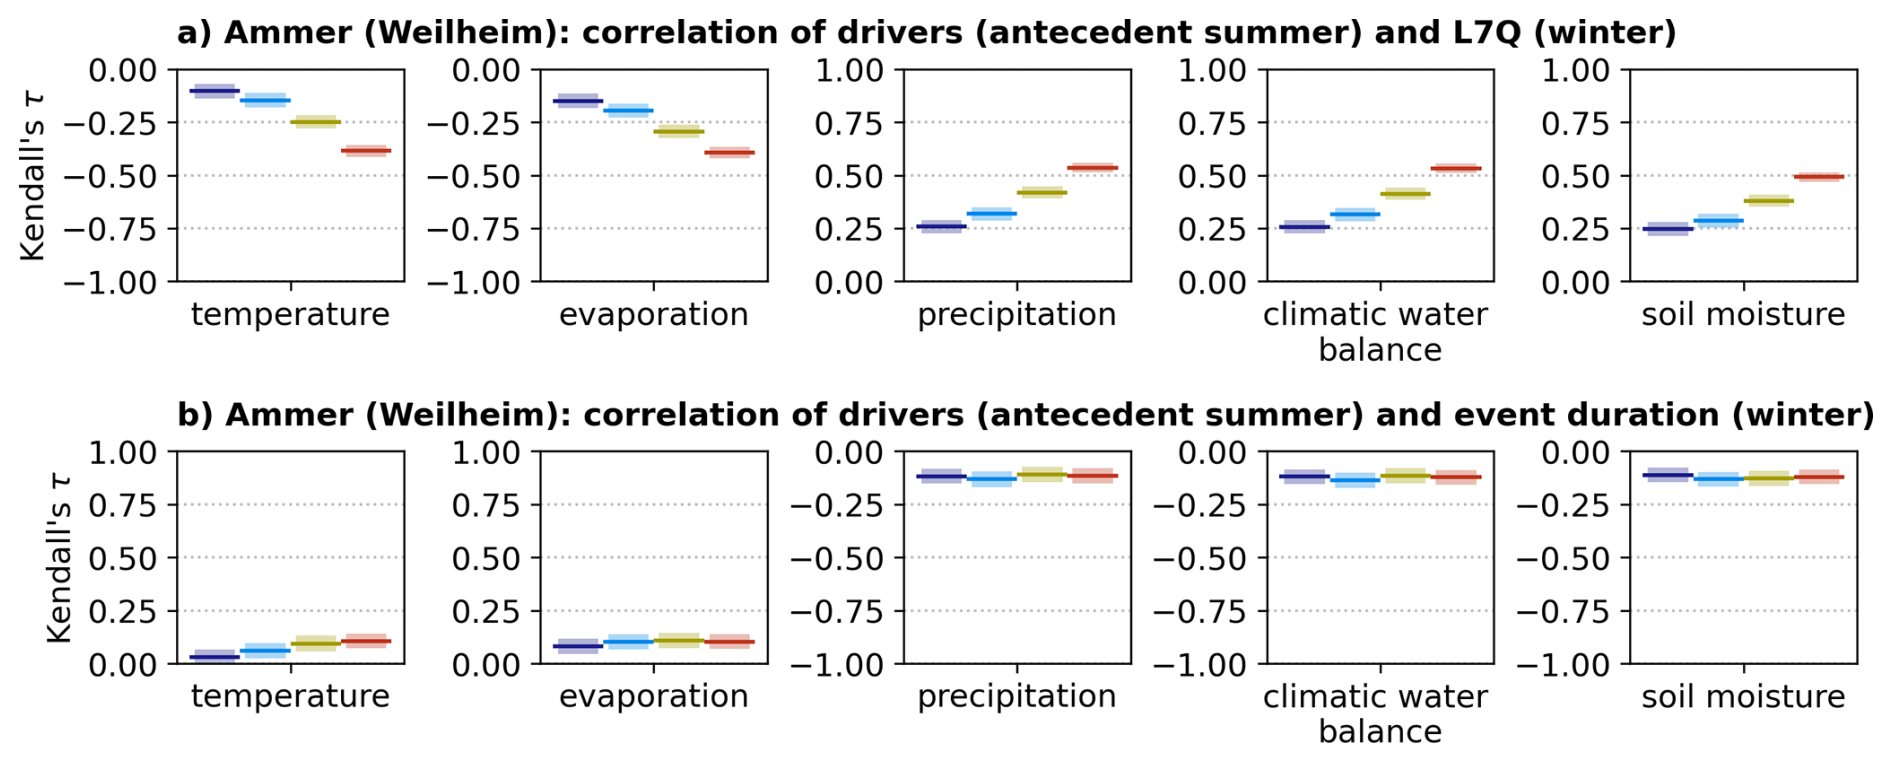
Figure 13Kendall's rank correlation between climatic drivers of the antecedent summer and (a) winter low-flow intensity L7Q, as well as between climatic drivers of the antecedent summer and (b) winter low-flow event duration. The colours refer to the respective time periods as in the previous Figs. 2, 4, and 6. Per time period, all 50 members are pooled to a total of 1500 years. The transparent ranges provide 95 % confidence intervals for Kendall's τ.
5.1 Comparison to existing scientific literature
Mauser et al. (2008) use a statistical climate simulator to generate climate projections under the medium-emission scenario A1B driving the physically-based hydrological model PROMET in the catchments of the Upper Danube. Comparing 1971–2003 to 2011–2060, they find a strong intensification of river low flows, where 50 year peak low flow is less than half of the reference until 2060. Huang et al. (2015) apply a multi-model RCM ensemble featuring 16 simulations (12 simulations from the project ENSEMBLES and 4 additional simulations) under the medium-emission scenario A1B to drive the hydrological model SWIM over central Europe. For the catchment of the Upper Danube, they find that the 16 simulations do not agree on changes in 50 year river droughts until 2021–2060 and 2061–2100. However, more than 60 % of the simulations suggest an intensification of river droughts in the non-alpine catchments in the far future. Building on the 12-member multi-model ensemble from the project ENSEMBLES under the A1B emission scenario, Forzieri et al. (2014) apply the hydrological model LISFLOOD to investigate climate change effects on the annual minimum flow of 446 river gauges in Europe. Across Europe, they find a pronounced spatial gradient for 20 year low flow, with intensification of river droughts in the south and west and less extreme peak low flow in the north to north-east. For the catchments of the Upper Danube, increases and decreases of river droughts are projected, with the tendencies for intensification in the southern parts.
Stanzel and Kling (2018) compare the effect of the driving climate of the ENSEMBLES project (21 simulations) and the EURO-CORDEX ensemble (16 simulations) under medium (RCP4.5) and high (RCP8.5) emission scenarios in the Upper Danube catchment. They apply the conceptual hydrological model COSERO and find no significant changes in the 10th percentile of streamflow until 2021–2050. In the far future of 2071–2100, they report a decrease under RCP8.5 and based on the ENSEMBLES simulations, while no changes are simulated for RCP4.5.
Probst and Mauser (2022) select three simulations from EURO-CORDEX under RCP2.6 and RCP8.5 to drive the hydrological model PROMET. They find less extreme low flows in the future for the Upper Danube (gauge Achleiten) for all scenarios, where the gauge in Achleiten drains the whole Upper Danube catchment and is also strongly governed by the Inn. Hence, the comparability to the small catchments in this study is limited.
Marx et al. (2018) devise a multi-model study over Europe featuring five global climate models under three emission scenarios and three hydrological models equalling to 45 hydrological simulations. They analyse the 10th percentile of streamflow as low flow for the future warming levels of +1.5, +2, and +3 K. Compared to the baseline of 1971–2000, they find no significant changes in low flow in the Upper Danube for the catchments north of the Danube, while the projections suggest less extreme river droughts in alpine and pre-alpine river catchments south of the Danube.
Kiesel et al. (2019) apply the hydrological model Soil and Water Assessment Tool (SWAT) driven by 16 climate projections from EURO-CORDEX and explore different bias adjustment approaches. They find a 32 % decrease of the L7Q in the Ammer catchment until the end of the century under RCP8.5 compared to 2010. They also detect the shift of the dominating low flow regime from winter low flow to summer low flow, however occurring between the 2050s and the 2090s.
In sum, the existing scientific literature on river droughts in the Upper Danube area is ambiguous as the review of Piniewski et al. (2022) follows for the whole of central Europe. Our study tends to show a rather strong signal of low flow intensification compared to other studies in the Upper Danube. However, the selection of river catchments, low flow metrics, the differentiation between winter and summer low flow, driving climate models, emissions scenarios, time periods, and hydrological models limits the comparability of the studies.
5.2 Limitations and benefits of the hydrological SMILE for river drought assessments
Uncertainties in future climate projections stem from three specific sources: (1) climate model uncertainty, (2) emission scenario uncertainty, and (3) internal climate variability (ICV; Lehner et al., 2020). For projections of streamflow, further sources of uncertainty from add to the overall uncertainty, such as the bias adjustment (Willkofer et al., 2018), hydrological model calibration (Herrera et al., 2022), and the model uncertainty of hydrological models (Thébault et al., 2024). In our study, we apply only one climate model under one emission scenario, one bias adjustment methodology, one hydrological model calibrated by one algorithm on one calibration period. However, the SMILE as driving climate allows us to quantify ICV (Deser et al., 2020; Maher et al., 2021) and its large sample size enables a robust assessment of extreme low flow events.
The RCP 8.5 emission scenario represents high-emission scenario (Riahi et al., 2011). Following Hausfather and Peters (2020) we would recommend to see this scenario as a worst-case estimate, rather than the most likely scenario. While the RCP 8.5 tracks the global cumulative emissions well until 2020 (Schwalm et al., 2020), the IPCC AR6 report stated that the likelihood of such a high-emission scenario is considered low due to recent developments in the energy sector (Chen et al., 2021). Sarofim et al. (2024) still stress the utility of high-emission scenarios to assess low-probability/high-impact futures and to represent the climate of the 22nd century. In consequence, it is the only scenario to allow for an analysis of extreme event dynamics for the full range of global warming levels.
Compared to the multi-model ensemble of EURO-CORDEX under RCP8.5, the CRCM5-LE shows stronger signals of drying and increasing temperatures during summer. During winter, the CRCM5 projects a stronger increase of precipitation, where the temperature is close to the mean of the 22 EURO-CORDEX models (von Trentini et al., 2019). Hence, the driving climate of the CRCM5-LE induces a stronger intensification of summer low flow events and a less intense increase of winter low flows in comparison to the EURO-CORDEX. In turn, EURO-CORDEX simulations are found to underestimate the historical and projected warming compared to their driving global climate models of the CMIP5 phase (Schumacher et al., 2024). Furthermore, CMIP6 models have a wider range of equilibrium climate sensitivity than CMIP5 also resulting in a wider range of warming responses (Meehl et al., 2020).
With their multi-model study, Marx et al. (2018) can assess the contribution of the driving climate and the hydrological modelling to the overall uncertainty within low flows. They find a dominating contribution of the driving climate in large parts of central Europe, whereas hydrological modelling governs uncertainty in the (pre-)alpine catchments. Parajka et al. (2016) differentiate between summer low flow and winter low flow regimes for Austrian catchments. They find that both low flow regimes show a varying sensitivity to different sources of uncertainty. Investigating different climate scenarios, calibration periods, and calibration objective functions, they find that the driving climate is the dominating source of uncertainty for summer low flows contributing 76 % of overall uncertainty. For winter low flows, the driving climate is also the largest contributor (26 %), accompanied by the selection of the calibration period (13 %) and the objective function (13 %). Willkofer et al. (2018) show that the choice of the bias adjustment method has a moderate effect on projections of low flow, which ranges up to 10 % for a 2 year low flow.
Troin et al. (2022) assess how the hydrological model structure in the representation of potential evapotranspiration, snow dynamics, vertical and lateral flow can affect low flow simulations. They find that the lateral and vertical flow schemes are most important sources of uncertainty for low flows. This is because aquifers contribute to the streamflow via the baseflow (Beck et al., 2013), which is particularly relevant during periods of low precipitation and low surface runoff. As the upward movement of groundwater can influence soil-moisture-climate interactions, depending on the soil type (Vogelbacher et al., 2024; Shokri and Salvucci, 2011), integrating information on soil characteristics, groundwater level, as well as capillary rise and its contribution to soil moisture within the hydro-climatological model chain is particularly valuable for future climate projections. Shallow groundwater tables can enhance soil moisture storage, potentially mitigating the intensity and frequency of droughts (Van Loon and Van Lanen, 2012; Van Loon et al., 2024). In the setup of the study, the hydrological model WaSiM is able to represent the aforementioned processes, as it captures infiltration, surface runoff and water flow in the unsaturated zone using the Richards equation as well as deep percolation and capillary rise of water from the saturated to the unsaturated zone (Schulla, 2021). Lateral groundwater flow is represented by calculating the baseflow conceptually based on the saturated hydraulic conductivity, elevation of the water table and the soil surface (Neukum and Azzam, 2012).
In addition, changes in land cover and land use may further influence these dynamical interactions between groundwater, soil moisture and climate, whereby our model setup assumes static land use and land cover. Teuling et al. (2010) analyse the differing responses of grasslands and forests, emphasizing the mitigating effects of forests on the persistence of increased temperatures for long-lasting events. Zipper et al. (2019) suggest that land use and land cover changes after the Soviet Union collapse and European Union formation might have induced drying in the Mediterranean and Eastern Europe regions. For a detailed analysis of groundwater, soil moisture, and climate interactions, a fully coupled model chain (e.g. Fersch et al., 2020; Maxwell and Kollet, 2008; Naz et al., 2023; Rummler et al., 2022) as well as dynamic scenarios of land cover and land use (Huber García et al., 2018) would be beneficial. However, in this study, the climate simulations by the CRCM5-LE drive the hydrological model WaSiM without feedback from the hydrological conditions into the climate modelling. Given the scope of this analysis on large ensembles, a fully coupled model chain featuring dynamic land use and land cover was not incorporated. Nevertheless, we emphasize potential changes in land use and land cover as well as the potential contribution of groundwater to soil moisture and the interaction with the climate in the interpretation of the results.
In addition to the sources of uncertainty of the scenario uncertainty and various components of the model uncertainty of the climate models and hydrological models discussed above, ICV affects future climate and streamflow projections. Lehner et al. (2020) compare the contribution of internal variability to overall uncertainty for mean temperature and mean precipitation globally and for different regions. They demonstrate that ICV influences projections of precipitation more than of temperature and that it can be the dominating source of uncertainty for small regions and local assessments. For regional to local extreme events (Poschlod, 2022) and compound events (Bevacqua et al., 2023; Lehner, 2024), the contribution of ICV is even higher than for mean values. The propagation of this uncertainty source to hydrology is less investigated. Using the WaSiM-LE, Willkofer et al. (2024) report a range of −67 % (−51 %) to +171 % (+91 %), when estimating 100 year flood peaks in 98 catchments in central Europe based on 30 (100) years. Also based on a hydrological SMILE, Faghih and Brissette (2023) confirm the strong influence of ICV on flood projections under climate change for 133 catchments across the eastern and north-eastern United States. Further, they emphasize that floods in small catchments show a higher sensitivity to ICV than floods in large catchments. For future projections of low flow peaks, they also find a considerable influence of ICV, however with a more even sensitivity across catchment sizes.
In our study, we focus less on quantifying the ICV influence, but rather pool the 50 members of the hydro-SMILE to generate a robust database for analysing very rare and extreme low flows in terms of their univariate (Fig. 6) and bivariate (Fig. 7) characteristics. If we were to use only a single 30 year simulation per time period instead of the large ensemble, we would not be able to detect the climate change-induced changes as robustly. When resampling 30 years per time period with replacement for 100 times, the 100 year low flow intensities and duration are systematically underestimated (Fig. S7). The inner 90-percent-range of estimated 100 year L7Q spans from −21 % to +32 %, whereas uncertainty is larger with −62 % to +81 % for 100 year durations. While the “true” sign of change is detected, with the pooled ensemble representing the “truth”, only a small partition of the bootstrapped samples can reveal the significance of future changes. Also, for the bivariate return levels (Fig. 7) or trivariate assessments of temperature, precipitation and low flow (Fig. 10) the large sample size of the ensemble is paramount.
5.3 Implications of the results for the local hydrology and water management
The projected changes in river drought characteristics for the Wörnitz and Ammer rivers are expected to have substantial implications for the water availability. While both rivers are not contributing to public water supply, major shipping infrastructure or cooling of thermal powerplants, the projected river droughts would affect hydropower generation, agricultural irrigation, recreational activities, and riverine ecosystems, particularly in terms of water temperature and quality (FGG Donau, 2021; LfU, 2016; WWA Donauwörth, 2013). The drastic scale of the projected changes would put water management and adaptation planning under intense pressure to act. However, due to the reliance on a single combination of global climate model, regional climate model, and hydrological model, as well as a single emission scenario, the results are subject to considerable model and scenario uncertainty. Given that RCP8.5 represents the highest-emission scenario and that the CRCM5 is positioned within the hotter and drier range relative to the multi-model EURO-CORDEX ensemble, the projected drastic changes for the period 2070–2099 can be interpreted as a worst-case scenario by the end of the century. Nevertheless, significant alterations in river drought frequency and severity are projected for the period 2040–2069, corresponding to a global warming of slightly above 3 °C above preindustrial levels, which aligns with the middle-of-the-road SSP4.5 scenario for 2100. Hence, we argue that the low flow events that are simulated for the period 2040–2069 are in the range of possible events occurring until the end of the century. We recommend that water management and adaptation planning consider the projected intensity and duration of these rare events for a well-informed and anticipatory drought management.
Based on the above discussion, we do not recommend a hydro-SMILE as replacement of multi-model assessments, but for the focus on very rare events of multivariate extreme event properties. Laaha et al. (2016) suggest a three-pillar approach for the projections of low flow. They recommend extrapolation of observational trends, hydrological modelling driven by climate simulations under emission scenarios, and extrapolation of changing stochastic rainfall characteristics into the future combined with rainfall–runoff modelling. They consider the consistency between the three approaches as an indicator of the uncertainty of the future projections. Within their third pillar, they apply a stochastic rainfall generator to create an ensemble of 100 runs, which are intended to capture climate variability. We argue, that a process-based hydrological SMILE could either enrich the third pillar or form a separate fourth pillar, if there is a focus on very rare and extreme events or multivariate event characteristics.
We conclude that hydro-SMILEs are an important tool for the investigation of rare river droughts and complex event characteristics. As such events are most impactful, a hydro-SMILE, especially when based on a spatially explicit, process-based impact model, can also be used to design physically-plausible storylines of drought events (Shepherd, 2019; Sillmann et al., 2021). Many studies only analyse moderate extreme levels of peak low flow, which might hide climate change induced alterations of the low flow. Hence, we recommend to distinguish between summer low flow and winter low flow, as rainfall-driven and melt-driven catchments show distinct reactions to climate change (Brunner et al., 2019b). A low flow typology could be applied to even better disentangle the effects of the climatic and hydrological drivers on different types of low flow genesis (Brunner et al., 2022). Further we suggest to analyse the seasonality, low flow duration, or bivariate return levels of peak flow and duration. They show a highly varying degree of sensitivity to climate change alterations, but are relevant for the water management. Climate change projections of these characteristics can inform decision-makers and adaptation planners for the dimensioning of reservoirs, renaturation of rivers, and regulations of groundwater and surface water withdrawal.
Given the high-emission scenario and strong warming in the CRCM5, the projected drastic changes in river droughts may be interpreted as a worst-case scenario. However, using global warming levels as reference, the projected local changes can be linked to global emissions. The projected climate of 2040–2069 corresponds to a global warming of slightly more than 3 °C above pre-industrial levels. Hence, the projected river drought events for the period 2040–2069 are within the range of possibilities that water managers must consider for adaptation planning until the end of the century.
The codes and data are available from the authors upon reasonable request.
The supplement related to this article is available online at https://doi.org/10.5194/hess-30-1165-2026-supplement.
BP conceptualized the study and its methodology, performed the formal analysis and validation, and prepared the original draft with contributions from AV and LS. BP and LS developed the code and visualization. AS was responsible for data curation. RL acquired the funding for the generation of the underlying WaSiM-LE and was responsible for project administration and supervision. All co-authors contributed to the review and editing of the article.
The contact author has declared that none of the authors has any competing interests.
Publisher's note: Copernicus Publications remains neutral with regard to jurisdictional claims made in the text, published maps, institutional affiliations, or any other geographical representation in this paper. The authors bear the ultimate responsibility for providing appropriate place names. Views expressed in the text are those of the authors and do not necessarily reflect the views of the publisher.
BP and AV acknowledge the support by the Deutsche Forschungsgemeinschaft (DFG, German Research Foundation) under Germany's Excellence Strategy – EXC 2037 “CLICCS – Climate, Climatic Change, and Society”. AS and RL were supported by the ClimEx II project, funded by the Bavarian Ministry for the Environment and Consumer Protection.
The authors thank the Leibniz Supercomputing Centre for providing the HPC infrastructure and computation time for the generation of the WaSiM-LE. The CRCM5-LE was created within the ClimEx Project, which was funded by the Bavarian Ministry for the Environment and Consumer Protection. Computations of the CRCM5-LE were performed on the SuperMUC HPC system of the Leibniz Supercomputing Centre of the Bavarian Academy of Sciences and Humanities. We acknowledge Environment and Climate Change Canada for providing the CanESM2-LE driving data.
This research has been funded by the Deutsche Forschungsgemeinschaft (DFG, German Research Foundation) under Germany's Excellence Strategy – EXC 2037 “CLICCS – Climate, Climatic Change, and Society” – Project Number: 390683824, contribution to the Center for Earth System Research and Sustainability (CEN) of Universität Hamburg.
This paper was edited by Paul Wagner and reviewed by Massimiliano Zappa and one anonymous referee.
Aalbers, E. E., Lenderink, G., van Meijgaard, E., and van den Hurk, B. J. J. M.: Local-scale changes in mean and heavy precipitation in Western Europe, climate change or internal variability?, Clim. Dynam., 50, 4745–4766, https://doi.org/10.1007/s00382-017-3901-9, 2018.
AghaKouchak, A., Cheng, L., Mazdiyasni, O., and Farahmand, A.: Global warming and changes in risk of concurrent climate extremes: Insights from the 2014 California drought, Geophys. Res. Lett., 41, 8847–8852, https://doi.org/10.1002/2014GL062308, 2014.
AghaKouchak, A., Huning, L. S., Sadegh, M., Qin, Y., Markonis, Y., Vahedifard, F., Love, C. A., Mishra, A., Mehran, A., Obringer, R., Hjelmstad, A., Pallickara, S., Jiwa, S., Hanel, M., Zhao, Y., Pendergrass, A. G., Arabi, M., Davis, S. J., Ward, P. J., Svoboda, M., Pulwarty, R., and Kreibich, H.: Toward impact-based monitoring of drought and its cascading hazards, Nat. Rev. Earth Environ., 4, 582–595, https://doi.org/10.1038/s43017-023-00457-2, 2023.
Arheimer, B., Donnelly, C., and Lindström, G.: Regulation of snow-fed rivers affects flow regimes more than climate change, Nat. Commun., 8, 62, https://doi.org/10.1038/s41467-017-00092-8, 2017.
Bakke, S. J., Ionita, M., and Tallaksen, L. M.: The 2018 northern European hydrological drought and its drivers in a historical perspective, Hydrol. Earth Syst. Sci., 24, 5621–5653, https://doi.org/10.5194/hess-24-5621-2020, 2020.
Balkema, A. A. and De Haan, L.: Residual Life Time at Great Age, Ann. Probab., 2, 792–804, https://doi.org/10.1214/aop/1176996548, 1974.
Basso, S., Botter, G., Merz, R., and Miniussi, A.: PHEV! The PHysically-based Extreme Value distribution of river flows, Environ. Res. Lett., 16, 124065, https://doi.org/10.1088/1748-9326/ac3d59, 2021.
Beck, H. E., van Dijk, A. I. J. M., Miralles, D. G., de Jeu, R. A. M., Bruijnzeel, L. A., McVicar, T. R., and Schellekens, J.: Global patterns in baseflow index and recession based on streamflow observations from 3394 catchments, Water Resour. Res., 49, 7843–7863, https://doi.org/10.1002/2013WR013918, 2013.
Berghuijs, W. R., Gnann, S. J., and Woods, R. A.: Unanswered questions on the Budyko framework, Hydrol. Process., 34, 5699–5703, https://doi.org/10.1002/hyp.13958, 2020.
Bevacqua, E., Suarez-Gutierrez, L., Jézéquel, A., Lehner, F., Vrac, M., Yiou, P., and Zscheischler, J.: Advancing research on compound weather and climate events via large ensemble model simulations, Nat. Commun., 14, 2145, https://doi.org/10.1038/s41467-023-37847-5, 2023.
Bevacqua, E., Rakovec, O., Schumacher, D. L., Kumar, R., Thober, S., Samaniego, L., Seneviratne, S. I., and Zscheischler, J.: Direct and lagged climate change effects intensified the 2022 European drought, Nat. Geosci., 17, 1100–1107, https://doi.org/10.1038/s41561-024-01559-2, 2024.
Bhaduri, A., Bogardi, J., Siddiqi, A., Voigt, H., Vörösmarty, C., Pahl-Wostl, C., Bunn, S. E., Shrivastava, P., Lawford, R., Foster, S., and Kremer, H.: Achieving sustainable development goals from a water perspective, Front. Environ. Sci., 4, https://doi.org/10.3389/fenvs.2016.00064, 2016.
Blauhut, V., Stoelzle, M., Ahopelto, L., Brunner, M. I., Teutschbein, C., Wendt, D. E., Akstinas, V., Bakke, S. J., Barker, L. J., Bartošová, L., Briede, A., Cammalleri, C., Kalin, K. C., De Stefano, L., Fendeková, M., Finger, D. C., Huysmans, M., Ivanov, M., Jaagus, J., Jakubínský, J., Krakovska, S., Laaha, G., Lakatos, M., Manevski, K., Neumann Andersen, M., Nikolova, N., Osuch, M., van Oel, P., Radeva, K., Romanowicz, R. J., Toth, E., Trnka, M., Urošev, M., Urquijo Reguera, J., Sauquet, E., Stevkov, A., Tallaksen, L. M., Trofimova, I., Van Loon, A. F., van Vliet, M. T. H., Vidal, J.-P., Wanders, N., Werner, M., Willems, P., and Živković, N.: Lessons from the 2018–2019 European droughts: a collective need for unifying drought risk management, Nat. Hazards Earth Syst. Sci., 22, 2201–2217, https://doi.org/10.5194/nhess-22-2201-2022, 2022.
Bocharov, G.: pyextremes, https://georgebv.github.io/pyextremes/ (last access: 24 January 2025), 2022.
Boehnisch, A., Felsche, E., Mittermeier, M., Poschlod, B., and Ludwig, R.: Future Patterns of Compound Dry and Hot Summers and Their Link to Soil Moisture Droughts in Europe, Earth's Future, 13, e2024EF004916, https://doi.org/10.1029/2024EF004916, 2025.
Bosshard, T., Carambia, M., Goergen, K., Kotlarski, S., Krahe, P., Zappa, M., and Schär, C.: Quantifying uncertainty sources in an ensemble of hydrological climate-impact projections, Water Resour. Res., 49, 1523–1536, https://doi.org/10.1029/2011WR011533, 2013.
Brönnimann, S., Rajczak, J., Fischer, E. M., Raible, C. C., Rohrer, M., and Schär, C.: Changing seasonality of moderate and extreme precipitation events in the Alps, Nat. Hazards Earth Syst. Sci., 18, 2047–2056, https://doi.org/10.5194/nhess-18-2047-2018, 2018.
Brown, A. G., Lespez, L., Sear, D. A., Macaire, J.-J., Houben, P., Klimek, K., Brazier, R. E., Van Oost, K., and Pears, B.: Natural vs. anthropogenic streams in Europe: History, ecology and implications for restoration, river-rewilding and riverine ecosystem services, Earth-Sci. Rev., 180, 185–205, https://doi.org/10.1016/j.earscirev.2018.02.001, 2018.
Brunner, M. I.: Floods and droughts: a multivariate perspective, Hydrol. Earth Syst. Sci., 27, 2479–2497, https://doi.org/10.5194/hess-27-2479-2023, 2023.
Brunner, M. I., Björnsen Gurung, A., Zappa, M., Zekollari, H., Farinotti, D., and Stähli, M.: Present and future water scarcity in Switzerland: Potential for alleviation through reservoirs and lakes, Sci. Total Environ., 666, 1033–1047, https://doi.org/10.1016/j.scitotenv.2019.02.169, 2019a.
Brunner, M. I., Farinotti, D., Zekollari, H., Huss, M., and Zappa, M.: Future shifts in extreme flow regimes in Alpine regions, Hydrol. Earth Syst. Sci., 23, 4471–4489, https://doi.org/10.5194/hess-23-4471-2019, 2019b.
Brunner, M. I., Swain, D. L., Wood, R. R., Willkofer, F., Done, J. M., Gilleland, E., and Ludwig, R.: An extremeness threshold determines the regional response of floods to changes in rainfall extremes, Commun. Earth Environ., 2, 173, https://doi.org/10.1038/s43247-021-00248-x, 2021.
Brunner, M. I., Van Loon, A. F., and Stahl, K.: Moderate and Severe Hydrological Droughts in Europe Differ in Their Hydrometeorological Drivers, Water Resour. Res., 58, e2022WR032871, https://doi.org/10.1029/2022WR032871, 2022.
Brunner, M. I., Götte, J., Schlemper, C., and Van Loon, A. F.: Hydrological Drought Generation Processes and Severity Are Changing in the Alps, Geophys. Res. Lett., 50, e2022GL101776, https://doi.org/10.1029/2022GL101776, 2023.
Budyko, M. I.: On climatic factors of runoff, Problemy Fiz. Geografii, 16, 41–48, 1951 (in Russian).
Bueche, T., Wenk, M., Poschlod, B., Giadrossich, F., Pirastru, M., and Vetter, M.: glmGUI v1.0: an R-based graphical user interface and toolbox for GLM (General Lake Model) simulations, Geosci. Model Dev., 13, 565–580, https://doi.org/10.5194/gmd-13-565-2020, 2020.
Cammalleri, C., Naumann, G., Mentaschi, L., Bisselink, B., Gelati, E., De Roo, A., and Feyen, L.: Diverging hydrological drought traits over Europe with global warming, Hydrol. Earth Syst. Sci., 24, 5919–5935, https://doi.org/10.5194/hess-24-5919-2020, 2020.
Caruso, M. F. and Marani, M.: Extreme-coastal-water-level estimation and projection: a comparison of statistical methods, Nat. Hazards Earth Syst. Sci., 22, 1109–1128, https://doi.org/10.5194/nhess-22-1109-2022, 2022.
Chen, D., Rojas, M., Samset, B., Cobb, K., Niang, A. D., Edwards, P., Emori, S., Faria, S., Hawkins, E., Hope, P., Huybrechts, P., Meinshausen, M., Mustafa, S., Plattner, G.-K., and Tréguier, A.-M.: Framing, Context and Methods, in: Climate Change 2021: The Physical Science Basis, Contribution of Working Group I to the Sixth Assessment Report of the Intergovernmental Panel on Climate Change, Cambridge University Press, Cambridge, United Kingdom and New York, NY, USA, 147–286, https://doi.org/10.1017/9781009157896.003, 2021.
Coles, S.: An introduction to statistical modeling of extreme values, Springer, London, UK, https://doi.org/10.1007/978-1-4471-3675-0, 2001.
Conradt, H., Engelhardt, H., Menz, C., Vicente-Serrano, S. M., Farizo, B. A., Peña-Angulo, D., Domínguez-Castro, F., Eklundh, L., Jin, H., Boincean, B., Murphy, C., and López-Moreno, J. I.: Cross-sectoral impacts of the 2018–2019 Central European drought and climate resilience in the German part of the Elbe River basin, Reg. Environ. Change, 23, 32, https://doi.org/10.1007/s10113-023-02032-3, 2023.
Dahlmann, H., Stephan, R., and Stahl, K.: Upstream-downstream asymmetries of drought impacts in major river basins of the European Alps, Front. Water, 4, 1061991, https://doi.org/10.3389/frwa.2022.1061991, 2022.
Davison, A. C. and Smith, R. L.: Models for exceedances over high thresholds, J. R. Stat. Soc., 52, 393–442, 1990.
Deser, C., Lehner, F., Rodgers, K. B., Ault, T., Delworth, T. L., DiNezio, P. N., Fiore, A., Frankignoul, C., Fyfe, J. C., Horton, D. E., Kay, J. E., Knutti, R., Lovenduski, N. S., Marotzke, J., McKinnon, K. A., Minobe, S., Randerson, J., Screen, J. A., Simpson, I. R., and Ting, M.: Insights from Earth System Model Initial-Condition Large Ensembles and Future Prospects, Nat. Clim. Change, 10, 277–286, https://doi.org/10.1038/s41558-020-0731-2, 2020.
EEA (European Environmental Agency): EU-DEM v1.1: Digital Elevation Model over Europe, https://cis2.eea.europa.eu/data/42/ (last access: 30 September 2021), 2018.
Ehsani, N., Vörösmarty, C. J., Fekete, B. M., and Stakhiv, E. Z.: Reservoir operations under climate change: Storage capacity options to mitigate risk, J. Hydrol., 555, 435–446, https://doi.org/10.1016/j.jhydrol.2017.09.008, 2017.
Faghih, M. and Brissette, F.: The role of internal climate variability on future streamflow projections, J. Hydrol., 625, 130101, https://doi.org/10.1016/j.jhydrol.2023.130101, 2023.
Felsche, E., Boehnisch, A., Poschlod, B., and Ludwig, R.: Will Present-Day Compound Hot and Dry European Summers Still Be Extreme in the Future?, Commun. Earth Environ., 5, 1, https://doi.org/10.1038/s43247-024-01575-5, 2024.
Fersch, B., Senatore, A., Adler, B., Arnault, J., Mauder, M., Schneider, K., Völksch, I., and Kunstmann, H.: High-resolution fully coupled atmospheric–hydrological modeling: a cross-compartment regional water and energy cycle evaluation, Hydrol. Earth Syst. Sci., 24, 2457–2481, https://doi.org/10.5194/hess-24-2457-2020, 2020.
FGG Donau – Flussgebietsgemeinschaft Donau: Umsetzung der Wasserrahmenrichtlinie – Bewirtschaftungsplan Donau – Bewirtschaftungszeitraum 2022 bis 2027, München, https://www.fgg-donau.bayern.de/wrrl/bewirtschaftungsplaene/doc/bewirtschaftungsplan_fggdonau.pdf (last access: 8 December 2025), 2021.
Fisher, R. A. and Tippett, L. H. C.: Limiting forms of the frequency distribution of the largest or smallest member of a sample, Math. Proc. Cambridge, 24, 180–190, https://doi.org/10.1017/S0305004100015681, 1928.
Foreman-Mackey, D., Hogg, D. W., Lang, D., and Goodman, J.: emcee: The MCMC Hammer, Publ. Astron. Soc. Pac., 125, 306–312, https://doi.org/10.1086/670067, 2013.
Forzieri, G., Feyen, L., Rojas, R., Flörke, M., Wimmer, F., and Bianchi, A.: Ensemble projections of future streamflow droughts in Europe, Hydrol. Earth Syst. Sci., 18, 85–108, https://doi.org/10.5194/hess-18-85-2014, 2014.
Fyfe, J. C., Derksen, C., Mudryk, L., Flato, G. M., Santer, B. D., Swart, N. C., Molotch, N. P., Zhang, X., Wan, H., Arora, V. K., Scinocca, J., and Jiao, Y.: Large near-term projected snowpack loss over the western United States, Nat. Commun., 8, 14996, https://doi.org/10.1038/ncomms14996, 2017.
Gnedenko, B.: Sur la distribution limite du terme maximum d'uneserie aleatoire, Ann. Math., 44, 423–453, 1943.
Goda, Y.: Inherent negative bias of quantile estimates of annual maximum data due to sample size effect: A numerical simulation study, Coast. Eng. J., 53, 397–429, https://doi.org/10.1142/S0578563411002409, 2011.
Gräler, B., van den Berg, M. J., Vandenberghe, S., Petroselli, A., Grimaldi, S., De Baets, B., and Verhoest, N. E. C.: Multivariate return periods in hydrology: a critical and practical review focusing on synthetic design hydrograph estimation, Hydrol. Earth Syst. Sci., 17, 1281–1296, https://doi.org/10.5194/hess-17-1281-2013, 2013.
Gupta, H. V., Kling, H., Yilmaz, K. K., and Martinez, G. F.: Decomposition of the mean squared error and NSE performance criteria: Implications for improving hydrological modelling, J. Hydrol., 377, 80–91, https://doi.org/10.1016/j.jhydrol.2009.08.003, 2009.
Hamdi, Y., Haigh, I. D., Parey, S., and Wahl, T.: Preface: Advances in extreme value analysis and application to natural hazards, Nat. Hazards Earth Syst. Sci., 21, 1461–1465, https://doi.org/10.5194/nhess-21-1461-2021, 2021.
Hanus, S., Hrachowitz, M., Zekollari, H., Schoups, G., Vizcaino, M., and Kaitna, R.: Future changes in annual, seasonal and monthly runoff signatures in contrasting Alpine catchments in Austria, Hydrol. Earth Syst. Sci., 25, 3429–3453, https://doi.org/10.5194/hess-25-3429-2021, 2021.
Haslinger, K., Koffler, D., Schöner, W., and Laaha, G.: Exploring the link between meteorological drought and streamflow: Effects of climate-catchment interaction, Water Resour. Res., 50, 2468–2487, https://doi.org/10.1002/2013WR015051, 2014.
Hausfather, Z. and Peters, G. P.: Emissions – the “business as usual” story is misleading, Nature, 577, 618–620, https://doi.org/10.1038/d41586-020-00177-3, 2020.
Hawkins, E.: 2018 visualisation update, https://www.climate-lab-book.ac.uk/2018/2018-visualisation-update/ (last access: 24 January 2025), 2018.
Herrera, P. A., Marazuela, M. A., and Hofmann, T.: Parameter estimation and uncertainty analysis in hydrological modeling, WIRes Water, 9, 1–23, https://doi.org/10.1002/wat2.1569, 2022.
Hewa, G. A., Wang, Q. J., McMahon, T. A., Nathan, R. J., and Peel, M. C.: Generalized extreme value distribution fitted by LH moments for low-flow frequency analysis, Water Resour. Res., 43, 227–228, https://doi.org/10.1029/2006WR004913, 2007.
Hogeboom, R. J., Knook, L., and Hoekstra, A. Y.: The blue water footprint of the world's artificial reservoirs for hydroelectricity, irrigation, residential and industrial water supply, flood protection, fishing and recreation, Adv. Water Resour., 113, 285–294, https://doi.org/10.1016/j.advwatres.2018.01.028, 2018.
Huang, S., Krysanova, V., and Hattermann, F.: Projections of climate change impacts on floods and droughts in Germany using an ensemble of climate change scenarios, Reg. Environ. Change, 15, 461–473, https://doi.org/10.1007/s10113-014-0606-z, 2015.
Huber García, V., Meyer, S., Kok, K., Verweij, P., and Ludwig, R.: Deriving spatially explicit water uses from land use change modelling results in four river basins across Europe, Sci. Total Environ., 628–629, 1079–1097, https://doi.org/10.1016/j.scitotenv.2018.02.051, 2018.
Kiesel, J., Gericke, A., Rathjens, H., Wetzig, A., Kakouei, K., Jähnig, S. C., and Fohrer, N.: Climate change impacts on ecologically relevant hydrological indicators in three catchments in three European ecoregions, Ecol. Eng., 127, 404–416, https://doi.org/10.1016/j.ecoleng.2018.12.019, 2019.
Kunstmann, H., Krause, J., and Mayr, S.: Inverse distributed hydrological modelling of Alpine catchments, Hydrol. Earth Syst. Sci., 10, 395–412, https://doi.org/10.5194/hess-10-395-2006, 2006.
Laaha, G., Parajka, J., Viglione, A., Koffler, D., Haslinger, K., Schöner, W., Zehetgruber, J., and Blöschl, G.: A three-pillar approach to assessing climate impacts on low flows, Hydrol. Earth Syst. Sci., 20, 3967–3985, https://doi.org/10.5194/hess-20-3967-2016, 2016.
Lang, A. and Poschlod, B.: Updating catastrophe models to today's climate – An application of a large ensemble approach to extreme rainfall, Clim. Risk Manag., 44, 100594, https://doi.org/10.1016/j.crm.2024.100594, 2024.
Le Roux, E., Evin, G., Eckert, N., Blanchet, J., and Morin, S.: Non-stationary extreme value analysis of ground snow loads in the French Alps: a comparison with building standards, Nat. Hazards Earth Syst. Sci., 20, 2961–2977, https://doi.org/10.5194/nhess-20-2961-2020, 2020.
Leduc, M., Mailhot, A., Frigon, A., Martel, J.-L., Ludwig, R., Brietzke, G. B., Giguère, M., Brissette, F., Turcotte, R., Braun, M., and Scinocca, J.: The ClimEx Project: A 50-Member Ensemble of Climate Change Projections at 12 km Resolution over Europe and Northeastern North America with the Canadian Regional Climate Model (CRCM5), J. Appl. Meteorol. Clim., 58, 663–693, https://doi.org/10.1175/JAMC-D-18-0021.1, 2019.
Lehner, F.: Climate model large ensembles as test beds for applied compound event research, iScience, 27, 11, https://doi.org/10.1016/j.isci.2024.111113, 2024.
Lehner, F., Deser, C., Maher, N., Marotzke, J., Fischer, E. M., Brunner, L., Knutti, R., and Hawkins, E.: Partitioning climate projection uncertainty with multiple large ensembles and CMIP5/6, Earth Syst. Dynam., 11, 491–508, https://doi.org/10.5194/esd-11-491-2020, 2020.
LfU – Bayerisches Landesamt für Umwelt: Niedrigwasser in Bayern – Grundlagen, Veränderung und Auswirkungen, Augsburg, https://www.nid.bayern.de/files/docs/niedrigwasserbericht.pdf (last access: 8 December 2025), 2016.
LfU – Bayerisches Landesamt für Umwelt: Hydrologische Kenn- und Schwellenwerte, Augsburg, https://www.lfu.bayern.de/wasser/klimawandel_wasserhaushalt/doc/hydrologische_kennwerte.pdf (last access: 24 January 2025), 2021.
LfU – Bayerisches Landesamt für Umwelt: Gewässerkundlicher Dienst Bayern, https://www.gkd.bayern.de/en/rivers/discharge, last access: 23 June 2025.
Loritz, R., Dolich, A., Acuña Espinoza, E., Ebeling, P., Guse, B., Götte, J., Hassler, S. K., Hauffe, C., Heidbüchel, I., Kiesel, J., Mälicke, M., Müller-Thomy, H., Stölzle, M., and Tarasova, L.: CAMELS-DE: hydro-meteorological time series and attributes for 1582 catchments in Germany, Earth Syst. Sci. Data, 16, 5625–5642, https://doi.org/10.5194/essd-16-5625-2024, 2024.
Ludwig, R., Taschner, S., and Mauser, W.: Modelling floods in the Ammer catchment: limitations and challenges with a coupled meteo-hydrological model approach, Hydrol. Earth Syst. Sci., 7, 833–847, https://doi.org/10.5194/hess-7-833-2003, 2003.
Maher, N., Milinski, S., and Ludwig, R.: Large ensemble climate model simulations: introduction, overview, and future prospects for utilising multiple types of large ensemble, Earth Syst. Dynam., 12, 401–418, https://doi.org/10.5194/esd-12-401-2021, 2021.
Maraun, D.: Bias Correcting Climate Change Simulations – a Critical Review, Curr. Clim. Change Rep., 2, 211–220, https://doi.org/10.1007/s40641-016-0050-x, 2016.
Marke, T.: Development and Application of a Model Interface to couple Land Surface Models with Regional Climate Models for Climate Change Risk Assessment in the Upper Danube Watershed, Ludwig-Maximilians-Universität München, https://doi.org/10.5282/edoc.9162, 2008.
Martins, E. S. and Stedinger, J. R.: Generalized maximum likelihood Pareto-Poisson estimators for partial duration series, Water Resour. Res., 37, 2551–2557, https://doi.org/10.1029/2001WR000367, 2001.
Marx, A., Kunstmann, H., Bárdossy, A., and Seltmann, J.: Radar rainfall estimates in an alpine environment using inverse hydrological modelling, Adv. Geosci., 9, 25–29, https://doi.org/10.5194/adgeo-9-25-2006, 2006.
Marx, A., Kumar, R., Thober, S., Rakovec, O., Wanders, N., Zink, M., Wood, E. F., Pan, M., Sheffield, J., and Samaniego, L.: Climate change alters low flows in Europe under global warming of 1.5, 2, and 3 °C, Hydrol. Earth Syst. Sci., 22, 1017–1032, https://doi.org/10.5194/hess-22-1017-2018, 2018.
Mauser, W., Marke, T., and Stoeber, S.: Climate change and water resources: scenarios of low-flow conditions in the Upper Danube River Basin, IOP C. Ser. Earth Env., 4, 012027, https://doi.org/10.1088/1755-1307/4/1/012027, 2008.
Maxwell, R. M. and Kollet, S. J.: Interdependence of groundwater dynamics and land-energy feedbacks under climate change, Nat. Geosci., 1, 665, https://doi.org/10.1038/ngeo315, 2008.
Meehl, G. A., Senior, C. A., Eyring, V., Flato, G., Lamarque, J.-F., Stouffer, R. J., Taylor, K. E., and Schlund, M.: Context for interpreting equilibrium climate sensitivity and transient climate response from the CMIP6 Earth system models, Science Advances, 6, eaba1981, https://doi.org/10.1126/sciadv.aba1981, 2020.
Meißner, D., Klein, B., and Ionita, M.: Development of a monthly to seasonal forecast framework tailored to inland waterway transport in central Europe, Hydrol. Earth Syst. Sci., 21, 6401–6423, https://doi.org/10.5194/hess-21-6401-2017, 2017.
Melsen, L. A., Addor, N., Mizukami, N., Newman, A. J., Torfs, P. J. J. F., Clark, M. P., Uijlenhoet, R., and Teuling, A. J.: Mapping (dis)agreement in hydrologic projections, Hydrol. Earth Syst. Sci., 22, 1775–1791, https://doi.org/10.5194/hess-22-1775-2018, 2018.
Mendoza, P. A., Clark, M. P., Mizukami, N., Gutmann, E. D., Arnold, J. R., Brekke, L. D., and Rajagopalan, B.: How do hydrologic modeling decisions affect the portrayal of climate change impacts?, Hydrol. Process., 30, 1071–1095, https://doi.org/10.1002/hyp.10684, 2016.
Monteith, J. L.: Evaporation and environment, Sym. Soc. Exp. Biol., 19, 205–234, 1965.
Moriasi, D. N., Arnold, J. G., van Liew, M. W., Bingner, R. L., Harmel, R. D., and Veith, T. L.: Model Evaluation Guidelines for Systematic Quantification of Accuracy in Watershed Simulations, T. ASABE, 50, 885–900, https://doi.org/10.13031/2013.23153, 2007.
Mpelasoka, F. S. and Chiew, F. H. S.: Influence of Rainfall Scenario Construction Methods on Runoff Projections, J. Hydrometeorol., 10, 1168–1183, https://doi.org/10.1175/2009JHM1045.1, 2009.
Muelchi, R., Rössler, O., Schwanbeck, J., Weingartner, R., and Martius, O.: River runoff in Switzerland in a changing climate – changes in moderate extremes and their seasonality, Hydrol. Earth Syst. Sci., 25, 3577–3594, https://doi.org/10.5194/hess-25-3577-2021, 2021.
Nash, J. E. and Sutcliffe, J. V.: River flow forecasting through conceptual models part I – A discussion of principles, J. Hydrol., 10, 282–290, https://doi.org/10.1016/0022-1694(70)90255-6, 1970.
Naumann, G., Alfieri, L., Wyser, K., Mentaschi, L., Betts, R. A., Carrao, H., Spinoni, J., Vogt, J., and Feyen, L.: Global Changes in Drought Conditions Under Different Levels of Warming, Geophys. Res. Lett., 45, 3285–3296, https://doi.org/10.1002/2017gl076521, 2018.
Naumann, G., Cammalleri, C., Mentaschi, L., and Feyen, L.: Increased economic drought impacts in Europe with anthropogenic warming, Nat. Clim. Change, 11, 485–491, https://doi.org/10.1038/s41558-021-01044-3, 2021.
Naz, B. S., Sharples, W., Ma, Y., Goergen, K., and Kollet, S.: Continental-scale evaluation of a fully distributed coupled land surface and groundwater model, ParFlow-CLM (v3.6.0), over Europe, Geosci. Model Dev., 16, 1617–1639, https://doi.org/10.5194/gmd-16-1617-2023, 2023.
Neukum, C. and Azzam, R.: Impact of climate change on groundwater recharge in a small catchment in the Black Forest, Germany, Hydrogeol. J., 20, 547–560, https://doi.org/10.1007/s10040-011-0827-x, 2012.
Otop, I., Adynkiewicz-Piragas, M., Zdralewicz, I., Lejcus, I., and Miszuk, B.: The Drought of 2018–2019 in the Lusatian Neisse River Catchment in Relation to the Multiannual Conditions, Water-Sui., 15, 1647, https://doi.org/10.3390/w15091647, 2023.
Parajka, J., Blaschke, A. P., Blöschl, G., Haslinger, K., Hepp, G., Laaha, G., Schöner, W., Trautvetter, H., Viglione, A., and Zessner, M.: Uncertainty contributions to low-flow projections in Austria, Hydrol. Earth Syst. Sci., 20, 2085–2101, https://doi.org/10.5194/hess-20-2085-2016, 2016.
Parey, S., Hoang, T. T. H., and Dacunha-Castelle, D.: Future high temperature extremes and stationarity, Nat. Hazards, 98, 1115–1134, https://doi.org/10.1007/s11069-018-3499-1, 2019.
Parra, V., Arumí, J. L., and Muñoz, E.: Identifying a Suitable Model for Low-Flow Simulation in Watersheds of South-Central Chile: A Study Based on a Sensitivity Analysis, Water-Sui., 11, 1506, https://doi.org/10.3390/w11071506, 2019.
Peña-Angulo, D., Vicente-Serrano, S., Domínguez-Castro, F., Lorenzo-Lacruz, J., Murphy, C., Hannaford, J., Allan, R. P., Tramblay, Y., Reig-Gracia, F., and El Kenawy, A.: The complex and spatially diverse patterns of hydrological droughts across Europe, Water Resour. Res., 58, e2022WR031976, https://doi.org/10.1029/2022WR031976, 2022.
Pickands, J. I. I. I.: Statistical inference using extreme order statistics, Ann. Stat., 3, 119–131, https://doi.org/10.1214/aos/1176343003, 1975.
Piniewski, M., Eini, M. R., Chattopadhyay, S., Okruszko, T., and Kundzewicz, Z. W.: Is there a coherence in observed and projected changes in riverine low flow indices across Central Europe?, Earth-Sci. Rev., 233, https://doi.org/10.1016/j.earscirev.2022.104187, 2022.
Poschlod, B.: Attributing heavy rainfall event in Berchtesgadener Land to recent climate change – Further rainfall intensification projected for the future, Weather Clim. Extr., 38, 100492, https://doi.org/10.1016/j.wace.2022.100492, 2022.
Poschlod, B. and Daloz, A. S.: Snow depth in high-resolution regional climate model simulations over southern Germany – suitable for extremes and impact-related research?, The Cryosphere, 18, 1959–1981, https://doi.org/10.5194/tc-18-1959-2024, 2024.
Poschlod, B. and Koh, J.: Convection-permitting Climate Models can Support Observations to Generate Rainfall Return Levels, Water Resour. Res., 60, e2023WR035159, https://doi.org/10.1029/2023WR035159, 2024.
Poschlod, B., Hodnebrog, Ø., Wood, R. R., Alterskjær, K., Ludwig, R., Myhre, G., and Sillmann, J.: Comparison and evaluation of statistical rainfall disaggregation and high-resolution dynamical downscaling over complex terrain, J. Hydrometeorol., 19, 1973–1982, https://doi.org/10.1175/JHM-D-18-0132.1, 2018.
Poschlod, B., Willkofer, F., and Ludwig, R.: Impact of Climate Change on the Hydrological Regimes in Bavaria, Water-Sui., 12, 1599, https://doi.org/10.3390/w12061599, 2020.
Probst, E. and Mauser, W.: Climate Change Impacts on Water Resources in the Danube River Basin: A Hydrological Modelling Study Using EURO-CORDEX Climate Scenarios, Water-Sui., 15, 8, https://doi.org/10.3390/w15010008, 2022.
Rauthe, M., Steiner, H., Riediger, U., Mazurkiewicz, A., and Gratzki, A.: A Central European precipitation climatology – Part I: Generation and validation of a high-resolution gridded daily data set (HYRAS), Meteorol. Z., 22, 235–256, https://doi.org/10.1127/0941-2948/2013/0436, 2013.
Raynal-Villasenor, J. A. and Raynal-Gutierrez, M. E.: Estimation procedures for the GEV distribution for the minima, J. Hydrol., 519, 512–522, https://doi.org/10.1016/j.jhydrol.2014.07.045, 2014.
Riahi, K., Rao, S., Krey, V., Cho, C., Chirkov, V., Fischer, G., Kindermann, G., Nakicenovic, N., and Rafaj, P.: RCP 8.5 – A scenario of comparatively high greenhouse gas emissions, Climatic Change, 109, 33–57, https://doi.org/10.1007/s10584-011-0149-y, 2011.
Roudier, P., Andersson, J. C. M., Donnelly, C., Feyen, L., Greuell, W., and Ludwig, F.: Projections of future floods and hydrological droughts in Europe under a +2 °C global warming, Climatic Change, 135, 341–355, https://doi.org/10.1007/s10584-015-1570-4, 2016.
Rummler, T., Wagner, A., Arnault, J., and Kunstmann, H.: Lateral terrestrial water fluxes in the LSM of WRF-Hydro: Benefits of a 2D groundwater representation, Hydrol. Process., 36, e14510, https://doi.org/10.1002/hyp.14510, 2022.
Sadegh, M., Ragno, E., and AghaKouchak, A.: Multivariate Copula Analysis Toolbox (MvCAT): describing dependence and underlying uncertainty using a Bayesian framework, Water Resour. Res., 53, 5166–5183, https://doi.org/10.1002/2016WR020242, 2017.
Sadegh, M., Moftakhari, H., Gupta, H. V., Ragno, E., Mazdiyasni, O., Sanders, B., Matthew, R., and AghaKouchak, A.: Multihazard scenarios for analysis of compound extreme events, Geophys. Res. Lett., 45, 5470–5480, https://doi.org/10.1029/2018GL077317, 2018.
Salvadori, G., De Michele, C., and Durante, F.: On the return period and design in a multivariate framework, Hydrol. Earth Syst. Sci., 15, 3293–3305, https://doi.org/10.5194/hess-15-3293-2011, 2011.
Salvadori, G., Durante, F., and De Michele, C.: Multivariate return period calculation via survival functions, Water Resour. Res., 49, 2308–2311, https://doi.org/10.1002/wrcr.20204, 2013.
Salvadori, G., Tomasicchio, G. R., and D'Alessandro, F.: Practical guidelines for multivariate analysis and design in coastal and off-shore engineering, Coast. Eng., 88, 1–14, https://doi.org/10.1016/j.coastaleng.2014.01.011, 2014.
Salvadori, G., Durante, F., De Michele, C., Bernardi, M., and Petrella, L.: A multivariate copula-based framework for dealing with hazard scenarios and failure probabilities, Water Resour. Res., 52, 3701–3721, https://doi.org/10.1002/2015WR017225, 2016.
Sarofim, M. C., Smith, C. J., Malek, P., McDuffie, E. E., Hartin, C. A., Lay, C. R., and McGrath, S.: High radiative forcing climate scenario relevance analyzed with a ten-million-member ensemble, Nat. Commun., 15, 8185, https://doi.org/10.1038/s41467-024-52437-9, 2024.
Schulla, J.: Model Description WaSiM (Water balance Simulation Model), Zurich, http://wasim.ch/downloads/doku/wasim/wasim_2021_en.pdf (last access: 20 December 2024), 2021.
Schumacher, D. L., Singh, J., Hauser, M., Persad, G., Wild, M., Boé, J., and Seneviratne, S. I.: Exacerbated summer European warming not captured by climate models neglecting long-term aerosol changes, Commun. Earth Environ., 5, 182, https://doi.org/10.1038/s43247-024-01332-8, 2024.
Schwalm, C. R., Glendon, S., and Duffy, P. B.: RCP8.5 tracks cumulative CO2 emissions, P. Natl. Acad. Sci. USA, 117, 19656–19657, https://doi.org/10.1073/pnas.2007117117, 2020.
Schwarz, G.: Estimating the dimension of a model, Ann. Stat., 6, 461–464, https://doi.org/10.1214/aos/1176344136, 1978.
Serinaldi, F. and Kilsby, C. G.: Rainfall extremes: Toward reconciliation after the battle of distributions, Water Resour. Res., 50, 336–352, https://doi.org/10.1002/2013WR014211, 2014.
Shepherd, T. G.: Storyline approach to the construction of regional climate change information, P. Roy. Soc. A-Math. Phy., 475, 20190013, https://doi.org/10.1098/rspa.2019.0013, 2019.
Shokri, N. and Salvucci, G. D.: Evaporation from porous media in the presence of a water table, Vadose Zone J., 10, 1309–1318, https://doi.org/10.2136/vzj2011.0027, 2011.
Sillmann, J., Shepherd, T. G., van den Hurk, B., Hazeleger, W., Martius, O., Slingo, J., and Zscheischler, J.: Event-based storylines to address climate risk, Earth's Future, 9, e2020EF001783, https://doi.org/10.1029/2020EF001783, 2021.
Sklar, A.: Fonctions de Répartition à n Dimensions et Leurs Marges, Institut Statistique de l'Université de Paris, 8, 229–231, https://hal.science/hal-04094463v1 (last access: 22 January 2025), 1959.
Stahl, K., Kohn, I., Blauhut, V., Urquijo, J., De Stefano, L., Acácio, V., Dias, S., Stagge, J. H., Tallaksen, L. M., Kampragou, E., Van Loon, A. F., Barker, L. J., Melsen, L. A., Bifulco, C., Musolino, D., de Carli, A., Massarutto, A., Assimacopoulos, D., and Van Lanen, H. A. J.: Impacts of European drought events: insights from an international database of text-based reports, Nat. Hazards Earth Syst. Sci., 16, 801–819, https://doi.org/10.5194/nhess-16-801-2016, 2016.
Stanzel, P. and Kling, H.: From ENSEMBLES to CORDEX: Evolving climate change projections for Upper Danube River flow, J. Hydrol., 563, 987–999, https://doi.org/10.1016/j.jhydrol.2018.06.057, 2018.
Stephan, R., Erfurt, M., Terzi, S., Žun, M., Kristan, B., Haslinger, K., and Stahl, K.: An inventory of Alpine drought impact reports to explore past droughts in a mountain region, Nat. Hazards Earth Syst. Sci., 21, 2485–2501, https://doi.org/10.5194/nhess-21-2485-2021, 2021.
Teuling, A. J., Seneviratne, S. I., Stöckli, R., Reichstein, M., Moors, E., Ciais, P., Luyssaert, S., van den Hurk, B., Ammann, C., Bernhofer, C., Dellwik, E., Gianelle, D., Gielen, B., Grünwald, T., Klumpp, K., Montagnani, L., Moureaux, C., Sottocornola, M., and Wohlfahrt, G.: Contrasting response of European forest and grassland energy exchange to heatwaves, Nat. Geosci., 3, 722–727, https://doi.org/10.1038/ngeo950, 2010.
Teutschbein, C. and Seibert, J.: Bias correction of regional climate model simulations for hydrological climate-change impact studies: Review and evaluation of different methods, J. Hydrol., 456–457, 12–29, https://doi.org/10.1016/j.jhydrol.2012.05.052, 2012.
Thébault, C., Perrin, C., Andréassian, V., Thirel, G., Legrand, S., and Delaigue, O.: Multi-model approach in a variable spatial framework for streamflow simulation, Hydrol. Earth Syst. Sci., 28, 1539–1566, https://doi.org/10.5194/hess-28-1539-2024, 2024.
Tootoonchi, F., Haerter, J. O., Todorović, A., Räty, O., Grabs, T., and Teutschbein, C.: Uni- and multivariate bias adjustment methods in Nordic catchments: Complexity and performance in a changing climate, Sci. Total Environ., 853, 158615, https://doi.org/10.1016/j.scitotenv.2022.158615, 2022.
Toreti, A., Bavera, D., Acosta Navarro, J., Cammalleri, C., de Jager, A., Di Ciollo, C., Hrast Essenfelder, A., Maetens, W., Magni, D., Masante, D., Mazzeschi, M., Niemeyer, S., and Spinoni, J.: Drought in Europe August 2022, Publications Office of the European Union, Luxembourg, JRC130493, https://doi.org/10.2760/264241, 2022.
Toreti, A., Bavera, D., Acosta Navarro, J., Arias Muñoz, C., Avanzi, F., Barbosa, P., de Jager, A., Di Ciollo, C., Ferraris, L., Fioravanti, G., Gabellani, S., Grimaldi, S., Hrast Essenfelder, A., Isabellon, M., Jonas, T., Maetens, W., Magni, D., Masante, D., Mazzeschi, M., McCormick, N., Rossi, L., and Salamon, P.: Drought in Europe June 2023, Publications Office of the European Union, Luxembourg, JRC134492, https://doi.org/10.2760/575433, 2023.
Troin, M., Martel, J. L., Arsenault, R., and Brissette, F.: Large-sample study of uncertainty of hydrological model components over North America, J. Hydrol., 609, 127766, https://doi.org/10.1016/j.jhydrol.2022.127766, 2022.
Tu, X., Wu, H., Singh, V. P., Chen, X., Lin, K., and Xie, Y.: Multivariate design of socioeconomic drought and impact of water reservoirs, J. Hydrol., 566, 192–204, https://doi.org/10.1016/j.jhydrol.2018.09.012, 2018.
Van Loon, A. F. and Van Lanen, H. A. J.: A process-based typology of hydrological drought, Hydrol. Earth Syst. Sci., 16, 1915–1946, https://doi.org/10.5194/hess-16-1915-2012, 2012.
Van Loon, A. F., Ploum, S. W., Parajka, J., Fleig, A. K., Garnier, E., Laaha, G., and Van Lanen, H. A. J.: Hydrological drought types in cold climates: quantitative analysis of causing factors and qualitative survey of impacts, Hydrol. Earth Syst. Sci., 19, 1993–2016, https://doi.org/10.5194/hess-19-1993-2015, 2015.
Van Loon, A. F., Gleeson, T., Clark, J., Van Dijk, A. I. J. M., Stahl, K., Hannaford, J., Di Baldassarre, G., Teuling, A. J., Tallaksen, L. M., Uijlenhoet, R., Hannah, D. M., Sheffield, J., Svoboda, M., Verbeiren, B., Wagener, T., Rangecroft, S., Wanders, N., and Van Lanen, H. A. J.: Drought in the Anthropocene, Nat. Geosci., 9, 89–91, https://doi.org/10.1038/ngeo2646, 2016.
Van Loon, A. F., Kchouk, S., Matanó, A., Tootoonchi, F., Alvarez-Garreton, C., Hassaballah, K. E. A., Wu, M., Wens, M. L. K., Shyrokaya, A., Ridolfi, E., Biella, R., Nagavciuc, V., Barendrecht, M. H., Bastos, A., Cavalcante, L., de Vries, F. T., Garcia, M., Mård, J., Streefkerk, I. N., Teutschbein, C., Tootoonchi, R., Weesie, R., Aich, V., Boisier, J. P., Di Baldassarre, G., Du, Y., Galleguillos, M., Garreaud, R., Ionita, M., Khatami, S., Koehler, J. K. L., Luce, C. H., Maskey, S., Mendoza, H. D., Mwangi, M. N., Pechlivanidis, I. G., Ribeiro Neto, G. G., Roy, T., Stefanski, R., Trambauer, P., Koebele, E. A., Vico, G., and Werner, M.: Review article: Drought as a continuum – memory effects in interlinked hydrological, ecological, and social systems, Nat. Hazards Earth Syst. Sci., 24, 3173–3205, https://doi.org/10.5194/nhess-24-3173-2024, 2024.
Villarini, G., Smith, J. A., Serinaldi, F., and Ntelekos, A. A.: Analyses of seasonal and annual maximum daily discharge records for central Europe, J. Hydrol., 399, 299–312, https://doi.org/10.1016/j.jhydrol.2011.01.007, 2011.
Vogelbacher, A., Aminzadeh, M., Madani, K., and Shokri, N.: An analytical framework to investigate groundwater-atmosphere interactions influenced by soil properties, Water Resour. Res., 60, e2023WR036643, https://doi.org/10.1029/2023WR036643, 2024.
von Trentini, F., Leduc, M., and Ludwig, R.: Assessing natural variability in RCM signals: comparison of a multi model EURO-CORDEX ensemble with a 50-member single model large ensemble, Clim. Dynam., 53, 1963–1979, https://doi.org/10.1007/s00382-019-04755-8, 2019.
Wang, C. H. and Holmes, J. D.: Exceedance rate, exceedance probability, and the duality of GEV and GPD for extreme hazard analysis, Nat. Hazards, 102, 1305–1321, https://doi.org/10.1007/s11069-020-03968-z, 2020.
Westra, S., Mehrotra, R., Sharma, A., and Srikanthan, R.: Continuous rainfall simulation: 1. A regionalized subdaily disaggregation approach, Water Resour. Res., 48, W01535, https://doi.org/10.1029/2011WR010489, 2012.
Willkofer, F., Schmid, F.-J., Komischke, H., Korck, J., Braun, M., and Ludwig, R.: The impact of bias correcting regional climate model results on hydrological indicators for Bavarian catchments, J. Hydrol.-Regional Studies, 19, 25–41, https://doi.org/10.1016/j.ejrh.2018.06.010, 2018.
Willkofer, F., Wood, R. R., von Trentini, F., Weismüller, J., Poschlod, B., and Ludwig, R.: A Holistic Modelling Approach for the Estimation of Return Levels of Peak Flows in Bavaria, Water-Sui., 12, 2349, https://doi.org/10.3390/w12092349, 2020.
Willkofer, F., Wood, R. R., and Ludwig, R.: Assessing the impact of climate change on high return levels of peak flows in Bavaria applying the CRCM5 large ensemble, Hydrol. Earth Syst. Sci., 28, 2969–2989, https://doi.org/10.5194/hess-28-2969-2024, 2024.
Wolff, E. and Van Vliet, M. T. H.: Impact of the 2018 drought on pharmaceutical concentrations and general water quality of the Rhine and Meuse rivers, Sci. Total Environ., 778, https://doi.org/10.1016/j.scitotenv.2021.146182, 2021.
WWA Donauwörth – Wasserwirtschaftsamt Donauwörth: Erläuterungsbericht Gewässerentwicklungskonzept Wörnitz, https://www.wwa-don.bayern.de/themen/fluesse_seen/gewaesserentwicklungskonzepte/doc/woernitz/1_erl_bericht.pdf (last access: 8 December 2025), 2013.
Zipper, S. C., Keune, J., and Kollet, S. J.: Land use change impacts on European heat and drought: remote land-atmosphere feedbacks mitigated locally by shallow groundwater, Environ. Res. Lett., 14, 044012, https://doi.org/10.1088/1748-9326/ab0db3, 2019.
Zscheischler, J. and Fischer, E.: The record-breaking compound hot and dry 2018 growing season in Germany, Weather Clim. Extr., 29, 100270, https://doi.org/10.1016/j.wace.2020.100270, 2020.
Zscheischler, J. and Seneviratne, S. I.: Dependence of drivers affects risks associated with compound events, Sci. Adv., 3, e1700263, https://doi.org/10.1126/sciadv.1700263, 2017.
Zscheischler, J., Orth, R., and Seneviratne, S. I.: Bivariate return periods of temperature and precipitation explain a large fraction of European crop yields, Biogeosciences, 14, 3309–3320, https://doi.org/10.5194/bg-14-3309-2017, 2017.