the Creative Commons Attribution 4.0 License.
the Creative Commons Attribution 4.0 License.
 | 13 Feb 2025
Creating a national urban flood dataset for China from news texts (2000–2022) at the county level
Shengnan Fu
David M. Schultz
Heng Lyu
Zhonghua Zheng
Chi Zhang
Urban floods are increasingly threatening cities across China, emphasizing the need to understand their patterns. Current flood datasets primarily offer provincial-scale insights and lack temporal continuity, which leads to a challenge to detailed analysis. To address this issue, this study introduces a machine learning framework by applying online news media as a primary data source to create a county-level dataset of urban flood events from 2000 to 2022. Using the Bidirectional Encoder Representations from Transformers (BERT) model, we achieved a robust performance in information extraction, with an F1 score of 0.86 and an exact match score of 0.82. Further, a combined model of bidirectional long short-term memory (BiLSTM) networks with a conditional-random-field (CRF) layer effectively identified flood locations. The dataset documents the timing and affected county areas of urban floods, revealing that a total of 2051 county-level regions have been impacted, with 7595 occurrences recorded. This coverage represents approximately 46 % of China's total land area. Our analysis reveals that the temporal trend of flooded cities in our news-based dataset broadly aligns with that in the China Flood and Drought Bulletin, despite notable differences in the magnitudes of reported events during peak years. This news-derived dataset enables the analysis of urban floods in China from both natural and societal perspectives. Temporally, flood events occur predominantly in the summer, accounting for 74 % of the total number of flooding events. Excluding the peak year 2010, there is an observable increasing trend in flood events from 2000 to 2022. Spatially, flood frequency decreases from southeast to northwest, with Guangxi Province recording the highest number of floods. From a societal perspective, some economically developed regions with high population densities, such as Jiangsu and Guangdong, exhibit decreasing flood trends. This study provides a national dataset of urban flood events in China, highlighting spatiotemporal patterns for supporting flood management, planning, and strategy development.
- Article
(4379 KB) - Full-text XML
- BibTeX
- EndNote


Floods have been a recurring challenge in China throughout its history, with efforts to manage them spanning 4 millennia (Feng et al., 2023; Jiang et al., 2023). Cao et al. (2022) found that China and the United States were the two countries with the highest urban flood exposure, together accounting for approximately 61.5 % of the global increase. In recent years, Zhengzhou had torrential rainfall and subsequent flooding on 21 July 2021, resulting in 380 deaths and direct economic losses of USD 5.69 billion (Dong et al., 2022). In another example, Shenzhen experienced short-duration and extremely heavy precipitation on 11 April 2019, leading to floods and 11 deaths (Zhang et al., 2023b). Thus, urban flooding is an important risk factor affecting urban property and public safety in China.
Understanding the evolution of urban flood patterns is crucial for effective planning and management. Analyzing the temporal and spatial distributions of floods can reveal significant trends influenced by both natural and social factors, helping to identify flood-prone areas, which is essential for developing flood control strategies (Ahemaitihali and Dong, 2022; Zhang et al., 2023a). Previous studies have shown that historical flood datasets are vital for understanding these distribution patterns (Zhao et al., 2018; Wu et al., 2019; Xu and Tang, 2021).
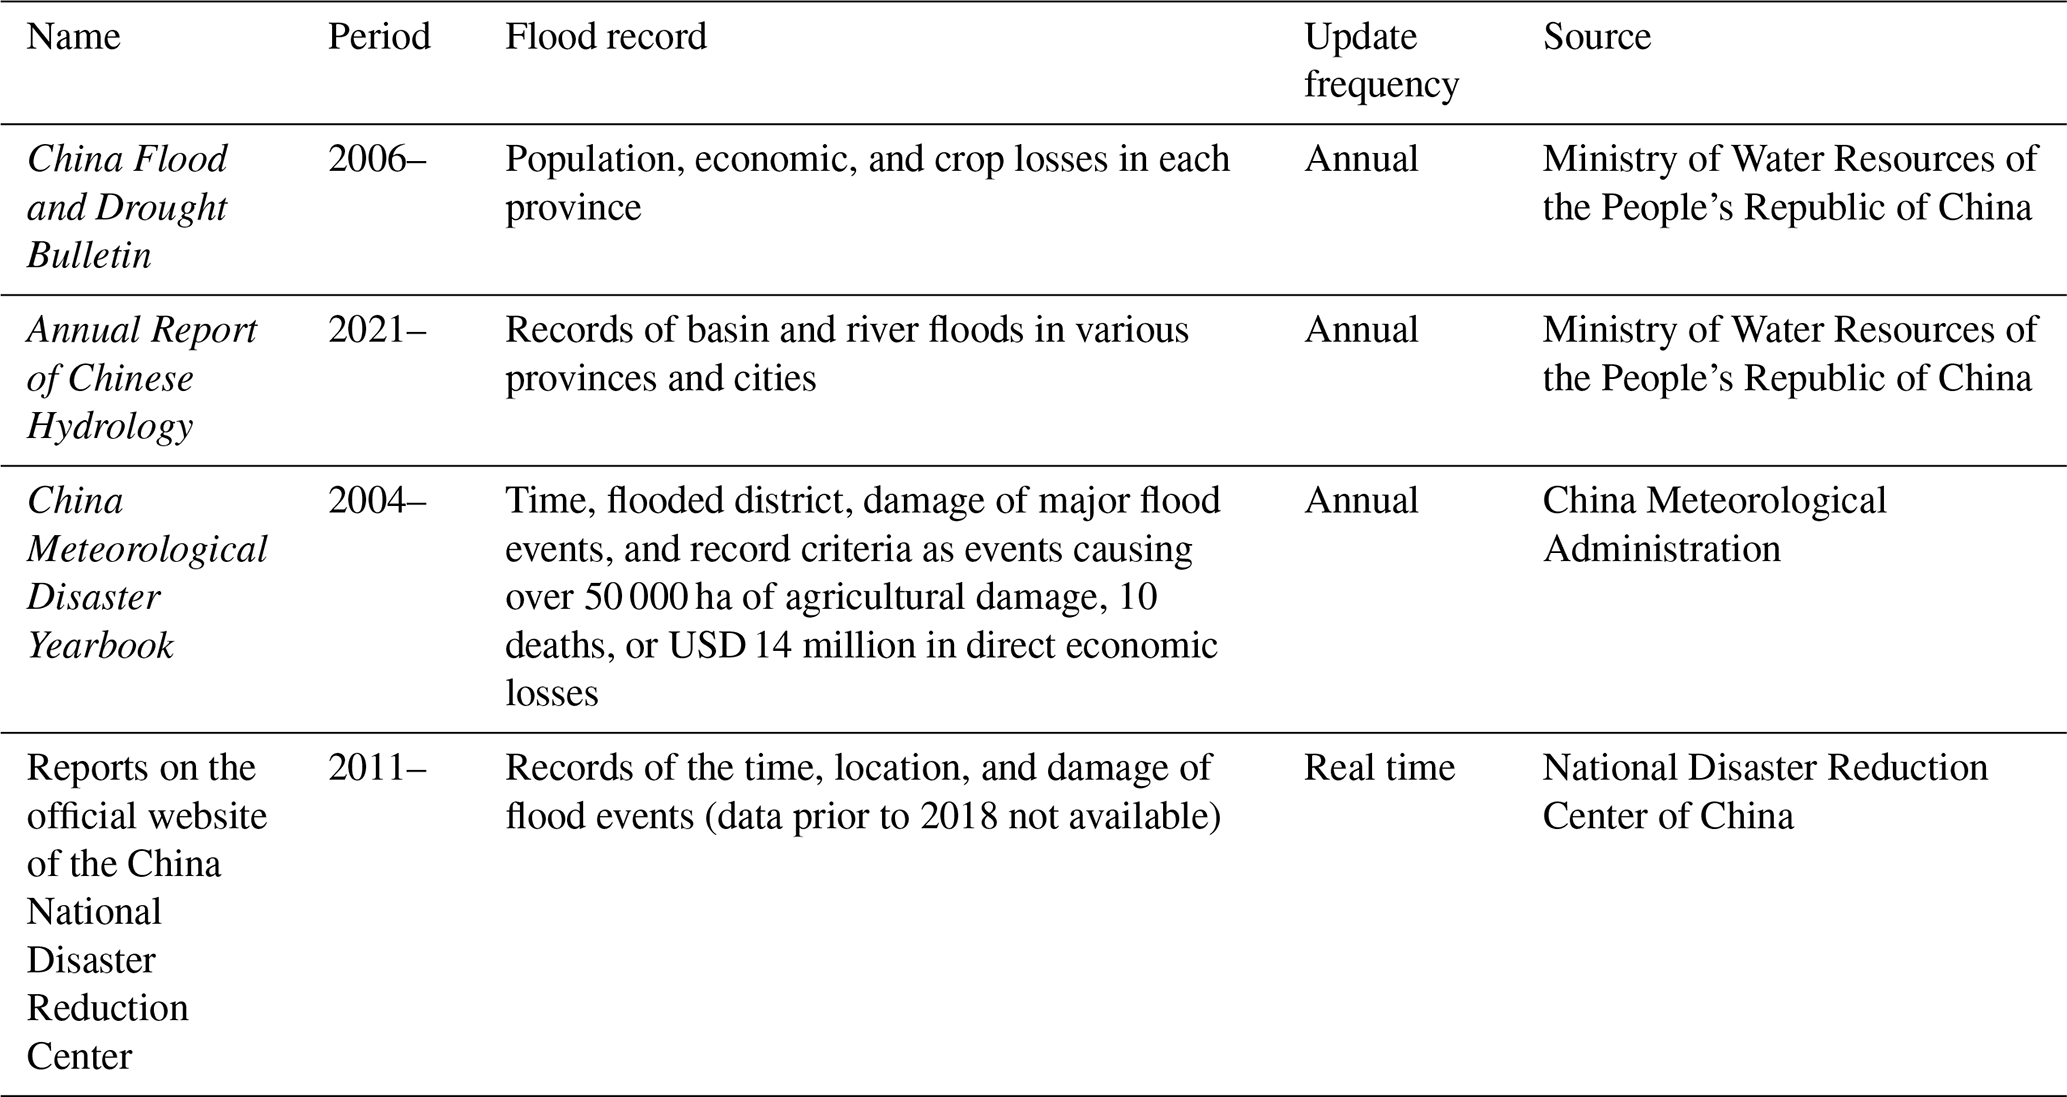
In China, the primary datasets for flood events are officially aggregated data, as summarized in Table 1. However, each of these datasets has its own specific applicability and limitations. Notably, the China Flood and Drought Bulletin provides the most reliable data on economic losses and flooded areas, covering both urban and basin flooding. However, it only includes the spatial distribution of accumulated disaster data at the provincial level. The Annual Report of Chinese Hydrology is more suitable for basin flooding studies than urban flooding studies, and it only began publication in 2021. The China Meteorological Disaster Yearbook only includes records of severe events that result in significant losses, leading to a smaller number of records of the more frequent urban floods that cause minor damage. Additionally, the information on the website of the China National Disaster Reduction Center is relatively detailed and similar to news reports, as both are documented at the time of disaster occurrence. However, the data collected before 2018 became inaccessible due to a change in the website that followed the creation of the Emergency Management Department of China in 2018.
In addition to the official Chinese datasets, there are several natural hazard datasets recording flood events created by other governments or organizations (Table 2). Each dataset has a different research perspective, which makes it impossible to create a long-term statistical analysis of historical urban floods in China. Based on the societal sources of information, the Emergency Events Database (EM-DAT) includes global disaster events with detailed information like timing, location, and losses but only focuses on severe events that meet specific damage criteria (Delforge et al., 2023). The Natural Disaster Data Book published by the Asian Disaster Reduction Center is an analysis of EM-DAT data specifically for the Asian region (https://www.adrc.asia/publications/databook/, last access: 5 October 2023). The Global Flood Monitor website (https://www.globalfloodmonitor.org/, last access: 5 October 2023) detects flood events by analyzing spikes in Twitter data streams (de Bruijn et al., 2019). However, due to the limited number of Twitter users in China, its coverage of flood events in the country is insufficient. FloodList (https://floodlist.com/, last access: 5 October 2023) identifies flood events from news texts, extracting information such as timing, location, and damages, but it lacks comprehensive historical data, making it more suitable for near-real-time studies.
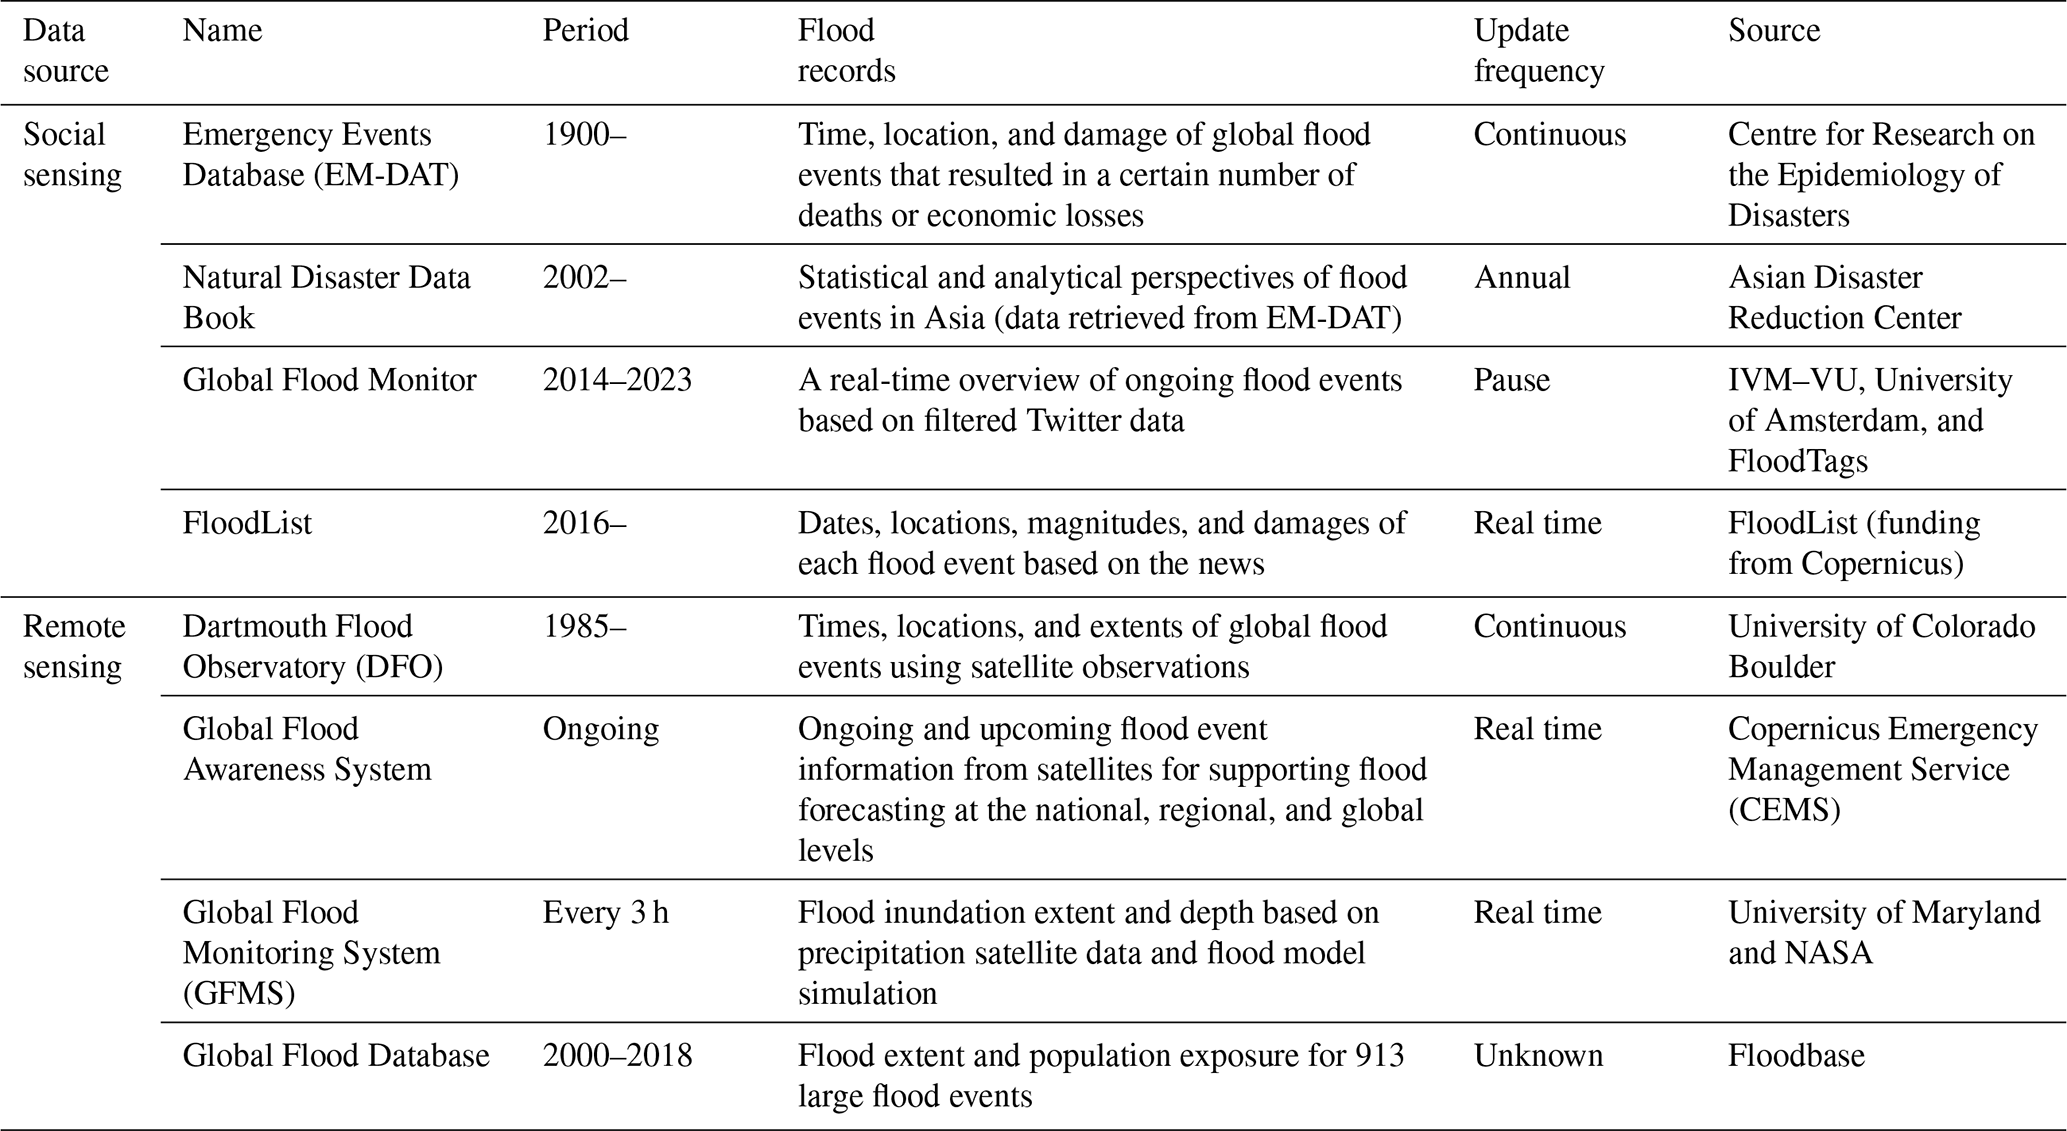
On the other hand, datasets based on remote sensing, such as the Dartmouth Flood Observatory, focus on global flood events with precise geographical details (latitude and longitude), but this dataset underrepresents floods in China, with fewer than 400 cases since 1985 (https://floodobservatory.colorado.edu/, last access: 5 October 2023). Both the Global Flood Awareness System in Copernicus Emergency Management (https://global-flood.emergency.copernicus.eu/, last access: 5 October 2023) and the Global Flood Monitoring System (http://flood.umd.edu/, last access: 5 October 2023) are excellent for real-time flood forecasting and inundation monitoring but are not suited for long-term historical analyses. Additionally, the Global Flood Database (Tellman et al., 2021) presents flood extent and population exposure for 913 large flood events, but it covers very few events in China.
The existing datasets provide valuable insights into urban flooding; however, they often operate at the provincial level or have limited event coverage across China. This broader scale can obscure important local variations in flood characteristics and risk factors. In China, the administrative structure consists of several levels: the highest is the provincial level, followed by the prefectural level (i.e., cities in the usual sense) and then the county level. Given China's vast area of approximately 9.6×10⁶ km2, flood characteristics exhibit significant spatial variability across provincial and prefectural regions (Wang et al., 2013; Shang et al., 2023). With around 2844 county-level areas, each spanning roughly 1000–3000 km2, this scale offers a more granular perspective for analyzing flood patterns across diverse locations.
To create an urban flood dataset, researchers often supplement governmental data with remote-sensing imagery (Huang and Jin, 2020; Shahabi et al., 2020) and field survey data (Eini et al., 2020; Darabi et al., 2021). While remote-sensing images have the potential to infer disaster progression, mapping urban floods presents inherent challenges, such as uncertainties caused by cloud cover (Datla et al., 2010; Donovan et al., 2019). In contrast, field surveys provide accurate, first-hand data, but the process is time-consuming and labor-intensive (Surampudi and Yarrakula, 2020; Feng et al., 2022), complicating the large-scale collection of historical flood events. Given these limitations, digital news media data have emerged as a promising alternative (Williamson, 2019; Antwi et al., 2022). Studies have shown that news data offer timely, authentic, and extensive coverage of disaster events. For example, Yang et al. (2023b) analyzed the clustering of multiple natural hazards in China based on news data, while Liu et al. (2018) used media data to extract characteristics of natural hazards, revealing the coexistence of meteorological and geological hazards. Our study aims to extend these efforts by developing a county-level historical flood dataset based on news data, with a focus on urban floods.
To extract flood events from news data, information extraction techniques in natural language processing are highly effective (Xiang and Wang, 2019; Olivetti et al., 2020). Machine-reading comprehension methods, particularly those using a question–answer format, have proven especially useful for nuanced information extraction (Wei et al., 2018; Farooq et al., 2020). Of these, pre-trained language models such as Bidirectional Encoder Representations from Transformers (BERT) (Devlin et al., 2018) demonstrate exceptional proficiency in capturing semantic relationships, making them well-suited to this task (Wang et al., 2021; Huang et al., 2021). The strength of the BERT model lies in its innovative bidirectional pre-training on large-scale unlabeled text data, such as Wikipedia and books, allowing it to effectively extract information across diverse fields (Xiong, 2020; Suwaileh et al., 2020). Additionally, employing named entity recognition (NER) methods, such as the bidirectional long short-term memory (BiLSTM) networks combined with a conditional random field (CRF) layer (Kundzewicz et al., 2019; Yan et al., 2024), in the outputs of BERT can enhance efficiency when identifying disaster-affected locations. The output from the question–answer process typically consists of relatively complete sentences, and NER is effective at identifying entities such as names and locations, providing direct information about disaster sites.
The abilities of natural language processing techniques, combined with the reliability of news data, provide us with an opportunity to create a new flood event dataset to address the absence of datasets at the county level. Therefore, this present study aims to develop a national county-level urban flood dataset from 2000 to 2022 based on news data by using a machine-learning framework. The performance of the BERT model in the field of flood disaster knowledge is examined, and the spatiotemporal characteristics of urban floods in China are analyzed based on news records.
Three kinds of datasets were used in this study. Section 2.1 describes Chinese machine-reading comprehension data called CMRC2018 and used to train the BERT model. Section 2.2 explains the news data used to extract information on urban flooding. Section 2.3 interprets the comparative data selected for the comparison of flood information.
2.1 CMRC2018
The CMRC2018 dataset is a span extraction dataset for Chinese machine-reading comprehension, consisting of nearly 20 000 real-world questions annotated by human experts on Wikipedia paragraphs (Cui et al., 2018). The task of reading comprehension is to obtain the corresponding answer from a given context and question, and span extraction indicates that the content of the answer is all in the context. The length of the span is determined by the distance between the start and end positions of the answer. The dataset used in this study contains 2282 training samples. Each sample consists of a group (C, Q, and A), where C represents the context, Q represents the questions, and A represents the answers. The answer to each question should be a span extracted from the context. Figure 1 shows an example including a context describing a model's resume and a question about the content of the context and the corresponding answer. In this study, the CMRC2018 dataset was used to fine-tune the BERT model to adapt to the Chinese machine-reading comprehension task.

2.2 News data
The news used in this study was collected from two Chinese newspaper databases covering the whole of China, i.e., WiseNews (https://www.wisers.com/wisesearch, last access: 25 January 2023)) and the newspaper database of the China National Knowledge Infrastructure (CNKI) website (https://navi.cnki.net/knavi/newspapers/index, last access: 22 January 2023). WiseNews is a full-text news database providing access to more than 600 newspapers, magazines, and websites from China, with coverage dating back to 1998 and with daily updates. The CNKI database contains news from over 500 major newspapers in China, spanning 2000 to the present. A key distinction between these two databases is that CNKI applies specific selection criteria for academic and informative documents, resulting in differences in the volume of search results for the same keywords. The newspaper sources collected by the WiseNews database could cover the newspaper sources collected by CNKI.
CNKI was chosen as the primary data source for manually extracting the spatiotemporal information on flood events due to its higher concentration of academic and informative content. A total of 2730 news articles from 2000 to 2021 was gathered using the subject keywords “flood” OR “flood disaster” and the full-text keywords “city” OR “county” OR “district”. Although other meteorology-related terms such as “typhoon”, “cyclone”, or “heavy rainfall” may also be associated with flood events, there were few cases where flood-related news mentioned only flood-related terms like typhoon. For instance, a separate query using the term “heavy rain” only yielded about 7 % of relevant reports on actual flood events, with the majority of the results being meteorological warnings. To ensure a relevant dataset and improve model efficiency, this study limited the search terms to those most directly related to flooding.
Once the CNKI data were collected, duplicate reports of the same urban flood events from different regional newspapers were manually removed by the lead author. Articles containing search keywords but focused on flood prevention measures, seasonal warnings, or other non-flood-related topics were also excluded. Additionally, as the focus of this study is on urban flooding, reports about flash floods and landslides were omitted. The final dataset, after manual review and verification by the researchers in the group, consisted of 253 relevant news articles.
After successfully applying the method to the CNKI data, the WiseNews database was used to extract flood-related information. To refine the search and improve the data quality, the terms “floods and beasts” and “flash flood” were excluded due to their tendency to retrieve unrelated news, based on the experience of processing CNKI news data. “Floods and beasts” is an idiom in Chinese that is often used as a metaphor for frightening things. It contains the word “flood”, so some unrelated news items that used it to describe other disasters or bad phenomena may be included in search results. Therefore, the refined search strategy used was (“flood” OR “flood disaster”) AND (“city” OR “county” OR “district”) NOT (“flash flood” OR “floods and beasts”). This search produced a total of 46 118 news items spanning the period from 2000 to 2022.
2.3 Comparative data
The summary descriptions of flooded cities in the China Flood and Drought Bulletin (Table 1) were used for comparison with the number of flood events reported in news articles. Although the bulletins provide annual flood loss data at the provincial level, which is not directly comparable to the county-level flood information extracted in this study, they do include statistics on the number of cities affected by floods from 2006 to 2018. Given the absence of more proper data, these city-level statistics were used as a basis for comparison with the flood occurrences identified in our research.
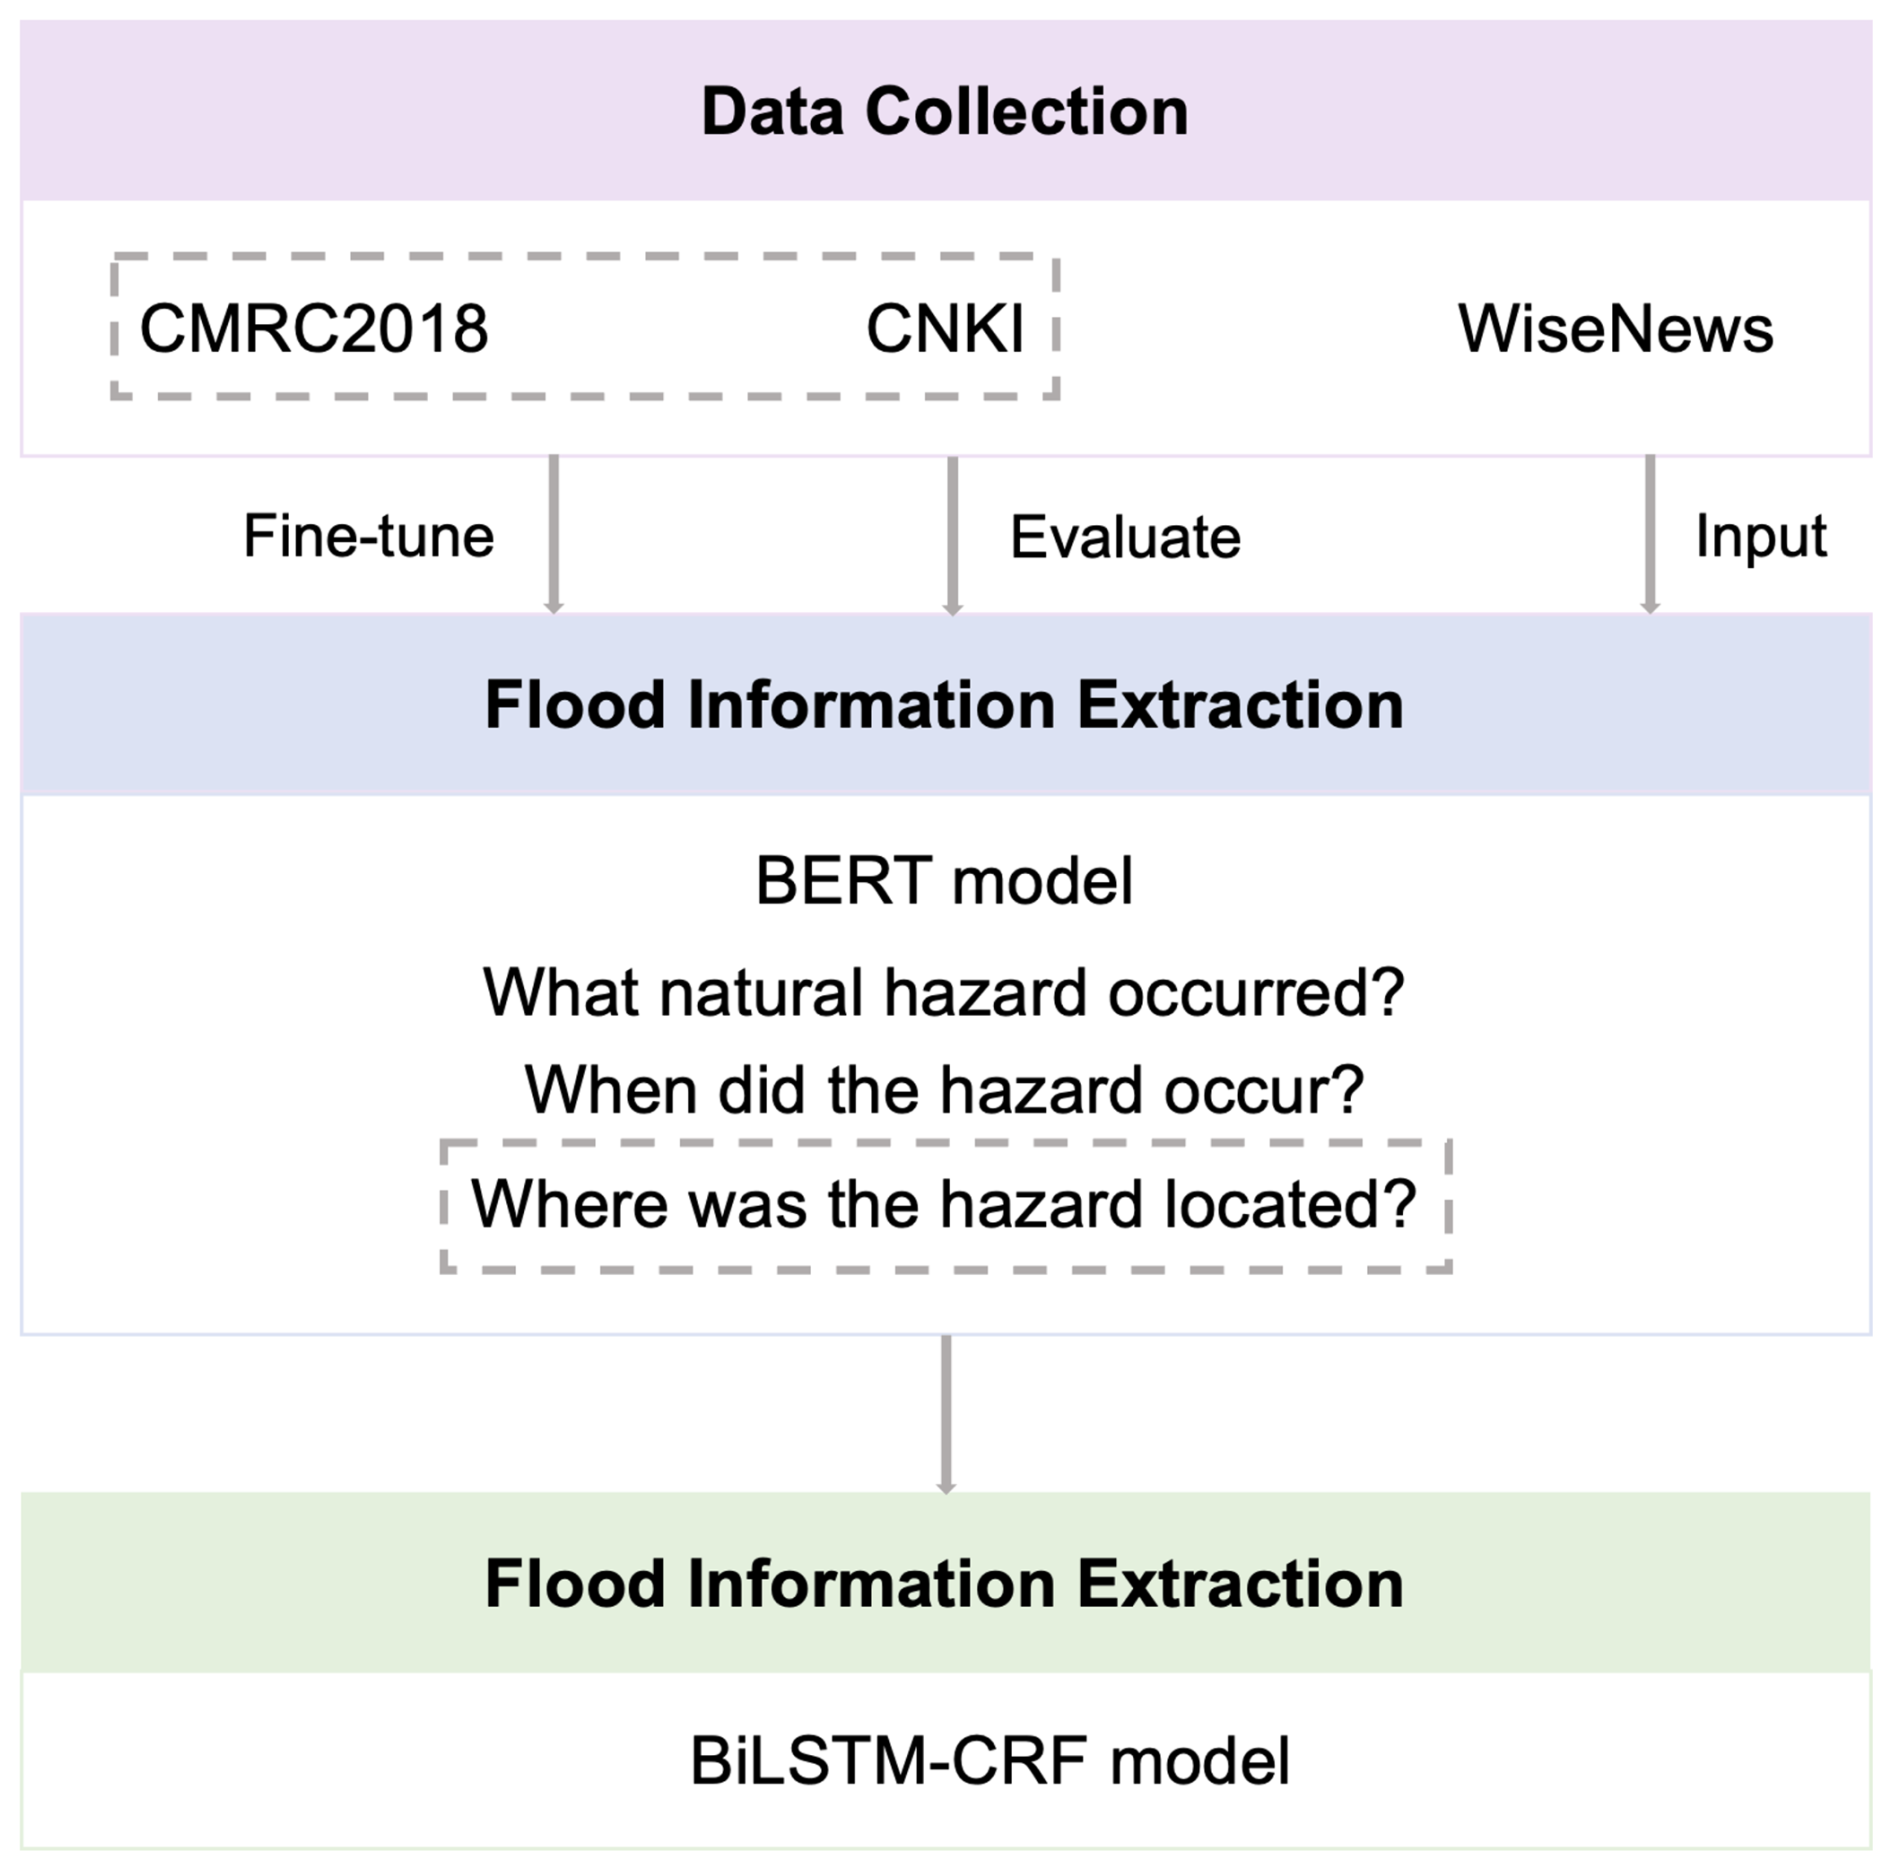
In this study, a machine-learning framework was adopted to extract spatiotemporal flood event information from news texts (Fig. 2). Section 3.1 describes the data preparation for the model construction. Section 3.2 shows how to build and apply the BERT model to extract flood information. Section 3.3 explains the flood location recognition methods based on a NER model. Section 3.4 introduces the evaluation metrics for model performance.
3.1 Data preparation
In this study, data preprocessing involved both cleaning and splitting of the news texts. Initially, the documents downloaded from the databases contained irrelevant content, such as copyright notices, web links, and empty lines, which were removed using the regular expression (“re”) module in Python. Additionally, since news documents could be lengthy and exceed the input length limitations of the BERT model, the texts were split into smaller samples.
Once the preprocessing was complete, the CNKI news texts were manually annotated following the CMRC2018 data format. Each news article was treated as a context, and three questions were developed to extract urban flood-related information: (1) “What natural hazard occurred?” (2) “When did the hazard occur?”, and (3) “Where was the hazard located?” The answers were labeled manually based on the content of each article. While the training samples were fully annotated with both questions and answers, the test samples retained the question format but did not include the answers, leaving those to be generated by the model.
The CNKI news articles were then divided into 633 distinct samples. Of these, 503 were randomly selected as training samples, and the remaining 130 were set aside as test samples to evaluate the model performance. For training, 80 % of the samples (402) were combined with the CMRC2018 dataset to fine-tune the BERT model, while 20 % (101) were used for validation to optimize the model's hyperparameters. During the test phase, the answers generated by the model for the CNKI test samples were reviewed manually to assess the accuracy. Once the model was confirmed to perform effectively, it was applied to the WiseNews dataset for further analysis.
For the WiseNews data, it only needs to be formatted as a test set for direct application with the trained model, without requiring manual answer annotations. Future data will follow the same process, further enhancing analytical efficiency.
3.2 BERT model construction and application
BERT, which is designed to pre-train deep bidirectional representations from large unlabeled datasets (Devlin et al., 2018), was introduced to extract flood information in this study. The model structure is a multilayer bidirectional transformer encoder, which is an attention mechanism that learns contextual relations between words. Unlike other traditional bidirectional language models where the contextual representation of each token is a concatenation of the forward and reverse representations, the transformer encoder reads the entire sequence of words at once. There are two procedures for constructing a BERT model: pre-training and fine-tuning.
For pre-training, the model is trained on unlabeled text data using two unsupervised training strategies. First, BERT proposes a masked language model, inspired by the cloze task (Taylor, 1953), in which 15 % of input tokens are randomly replaced by a special placeholder token called a “mask”. The model then attempts to predict the original tokens that were masked. Secondly, BERT adopts next-sentence prediction as part of the training process. This binary task helps the model understand relationships between sentences by taking pairs of sentences as input and determining whether the second sentence follows the first one in the original text.
Following pre-training, the downstream task for fine-tuning in this study involves extracting answers from the context based on posed questions. In typical applications, BERT models predict where answers start and end in a text by adding a classification layer known as softmax. The process begins with tokenization, where the text is divided into smaller units called tokens that can represent words, phrases, or punctuation marks. Then, the model calculates the probability of each token being the start and end of an answer. This allows the model to identify a continuous text fragment as an answer, which is suitable for scenarios where a single optimal answer is required. However, the locations affected by a flood event are generally not unique, and the descriptions of multiple disaster areas in the news may be scattered in discontinuous statements. This requires a method that can extract multiple answers for our study.
To enhance the model's ability to manage multiple answers, a BIEO (beginning, inside, end, outside) tagging layer is integrated into the input (Li et al., 2019). This modification enables the model to predict one of four possible tags for each token: “beginning” for the starting token of an answer, “inside” for intermediate tokens within an answer, “end” for the final token of an answer, and “outside” for tokens that do not form part of the answer. This approach allows the model to recognize multiple independent answer fragments within a paragraph, because each answer fragment is marked by an explicit start and end and is connected by an intermediate tag. This enhanced ability makes the model exceptionally suitable for complex, multi-answer scenarios like analyzing fragmented disaster reports. Figure 3 shows the overall structure of the model used in the present study. Here, the context and query processed through the BIEO tagging layer, together with their semantic information, are learned using the BERT structure. Finally, the probabilities of each token belonging to the BIEO layer of the answer are determined through a linear layer and the softmax function. The BERT base model was fine-tuned for three epochs (i.e., the number of times the entire training dataset is passed through the model during the training process) with a learning rate (i.e., a hyperparameter that controls the step size at each iteration while moving towards a minimum of the loss function) of and a batch size (i.e., the number of training examples used in one iteration of the model) of 8, which were determined to be the most effective combination of the tested settings. The results of the other combinations can be found in Table A1.
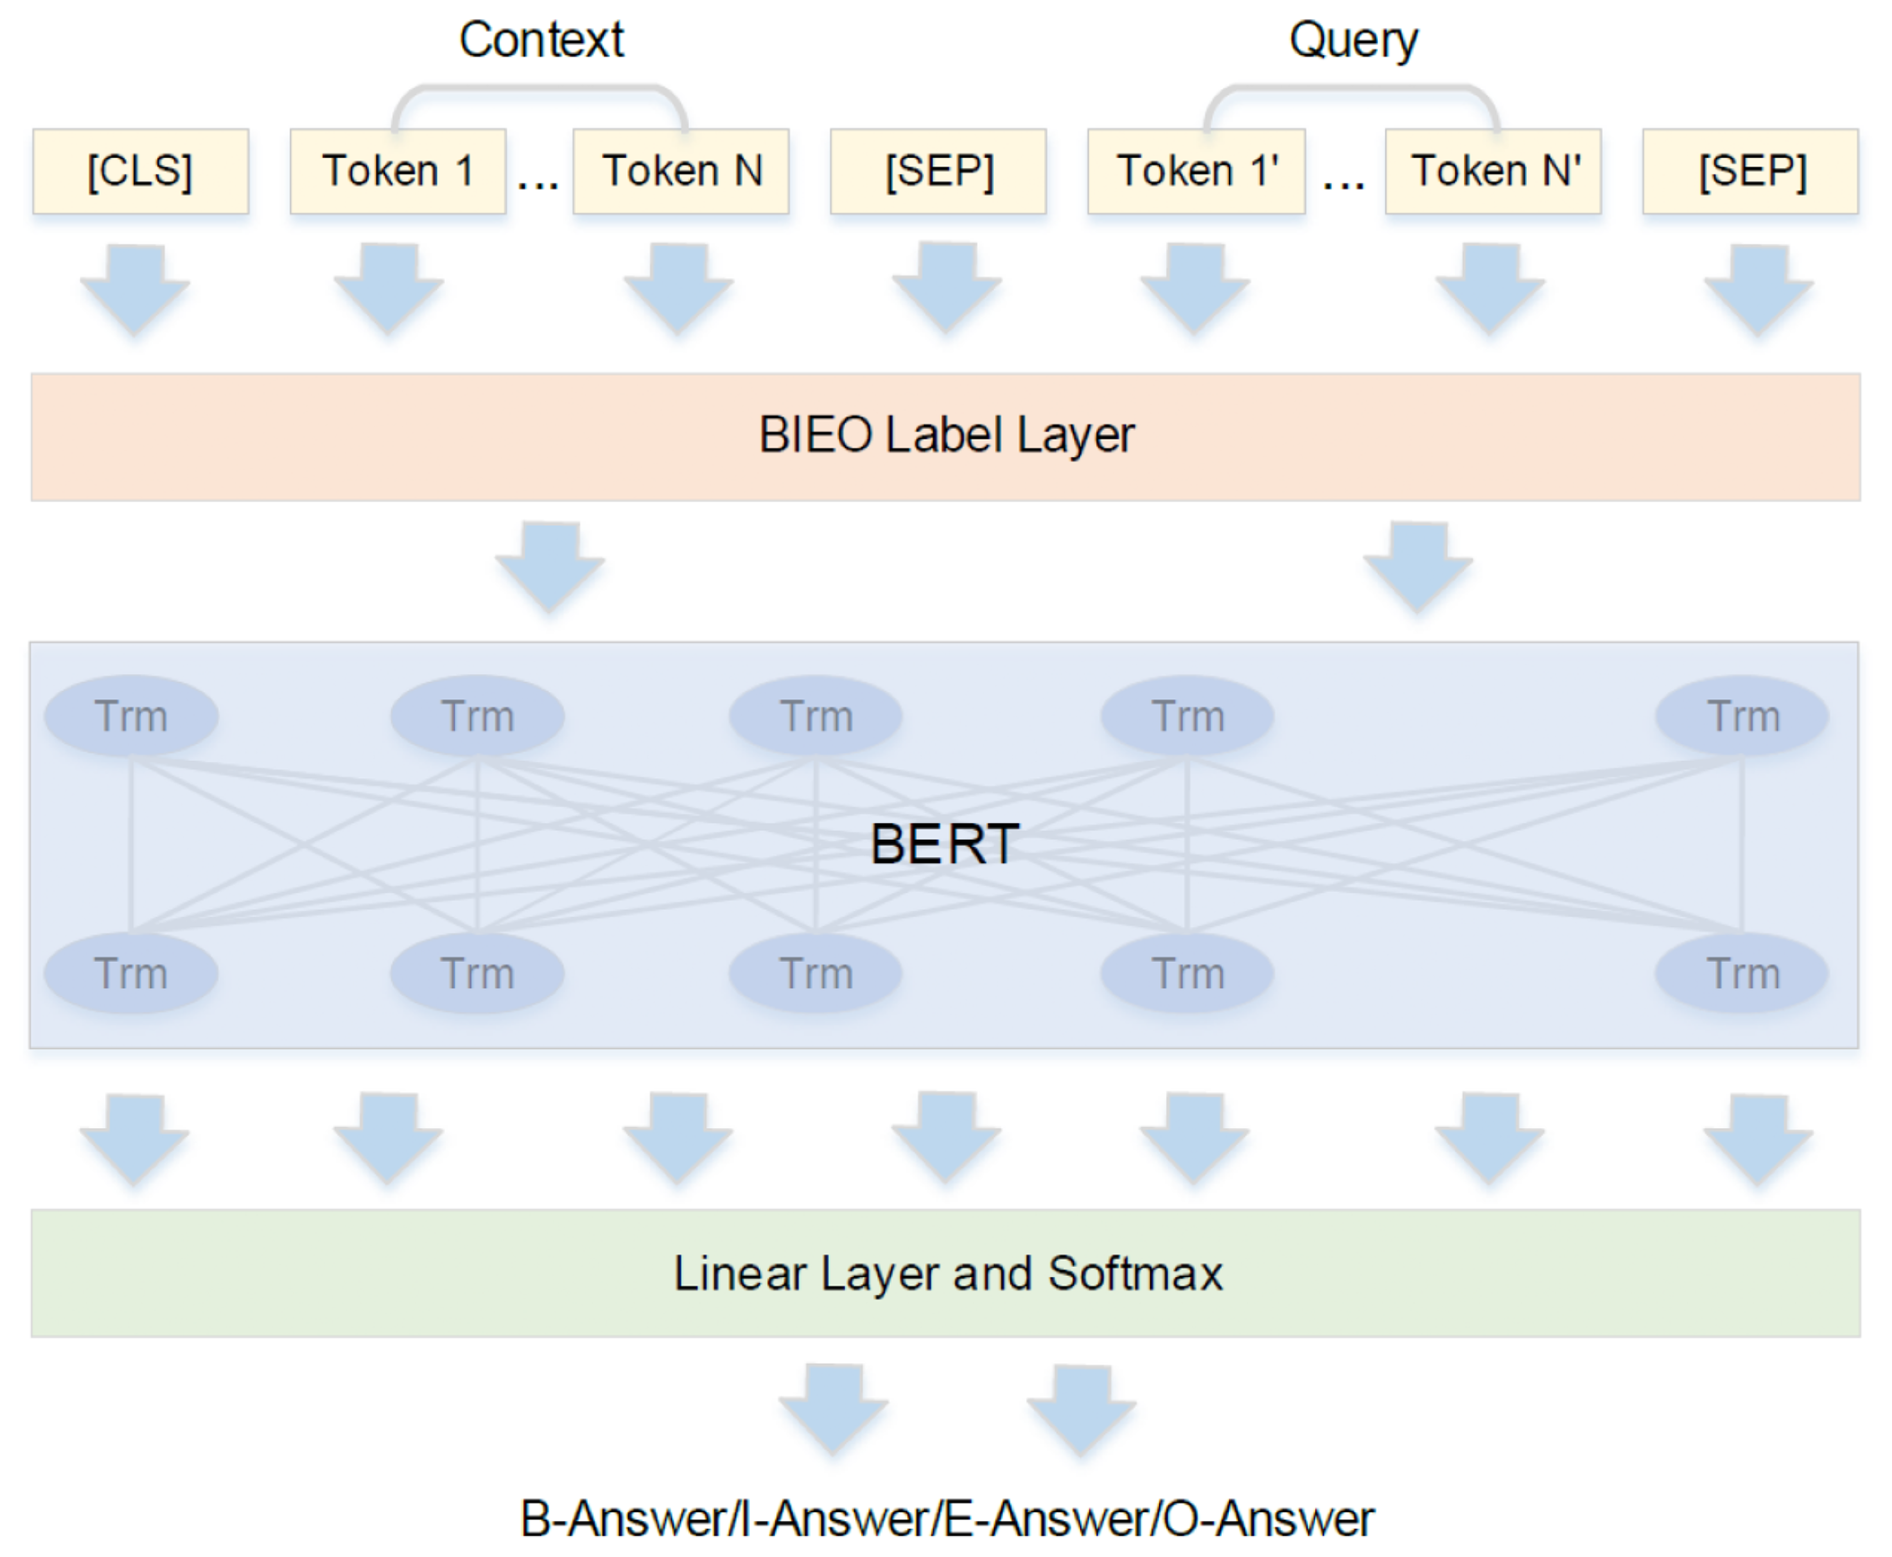
Figure 3The structure of the BERT model proposed in this study. [CLS] and [SEP] are special markers that identify the beginning and end of an input text. [CLS] stands for “classification”, and adding a [CLS] token at the beginning of the input text allows the model to learn a representation for the whole sentence. [SEP] stands for “separator”, used mainly to separate different sentences or pieces of text. The “Trm” inside BERT represents the transformer architecture.
To build the set of urban flooding events, the output of the BERT model needs to be confirmed and collated further. The first step is to check whether the news contains a flooding event. If the answer to Question 1, “What hazard happened?”, contains the keywords “flood” or “flood disaster” and does not contain the word “will”, which indicates the forecast, the news sample is considered to describe a flood disaster event. As the long-text news is split into different samples in the preprocessing procedure, the news can be confirmed as long as one of the answers of multiple samples belonging to the same news meets the conditions. For the time information, once the answer to Question 1 is confirmed to be an urban flood event, then the answer to Question 2 is the time of the flood and the year information is the year of the news release if the answer does not include the year. For the location information, similar to confirming the time information, if the answer to Question 1 is confirmed, then the answer to Question 3 contains the flood locations.
To evaluate the impact of training data selection on model performance, we also conducted several cross-validation experiments. First, we combined the original training set and validation set to create a comprehensive dataset containing all the annotated samples, for 503 in total. In each iteration of the cross-validation, we randomly shuffled the comprehensive dataset using different random seeds to ensure data order diversity and experiment reproducibility. Specifically, in five iterations, we set different random seeds (from 0 to 4) and used Python's random module to shuffle the data.
After each random shuffle, we selected the first 402 samples (consistent with the size of the original training set) as the new training set. By keeping the training set size consistent, the differences in model performance were solely due to the selection of the training data rather than changes in the data size. Then, the BERT model was fine-tuned on each new training set and the Friedman test was used to assess the statistical significance of performance differences between different fine-tuned models.
3.3 Urban flood location recognition
The flood location answers output by the BERT model typically include cities, counties, or districts as well as, in some cases, specific streets or buildings. Additionally, in most answers, there is not only the name of the place itself, but also the characters before or after it (e.g., “it occurred in Hangzhou”). Therefore, a BiLSTM–CRF model was adopted to further extract the pure place names from the answers. BiLSTM is a deep-learning model that captures context information from sequence data, while CRF is a probabilistic graphical model used for sequence labeling that considers dependencies between labels. In the NER model, a BiLSTM layer is adopted to extract features from the input character vectors. Then, the CRF layer uses the output from BiLSTM to compute the most likely sequence of labels considering the dependencies between them. The model was trained using the Microsoft Research Asia (MSRA) named entity recognition corpus, a widely used dataset that contains a large number of annotated Chinese sentences with named entities such as locations, persons, and organizations. The model framework used in this present study is detailed in Fu et al. (2022). Then, the spatial information was standardized by using county or district names (in China, counties and districts are at the same administrative level, and both are included in cities).
After identifying the flood locations, it was essential to verify and revise the list of places, in accordance with the latest national administrative divisions. Because the data span the period from 2000 to 2022, they include periods during which several regions in China underwent administrative adjustments or renaming. To ensure accuracy and relevance when associating these locations with the administrative division shapefile for spatial visualization in ArcGIS, the changed names of districts or counties should be checked to reflect the current administrative divisions. This step was crucial for maintaining consistency and ensuring that the visualizations accurately represent the latest geographical borders. After that, flood locations were matched with the administrative division shapefile and visualized using ArcGIS.
3.4 Evaluation metrics
In this study, two evaluation metrics were used to assess the effectiveness of (i) flood event detection and (ii) flood information extraction. These metrics are common across a number of disciplines but use different names (Brooks et al., 2024). Initially, the identification of flood events was treated as a classification problem, using precision, recall, and F1 score to evaluate the accuracy of predictions. The metrics were calculated as
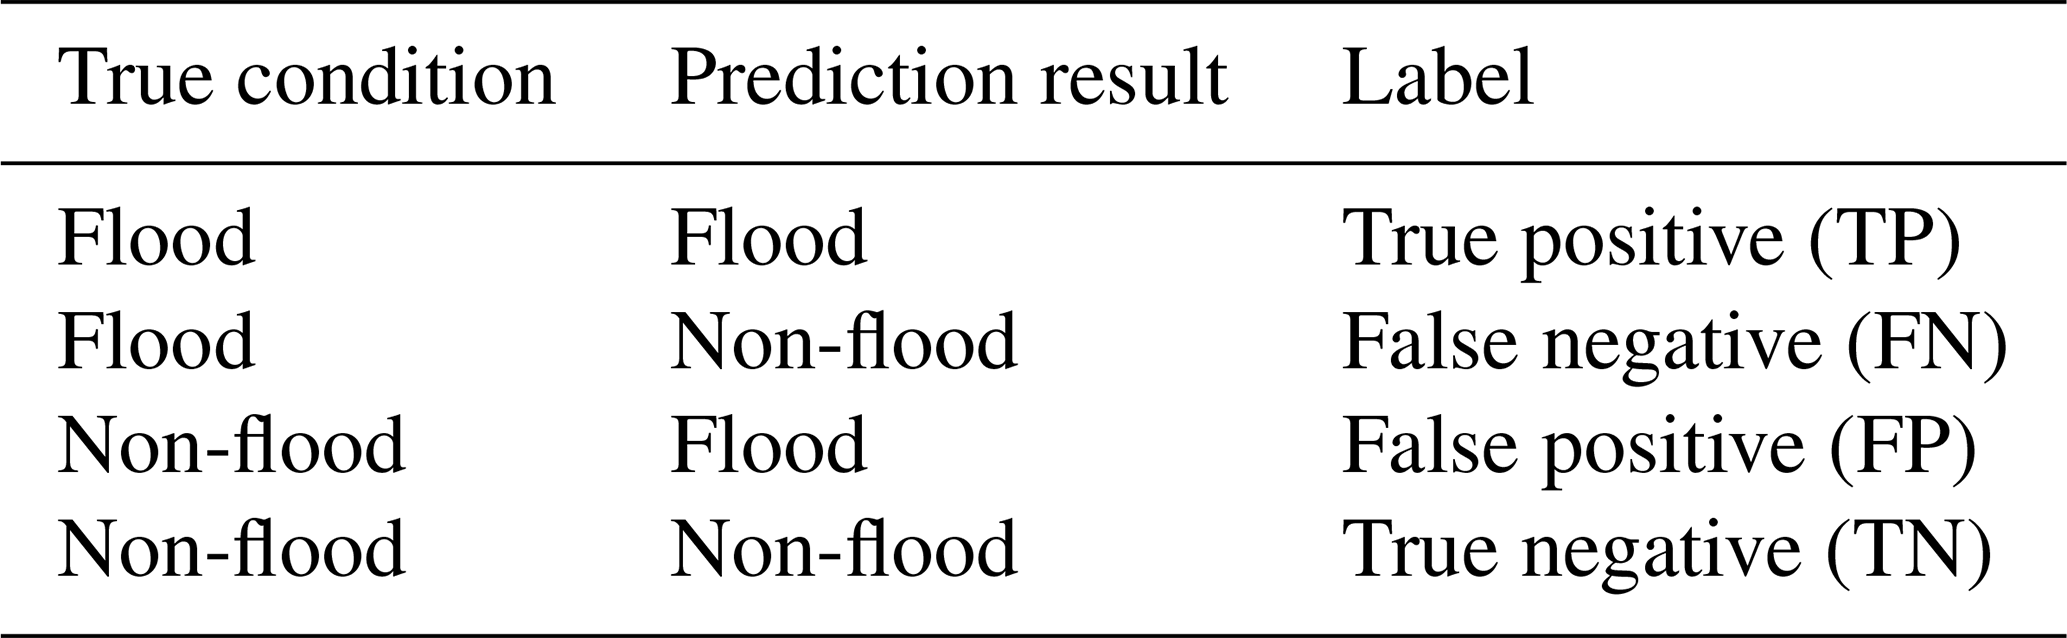
For the computation of these indexes, Table 3 explains the classification outcomes in terms of true positives (TPs), false positives (FPs), false negatives (FNs), and true negatives (TNs). Of these metrics, precision is defined as the ratio of correctly predicted flood news to all predictions labeled as flood events. Recall measures the proportion of correctly predicted flood news to all actual flood events. The F1 score combines the precision and recall scores as the harmonic mean, providing a balanced view of the model's performance. A higher F1 score indicates a superior model performance.
Furthermore, for the extraction of urban flood event information, two matching criteria were applied (Rajpurkar et al., 2016). The first index is called the exact match (EM), which measures the matching degree between the prediction and ground truths. The score is 1 for the EM of both the time and location information extracted. Otherwise, the score is 0. There is usually more than one disaster location in one flood event, and maybe the model can output several albeit not completely accurate locations. Therefore, a fuzzy match was used to evaluate the location extraction using precision, recall, and F1 score. Unlike the classical formula, the precision and recall were calculated as
where P represents the number of accurately extracted flood locations, M is the total number of predicted flood locations, and N is the total number of actual flood locations observed in the texts. The F1 score was computed using the classical formula as in Eq. (3), providing a balanced view of the quality and completeness of the predicted locations.
The Results section consists of three primary parts. Section 4.1 evaluates the BERT model's performance using different metrics. Section 4.2 shows a comparison between the number of floods extracted from the news and the China Flood and Drought Bulletin. Section 4.3 presents the content of the news-based urban flood dataset and an analysis of spatiotemporal characteristics from both natural and societal perspectives.
4.1 The performance of the BERT model
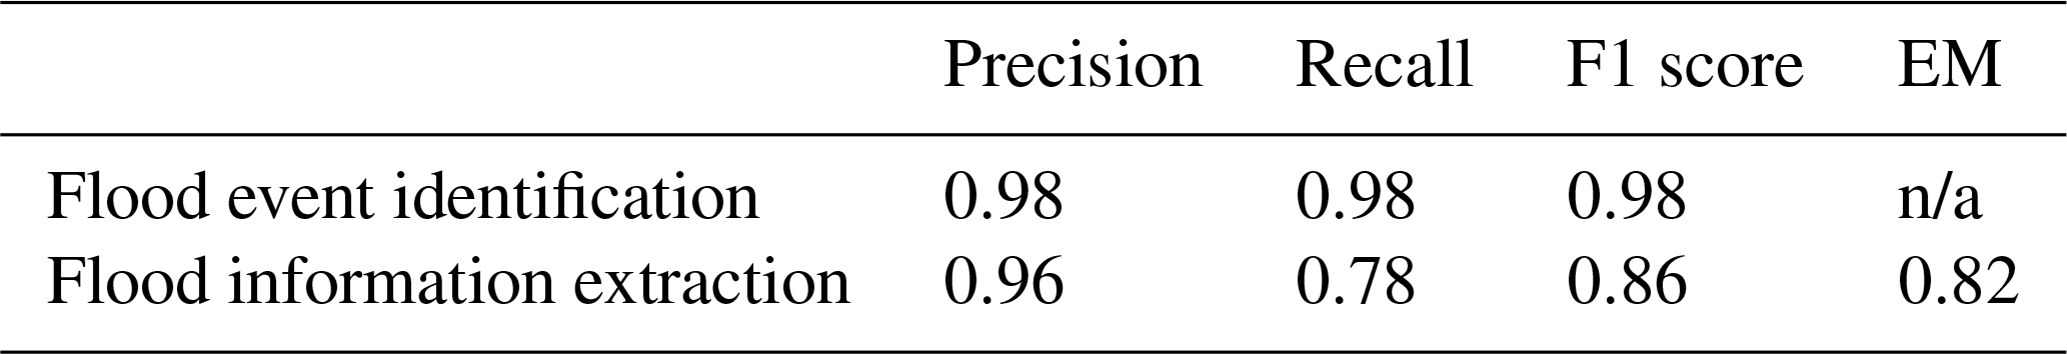
The effectiveness of flood event recognition and flood information extraction is presented in Table 4. The BERT model demonstrates excellent performance in identifying whether an event is a flood, achieving an impressive F1 score of 0.98. On the other hand, the overall performance of flood information extraction is satisfactory, with an F1 score of 0.86 for location extraction and an EM of 0.82 for both time and location extraction. The high F1 score and EM values (over 0.80) demonstrate that integrating domain-specific knowledge enabled the model to respond to questions about flood information.
Table 4The performance of the BERT model (the EM index was not applied to evaluate event identification). n/a: not applicable
The performance of the BERT model in this study is competitive within the broader field of information extraction and Chinese natural language processing (NLP). For example, Yang et al. (2022) employed a BERT-based model for Chinese NER and achieved F1 scores of 94.78 % in the MSRA dataset and 62.06 % in the Weibo dataset, which is a Chinese social media platform. The stark difference in performance underscores the challenges of semantic understanding in less structured media data compared to more formal datasets like MSRA. Similarly, Kim et al. (2022) developed a BERT-based question–answer method for extracting infrastructure damage information from textual data, achieving F1 scores of 90.5 % and 83.6 % in hurricane and earthquake datasets, respectively.
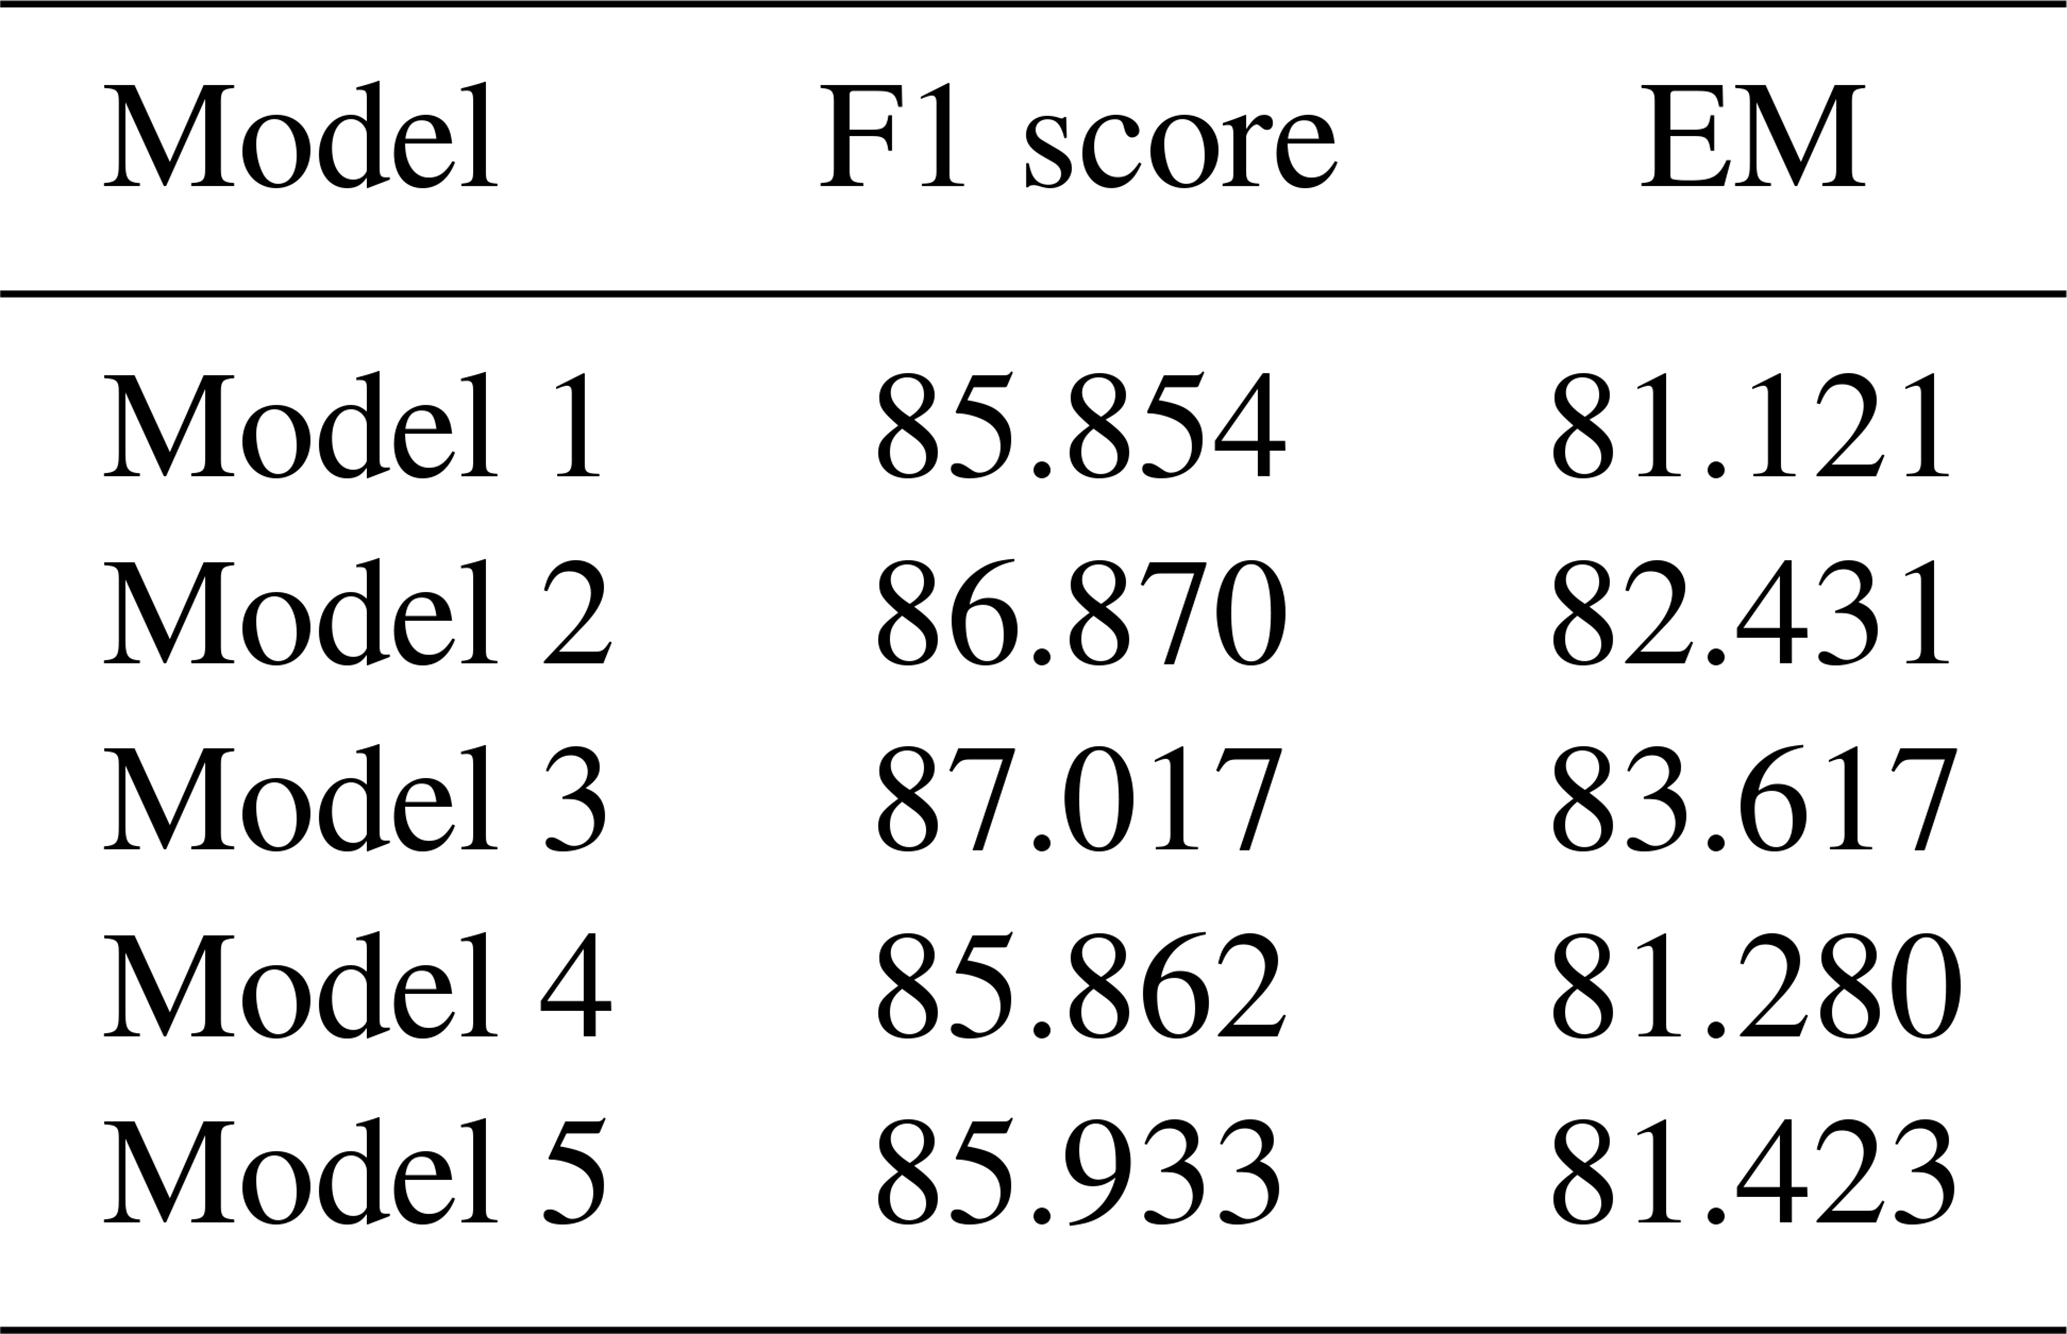
The cross-validation experiments yielded a consistent model performance across the different training data selections. Table 5 summarizes the F1 score and the EM of the flood information extraction for each model. To statistically assess the differences between the models, we performed the Friedman test. The test resulted in a p value of 0.38, indicating that there are no statistically significant differences in performance between the models (p>0.05). This suggests that the model is robust and that the training data selection in the current study is appropriate.
Table 5Performance metrics for each cross-validation experiment.
4.2 Comparison of the urban flood information
To evaluate the news-based flood dataset, a comparative analysis was conducted using records from the China Flood and Drought Bulletin. The comparison of annually flooded cities from the China Flood and Drought Bulletin with those identified in news sources between 2006 and 2018 is displayed in Fig. 4a. In addition, the year-to-year difference in the number of flooded cities between the two datasets is visualized to provide a more intuitive representation of interannual variations. As shown in Fig. 4b, the trend of the news-based dataset closely follows the overall temporal pattern observed in the China Flood and Drought Bulletin. This suggests that the dataset created in the present study can reliably reflect changes in flood events across different regions, though news media consistently underestimate the number of cities affected by floods.
Identifying specific biases is challenging because the China Flood and Drought Bulletin only provides the total number of flooded cities, without listing an inventory of the specific locations. This limitation makes it impossible to pinpoint which specific events or regions are underreported in our dataset. However, we can hypothesize that the biases stem from the intrinsic characteristics of news data.
Some previous studies have also reflected the bias involved in developing disaster catalogs using reports (Gall et al., 2009; Delforge et al., 2023). From the perspective of media communication studies, agenda-setting theory posits that, by choosing which events to report on, the media effectively signal to the public which issues are important (Leidecker-Sandmann et al., 2023). Through the quantity and depth of coverage, the media can shape the level of public attention given to certain events. In the context of disaster reporting, the government may influence the direction of media coverage to control public attention on specific disasters (Bai, 2022). For example, during the COVID-19 pandemic, research on governmental crisis communication showed that media agenda setting was significantly influenced by government press conferences (Hayek, 2024). Crisis communication theory also explains how governments can swiftly steer public opinion in the aftermath of a disaster, reducing the spread of negative emotions and maintaining social stability (Zhou et al., 2023). As a result, the variability in disaster reporting by the media may be influenced by multiple factors, including government policies, public interest, and the media's own resource allocation, leading to a situation where the volume of media reports is not necessarily consistent with the actual number of disaster events.
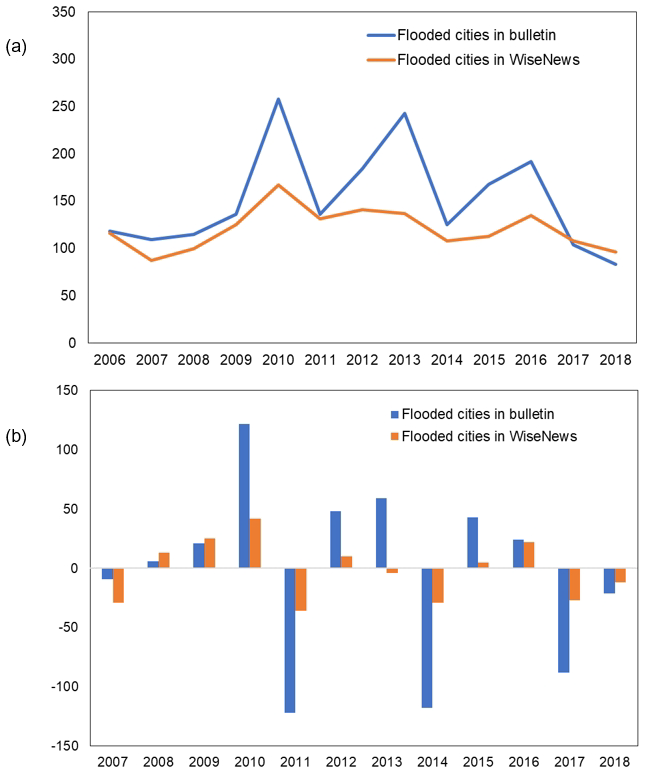
Figure 4The comparison between the number of flooded cities extracted from the news and the China Flood and Drought Bulletin for each year. (a) The time series of both datasets. (b) Year-to-year changes in both datasets, with the y axis showing the difference in values from the previous year. The positive bars indicate an increase compared to the previous year, whereas the negative bars indicate a decrease.
4.3 The urban flood dataset
After using a mixed strategy for the accuracy evaluation of the news-based flood information, this section introduces the temporal and spatial distributions of the national urban flood dataset. The dataset records urban flood events reported in news articles from 2000 to 2022, including the timing of these events at the day level and the affected areas at the county level. Currently, the dataset has a total of 2051 counties affected by flood disasters during these years, with a total occurrence of 7595. Section 4.3.1 shows the temporal distribution with the monthly changes in the number of flood events in county-level regions. Section 4.3.2 shows the spatial distribution of the total number of floods in county-level regions, along with the trend of floods from natural and societal perspectives.
4.3.1 Temporal distribution of flood events
Figure 5 shows the temporal distribution of historical flood locations in China from 2000 to 2022. It shows the flood occurrence for each month of every year, with darker colors indicating more frequent floods. The comparison of monthly flood occurrences across different years shows little variation, which reveals an evident seasonal cycle. The summer months (June–August) experienced a higher occurrence of flooding, accounting for 74 % of the total flooding events. In contrast, the winter season (December–February), which recorded few flood events, only accounted for 1 %. This is impacted by the seasonality, where precipitation is concentrated in summer. The seasonal characteristics are consistent with the findings of the Xu and Tang (2021) analysis of multi-disaster data from 2011 to 2019 in China, which showed that floods predominantly occurred from April to September, with the highest frequency in July.
Over these years, the total number of flood events per year did not show a continuous increase but rather a rise and fall, with a peak in 2010. This pattern is consistent with the trends observed in the China Flood and Drought Bulletin (Fig. 4). Data from the early 2000s show a notably low occurrence of flood events due to a low volume of news data. Excluding this minimum, the year 2003 emerges as having the lowest number of flood events. The year 2010 stood out with the highest occurrence of floods, significantly impacting 525 counties. After 2010, excluding the impact of the peak values, the overall trend shows a slight increase again.
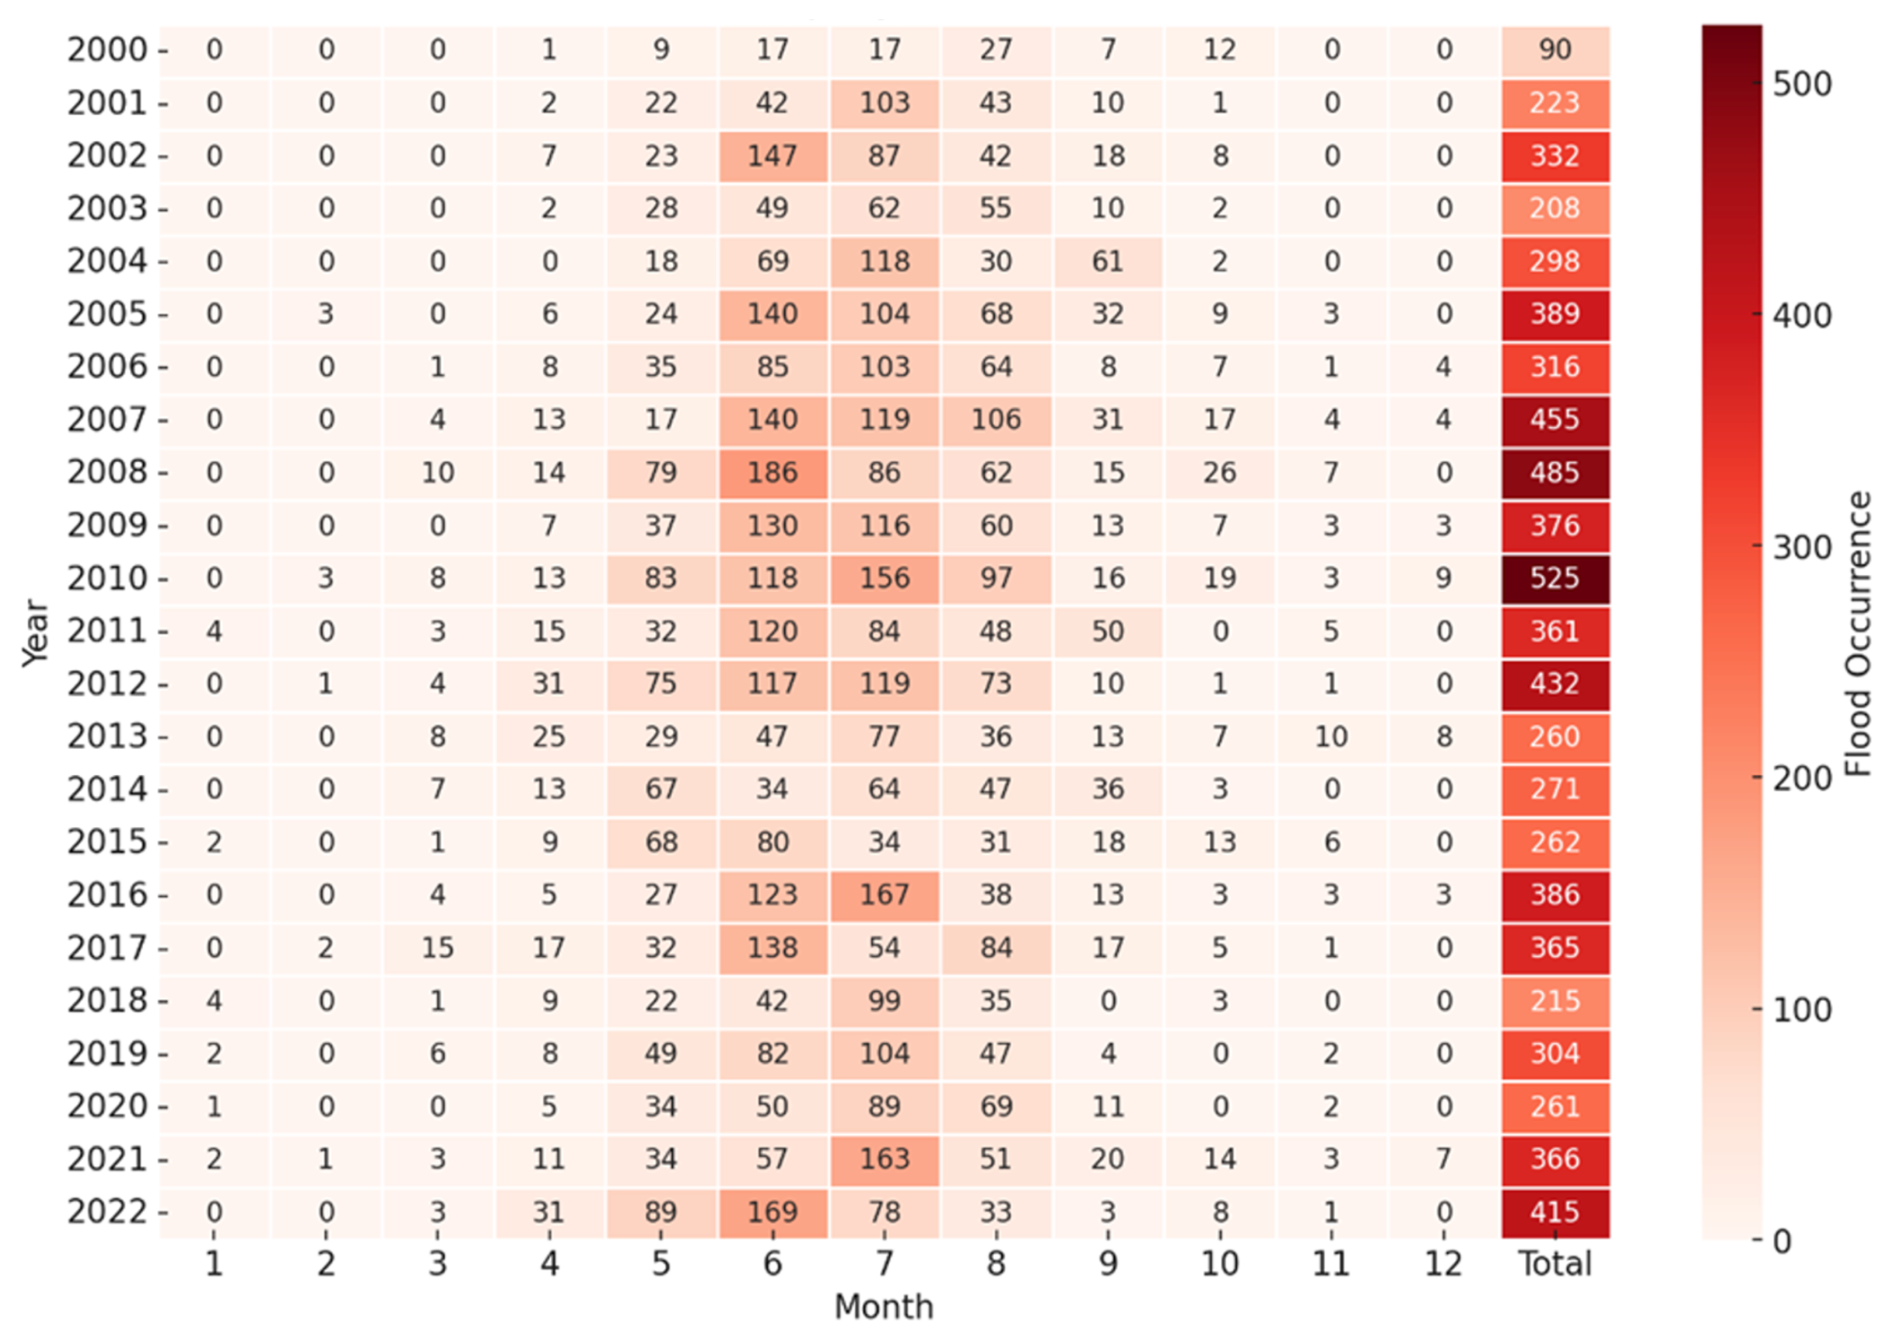
Figure 5A heatmap showing in each cell the number of flood occurrences for each month and each year.
4.3.2 Spatial distribution of flood events
Figure 6a illustrates the spatial distribution of the accumulated flood frequency at the county level across China from 2000 to 2022. Using the natural breaks classification method, flood frequency is divided into five levels (0, 1–5, 5–9, 9–13, and 13–22). Level-2 counties represent the largest proportion (55 %), followed by Level 1 (29 %) and Level 3 (11 %), while Levels 4 and 5 have notably lower proportions (4 % and 1 %, respectively). Flood events have occurred in the majority of county areas across China, with the affected areas covering approximately 46 % of the nation's total land area. The regions with the most frequent floods, represented by Levels 4 and 5, are concentrated in the southwestern interior (e.g., Sichuan Province), the northwest (e.g., Gansu Province), and the southern coastal regions, including Guangdong, Fujian, and Guangxi provinces. This distribution pattern aligns with the findings of Liang et al. (2019), whose historical meteorological data analysis identified a higher flood frequency in the southern provinces, particularly Guangdong, Hainan, Guangxi, and Fujian.

Figure 6Spatial distribution of flood occurrences and trends in China (2000–2022). (a) The accumulated flood occurrences at the county level. (b) The accumulated flood occurrences and trends across different climate zones, where Roman numerals denote the climate zones. The triangles indicate trends: downward triangles represent decreases, and upward triangles represent increases, with the sizes corresponding to the trend values. Publisher's remark: please note that the above figure contains disputed territories.
The province with the most floods was Guangxi, with 960 reported flood events. Guangxi is located in the southwest of China (20°54′–26°23′ N, 104°29′–112°4′ E) in the South Asian tropical monsoon climate zone (Nie et al., 2012; Gao et al., 2020b). The region is characterized by high temperatures, a long summer, a short winter, and distinct wet and dry seasons. The annual average temperature is 22.5 °C, and the annual average precipitation is 1806 mm (Qiu et al., 2021). Studies indicate that Guangxi experienced frequent flood disasters caused by heavy rainfall (Li et al., 2023; Ma et al., 2023). Qin et al. (2021) found an increase in flood hazards in Guangxi since the 1990s and predicted that future precipitation in the region would be more intense.
To explore the spatial characteristics of urban floods in China further from a natural perspective, an analysis was conducted on their distribution across different climate zones, incorporating the Theil–Sen estimator for robust trend detection. The Theil–Sen estimator is a nonparametric method that calculates the slope between points, offering a robust way of tracking changes in flood occurrences over time (Kemter et al., 2023). Figure 6b shows the spatial distribution and trend of flood occurrence of China's diverse climate zones. The subtropical zones, i.e., the South Subtropical Zone (IV), North Subtropical Zone (V), and Central Subtropical Zone (III), are characterized by higher frequencies of flooding of 1336, 1597, and 3222, respectively. These zones, which experience the bulk of the flood events, exhibit contrasting trends. While the South Subtropical Zone (IV) indicates an increasing trend in flood events, the Central Subtropical Zone (III) and the North Subtropical Zone (V) show a slight decrease, highlighting the nonmonotonic nature of flood trends across climatic gradients. In addition, the South Temperate Zone (I) displays a relatively higher frequency and an increasing trend of flood events. Conversely, the North Temperate Zone (VII), the Central Tropical Zone (IX), and the Plateau Climate Zone (II) experience a minimal frequency of flood events and a near-zero trend coefficient, suggesting a relatively lower impact of flooding.
In addition, to analyze the relationship between flood changes and societal characteristics, Fig. 7 uses the average annual gross regional product (GRP; billion USD) and population density in people per square kilometers as base maps to display the distribution of flood trends across different regions, with darker shades indicating higher values. Overall, most provinces exhibit an increasing trend in flood events, particularly in the northern and western regions of China. These areas, including provinces such as Heilongjiang, Shandong, and Chongqing, are characterized by varying levels of population density, both higher and lower, according to Fig. 7a. The provinces that exhibit a decreasing trend in flood events are primarily located in the central and southeastern regions, particularly Jiangsu, Fujian, and Guangdong, which are notable for their higher population densities. This suggests that the rising flood events are not strictly tied to population density.
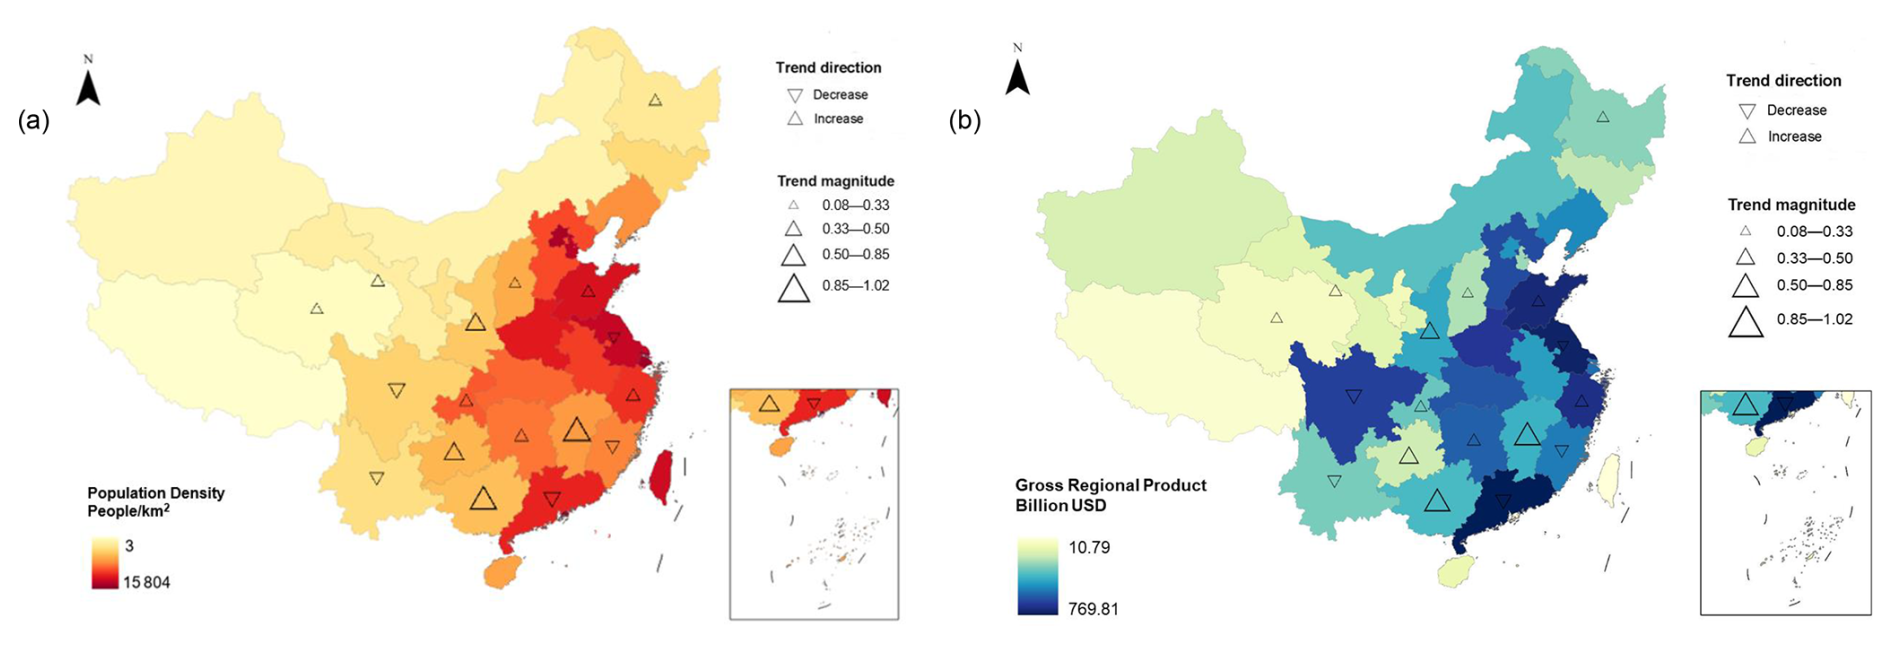
Figure 7The analysis of flood event trends across the Chinese provinces from 2000 to 2022, shown in relation to (a) population density and (b) gross regional product (GRP). The triangles indicate trends: downward triangles represent decreases, and upward triangles represent increases, with the sizes corresponding to the trend values. Publisher's remark: please note that the above figure contains disputed territories.
As for the trends in relation to economic output in Fig. 7b, the provinces with increasing flood trends are mostly those with a lower to moderate GRP, such as those in the northern and western parts of China, except for Shandong and Zhejiang. These regions may not have received the same level of economic investment in flood control infrastructure as the more developed eastern provinces, which might explain the rising trend in flood events. On the other hand, the central and eastern provinces with decreasing trends, such as Jiangsu, Guangdong, and Sichuan, are among the most economically developed in China. This suggests that the availability of economic resources has allowed for more comprehensive flood management strategies, reducing the frequency of flood events in these areas.
The Discussion section consists of two primary parts. Section 5.1 summarizes the main findings of our study, and Sect. 5.2 explains its limitations and outlines potential directions for future research.
5.1 Main findings
The dataset created in this study serves as the first county-level urban flood inventory across China from 2000, addressing a gap in existing datasets, which often fail to provide county-level flood distributions or coverage across the country. While the China Flood and Drought Bulletin offers authoritative data on flood disasters, focusing on economic losses, casualties, and agricultural damages at the provincial level, it lacks detailed inventories for specific cities. Our dataset shows trends that are largely consistent with those reported in the China Flood and Drought Bulletin, indicating that it can reliably reflect changes in flood events across different regions. This dataset's county-level granularity also allows for resampling and aggregation to the city or provincial levels, facilitating deeper analyses of flood dynamics and influencing factors at different spatial scales.
Understanding flood patterns derived from media information reveals both natural and societal dimensions. The temporal trends observed in our dataset are influenced not only by environmental factors, such as the increase in extreme rainfall events (Wu et al., 2021; Kong et al., 2021; Kundzewicz et al., 2019) and urbanization (Huong and Pathirana, 2013; Luo and Zhang, 2022; Rentschler et al., 2023), but also by the evolving nature of news media. According to Kron et al. (2012), creating a comprehensive hazard dataset is challenging due to inconsistent definitions and varying scales of reporting. The framing of news reports can significantly affect the perceived frequency and types of flood events (Bohensky and Leitch, 2014). Thus, while floods are natural phenomena, the reporting and societal perception of flood disasters introduce complexities that can lead to distinct trends.
From a spatial perspective, our study discusses flood trends in relation to both natural and societal features. Overall, the southern and eastern regions of China are more affected by flooding, which is consistent with previous findings on the flood risk and peak precipitation distribution (Sun et al., 2024; Gao et al., 2020a). Specifically, the subtropical regions experienced the most frequent flood events in this study. The subtropical regions with their high temperatures and high humidity, particularly during summer and fall, are especially prone to short-term heavy precipitation caused by convective activities (Li et al., 2022; Kotz et al., 2023). These climatic conditions make the subtropical regions the primary contributors to the overall flood event count in China.
Regarding the societal aspects, provinces with high population densities and significant economic development, specifically Jiangsu and Guangdong, exhibit a decreasing trend in flood events. These regions have experienced a high number of flood events over these years, with a notable peak around 2010. The decrease in floods may be related to this peak. Additionally, as regions frequently affected by flooding and characterized by high economic output and population density, substantial investments in flood management infrastructure and policies may have been made, thus also contributing to the observed decline in flood events. Jia et al. (2022) highlighted the investments in the flood management infrastructure in China's economically developed regions. They compared the 1998 and 2020 floods in the Yangtze River basin region, which is an economically developed region in China. Their analysis revealed that improvements in risk management, including engineering defenses, environmental recovery, forecasting and early warning, and emergency responses, have led to a substantial reduction in flood disaster losses in the Yangtze River basin region.
5.2 Limitations and future work
Despite the valuable insights provided by the spatial and temporal analyses in this study, there are several notable limitations. Although thorough double-checking was conducted during the data preparation phase, the possibility of biases remains due to subjective differences in interpretation. Future research could incorporate language models for correlation analysis or involve more field experts to cross-validate the accuracy of the results. On the other hand, our dataset contains information solely on the timing and names of the affected areas, lacking critical details such as the spatial extent, water volume, flood types, causes, damages, or multi-hazard information. This limitation arises from the nature of our data source, as we relied on news reports rather than scientific papers, which typically include such quantitative details. To address this limitation, additional data sources should be introduced, such as disaster yearbooks from each province or city, to enrich the dataset with more comprehensive flood event details, particularly multi-hazard information.
Recognizing that urban flooding often occurs in conjunction with other disasters, recent studies have attempted to extract multi-hazard information from news media reports. However, most of these studies use rule-based methods for classification rather than analyzing causal relationships between disasters or subdividing floods into specific types. For instance, Yang et al. (2023a) applied a rule-based approach to extract 15 types of disaster information from news texts, categorizing reports based on specific disaster terms and matching location information using prefecture-level administrative names. Similarly, Liu et al. (2018) used keyword positioning and rule-based NER to identify disaster types and locations in news reports. In both cases, a report mentioning multiple disaster types is considered indicative of multi-disaster co-occurrence, but this approach can introduce biases if the hazards mentioned are unrelated. Future research should explore the use of language models for enhancing extraction of diverse flood types and related hazards from news data, potentially increasing accuracy by identifying causal links.
Furthermore, the approach used in the present study also has its limitations. We employed the BERT model fine-tuned by a Chinese corpus for question–answer tasks, which has proven efficient in information extraction. However, with the rapid advancement of large language models (LLMs), newer models such as the GPT series offer significant improvements in natural language processing tasks. For example, Colverd et al. (2023) successfully used several LLMs, including GPT-3.5, GPT-4, and PaLM-Text-Bison, to generate flood disaster impact reports by extracting information from the web, finding strong correlations between LLM-generated and human-authored reports. Additionally, Hu et al. (2023) proposed a method that combines geospatial knowledge with GPT models to extract location descriptions from disaster-related social media posts, achieving a 40 % improvement over traditional NER approaches. Given these advancements, future research should explore the use of LLMs to extract nuanced information from flood-related text data, which means distinguishing between the flood types, causes, and specific losses associated with each flooding event. On the other hand, the BERT model requires language-specific fine-tuning, which can limit adaptability across languages. In contrast, LLMs that adopt a zero-shot strategy (i.e., direct application without the need for fine-tuning) may solve the transferability problem.
This study developed the first county-level urban flood inventory across China from 2000 to 2022 by leveraging news reports and employing the fine-tuned BERT model for flood event recognition and information extraction. The BERT model demonstrated excellent performance, achieving an F1 score of 0.98 in flood event identification and an F1 score of 0.86 in flood information extraction. Although the model we trained cannot be transferred directly to regions with different languages, the developed technical approach can be applied in any region and serves as a reference.
The established dataset consists of records from 2048 counties affected by flood disasters between 2000 and 2022, with a total number of 7559 events covering approximately 46 % of China's total land area. Our dataset shows trends largely consistent with those reported in the China Flood and Drought Bulletin, indicating that it can reliably reflect changes in flood events across different regions, despite some underestimations due to biases inherent in news reporting.
Building on the insights from the dataset, this study also examines the temporal and spatial patterns of urban flood occurrence in China. Temporally, the total flood occurrence from 2000 to 2022, excluding the influence of the peak year, shows an upward trend. The peak in flood occurrence was identified in 2010, when 525 counties were affected. In addition, the seasonal characteristics show that the rainy climate in summer leads to summer floods that account for 74 % of the total.
Spatially, the urban flood occurrence decreased from southeast to northwest, and most of the provinces exhibited an increasing trend. The southeastern coastal regions like Guangdong Province, Fujian Province, and Guangxi Province and the southwest of inland China like Sichuan Province are the most frequently flooded areas. Additionally, most of the subtropical zones across China experienced more floods than the other climate zones. From a societal perspective, some economically developed provinces with high population densities, such as Jiangsu and Guangdong, show a decreasing trend in flood events, possibly due to investments in flood management infrastructure.
In summary, this study provides critical insights into urban flooding patterns, though limitations remain. Our dataset lacks detailed quantitative data on flood extent and damages due to the reliance on news reports. Integrating additional sources, such as provincial disaster yearbooks, could enrich this dataset. Furthermore, future research should explore advanced language models like LLMs to enhance accuracy when extracting flood types, causes, and impacts, offering improved adaptability and insights for multi-hazard analysis.
Table A1The performance of the BERT model with different hyperparameters during the fine-tuning process.
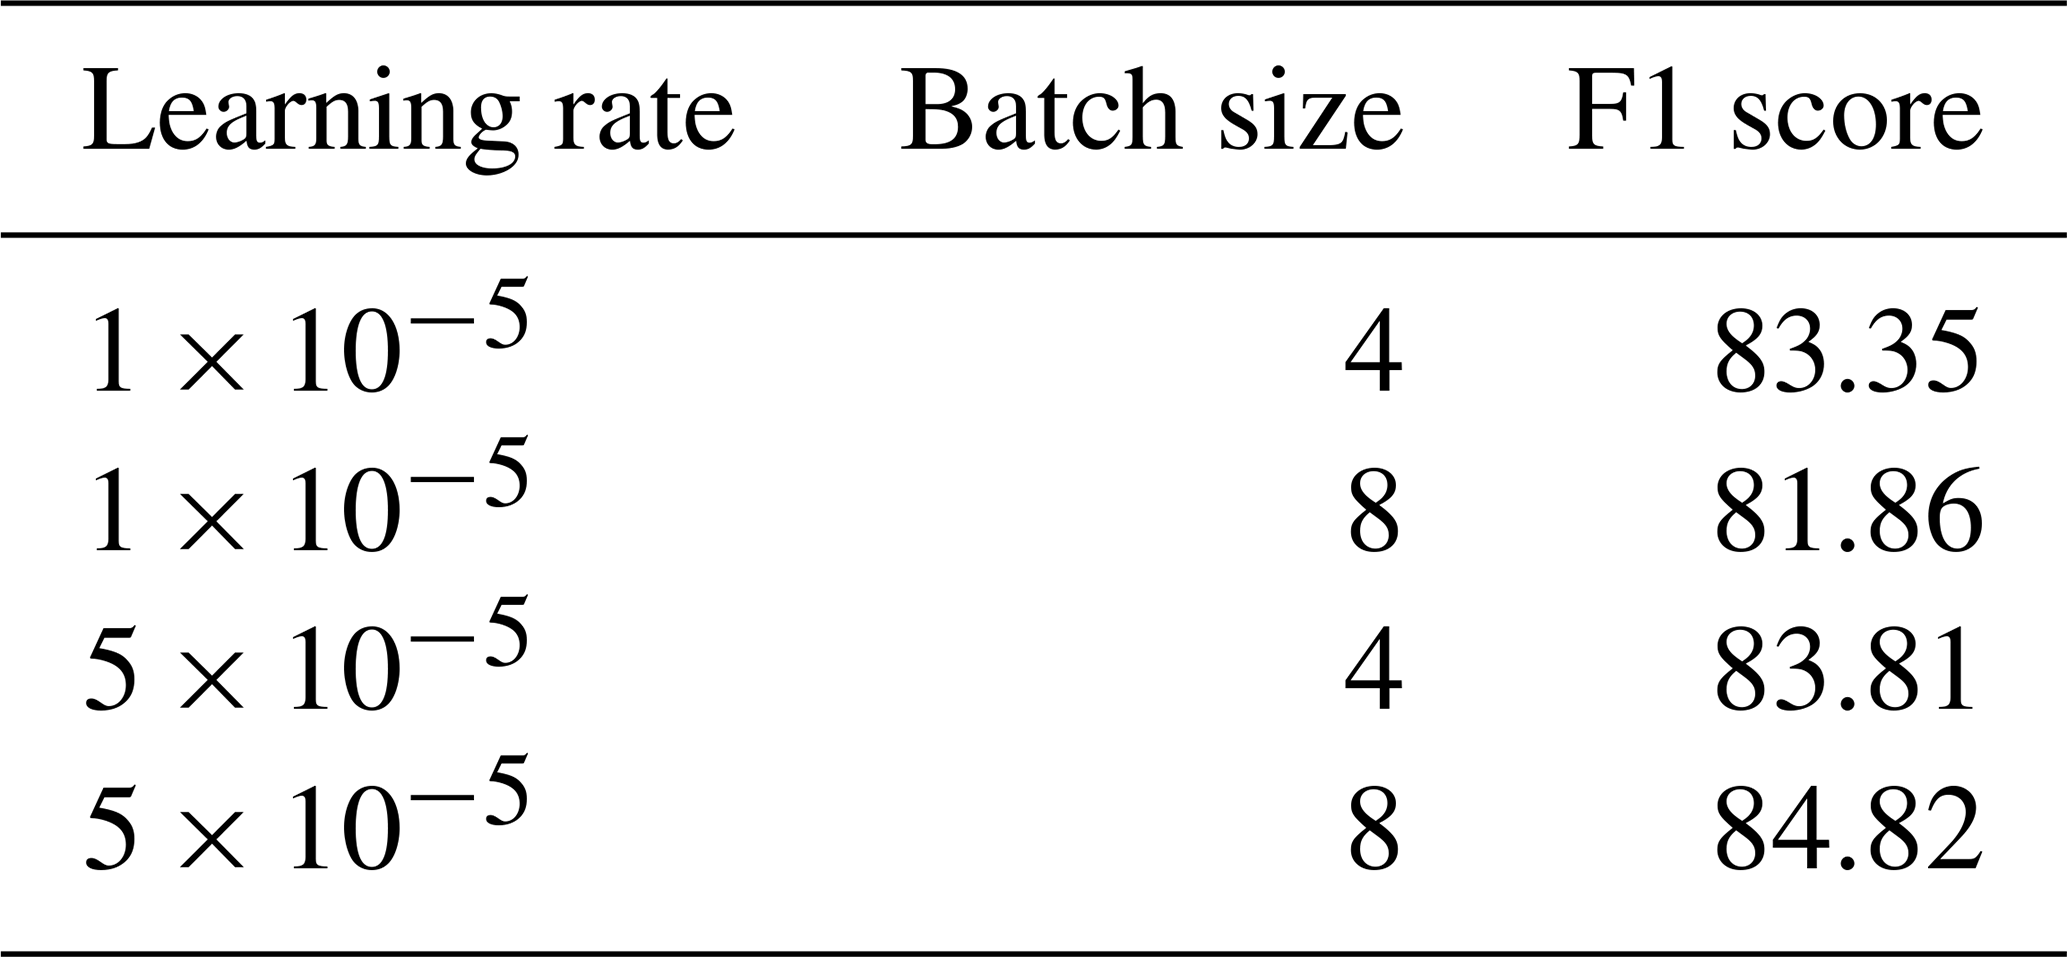
Table A1 shows the F1 score values used to evaluate the BERT model performance during the hyperparameter tuning process, with a different calculation method from the main text. Precision and recall are calculated as
O is defined as the maximum overlapping character length between the model's output and the standard annotated answer, L is the length of the output answer, and S is the length of the standard answer. Finally, the F1 score refers to Eq. (3) in Sect. 3.
The national flood dataset created in the present study is accessible on Zenodo, and the DOI is https://doi.org/10.5281/zenodo.14000094 (Fu, 2024). The BERT model used in this study was based on pre-trained weights from Google's BERT repository (https://storage.googleapis.com/bert_models/2018_11_03/chinese_L-12_H-768_A-12.zip, last access: 3 February 2025, Devlin et al., 2018). The following key libraries and tools were used: TensorFlow (v1.12), NumPy, Pandas, and scikit-learn. Readers can retrieve the news using the query we described in the section on news data and download the data according to the data management rules of the WiseNews platform. The population used in this study was provided by LandScan (https://doi.org/10.48690/1529167, Sims et al., 2023), and the GRP data were from the China Statistical Yearbook. The code, trained model, and annotated flood-related corpora are available from the corresponding author upon request.
SF conducted the investigation, developed the methodology, handled the coding, and wrote the original draft. HL provided guidance on the methodology and reviewed and edited the manuscript. DMS and ZZ provided guidance on the methodology and coding, respectively, and participated in the manuscript editing. CZ supervised the project and acquired the funding.
The contact author has declared that none of the authors has any competing interests.
Publisher’s note: Copernicus Publications remains neutral with regard to jurisdictional claims made in the text, published maps, institutional affiliations, or any other geographical representation in this paper. While Copernicus Publications makes every effort to include appropriate place names, the final responsibility lies with the authors.
We thank the China Scholarship Council for supporting Shengnan Fu's studies in Manchester, which facilitated this project. We also thank Tong Zhang from Dalian University of Technology for her valuable assistance in explaining the characteristics of media data from the perspective of journalism.
This research was funded by the National Key R&D Program of China (grant no. 2022YFC3090601), the National Science Foundation for Distinguished Young Scholars (grant no. 51925902), and the Key Fund of the National Natural Science Foundation of China (grant no. U2240204). David M. Schultz was partially supported by the Natural Environment Research Council of the UK (grant nos. NE/W000997/1 and NE/X018539/1).
This paper was edited by Marnik Vanclooster and reviewed by four anonymous referees.
Ahemaitihali, A. and Dong, Z.: Spatiotemporal Characteristics Analysis and Driving Forces Assessment of Flash Floods in Altay, Water, 14, 331, https://doi.org/10.3390/w14030331, 2022. a
Antwi, S. H., Rolston, A., Linnane, S., and Getty, D.: Communicating water availability to improve awareness and implementation of water conservation: A study of the 2018 and 2020 drought events in the Republic of Ireland, Sci. Total Environ., 807, 150865, https://doi.org/10.1016/j.scitotenv.2021.150865, 2022. a
Bai, S.: Mainstream Media Agenda Setting in Disaster Events, Journal of Emergency Management and Disaster Communications, 3, 83–98, 2022. a
Bohensky, E. L. and Leitch, A. M.: Framing the flood: a media analysis of themes of resilience in the 2011 Brisbane flood, Reg. Environ. Change, 14, 475–488, 2014. a
Brooks, H. E., Flora, M. L., and Baldwin, M. E.: A rose by any other name: On basic scores from the 2 × 2 table and the plethora of names attached to them, Artificial Intelligence for the Earth Systems, 3, e230104, https://doi.org/10.1175/AIES-D-23-0104.1, 2024. a
Cao, W., Zhou, Y., Güneralp, B., Li, X., Zhao, K., and Zhang, H.: Increasing global urban exposure to flooding: An analysis of long-term annual dynamics, Sci. Total Environ., 817, 153012, https://doi.org/10.1016/j.scitotenv.2022.153012, 2022. a
Colverd, G., Darm, P., Silverberg, L., and Kasmanoff, N.: Floodbrain: Flood disaster reporting by web-based retrieval augmented generation with an llm, arXiv [preprint], https://doi.org/10.48550/arXiv.2311.02597, 2023. a
Cui, Y., Liu, T., Che, W., Xiao, L., Chen, Z., Ma, W., Wang, S., and Hu, G.: A span-extraction dataset for Chinese machine reading comprehension, in: Proceedings of the 2019 Conference on Empirical Methods in Natural Language Processing and the 9th International Joint Conference on Natural Language Processing (EMNLP-IJCNLP), Hong Kong, China 3–7 November 2019, 5883–5889, https://doi.org/10.18653/v1/D19-1600, 2018. a
Darabi, H., Haghighi, A. T., Rahmati, O., Shahrood, A. J., Rouzbeh, S., Pradhan, B., and Bui, D. T.: A hybridized model based on neural network and swarm intelligence-grey wolf algorithm for spatial prediction of urban flood-inundation, J. Hydrol., 603, 126854, https://doi.org/10.1016/j.jhydrol.2021.126854, 2021. a
Datla, R. V., Kessel, R., Smith, A. W., Kacker, R. N., and Pollock, D. B.: Review Article: Uncertainty analysis of remote sensing optical sensor data: guiding principles to achieve metrological consistency, Int. J. Remote Sens., 31, 867–880, https://doi.org/10.1080/01431160902897882, 2010. a
de Bruijn, J. A., de Moel, H., Jongman, B., de Ruiter, M. C., Wagemaker, J., and Aerts, J. C.: A global database of historic and real-time flood events based on social media, Scientific Data, 6, 311, https://doi.org/10.1038/s41597-019-0326-9, 2019. a
Delforge, D., Wathelet, V., Below, R., Sofia, C. L., Tonnelier, M., van Loenhout, J., and Speybroeck, N.: EM-DAT: The Emergency Events Database, Research Square [data set], https://doi.org/10.21203/rs.3.rs-3807553/v1, 2023. a, b
Devlin, J., Chang, M.-W., Lee, K., and Toutanova, K.: Bert: Pre-training of deep bidirectional transformers for language understanding, arXiv [preprint] https://doi.org/10.48550/arXiv.1810.04805, 2018 (data available at: https://storage.googleapis.com/bert_models/2018_11_03/chinese_L-12_H-768_A-12.zip, last access: 3 February 2025). a, b
Dong, B., Xia, J., Li, Q., and Zhou, M.: Risk assessment for people and vehicles in an extreme urban flood: Case study of the “7.20” flood event in Zhengzhou, China, Int. J. Disast. Risk Re., 80, 103205, https://doi.org/10.1016/j.ijdrr.2022.103205, 2022. a
Donovan, M., Belmont, P., Notebaert, B., Coombs, T., Larson, P., and Souffront, M.: Accounting for uncertainty in remotely-sensed measurements of river planform change, Earth-Sci. Rev., 193, 220–236, https://doi.org/10.1016/j.earscirev.2019.04.009, 2019. a
Eini, M., Kaboli, H. S., Rashidian, M., and Hedayat, H.: Hazard and vulnerability in urban flood risk mapping: Machine learning techniques and considering the role of urban districts, Int. J. Disast. Risk Re., 50, 101687, https://doi.org/10.1016/j.ijdrr.2020.101687, 2020. a
Farooq, H. and Kaushik, B.: Review of deep learning techniques for improving the performance of machine reading comprehension problem, in: 2020 4th International Conference on Intelligent Computing and Control Systems (ICICCS), Madurai, India, 13–15 May 2020, 928–935, https://doi.org/10.1109/ICICCS48265.2020.9121015, 2020. a
Feng, J., Li, D., Li, Y., and Zhao, L.: Analysis of compound floods from storm surge and extreme precipitation in China, J. Hydrol., 627, 130402, https://doi.org/10.1016/j.jhydrol.2023.130402, 2023. a
Feng, Y., Xiao, Q., Brenner, C., Peche, A., Yang, J., Feuerhake, U., and Sester, M.: Determination of building flood risk maps from LiDAR mobile mapping data, Comput. Environ. Urban, 93, 101759, https://doi.org/10.1016/j.compenvurbsys.2022.101759, 2022. a
Fu, S.: Urban Flood Inventory in China (1.0), Zenodo [data set], https://doi.org/10.5281/zenodo.14000094, 2024.
Fu, S., Lyu, H., Wang, Z., Hao, X., and Zhang, C.: Extracting historical flood locations from news media data by the named entity recognition (NER) model to assess urban flood susceptibility, J. Hydrol., 612, 128312, https://doi.org/10.1016/j.jhydrol.2022.128312, 2022. a
Gall, M., Borden, K. A., and Cutter, S. L.: When do losses count? Six fallacies of natural hazards loss data, B. Am. Meteorol. Soc., 90, 799–810, 2009. a
Gao, X., Guo, M., Yang, Z., Zhu, Q., Xu, Z., and Gao, K.: Temperature dependence of extreme precipitation over mainland China, J. Hydrol., 583, 124595, https://doi.org/10.1016/j.jhydrol.2020.124595, 2020a. a
Gao, Z., Huang, B., Ma, Z., Chen, X., Qiu, J., and Liu, D.: Comprehensive comparisons of state-of-the-art gridded precipitation estimates for hydrological applications over southern China, Remote Sens., 12, 3997, https://doi.org/10.3390/rs12233997, 2020b. a
Hayek, L.: Media framing of government crisis communication during Covid-19, Media and Communication, 12, 7774, https://doi.org/10.17645/mac.7774, 2024. a
Hu, Y., Mai, G., Cundy, C., Choi, K., Lao, N., Liu, W., Lakhanpal, G., Zhou, R. Z., and Joseph, K.: Geo-knowledge-guided GPT models improve the extraction of location descriptions from disaster-related social media messages, Int. J. Geogr. Inf. Sci., 37, 2289–2318, 2023. a
Huang, M. and Jin, S.: Rapid Flood Mapping and Evaluation with a Supervised Classifier and Change Detection in Shouguang Using Sentinel-1 SAR and Sentinel-2 Optical Data, Remote Sens., 12, 2073, https://doi.org/10.3390/rs12132073, 2020. a
Huang, W., Wu, C., Luo, S., Chen, K., Wang, H., and Toda, T.: Speech recognition by simply fine-tuning BERT, in: ICASSP 2021–2021 IEEE International Conference on Acoustics, Speech and Signal Processing (ICASSP), Toronto, Ontario, Canada, 6–11 June 2021, 7343–7347, https://doi.org/10.1109/ICASSP39728.2021.9413668, 2021. a
Huong, H. T. L. and Pathirana, A.: Urbanization and climate change impacts on future urban flooding in Can Tho city, Vietnam, Hydrol. Earth Syst. Sci., 17, 379–394, https://doi.org/10.5194/hess-17-379-2013, 2013. a
Jia, H., Chen, F., Pan, D., Du, E., Wang, L., Wang, N., and Yang, A.: Flood risk management in the Yangtze River basin – Comparison of 1998 and 2020 events, Int. J. Disast. Risk Re., 68, 102724, https://doi.org/10.1016/j.ijdrr.2021.102724, 2022. a
Jiang, R., Lu, H., Yang, K., Chen, D., Zhou, J., Yamazaki, D., Pan, M., Li, W., Xu, N., Yang, Y., Guan, D., and Tian, F.: Substantial increase in future fluvial flood risk projected in China’s major urban agglomerations, Communications Earth & Environment, 4, 389, https://doi.org/10.1038/s43247-023-01049-0, 2023. a
Kemter, M., Marwan, N., Villarini, G., and Merz, B.: Controls on Flood Trends Across the United States, Water Resour. Res., 59, e2021WR031673, https://doi.org/10.1029/2021WR031673, 2023. a
Kim, Y., Bang, S., Sohn, J., and Kim, H.: Question answering method for infrastructure damage information retrieval from textual data using bidirectional encoder representations from transformers, Automat. Constr., 134, 104061, https://doi.org/10.1016/j.autcon.2021.104061, 2022. a
Kong, F., Sun, S., and Wang, Y.: Comprehensive Understanding the Disaster-Causing Mechanism, Governance Dilemma and Targeted Countermeasures of Urban Pluvial Flooding in China, Water, 13, 1762, https://doi.org/10.3390/w13131762, 2021. a
Kotz, M., Lange, S., Wenz, L., and Levermann, A.: Constraining the Pattern and Magnitude of Projected Extreme Precipitation Change in a Multimodel Ensemble, J. Climate, 37, 97–111, https://doi.org/10.1175/JCLI-D-23-0492.1, 2023. a
Kron, W., Steuer, M., Löw, P., and Wirtz, A.: How to deal properly with a natural catastrophe database – analysis of flood losses, Nat. Hazards Earth Syst. Sci., 12, 535–550, https://doi.org/10.5194/nhess-12-535-2012, 2012. a
Kundzewicz, Z. W., Su, B., Wang, Y., Xia, J., Huang, J., and Jiang, T.: Flood risk and its reduction in China, Adv. Water Resour., 130, 37–45, https://doi.org/10.1016/j.advwatres.2019.05.020, 2019. a, b
Leidecker-Sandmann, M., Koppers, L., and Lehmkuhl, M.: Correlations between the selection of topics by news media and scientific journals, Plos One, 18, e0280016, https://doi.org/10.1371/journal.pone.0280016, 2023. a
Li, X., Yin, F., Sun, Z., Li, X., Yuan, A., Chai, D., Zhou, M., and Li, J.: Entity-Relation Extraction as Multi-Turn Question Answering, in: Proceedings of the 57th Annual Meeting of the Association for Computational Linguistics, Florence, Italy, 28 July–2 August 2019, 1340–1350, https://doi.org/10.18653/v1/P19-1129, 2019. a
Li, Y., Deng, Y., Cheung, H. N., Zhou, W., Yang, S., and Zhang, H.: Amplifying subtropical hydrological transition over China in early summer tied to weakened mid-latitude synoptic disturbances, npj Climate and Atmospheric Science, 5, https://doi.org/10.1038/s41612-022-00259-1, 2022. a
Li, Z., Tang, X., Li, L., Chu, Y., Wang, X., and Yang, D.: GIS-based risk assessment of flood disaster in the Lijiang River Basin, Sci. Rep., 13, 6160, https://doi.org/10.1038/s41598-023-32829-5, 2023. a
Liang, Y., Wang, Y., Zhao, Y., Lu, Y., and Liu, X.: Analysis and Projection of Flood Hazards over China, Water, 11, 1022, https://doi.org/10.3390/w11051022, 2019. a
Liu, X., Guo, H., Lin, Y.-R., Li, Y., and Hou, J.: Analyzing spatial-temporal distribution of natural hazards in China by mining news sources, Nat. Hazards Rev., 19, 04018006, https://doi.org/10.1061/(ASCE)NH.1527-6996.0000291, 2018. a, b
Luo, K. and Zhang, X.: Increasing urban flood risk in China over recent 40 years induced by LUCC, Landscape Urban Plan., 219, 104317, https://doi.org/10.1016/j.landurbplan.2021.104317, 2022. a
Ma, M., Gao, Q., Xiao, Z., Hou, X., Hu, B., Jia, L., and Song, W.: Analysis of public emotion on flood disasters in southern China in 2020 based on social media data, Nat. Hazards, 118, 1013–1033, https://doi.org/10.1007/s11069-023-06033-7, 2023. a
Nie, C., Li, H., Yang, L., Ye, B., Dai, E., Wu, S., Liu, Y., and Liao, Y.: Spatial and temporal changes in extreme temperature and extreme precipitation in Guangxi, Quatern. Int., 263, 162–171, https://doi.org/10.1016/j.quaint.2012.02.029, 2012. a
Olivetti, E. A., Cole, J. M., Kim, E., Kononova, O., Ceder, G., Han, T., Jin, Y., and Hiszpanski, A. M.: Data-driven materials research enabled by natural language processing and information extraction, Appl. Phys. Rev., 7, 041317, https://doi.org/10.1063/5.0021106, 2020. a
Qin, N. X., Wang, J. N., Gao, L., Hong, Y., Huang, J. L., and Lu, Q. Q.: Observed trends of different rainfall intensities and the associated spatiotemporal variations during 1958–2016 in Guangxi, China, Int. J. Climatol., 41, E2880–E2895, https://doi.org/10.1002/joc.6888, 2021. a
Qiu, H., Hu, B., and Zhang, Z.: Impacts of land use change on ecosystem service value based on SDGs report – Taking Guangxi as an example, Ecol. Indic., 133, 108366, https://doi.org/10.1016/j.ecolind.2021.108366, 2021. a
Rajpurkar, P., Zhang, J., Lopyrev, K., and Liang, P.: Squad: 100 000+ questions for machine comprehension of text, arXiv [preprint], https://doi.org/10.48550/arXiv.1606.05250, 2016. a
Rentschler, J., Avner, P., Marconcini, M., Su, R., Strano, E., Vousdoukas, M., and Hallegatte, S.: Global evidence of rapid urban growth in flood zones since 1985, Nature, 622, 87–92, https://doi.org/10.1038/s41586-023-06468-9, 2023. a
Shahabi, H., Shirzadi, A., Ghaderi, K., Omidvar, E., AlAnsari, N., Clague, J. J., Geertsema, M., Khosravi, K., Amini, A., Bahrami, S., Rahmati, O., Habibi, K., Mohammadi, A., Nguyen, H., Melesse, A. M., Ahmad, B. B., and Ahmad, A.: Flood Detection and Susceptibility Mapping Using Sentinel-1 Remote Sensing Data and a Machine Learning Approach: Hybrid Intelligence of Bagging Ensemble Based on K-Nearest Neighbor Classifier, Remote Sens., 12, 266, https://doi.org/10.3390/rs12020266, 2020. a
Shang, G., Wang, X., Li, Y., Han, Q., He, W., and Chen, K.: Heterogeneity Analysis of Spatio-Temporal Distribution of Vegetation Cover in Two-Tider Administrative Regions of China, Sustainability, 15, 13305, https://doi.org/10.3390/su151813305, 2023. a
Sims, K., Reith, A., Bright, E., Kaufman, J., Pyle, J., Epting, J., Gonzales, J., Adams, D., Powell, E., Urban, M., and Rose, A.: LandScan Global 2022, Oak Ridge National Laboratory [data set], https://doi.org/10.48690/1529167, 2023.
Sun, H., Di, Z., Qin, P., Zhang, S., and Lang, Y.: Spatio-temporal variation and dynamic risk assessment of drought and flood disaster (DFD) in China, Int. J. Disast. Risk Re., 100, 104140, https://doi.org/10.1016/j.ijdrr.2023.104140, 2024. a
Surampudi, S. and Yarrakula, K.: Mapping and assessing spatial extent of floods from multitemporal synthetic aperture radar images: a case study on Brahmaputra River in Assam State, India, Environ. Sci. Pollut. R., 27, 1521–1532, https://doi.org/10.1007/s11356-019-06849-6, 2020. a
Suwaileh, R., Imran, M., Elsayed, T., and Sajjad, H.: Are we ready for this disaster? Towards location mention recognition from crisis tweets, in: Proceedings of the 28th International Conference on Computational Linguistics, Barcelona, Spain, 8–13 December 2020, 6252–6263, https://doi.org/10.18653/v1/2020.coling-main.550, 2020. a
Taylor, W. L.: “Cloze procedure”: A new tool for measuring readability, Journalism Quart., 30, 415–433, 1953. a
Tellman, B., Sullivan, J. A., Kuhn, C., Kettner, A. J., Doyle, C. S., Brakenridge, G. R., Erickson, T. A., and Slayback, D. A.: Satellite imaging reveals increased proportion of population exposed to floods, Nature, 596, 80–86, 2021. a
Wang, S., Jiao, S., and Xin, H.: Spatio-temporal characteristics of temperature and precipitation in Sichuan Province, Southwestern China, 1960–2009, Quatern. Int., 286, 103–115, https://doi.org/10.1016/j.quaint.2012.04.030, 2013. a
Wang, S., Wang, Z., Jiang, Y., and Wang, H.: Hierarchical Annotation Event Extraction Method in Multiple Scenarios, Wireless Communications and Mobile Computing, 2021, 1–9, https://doi.org/10.1155/2021/8899852, 2021. a
Wei, H., Liu, K., Liu, J., Lyu, Y., Zhao, S., Xiao, X., Liu, Y., Wang, Y., Wu, H., She, Q., Liu, X., Wu, T., and Wang, H.: DuReader: a Chinese Machine Reading Comprehension Dataset from Real-world Applications, in: Proceedings of the Workshop on Machine Reading for Question Answering, Melbourne, Australia, 19 July 2018, 37–46, https://doi.org/10.18653/v1/W18-2605, 2018. a
Williamson, R.: Authenticity in Newspaper Coverage of Political Leaders’ Responses to Disaster: A Historical Study, Journalism Stud., 20, 1511–1527, https://doi.org/10.1080/1461670X.2018.1527712, 2019. a
Wu, J., Li, Y., Ye, T., and Li, N.: Changes in mortality and economic vulnerability to climatic hazards under economic development at the provincial level in China, Reg. Environ. Change, 19, 125–136, https://doi.org/10.1007/s10113-018-1386-7, 2019. a
Wu, M., Wu, Z., Ge, W., Wang, H., Shen, Y., and Jiang, M.: Identification of sensitivity indicators of urban rainstorm flood disasters: A case study in China, J. Hydrol., 599, 126393, https://doi.org/10.1016/j.jhydrol.2021.126393, 2021. a
Xiang, W. and Wang, B.: A Survey of Event Extraction From Text, IEEE Access, 7, 173111–173137, https://doi.org/10.1109/ACCESS.2019.2956831, 2019. a
Xiong, R.: Chinese Conference Event Named Entity Recognition Based on BERT-BiLSTM-CRF, in: Proceedings of the 3rd International Conference on Big Data Technologies, Qingdao, China, 18–20 September 2020, 188–191, https://doi.org/10.1145/3422713.3422742, 2020. a
Xu, X. and Tang, Q.: Meteorological disaster frequency at prefecture-level city scale and induced losses in mainland China during 2011–2019, Nat. Hazards, 109, 827–844, https://doi.org/10.1007/s11069-021-04858-8, 2021. a, b
Yan, Z., Guo, X., Zhao, Z., and Tang, L.: Achieving fine-grained urban flood perception and spatio-temporal evolution analysis based on social media, Sustain. Cities Soc., 101, 105077, https://doi.org/10.1016/j.scs.2023.105077, 2024. a
Yang, C., Zhang, H., Li, X., He, Z., and Li, J.: Analysis of spatial and temporal characteristics of major natural disasters in China from 2008 to 2021 based on mining news database, Nat. Hazards, 118, 1881–1916, 2023a. a
Yang, C., Zhang, H., Li, X., He, Z., and Li, J.: Analysis of spatial and temporal characteristics of major natural disasters in China from 2008 to 2021 based on mining news database, Nat. Hazards, 118, 1881–1916, https://doi.org/10.1007/s11069-023-06097-5, 2023b. a
Yang, R., Gan, Y., and Zhang, C.: Chinese named entity recognition based on BERT and lightweight feature extraction model, Information, 13, 515, https://doi.org/10.3390/info13110515, 2022. a
Zhang, C., Xu, T., Wang, T., and Zhao, Y.: Spatial-temporal evolution of influencing mechanism of urban flooding in the Guangdong Hong Kong Macao greater bay area, China, Front. Earth Sci., 10, 1113997, https://doi.org/10.3389/feart.2022.1113997, 2023a. a
Zhang, Z., Jian, X., Chen, Y., Huang, Z., Liu, J., and Yang, L.: Urban waterlogging prediction and risk analysis based on rainfall time series features: A case study of Shenzhen, Frontiers in Environmental Science, 11, 1131954, https://doi.org/10.3389/fenvs.2023.1131954, 2023b. a
Zhao, G., Pang, B., Xu, Z., Yue, J., and Tu, T.: Mapping flood susceptibility in mountainous areas on a national scale in China, Sci. Total Environ., 615, 1133–1142, https://doi.org/10.1016/j.scitotenv.2017.10.037, 2018. a
Zhou, S., Yu, W., Tang, X., and Li, X.: Government crisis communication innovation and its psychological intervention coupling: Based on an analysis of China’s provincial COVID-19 outbreak updates, Front. Psychol., 13, 1008948, https://doi.org/10.3389/fpsyg.2022.1008948, 2023. a