the Creative Commons Attribution 4.0 License.
the Creative Commons Attribution 4.0 License.
 | 15 Dec 2025
How do geological map details influence the identification of geology-streamflow relationships in large-sample hydrology studies?
Thiago V. M. do Nascimento
Julia Rudlang
Sebastian Gnann
Jan Seibert
Markus Hrachowitz
Fabrizio Fenicia
Large-sample hydrology datasets have advanced hydrological research, yet the impact of landscape map details on identifying dominant streamflow generation processes remains underexplored. This study investigates the role of geology using maps of increasing detail – global, continental, and regional – each reclassified into four permeability classes. These geological attributes were used along with topography, soil, land use, and climate attributes to identify dominant controls on streamflow signatures across 4469 European catchments. To distinguish landscape influences from the otherwise dominant influence of climate, we conducted separate analyses on nested basins. Three scales were considered to assess scale-dependent patterns: large (63 nested basins), intermediate (the Moselle nested basin), and small (five nested catchments within the Moselle). The large-scale study used geology information from global and continental maps, while the others also incorporated regional maps. At the large scale, dominant controls varied widely between nested basins, but landscape generally outweighed climate, highlighting the value of our nested basin design. At this scale, continental and global geology maps produced different correlation patterns, with neither consistently superior. At the intermediate scale, increased geological detail led geology to shift from the least to the most correlated variable for certain streamflow signatures. The small-scale experiment reinforced these findings, as the regional map highlighted controls more consistent with process understanding. This study underscores the benefit of integrating detailed, region-specific geological data into large sample hydrology studies, and demonstrates the utility of a nested basins design. These findings have important implications for hydrological regionalization and streamflow prediction in ungauged basins.
- Article
(13243 KB) - Full-text XML
-
Supplement
(1063 KB) - BibTeX
- EndNote


The availability of large-sample hydrology (LSH) datasets, which include hydrometeorological time series and catchment attributes for hundreds to thousands of catchments, has grown significantly in recent years (e.g. Addor et al., 2017; Chagas et al., 2020; Coxon et al., 2020; Fowler et al., 2021; GRDC, 2024; Helgason and Nijssen, 2024; Höge et al., 2023; Klingler et al., 2021; Kratzert et al., 2023; do Nascimento et al., 2024a). This expansion enabled studies across a wide range of catchments worldwide (Addor et al., 2018; Almagro et al., 2024; Beck et al., 2015; Ibrahim et al., 2025; Kratzert et al., 2019; Kuentz et al., 2017; Nearing et al., 2024; van Oorschot et al., 2024; Wu et al., 2021).
A key objective of most of these studies has been to investigate which climate or landscape attributes predominantly influence specific aspects of the streamflow response. While from prior hydrological understanding one would expect that the streamflow response is driven by both climate and landscape characteristics (Bloomfield et al., 2021; Gnann et al., 2021; do Nascimento et al., 2024b), many LSH studies highlighted climate as the dominant or sole driver of streamflow response (Addor et al., 2018; Beck et al., 2015; Huang et al., 2021; Kuentz et al., 2017; Wu et al., 2021).
This raises an important question: why does the influence of landscape appear weak or even absent in large-sample studies? One possibility is that the inherent uniqueness of individual catchments prevents the formulation of generalized relationships between landscape attributes and streamflow signatures that hold true across extensive regions. A second possibility is that strong climatic gradients across large domains (e.g. entire continents), can dominate the hydrological response, effectively masking the influence of landscape characteristics. A third explanation lies in the limitations of the landscape attributes themselves: variables derived from gridded datasets or maps may lack hydrologically meaningful information. Finally, the level of detail in these maps may be insufficient, with critical landscape features not captured or aggregated into overly coarse classes.
The concept of uniqueness of place in hydrology, postulated by Beven (2000), describes how specific combinations of climate, geology, topography, vegetation, and human influences shape hydrological processes within individual landscapes. This inherent uniqueness complicates the regionalization of dominant processes and their relationships with catchment landscape attributes, as assumptions valid in one context may not apply to another. For instance, variability in the baseflow index has been related to geology (Fenicia and McDonnell, 2022; Pfister et al., 2017), climate (Addor et al., 2018; Beck et al., 2015; Mwakalila et al., 2002), topography (Santhi et al., 2008), soils (Schneider et al., 2007) or land use (Zomlot et al., 2015) in different regions. As a result, efforts to develop generally valid and applicable relationships to predict streamflow signatures across large regions are often hindered by the complex and localized interactions between landscape and hydrological dynamics.
Moreover, it is well known that dominant hydrological processes, as well as their controls, change with scale (e.g., Blöschl and Sivapalan, 1995). At very large scales, climate is often dominant because it constrains the water and energy supply and regulates whether precipitation falls as rain or snow (Budyko and Miller, 1974; Knoben et al., 2018). This may, at least to some extent, override the role of landscape attributes (e.g., geology) in controlling the streamflow response (Gnann et al., 2019). In this case, it becomes important to filter out climatic influences, for instance by studying sub-domains separately or by using metrics that integrate climatic and landscape factors (Gleeson et al., 2011a; van Oorschot et al., 2024).
The information content of summary statistics used to capture landscape and streamflow time series is also an important aspect in hydrology. While summary indicators distil complex data into manageable metrics, they often fail to capture the full depth of information present in spatial maps or temporal patterns. For example, the spatial distribution or the temporal variability of landscape attributes is typically lost when exclusively relying on aggregated metrics (Floriancic et al., 2022; Tarasova et al., 2024; Tempel et al., 2024; Wang et al., 2024). Additionally, key details about landscape characteristics may not be transferred into readily available indicators. For example, the same rock types can exhibit widely varying properties depending on factors such as the degree of weathering, extent of fracturing, presence of secondary porosity, and geological ages (Gnann et al., 2021). Such characteristics are often absent from standard variables readily available in LSH datasets. Fenicia and McDonnell (2022) demonstrate that correlations between streamflow and baseflow index become apparent only after developing tailored indicators, such as classifying geological units by their permeability. This highlights the necessity of designing indicators that are sensitive to the underlying processes and heterogeneity of the landscape.
Landscape maps also vary in spatial resolution and the level of detail they provide, which affects their usefulness in hydrological studies. As noted by Addor et al. (2020), global maps are often used in large-sample studies due to their standardized, readily available format, allowing for objective comparisons across diverse geographic regions. However, this consistency typically comes at the cost of detail, limiting the ability to capture landscape heterogeneity accurately. In general, global maps are coarser and less accurate, whereas regional maps offer finer resolution and more hydrologically relevant detail. Several LSH studies have suggested that the weak correlations between landscape attributes and streamflow can be attributed to the level of detail of global landscape maps (Addor et al., 2018; Beck et al., 2015; Kratzert et al., 2019). For example, the Global Lithological Map (GLiM) (Hartmann et al., 2012) groups rock types globally into 16 classes at their first level. While the classification facilitates evaluation by categorizing different rock types, there is, for instance, only one class for siliciclastic rocks, which can encompass very distinct rock types like sandstones and shales, with vastly different permeabilities. Insufficient detail in geological data can then lead to inaccuracies in predicting infiltration, groundwater flow, and storage dynamics using models (Blöschl and Sivapalan, 1995).
Considerable attention has been devoted to how the uncertainty of climate data affects LSH study outcomes. Clerc-Schwarzenbach et al. (2024) found that regional meteorological forcing variables available in CAMELS datasets (Addor et al., 2017; Chagas et al., 2020; Coxon et al., 2020) provided more accurate and realistic inputs for hydrological models than the global product ERA5 (Hersbach et al., 2020), which was used to derive meteorological forcings for catchments worldwide in the Caravan dataset (Kratzert et al., 2023).
In contrast, far less attention has been given to how the quality of landscape data affects our understanding of dominant hydrological processes in LSH studies. There remains a lack of systematic studies to investigate how the identification of relationships between streamflow signatures and landscape attributes is affected by the level of detail of landscape data. Addressing this gap is crucial for improving the reliability of insights derived from LSH analyses and advancing our ability to regionalize hydrological processes effectively.
This study investigates how the level of detail in geological maps influences the identification of relationships between geology and streamflow signatures. We utilized the EStreams dataset (do Nascimento et al., 2024a), which covers hydrometeorological and landscape attributes for thousands of catchments over pan-European territory. Our analysis focused on streamflow signatures alongside climatic and landscape attributes, with particular emphasis on geological attributes.
To explore the impact of geological map detail, we incorporated two geological maps at continental (Duscher et al., 2019; Günther and Duscher, 2019) and regional scales (AGE, 2024; BDLISA database, 2024; GÜK200, 2024), supplementing the global geology map in the original EStreams dataset. These maps offer a higher level of detail, enhancing the representation of geological attributes. While the primary aim was to evaluate the role of geological detail, climatic and other landscape attributes were also included for comparative purposes
We analyzed 4469 European catchments using a multi-scale, nested-catchment approach to account for scale-dependent effects and to minimize the dominant influence of climate often observed in large-scale studies. Specifically, we conducted: (a) a large-scale analysis of 63 river basins across Europe (comprising all 4469 catchments), (b) an intermediate-scale analysis of the Moselle basin (152 sub-catchments), selected for its numerous previous studies and the availability of a regional-scale geology map, and (c) a small-scale investigation of five catchments (121 sub-catchments therein) within the Moselle. Each study basin included a variable number of nested catchments, allowing spatial variability in streamflow signatures to be linked to landscape controls. This stepwise approach, progressing from large to basin scale, balances depth with breadth (Gupta et al., 2014). It enables a robust assessment of how geological map detail shapes our ability to detect and quantify dominant streamflow generation processes, addressing the central question: how does the level of detail in geological maps affect hydrological interpretation?
Specifically, we pursue the following objectives at three spatial scales:
-
Large-scale (across 63 river basins). Quantify the relative influences of landscape and climate attributes on streamflow signatures across 63 European basins. Identify general pattern in dominant controls on streamflow signatures and evaluate how detail in geological information from global and continental maps affects this interpretation.
-
Intermediate-scale (across 152 catchments in the Moselle basin). Analyze dominant controls on streamflow signatures within the Moselle basin, using global, continental, and regional geological maps. Investigate how increasing geological detail influences the interpretation of basin behavior.
-
Small-scale (within 5 catchments in the Moselle basin). Examine dominant controls on streamflow signatures across five smaller, contrasting catchments in the Moselle. Assess the consistency of emerging patterns in terms of dominant controls on streamflow signatures and evaluate how different levels of geological detail influence correlations and inferences on baseflow generation processes.
This paper is structured as follows. Section 2 introduces the Data used. Section 3 describes the methodology applied. Section 4 presents the main results and is divided into three parts: large-scale analysis (Sect. 4.1), the intermediate-scale (Moselle basin) (Sect. 4.2) and the small-scale (Sect. 4.3). Section 5 discusses the results, mainly according to the key hypothesis introduced in Sect. 3.3. Finally, Sect. 6 summarizes the main conclusions.
2.1 The EStreams dataset
The data used in this study was obtained from the EStreams dataset (do Nascimento et al., 2024a). EStreams provides catchment delineations, meteorological time series, hydro-climatic signatures, and landscape attributes (topography, soils, geology, vegetation, and land use) for 17 130 European catchments. The catchments included in this study were selected using the following criteria:
-
We included only catchments with high-quality delineations, as described by do Nascimento et al. (2024a), to ensure spatial accuracy.
-
Only catchments with areas between 50 and 35 000 km2 were kept, reducing potential aggregation errors in catchment attributes (Beck et al., 2015; Van Dijk et al., 2013; Kratzert et al., 2023).
-
We chose catchments with signatures derived from at least 10 years of daily streamflow data (not necessarily consecutive) between 1950 and 2020. This threshold, supported by previous studies (Beck et al., 2015; Kauffeldt et al., 2013), ensured a balance between data availability and temporal representativeness.
-
Catchments were excluded if the long-term average streamflow exceeded 10 mm d−1 or if the runoff ratio was above 1, thus excluding catchments with potential water balance issues or major anthropogenic impacts.
-
Finally, these catchments were nested within a regional river basin with a total area between 7000 and 35 000 km2. This criterion was intended to minimize climatic variability associated with excessively large regional basins, while the second ensured sufficient representation of spatial variability in streamflow signatures.
Following these criteria, a total 4469 catchments remained in the dataset and were used in subsequent analyses as described in Sect. 2.3.
2.2 Geological maps
2.2.1 Global geological map
For the global geological map, we used the Global Lithological Map (GLiM) (Hartmann et al., 2012). GLiM is a comprehensive database that provides lithological classifications at a scale of 1:3 750 000. The dataset integrates geological information from several regional sources worldwide, including existing geological maps and databases, resulting in a global standardized lithological classification. We used the first level of information, which classifies bedrock-types into 16 major distinct classes (Table 5). Despite its lower level of details compared to regional datasets, GLiM's consistency and extensive coverage makes it a valuable resource for global-scale studies, and it is used in most existing LSH datasets (Addor et al., 2017; Helgason and Nijssen, 2024; Höge et al., 2023; Klingler et al., 2021; Kratzert et al., 2023). While its broad classification system may limit detailed geological interpretations, it has served as a foundation for large-scale analyses, providing a balanced trade-off between global coverage and geological detail.
2.2.2 Continental geological map
For the continental geological map, we used the International Hydrogeological Map of Europe (IHME), version 11, available at http://www.bgr.bund.de (last access: 11 February 2025), with a scale of 1:1 500 000 (Duscher et al., 2019; Günther and Duscher, 2019). The IHME map covers almost the entire European continent and parts of the Middle East. We used the third level of detail, which classifies bedrock-types into 31 distinct classes (Table 5). The IHME was compiled using the International Geological Map of Europe 1:1 500 000 (IGK1500), maintaining the same scale, topography, and projection.
2.2.3 Regional geological map
For the regional geological map, we used the same data used by Fenicia and McDonnell (2022). This regional map was specifically developed for the Moselle basin and was therefore used only for the intermediate and small-scale analyses. The Moselle basin spans four countries (54 % in France, 37 % in Germany, 8 % in Luxembourg and 1 % in Belgium), with geological maps sourced from different providers depending on the country:
-
France: BD LISA database (version 1, niveau 2, ordre 1, scale: 1:250 000, downloaded at https://bdlisa.eaufrance.fr, last access: 11 December 2021).
-
Germany: Geologische Übersichtskarte der Bundesrepublik Deutschland (GÜK200) (scale: 1:200 000, downloaded at http://www.bgr.bund.de, last access: 11 December 2021).
-
Luxembourg: The map was obtained from the “Administration de la gestion de l'eau” (at a scale of 1:250 000, and available at https://eau.gouvernement.lu/fr.html, last access: 11 December 2021).
-
Belgium: Information from the continental-scale IHME database (see Sect. 2.2.2).
Even though the IHME data has a much lower level of detail than the other maps, it was kept because less than 1 % of the Moselle basin lies in Belgium. The four different maps were combined, resulting in a total of 31 classes over the Moselle (Table 5). This combination of data sources provides a more nuanced and region-specific view of geological variability, enhancing the resolution of subsurface properties in the Moselle basin.
2.2.4 Summary of the main differences in the geological maps
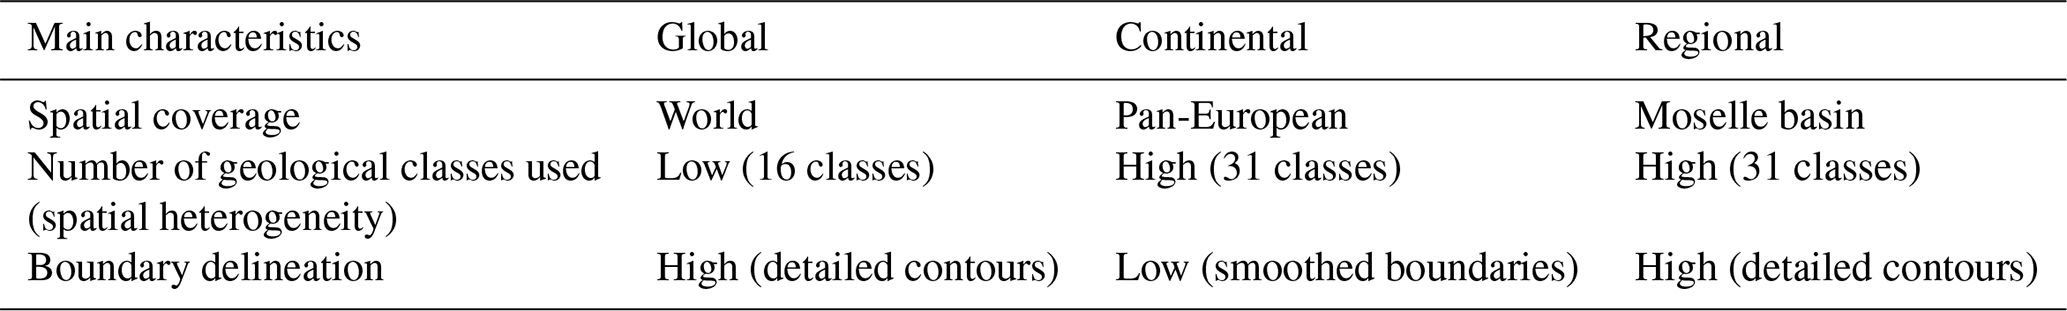
The geological maps used in this study differ not only in spatial scale but also in the number of lithological classes they include and how finely they delineate geological boundaries. Notably, the same location may be assigned different lithologies depending on the map used (e.g., Figs. A1 and A2), resulting in varying geological classifications for the same catchment. These differences are summarized in Table 1 and can also be seen in Fig. 2. While the global map presents a lower number of classes than the continental and regional maps, both the global and regional maps feature more detailed boundary contours.
Table 1Summary of the main differences between the geological maps.
2.3 Three analyses at progressively smaller scales
We examined three spatial scales, progressively transitioning from larger to smaller regions while increasing the level of analytical detail at each step. This approach aimed to balance depth and breadth, moving from lower-depth, broader-scale analyses to higher-depth, smaller-scale examinations. To ensure clarity, we categorized the spatial scales into three levels:
-
Large scale: This level included 63 river basins across Europe, and selected five basins (the Moselle, Cinca, Garonne, Vienne and Narew) for further exploration, as illustrated in Fig. 1a and b.
-
Intermediate scale: one selected regional basin, i.e., the Moselle River basin, shown in Fig. 1c.
-
Small scale: Five catchments nested within the Moselle basin (Fig. 1c).
At each scale, the basins and catchments analyzed included nested sub-catchments, allowing for an examination of their spatial distribution of streamflow signatures. The criteria for selecting catchments at each scale, along with the corresponding methodological approaches for analyzing the spatial distribution of streamflow signatures, are detailed in the following sections.
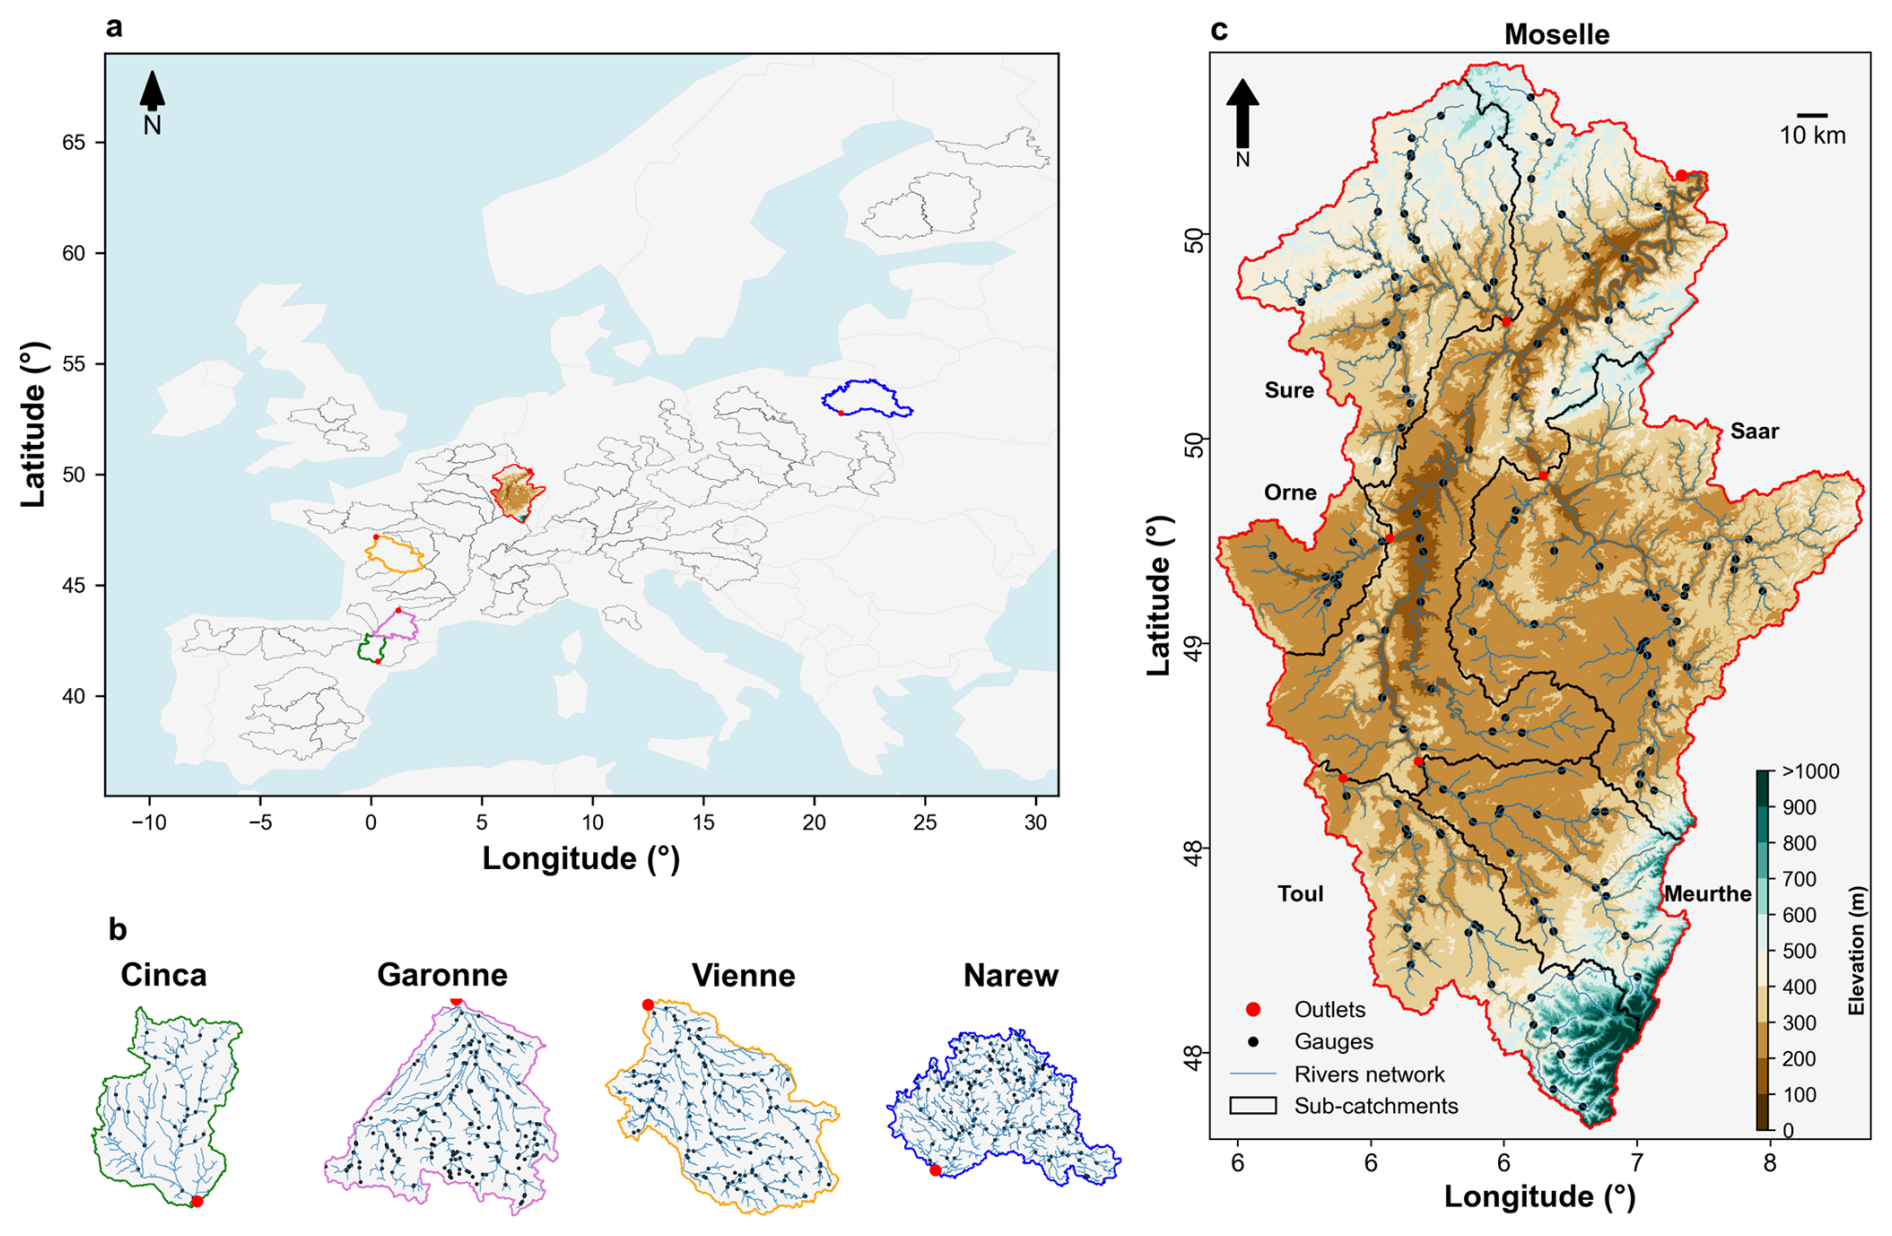
Figure 1Study area. (a) the 63 river basins used in the large-scale analysis, (b) five selected river basins as examples for the large-scale analysis are highlighted using distinct colors: green (Cinca, Spain, EStreams ID: ES000331), pink (Garonne, France, FR001604), orange (Vienne, France, FR003986), red (Moselle, DEBU1959) and blue (Narew, Poland, PL000936), while the remaining are outlined in black. (c) Moselle river basin also used in the intermediate scale analysis. It also shows the five nested sub-catchments (Moselle-Toul, FR003249; Moselle-Meurthe, FR000159; Moselle-Orne, FR003283; Moselle-Sure, LU000017 and Moselle-Saar, DEBU1957) used in the small-scale analysis. Red circles indicate the outlets of the basins/catchments, while black circles in all panels indicate the locations of the individual sub-catchment outlets at each analysis scale.
2.3.1 Large-scale: 63 basins
The large-scale analysis made use of the 63 river basins shown in Fig. 1a. The 63 selected river basins are distributed over a wide spectrum of hydro-climatic and landscape characteristics across Europe. They each contain up to 181 nested sub-catchment streamflow gauges. In total data from 4469 monitored (sub-)catchments are used in this analysis. See Table S1 in the Supplement for more details. From the 63 river basins of the large-scale analysis, five were selected for more detailed analysis based on their apparent distinct controls on the distribution of streamflow signatures: the Moselle (EStreams ID: DEBU1959), the Cinca (ES000331) and Garonne (FR001604), both located on the border between France and Spain, the Vienne (FR003986), located in central west France and the Narew (PL000936), located in northeast Poland. These basins are highlighted in Fig. 1b.
2.3.2 Intermediate scale: the Moselle basin
The Moselle basin (Fig. 1c) was selected for the intermediate scale analysis due to its documented geological influence on streamflow generation (Fenicia and McDonnell, 2022; Hellebrand et al., 2007; Pfister et al., 2017) and the availability of a detailed geological map derived from national databases (Fenicia and McDonnell, 2022). The basin outlet is located at Cochem, approximately 50 km upstream from the confluence with the Rhine River in Germany. The 152 gauged sub-catchments used in this analysis are indicated by their outlets in Fig. 1c.
The Moselle spans 27 100 km2, with elevation ranging from 60 to 1424 m. Its land use is primarily composed of forests (38 %), cropland (30 %), and pastures (20 %) (Fenicia and McDonnell, 2022). The region experiences annual precipitation between 800 and 1500 mm yr−1, while potential evaporation (PET), more consistent across the basin, ranges from 700 to 850 mm yr−1. Its substrate exhibits distinct heterogeneity, with coarser soils in the south, medium textures in the north, and finer materials concentrated in the central region. The geology of the basin primarily consists of sedimentary and metamorphic rocks, distributed across two geological basins and two massifs (Fenicia and McDonnell, 2022).
2.3.3 Small-scale: five nested sub-catchments within the Moselle
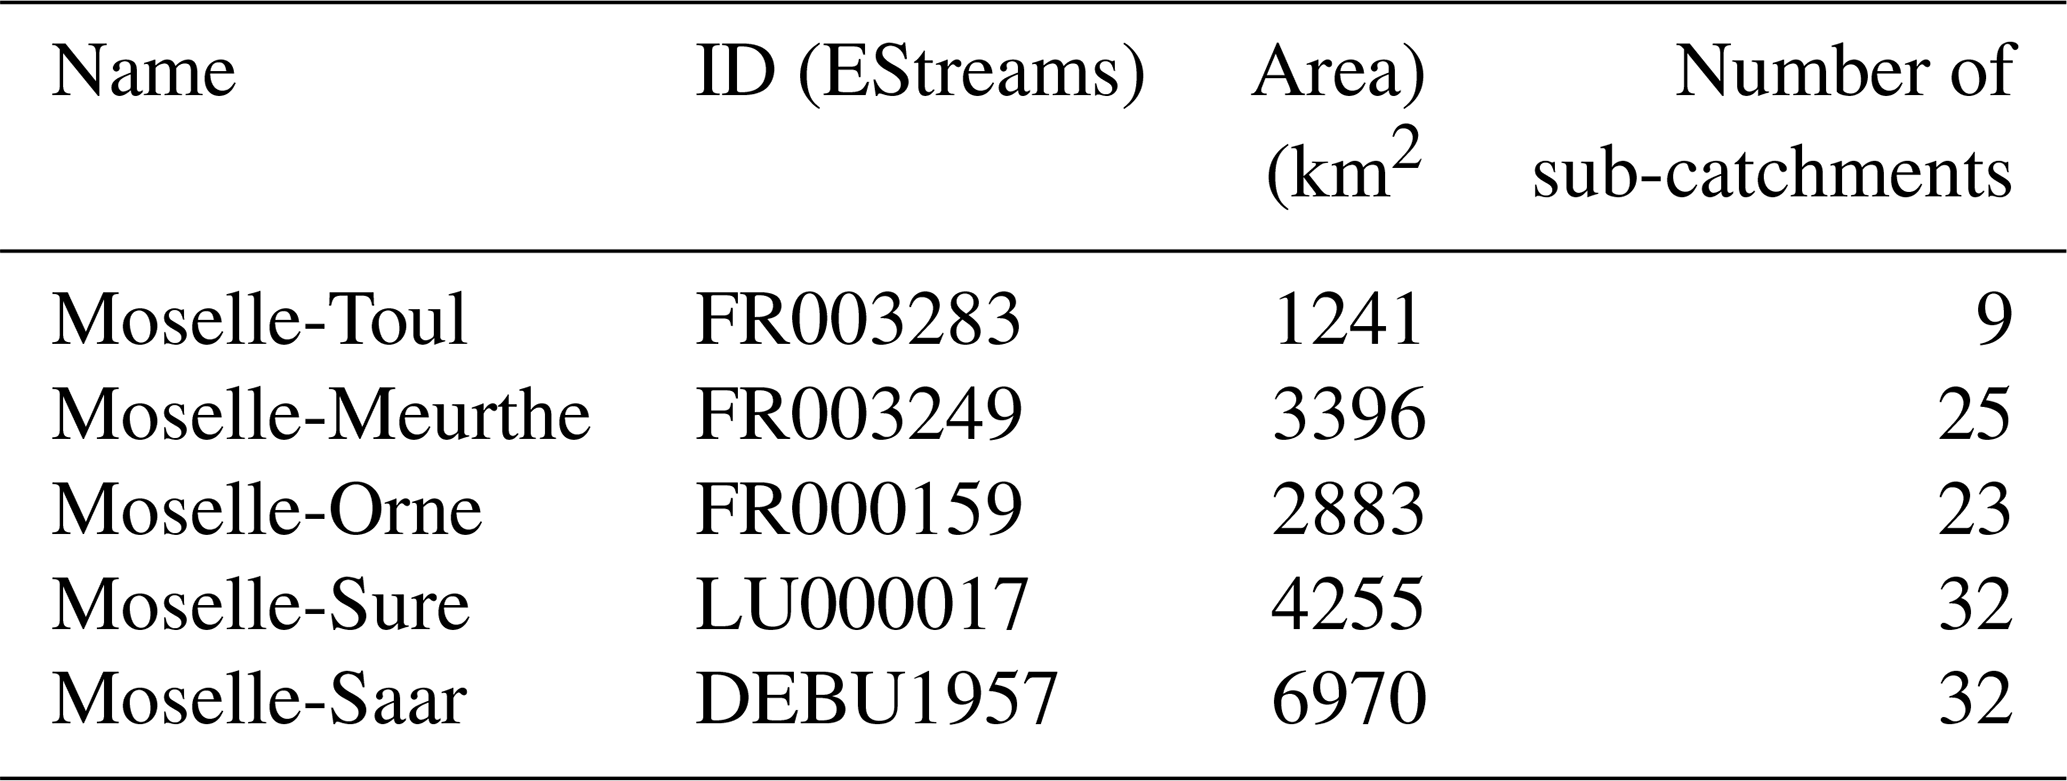
For the small-scale analysis, five catchments nested within the Moselle basin were selected (Fig. 1c). Each catchment was required to contain at least nine gauged sub-catchments to ensure adequate spatial representation. Table 2 lists their names, outlet codes, area, and the number of gauged sub-catchments. The selected catchments vary in size and number of gauges, with Moselle-Toul being the smallest and Moselle-Saar the largest.
Table 2Main overview of the five catchments nested within the Moselle.
3.1 Descriptors of streamflow, climate and landscape
In this section we present the streamflow, climate, and landscape attributes used in our analyses. To maintain clarity, we use different Greek letters to denote attributes associated with specific domains:
-
Streamflow attributes: These are referred to as “signatures” and are identified with the letter σ.
-
Climate attributes: These are identified with the letter κ.
-
Landscape attributes: These are classified into four groups based on the maps used to derive them:
- -
Topography: τ.
- -
Soils: ξ.
- -
Geology: γ.
- -
Land use: λ.
- -
Each letter is followed by the specific variable name as defined in the EStreams dataset. The attributes used are those readily available from EStreams, which in turn are derived from those commonly found in LSH datasets. An exception is the geology-based attributes, which are described in Sect. 3.2.
Although geology is the primary focus of this study, we included other landscape and climate attributes to provide a comparative baseline. This allows us to assess whether increased correlations while using geological data also lead to stronger explanatory power relative to other groups and helps place our findings in the context of broader hydrological understanding. For example, comparing across attribute groups enables us to interpret whether a correlation of 0.60 for a geology variable is relatively high or low compared to topography, soils, land use, or climate attributes.
3.1.1 Streamflow signatures
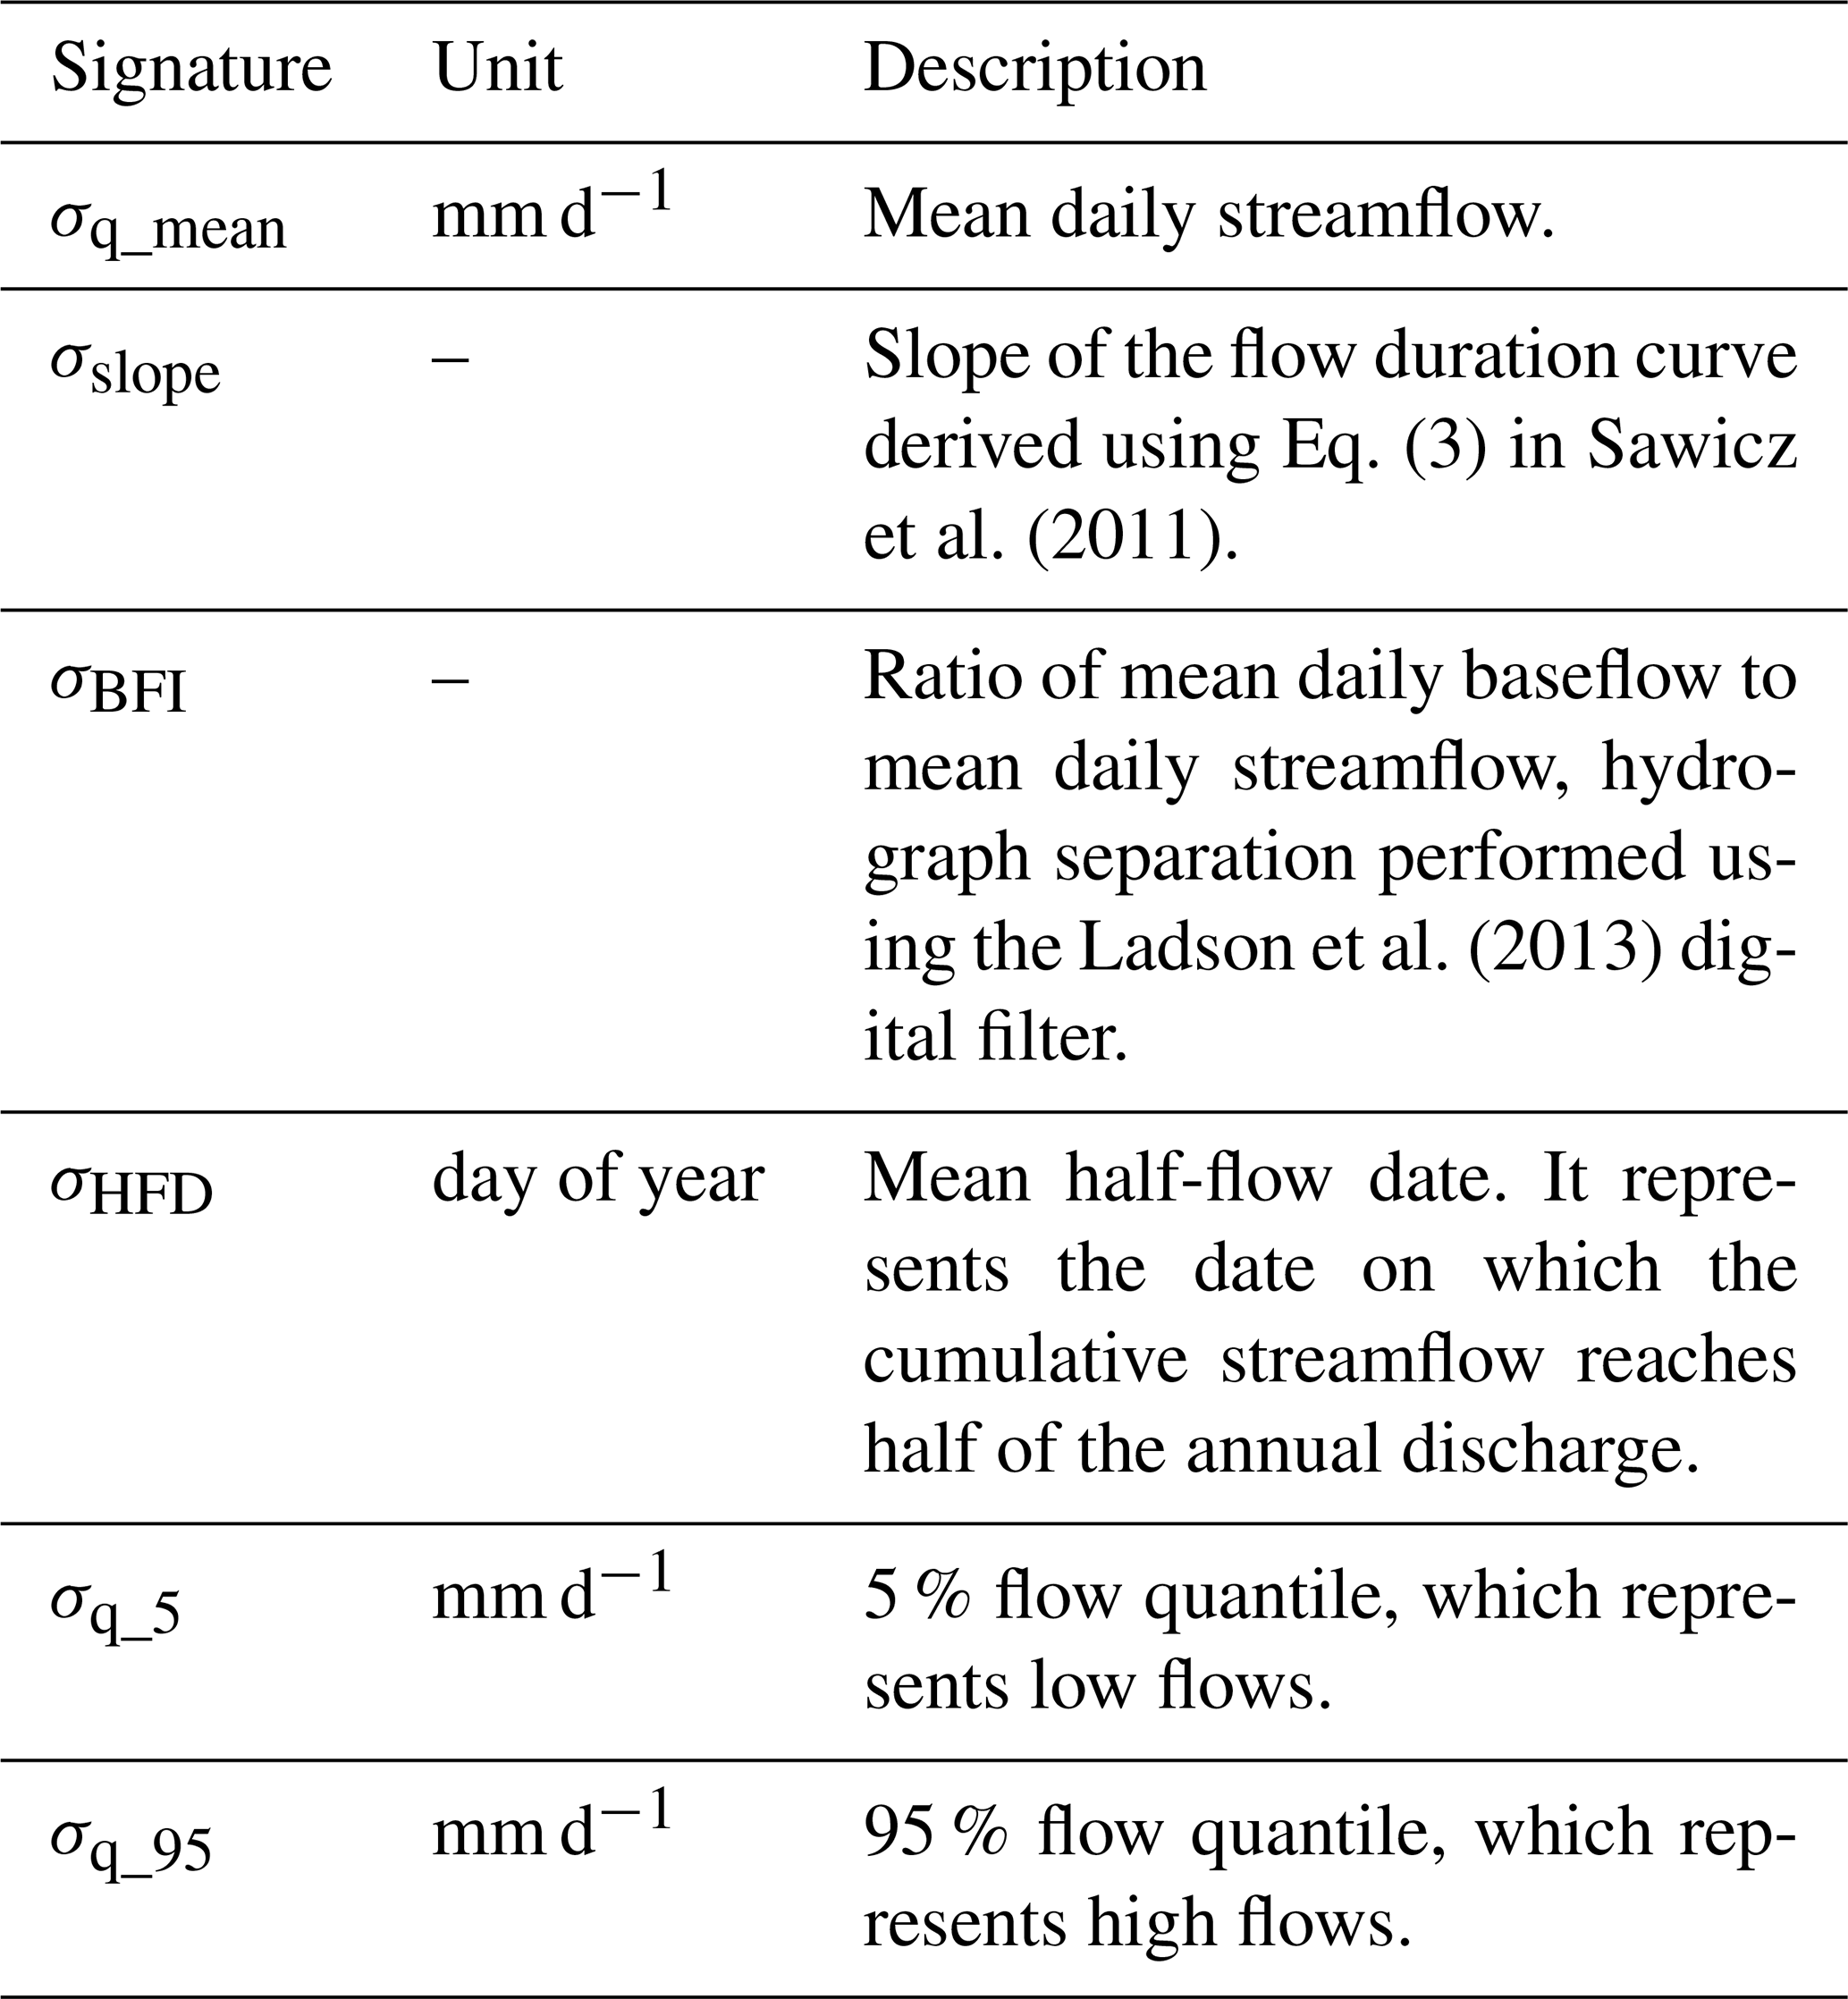
We used 6 streamflow signatures to characterize the hydrological behavior of the selected catchments (Table 3). These signatures have been selected because they are readily available in LSH datasets and proved useful to characterize different parts of a hydrograph (Addor et al., 2017, 2018; Höge et al., 2023; do Nascimento et al., 2024a). Each signature was originally computed by EStreams using available streamflow data from 1 October 1950 to the 30 September of 2022.
3.1.2 Climate and landscape attributes
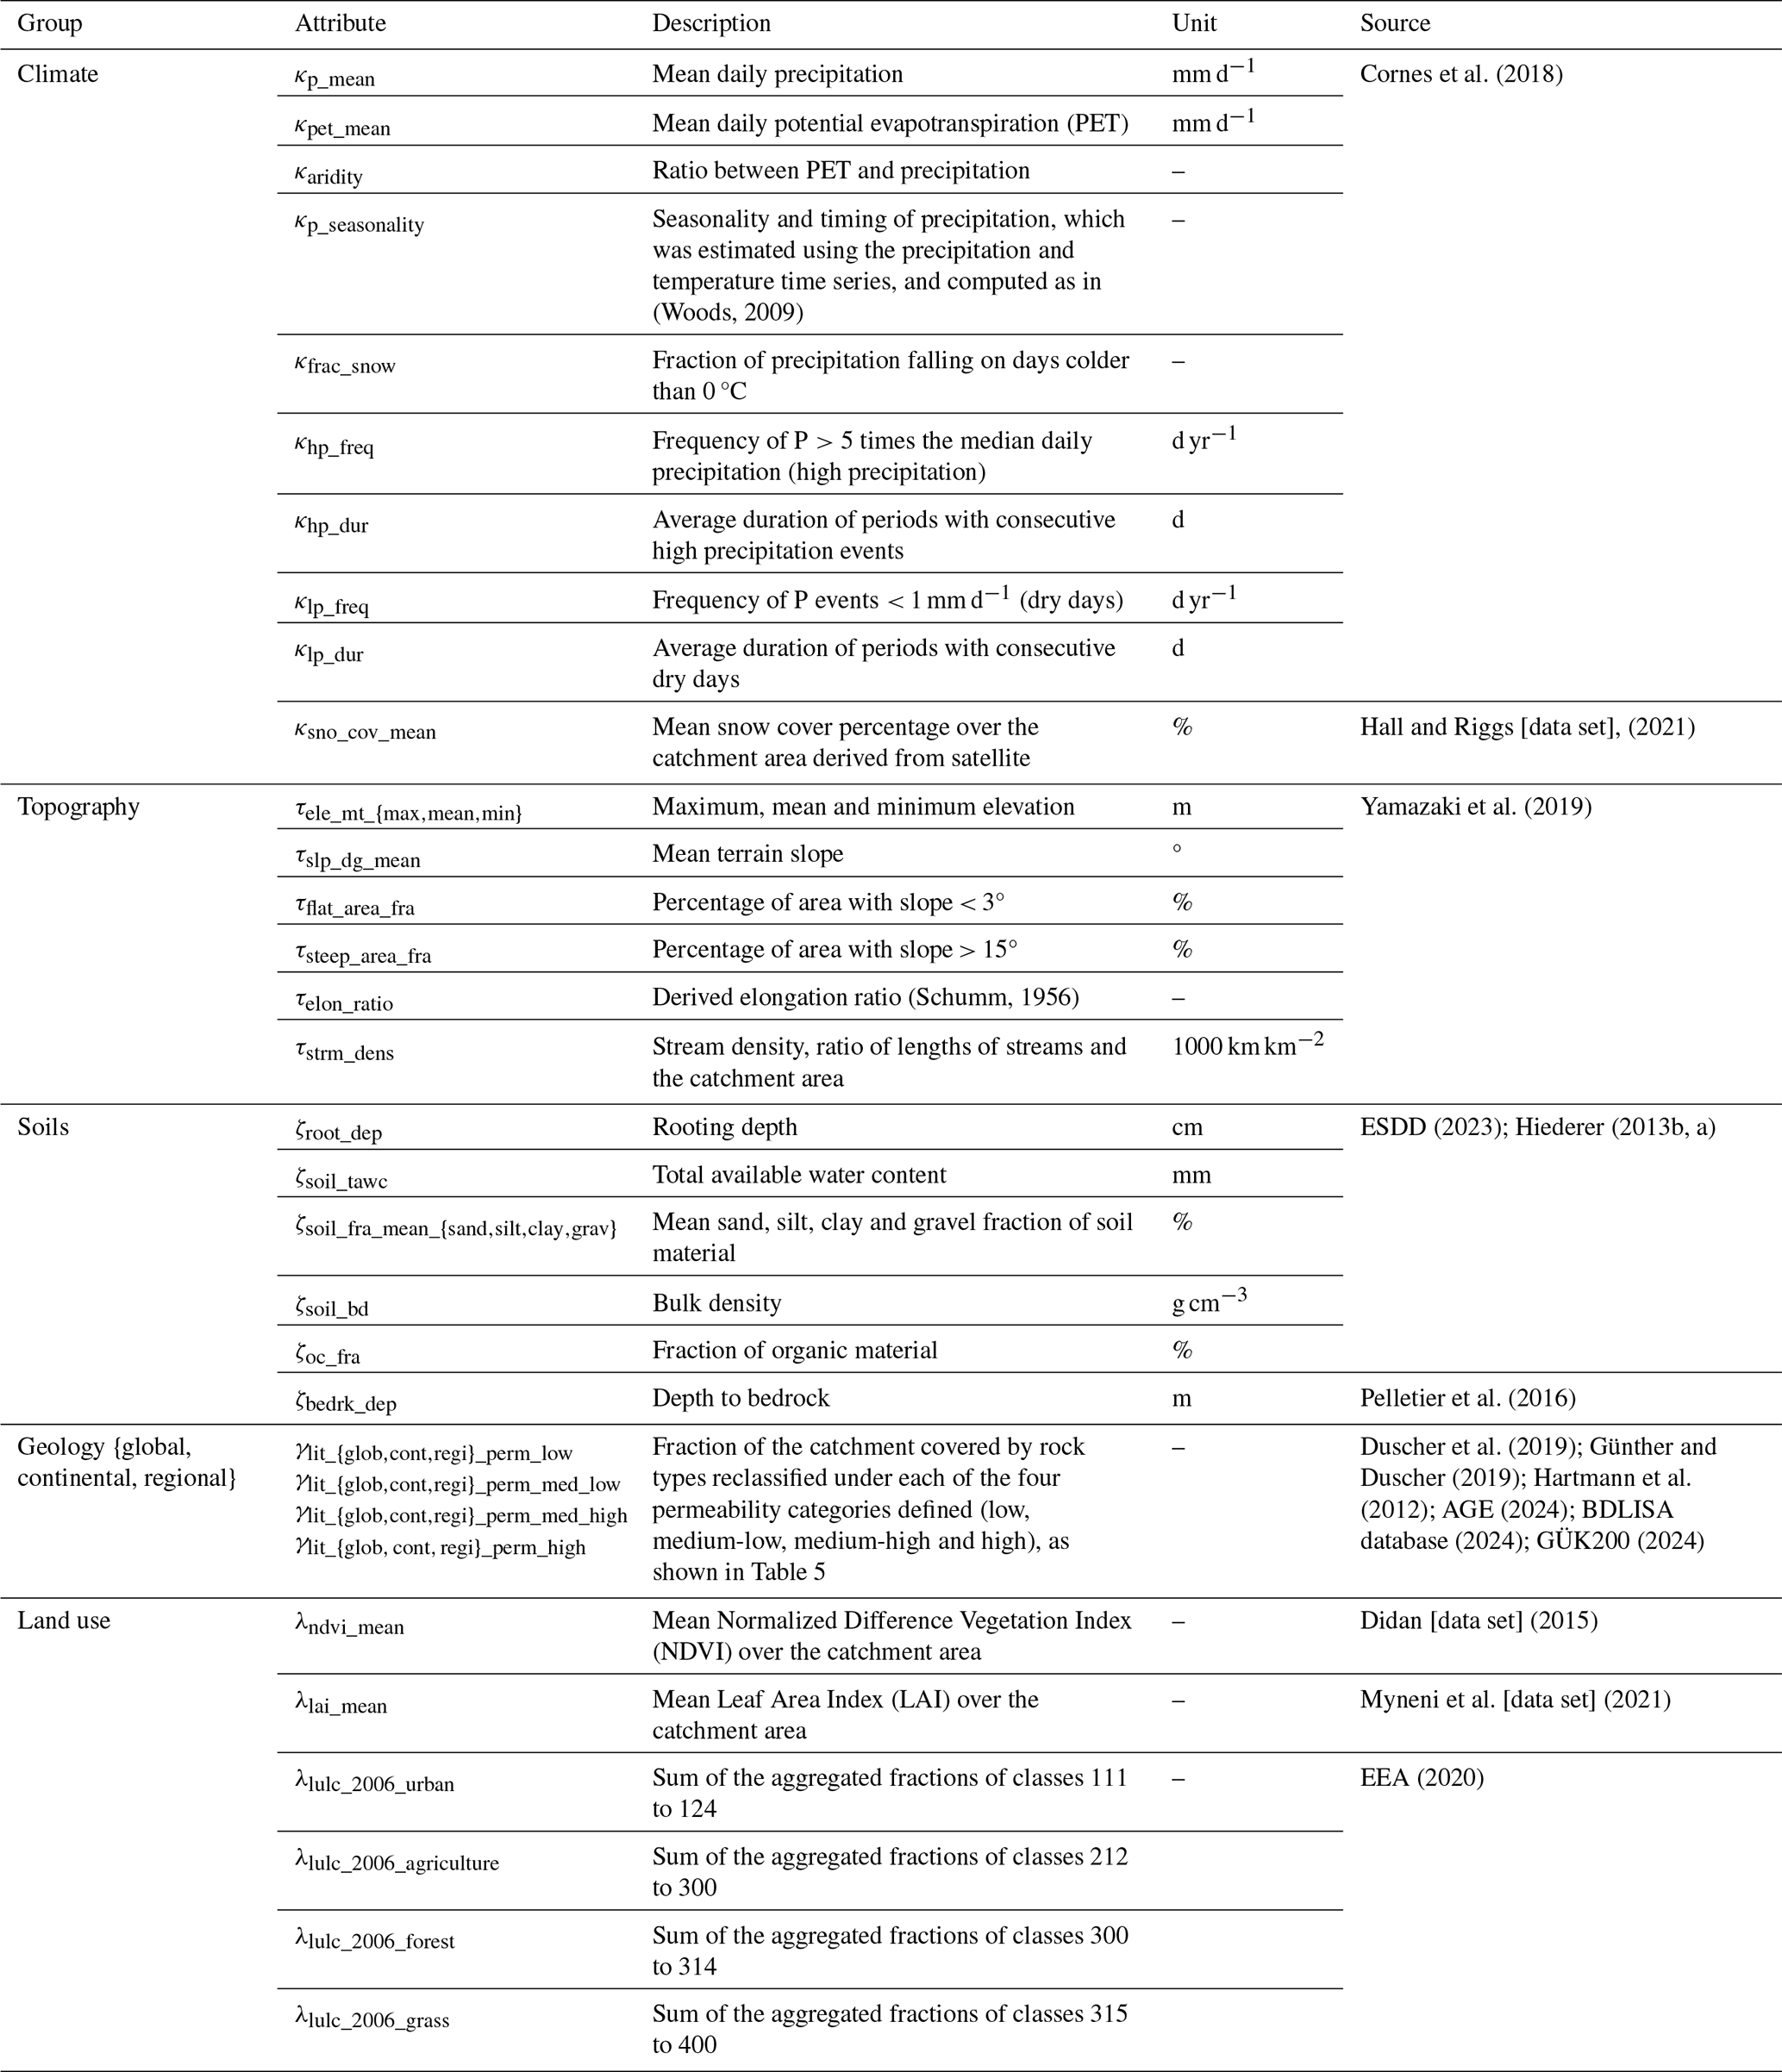
The set of climate and landscape attributes used in this study is shown in Table 4.
Table 4Set of catchment attributes used in this work, as described by EStreams (do Nascimento et al., 2024a). The Table divides the attributes into five different groups (i.e. climate: κ, topography: τ, soils: ζ, geology: γ and land use: λ). Geology was split into three sub-groups (i.e., global, continental and regional sources). Similarly to the streamflow signatures, the climatic attributes were derived by EStreams using the available E-OBS time series dataset between the period of 1950 to 2022.
3.2 Reclassification of the geological maps
Lithological maps, in their raw form, are challenging to use directly for regression analysis with streamflow signatures. To enable their use, lithological classes must be assigned numerical values that reflect their hydraulic properties. To address this, we reclassified the geology into four qualitative permeability classes: low, medium-low, medium-high, and high, following the approach introduced by Fenicia and McDonnell (2022) and supported by additional references from the literature (Bagdassarov, 2021; Gleeson et al., 2011b).
Table 5 shows the details of this reclassification, associating each geological map class with its corresponding permeability category. For instance, volcanic and plutonic rocks were assigned to the “low permeability” class, while unconsolidated sediments, such as conglomerates, were categorized as having “high permeability.” Fig. 2 shows the spatial distribution of these categories from the global, continental and regional geology maps across the Moselle basin. The three geological maps generally agree on permeability distribution, though discrepancies appear in the northern area of the basin.
Table 5Reclassification of the global, continental and regional geology classes into four permeability classes. The table also shows the sources of each map.
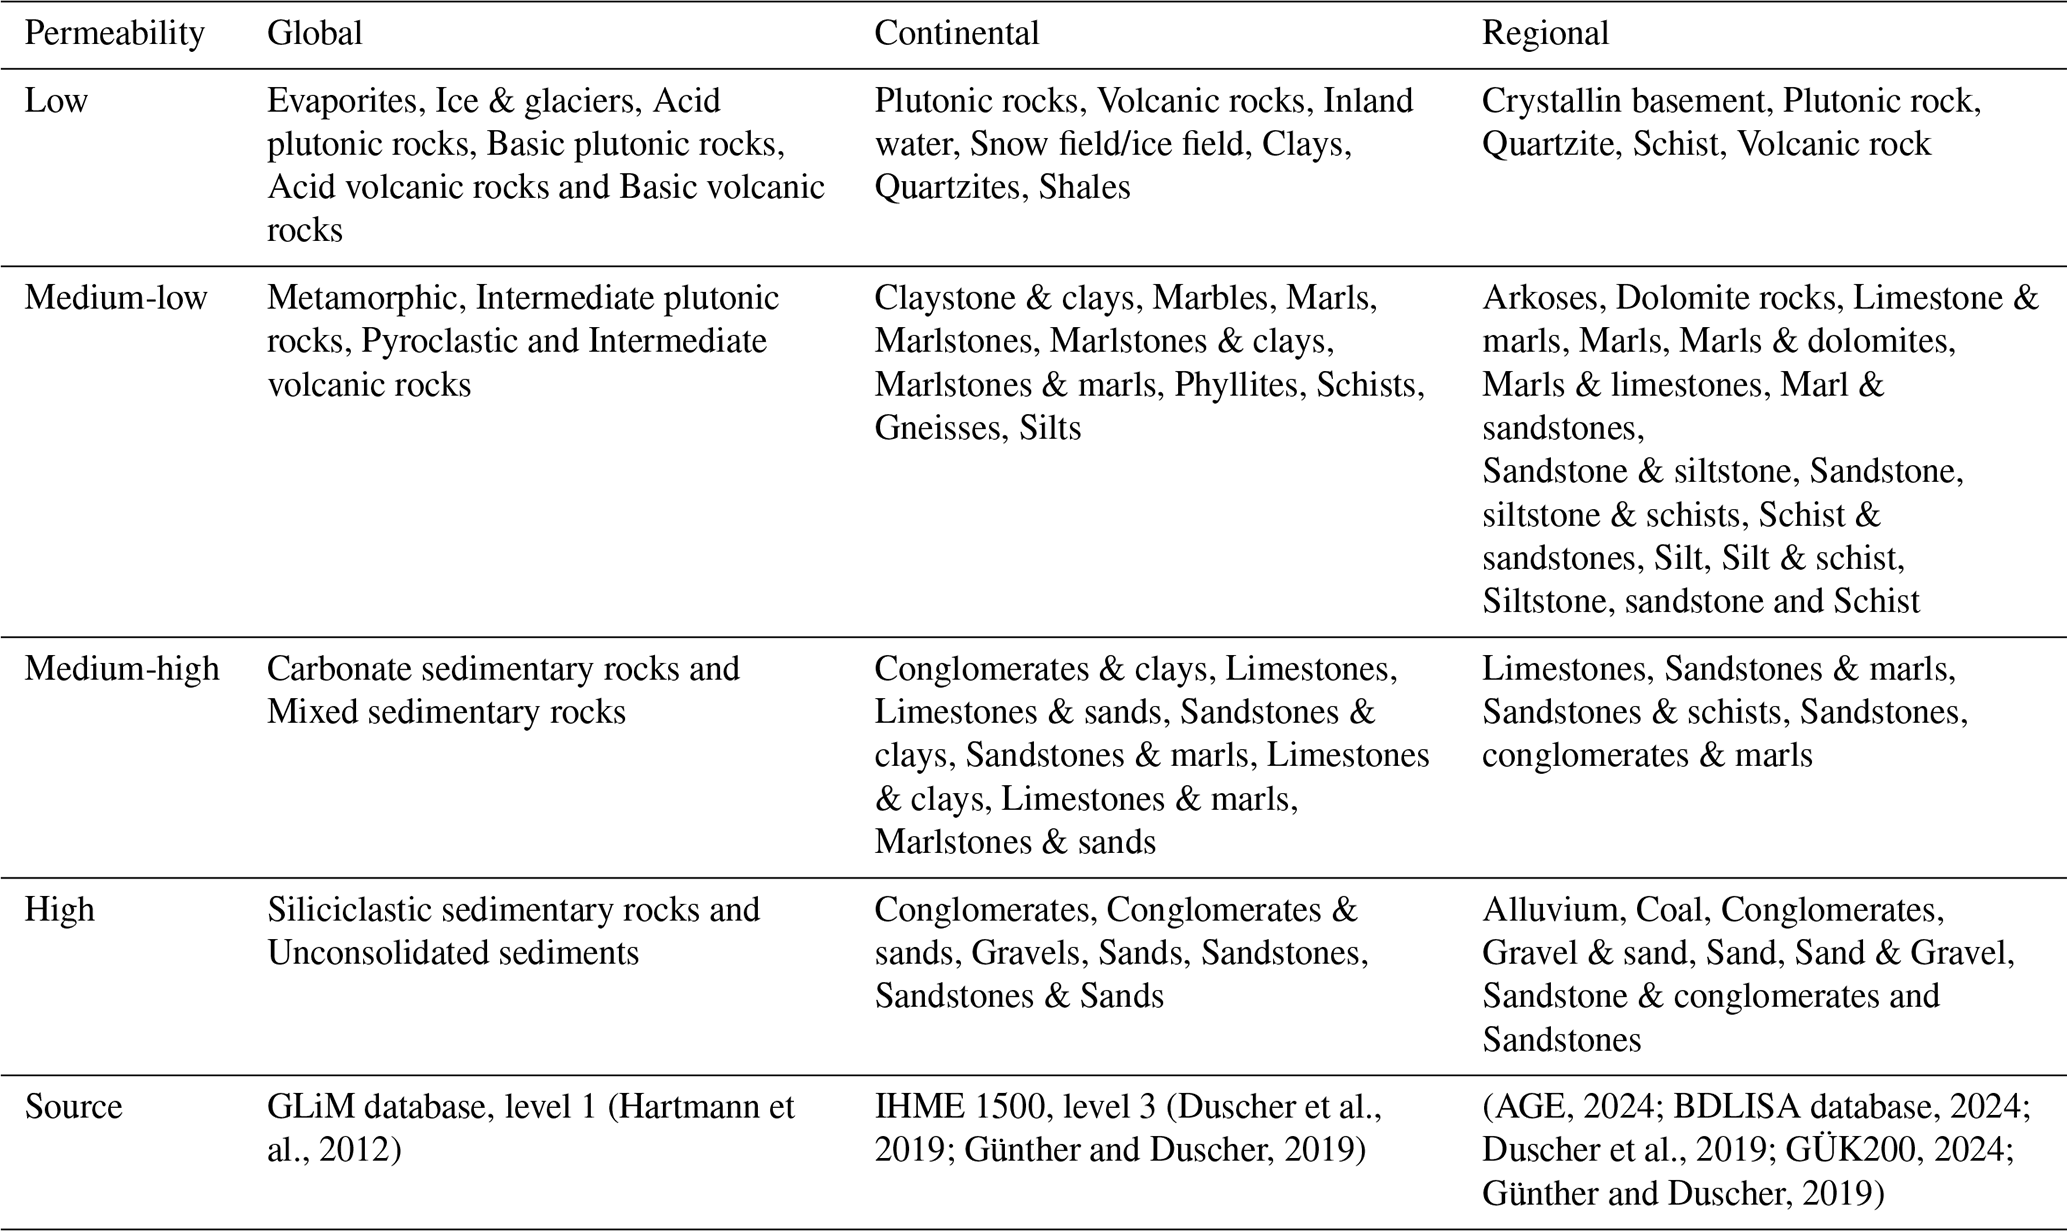

Figure 2Spatial distribution of the four permeability categories across the Moselle basin for the global, continental and regional geology maps. In the background there is the river network in blue, the streamflow gauges (sub-catchments) as black dots, and the basin outlet in red.
The four permeability classes are represented by attributes defining the spatial coverage of each permeability class relative to the total catchment area. For instance, the variable γlit_cont_perm_high in Table 4 Indicates the relative area fraction of high-permeability zones in the continental map, therefore combining the areas of associated rock-types, i.e., conglomerates, conglomerates & sands, gravels, sands, sandstones, and sandstones & sands (Table 5).
3.3 General procedure for identifying dominant controls on streamflow
In this study, we conducted an exploratory statistical analysis to identify dominant climate or landscape attributes influencing streamflow generation across different scales. This was done based on the Spearman correlation coefficient (rs) between each catchment attribute (listed in Table 4) and each streamflow signature (Table 3). To analyze the impact of different geological maps, the analysis was performed separately using data of the corresponding attributed from each map – global, continental, and regional. This approach allows us to evaluate the influence of geological data level of detail on correlation outcomes and assess whether observed correlations correspond to hydrological expectation and previous literature.
Specifically, our hypotheses of the effect of underlying geological maps on the correlation between geological attributes and hydrological signatures were as follows:
-
Different correlation with higher map detail: More detailed geological maps are expected to increase the correlation between derived geology attributes and streamflow signatures, if geology influences the streamflow regime.
-
Consistency of correlations with physical understanding: As map detail increases, we expect the correlations to become progressively more consistent with physical understanding. For example, the baseflow index (σBFI) is expected to show positive correlations with high-permeability geological attributes, as high bedrock permeability favors groundwater flow, which facilitates baseflow (Bloomfield et al., 2021; Fenicia and McDonnell, 2022). We also anticipate that, because of this physical consistency, correlations will become less variable across different regions.
While this univariate approach is useful for interpretability and isolating the influence of individual attributes, it has key limitations. First, it does not capture interactions among multiple variables or account for multicollinearity – an important consideration given that many climate and landscape attributes are interdependent (Mathai and Mujumdar, 2022). Moreover, univariate correlations may be prone to spurious relationships, especially in complex hydrological systems.
Although more advanced statistical and machine learning methods – such as multiple regression, random forests, or other multivariate approaches – could better disentangle the individual effects of geology and control for confounding variables (Addor et al., 2018; Beck et al., 2015; Kuentz et al., 2017), the goal of this study is not to maximize predictive accuracy. Rather, our focus is on interpretability, physical consistency, and evaluating how geological map detail influences our understanding of streamflow generation mechanisms.
3.4 Specific procedure
3.4.1 Large-scale
For the 63 regional basins, we followed this procedure:
-
First, we calculated the rs between each of the 6 streamflow signatures (Table 3) and the 47 catchment attributes (Table 4) using all available sub-catchments within each basin. For example, for the Moselle basin, we used data from the 152 sub-catchments to compute each rs value. Overall, this step resulted in a total of 17 766 correlation values.
-
To provide a broad overview of landscape controls on each signature by reducing dimensionality and streamlining interpretation, we only reported the maximum for each of the six attribute groups listed in Table 4: climate, topography, soils, land use, global geology, and continental geology. This step narrowed the correlation values to 2263.
We selected the maximum rather than the mean or median to highlight the strongest attribute–signature relationships within each group. While we acknowledge that groups with more variables may be more likely to yield stronger maximum values, the goal here was not to compare groups statistically, but to identify potential dominant controls. Mean or median values could obscure key relationships by averaging over non-informative variables, whereas the maximum highlights potentially meaningful signals worthy of further investigation.
Furthermore, while most LSH studies compute correlations across all catchments simultaneously, our approach differs by analyzing 63 individual river basins separately across a continental domain. This framing limits the influence of broad climate gradients, which can mask landscape effects. Therefore, by focusing on climatically consistent units, i.e., individual river basins with nested catchments, we reduce climate variability and improve our ability to detect basin-specific controls on streamflow signatures.
3.4.2 Intermediate scale
For the Moselle basin, we applied the same procedure as described above for the large-scale analysis, with the addition of data from the regional geology map.
3.4.3 Small-scale
For the five catchments of the Moselle, we employed the following methodology:
-
We calculated the correlation between the baseflow index and 47 catchment attributes for each of the five catchments of the Moselle, using all available nested sub-catchments within each catchment. This resulted in a total of 235 correlation values rs.
-
Instead of selecting only the maximum value per group, we conducted a more refined analysis here, focusing on the coherence of correlations, mainly the ones derived from geological attributes, consistent with the hypotheses raised in Sect. 3.3.
This more in-depth analysis aimed to assess how local factors might alter the relationships identified at broader scales, allowing us to distinguish correlations that are likely to reflect hydrological expectation and previous literature.
4.1 Large scale analysis
4.1.1 Ranking of different attribute groups
We focus here on the baseflow index (σBFI), a streamflow signature commonly associated with groundwater flow, where geology is anticipated to be a dominant control. Across the 63 basins, 75 % (47) exhibited at least one attribute group with > 0.50. However, the group with the highest correlation varied widely across basins (Fig. 3). In most cases, land use (15) was the group with the highest maximum correlation, followed by soils (13), climate (12), topography (10), geology from the global map (7), and geology from the continental map (6). Particularly, landscape attributes showed stronger correlations with σBFI than climatic attributes in 51 out of the 63 nested basins (see Supplement Table S3 for basin-level details).
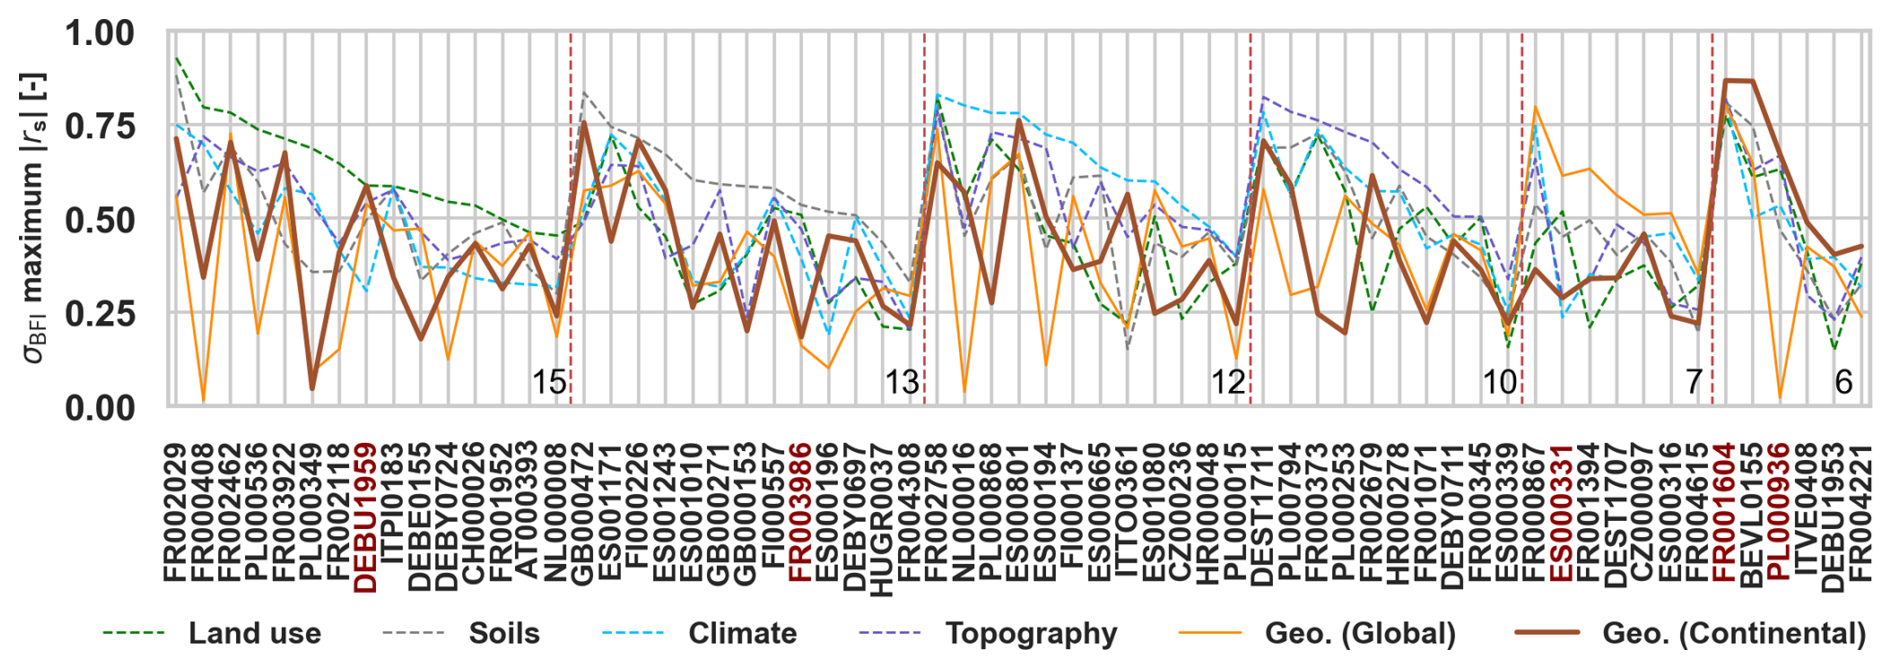
Figure 3Maximum values for each catchment attribute group for each nested basin. Each color represents the respective maximum value for a specific attribute group (e.g., climate is shown in blue). The IDs of the Cinca (ES000331), Garonne (FR001604), Vienne (FR003986), Moselle (DEBU1959), and Narew (PL000936) basins are indicated in red. The groups are ordered in descending order starting with the group that ranked the most nested basins (land use) and ending with the least (continental geology). The number of nested basins in each group is also indicated in the plot area.
We examined individual attributes with the highest with σBFI within each group to explore which specific variable drive these results. We found a large variability in these individual attributes. These included mean snow cover (climate), fraction of steep area (topography), mean NDVI (land use), mean fraction of silt (soils), high-permeability class (global geology), and low-permeability class (continental geology). Their relationships with σBFI are shown in Fig. D1, and correlations among these variables themselves are presented in Fig. D2. Among them, mean NDVI showed the highest correlation with σBFI (). The highest pairwise correlations were between mean snow cover and NDVI (), and between snow cover and fraction of steep area ().
We emphasize that these correlations do not imply causality. Moreover, the correlations were arguably weak, emphasizing the difficulty of identifying generally valid cross-basin relationships between catchment attributes and streamflow signatures at the continental scale. Such relationships became clearer only when the analysis was constrained to more hydrologically homogeneous regions, such as nested basins (e.g., the Moselle).
4.1.2 Comparison between the correlations of the two geological maps
Figure 4 compares the global and continental maps across the full set of signatures. Results indicate that neither map consistently outperformed the other for all signatures at the same time at the large-scale analysis. Specifically, most basins scatter around the 1:1 line, with variable differences in values between global and continental geological attributes and signatures. Depending on the signature, between 32 and 41 out of 63 basins exhibited stronger with the continental attribute. Only σq_95 (41 basins) and σHFD (37 basins) exceeded by the widest margins the halfway threshold, whereas the other signatures (including σBFI) remained closer to an even split.
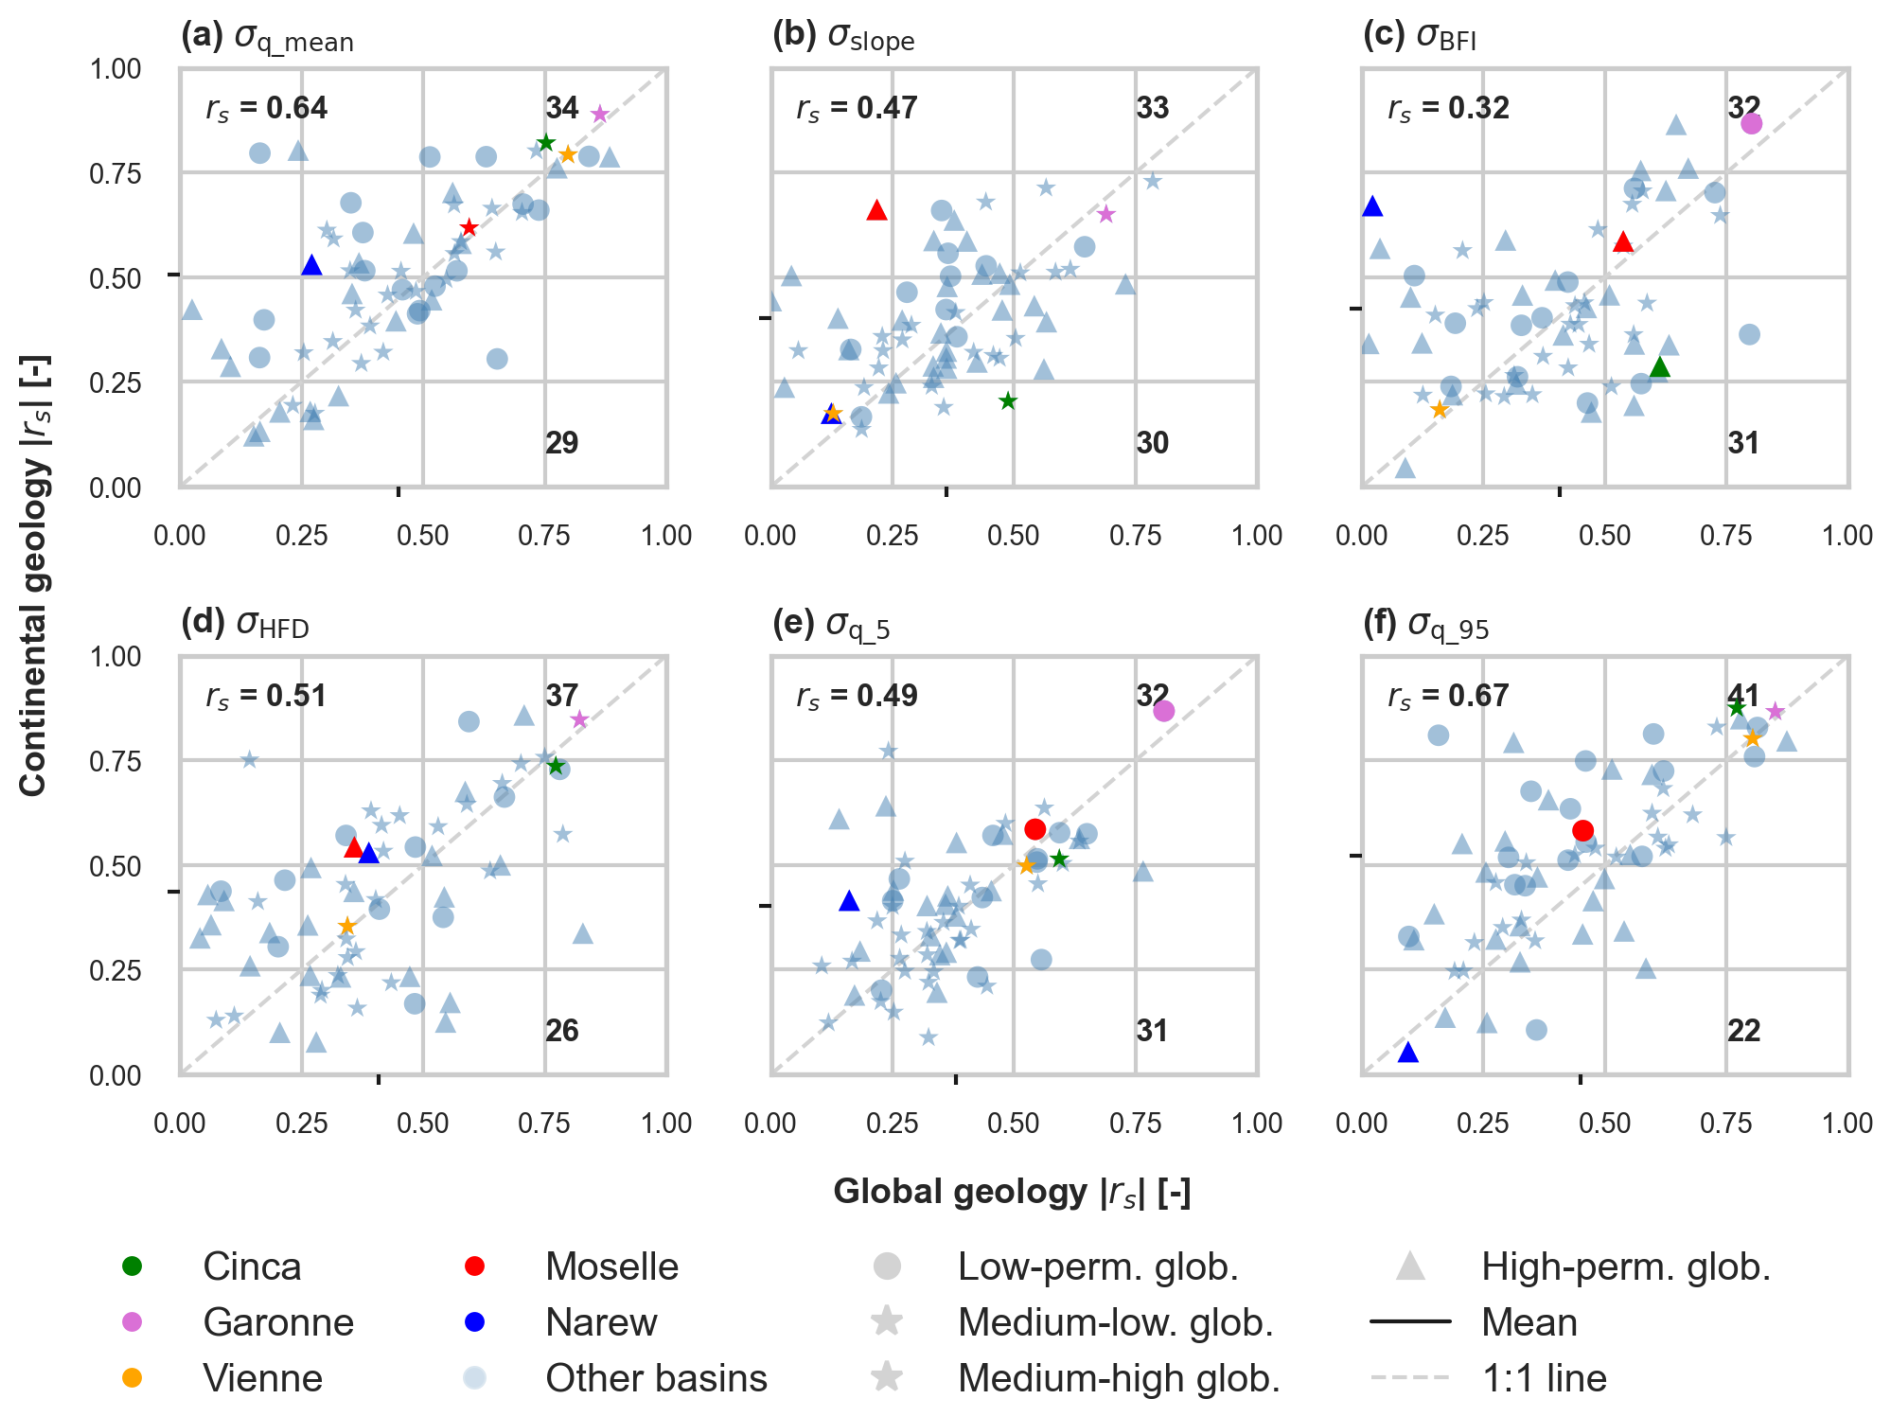
Figure 4Scatter plots of the values derived from the global geology maps versus those from the continental geology map for the six streamflow signatures. Each light blue circle represents one of the 63 river basins. The 1:1 line is shown in dashed light gray, and the mean coordinates per geological map are depicted in black on both axes. Moreover, the subplots show the Spearman correlation between the correlations from both maps, and the number of basins above and below the 1:1 line.
Focusing only on basins where the absolute differences in exceeded 0.1 between global and continental attributes (about 30 basins per signature), the apparent advantage of the continental map became clearer: more than half of these basins showed stronger with continental attributes than global. Increases were more consistent for σq_mean (85 % of the basins) and σq_95 (81 %), followed by σslope and σq_5 (69 %), σHFD (63 %), and σBFI (59 %). These results underscore the added value of the continental-scale geology maps in capturing particularly the spatial distribution of streamflow signatures related to flow extremes and surface water dynamics (σq_mean and σq_95) when absolute differences in exceeded 0.1.
Moreover, except for σq_95 (0.67) and σq_mean (0.64), the correspondence between the two geological maps was generally weak (Fig. 4), indicating limited consistency between them. Additional details for the baseflow index and other attribute groups are provided in Fig. D3, which shows that although cross-group correlations between the were typically positive, their magnitudes were generally low, with only topography and climate exceeding 0.70.
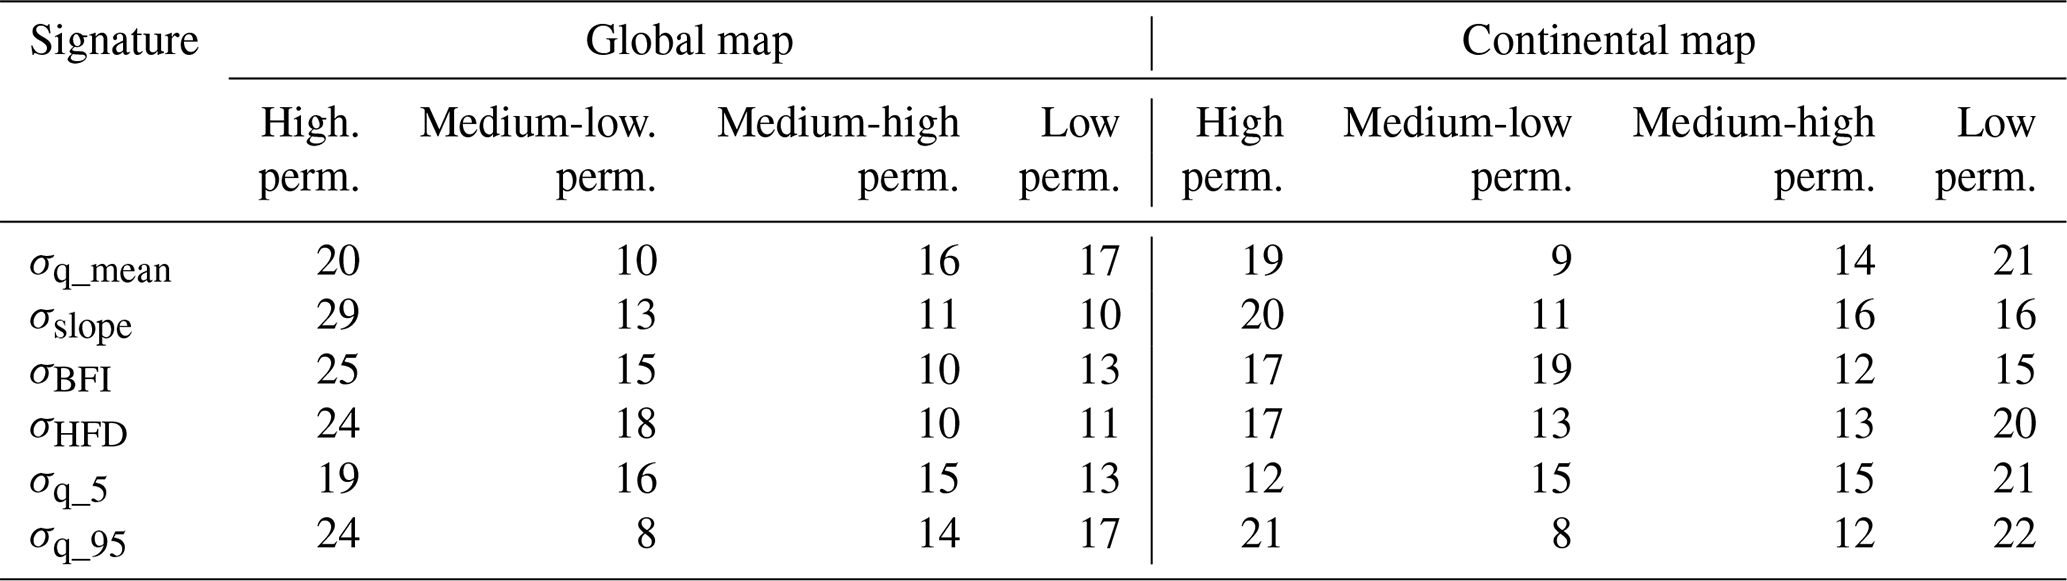
The distribution of permeability variables with the highest also differed between the two geological maps (Fig. 4; Table 6). For the baseflow index, the global map most frequently highlighted the high-permeability class (25 basins), followed by medium-low (15), low (13), and medium-high (10). In contrast, the continental map showed a different pattern: medium-low permeability had the highest number of leading correlations (19), followed closely by high (17), low (15), and medium-high (12). Similar shifts occurred for other streamflow signatures as well (Tables S4 to S9). Overall, the results suggest that the global map tends to emphasize the influence of high-permeability attributes, while the continental map captures a more nuanced influence of medium and low-permeability classes, suggesting that differences in geological map details can alter the inferred streamflow-geology relationships.
Table 6Number of basins where each geological permeability attribute showed the highest correlation () with each streamflow signature, for the global and continental geological maps.
4.1.3 Further exploration of five representative basins
To gain deeper insights into disparities in results arising from distinct underlying geological maps, five selected basins with distinct correlation patterns (Figs. 2 and 5) were analyzed, namely the Moselle (DEBU1959), Cinca (ES000331), Garonne (FR001604), Vienne (FR003986) and Narew (PL000936). These basins exhibit a range of behaviors, from high and consistent correlations in the Garonne to substantial differences between global and continental maps in the Cinca, Narew, and Moselle, and low correlations in the Vienne irrespective of the map used. The key variations in these correlations can be linked to differences in geological classification, spatial heterogeneity, and the level of fine boundary contours (spatial resolution) in each map. A detailed description of their raw geological classifications is provided in Appendix A. From this analysis, it was found that:
For the Moselle basin (Fig. 2), the continental map provided = 0.59, a slightly stronger correlation with σBFI compared to the global map ( 0.54; Fig. 4c). Figure 2 highlights that the main difference between the two maps is in the northern area of the basin, where the global map classified a substantial part as siliciclastic rocks (high permeability in our classification). The continental map, however, provided a more detailed differentiation, identifying shale (low permeability), which better aligned with the observed low σBFI values in the area. This means that using the global map, our reclassification assigned 3.8 % of the basin to low permeability, while the continental map reclassified 22.7 % to low permeability.
The Cinca basin shows an interesting pattern. While the global geology map presented a = 0.60 between σBFI and geology, the continental map yielded a much weaker correlation ( 0.29; Fig. 4c). Figure 5 shows that the global map provided a higher spatial variability alongside finer detail than the continental map. In fact, the continental map expressed a sharp change in the permeabilities from the upstream area to the downstream area of the basin.
For the Garonne basin, both geology maps displayed very high correlation values for σBFI ( > 0.80; Fig. 4c). Figure 5 indicates that both maps classified this basin with dominant rock types such as mixed sedimentary rocks and unconsolidated sediments, which also yield high permeability (Appendix A). Additionally, both maps presented a strong spatial geology variability (gradient) over the whole basin area (Fig. 5). In quantitative terms, the global map classified 29 % and 52 % of the area respectively as high and medium-high permeability, and the continental map with 17 % (high), 49 % (medium-high), demonstrating a good balance among the used reclassified classes.
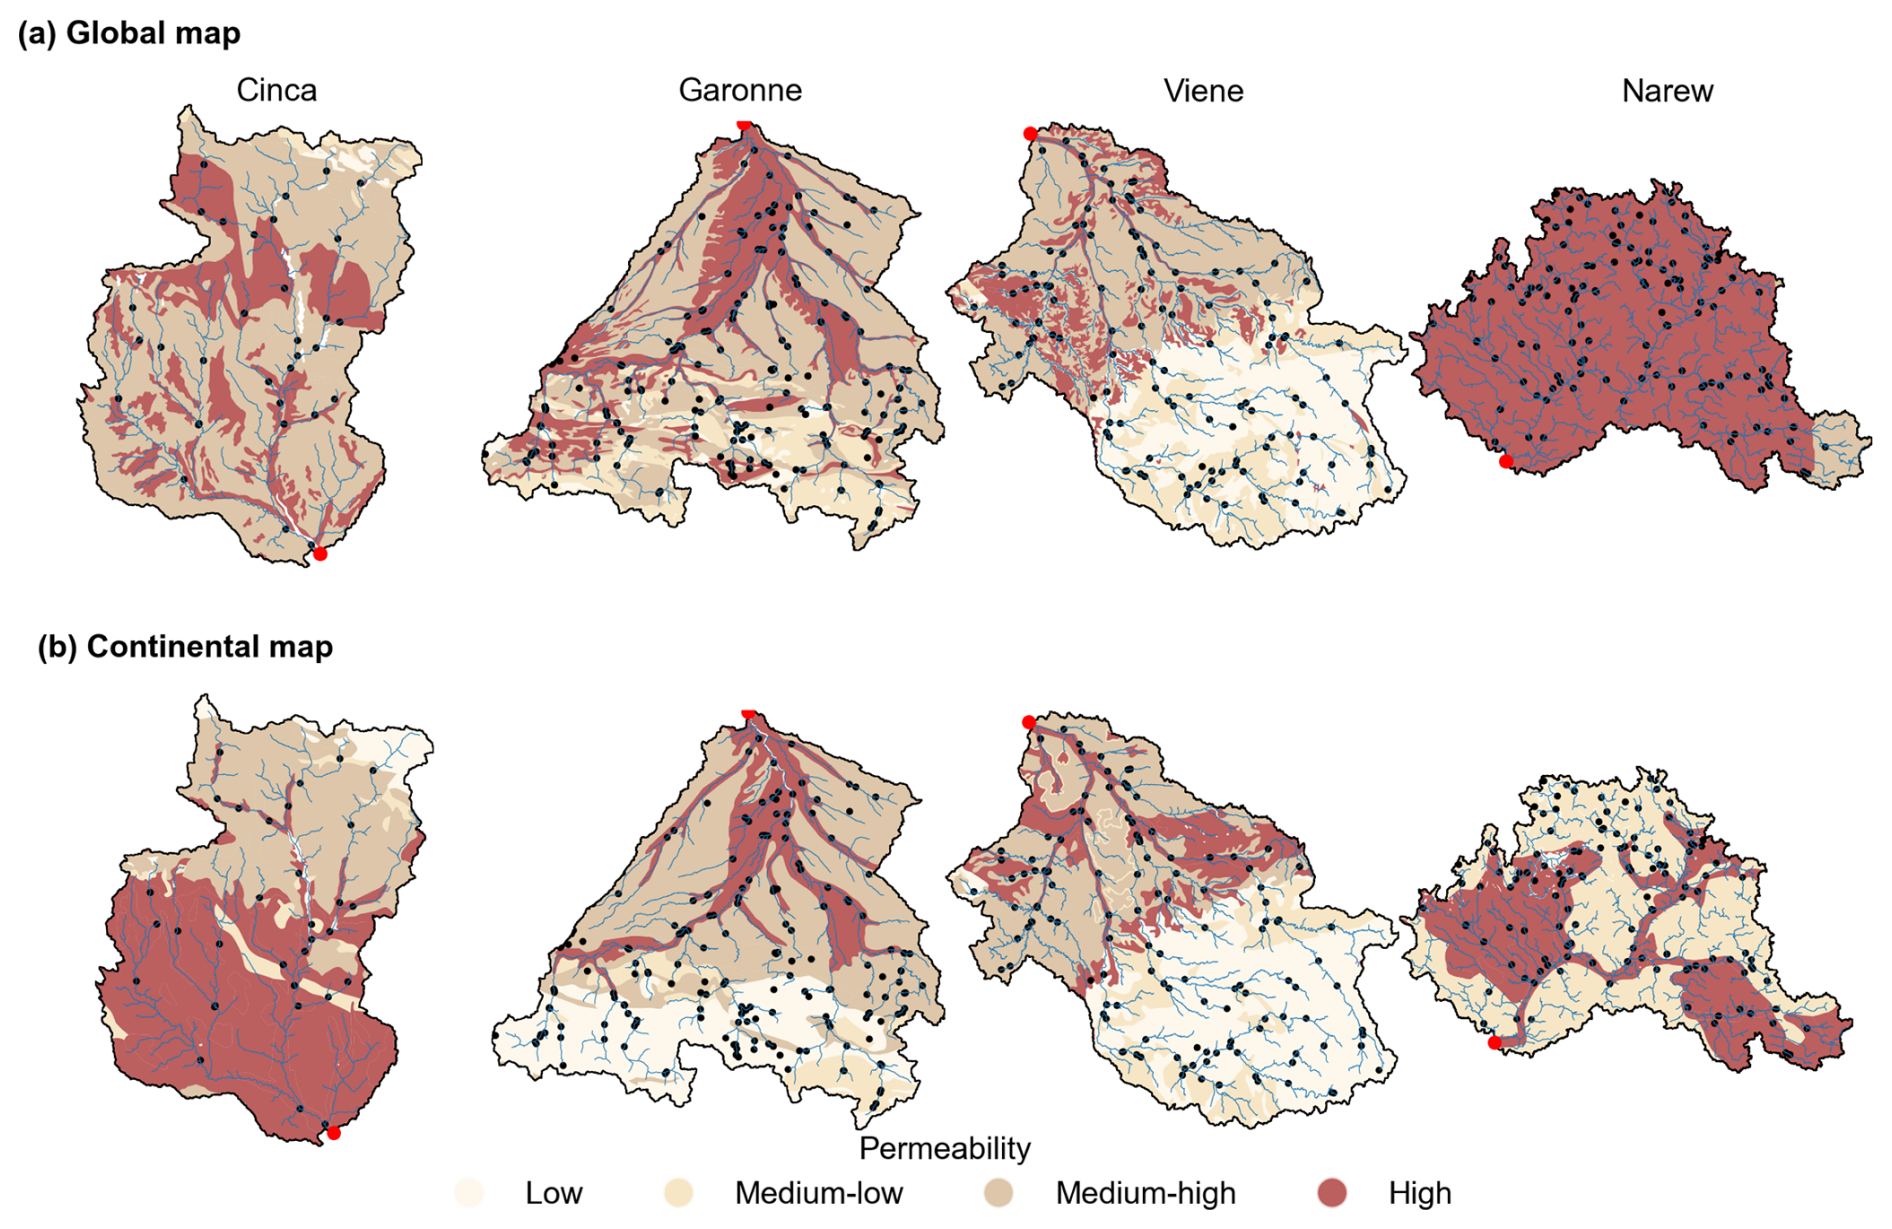
Figure 5Spatial distribution of the four permeability categories across four selected basins for the (a) global and (b) continental geology maps. The Moselle was excluded because it is already depicted in Fig. 2. In the background, the river network is shown in blue, the streamflow gauges (sub-catchment outlets) in black, and the respective nested basin outlets in red.
The Vienne basin is characterized by very low σBFI correlations ( < 0.20) for both geology maps (Fig. 4c). Figure 5 reveals that both maps agreed on a clear separation of low-permeability rock types in the upstream area, and high-permeability in the downstream. There is thus not a smooth geological variability gradient that could explain spatial differences in baseflow, but a sudden change from upstream to downstream in the pattern of the reclassified permeabilities. This is a similar pattern to the continental map of the Cinca basin. Notably, Figure 3 shows that the highest using other attribute groups remained similarly low in the basin ( < 0.55).
For the Narew basin, the continental geological map showed a pronounced 0.70, while the global map suggested near-zero correlation with σBFI. Figure 5 shows that the permeability reclassification provided by the global map classified most of the basin (95 % of its area) as high permeability, whereas the continental map distinguished the basin into areas of high (45 %) and medium-low (55 %). As can be seen in Appendix A, the main difference in the reclassifications results from the limited level of detail in the global map, which classified most of the area simply as unconsolidated sediments.
Overall, the global and continental maps appear to show a trade-off in their ability to accurately reflect geology. While the continental map offers a broader range of geological classes, allowing for more precise classification of hydrological properties, it tends to be more approximate in representing the boundaries between different layers. These boundaries are more jagged in the global map and smoother in the continental map, indicating a compromise between class diversification and the level of fine boundary contours. With the exception of the Narew, this was evident in all other four basins explored here. Although such a higher level of fine contour detail did not always provide stronger correlation (Moselle, Garonne, and Vienne), it likely explains the stronger correlation of the global map for the Cinca basin (Fig. 5).
4.2 Intermediate scale analysis
Here we present the results of our analysis on the Moselle basin, using the regional, continental, and global maps. The heatmap in Fig. 6 shows the maximum values for the six streamflow signatures across the seven attribute groups. The results show a general increase in values from global to continental to regional geology maps for all signatures. Particularly, the average maximum rose from 0.45 (global) to 0.68 (regional) across the six signatures. In some cases, the correlations increased considerably: σslope increased from 0.22 (global) to 0.70 (regional). In other cases, the increase was more modest: σq_mean increased from 0.59 (global) to 0.66 (regional).
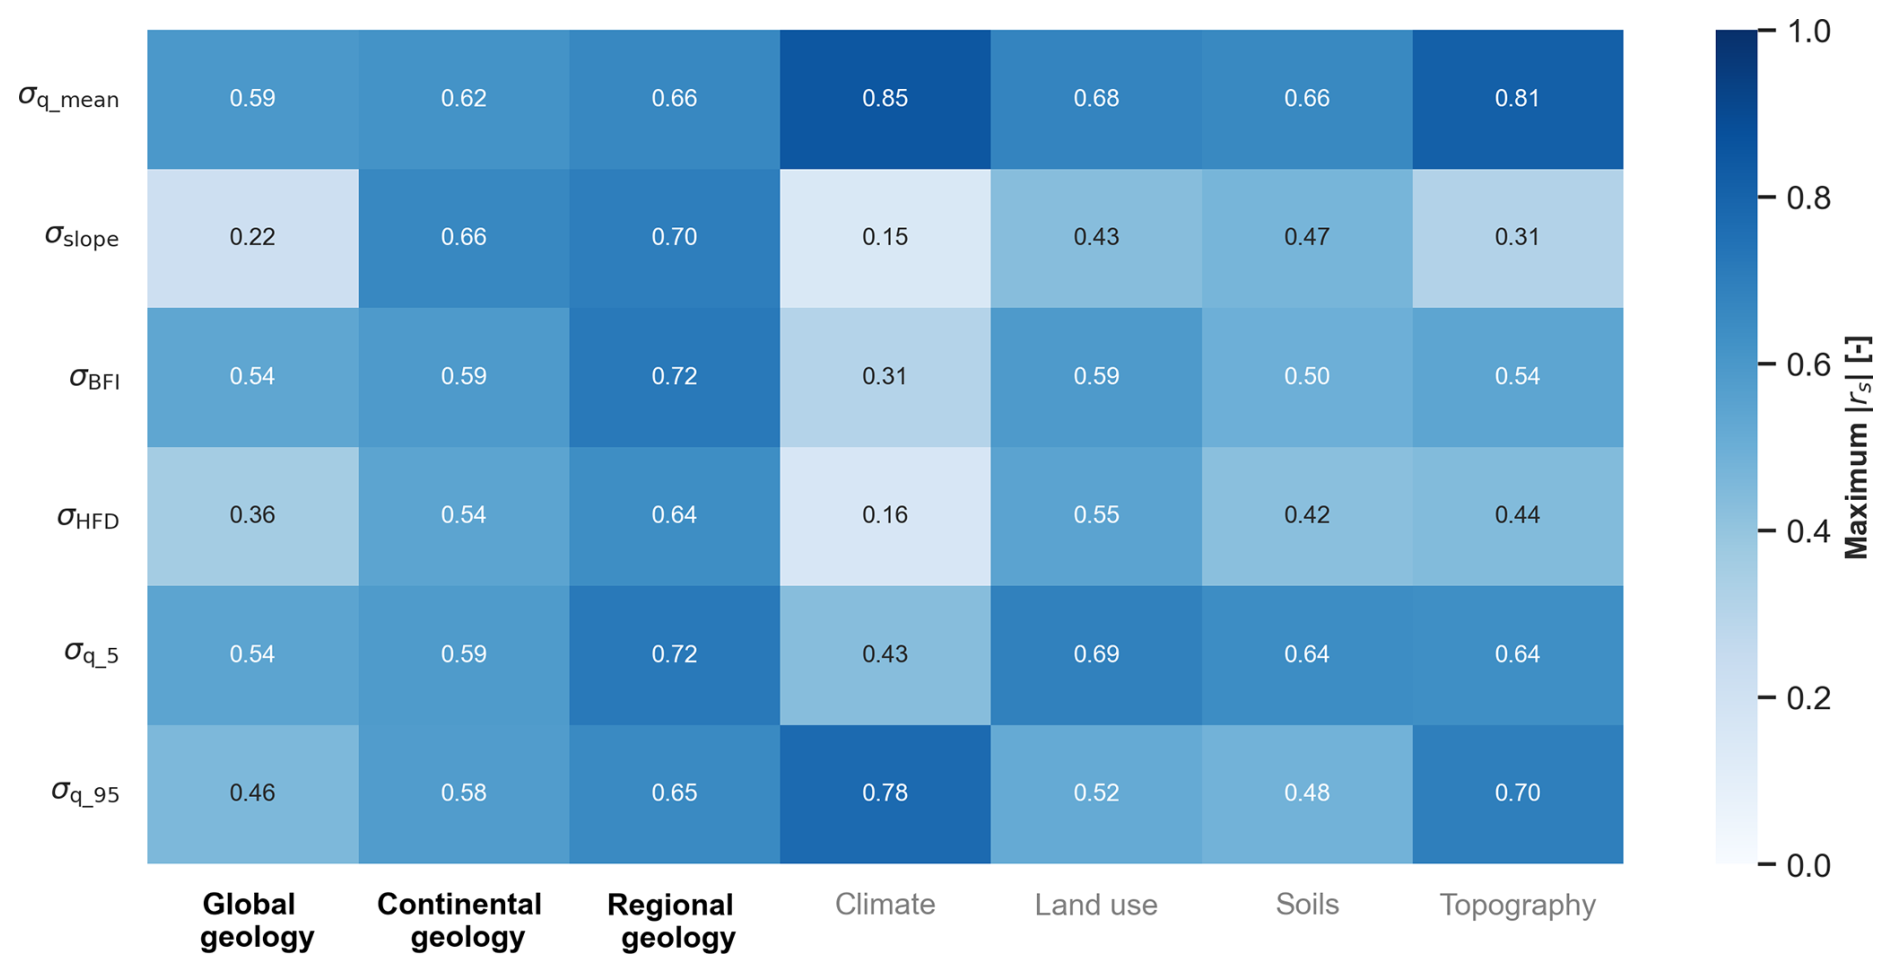
Figure 6Heatmap of the maximum values for the set of streamflow signatures in relation to the seven attribute groups used in this work.
Contrary to the large-scale analysis, in the Moselle basin, the impact of geology is more pronounced for signatures influencing the shape of the hydrograph rather than the magnitude of streamflow. This shift is also reflected in the relative ranking of geology across map resolutions (Fig. 6). Using the global attributes, geology ranked below at least one other landscape or climate attribute across all signatures. The continental map identified geology as the group with the highest correlation only for σslope, with similar or weaker correlations than those of other landscape or climate attributes. In contrast, the regional map highlighted geology as the group with the highest correlation for four out of six streamflow signatures (except for σq_mean and σq_95).
This progression – from very limited (global) over moderate (continental, affecting one signature), to high (regional, affecting four signatures) – suggests an increasing relevance of geology in describing streamflow behavior, captured by the streamflow signatures used, as the detail of the geology information increases. This indicates that the influence of geology becomes clearer as the level of geological detail increases in the Moselle basin. The affected signatures are consistent with expectations: those related to baseflow, and flow persistency show stronger geological correlation, whereas σq_mean (linked to flow magnitude) is more dependent on climate, and σq_95 (associated with peak flows) is primarily correlated with topography.
Figure B1 further illustrates the stronger correlations of the regional geology map for σslope, σBFI and σHFD when compared to the continental and global maps. The scatter plots show that the global map performs poorly mainly in smaller catchments, where geology is either oversimplified into a single category or lacks representation for certain classes. This suggests that the weaker correlations of the global map in the Moselle stem from its less detailed classification, which might affect smaller catchments more strongly.
4.3 Small scale analysis in the Moselle sub-catchments
We conducted a detailed analysis of baseflow variability across the five Moselle sub-catchments to investigate its relationship with catchment attributes, and to identify potential differences in baseflow behavior. Figure 7 presents a heatmap displaying the rsvalues between σBFI and key climate and landscape attributes. Unlike Fig. 6, which grouped attributes into broader categories, Fig. 7 displays individual attributes, focusing on a subset of the original 47 while retaining the correlation signs.
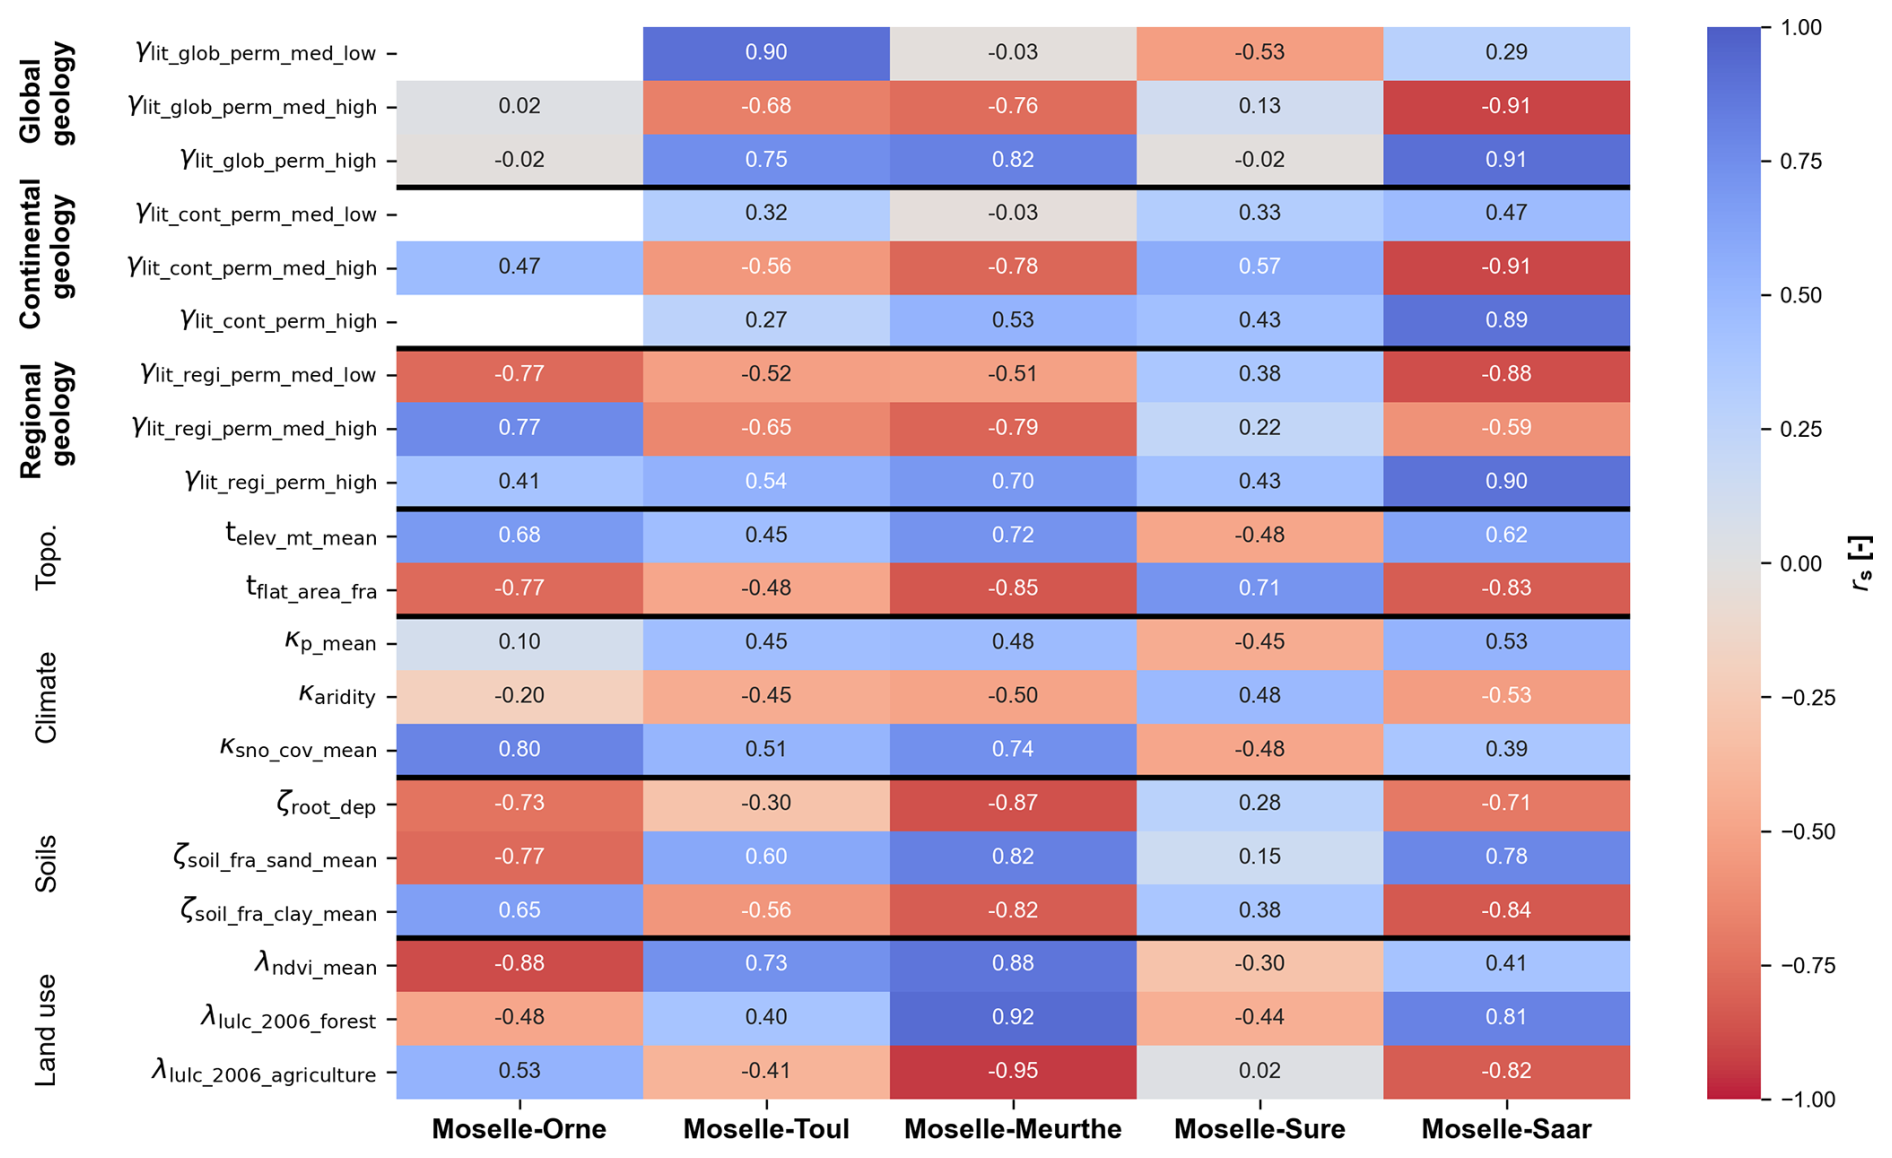
Figure 7Heatmap representing the rs values between the σBFI and a set of the catchment attributes used in this work for each of the five sub-catchments of the Moselle. The attributes are subdivided into geology (sub-divided into global, continental and regional), topography, climate, soils, and land use.
Correlation patterns vary considerably across catchments. The same attribute can exhibit high correlation in one catchment, weak in another, or even change correlation sign. Toul, Meurthe, and Saar consistently show stable correlation signs (though with varying magnitudes), while Orne and Sure exhibit distinct correlation patterns both from each other and from the other catchments. The highest correlating variables also differed across catchments: mean NDVI in the Orne (), medium-low global permeability in the Toul (rs=0.90), fraction of agricultural land cover in the Meurthe (), fraction of flat area in the Sure (rs=0.71), and medium-high continental permeability in the Saar ().
Geological attributes show distinct correlation behaviors. In the Orne catchment, the global geology map showed no correlation with σBFI, whereas the regional map reached a much stronger correlation with the medium-low permeability (). In the Toul, by contrast, the global map produced a very high positive correlation with the medium-low permeability (rs=0.90), while the regional map indicated a weaker and negative correlation with medium-high permeability (). Among all geological attributes considered, only the high permeability class from the regional map consistently produced correlations with the same sign (positive) and values above 0.40 across all five catchments. A similar pattern was observed for medium-low regional permeability, which only presented a positive sign for the Sure catchment. The global geological map, by contrast, displayed more variation in both correlation sign and magnitude, with many near-zero correlations (Orne, Meurthe, and Sure) but also extreme values (Toul).
It is important to highlight that high and sign consistent correlations do not necessarily imply causality even if they align with process understanding and expectations (i.e., hypothesis 1 and 2 in Sect. 3.3). It is well known that dominant processes vary widely as well their controls. For instance, the fraction of flat area correlated strongly with σBFI in all sub-catchments, yet the Sure sub-catchment exhibited a positive sign, suggesting a different process dominance there. These results emphasize the importance of complementing statistical approaches with detailed hydrological insights to improve the understanding of hydrological controls.
5.1 Assessing the role of geology in streamflow signatures across scales
The large-scale analysis of the 63 nested basins showed that the most strongly correlated attributes varied across basins, and consequently attribute rankings differed substantially between basins. This finding underscores the challenge of generalizing landscape influences on hydrological signatures across basins.
Landscape attributes generally exhibited stronger correlations with baseflow index than climate attributes, with this pattern observed in 51 out of the 63 basins (see Sect. 4.1.1). This contrasts with previous studies, which often reported climate as the dominant control on streamflow (Addor et al., 2018; Beck et al., 2015; Kratzert et al., 2019; Kuentz et al., 2017). We interpret this discrepancy as a consequence of methodological differences. Earlier work typically assessed large-sample datasets collectively, emphasizing the dominant role of climate at broad scales. By contrast, our basin-by-basin analysis better isolates local variability, thereby revealing a stronger influence of landscape characteristics.
Our comparison of the two geological maps revealed markedly different correlation patterns with groundwater-oriented streamflow signatures, such as baseflow index and slope of the FDC (Fig. 4). The absence of a consistently superior map suggests limited reliability when using broad-scale geological data for hydrological inference. This inconsistency likely reflects both uncertainties in the geological maps themselves and the difficulty of translating lithological information into hydrologically meaningful indicators, such as through reclassification into relative permeability classes. These findings highlight the need for improved geological datasets tailored to hydrological applications.
Analyses of individual nested basins, where the maps performed radically different, suggest that the global and continental geology maps may have complementary strengths and weaknesses (Table 1). The global map appears to capture small-scale geological features more effectively, as seen in its more intricate and jagged class boundaries (e.g., in Fig. 5a compared to b). This allows for more precise delineation of geological units. However, the continental map offers a greater number of geological classes, enabling a finer and more accurate classification of relative permeabilities. This enhanced classification allows for better differentiation of geological influences on hydrological processes (see Sect. 5.3.2). Regional maps may address the shortcomings of both global and continental maps, as they incorporate both higher geological heterogeneity and finer-scale geological details (Fig. 2 and Table 1). However, these maps have limited coverage and could not be used for this large-scale experiment.
At the intermediate scale, the analysis within the Moselle basin shows a clear increase in correlations when transitioning from global to continental to regional geology maps for all streamflow signatures explored. This pattern reinforces the hypothesis that more detailed geological maps provide more useful information for hydrological analysis in contexts where geology influences the streamflow regime (Sect. 3.3). The variability in results is noteworthy, even to the extent that different geology maps lead to contrasting interpretations of hydrological understanding. When using the global map, geology appears to have little to no control over streamflow signatures, with some signatures, particularly related to baseflow, being poorly correlated. However, the use of continental and regional maps overturns these initial perceptions, demonstrating high correlations between geological attributes and particularly streamflow signatures related to baseflow generation.
At the smallest scale considered, different hydrological controls emerge as important for different sub-catchments when predicting streamflow signatures. Similar to the global-scale analysis, there is considerable variability in determining which attributes best correlate with specific signatures across catchments. However, the regional geology map stands out by providing consistent and interpretable results. The correlations obtained using the regional map are not only relatively high but also consistent with process understanding (hypothesis 1 and 2 in Sect. 3.3). These findings underscore the utility of regional geology maps for capturing valuable information on catchment properties that influence streamflow.
5.2 Need for enough geological heterogeneity and fine detail
Understanding the influence of landscape or climate attributes on streamflow signatures requires that these attributes exhibit adequate variability across the study area. For geology in particular, meaningful evaluation of its role is only possible when geological attributes vary sufficiently among catchments. However, this condition is not always met in all case studies considered.
For example, the Moselle-Sure catchment (Fig. 2) has more than 50 % of its area classified into a single geological class (and consequently a single permeability), leading to a uniform geology. The Vienne basin (Fig. 5) shows a sudden shift in the geological class pattern, resulting in sub-catchments with largely homogeneous geology. Here, the predictor variability is highly discrete, with values concentrated at either 0 % or 100 %. Finally, in the Cinca basin (Fig. 5), despite abrupt geological shifts from upstream to downstream, the global map provided stronger correlations than the continental map, probably due to its higher geological heterogeneity. As discussed in Sect. 2.2.4 (Table 1), the global map has more detailed contours, despite having fewer classes overall, which in this case made it more informative.
Conversely, in regions with high geological heterogeneity, strong correlations between hydrological signatures and geological attributes were observed. This was evident in the Garonne, Narew, and Moselle basins (Fig. 5), and in four out of five Moselle sub-catchments (Fig. 2). Taken together, these findings suggest that sufficient geological heterogeneity – rather than map detail alone – is a prerequisite for detecting strong landscape–hydrology relationships. In regions with relatively uniform geology, even fine-scale maps add limited explanatory value.
5.3 Using geological information effectively
5.3.1 Reclassification of geological rock formations
Translating landscape maps into meaningful attributes is a challenging task, particularly when these maps contain many classes with no direct hydrological relevance (Floriancic et al., 2022; Karlsen et al., 2016; Tarasova et al., 2024). This is particularly the case for geological maps, which often feature a vast array of lithological units. Previous studies have primarily used the percentage coverage of individual geological rock-type categories over the catchment area as landscape attributes (Addor et al., 2018; Kratzert et al., 2019; Kuentz et al., 2017). However, in large catchment studies, this approach often results in categories with 0 % representation in certain catchments (e.g., carbonate sedimentary rocks), making it difficult to derive correlations.
We argue that reclassifying geological units into hydrologically relevant categories, such as relative permeabilities, is an essential prerequisite for the identification of meaningful correlations. A comparable effort is the Hydrology of Soil Types (HOST) classification developed for the United Kingdom (Boorman et al., 1995), which categorizes soils based on their influence on hydrological processes. It is also important to reduce the classes' dimensionality (e.g., from 31 classes to 4, as in our study). In this way, we ensure a smoother variability of attribute values across catchments, facilitating the determination and interpretation of correlations. Such approaches are well-established in regional hydrogeological studies (Freeze and Cherry, 1979), where simplifying numerous classes into meaningful hydrological landscape units with similar behaviors facilitates analysis.
In this study, we adopted an approach for reclassifying geological categories aligned with the methodology of Fenicia and McDonnell (2022). Yet, we acknowledge that our reclassification still contains subjective choices, and therefore if a different approach is employed, users might reach slightly different conclusions. It is important, though, to back up such choices according to literature and previous studies (e.g., group rock-types with generally similar permeability together) to ensure that the found correlations could potentially mirror real causalities.
5.3.2 Example of limited information in global maps
Global geology maps do not always contain sufficient information to disentangle different hydrological behaviors. For instance, while investigating the main differences in geological maps for the Moselle basin (Fig. 2), we identified that these discrepancies primarily result from insufficient detail in the classification of siliciclastic rock formations in the first level of the GLiM geological map (Appendix A). Siliciclastic rocks encompass formations such as sandstone, mudstone, and greywacke, but also include shale, rocks with some degree of metamorphic alteration. On the one hand, despite the substantial differences in permeability among these rock types, they are grouped into a single category at this level of classification. The continental and regional maps, on the other hand, clearly distinguish shale as a separate class in their available level of classification.
In our reclassification, we categorized siliciclastic rocks within the high-permeability category, primarily due to the predominance of sandstone and conglomerate formations. This distinction is reflected in the patterns observed in the Moselle and highlights the limitations of relying on a single class to represent rock types with such diverse properties. This lack of informativeness should be carefully considered in LSH studies.
Notably, information on shale within siliciclastic rock formations is often available at the third level of detail in the GLiM dataset (Hartmann et al., 2012). However, to our knowledge, current LSH studies that use this dataset have only utilized the first level of information (Addor et al., 2017; Höge et al., 2023; Klingler et al., 2021; Kratzert et al., 2023; do Nascimento et al., 2024a; Wu et al., 2021). We therefore recommend that future users of the GLiM dataset incorporate the third level of detail when deriving geological attributes for LSH studies to ensure a more nuanced representation of rock formations.
5.4 Uniqueness of place
To what extent the ability to regionalize collides with “uniqueness of place” (Beven, 2000) is an open question. When comparing individual catchments, we generally observed varying patterns and potential controls on streamflow signatures. Large-scale analysis revealed noteworthy differences in the attribute groups most highly correlated with streamflow, as well as in the relative importance of climate and landscape controls. Even at the sub-catchment level of the Moselle, the various catchments demonstrated visible differences in local controls (Figs. E1 and 7).
Interestingly, we noted that, in the Moselle basin the apparent “uniqueness of place” may be due to data quality rather than process diversity, as the use of more detailed maps produced more generalizable results. The regional map presented sign-consistent, aligning with our original hypothesis, correlations between the high-permeability attribute and baseflow. However, there is still considerable remaining variability, underscoring the need for multifactorial approaches to regionalize hydrological processes, ensuring that spatial heterogeneity in catchment attributes is adequately represented.
On the large scale, we also noticed difficulties in devising generalized relationships (e.g., Appendices C and D). Specifically, regardless of whether geological attributes were derived from the global or continental maps, correlations to streamflow signatures, when computed for the whole set of 4469 sub-catchments over Europe, showed some increase from the former to the latter, but remained low (Appendix C). This suggests the challenge of treating catchments uniformly across vast areas, reinforcing the importance of regional clustering before aggregation. Therefore, we recommend that LSH studies aiming either to model rainfall-runoff or to predict streamflow characteristics prioritize methodologies that incorporate regionalization or clustering approaches, especially when working at continental level. Such approaches are already incorporated in recent machine learning developments for rainfall-runoff prediction using Long Short-Term Memory (LSTM) models, for instance (Kratzert et al., 2019; Nearing et al., 2024).
This study analyzes the correlations between streamflow signatures and climatic and landscape attributes at multiple scales, focusing on a large-scale comparison of 63 nested river basins, an intermediate-scale analysis of the Moselle basin, and a small-scale experiment involving five Moselle sub-catchments. Each basin contained a variable number of nested catchments, enabling the examination of spatial patterns in streamflow signatures. A particular emphasis was placed on comparing three geology maps of varying levels of detail: global, continental, and regional. Our main conclusions are as follows:
-
Large-scale analysis: The analysis revealed distinct controls and rankings of streamflow signatures for each basin. While high correlations were generally observed, no consistent pattern emerged across all basins. Notably, landscape attributes frequently showed stronger correlations with baseflow-related signatures than climate attributes. When comparing the global and continental geology maps, our results showed limited consistency between them, and that neither map consistently outperformed the other in terms of correlation with groundwater-oriented streamflow signatures. However, when extended to other flow signatures – particularly those representing surface water dynamics and extremes – the continental map showed a slight but consistent advantage over the global map. We attribute these results to the complementary strengths and weaknesses of the maps: the global map offers more precise contours for area coverage estimation (higher spatial resolution), while the continental map features more classes, facilitating better diversification in permeability categories. Lastly, the use of nested basins as the primary analysis unit at the large-scale proved to be a particularly effective approach. Unlike the more common approach of aggregating all data, this method enabled us to isolate and interpret potential streamflow controls in a way that would likely have been obscured at broader scales.
-
Intermediate-scale analysis: This analysis demonstrated how using geology maps of varying detail can lead to drastically different conclusions regarding the dominance of certain landscape attributes in correlating with streamflow. Geological attributes shifted from weak correlations to becoming the most strongly correlated with streamflow signatures as we progressed from the global to the continental, and then to the regional map. This trend supports the hypothesis that geology plays a key role in streamflow dynamics in the Moselle basin. The regional map effectively addressed both the spatial resolution limitations of the continental map and the class diversity of the global map, offering a more robust representation of geological influencing factors.
-
Small-scale analysis: At this scale, distinct patterns were observed between the Moselle sub-catchments. Similar to the large-scale analysis, no single attribute group dominated signature variability across all five catchments. However, the regional map was the only one that provided sign consistent and relatively high correlations across all sub-catchments, aligning with our initial, physically motivated hypotheses about the role of geology in baseflow variability in the Moselle basin.
Overall, this study highlights the substantial variability in catchment behavior, which may reflect the ”uniqueness of place.” Particularly, there is considerable variability in the extent to which geology influences baseflow-related signatures. However, this variability appears to diminish when more detailed (regional) geological data is used. This suggests that the quality of landscape information, particularly geology, can impact the outcomes of large-scale studies and subsequent interpretations.
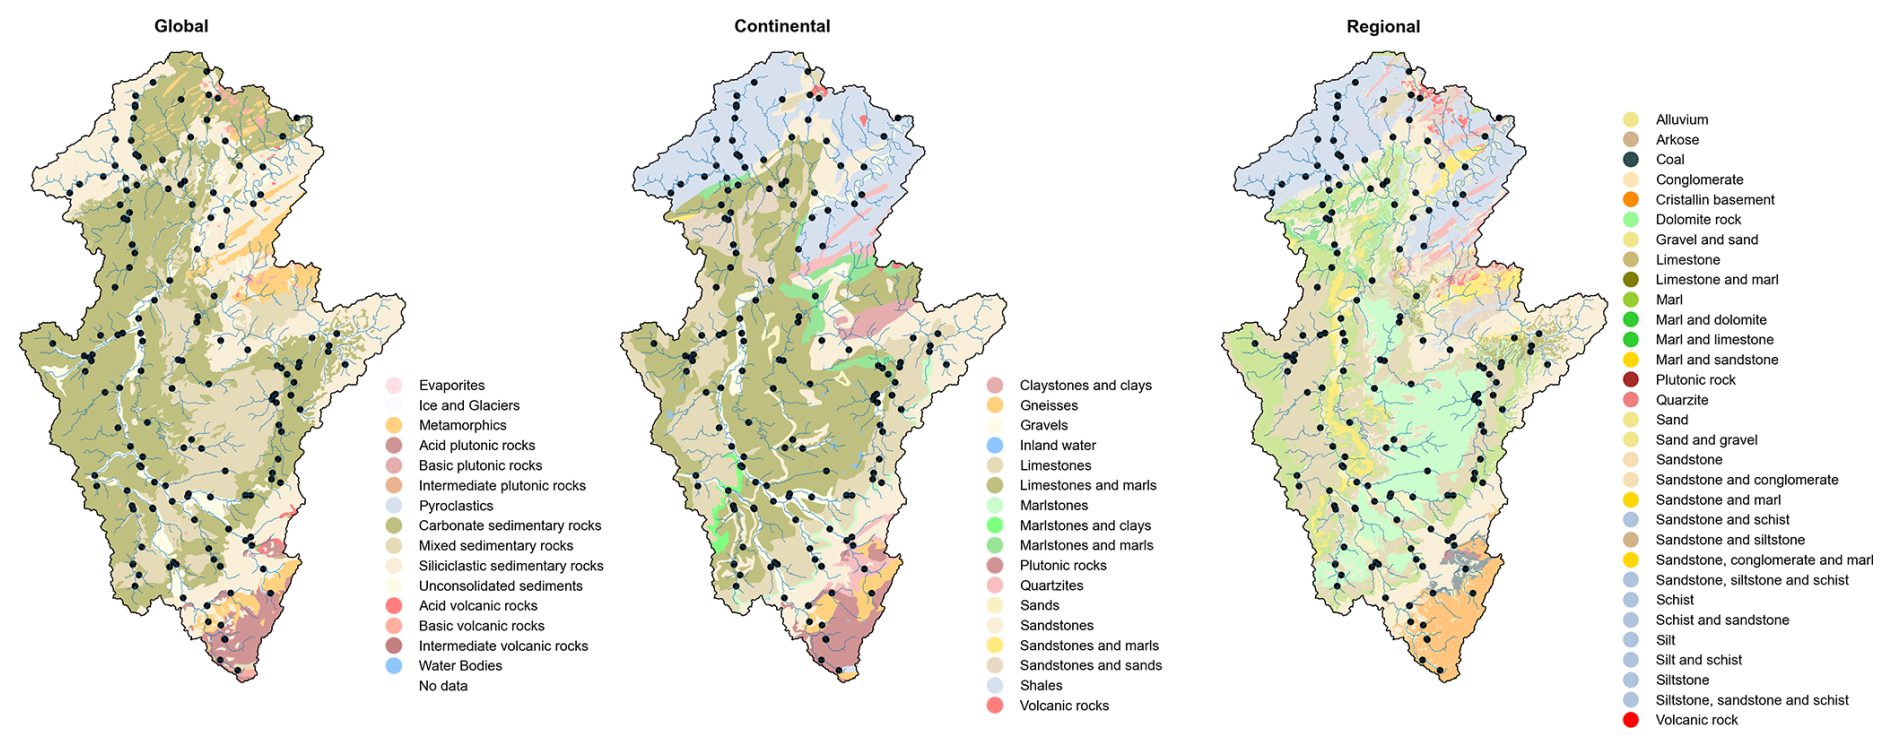
Figure A1Spatial distribution of the original geology classes from the global, continental and regional sources used for the Moselle basin. The colours might represent different categories among the three sources.
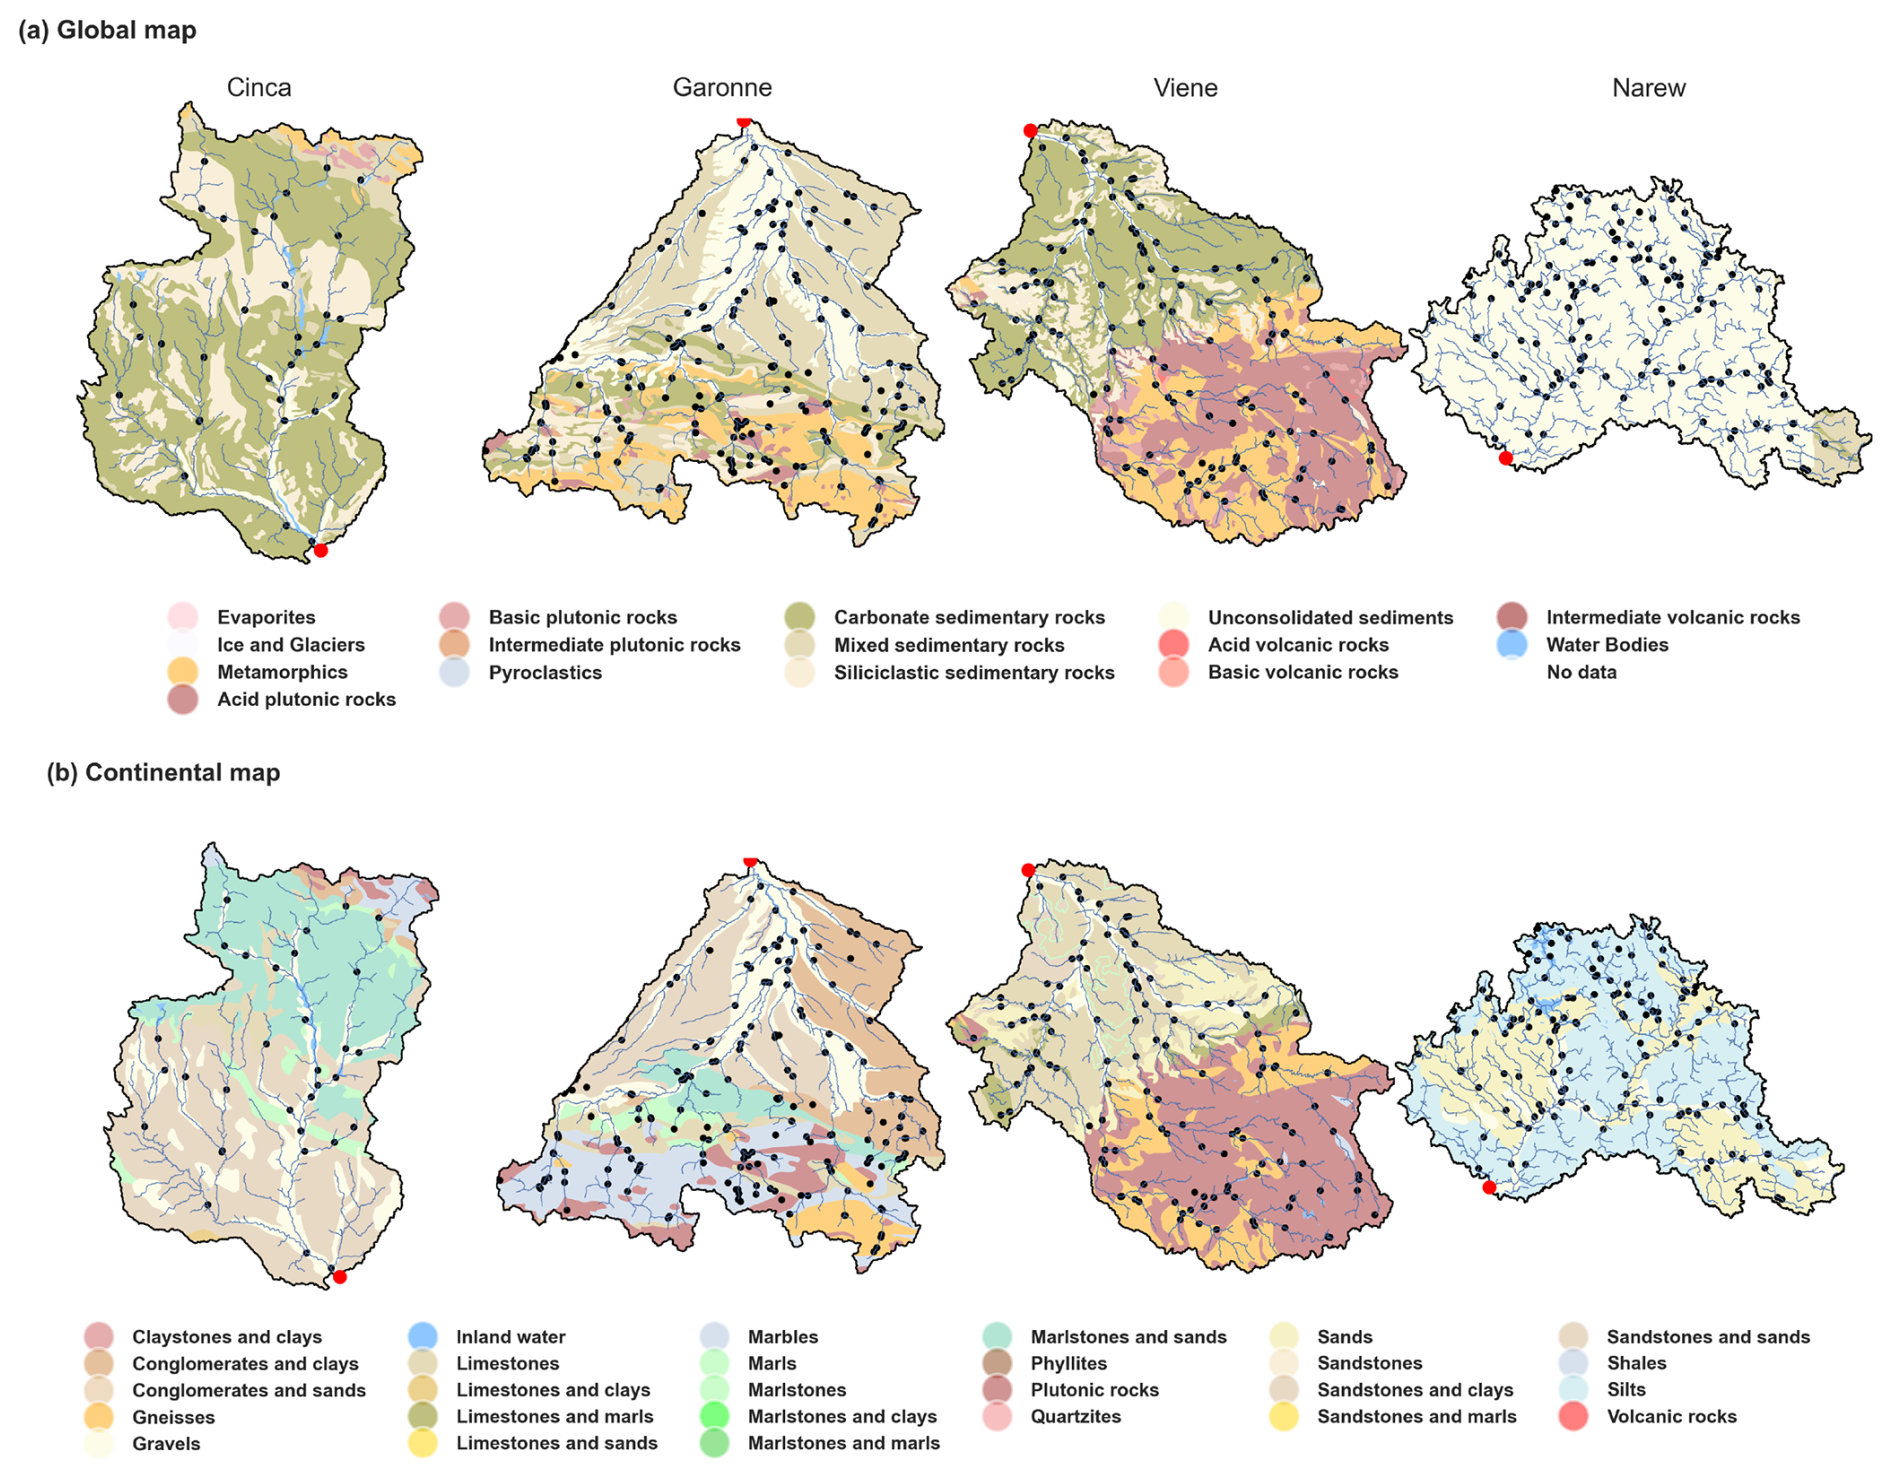
Figure A2Spatial distribution of the raw geology classes from the global and continental sources used for the Cinca, Garonne, Viene and Narew basins. The colors might represent different categories among the three sources.
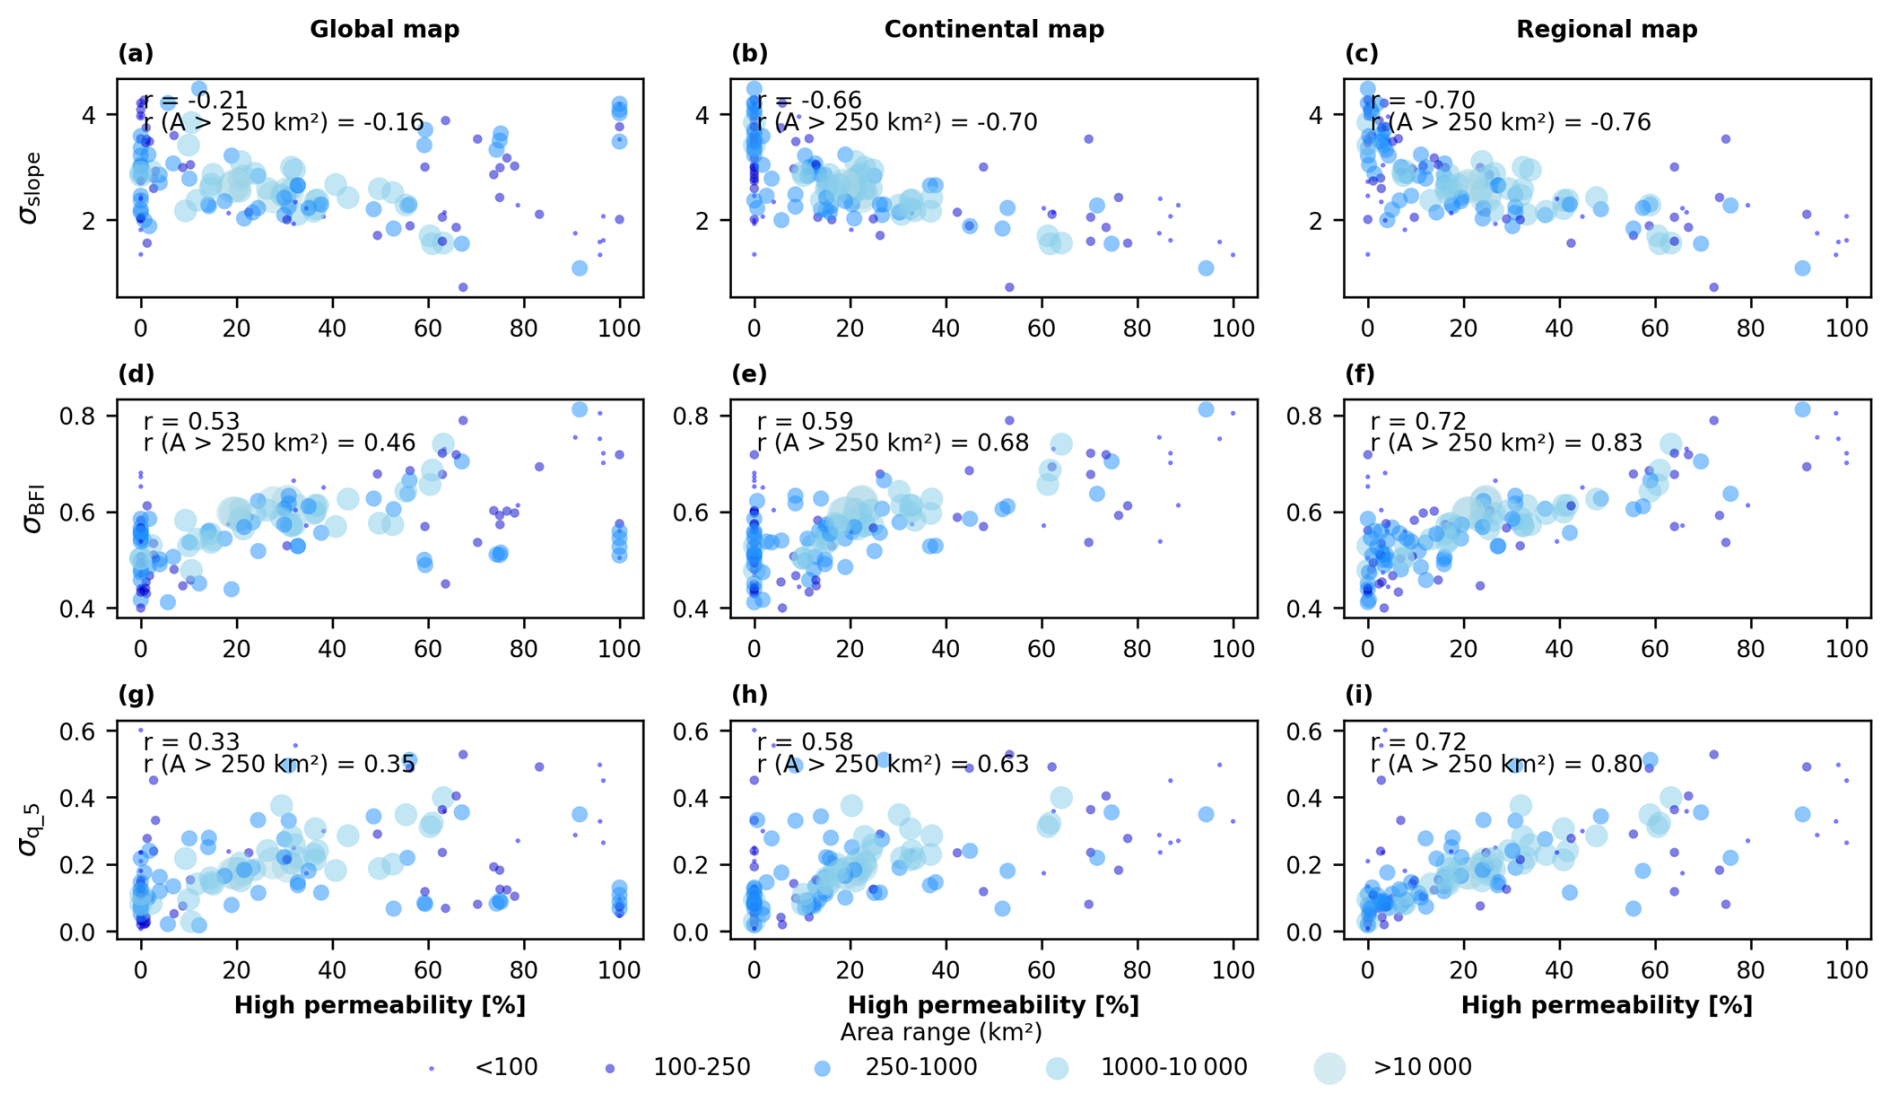
Figure B1Scatter plots showing the correlation between the high-permeability percentages of area in each Moselle sub-catchment versus three selected streamflow signatures. The colours of the circles and their respective sizes represent their area range, varying from below 100 km2 to above 10 000 km2.
Table C1Correlation values (rs) computed using the 4469 European sub-catchments altogether between the catchment attributes derived from the global and the continental maps and baseflow index.
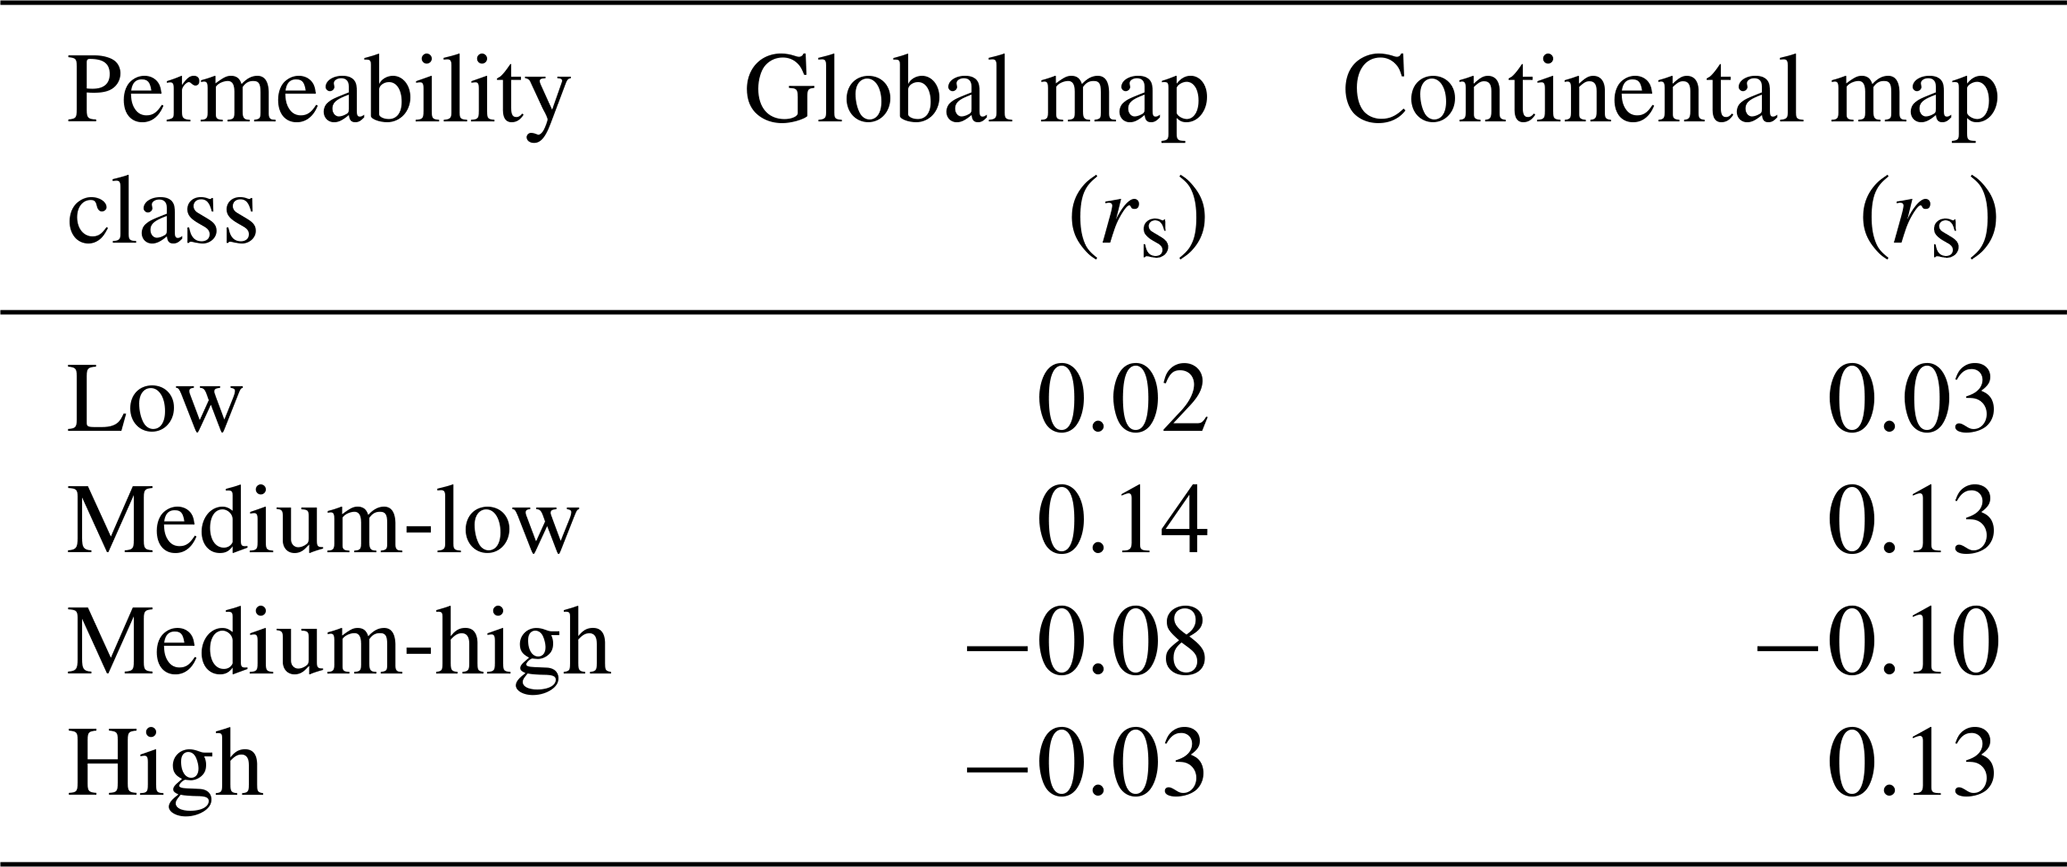
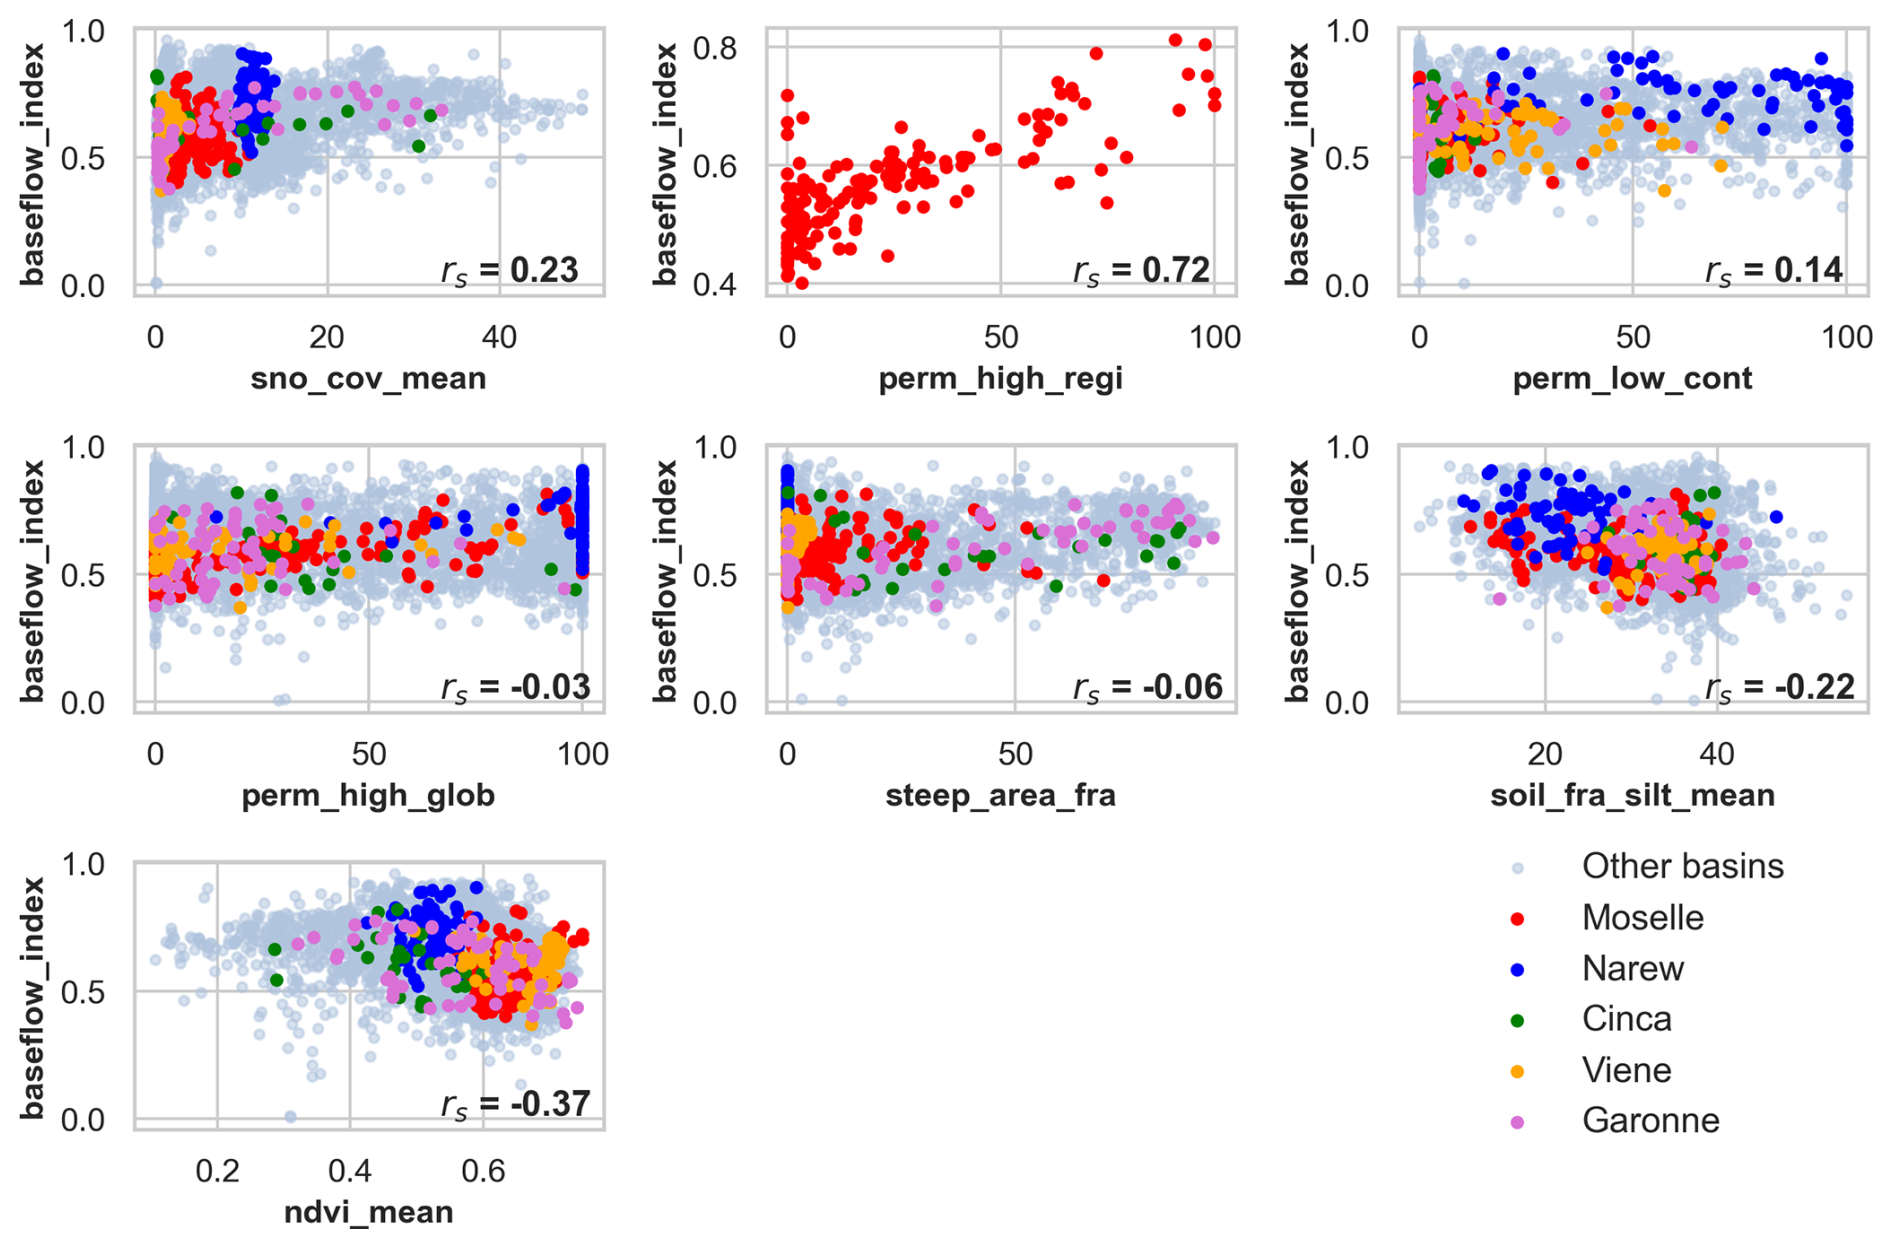
Figure D1Scatter plots between the attributes with the most often highest correlations for each of the six groups (climatic, regional, continental and global geology, topography, soils and land use) and baseflow index. All 4469 catchments are plotted in light blue, but the catchments of the five basins further explored are plotted with different colors according to the legend. Note that the Spearman correlation between each attribute and baseflow index is depicted in each panel.
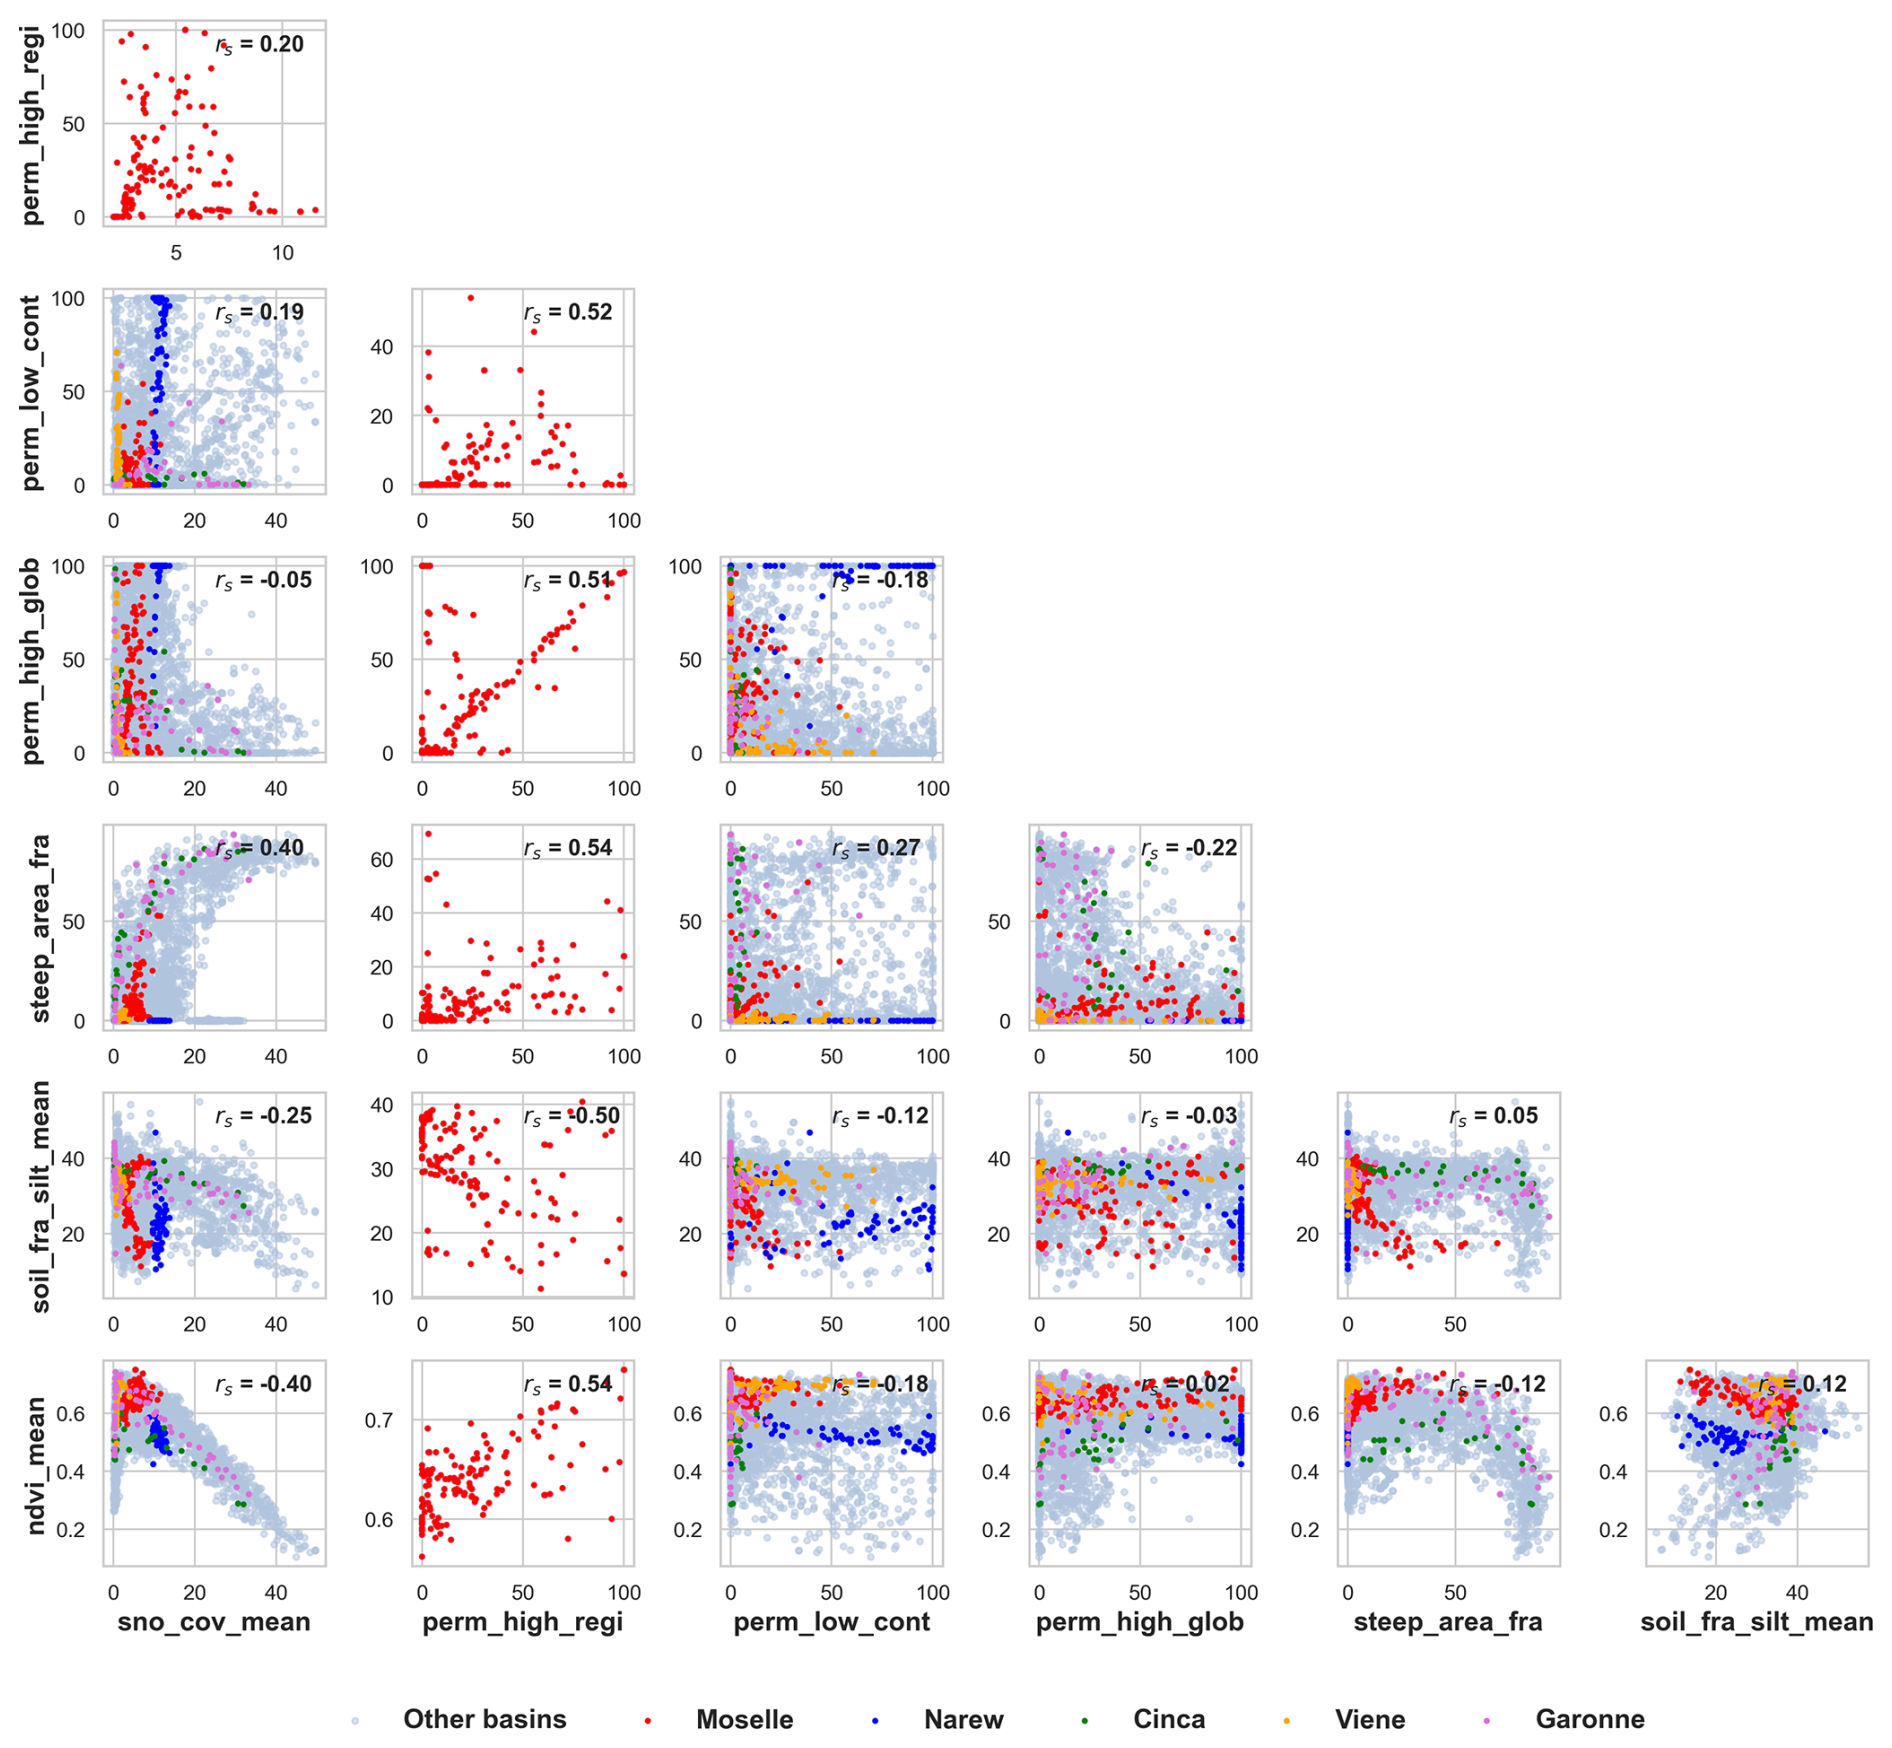
Figure D2Scatter plots between the attributes with the most often highest correlations for each of the six groups (climatic, regional, continental and global geology, topography, soils and land use). All 4469 catchments are plotted in light blue, but the catchments of the five basins further explored are plotted with different colors according to the legend.
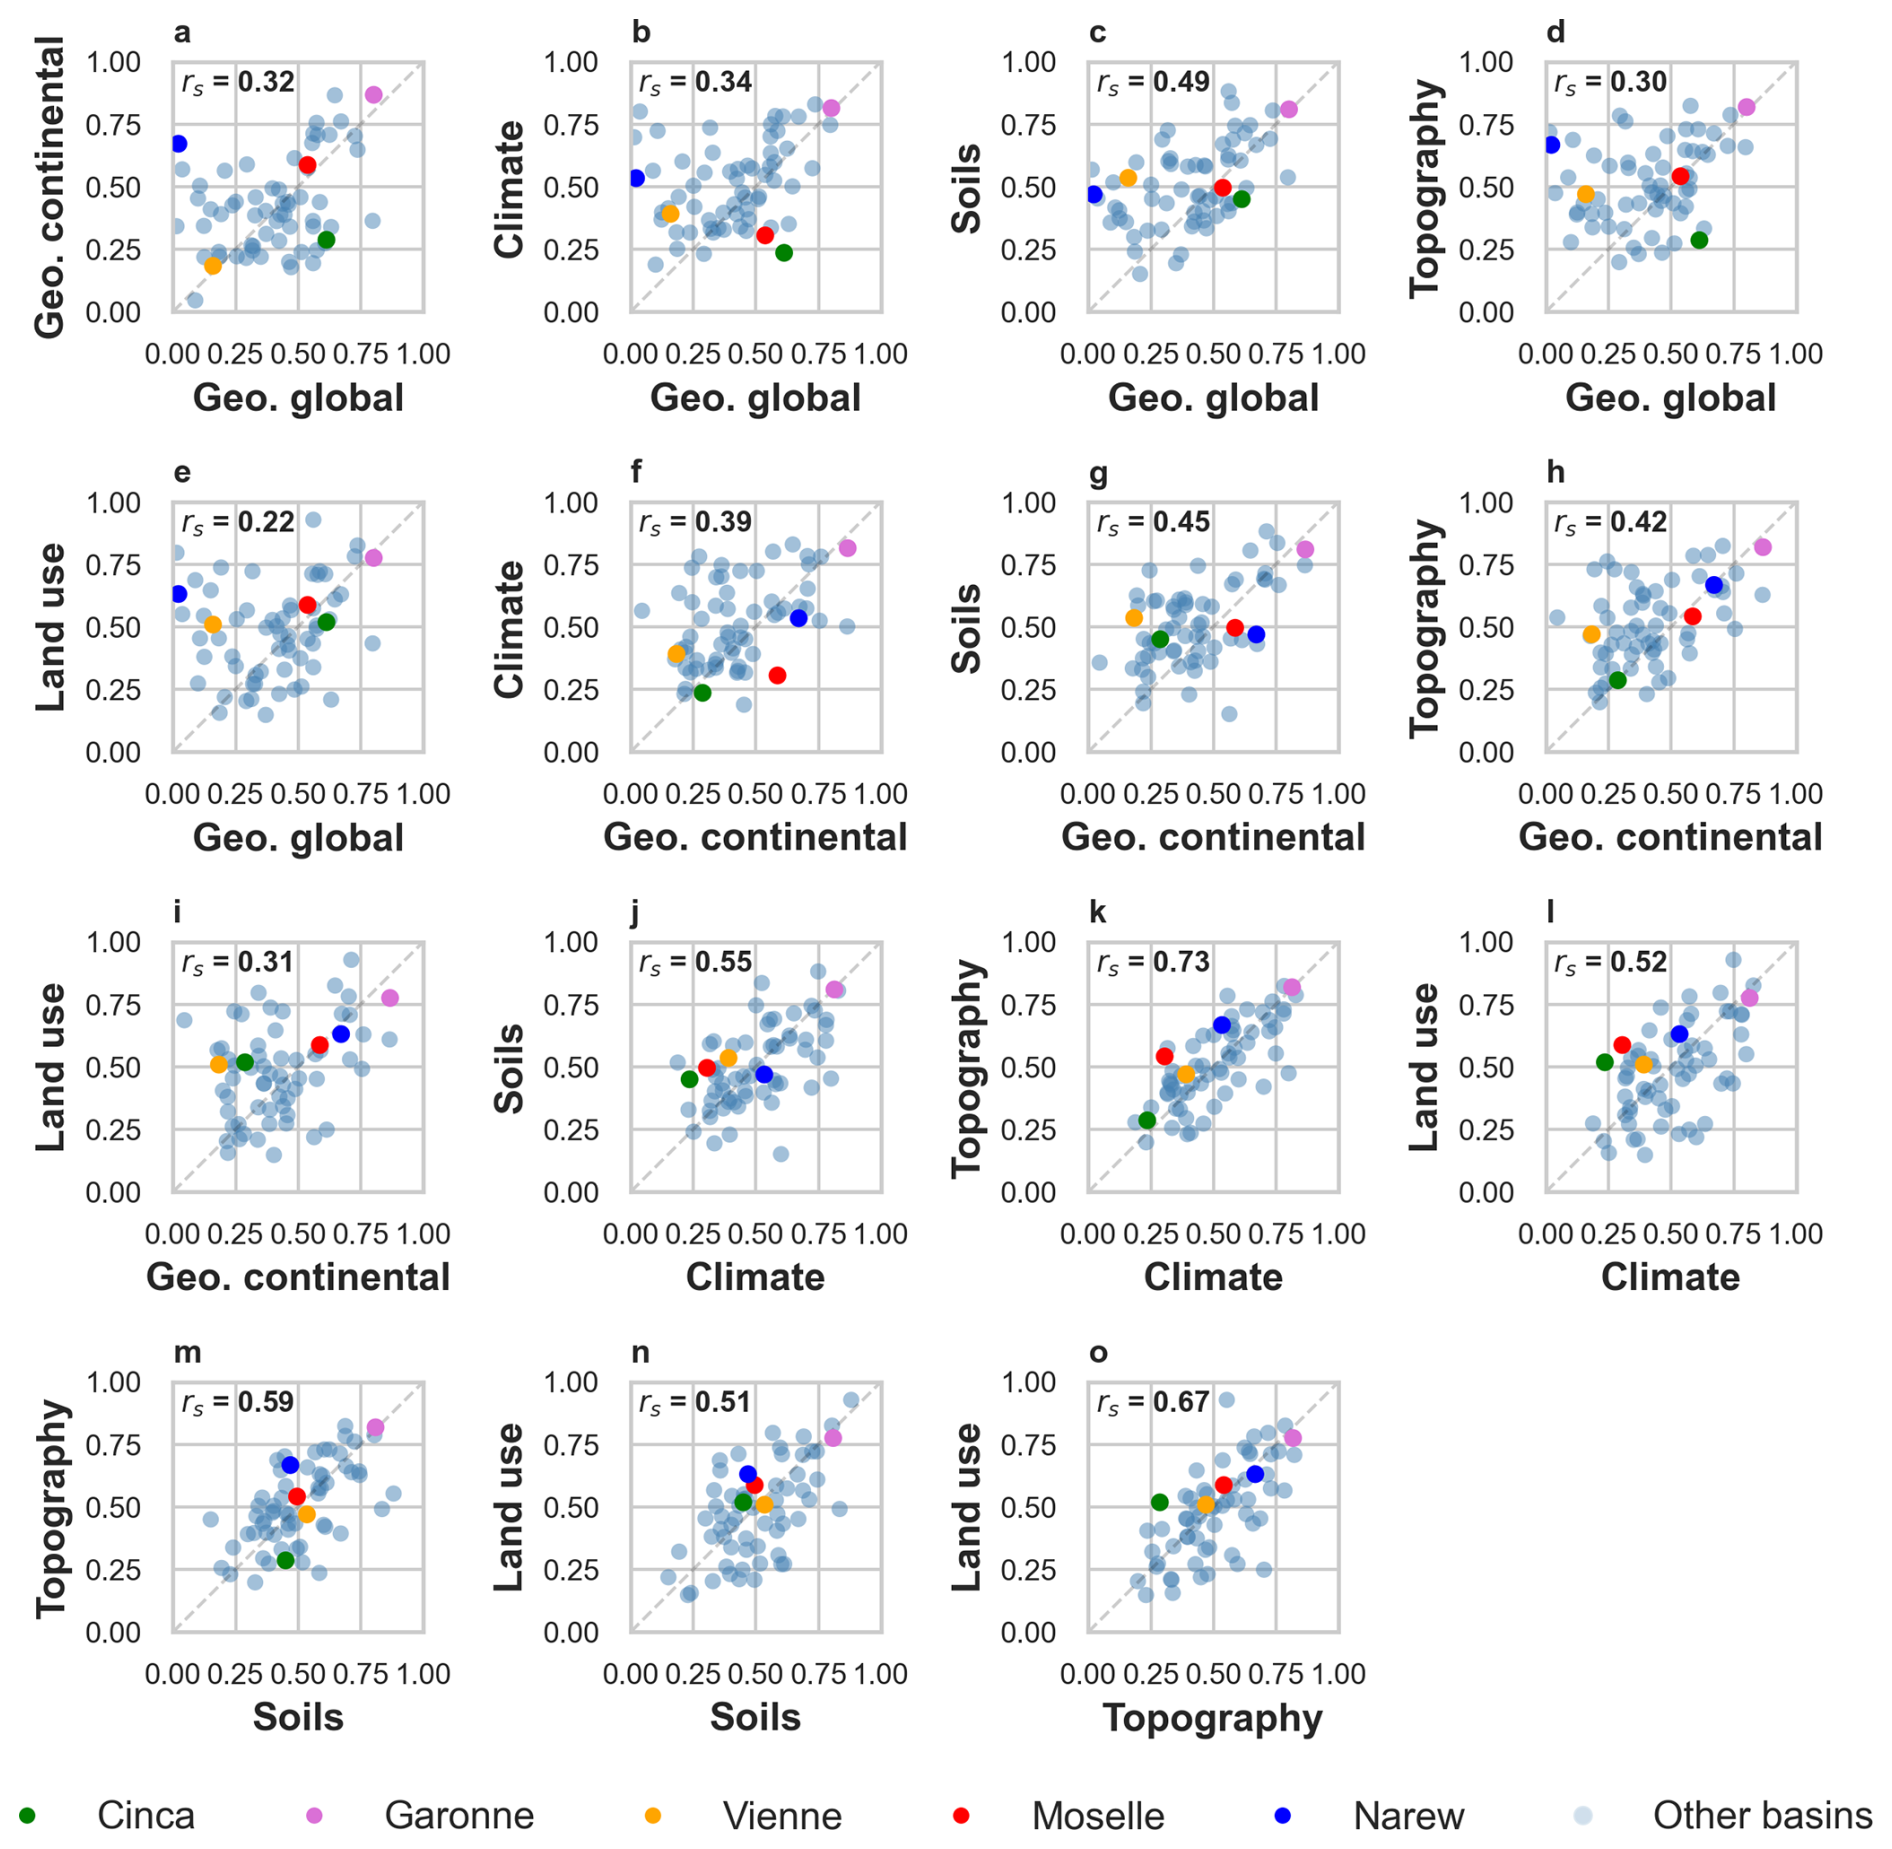
Figure D3Scatter plots between the different attribute groups for their maximum values for the baseflow index. Each light blue circle represents one of the river basins evaluated, with the five selected river basins highlighted using distinct colors: green (Cinca), pink (Garonne), orange (Vienne), red (Moselle) and blue (Narew). Moreover, the subplots show the correlation between the correlations from both maps.
This section provides an overview of hydrological variability across the Moselle basin and its five selected catchments, serving as a foundation for interpretation. Figure E1 illustrates pattern of key climatic, landscape and streamflow characteristics. The figure highlights substantial variability in all considered properties across the Moselle. Even neighboring catchments can exhibit markedly different responses. For example, Moselle-Toul and Moselle-Meurthe, despite being geographically adjacent and similar in size, display different hydrological patterns.
The mean flow is the highest in the Southern part of the Moselle (Fig. E1a), reaching σq_mean > 2 mm d−1 across most of the Moselle-Toul. In contrast, the lowest σq_mean along with reduced spatial variability are found in the central part of the Moselle: Orne and Saar sub-catchments. The spatial pattern of σq_mean closely resembles that of mean precipitation (κp_mean, Fig. E1b), suggesting a close relation between the two variables – specifically, that, unsurprisingly, mean discharge is primarily controlled by mean precipitation (Fig. E1a). In turn, precipitation variability appears to relate to elevation variability, as indicated by the similarities between precipitation patterns and elevation (Fig. E1b) or mean terrain slope (τslp_dg_mean; Fig. E1c).
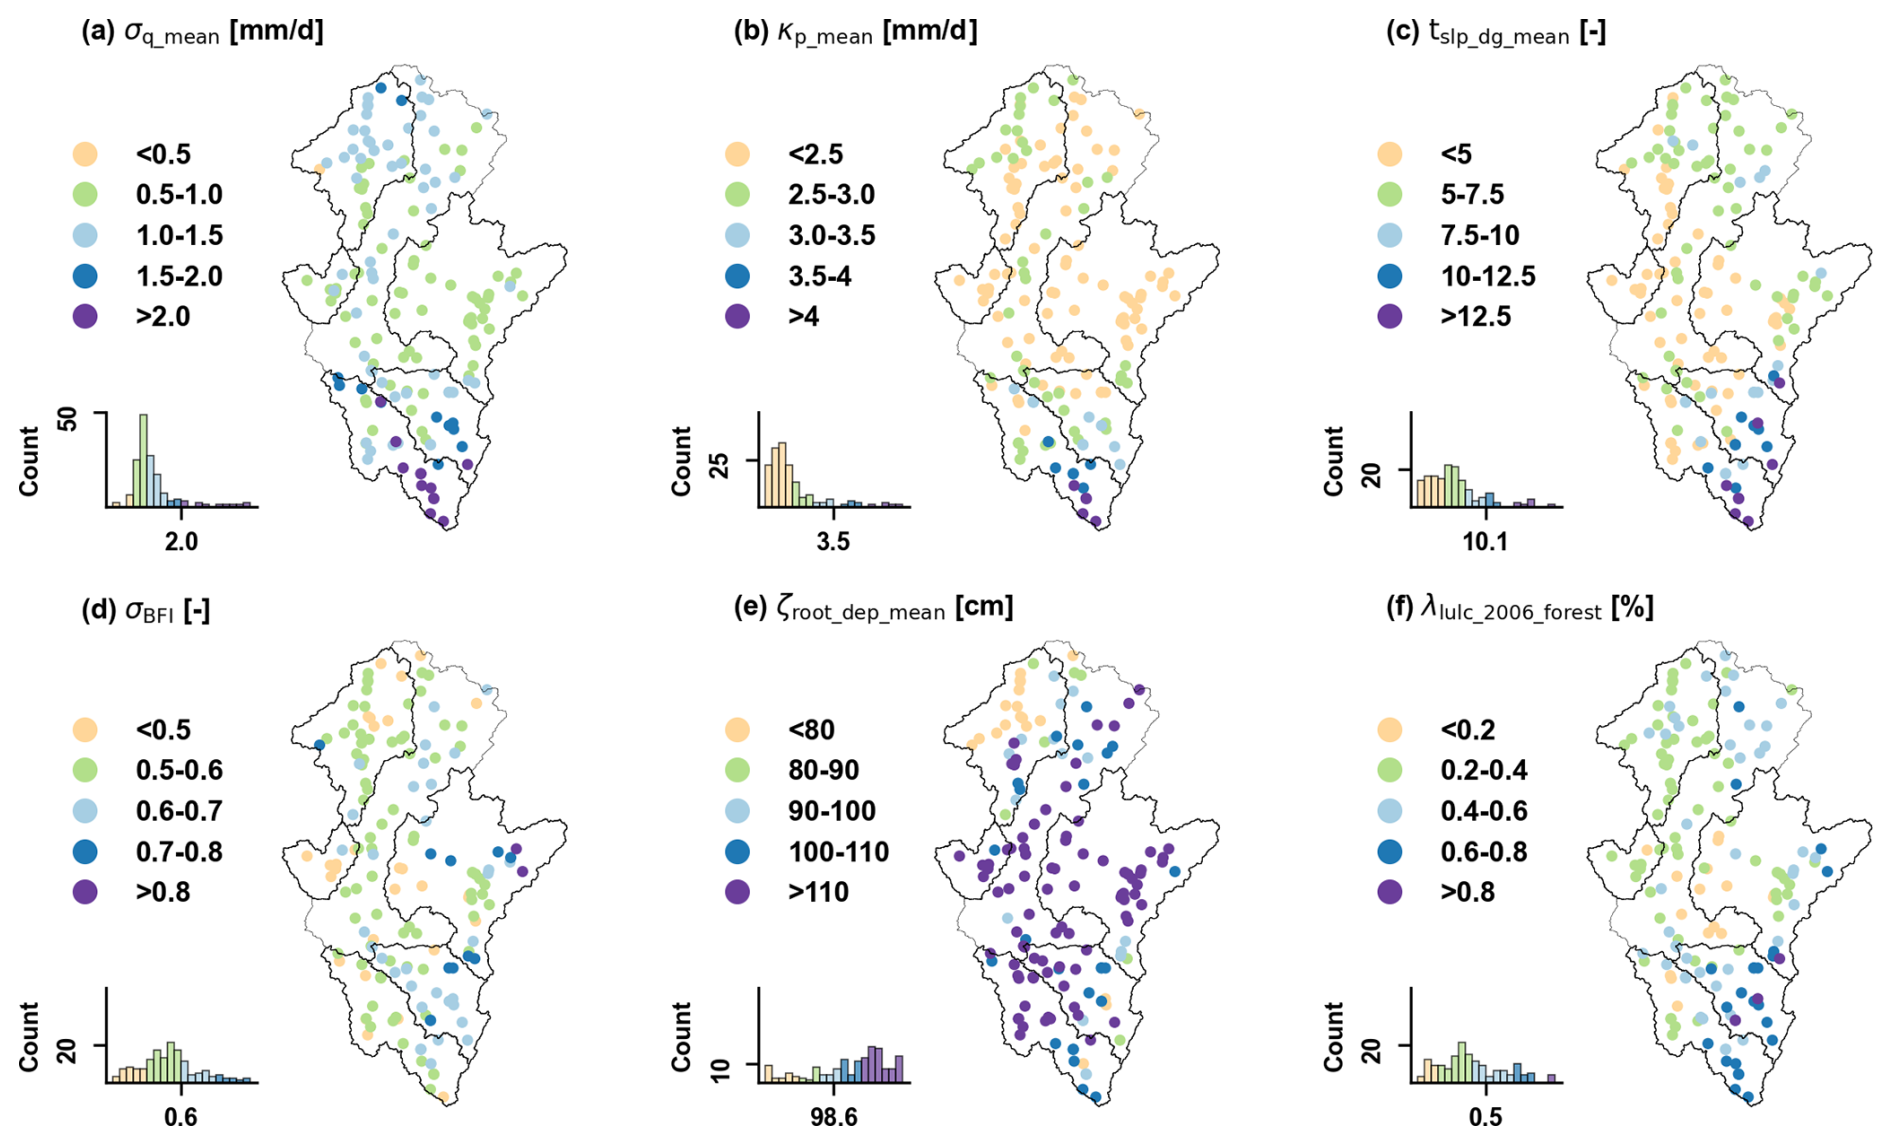
Figure E1Spatial variability of selected streamflow signatures and landscape attributes used in this work over the Moselle basin. Each subplot shows the values of each variable with colors corresponding to specific intervals. Note that each subplot also shows the histogram of the specific variable, with histogram bins colored to match the ranges used in the map circles.
The baseflow (σBFI), shows a very different pattern than σq_mean (Fig. E1d). Its highest values and variability are found in Moselle-Saar, while Toul and Sure presented the lowest σBFI values and reduced variability. These patterns align with the geological classification shown in the Moselle geology map (Fig. 2), where higher permeability in the southeast corresponds to increased baseflow, while lower permeability in the north results in reduced baseflow.
Rooting depth (Fig. E1e) is shallowest in the Northern part of the Moselle (Moselle-Sure), an area that also has lower forest cover (Fig. E1f) compared to the rest of the basin. According to Fenicia and McDonnell (2022), this area is also strongly influenced by agriculture. Notably, from the visual inspection, it seems that both attributes seem to mirror the baseflow pattern in the Sure catchment.
The used version of the EStreams dataset (v1.2) is stored online at a Zenodo repository (https://doi.org/10.5281/zenodo.14778580, do Nascimento et al., 2025) and detailed described by do Nascimento et al. (2024b). Regional geology catchment attributes for the Moselle are available online (https://doi.org/10.5281/zenodo.14779451, do Nascimento et al., 2025). All code used in this study is available online at a GitHub repository (https://doi.org/10.5281/zenodo.17700903, do Nascimento, 2025) (https://github.com/thiagovmdon/LSH-quality_geology, last access: 24 November 2025).
The supplement related to this article is available online at https://doi.org/10.5194/hess-29-7173-2025-supplement.
FF had the original idea and worked with TN to develop the conceptualization and methodology of the study. TN, JR and FF worked on the data curation. TN wrote all codes used and conducted all formal analysis. FF, MH, and SG supervised the work. The visualizations and original draft of the manuscript were prepared by TN. All co-authors contributed to the review and editing of the manuscript. Funding was acquired by FF and MH. All authors have read and agreed to the current version of the paper.
At least one of the (co-)authors is a member of the editorial board of Hydrology and Earth System Sciences. The peer-review process was guided by an independent editor, and the authors also have no other competing interests to declare.
Publisher's note: Copernicus Publications remains neutral with regard to jurisdictional claims made in the text, published maps, institutional affiliations, or any other geographical representation in this paper. While Copernicus Publications makes every effort to include appropriate place names, the final responsibility lies with the authors. Views expressed in the text are those of the authors and do not necessarily reflect the views of the publisher.
We thank the editor and the two reviewers for their constructive comments.
This project was funded by the “Money Follows Cooperation” project (project no. OCENW.M.21.230) between the Netherlands Organization for Scientific Research (NWO) and the Swiss National Science Foundation (SNSF). This work was further supported by the TU Delft Climate Action Research and Education seed funds.
This paper was edited by Fuqiang Tian and reviewed by two anonymous referees.
Addor, N., Newman, A. J., Mizukami, N., and Clark, M. P.: The CAMELS data set: catchment attributes and meteorology for large-sample studies, Hydrol. Earth Syst. Sci., 21, 5293–5313, https://doi.org/10.5194/hess-21-5293-2017, 2017.
Addor, N., Nearing, G., Prieto, C., Newman, A. J., Le Vine, N., and Clark, M. P.: A Ranking of Hydrological Signatures Based on Their Predictability in Space, Water Resour. Res., 54, 8792–8812, https://doi.org/10.1029/2018WR022606, 2018.
Addor, N., Do, H. X., Alvarez-Garreton, C., Coxon, G., Fowler, K., and Mendoza, P. A.: Large-sample hydrology: recent progress, guidelines for new datasets and grand challenges, Hydrological Sciences Journal, 65, 712–725, https://doi.org/10.1080/02626667.2019.1683182, 2020.
AGE: Geological map for Luxembourg at 1:250 000 scale, Administration de la gestion de l’eau, Luxembourg, [data set], https://eau.gouvernement.lu/fr.html (last access: 11 December 2021), 2021.
Almagro, A., Meira Neto, A. A., Vergopolan, N., Roy, T., Troch, P. A., and Oliveira, P. T. S.: The Drivers of Hydrologic Behavior in Brazil: Insights From a Catchment Classification, Water Resour. Res., 60, e2024WR037212, https://doi.org/10.1029/2024WR037212, 2024.
Bagdassarov, N.: Permeability of Rocks, Fundamentals of Rock Physics, 178–210, https://doi.org/10.1017/9781108380713.006, 2021.
BDLISA database: Base de Donnée des Limites des Systèmes Aquifères, version 1, niveau 2, ordre 1, scale: , [data set], https://bdlisa.eaufrance.fr (last access: 11 December 2021), 2024.
Beck, H. E., de Roo, A., and van Dijk, A. I. J. M.: Global Maps of Streamflow Characteristics Based on Observations from Several Thousand Catchments, J. Hydrometeorol., 16, 1478–1501, https://doi.org/10.1175/JHM-D-14-0155.1, 2015.
Beven, K. J.: Uniqueness of place and process representations in hydrological modelling, Hydrol. Earth Syst. Sci., 4, 203–213, https://doi.org/10.5194/hess-4-203-2000, 2000.
Bloomfield, J. P., Gong, M., Marchant, B. P., Coxon, G., and Addor, N.: How is Baseflow Index (BFI) impacted by water resource management practices?, Hydrol. Earth Syst. Sci., 25, 5355–5379, https://doi.org/10.5194/hess-25-5355-2021, 2021.
Blöschl, G. and Sivapalan, M.: Scale issues in hydrological modelling: A review, Hydrol. Process., 9, 251–290, https://doi.org/10.1002/HYP.3360090305, 1995.
Boorman, D. B., Hollis, J. M., and Lilly, A.: Hydrology of soil types: a hydrologically-based classification of the soils of United Kingdom, Institute of Hydrology, Wallingford, UK, 146 pp., ISBN 0-948540-73-9, 1995.
Budyko, M. I. and Miller, D. H.: Climate and Life, Academic Press, New York, USA, 508 pp., ISBN 978-0-12-139450-0, 1974.
Chagas, V. B. P., Chaffe, P. L. B., Addor, N., Fan, F. M., Fleischmann, A. S., Paiva, R. C. D., and Siqueira, V. A.: CAMELS-BR: hydrometeorological time series and landscape attributes for 897 catchments in Brazil, Earth Syst. Sci. Data, 12, 2075–2096, https://doi.org/10.5194/essd-12-2075-2020, 2020.
Clerc-Schwarzenbach, F., Selleri, G., Neri, M., Toth, E., van Meerveld, I., and Seibert, J.: Large-sample hydrology – a few camels or a whole caravan?, Hydrol. Earth Syst. Sci., 28, 4219–4237, https://doi.org/10.5194/hess-28-4219-2024, 2024.
Cornes, R. C., van der Schrier, G., van den Besselaar, E. J. M., and Jones, P. D.: An Ensemble Version of the E-OBS Temperature and Precipitation Data Sets, Journal of Geophysical Research: Atmospheres, 123, 9391–9409, https://doi.org/10.1029/2017JD028200, 2018.
Coxon, G., Addor, N., Bloomfield, J. P., Freer, J., Fry, M., Hannaford, J., Howden, N. J. K., Lane, R., Lewis, M., Robinson, E. L., Wagener, T., and Woods, R.: CAMELS-GB: hydrometeorological time series and landscape attributes for 671 catchments in Great Britain, Earth Syst. Sci. Data, 12, 2459–2483, https://doi.org/10.5194/essd-12-2459-2020, 2020.
Didan, K.: MODIS/Terra Vegetation Indices 16-Day L3 Global 500m SIN Grid V006, NASA Land Processes Distributed Active Archive Center [data set], https://doi.org/10.5067/MODIS/MOD13A1.006 (last access: 2 November 2023), 2015.
do Nascimento, T. V. M.: Code from “How do geological map details influence the identification of geology- streamflow relationships in large-sample hydrology studies?”, Zenodo [code], https://doi.org/10.5281/zenodo.17700902, 2025.
do Nascimento, T. V. M., Rudlang, J., Höge, M., van der Ent, R., Chappon, M., Seibert, J., Hrachowitz, M., and Fenicia, F.: EStreams: An integrated dataset and catalogue of streamflow, hydro-climatic and landscape variables for Europe, Scientific Data, 11, 1–19, https://doi.org/10.1038/s41597-024-03706-1, 2024a.
do Nascimento, T. V. M., de Oliveira, R. P., and Condesso de Melo, M. T.: Impacts of large-scale irrigation and climate change on groundwater quality and the hydrological cycle: A case study of the Alqueva irrigation scheme and the Gabros de Beja aquifer system, Science of The Total Environment, 907, 168151, https://doi.org/10.1016/J.SCITOTENV.2023.168151, 2024b.
do Nascimento, T. V. M., Rudlang, J., Höge, M., van der Ent, R., Chappon, M., Seibert, J., Hrachowitz, M., and Fenicia, F.: EStreams: An Integrated Dataset and Catalogue of Streamflow, Hydro-Climatic Variables and Landscape Descriptors for Europe (1.2), Zenodo [data set], https://doi.org/10.5281/zenodo.14778580, 2025.
do Nascimento, T. V. M., Rudlang, J. M., Gnann, S., Seibert, J., Hrachowitz, M., and Fenicia, F.: Data from “How do geological map details influence the identification of geology-streamflow relationships in large-sample hydrology studies?” (0.1), Zenodo [data set], https://doi.org/10.5281/zenodo.14779451, 2025.
Duscher, K., Günther, A., Richts, A., Clos, P., Philipp, U., and Struckmeier, W.: The GIS layers of the BInternational Hydrogeological Map of Europe in a vector format, Hydrogeology Journal, 27, 595–603, https://doi.org/10.1007/s10040-015-1296-4, 2019.
EEA: CORINE Land Cover (CLC), European Environment Agency [data set], Copenhagen, Denmark, https://land.copernicus.eu/en/products/corine-land-cover (last access: 2 November 2023), 2020.
ESDD: European Soil Database Derived data, https://esdac.jrc.ec.europa.eu/content/european-soil-database-derived-data, last access: 23 November 2023.
Fenicia, F. and McDonnell, J. J.: Modeling streamflow variability at the regional scale: (1) perceptual model development through signature analysis, J. Hydrol. (Amst.), 605, 127287, https://doi.org/10.1016/J.JHYDROL.2021.127287, 2022.
Floriancic, M. G., Spies, D., van Meerveld, I. H. J., and Molnar, P.: A multi-scale study of the dominant catchment characteristics impacting low-flow metrics, Hydrol. Process., 36, e14462, https://doi.org/10.1002/HYP.14462, 2022.
Fowler, K. J. A., Acharya, S. C., Addor, N., Chou, C., and Peel, M. C.: CAMELS-AUS: hydrometeorological time series and landscape attributes for 222 catchments in Australia, Earth Syst. Sci. Data, 13, 3847–3867, https://doi.org/10.5194/essd-13-3847-2021, 2021.
Freeze, R. A. and Cherry, J. A.: Groundwater, Prentice-Hall, Englewood Cliffs, New Jersey, USA, 604 pp., ISBN 978-0-13-365312-0, 1979.
Gleeson, T., Marklund, L., Smith, L., and Manning, A. H.: Classifying the water table at regional to continental scales, Geophys Res Lett, 38, https://doi.org/10.1029/2010GL046427, 2011a.
Gleeson, T., Smith, L., Moosdorf, N., Hartmann, J., Dürr, H. H., Manning, A. H., Van Beek, L. P. H., and Jellinek, A. M.: Mapping permeability over the surface of the Earth, Geophys. Res. Lett., 38, 2401, https://doi.org/10.1029/2010GL045565, 2011b.
Gnann, S. J., Woods, R. A., and Howden, N. J. K.: Is There a Baseflow Budyko Curve?, Water Resour. Res., 55, 2838–2855, https://doi.org/10.1029/2018WR024464, 2019.
Gnann, S. J., McMillan, H. K., Woods, R. A., and Howden, N. J. K.: Including Regional Knowledge Improves Baseflow Signature Predictions in Large Sample Hydrology, Water Resour. Res., 57, e2020WR028354, https://doi.org/10.1029/2020WR028354, 2021.
GRDC: Report of the 15th Meeting of the GRDC Steering Committee, Federal Institute of Hydrology (BfG), Koblenz, Germany, 9 pp., https://grdc.bafg.de/downloads/GRDC-15th-SCNotes_final.pdf (last access: 3 December 2025), 2024.
GÜK200: Geologische Übersichtskarte der Bundesrepublik Deutschland, scale: , [data set], http://www.bgr.bund.de (last access: 11 December 2021), 2024.
Günther, A. and Duscher, K.: Extended vector data of the International Hydrogeological Map of Europe (Version IHME1500 v1.2) Federal Institute for Geosciences and Natural Resources (BGR), Hannover, Germany, [data set], https://www.bgr.bund.de/ihme1500 (last access: 3 December 2025), 2019.
Gupta, H. V., Perrin, C., Blöschl, G., Montanari, A., Kumar, R., Clark, M., and Andréassian, V.: Large-sample hydrology: a need to balance depth with breadth, Hydrol. Earth Syst. Sci., 18, 463–477, https://doi.org/10.5194/hess-18-463-2014, 2014.
Hall, D. K. and Riggs, G. A.: MODIS/Terra Snow Cover Daily L3 Global 500m SIN Grid, Version 61, Boulder, Colorado, USA, NASA National Snow and Ice Data Center Distributed Active Archive Center [data set], https://doi.org/10.5067/MODIS/MOD10A1.061 (last access: 2 November 2023), 2021.
Hartmann, J., Moosdorf, N., Hartmann, J., and Moosdorf, N.: The new global lithological map database GLiM: A representation of rock properties at the Earth surface, Geochemistry, Geophysics, Geosystems, 13, 12004, https://doi.org/10.1029/2012GC004370, 2012.
Helgason, H. B. and Nijssen, B.: LamaH-Ice: LArge-SaMple DAta for Hydrology and Environmental Sciences for Iceland, Earth Syst. Sci. Data, 16, 2741–2771, https://doi.org/10.5194/essd-16-2741-2024, 2024.
Hellebrand, H., Hoffmann, L., Juilleret, J., and Pfister, L.: Assessing winter storm flow generation by means of permeability of the lithology and dominating runoff production processes, Hydrol. Earth Syst. Sci., 11, 1673–1682, https://doi.org/10.5194/hess-11-1673-2007, 2007.
Hersbach, H., Bell, B., Berrisford, P., Hirahara, S., Horányi, A., Muñoz-Sabater, J., Nicolas, J., Peubey, C., Radu, R., Schepers, D., Simmons, A., Soci, C., Abdalla, S., Abellan, X., Balsamo, G., Bechtold, P., Biavati, G., Bidlot, J., Bonavita, M., De Chiara, G., Dahlgren, P., Dee, D., Diamantakis, M., Dragani, R., Flemming, J., Forbes, R., Fuentes, M., Geer, A., Haimberger, L., Healy, S., Hogan, R. J., Hólm, E., Janisková, M., Keeley, S., Laloyaux, P., Lopez, P., Lupu, C., Radnoti, G., de Rosnay, P., Rozum, I., Vamborg, F., Villaume, S., and Thépaut, J. N.: The ERA5 global reanalysis, Quarterly Journal of the Royal Meteorological Society, 146, 1999–2049, https://doi.org/10.1002/QJ.3803, 2020.
Hiederer, R.: Mapping Soil Properties for Europe – Spatial Representation of Soil Database Attributes, Publications Office of the European Union, Luxembourg, 47 pp., https://doi.org/10.2788/94128, 2013a.
Hiederer, R.: Mapping Soil Typologies – Spatial Decision Support Applied to European Soil Database, Publications Office of the European Union, Luxembourg, 147 pp., https://doi.org/10.2788/87029, 2013b.
Höge, M., Kauzlaric, M., Siber, R., Schönenberger, U., Horton, P., Schwanbeck, J., Floriancic, M. G., Viviroli, D., Wilhelm, S., Sikorska-Senoner, A. E., Addor, N., Brunner, M., Pool, S., Zappa, M., and Fenicia, F.: CAMELS-CH: hydro-meteorological time series and landscape attributes for 331 catchments in hydrologic Switzerland, Earth Syst. Sci. Data, 15, 5755–5784, https://doi.org/10.5194/essd-15-5755-2023, 2023.
Huang, S., Dong, Q., Zhang, X., and Deng, W.: Catchment natural driving factors and prediction of baseflow index for Continental United States based on Random Forest technique, Stochastic Environmental Research and Risk Assessment, 35, 2567–2581, https://doi.org/10.1007/S00477-021-02057-2, 2021.
Ibrahim, M., Coenders-Gerrits, M., van der Ent, R., and Hrachowitz, M.: Catchments do not strictly follow Budyko curves over multiple decades, but deviations are minor and predictable, Hydrol. Earth Syst. Sci., 29, 1703–1723, https://doi.org/10.5194/hess-29-1703-2025, 2025.
Karlsen, R. H., Seibert, J., Grabs, T., Laudon, H., Blomkvist, P., and Bishop, K.: The assumption of uniform specific discharge: unsafe at any time?, Hydrol. Process., 30, 3978–3988, https://doi.org/10.1002/HYP.10877, 2016.
Kauffeldt, A., Halldin, S., Rodhe, A., Xu, C.-Y., and Westerberg, I. K.: Disinformative data in large-scale hydrological modelling, Hydrol. Earth Syst. Sci., 17, 2845–2857, https://doi.org/10.5194/hess-17-2845-2013, 2013.
Klingler, C., Schulz, K., and Herrnegger, M.: LamaH-CE: LArge-SaMple DAta for Hydrology and Environmental Sciences for Central Europe, Earth Syst. Sci. Data, 13, 4529–4565, https://doi.org/10.5194/essd-13-4529-2021, 2021.
Knoben, W. J. M., Woods, R. A., and Freer, J. E.: A Quantitative Hydrological Climate Classification Evaluated With Independent Streamflow Data, Water Resour. Res., 54, 5088–5109, https://doi.org/10.1029/2018WR022913, 2018.
Kratzert, F., Klotz, D., Shalev, G., Klambauer, G., Hochreiter, S., and Nearing, G.: Towards learning universal, regional, and local hydrological behaviors via machine learning applied to large-sample datasets, Hydrol. Earth Syst. Sci., 23, 5089–5110, https://doi.org/10.5194/hess-23-5089-2019, 2019.
Kratzert, F., Nearing, G., Addor, N., Erickson, T., Gauch, M., Gudmundsson, L., Hassidim, A., Klotz, D., Nevo, S., and Matias, Y.: Caravan – A global community dataset for large-sample hydrology, Sci. Data, 10, 61, https://doi.org/10.1038/s41597-023-01975-w, 2023.
Kuentz, A., Arheimer, B., Hundecha, Y., and Wagener, T.: Understanding hydrologic variability across Europe through catchment classification, Hydrol. Earth Syst. Sci., 21, 2863–2879, https://doi.org/10.5194/hess-21-2863-2017, 2017.
Ladson, A. R., Brown, R., Neal, B., and Nathan, R.: A standard approach to baseflow separation using the Lyne and Hollick filter, Australian Journal of Water Resources, 17, 25–34, https://doi.org/10.7158/W12-028.2013.17.1, 2013.
Mathai, J. and Mujumdar, P. P.: Use of streamflow indices to identify the catchment drivers of hydrographs, Hydrol. Earth Syst. Sci., 26, 2019–2033, https://doi.org/10.5194/hess-26-2019-2022, 2022.
Mwakalila, S., Feyen, J., and Wyseure, G.: The influence of physical catchment properties on baseflow in semi-arid environments, J. Arid Environ., 52, 245–258, https://doi.org/10.1006/JARE.2001.0947, 2002.
Myneni, R., Knyazikhin, Y., and Park, T.: MODIS/Terra Leaf Area Index/FPAR 8-Day L4 Global 500m SIN Grid V061, NASA Land Processes Distributed Active Archive Center, [data set], https://doi.org/10.5067/MODIS/MOD15A2H.061 (last access: 2 November 2023), 2021.
Nearing, G., Cohen, D., Dube, V., Gauch, M., Gilon, O., Harrigan, S., Hassidim, A., Klotz, D., Kratzert, F., Metzger, A., Nevo, S., Pappenberger, F., Prudhomme, C., Shalev, G., Shenzis, S., Tekalign, T. Y., Weitzner, D., and Matias, Y.: Global prediction of extreme floods in ungauged watersheds, Nature, 627, 559–563, https://doi.org/10.1038/S41586-024-07145-1, 2024.
Pelletier, J. D., Broxton, P. D., Hazenberg, P., Zeng, X., Troch, P. A., Niu, G. Y., Williams, Z., Brunke, M. A., and Gochis, D.: A gridded global data set of soil, intact regolith, and sedimentary deposit thicknesses for regional and global land surface modeling, J. Adv. Model Earth. Syst., 8, 41–65, https://doi.org/10.1002/2015MS000526, 2016.
Pfister, L., Martínez-Carreras, N., Hissler, C., Klaus, J., Carrer, G. E., Stewart, M. K., and McDonnell, J. J.: Bedrock geology controls on catchment storage, mixing, and release: A comparative analysis of 16 nested catchments, Hydrol. Process., 31, 1828–1845, https://doi.org/10.1002/HYP.11134, 2017.
Santhi, C., Allen, P. M., Muttiah, R. S., Arnold, J. G., and Tuppad, P.: Regional estimation of base flow for the conterminous United States by hydrologic landscape regions, J. Hydrol. (Amst.), 351, 139–153, https://doi.org/10.1016/J.JHYDROL.2007.12.018, 2008.
Sawicz, K., Wagener, T., Sivapalan, M., Troch, P. A., and Carrillo, G.: Catchment classification: empirical analysis of hydrologic similarity based on catchment function in the eastern USA, Hydrol. Earth Syst. Sci., 15, 2895–2911, https://doi.org/10.5194/hess-15-2895-2011, 2011.
Schneider, M. K., Brunner, F., Hollis, J. M., and Stamm, C.: Towards a hydrological classification of European soils: preliminary test of its predictive power for the base flow index using river discharge data, Hydrol. Earth Syst. Sci., 11, 1501–1513, https://doi.org/10.5194/hess-11-1501-2007, 2007.
Schumm, S. A.: Evolution of drainage systems and slopes in badlands at Perth Amboy, New Jersey, GSA Bulletin, 67, 597–646, 1956.
Tarasova, L., Gnann, S., Yang, S., Hartmann, A., and Wagener, T.: Catchment characterization: Current descriptors, knowledge gaps and future opportunities, Earth Sci. Rev., 252, 104739, https://doi.org/10.1016/J.EARSCIREV.2024.104739, 2024.
Tempel, N., Bouaziz, L., Taormina, R., van Noppen, E., Stam, J., Sprokkereef, E., and Hrachowitz, M.: Catchment response to climatic variability: implications for root zone storage and streamflow predictions, Hydrol. Earth Syst. Sci., 28, 4577–4597, https://doi.org/10.5194/hess-28-4577-2024, 2024.
Van Dijk, A. I. J. M., Peña-Arancibia, J. L., Wood, E. F., Sheffield, J., and Beck, H. E.: Global analysis of seasonal streamflow predictability using an ensemble prediction system and observations from 6192 small catchments worldwide, Water Resour. Res., 49, 2729–2746, https://doi.org/10.1002/WRCR.20251, 2013.
van Oorschot, F., Hrachowitz, M., Viering, T., Alessandri, A., and van der Ent, R. J.: Global patterns in vegetation accessible subsurface water storage emerge from spatially varying importance of individual drivers, Environmental Research Letters, 19, 124018, https://doi.org/10.1088/1748-9326/AD8805, 2024.
Wang, S., Hrachowitz, M., and Schoups, G.: Multi-decadal fluctuations in root zone storage capacity through vegetation adaptation to hydro-climatic variability have minor effects on the hydrological response in the Neckar River basin, Germany, Hydrol. Earth Syst. Sci., 28, 4011–4033, https://doi.org/10.5194/hess-28-4011-2024, 2024.
Woods, R. A.: Analytical model of seasonal climate impacts on snow hydrology: Continuous snowpacks, Adv. Water Resour., 32, 1465–1481, https://doi.org/10.1016/j.advwatres.2009.06.011, 2009.
Wu, S., Zhao, J., Wang, H., and Sivapalan, M.: Regional Patterns and Physical Controls of Streamflow Generation Across the Conterminous United States, Water Resour. Res., 57, e2020WR028086, https://doi.org/10.1029/2020WR028086, 2021.
Yamazaki, D., Ikeshima, D., Sosa, J., Bates, P. D., Allen, G. H., and Pavelsky, T. M.: MERIT Hydro: A High-Resolution Global Hydrography Map Based on Latest Topography Dataset, Water Resour. Res., 55, 5053–5073, https://doi.org/10.1029/2019WR024873, 2019.
Zomlot, Z., Verbeiren, B., Huysmans, M., and Batelaan, O.: Spatial distribution of groundwater recharge and base flow: Assessment of controlling factors, J. Hydrol. Reg. Stud., 4, 349–368, https://doi.org/10.1016/J.EJRH.2015.07.005, 2015.
- Abstract
- Introduction
- Data
- Methods
- Results
- Discussion
- Conclusions
- Appendix A: Spatial distribution of the raw geology classes for the five European basins used
- Appendix B: Size dependency correlations between three selected streamflow signatures and high permeability percentages
- Appendix C: Different correlations for baseflow using the European catchments altogether
- Appendix D: Extra scatter plots between attributes groups and baseflow index
- Appendix E: Spatial patterns of hydrological variability in the Moselle sub-catchments
- Code and data availability
- Author contributions
- Competing interests
- Disclaimer
- Acknowledgements
- Financial support
- Review statement
- References
- Supplement