the Creative Commons Attribution 4.0 License.
the Creative Commons Attribution 4.0 License.
The interprovincial green water flow in China and its teleconnected effects on the social economy
Shan Sang
Chengcheng Hou
Shuangshuang Zi
Huiqing Lin
Green water (terrestrial evapotranspiration) flows from source regions, precipitates downwind via moisture recycling, recharges water resources, and sustains the social economy in sink regions. However, unlike blue water, there has been limited assessment of green water flows and their teleconnected effects on the social economy. This study used a climatology mean moisture trajectory dataset produced by the UTrack model for 2008–2017 to quantify interprovincial green water flows in China and their socioeconomic contributions. Results reveal an interconnected flow network where the green water of each province reciprocally exchanges with each other. Despite self-recycling (ranging from 0.6 % to 35 %), green water mainly forms precipitation in neighboring provinces, with average interprovincial flow directions from west to east and south to north. About 56 % of the total green water exported from the 31 mainland source provinces remains at home, contributing 43 % of the precipitation in China. The green water from the source provinces embodies substantial socioeconomic value for the downwind provinces, accounting for about 40 % of the water resources, 45 % of the gross domestic product (GDP), 46 % of the population, and 50 % of the food production of China. Green water from the western provinces is the largest contributor to water resources, while green water from the southwestern and central provinces embodies the highest GDP, population, and food production. Overall, the embodied socioeconomic values of green water flow increase from the source to sink provinces, suggesting that green water from less developed provinces effectively supports the higher socioeconomic status of developed provinces. This assessment emphasizes the substantial teleconnected socioeconomic values of green water flows and the need to incorporate them towards more comprehensive and effective water resource management.
- Article
(6478 KB) - Full-text XML
- BibTeX
- EndNote
Terrestrial moisture recycling is a crucial process of the water cycle, whereby water evaporates from land into the atmosphere, travels with the prevailing winds, and eventually falls back to the land as precipitation (van der Ent et al., 2010; Keys and Wang-Erlandsson, 2018; Zemp et al., 2014). Terrestrial evapotranspiration (i.e., green water) (Falkenmark and Rockström, 2006), which includes evaporation and transpiration from land and vegetation, contributes over half of the global precipitation on land (van der Ent et al., 2010; Theeuwen et al., 2023; Tuinenburg et al., 2020a). Green water flows from upwind source regions to generate precipitation and supply water resources for the social development of downwind sink regions through moisture recycling (Schyns et al., 2019; Wang-Erlandsson et al., 2022). Analogous to the upstream and downstream connections via blue water (referring to surface water and groundwater flow within a watershed; Gleeson et al., 2020), the upwind source and downwind sink regions are connected via green water flow within the evaporationshed (i.e., downwind regions receiving precipitation from a specific location's evaporation) (Ent and Savenije, 2013). Changes in both blue and green water flow directly impact water resource availability, thereby influencing regional water security and human societies (Keys et al., 2019).
The blue and green water flows provide a mechanism by which upstream or upwind changes in ecohydrological and societal processes may affect the downwind or downstream supply of water resources and, thus, ecological and societal systems therein. Due to upstream water withdrawal and dams, the global total blue water flow into oceans and internal sinks decreased by 3.5 % in 2002 compared to 1961–1990 (Döll et al., 2009). The decline in water availability exacerbated water stress in the downstream of transboundary river basins (Munia et al., 2016). Moreover, upstream vegetation restoration and soil and water conservation practices reduced water yield downstream, as already happened in the Yellow River (Wang et al., 2017; Zhou et al., 2015b). Numerous studies have investigated the causal connection of blue water flow from upstream and downstream regions, yet research into the connection of green water flow from upwind and downwind regions and their impacts remains inadequate.
Unlike blue water flow primarily shaped by terrain with specific routes and regulated by human activities (e.g., reservoir, transfer), green water flow is transported by atmospheric air movement in a pervasive manner from evapotranspiration to precipitation in downwind sink regions (Schyns et al., 2019). This establishes a spatial linkage between source and sink regions for green water flow through the moisture recycling process, similar to blue water flow through the surface hydrological process (Li et al., 2024). Therefore, evapotranspiration changes associated with land cover changes in source regions are likely to impact not only downstream rivers via blue water flow, but also downwind precipitation via green water flow (Keys et al., 2012), with further implications for socioeconomic development (Wang-Erlandsson et al., 2018). For example, vegetation greening reduced blue water but increased downwind water availability globally through green water (Cui et al., 2022). Reduction in green water in the Amazon decreased downwind precipitation in the United States (Lawrence and Vandecar, 2015), and reduction in green water source regions could decrease potential crop yields in key global food-producing regions (Bagley et al., 2012).
Source regions supply water resources to support sink regions' socioeconomic development through both blue and green water flows. Existing research has extensively assessed the socioeconomic values of blue water, e.g., the population dependency on runoff (Green et al., 2015; Viviroli et al., 2020), while seldom considering the teleconnected effects of green water on the social economy. In fact, green water is also closely tied to human society because green water traveling from source regions precipitates, recharges water resources, and ultimately sustains socioeconomic activities, livelihoods, and ecosystems in sink regions (Aragão, 2012; Keys and Wang-Erlandsson, 2018; O'Connor et al., 2021). These contributions should be quantified and recognized as being the value of green water to the social economy, which expands the scope of water management and water security maintenance (Keys et al., 2017; Rockström et al., 2023). Emerging moisture-tracking technologies offer feasible ways of quantifying green water flow across regions at large scales (Keys et al., 2019; Li et al., 2023; Theeuwen et al., 2023) and pave the way for assessing the socioeconomic values of green water.
The general spatial and seasonal patterns of moisture flows in China are determined by regional atmospheric circulation systems, including prevailing westerly winds (from the west towards the east) in most of China between 30 and 60° N (Bridges et al., 2023), the East Asian monsoon in eastern China, and the Indian monsoon in southwestern China. In summer, the East Asian and Indian monsoons supply moisture for precipitation in eastern and southwestern China (Tian and Fan, 2013). In winter, the East Asian monsoon drives northwesterly moisture transport across much of China and generates precipitation (Wu and Wang, 2002). Recent studies analyzed the large spatial pattern of moisture recycling in China at the grid (Zhang et al., 2023a), river basin (Wang et al., 2023b), and ecological region (Xie et al., 2024) scales or for specific regions (Pranindita et al., 2022; Zhang et al., 2024). However, green water flows from different regions are interlinked and become sources and sinks of each other. Such green water transfer at a subnational scale effectively forms an interconnected green water flow network. It highlights the mutual dependency of green water and its socioeconomic contributions, especially for large countries like China. Few studies focus on green water flows at the administrative district scale, which is important for water management. Furthermore, the substantial regional disparities in socioeconomic development add complexity to understanding the socioeconomic contributions of green water to Chinese provinces. The western provinces with weak economic statuses and sparse populations are abundant in water resources (Ya-Feng et al., 2020). In contrast, the economically developed and densely populated eastern provinces suffer from water scarcity (Varis and Vakkilainen, 2001). Therefore, quantifying interprovincial green water flows and evaluating the embodied socioeconomic values offer new perspectives for optimizing water resource utilization and mitigating the imbalance in regional socioeconomic development.
In this study, we used a high-quality moisture trajectory dataset from the UTrack model to quantify and visualize the interprovincial network of green water flows within China. Next, we combined socioeconomic statistical data to evaluate socioeconomic values embodied in green water flow for economic production, population, and food production. Our study aims to reveal the transboundary green water flows within China and their teleconnected effects on the social economy. This study incorporates green water flow into water resources, extending water resource management beyond blue water towards a more complete understanding of the water cycle and its socioeconomic implications, which is beneficial for assessing and optimizing regional water security.
2.1 Data
This study used the moisture trajectory dataset generated by the Lagrangian moisture-tracking model UTrack-atmospheric-moisture driven by ERA5 reanalysis data. The model is a state-of-the-art moisture-tracking model, producing more detailed evaporation footprints due to the high spatial resolution and reduced unnecessary complexity (Tuinenburg and Staal, 2020). The dataset provides monthly mean moisture flows at the global scale with a spatial resolution of 0.5° for 2008–2017, expressed as the fractions of evaporation from a source grid allocated to precipitation at a sink grid (Tuinenburg et al., 2020a). It has been widely used in moisture recycling research with various spatial scales, such as the precipitation source of the grid (Staal et al., 2023; Wei et al., 2024; Zhang et al., 2023a) and basin scales (Wang et al., 2023b), and moisture transport between nations (Rockström et al., 2023). The moisture trajectory dataset was used in conjunction with the multiyear monthly mean evapotranspiration (ET) of 2008–2017 from the ERA5 reanalysis dataset to estimate precipitation in a sink grid originating from a source grid.
The socioeconomic statistical data in 2008–2017 from the China Statistical Yearbook were used to estimate the socioeconomic values of green water in terms of water resource volume, gross domestic product (GDP), population, and food production for 31 provinces in mainland China, without Hong Kong, Macau, and Taiwan due to data limitations. GDP was adjusted to price in the year 2020 to eliminate the effects of inflation.
2.2 Quantify green water flows in China
We quantified interprovincial moisture flows and their precipitation contribution following the workflow described in Fig. A1. At each sink grid, the ET-to-precipitation (ET-to-P) fractions from the moisture trajectory datasets were multiplied by the ERA5 ET to obtain the monthly precipitation contribution by moisture from its source grids. Repeating the calculation for all grids within a sink province and summing them up yielded the precipitation in the sink province contributed by each source grid (Fig. A1, Step 1). Next, we employed zonal statistics to sum up precipitation in the sink province contributed by the grids of each source province, and the precipitation contribution was converted to relative values, i.e., the fraction of precipitation in a sink province j originating from the green water of a source province i (denoted as Wij), rather than the absolute contribution, in order to reduce the uncertainty in the latter (Fig. A1, Step 2). The fraction Wij multiplied by the observed precipitation of the sink province restores the absolute precipitation contribution. This practice ensures that provincial precipitation is fully decomposed into different sources, reducing the estimation bias of sink precipitation due to an unclosed water balance by ET and precipitation data (De Petrillo et al., 2024). Finally, the interprovincial green water flows in China were derived after estimating each province individually.
The direction of green water flows can be represented by a vector starting from a source to sink province determined by their geometric centers and with its length denoting the flow magnitude. Since green water flows have multiple destinations, each flow points to different sink provinces and even outside China. For each source province, all of the domestic green water flow vectors can be averaged to a composite to represent their net direction and magnitude, which are mainly determined by atmospheric wind conditions, source location, and green water volume.
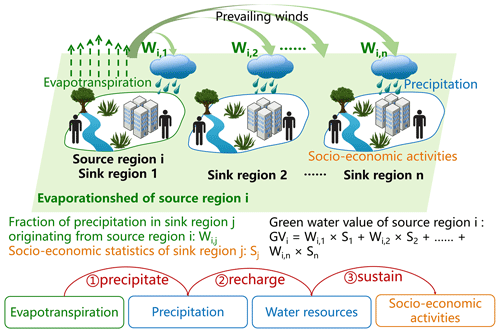
Figure 1A conceptual diagram depicting the teleconnection of green water flows and their socioeconomic contributions in a cascade manner. Evapotranspiration (green dotted arrows) from source region i flows downwind with the prevailing winds (green thick arrows) and precipitates in sink region n, which recharges water sources and sustains socioeconomic activities in sink regions.
2.3 Quantify socioeconomic values embodied in green water
Green water from upwind source provinces flows and precipitates downwind to recharge water resources and therefore sustains socioeconomic activities in sink provinces, as depicted in Fig. 1. Consequently, precipitation, water resources, and socioeconomic factors such as economic activities, human livelihood, and crop production in sink provinces rely on green water exported from source provinces. Changes in green water may affect water resource volume and then impact economic activities, livelihood, and crop production through water supply. We chose water resource volume, economic output (measured by GDP), population, and food production as the four socioeconomic indicators that are closely related to water resources to evaluate the socioeconomic contributions of green water.
If we assume that all socioeconomic activities in sink province j are sustained by precipitation which constitutes water resources and recharges groundwater, socioeconomic statistics of sink province j can be partitioned into source provinces by their share of the precipitation contribution (Wij). Therefore, multiplying socioeconomic statistics in sink province j (Sj) by Wij yielded the socioeconomic value of green water from source province i. The total socioeconomic value of green water of source province i (GVi) can be obtained by summing its contributions to all sink provinces (Fig. 1) as
where Sj is the average socioeconomic value of 2008–2017, i.e., water resource volume (km3), GDP (CNY 1 = USD 0.14), population (persons), and food production (ton), in sink province j, and n is the number of sink provinces.
Due to the different socioeconomic development statuses, the same amount of green water may produce different socioeconomic values between source and sink provinces. This means that green water flow also involves changes in embodied socioeconomic values from source to sink provinces. We used water productivity in the source province (WPi) to calculate the socioeconomic values of its exported green water in the counterfactual scenario when it was all consumed in the source province without interprovincial transfer () (Eq. 2). The results were compared with the actual green water's socioeconomic values (Eq. 1) (i.e., the socioeconomic values of exported green water when it is consumed in sink provinces) as
where WUj is the water use in sink province j and WPi is the water productivity in source province i (i.e., economic output, population, and food production per unit water use).
The changes in the socioeconomic value of green water flow (ΔGVi) from source province i to its sink provinces can be estimated by
is the net change in the socioeconomic values of all interprovincial green water flows in China.
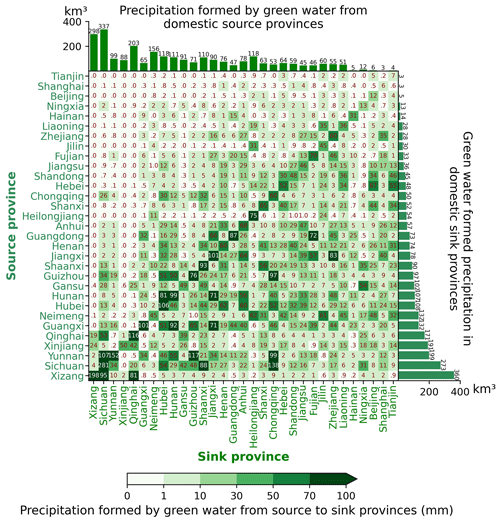
Figure 2Interprovincial green water flows in China. The heat map denotes precipitation in a sink province generated by green water from a source province (mm). The right bar shows domestic precipitation (km3) formed by green water from each source province. The top bar shows precipitation in each sink province formed by green water from domestic source provinces (km3).
3.1 The interprovincial green water flows in China and their directions
Green water exported from a source province forms precipitation in different sink provinces in China, and precipitation in a sink province originates from green water in different source provinces. Therefore, different provinces in China, acting as either sources or sinks, are interconnected through moisture recycling and have established an interprovincial network (Fig. 2).
A large fraction of green water exported from each source province is retained locally to generate precipitation (diagonal cells in Fig. 2). The precipitation recycling ratio (PRR), the ratio of precipitation generated by local green water to the total precipitation, reflects how much the green water of each source province contributes to its own precipitation (Fig. A2c). Xizang has the highest PRR of 0.345, followed by Qinghai (0.341) and Sichuan (0.297). Besides local recycling, green water predominantly flows and generates more precipitation in neighboring provinces and less precipitation in distant provinces. For example, green water from Sichuan forms high precipitation in neighboring provinces such as Chongqing (138 mm), far surpassing other distant sink provinces (< 88 mm).
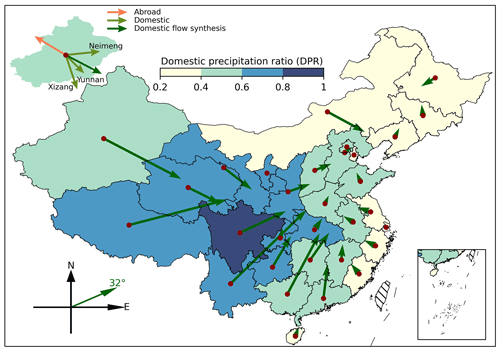
Figure 3Directions of green water flows from each source province in China. Green arrows indicate the average direction of domestic green water flows, denoted as a vector starting from a source province (the geometric center in red points) to sink provinces and with its length representing the amount of precipitation formed by green water. The face colors on the map represent fractions of green water forming precipitation within China for each source province (DPR). The upper-left corner shows a schematic diagram for green water flows from Xinjiang. The lower-left corner shows the composite flow direction of interprovincial green water for all the provinces.
The direction of interprovincial green water flow can be visualized as a composite direction averaging all domestic green water flows from each source province, which are mainly determined by atmospheric wind conditions, source location, and green water volume (Fig. 3). Overall, the average direction of all interprovincial green water flows is at 32° northeastward (32° north off the easterly direction), suggesting that green water within China is transported in the northerly and easterly directions owing to the combined effects of monsoons and westerly winds.
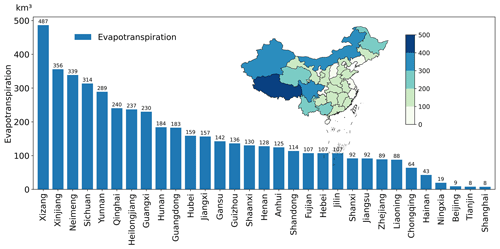
Green water exported by source provinces contributes to precipitation both within and outside China. We defined the domestic precipitation ratio (DPR) as the ratio of green water that formed precipitation in China to each province's total green water export to represent its relative importance to China's precipitation (Fig. A2a). Green water from the provinces in western and central China mainly flows eastward under the influence of the prevailing westerlies, which extend their evaporationsheds eastward to cover a large part of China and generate more precipitation within China (Fig. 3). For instance, green water from Xizang, the largest exporter in China, produces the highest domestic precipitation (360 km3) (right bar in Fig. 2) with a high DPR of 0.74, contributing to precipitation in the other 30 provinces to varying extents (0.2 to 95 mm). Similarly, the green water from the southern provinces is affected by the Indian monsoon (southwestern monsoon), which drives green water flow northeastward. With a substantial volume of green water, these southern provinces contribute significantly to domestic precipitation. In contrast, green water from the eastern coastal or northwestern border provinces goes to the northwest, primarily attributed to the East Asian monsoon (southeastern monsoon) (Cai et al., 2010). As a result, most evaporationsheds lying outside China generate less domestic precipitation but more outside the country, resulting in a lower DPR, such as for Fujian (DPR 0.31) and Heilongjiang (DPR 0.23). The northern provinces are influenced by westerly winds and winter monsoon from Siberia (Sun et al., 2012), causing predominantly southeastward flow of green water. However, the evaporationsheds of these provinces mainly cover the Pacific Ocean, resulting in a relatively low DPR despite their substantial volume of exported green water. While some inland provinces have a high DPR because their evaporationsheds overlap with mainland China, the low green water volume (Fig. A4) limits their domestic precipitation contributions (e.g., Gansu and Ningxia with DPRs of 0.72 and 0.66, respectively).
Furthermore, precipitation in sink provinces originates from both domestic and foreign green water sources. Sichuan (337 km3), Xizang (298 km3), and Qinghai (203 km3) are the top three provinces importing the largest volume of green water from domestic sources due to the large ET from themselves and their neighboring provinces (top bar of Fig. 2). To quantify the relative importance of domestic sources, we defined the domestic source ratio (DSR) in each province as the sum of the precipitation contribution from domestic sources divided by the total precipitation (Fig. A2b). DSR is related to each province's precipitationshed (i.e., the upwind region contributing evaporation to a specific location's precipitation) (Keys et al., 2014) and the included domestic green water exporters. The highest DSRs found in Qinghai (0.86) and Ningxia (0.82) are because their precipitationsheds include large domestic green water exporters like Xinjiang and Xizang, which supply considerable green water traveling eastward. Conversely, Hainan (0.07) and Guangdong (0.14) in coastal areas have lower DSRs because their precipitationsheds are primarily located in oceans and other countries due to the influence of the summer monsoon (Cai et al., 2010).
3.2 Socioeconomic values embodied in interprovincial green water flows
Source provinces export green water and create precipitation in sink provinces through moisture recycling processes, recharging water resources and sustaining the socioeconomic development of downwind sink provinces (Fig. 4). The reliance of socioeconomic activities in sink provinces on green water supply from source provinces implies that the green water and social economy are intertwined through the interprovincial green water flow network, indicating a teleconnection between source and sink provinces.
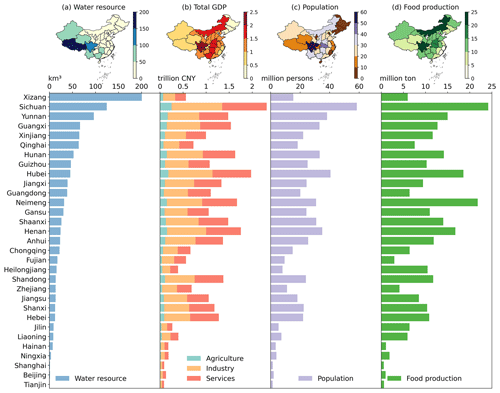
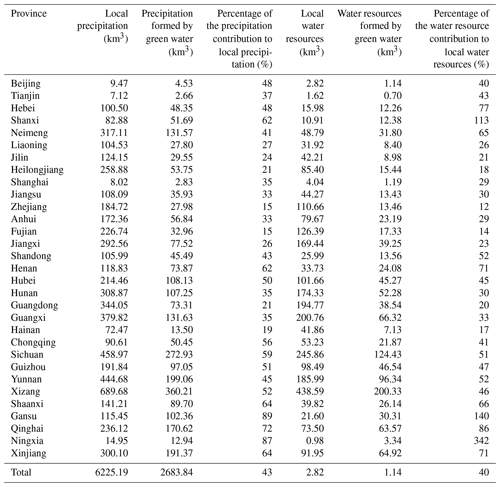
Our assessment of the contribution of green water to water resources indicates that green water from the western provinces recharges the highest volume of water resources. Xizang (200 km3), Sichuan (124 km3), and Yunnan (96 km3) are the top three contributors of water resources, whose green water export makes up 46 %, 51 %, and 52 %, respectively, of their own total water resources (Table A1). These regions also correspond to the top contributors to domestic precipitation, owing to the close linkage between precipitation and water resources. Although the southern and eastern provinces are rich in water resources due to their wet climate, most of their green water contributes to water resources outside China or to the ocean since they are situated downwind of the prevailing westerlies and next to the coast (e.g., Guangdong). In total, green water exported from the 31 provinces contributes 43 % and 40 % of precipitation and water resources in China (Table A1).
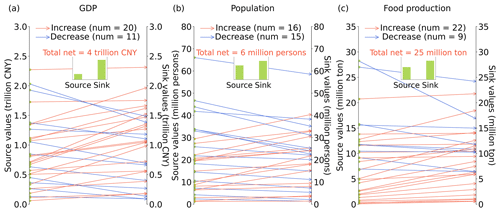
Figure 5Changes in socioeconomic values embodied in green water flow from source to sink provinces for GDP (a), population (b), and food production (c). Thin arrows of different colors represent the socioeconomic value increase (in red) or decrease (in blue) from source to sink provinces. Green bars represent the total socioeconomic value in China's 31 provinces.
The GDP, population, and food production embodied in green water export from source provinces are shown in Fig. 5b–d, which reflects how much the social economy of downwind sink provinces is supported by green water of source provinces. Overall, the contribution of green water to selected socioeconomic statistics shows similar rankings because the food production and agriculture GDP (R = 0.79) is spatially correlated with the population and total GDP (R = 0.85) (Fig. A6).
The sectoral GDP embodied in green water from source provinces is closely related to the industrial structure in sink provinces. The embodied industry and service sector GDP values across the provinces are relatively comparable, whereas the embodied agricultural GDP values are lower due to the low percentage of agricultural output in the total GDP (Fig. A3).
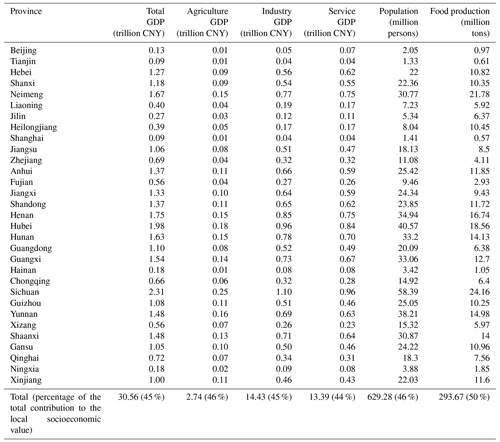
Green water from the southwestern and central provinces (e.g., Sichuan, Hubei, or Henan) embodies the highest GDP, population, and food production because of the large economic volume of these provinces and their neighboring regions as well as the high DPR. Specifically, green water from Sichuan supports the highest GDP (CNY 2.31 trillion), population (58 million persons), and food production (24 million tons) (Table A2) because Sichuan has a high GDP, population, and food production (Fig. A3). Moreover, green water from Sichuan contributes significantly to its own precipitation (30 %), and 87 % of its green water generates domestic precipitation. These factors together make green water in provinces like Sichuan embody the highest socioeconomic values.
Provinces that export large volumes of green water and have high DPRs do not necessarily embody more socioeconomic values if sink provinces that import their green water are less developed. Xizang is the largest green water exporter and the largest contributor of water resources (200 km3) but ranks low in embodied GDP (CNY 0.56 trillion, 23rd), population (15 million, 20th), and food production (5.97 million tons, 23rd) because the primary importers of its green water, such as Xizang and Qinghai, have low rankings in GDP (31st and 30th), population (31st and 30th), and food production (30th and 29th).
Green water from highly developed provinces (e.g., in southeastern China) may not necessarily embody high socioeconomic value if it has a low DPR. For example, Guangdong ranks 1st in GDP and population and 17th in food production but only has a small fraction of green water contributing to domestic precipitation (DPR 0.4). The limited domestic precipitation contribution results in low rankings of embodied socioeconomic values (14th for GDP, 17th for population, and 21st for food production) for Guangdong.
3.3 Changing socioeconomic values of green water flows
The substantial socioeconomic values embodied in interprovincial green water flows highlight the teleconnection of green water from source provinces and the social economy in sink provinces, including economy, population, and food production. Due to different socioeconomic statuses, the same amount of consumed water resources, which are recharged by green water, would sustain different socioeconomic values between source and sink provinces. Therefore, the socioeconomic values embodied in green water flow would change when traveling from source to sink provinces. As shown in Fig. 5, the socioeconomic values embodied in green water flow increase from source to sink provinces by CNY 4 trillion for GDP, 6 million for population, and 25 million tons for food production, respectively. The increase in the embodied GDP, population, and food production is observed in 20, 16, and 22 source provinces from a total of 31. This indicates that green water tends to flow from less to more developed provinces, sustaining more economic production, population, and food production per unit of green water. The largest economic output value increases are in Guangxi (CNY +0.83 trillion, 54 %). Xinjiang has the most added value in population (+13 million persons, 59 %) and food production (+7 million tons, 60 %) because its green water flows to more developed provinces (Fig. A5). In contrast, decreased socioeconomic values of green water flow are also observed. Shandong, Shaanxi, and Henan have the largest depreciation in green water values for GDP (CNY −0.66 trillion, 48 %), population (−13 million persons, 42 %), and food production (−12 million tons, 72 %) (Fig. A5) because their green water flows to provinces with lower socioeconomic values.
The changing socioeconomic values of green water flow reflect the regional disparity in socioeconomic statuses between source and sink provinces. The exported green water for more than half of the source provinces in China (> 15) has increased socioeconomic values when reaching sink provinces. This shows that green water from less developed provinces effectively supports the higher socioeconomic status of developed provinces through the interprovincial flow network. Therefore, these provinces are vitally important green water providers for developed areas. This teleconnection of green water and social economy substantiates that changing land use in the source provinces that affect evapotranspiration is likely to influence water resource availability and socioeconomic development in the sink provinces (Dias et al., 2015; Weng et al., 2018). Hence, it is imperative to account for “invisible” green water flow and its cascade effect in large-scale water resource management.
This study quantified the interprovincial green water flows in China using a moisture recycling framework and a moisture tracking model. The green water flow is established by transporting evaporated moisture by atmospheric winds from a source province to precipitate in a sink province. The transferred green water exchanges among multiple provinces and creates an interprovincial flow network. The location of the source province and its flow direction largely determine to what extent green water forming precipitation is retained within China. In our estimation, roughly 43 % of green water forms precipitation in China, similar to the 44 % of PRRs identified by Rockström et al. (2023). The average direction of all interprovincial green water flows in China is from southwest to northeast, which is consistent with the findings of Xie et al. (2024).
Green water flow can fill the gap of inadequate consideration of land–atmosphere feedback in the traditional water resource management framework (Keys et al., 2017). Typically, water resource management only considers blue water changes while neglecting green water flow, even though the latter may compensate for the former (Hoek van Dijke et al., 2022). Human activities such as irrigation (Su et al., 2021), afforestation (Li et al., 2018), and reservoir construction (Biemans et al., 2011; Veldkamp et al., 2017) in upstream regions may markedly change blue water accessibility in downstream regions. Meanwhile, the resulting increases in ET in upstream regions (McDermid et al., 2023; Qin, 2021; Shao et al., 2019) might offset the decline in water resources in the downstream by moisture recycling. Similarly, increased vegetation coverage intercepts more rainfall, reducing runoff and consequently diminishing water resource availability (Sun et al., 2006; Zhou et al., 2015a), but the rise in ET may compensate for local and downwind water availability through increased green water flows (Wang et al., 2023a; Zhang et al., 2021). Therefore, green water is an essential path of climatic and hydrological interaction between different regions, providing a new angle for integrated regional resource management (Keys et al., 2018; te Wierik et al., 2021). A comprehensive impact assessment of regional water security and optimization would benefit from combining blue and green water flows (Schyns et al., 2019) by which upstream or upwind regions jointly affect regional water resource availability (Creed et al., 2019).
With the recognition of the teleconnected effects of green water flows, maintaining regional water security requires both rational utilization of local water resources and appropriate land management in the upwind source regions. However, similar to blue water, water resource management across administrative boundaries has always been challenging due to the conflicting interests of different regions (Rockström et al., 2023). The diverse strategies developed to enhance regional coordination of blue water management serve as a reference for green water management, such as the interbasin water transfer or downstream beneficiaries paying upstream providers for clean-water services (Farley and Costanza, 2010; Pissarra et al., 2021; Sheng and Webber, 2021). However, unlike blue water resources with well-established accounting and valuation methods, green water monitoring and valuation are challenging. Green water from a specific region flows to multiple regions, and the received green water can subsequently re-evaporate and flow to other regions (Zemp et al., 2014). This interconnected network and cascade complicate the quantification of how much green water from a source region contributes to human activities in sink regions. More importantly, it is difficult to measure green water flow through observations in a way similar to those measurements made by hydrologic stations for blue water (Hu et al., 2023; Sheng and Webber, 2021). This study utilized a dataset from a moisture-tracking model to construct an interprovincial green water flow within China, which offers valuable insights for understanding the quantity of green water flow.
Due to the complex dynamics of the green water flow and the limitations of the moisture-tracking model, there are still major uncertainties in the data and methods of this study. First, the ET and precipitation datasets driving the UTrack model affect the tracked trajectories and magnitude of the moisture flow. The resulting moisture trajectory is expressed as the ET-to-P fraction, and the exact amount of moisture is restored by the ET and precipitation datasets chosen by users. Different ET and precipitation datasets could lead to different precipitation contributions and PRRs (Li et al., 2023). We used the ERA5 dataset to remain consistent with the original UTrack model. It is noted that the non-closure of the hydrological balance from ERA5 (De Petrillo et al., 2024) and the divergence in moisture-tracking models (e.g., simplifications and assumptions) also add uncertainty and impact the accuracy of the tracked green water flow (Tuinenburg and Staal, 2020; Zhang et al., 2023b). Moreover, the resulting moisture trajectory data only represent the climatologically mean moisture trajectories and ET (Li et al., 2023), neglecting the interannual variabilities in the moisture flow trajectory, e.g., those induced by the influence of extreme weather events or El Niño–Southern Oscillation (ENSO) (Zhao and Zhou, 2021). The interannual variations in green water flow may affect the DPRs and DSRs in some provinces. Human adaptation tends to buffer the impacts of interannual variations on the social economy through water resource management such as reservoirs, dams, and other infrastructures. Accounting for interannual variations in green water flows and their socioeconomic contributions is worth further investigation. Secondly, the socioeconomic value assessment of green water in this study only considers green water flows within China, excluding flows moving abroad and to the ocean that may embody socioeconomic values beyond the territory of mainland China. We mainly attribute socioeconomic values to green water and generated precipitation because precipitation is the ultimate water source for recharging the surface water and groundwater of a region. Strictly speaking, such attribution needs to be more precise because the social economy also utilizes streamflow from upstream areas, which deserve separate attention.
Moreover, the interactions between blue and green water increase the complexity when evaluating green water's socioeconomic contribution. For example, the blue water extracted by irrigation increases ET in the source region, providing more moisture for downwind regions (Yang et al., 2019). Simultaneously, most of the blue water for local irrigation comes from the green water of upwind regions (McDermid et al., 2023). In addition, not all water resources replenished by green-water-induced precipitation are accessible for human activities since some of them are used by the natural ecosystem (Keys et al., 2019). Therefore, it is necessary to distinguish between water sources and consumption to account for green water values more accurately. Despite the selected socioeconomic indicators being closely linked to water resources, green water flows' socioeconomic contribution can manifest itself in other aspects such as livestock production and irrigated agriculture. In future studies, the dynamic linkage between green water, water resources, and economic development can be assessed annually by using a long-term moisture-tracking dataset with a separation of water sources consumed by the social economy (surface water and groundwater). Nevertheless, our assessment serves as a useful first step in demonstrating the importance of the teleconnected green water flow in addition to blue water. Our attempts to quantify the social economy embodied in green water flow fill the gap in green water value assessment and provide a methodological reference for green water management.
This study quantified interprovincial green water flows in China and their teleconnected effects on the social economy. Green water exchanges between different regions effectively form a complex flow network and embody socioeconomic values. The interprovincial green water in China flows primarily from west to east and to a lesser extent from south to north, influenced by the co-control of westerlies and monsoons. The western provinces have significant contributions to precipitation and water resources in China, while the southwestern and central provinces have the highest socioeconomic values regarding GDP, population, and food production. Green water flowing from less developed regions supports substantial socioeconomic values in more affluent regions due to disparities in socioeconomic development between source and sink regions. Given the embodied socioeconomic benefits of green water, regional water resource management should consider water flow beyond blue water to integrate green water for more comprehensive and effective management of resources and security. Our study provides a reference for understanding the invisible green water flow and its teleconnected benefits.
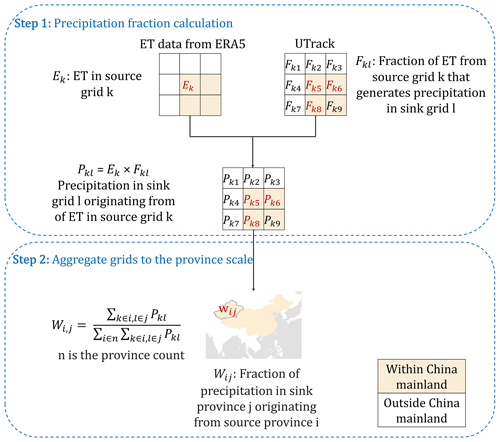
Figure A1Workflow for estimating green water flow. Step 1: calculate precipitation in sink grids originating from ET in source grids. Step 2: calculate the fraction of precipitation in sink provinces originating from source provinces.
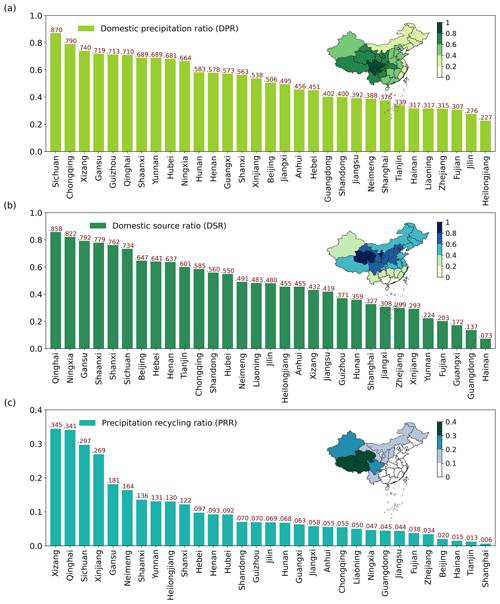
Figure A2(a) The domestic precipitation ratio (DPR), (b) the domestic source ratio (DSR), and (c) the precipitation recycling ratio (PRR) in each province.
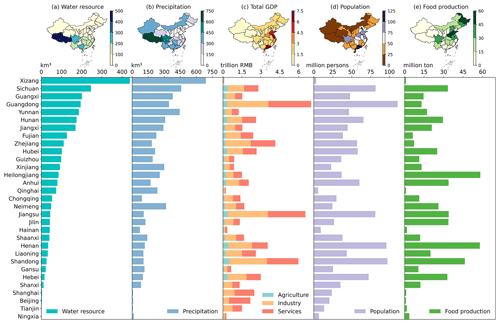
Figure A3The water resources (a), precipitation (b), GDP (c), population (d), and food production (e) in each province.
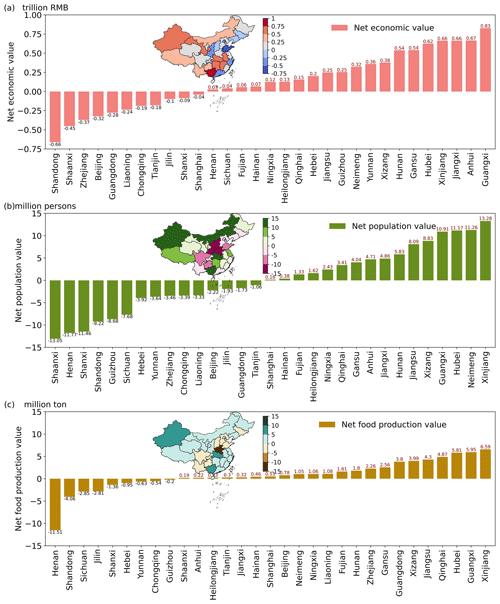
Figure A5Net GDP (a), population (b), and food production (c) values of green water flow in each source province to sink provinces. Positive values represent those socioeconomic values of water resources formed by green water increase by flow from source to sink provinces. Negative values represent those socioeconomic values of water resources formed by green water decrease by flow.
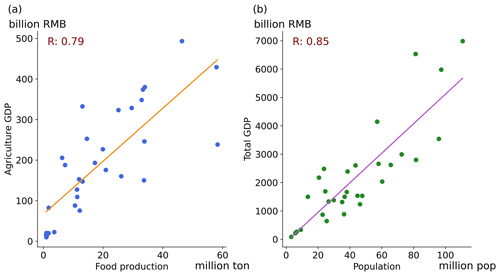
Figure A6Spatial Pearson correlation coefficient between the agricultural GDP and food production (a) and the population and total GDP (b) across the provinces of China.
Table A1Precipitation, water resources, and the contribution from green water in the provinces of China.
The moisture trajectory dataset is available at https://doi.org/10.1594/PANGAEA.912710 (Tuinenburg et al., 2020b). The evapotranspiration data from the ERA5 reanalysis dataset are available at https://doi.org/10.24381/CDS.F17050D7 (Hersbach et al., 2023). The socioeconomic statistics data are available from the China Statistical Yearbook (https://data.stats.gov.cn/index.htm, China State Statistical Bureau, 2024). The Python codes and data used in this study are available from Zenodo (https://doi.org/10.5281/zenodo.14533949, Sang and Li, 2024).
YL and SS conceived the study and performed the data analysis. SS and YL wrote the manuscript with contributions by CH, SZ, and HL.
The contact author has declared that none of the authors has any competing interests.
Publisher's note: Copernicus Publications remains neutral with regard to jurisdictional claims made in the text, published maps, institutional affiliations, or any other geographical representation in this paper. While Copernicus Publications makes every effort to include appropriate place names, the final responsibility lies with the authors. Regarding the maps used in this paper, please note that Figs. 3, 4, and A2–A5 contain disputed territories.
We thank the anonymous referees for their constructive review, which improved the quality of this paper.
This research was funded by the National Natural Science Foundation of China (grant no. 42041007), the Second Tibetan Plateau Scientific Expedition and Research Program (grant no. 2019QZKK0405), and the Fundamental Research Funds for the Central Universities.
This paper was edited by Hongkai Gao and reviewed by three anonymous referees.
Aragão, L. E. O. C.: The rainforest's water pump, Nature, 489, 217–218, https://doi.org/10.1038/nature11485, 2012.
Bagley, J. E., Desai, A. R., Dirmeyer, P. A., and Foley, J. A.: Effects of land cover change on moisture availability and potential crop yield in the world's breadbaskets, Environ. Res. Lett., 7, 014009, https://doi.org/10.1088/1748-9326/7/1/014009, 2012.
Biemans, H., Haddeland, I., Kabat, P., Ludwig, F., Hutjes, R. W. A., Heinke, J., Bloh, W. von, and Gerten, D.: Impact of reservoirs on river discharge and irrigation water supply during the 20th century, Water Resour. Res., 47, W03509, https://doi.org/10.1029/2009WR008929, 2011.
Bridges, J. D., Tarduno, J. A., Cottrell, R. D., and Herbert, T. D.: Rapid strengthening of westerlies accompanied intensification of Northern Hemisphere glaciation, Nat. Commun., 14, 3905, https://doi.org/10.1038/s41467-023-39557-4, 2023.
Cai, Y., Tan, L., Cheng, H., An, Z., Edwards, R. L., Kelly, M. J., Kong, X., and Wang, X.: The variation of summer monsoon precipitation in central China since the last deglaciation, Earth Pl. Sc. Lett., 291, 21–31, https://doi.org/10.1016/j.epsl.2009.12.039, 2010.
China State Statistical Bureau: China Statistical Yearbook [data set], https://data.stats.gov.cn/index.htm, last access: 20 December 2024.
Creed, I. F., Jones, J. A., Archer, E., Claassen, M., Ellison, D., McNulty, S. G., van Noordwijk, M., Vira, B., Wei, X., Bishop, K., Blanco, J. A., Gush, M., Gyawali, D., Jobbágy, E., Lara, A., Little, C., Martin-Ortega, J., Mukherji, A., Murdiyarso, D., Pol, P. O., Sullivan, C. A., and Xu, J.: Managing Forests for Both Downstream and Downwind Water, Front. For. Glob. Change, 2, 64, https://doi.org/10.3389/ffgc.2019.00064, 2019.
Cui, J., Lian, X., Huntingford, C., Gimeno, L., Wang, T., Ding, J., He, M., Xu, H., Chen, A., Gentine, P., and Piao, S.: Global water availability boosted by vegetation-driven changes in atmospheric moisture transport, Nat. Geosci., 15, 982–988, https://doi.org/10.1038/s41561-022-01061-7, 2022.
De Petrillo, E., Fahrländer, S., Tuninetti, M., Andersen, L. S., Monaco, L., Ridolfi, L., and Laio, F.: Reconciling tracked atmospheric water flows to close the global freshwater cycle, Research Square [preprint], https://doi.org/10.21203/rs.3.rs-4177311/v2, 30 April 2024.
Dias, L. C. P., Macedo, M. N., Costa, M. H., Coe, M. T., and Neill, C.: Effects of land cover change on evapotranspiration and streamflow of small catchments in the Upper Xingu River Basin, Central Brazil, Journal of Hydrology: Regional Studies, 4, 108–122, https://doi.org/10.1016/j.ejrh.2015.05.010, 2015.
Döll, P., Fiedler, K., and Zhang, J.: Global-scale analysis of river flow alterations due to water withdrawals and reservoirs, Hydrol. Earth Syst. Sci., 13, 2413–2432, https://doi.org/10.5194/hess-13-2413-2009, 2009.
Ent, R. J. van der and Savenije, H. H. G.: Oceanic sources of continental precipitation and the correlation with sea surface temperature, Water Resour. Res., 49, 3993–4004, https://doi.org/10.1002/wrcr.20296, 2013.
Falkenmark, M. and Rockström, J.: The New Blue and Green Water Paradigm: Breaking New Ground for Water Resources Planning and Management, J. Water Res. Pl., 132, 129–132, https://doi.org/10.1061/(ASCE)0733-9496(2006)132:3(129), 2006.
Farley, J. and Costanza, R.: Payments for ecosystem services: From local to global, Ecol. Econ., 69, 2060–2068, https://doi.org/10.1016/j.ecolecon.2010.06.010, 2010.
Gleeson, T., Wang-Erlandsson, L., Zipper, S. C., Porkka, M., Jaramillo, F., Gerten, D., Fetzer, I., Cornell, S. E., Piemontese, L., Gordon, L. J., Rockström, J., Oki, T., Sivapalan, M., Wada, Y., Brauman, K. A., Flörke, M., Bierkens, M. F. P., Lehner, B., Keys, P., Kummu, M., Wagener, T., Dadson, S., Troy, T. J., Steffen, W., Falkenmark, M., and Famiglietti, J. S.: The Water Planetary Boundary: Interrogation and Revision, One Earth, 2, 223–234, https://doi.org/10.1016/j.oneear.2020.02.009, 2020.
Green, P. A., Vörösmarty, C. J., Harrison, I., Farrell, T., Sáenz, L., and Fekete, B. M.: Freshwater ecosystem services supporting humans: Pivoting from water crisis to water solutions, Global Environ. Change, 34, 108–118, https://doi.org/10.1016/j.gloenvcha.2015.06.007, 2015.
Hersbach, H., Bell, B., Berrisford, P., Biavati, G., Horányi, A., Muñoz Sabater, J., Nicolas, J., Peubey, C., Radu, R., Rozum, I., Schepers, D., Simmons, A., Soci, C., Dee, D., and Thépaut, J.-N.: ERA5 monthly averaged data on single levels from 1940 to present, Copernicus Climate Change Service (C3S) Climate Data Store (CDS) [data set], https://doi.org/10.24381/CDS.F17050D7, 2023.
Hoek van Dijke, A. J., Herold, M., Mallick, K., Benedict, I., Machwitz, M., Schlerf, M., Pranindita, A., Theeuwen, J. J. E., Bastin, J.-F., and Teuling, A. J.: Shifts in regional water availability due to global tree restoration, Nat. Geosci., 15, 363–368, https://doi.org/10.1038/s41561-022-00935-0, 2022.
Hu, H., Tian, G., Wu, Z., and Xia, Q.: Cross-regional ecological compensation under the composite index of water quality and quantity: A case study of the Yellow River Basin, Environ. Res., 238, 117152, https://doi.org/10.1016/j.envres.2023.117152, 2023.
Keys, P. W. and Wang-Erlandsson, L.: On the social dynamics of moisture recycling, Earth Syst. Dynam., 9, 829–847, https://doi.org/10.5194/esd-9-829-2018, 2018.
Keys, P. W., van der Ent, R. J., Gordon, L. J., Hoff, H., Nikoli, R., and Savenije, H. H. G.: Analyzing precipitationsheds to understand the vulnerability of rainfall dependent regions, Biogeosciences, 9, 733–746, https://doi.org/10.5194/bg-9-733-2012, 2012.
Keys, P. W., Barnes, E. A., van der Ent, R. J., and Gordon, L. J.: Variability of moisture recycling using a precipitationshed framework, Hydrol. Earth Syst. Sci., 18, 3937–3950, https://doi.org/10.5194/hess-18-3937-2014, 2014.
Keys, P. W., Wang-Erlandsson, L., Gordon, L. J., Galaz, V., and Ebbesson, J.: Approaching moisture recycling governance, Global Environ. Change, 45, 15–23, https://doi.org/10.1016/j.gloenvcha.2017.04.007, 2017.
Keys, P. W., Wang-Erlandsson, L., and Gordon, L. J.: Megacity precipitationsheds reveal tele-connected water security challenges, PLOS ONE, 13, e0194311, https://doi.org/10.1371/journal.pone.0194311, 2018.
Keys, P. W., Porkka, M., Wang-Erlandsson, L., Fetzer, I., Gleeson, T., and Gordon, L. J.: Invisible water security: Moisture recycling and water resilience, Water Security, 8, 100046, https://doi.org/10.1016/j.wasec.2019.100046, 2019.
Lawrence, D. and Vandecar, K.: Effects of tropical deforestation on climate and agriculture, Nat. Clim. Change, 5, 27–36, https://doi.org/10.1038/nclimate2430, 2015.
Li, Y., Piao, S., Li, L. Z. X., Chen, A., Wang, X., Ciais, P., Huang, L., Lian, X., Peng, S., Zeng, Z., Wang, K., and Zhou, L.: Divergent hydrological response to large-scale afforestation and vegetation greening in China, Science Advances, 4, eaar4182, https://doi.org/10.1126/sciadv.aar4182, 2018.
Li, Y., Xu, R., Yang, K., Liu, Y., Wang, S., Zhou, S., Yang, Z., Feng, X., He, C., Xu, Z., and Zhao, W.: Contribution of Tibetan Plateau ecosystems to local and remote precipitation through moisture recycling, Glob. Change Biol., 29, 702–718, https://doi.org/10.1111/gcb.16495, 2023.
Li, Y., Xu, R., Yang, Z., Zhou, S., Lu, M., Lin, H., Zi, S., and Su, R.: Upwind Moisture Controls on Interannual Variations of Precipitation and Vegetation in China's Drylands, Geophys. Res. Lett., 51, e2024GL110997, https://doi.org/10.1029/2024GL110997, 2024.
McDermid, S., Nocco, M., Lawston-Parker, P., Keune, J., Pokhrel, Y., Jain, M., Jägermeyr, J., Brocca, L., Massari, C., Jones, A. D., Vahmani, P., Thiery, W., Yao, Y., Bell, A., Chen, L., Dorigo, W., Hanasaki, N., Jasechko, S., Lo, M.-H., Mahmood, R., Mishra, V., Mueller, N. D., Niyogi, D., Rabin, S. S., Sloat, L., Wada, Y., Zappa, L., Chen, F., Cook, B. I., Kim, H., Lombardozzi, D., Polcher, J., Ryu, D., Santanello, J., Satoh, Y., Seneviratne, S., Singh, D., and Yokohata, T.: Irrigation in the Earth system, Nat. Rev. Earth Environ., 4, 435–453, https://doi.org/10.1038/s43017-023-00438-5, 2023.
Munia, H., Guillaume, J. H. A., Mirumachi, N., Porkka, M., Wada, Y., and Kummu, M.: Water stress in global transboundary river basins: significance of upstream water use on downstream stress, Environ. Res. Lett., 11, 014002, https://doi.org/10.1088/1748-9326/11/1/014002, 2016.
O'Connor, J. C., Dekker, S. C., Staal, A., Tuinenburg, O. A., Rebel, K. T., and Santos, M. J.: Forests buffer against variations in precipitation, Glob. Change Biol., 27, 4686–4696, https://doi.org/10.1111/gcb.15763, 2021.
Pissarra, T. C. T., Sanches Fernandes, L. F., and Pacheco, F. A. L.: Production of clean water in agriculture headwater catchments: A model based on the payment for environmental services, Science of The Total Environment, 785, 147331, https://doi.org/10.1016/j.scitotenv.2021.147331, 2021.
Pranindita, A., Wang-Erlandsson, L., Fetzer, I., and Teuling, A. J.: Moisture recycling and the potential role of forests as moisture source during European heatwaves, Clim. Dynam., 58, 609–624, https://doi.org/10.1007/s00382-021-05921-7, 2022.
Qin, Y.: Global competing water uses for food and energy, Environ. Res. Lett., 16, 064091, https://doi.org/10.1088/1748-9326/ac06fa, 2021.
Rockström, J., Mazzucato, M., Andersen, L. S., Fahrländer, S. F., and Gerten, D.: Why we need a new economics of water as a common good, Nature, 615, 794–797, https://doi.org/10.1038/d41586-023-00800-z, 2023.
Sang, S. and Li, Y.: The interprovincial green water flow in China and its teleconnected effects on the social economy, Zenodo [code], https://doi.org/10.5281/zenodo.14533949, 2024.
Schyns, J. F., Hoekstra, A. Y., Booij, M. J., Hogeboom, R. J., and Mekonnen, M. M.: Limits to the world's green water resources for food, feed, fiber, timber, and bioenergy, P. Natl. Acad. Sci. USA, 116, 4893–4898, https://doi.org/10.1073/pnas.1817380116, 2019.
Shao, R., Zhang, B., Su, T., Long, B., Cheng, L., Xue, Y., and Yang, W.: Estimating the Increase in Regional Evaporative Water Consumption as a Result of Vegetation Restoration Over the Loess Plateau, China, J. Geophys. Res.-Atmos., 124, 11783–11802, https://doi.org/10.1029/2019JD031295, 2019.
Sheng, J. and Webber, M.: Incentive coordination for transboundary water pollution control: The case of the middle route of China's South-North water Transfer Project, J. Hydrol., 598, 125705, https://doi.org/10.1016/j.jhydrol.2020.125705, 2021.
Staal, A., Koren, G., Tejada, G., and Gatti, L. V.: Moisture origins of the Amazon carbon source region, Environ. Res. Lett., 18, 044027, https://doi.org/10.1088/1748-9326/acc676, 2023.
Su, Y., Li, X., Feng, M., Nian, Y., Huang, L., Xie, T., Zhang, K., Chen, F., Huang, W., Chen, J., and Chen, F.: High agricultural water consumption led to the continued shrinkage of the Aral Sea during 1992–2015, Sci. Total Environ., 777, 145993, https://doi.org/10.1016/j.scitotenv.2021.145993, 2021.
Sun, G., Zhou, G., Zhang, Z., Wei, X., McNulty, S. G., and Vose, J. M.: Potential water yield reduction due to forestation across China, J. Hydrol., 328, 548–558, https://doi.org/10.1016/j.jhydrol.2005.12.013, 2006.
Sun, Y., Clemens, S. C., Morrill, C., Lin, X., Wang, X., and An, Z.: Influence of Atlantic meridional overturning circulation on the East Asian winter monsoon, Nat. Geosci., 5, 46–49, https://doi.org/10.1038/ngeo1326, 2012.
te Wierik, S. A., Cammeraat, E. L. H., Gupta, J., and Artzy-Randrup, Y. A.: Reviewing the Impact of Land Use and Land-Use Change on Moisture Recycling and Precipitation Patterns, Water Resour. Res., 57, e2020WR029234, https://doi.org/10.1029/2020WR029234, 2021.
Theeuwen, J. J. E., Staal, A., Tuinenburg, O. A., Hamelers, B. V. M., and Dekker, S. C.: Local moisture recycling across the globe, Hydrol. Earth Syst. Sci., 27, 1457–1476, https://doi.org/10.5194/hess-27-1457-2023, 2023.
Tian, B. and Fan, K.: Factors favorable to frequent extreme precipitation in the upper Yangtze River Valley, Meteorol. Atmos. Phys., 121, 189–197, https://doi.org/10.1007/s00703-013-0261-9, 2013.
Tuinenburg, O. A. and Staal, A.: Tracking the global flows of atmospheric moisture and associated uncertainties, Hydrol. Earth Syst. Sci., 24, 2419–2435, https://doi.org/10.5194/hess-24-2419-2020, 2020.
Tuinenburg, O. A., Theeuwen, J. J. E., and Staal, A.: High-resolution global atmospheric moisture connections from evaporation to precipitation, Earth Syst. Sci. Data, 12, 3177–3188, https://doi.org/10.5194/essd-12-3177-2020, 2020a.
Tuinenburg, O., Theeuwen, J. J. E., and Staal, A.: Global evaporation to precipitation flows obtained with Lagrangian atmospheric moisture tracking, PANGAEA [data set], https://doi.org/10.1594/PANGAEA.912710, last access: 20 December 2020b.
van der Ent, R. J., Savenije, H. H. G., Schaefli, B., and Steele-Dunne, S. C.: Origin and fate of atmospheric moisture over continents, Water Resour. Res., 46, W09525, https://doi.org/10.1029/2010WR009127, 2010.
Varis, O. and Vakkilainen, P.: China's 8 challenges to water resources management in the first quarter of the 21st Century, Geomorphology, 41, 93–104, https://doi.org/10.1016/S0169-555X(01)00107-6, 2001.
Veldkamp, T. I. E., Wada, Y., Aerts, J. C. J. H., Döll, P., Gosling, S. N., Liu, J., Masaki, Y., Oki, T., Ostberg, S., Pokhrel, Y., Satoh, Y., Kim, H., and Ward, P. J.: Water scarcity hotspots travel downstream due to human interventions in the 20th and 21st century, Nat. Commun., 8, 15697, https://doi.org/10.1038/ncomms15697, 2017.
Viviroli, D., Kummu, M., Meybeck, M., Kallio, M., and Wada, Y.: Increasing dependence of lowland populations on mountain water resources, Nat. Sustain., 3, 917–928, https://doi.org/10.1038/s41893-020-0559-9, 2020.
Wang, S., Fu, B., Liang, W., Liu, Y., and Wang, Y.: Driving forces of changes in the water and sediment relationship in the Yellow River, Sci. Total Environ., 576, 453–461, https://doi.org/10.1016/j.scitotenv.2016.10.124, 2017.
Wang, X., Zhang, Z., Zhang, B., Tian, L., Tian, J., Arnault, J., Kunstmann, H., and He, C.: Quantifying the Impact of Land Use and Land Cover Change on Moisture Recycling With Convection-Permitting WRF-Tagging Modeling in the Agro-Pastoral Ecotone of Northern China, J. Geophys. Res.-Atmos., 128, e2022JD038421, https://doi.org/10.1029/2022JD038421, 2023a.
Wang, Y., Liu, X., Zhang, D., and Bai, P.: Tracking Moisture Sources of Precipitation Over China, J. Geophys. Res.-Atmos., 128, e2023JD039106, https://doi.org/10.1029/2023JD039106, 2023b.
Wang-Erlandsson, L., Fetzer, I., Keys, P. W., van der Ent, R. J., Savenije, H. H. G., and Gordon, L. J.: Remote land use impacts on river flows through atmospheric teleconnections, Hydrol. Earth Syst. Sci., 22, 4311–4328, https://doi.org/10.5194/hess-22-4311-2018, 2018.
Wang-Erlandsson, L., Tobian, A., van der Ent, R. J., Fetzer, I., te Wierik, S., Porkka, M., Staal, A., Jaramillo, F., Dahlmann, H., Singh, C., Greve, P., Gerten, D., Keys, P. W., Gleeson, T., Cornell, S. E., Steffen, W., Bai, X., and Rockström, J.: A planetary boundary for green water, Nat. Rev. Earth Environ., 3, 380–392, https://doi.org/10.1038/s43017-022-00287-8, 2022.
Wei, F., Wang, S., Fu, B., Li, Y., Huang, Y., Zhang, W., and Fensholt, R.: Quantifying the precipitation supply of China's drylands through moisture recycling, Agr. Forest Meteorol., 352, 110034, https://doi.org/10.1016/j.agrformet.2024.110034, 2024.
Weng, W., Luedeke, M. K. B., Zemp, D. C., Lakes, T., and Kropp, J. P.: Aerial and surface rivers: downwind impacts on water availability from land use changes in Amazonia, Hydrol. Earth Syst. Sci., 22, 911–927, https://doi.org/10.5194/hess-22-911-2018, 2018.
Wu, B. and Wang, J.: Winter Arctic Oscillation, Siberian High and East Asian Winter Monsoon, Geophys. Res. Lett., 29, 3–1-3–4, https://doi.org/10.1029/2002GL015373, 2002.
Xie, D., Zhang, Y., Zhang, M., Tian, Y., Cao, Y., Mei, Y., Liu, S., and Zhong, D.: Hydrological impacts of vegetation cover change in China through terrestrial moisture recycling, Sci. Total Environ., 915, 170015, https://doi.org/10.1016/j.scitotenv.2024.170015, 2024.
Ya-Feng, Z., Min, D., Ya-Jing, L., and Yao, R.: Evolution characteristics and policy implications of new urbanization in provincial capital cities in Western China, PLOS ONE, 15, e0233555, https://doi.org/10.1371/journal.pone.0233555, 2020.
Yang, Z., Qian, Y., Liu, Y., Berg, L. K., Hu, H., Dominguez, F., Yang, B., Feng, Z., Gustafson Jr, W. I., Huang, M., and Tang, Q.: Irrigation Impact on Water and Energy Cycle During Dry Years Over the United States Using Convection-Permitting WRF and a Dynamical Recycling Model, J. Geophys. Res.-Atmos., 124, 11220–11241, https://doi.org/10.1029/2019JD030524, 2019.
Zemp, D. C., Schleussner, C.-F., Barbosa, H. M. J., van der Ent, R. J., Donges, J. F., Heinke, J., Sampaio, G., and Rammig, A.: On the importance of cascading moisture recycling in South America, Atmos. Chem. Phys., 14, 13337–13359, https://doi.org/10.5194/acp-14-13337-2014, 2014.
Zhang, B., Tian, L., Zhao, X., and Wu, P.: Feedbacks between vegetation restoration and local precipitation over the Loess Plateau in China, Sci. China Earth Sci., 64, 920–931, https://doi.org/10.1007/s11430-020-9751-8, 2021.
Zhang, B., Gao, H., and Wei, J.: Identifying potential hotspots for atmospheric water resource management and source-sink analysis, Chinese Sci. Bull., 68, 2678–2689, https://doi.org/10.1360/TB-2022-1275, 2023a.
Zhang, C., Chen, D., Tang, Q., and Huang, J.: Fate and Changes in Moisture Evaporated From the Tibetan Plateau (2000–2020), Water Resour. Res., 59, e2022WR034165, https://doi.org/10.1029/2022WR034165, 2023b.
Zhang, C., Zhang, X., Tang, Q., Chen, D., Huang, J., Wu, S., and Liu, Y.: Quantifying precipitation moisture contributed by different atmospheric circulations across the Tibetan Plateau, J. Hydrol., 628, 130517, https://doi.org/10.1016/j.jhydrol.2023.130517, 2024.
Zhao, Y. and Zhou, T.: Interannual Variability of Precipitation Recycle Ratio Over the Tibetan Plateau, J. Geophys. Res.-Atmos., 126, e2020JD033733, https://doi.org/10.1029/2020JD033733, 2021.
Zhou, G., Wei, X., Chen, X., Zhou, P., Liu, X., Xiao, Y., Sun, G., Scott, D. F., Zhou, S., Han, L., and Su, Y.: Global pattern for the effect of climate and land cover on water yield, Nat. Commun., 6, 5918, https://doi.org/10.1038/ncomms6918, 2015a.
Zhou, Y., Huang, H. Q., Nanson, G. C., Huang, C., and Liu, G.: Progradation of the Yellow (Huanghe) River delta in response to the implementation of a basin-scale water regulation program, Geomorphology, 243, 65–74, https://doi.org/10.1016/j.geomorph.2015.04.023, 2015b.


