the Creative Commons Attribution 4.0 License.
the Creative Commons Attribution 4.0 License.
 | 21 Nov 2025
Transport behavior displayed by water isotopes and potential implications for assessment of catchment properties
Dan Elhanati
Erwin Zehe
Ishai Dror
Brian Berkowitz
Measurements of water isotopes are used routinely to estimate water transit time distributions and aquifer storage thickness in catchments. Water isotopes (e.g., ) are generally considered to behave identically to water molecules (H2O); they are thus often considered fully representative of water movement and preferred over inert chemical tracers for catchment assessment purposes. However, laboratory-scale measurements presented here show that water isotopes exhibit transport behavior that is essentially identical to that of inert chemical tracers. The very act of tagging water molecules, implicit in the measurement of any water isotope, yields measurements representative of movement as a chemical tracer. The resulting measurements are then interpreted quantitatively, focusing on a comparative assessment of apparent mean water and mean tracer velocities, and the applicability of Fickian and non-Fickian (anomalous) transport models. For both water isotopes and inert chemical tracers, the measured mean tracer velocity is not necessarily equal to the apparent mean water velocity. It is thus critical to recognize this inequality when estimating catchment properties. For example, accounting for anomalous transport of water isotopes can significantly reduce overall estimates of aquifer storage thickness over an entire watershed.
- Article
(1103 KB) - Full-text XML
- BibTeX
- EndNote


River catchments and streamflow play a pivotal role in water resources management (Sivapalan, 2018). A catchment represents a three-dimensional hydrological unit delineated by a watershed boundary, where precipitation is partly stored in the subsurface and partly released as evapotranspiration or runoff components, ultimately feeding streamflow. While the catchment water balance controls generation of streamflow amounts, catchments can be also regarded in analogy to chemical reactors (Grathwohl et al., 2013). Streamflow chemistry and contaminant fate are thus essentially controlled by the interplay of transport velocities and, in the case of reactive species, reaction rates of chemicals traveling through the catchment (Grathwohl et al., 2013; Berkowitz et al., 2016; Sternagel et al., 2021).
Natural catchments comprise inherent structural complexities above and below the land surface, which lead to heterogeneous spatial and temporal distributions of flow velocities. Accurately describing travel times in catchments is thus by no means straightforward (McDonnell et al., 2010). Travel (or transit) time distribution (TTDs) of water, defined as the durations water molecules require to traverse the catchment from rainfall to stream, are often regarded as a key metric for inferring streamflow chemistry (McGlynn et al., 2003; Weiler et al., 2003; Hrachowitz et al., 2013; Rodriguez et al., 2021; Benettin et al., 2022). A water TTD, and in particular the mean of the water TTD (from which one can infer the mean water velocity), is often used, for example, to estimate water storage and aquifer thickness in a catchment. However, it is difficult to uniquely define or determine a water TTD: clearly, one cannot directly measure the velocity of water molecules in an advective field.
More broadly, TTDs, sensu lato – e.g., TTDs of water, chemicals, and momentum – may represent different transport processes, which differ strongly with respect to the underlying mechanism and can also be time-dependent and substance-specific (Rinaldo et al., 2011). A common approach for inferring water TTDs of a catchment involves applying measurements of a tracer pulse transported by the water as input for a transport model. The normalized breakthrough curve of a unit mass input of the tracer thus corresponds to the tracer TTD, reflecting the distribution of fluid velocities and subscale diffusive mixing of tracer molecules between the flow lines (Simmons, 1982; Jury and Sposito, 1986). In this context, models that describe various catchment transport processes are used to estimate water TTDs from tracer breakthrough curves (McGuire and McDonnell, 2006; Bowers et al., 2020; Sternagel et al., 2022; Wienhöfer et al., 2009; McDonnell et al., 2010; Lischeid et al., 2000).
Measurements of any inert chemical tracer transported by the flow of water in a catchment are often assumed to be suitable for inferring water TTDs. Ion tracers such as bromide have been used widely to study anion transport in natural catchments, as they are relatively inexpensive and easy to measure (Levy and Chambers, 1987; Bowman, 1984). Their use has since been expanded to investigate broader aspects of catchment hydrology, including groundwater recharge and evapotranspiration (Chen et al., 2021), and catchment baseflow (Rai and Iqbal, 2015).
However, many studies focus on use of ratios of isotopic tracers of the water molecule itself (i.e., the isotopologues HO, 2H2O, 3H2O), because these molecules are considered to behave identically to H2O and they often enter the catchment naturally through rainfall (McDonnell and Beven, 2014; Rodriguez et al., 2021; Sternagel et al., 2022; Weiler et al., 2003; Aquilina et al., 2006; Koeniger et al., 2010). Moreover, in many catchments subject to chemical transport with relatively high Peclet numbers, conservative chemical tracers exhibit long-tailed breakthrough curves, a non-Fickian behavior that cannot be explained by the traditional advection-dispersion equation (ADE). This behavior, also referred to as anomalous transport, arises from the heterogeneous nature of the porous media through which the tracer plume travels (Berkowitz et al., 2006a). Water isotopes are therefore regarded as an optimal tracer of water, compared to other chemical tracers, as they are assumed to essentially represent water flow and not chemical transport (McGuire and McDonnell, 2006).
The above brief survey highlights the wide range of interpretations and methods related to TTD assessment, particularly to estimates of water TTDs. Motivated by the literature discussed above, the study here focuses on a frequently invoked, key assumption, namely that isotopic tracers of the water molecule itself behave identically to H2O (with only slightly different diffusion coefficients because of slightly different molecular weights) and can therefore be used to infer the true mean water velocity and residence time in a porous domain.
For this purpose, water isotope tracer transport in a critical subset of a full catchment – namely, the fully water-saturated domain – is examined. Breakthrough curves of a water isotope and an inert chemical tracer are measured in macroscopically 1D porous medium columns, which are known to exhibit a non-Fickian transport behavior; the resulting curves are compared and subsequently interpreted quantitatively. A fundamental question is thus studied: What are the implications of using water isotopes as tracers, as compared to inert chemical tracers, in terms of defining a water TTD and its mean, and related catchment properties?
A laboratory-scale experimental setup was constructed to compare the transport behavior of inert chemicals to the transport behavior of water isotopes. This setup aimed to examine flow and transport in a controlled saturated porous medium, allowing the measurement and comparison of the tracer (Br) and a water isotope tracer (water containing a higher ratio than commonly found in nature) in a flow regime which exhibits anomalous transport.
In a previous study, Elhanati et al. (2023) examined the transport behavior of an inert chemical tracer (Gd) in porous medium columns, under time-dependent velocity conditions in a macroscopically 1D flow regime. The same experimental setup was adapted for this study as it consistently showed anomalous transport for different flow rates and porous medium arrangements. The setup consisted of three vertical columns measuring 100 cm in length with an internal radius of 1.4 cm, packed with a fully water-saturated porous medium composed of clean quartz sand grains, and with water and tracer injected from below. First, three effectively (macroscopically) homogeneous porous medium columns (Columns I-III) were packed uniformly with sand having an average grain size of 1.105 mm (mesh size 12/20), and porosity of 0.38. Subsequently, the three columns were cleaned, and each was packed with an alternating pattern of three different sand sizes (Columns IV-VI) to produce a heterogeneous porous medium (Elhanati et al., 2023). Elhanati et al. (2023) reported that both packing configurations (i.e., homogeneous and heterogeneous) displayed long tailing in the Gd breakthrough curves and other behavior indicative of anomalous transport. This study, as well as many previous ones, demonstrates that even pore-scale heterogeneity in macroscopically uniform sand columns, over a range of flow rates and travel distances, can induce non-Fickian transport.
Three solutes were used for this study: (1) NaBr salt, an inert tracer used as a benchmark, with an initial concentration of 10 ppm Br; (2) D2O, with an initial concentration of 10 000 ppm D; (3) A combination of both solutes (NaBr and D2O). Repeating the experiments with a combined solute of D2O enriched water and Br allowed comparison of the resulting breakthrough curves. Although an interaction of the two tracers was not expected, the experiment was repeated with only the D2O for validation. Each experiment was conducted simultaneously in the three columns, starting with a short solute injection before switching to double-distilled water flow for the rest of the experiment. Samples were collected at the column outlets using a fraction collector.
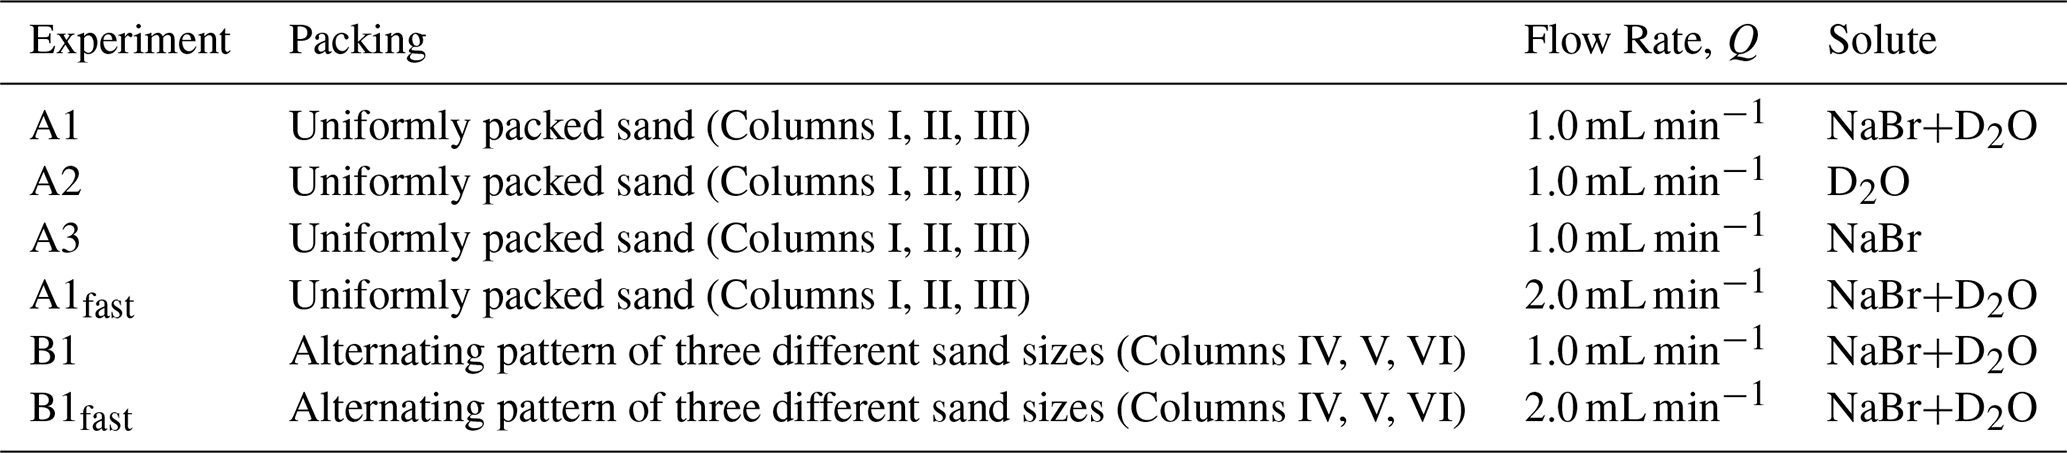
First, experiments were conducted in a homogeneous medium using coarse-grained sand for the three solutes mentioned above (experiment sets A1: NaBr+D2O, A2: D2O, and A3: NaBr, respectively; with a volumetric flow rate of Q= 1.0 mL min−1). Next, the homogeneous experiments were repeated with the combined NaBr and D2O solute with a higher flow velocity, namely double volumetric discharge (experiment set A1fast: NaBr+D2O; Q=2.0 mL min−1), to test for consistency in different flow conditions. Subsequently, two sets of experiments in a heterogeneous medium for the slow (experiment set B1: NaBr+D2O) and fast (experiment set B1fast: NaBr+D2O) flow conditions were performed. See Table 1 for a summary of the experiments. To add perspective, a representative Peclet number (Pe) for the experimental set-up can be estimated. Here, , where L is a characteristic length, chosen here as the average grain size diameter (L=0.11 cm), is the mean local flow velocity, and D is a mass diffusion coefficient ( cm2 s−1, representative of typical inert anionic tracers like bromide). For the uniformly packed sand columns with Q=1.0 mL min−1, cm s−1 (see calculation in Sect. 3.2), so that Pe ≈ 39.
Water samples were measured by Inductively Coupled Plasma-Mass Spectrometry (ICP-MS; Agilent). The ICP-MS ionizes the samples and detects the presence of specific atomic masses, which allows the determination of the concentration of the Br and D at the column outlet throughout the experiment. While isotopes of light elements are not readily measurable by ICP-MS due to low ionization efficiency and spectral interference, it is possible to measure deuterium-containing polyatomic species (e.g., ArD+) as an accurate proxy for D analysis (Galbács et al., 2020). In excess of H2O, D2O rapidly converts to HDO in equilibrium (D2O + H2⇄ O2HDO), which is linearly correlated to the measurable ArD+ ion in the plasma. It is noted that because the analytical method measures elemental (not molecular) concentration, the signal mirrors the total amount of the analyte(s), in this case the total ArD+ in the sample. While the measured Br background concentration is below the instrument detection limit, the double-distilled water applied in the experiment comprises a naturally occurring ratio. The background concentration was subtracted from the results presented to show the breakthrough of the Br and D2O solutes over their naturally occurring background concentration.
3.1 Comparison of Br and D2O breakthrough curves
The slow-flow homogeneous porous medium experiments show similar behavior for the enriched-deuterium water and the bromide tracer (Fig. 1a). Both signals show a similar breakthrough curve, as demonstrated by the onset and length of the breakthrough measured at the outlet. This finding is consistent for the bromide and D2O when injected as a single chemical species or when combined in a single experiment. This coupling establishes the similar behavior of the two chemical species, independent of a dynamic resulting from the simultaneous injection. This finding is apparent for all three columns, which show the same behavior in different packing arrangements. Column III, in particular, displayed longer tails of the breakthrough curves, consistently for both the Br and the D2O. This can be seen, in particular, in the semi-log scale which allows a focus on the long-tailed behavior. The faster flow experiments also showed consistency of this finding across the three columns (Fig. 1b). The heterogeneous porous medium experiments show longer tails compared to the homogeneous porous medium experiments, for both the slow flow and high flow experiments. For both flow scenarios, the bromide tracer and D2O water displayed similar breakthrough curves for each column (Fig. 1c and d). The various replicate experiments shown in Fig. 1 illustrate natural variability, which is exhibited particularly in the behavior of the long-time tails for each specific column and flow rate. As described in Sect. 2, recall that D2O rapidly converts to HDO in equilibrium (D2O + H2⇄ O2HDO), and that the analytical method employed here measures the total amount of deuterium in each sample. Thus, equilibrium exchange of deuterium in the water is accounted for implicitly, with the BTCs shown in Fig. 1 representing effective measurements and the overall transport behavior.
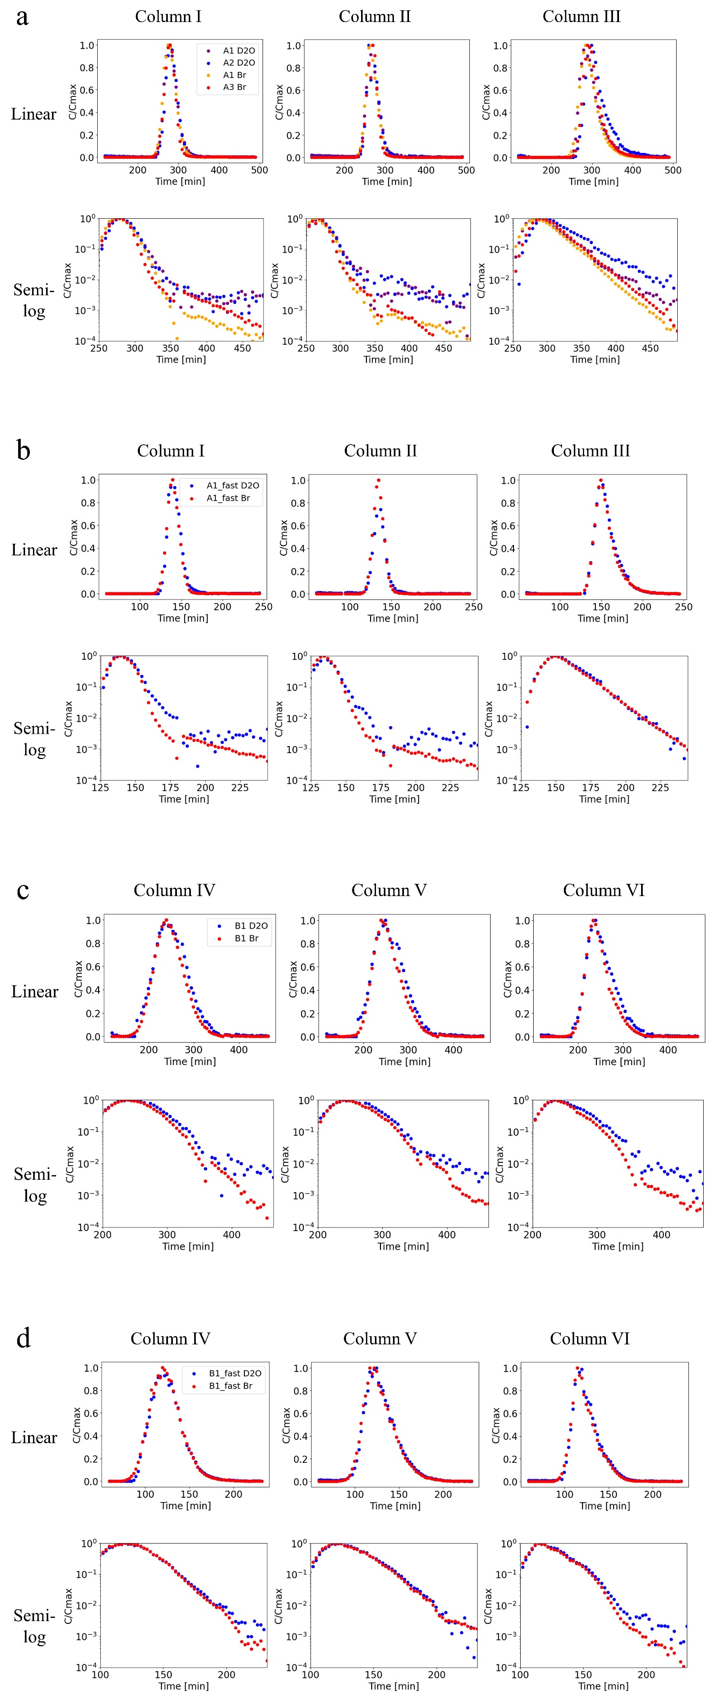
Figure 1Breakthrough curves (A1, B1: D2O+Br; A2: D2O; A3: Br) for the three homogeneous and the three heterogeneous porous medium columns in linear scale (top row) and semi-log scale (bottom row). (a) homogeneous slow-flow experiments (A1: NaBr+D2O, A2: D2O, A3: NaBr); (b) homogeneous fast-flow experiments (A1fast: NaBr+D2O); (c) heterogeneous slow-flow experiments (B1: NaBr+D2O); (d) heterogeneous fast-flow experiments (B1fast: NaBr+D2O). D2O concentrations at the tailing end of the breakthrough are generally slightly higher than Br concentrations, because the naturally occurring ratio fluctuates around the measured background value. Note the different time scales between experiments.
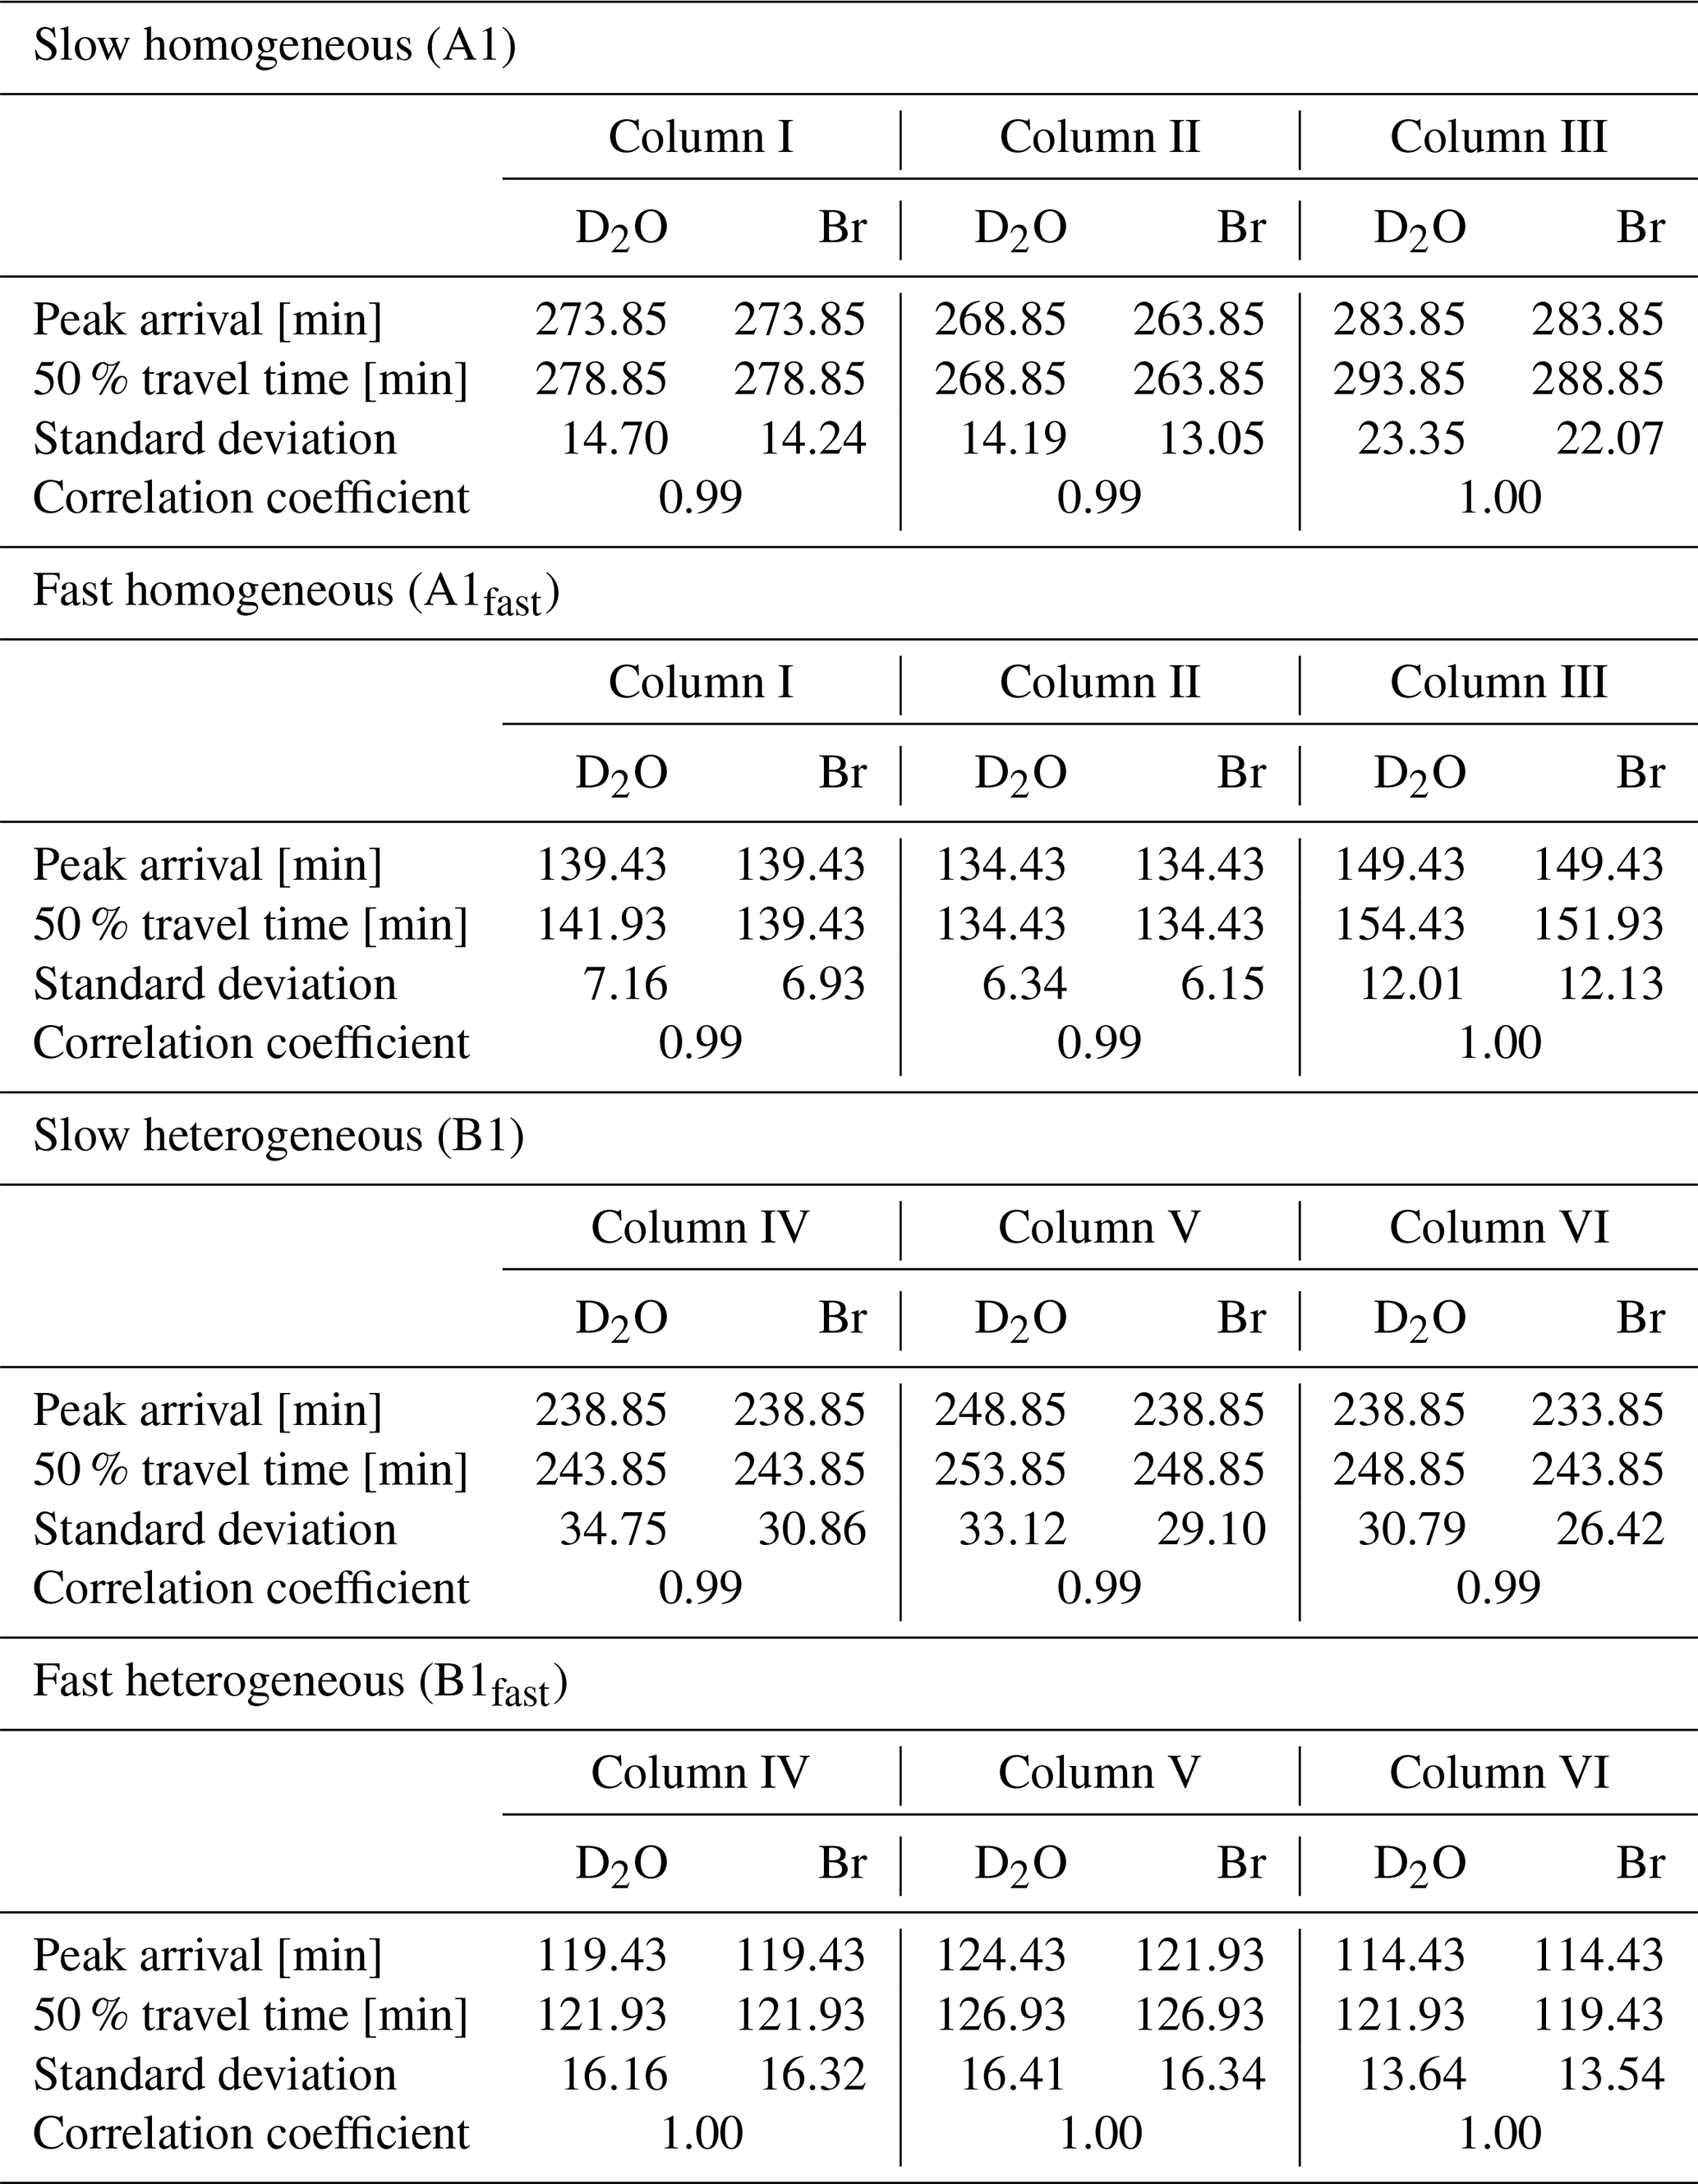
The results of both the heterogeneous and homogeneous column experiments, and for different flow rates, show that water isotopes behave similarly to inert chemical tracers; Table 2 summarizes associated metrics that compare each pair of BTCs. This finding is discussed in detail in Sect. 3.2 and 3.3. In both the homogeneous and heterogeneous columns, a similar discharge was experimentally maintained, resulting in similar mean water travel times. However, it is seen that due to the differences in medium composition, the heterogeneous columns displayed longer tails in the measured breakthrough. The longer tails seen in the heterogeneous medium compared to the homogeneous medium, are found for both the Br tracer and the deuterium-enriched water, indicating that both solutes indeed represent a transport process.
Table 2Peak arrival time, 50 % travel time and the standard deviation for the combined D2O and Br experiments. The Pearson correlation coefficient for each pair of BTCs is also shown. The smallest 5 % of the values of the measurements were filtered to remove noisy, extremely low concentration fluctuations in the deuterium samples.
3.2 Water and tracer transport in a fully water-saturated porous media: a Gedanken experiment
While one cannot directly measure the velocity of water molecules, an apparent mean water velocity, , which represents an average macroscopic water velocity over the entire medium, is commonly determined by use of Darcy's law. In a macroscopically 1D column, for example, can be determined by the simple relation , where Q is fixed volumetric discharge, n is an effective porosity (e.g., determined by comparing weights of a sand or rock core sample under dry and then water-saturated conditions), and A is the cross-sectional area of flow. It is emphasized that Darcy's law does not actually identify and measure the velocities of all water molecules (e.g., including those that may be trapped in an immobile zone for extremely long or essentially infinite times); rather, Darcy's law offers a means to determine an “effective”, continuum-scale, mean velocity of “water”. Recognition of this difference between the definitions of the “mean water velocity” (given by Darcy's law) and the mean velocity of water isotopes or chemical tracers is a core feature of the analysis presented here.
A critical question then arises: is the mean velocity of an inert chemical tracer, , identical to that of the apparent mean water velocity, ? In principle, the answer is, in general, no (i.e., ), unless the domain is perfectly homogeneous over the length and/or time scales of measurement (e.g., Cortis et al., 2004).
A Gedanken experiment is useful to visualize this important difference. In a fully water-saturated porous column containing pore-scale heterogeneities, or very small-scale, lower permeability inclusions embedded in the column, the flow and transport are macroscopically 1D (Fig. 2). The behavior of the water and the migration of an inert tracer, such as Br−, can be determined theoretically. By estimating the porosity and cross-sectional area of flow through the column, and for a fixed Q, can be calculated using Darcy's law, and the apparent mean travel time of water through the column can be estimated by dividing the column length by . Measuring the Br− ions, however, will expectedly yield a different result: if a pulse of X Br− ions is injected into the column, Y Br− ions may reach the inclusions and remain there for a very long time. Estimation of the mean velocity, , of the Br− ions at the column outlet would thus result in lower velocity compared to the apparent mean water velocity, due to the slow-moving ions (i.e., a long-tail in the tracer breakthrough measurement).
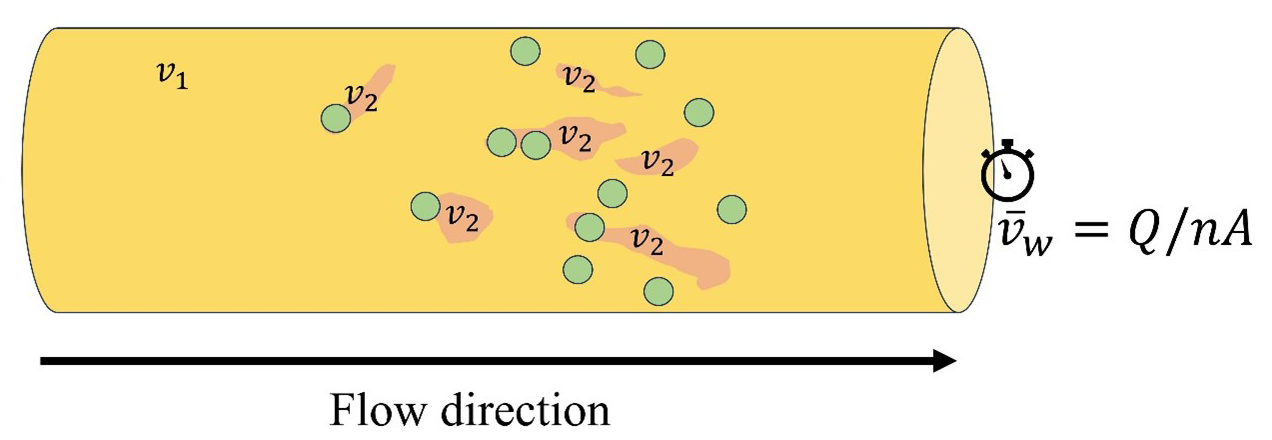
Figure 2Conceptual macroscopically 1D flow through a 1D porous medium column with a mean velocity () containing (very small-scale or pore-scale) lower velocity inclusions (). The Br− ions injected as a pulse into the column are marked with green circles. Calculation of the apparent mean water velocity () at the column outlet will yield a higher velocity than the actual velocity of the transported Br− ions due to the lower velocities experienced by some Br− ions in the inclusions.
This Gedanken experiment leads to the expected conclusion that the mean velocity of the chemical tracer does not necessarily represent the apparent mean water velocity, due to even small-scale mobile and immobile zones in the medium. However, it is also clear that the origin of the measured behavior of the inert tracer is the direct result of the measurement process. One can replace the Br− ions in the above example with water isotopes and reach the same result: some of the tagged water molecules will reach the inclusions and the estimated mean tracer velocity will be slower than the apparent mean water velocity . The act of tagging water effectively changes a water molecule to act as a “non-water” tracer, in the context of breakthrough measurements; in other words, the measured velocity represents the mean velocity of a tracer (be it a water isotope or an inert chemical), rather than the apparent mean velocity of the water.
3.3 Quantification of transport behavior
It is important to recognize the inherent difference between and when quantifying tracer transport in a fully water-saturated porous medium, in a macroscopically one-dimensional domain, the apparent mean water velocity does not represent the actual travel times of all water molecules through the medium, but rather an average macroscopic value of water velocity over the entire medium. On the other hand, an inert tracer transported by the water is subjected to advection and hydrodynamic dispersion, as well as to subscale diffusive mixing. As the chemical tracer is transported through the medium, it displays a distribution of velocities which represents a fingerprint of the heterogeneous flow paths. Therefore, the transport of a tracer inherently reflects a distribution of velocities for which represents the mean. It should be emphasized that the distinction between and holds regardless of the choice of model applied to interpret breakthrough curves. For example, the derivation of the classical ADE (and variants thereof) in particular, is predicated on . In contrast, the continuous time random walk (CTRW) formulation discussed below is essentially founded on .
With this understanding, how does one interpret and quantify experimental results such as those discussed in Sect. 3.1? In an effectively (macroscopically, continuum-level) homogeneous porous medium, the tracer particles can in essence display Fickian dispersion and (Berkowitz et al., 2006a). In this situation, the classical 1D form of the ADE for steady-state flow can be applied to quantify the transport dynamics, , where the velocity v is by definition based on and D* is a dispersion coefficient. However, in many cases, the velocity distribution often gives rise to non-Fickian (or anomalous) transport, which can be manifested by, e.g., the occurrence of long tails in measured breakthrough curves (Cortis et al., 2004), and cannot be captured by the traditional implementation of Fick's law in the ADE that assumes a symmetrical temporal breakthrough curve. Thus, the effect of anomalous transport may be significant for mean TTD estimation, which might differ substantially from the apparent mean water velocity; this is discussed in Sect. 3.4.
Here, the CTRW was used to interpret measured breakthrough curves (Berkowitz et al., 2006b) such as shown in Fig. 1. The CTRW represents a continuum-scale, ensemble average behavior relevant to the interpretation of these macroscopically 1D column experiments; it is especially suitable for this task because it inherently employs in its formulation. Solutions based on CTRW have been shown to yield a good description of non-Fickian transport scenarios (Nissan and Berkowitz, 2019; Dentz et al., 2008, 2023; Goeppert et al., 2020; Edery et al., 2015).
In a CTRW particle tracking (PT) formulation, applied here, probability density functions stochastically define particle transitions in space and time (Elhanati et al., 2023; Nissan et al., 2017). A truncated power law distribution is assigned for the temporal probability density function, defined with the exponent β, which is a measure of the non-Fickian nature of the transport (Nissan et al., 2017). A power law exponent of β>2 implies Fickian, or essentially Fickian, behavior for which an ADE solution is generally applicable (Berkowitz et al., 2006b), and can be modeled within the CTRW framework as a special case; β<2 is a descriptor of non-Fickian transport. The first spatial moment of the chemical species plume in the flow direction, vψ, is defined as the mean particle velocity and is therefore applied herein as the mean tracer velocity, . It is noted that the breakthrough curves from the experiments presented here were expected to display anomalous transport based on experiments and analysis reported previously by Elhanati et al. (2023). Anomalous transport even in macroscopically homogeneous porous media arises because of subtle, residual pore-scale disorder effects, with diffusion into pore-scale stagnant regions that can lead to a wide (power law) distribution of travel times (Cortis et al., 2004; Berkowitz et al., 2006a).
Two key characters are assessed in this context, focusing on a representative breakthrough curve: the mean velocity of the D2O tracer and the nature of the long tails in the breakthrough curves. As an example, the slow flow homogeneous porous medium D2O (A1) dataset was interpreted using the CTRW-PT formulation discussed above. An approximate fit to the data yielded a power law exponent of β≈1.84 (Fig. 3), which is indicative of anomalous transport.
Moreover, the CTRW-PT simulation yielded a mean tracer velocity of cm s−1. In sharp contrast, for this experiment, the apparent mean water velocity can be directly determined as cm s−1 for the experiment parameters (Q=1.0 mL min−1, n=0.38, and A=6.16 cm2). Clearly, . Figure 3 also shows two representative fits of the data using a 1D solution of the classical ADE. Here, using the value of cm s−1, which according to the theory underlying the Fickian-based ADE is the relevant velocity, the solution is seen to strongly over-estimate the advance of the peak, and to be unable to capture the long-time tailing. Furthermore, even if the mean velocity in the ADE is – incorrectly in this case – chosen to match the peak travel time of the data (simple inspection of the breakthrough curve indicates a peak travel time of about 274 min), the ADE solution is unable to capture the early arrivals and the long-time tailing (Fig. 3). In this case, the mean velocity is approximately cm s−1, and the dispersion coefficient was chosen to yield a breakthrough width similar to that using .
Finally, as an additional consideration, note that with a column length of 100 cm, the peak travel time of 274 min can be translated to an overall assumed “mean” velocity of about cm s−1, which is close to the estimate of cm s−1 from the CTRW-PT simulation, and clearly distinct from the apparent mean water velocity cm s−1. Moreover, from the same breakthrough curve, the velocity corresponding to the time required for 50 % of the tracer to be eluted from the column is essentially identical to .
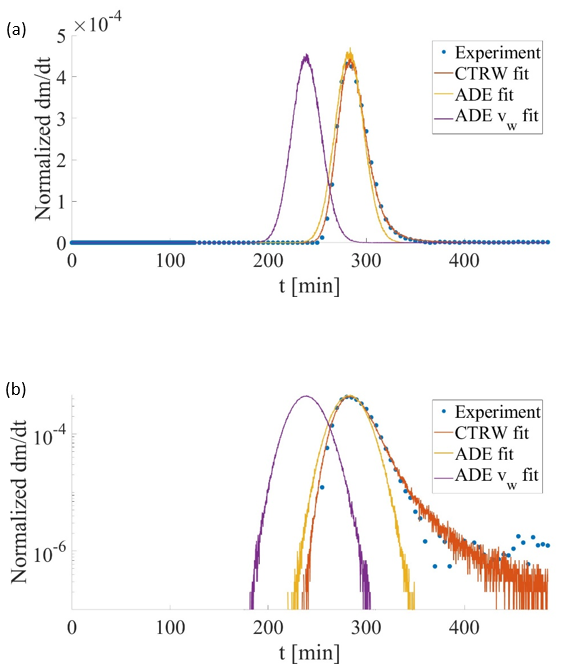
Figure 3Comparison of experiment and CTRW simulation breakthrough curves for the D2O slow flow homogeneous porous medium column (linear scale (a)). The long tails indicative of anomalous transport can be seen in the semi-log scale (b), and in the modeled power law exponent (β=1.84). CTRW solution: cm s−1 (with a generalized dispersion coefficient of cm2 s−1). Two solutions of the ADE are also shown, one using the value of cm s−1 (“ADE vw fit”; with a dispersion coefficient of cm2 s−1), and a fit to the peak of the data, yielding a velocity of cm s−1 (“ADE fit”; with cm2 s−1).
3.4 Implications of using isotopic waters for inferring catchment properties
The above analysis – for a macroscopically 1-D column – can be used to provide a first assessment of the impact of using differing estimates of a mean velocity on catchment travel time estimates. It should be recognized at the outset that while catchments are inherently complex, highly heterogeneous 3D systems, involving surface water, a soil layer, and aquifer components, catchment assessments are often based on largely 1D spatial conceptualizations that account for a bulk water and tracer input (recharge) region and an ultimate discharge measured at a conveniently monitored outlet point (spring or stream) (Stewart et al., 2010; Koeniger et al., 2010; Benettin et al., 2022; Rodriguez et al., 2021). An alternative approach employs storage selection theory, which involves collapsing the system to zero spatial dimensions and defining functions that interpret age-ranked release of water from storage and exit from the catchment, or in other words, defining functions that quantify the probability of water of a certain age being discharged at a given time.
In the column experiments discussed in Sect. 3.1, it was shown that water isotopes migrate like inert tracers. Furthermore, it was shown in Sect. 3.3 that the tracer transport displays non-Fickian behavior, with and longer-than-Fickian breakthrough tailing, both of which affect the assessment of travel and residence times. In catchment assessment, it is assumed that an often ambiguously defined mean travel time of water exists and that it can be represented by considering a hydraulic retention time, which is defined as a storage volume divided by a volumetric flow rate. Here, it is seen that the hydraulic retention times are distinct from average residence times: one cannot observe the migration of individual water molecules, but only the migration of tracers – whether inert chemicals or water isotopes – in water. This implies that trapping of water isotopes in low conductive regions will induce strong differences between estimated hydraulic retention times and average isotope travel times. Clearly, the presence of highly complex flow paths, recharge dynamics, and partially water-saturated regions in catchments will impact the relative difference between and . This aspect remains to be investigated in detail, but it can be speculated that the added complexity might lead to an even wider range of sources for tracer retention, as suggested by some field-scale analyses of anomalous transport (e.g., Goeppert et al., 2020; Dentz et al., 2023).
Returning to the specific example calculation discussed in Sect. 3.3, mean travel times over a 1 cm length are therefore ∼ 140 and ∼ 172 s, for the apparent mean water velocity ( cm s−1) and the mean tracer velocity ( cm s−1), respectively. The mean particle transit time is longer than the water travel time due to the dispersion-induced anomalous transport by a ratio of ∼ 1.2, for these specific experiments.
Returning now to the background discussed in the Introduction, a key parameter of interest in catchments is the assessment of the aquifer (fully water-saturated region) storage thickness over an entire watershed; see, e.g., Stewart et al. (2010) for extensive discussion of aquifer storage considerations. In this context, Stewart et al. (2010) provide an extensive summary of published studies that report mean water isotope travel times in macroscale catchments. The authors note that the various catchments appear sufficiently large to yield relatively similar average behaviors. Moreover, the assessments all suggest the existence of substantial storage volumes for recharge water into the aquifer zone.
These mean travel times estimates, which actually represent tracer transport and thus , are all based on analysis of 3H and assumed in these publications to represent the apparent water velocity, . [It is recognized, parenthetically, that different isotopes are likely to yield somewhat different average travel times, as may different inert chemical tracers with different masses and rates of diffusion, but this factor is not relevant for the key points and the short-term (3–4 h) column experiments reported here. Over relatively long time scales, the impact of different rates of diffusion may be significant: diffusion on one hand can enhance tracer trapping and thus extend retention times in low-permeability zones, while on the other hand can lead to increased uniformity of the tracer plume concentrations. The specific impact of molecular diffusion in these scenarios remains to be investigated.] If the tracer transport were Fickian, then this estimate would indeed represent . However, real aquifers generally display non-Fickian behavior (e.g., Goeppert et al., 2020; Dentz et al., 2023), and in the example calculation given in Sect. 3.3, the true value of is a factor of ∼ 1.2 faster than . Stewart et al. (2010) conclude their analysis with an example calculation of a catchment aquifer storage thickness, based on their summary of many catchments. They posit a catchment with annual precipitation of 1000 mm, evapotranspiration of 600 mm (and thus annual recharge of 400 mm yr−1), and 50 % aquifer flow in a formation with an overall porosity of 20 %. For an estimated (apparent) mean (water) travel time of 10 years, a 10 m aquifer thickness is needed over the entire watershed to account for the long travel times in the data. However, given that water isotopes do not directly represent the water mean travel times and yield longer travel times, the actual aquifer thickness may be lower. The ratio of 1.2 between apparent mean water and mean tracer travel times calculated above applies only to the specific columns studied here. However, applying the calculated ratio for the scenario presented, to give a coarse estimate, would yield a significantly smaller aquifer thickness of ∼ 8 m. While the ratio of water and tracer mean travel times should be estimated for any given scenario separately, the example above demonstrates the importance of this estimation in inferring aquifer characteristics.
The experimental findings demonstrate the similarity between the measured transport behavior of water isotopes and an inert chemical tracer in fully water-saturated porous media. This similarity is evident across different flow velocities and porous medium compositions. Notably, water isotopes exhibit the same transport behavior as tracers; the very act of tagging water molecules, implicit in the measurement of any water isotope, yields a measurement of their migration as a chemical tracer, which is not identical to the bulk water flow. Moreover, the experiments here demonstrate that even in relatively homogeneous sand columns, both water isotopes and inert chemical tracers exhibit non-Fickian (anomalous) transport, and the mean tracer velocity is not necessarily equal to the apparent mean water velocity.
Consequently, studies that rely on water isotopes to estimate water TTDs must recognize this subtle but critical inequality between apparent mean water and mean tracer velocities, and not use them interchangeably to represent the actual travel times of tracers and water isotopes. Our findings also indicate that selecting the correct velocity for aquifer thickness calculations can yield significantly smaller thickness estimates – an effect that could have even greater implications when applied at the global scale, beyond the illustrative example shown here.
The data on which this article is based are available online on Zenodo: https://doi.org/10.5281/zenodo.12187848 (Elhanati et al., 2024).
DE, EZ, ID, and BB formulated the ideas that resulted in the project, defined the goals and aims of the study, and contributed to the various study components. DE and BB developed the experimental methodology, ID and DE developed the isotope analytical measurement protocol, and DE implemented the methodology and carried out the data analysis. DE and BB drafted the initial manuscript. All authors took part in reviewing and editing the final manuscript.
At least one of the (co-)authors is a member of the editorial board of Hydrology and Earth System Sciences. The peer-review process was guided by an independent editor, and the authors also have no other competing interests to declare.
Publisher’s note: Copernicus Publications remains neutral with regard to jurisdictional claims made in the text, published maps, institutional affiliations, or any other geographical representation in this paper. While Copernicus Publications makes every effort to include appropriate place names, the final responsibility lies with the authors. Views expressed in the text are those of the authors and do not necessarily reflect the views of the publisher.
BB thanks the Minerva Foundation for support. DE gratefully acknowledges the support of the Weizmann Institute for Environmental Sustainability. BB holds the Sam Zuckerberg Professorial Chair in Hydrology.
BB and EZ gratefully acknowledge support through the ViTamins project, funded by the Volkswagen Foundation (grant no. AZ 9B192). B.B. also thanks the Minerva Foundation for support. D.E. gratefully acknowledges the support of the Weizmann Institute for Environmental Sustainability.
This paper was edited by Heng Dai and reviewed by Brandi Gaertner and three anonymous referees.
Aquilina, L., Ladouche, B., and Dörfliger, N.: Water storage and transfer in the epikarst of karstic systems during high flow periods, Journal of Hydrology, 327, 472–485, https://doi.org/10.1016/j.jhydrol.2005.11.054, 2006.
Benettin, P., Rodriguez, N. B., Sprenger, M., Kim, M., Klaus, J., Harman, C. J., van der Velde, Y., Hrachowitz, M., Botter, G., McGuire, K. J., Kirchner, J. W., Rinaldo, A., and McDonnell, J. J.: Transit Time Estimation in Catchments: Recent Developments and Future Directions, Water Resources Research, 58, 1–36, https://doi.org/10.1029/2022WR033096, 2022.
Berkowitz, B., Cortis, A., Dentz, M., and Scher, H.: Modeling non-Fickian transport in geological formations as a continuous time random walk, Reviews of Geophysics, 44, 1–49, https://doi.org/10.1029/2005RG000178, 2006a.
Berkowitz, B., Cortis, A., Dentz, M., and Scher, H.: Modeling non-Fickian transport in geological formations as a continuous time random walk, Reviews of Geophysics, 44, 1–49, https://doi.org/10.1029/2005RG000178, 2006b.
Berkowitz, B., Dror, I., Hansen, S. K., and Scher, H.: Measurements and models of reactive transport in geological media, Reviews of Geophysics, 54, 930–986, https://doi.org/10.1002/2016RG000524, 2016.
Bowers, W. H., Mercer, J. J., Pleasants, M. S., and Williams, D. G.: A combination of soil water extraction methods quantifies the isotopic mixing of waters held at separate tensions in soil, Hydrol. Earth Syst. Sci., 24, 4045–4060, https://doi.org/10.5194/hess-24-4045-2020, 2020.
Bowman, R. S.: Evaluation of Some New Tracers for Soil Water Studies, Soil Science Society of America Journal, 48, 987–993, https://doi.org/10.2136/sssaj1984.03615995004800050007x, 1984.
Chen, W., Wang, J., Liu, Y., Jin, M., Liang, X., Wang, Z., and Ferré, T. P. A.: Using bromide data tracer and HYDRUS-1D to estimate groundwater recharge and evapotranspiration under film-mulched drip irrigation in an arid Inland Basin, Northwest China, Hydrol. Process., 35, https://doi.org/10.1002/hyp.14290, 2021.
Cortis, A., Chen, Y., Scher, H., and Berkowitz, B.: Quantitative characterization of pore-scale disorder effects on transport in “homogeneous” granular media, Physical Review E, 70, 8, https://doi.org/10.1103/PhysRevE.70.041108, 2004.
Dentz, M., Scher, H., Holder, D., and Berkowitz, B.: Transport behavior of coupled continuous-time random walks, Physical Review E, 78, 1–9, https://doi.org/10.1103/PhysRevE.78.041110, 2008.
Dentz, M., Kirchner, J. W., Zehe, E., and Berkowitz, B.: The role of anomalous transport in long-term, stream water chemistry variability, Geophysical Research Letters, 50, 1–8, https://doi.org/10.1029/2023GL104207, 2023.
Edery, Y., Dror, I., Scher, H., and Berkowitz, B.: Anomalous reactive transport in porous media: Experiments and modeling, Physical Review E, 91, 1–13, https://doi.org/10.1103/PhysRevE.91.052130, 2015.
Elhanati, D., Dror, I., and Berkowitz, B.: Impact of time-dependent velocity fields on the continuum-scale transport of conservative chemicals, Water Resources Research, 59, 1–19, https://doi.org/10.1029/2023WR035266, 2023.
Elhanati, D., Dror, I., Zehe, E., and Berkowitz, B.: Breakthrough curves of water isotopes and inert chemical tracers through porous media columns Zenodo [data set], https://doi.org/10.5281/zenodo.12187848, 2024.
Galbács, G., Kéri, A., Kálomista, I., Kovács-Széles, É., and Gornushkin, I. B.: Deuterium analysis by inductively coupled plasma mass spectrometry using polyatomic species: An experimental study supported by plasma chemistry modeling, Analytica Chimica Acta, 1104, 28–37, https://doi.org/10.1016/j.aca.2020.01.011, 2020.
Goeppert, N., Goldscheider, N., and Berkowitz, B.: Experimental and modeling evidence of kilometer-scale anomalous tracer transport in an alpine karst aquifer, Water Research, 178, 115755, https://doi.org/10.1016/j.watres.2020.115755, 2020.
Grathwohl, P., Rügner, H., Wöhling, T., Osenbrück, K., Schwientek, M., Gayler, S., Wollschläger, U., Selle, B., Pause, M., Delfs, J. O., Grzeschik, M., Weller, U., Ivanov, M., Cirpka, O. A., Maier, U., Kuch, B., Nowak, W., Wulfmeyer, V., Warrach-Sagi, K., Streck, T., Attinger, S., Bilke, L., Dietrich, P., Fleckenstein, J. H., Kalbacher, T., Kolditz, O., Rink, K., Samaniego, L., Vogel, H. J., Werban, U., and Teutsch, G.: Catchments as reactors: A comprehensive approach for water fluxes and solute turnover, Environmental Earth Sciences, 69, 317–333, https://doi.org/10.1007/s12665-013-2281-7, 2013.
Hrachowitz, M., Savenije, H., Bogaard, T. A., Tetzlaff, D., and Soulsby, C.: What can flux tracking teach us about water age distribution patterns and their temporal dynamics?, Hydrol. Earth Syst. Sci., 17, 533–564, https://doi.org/10.5194/hess-17-533-2013, 2013.
Jury, W. A. and Sposito, G.: A transfer function model of solute transport through soil 1. fundamental concepts, Water Resources Research, 22, 243–247, 1986.
Koeniger, P., Leibundgut, C., Link, T., and Marshall, J. D.: Stable isotopes applied as water tracers in column and field studies, Organic Geochemistry, 41, 31–40, https://doi.org/10.1016/j.orggeochem.2009.07.006, 2010.
Levy, B. S. and Chambers, R. M.: Bromide as a conservative tracer for soil-water studies, Hydrol Process, 1, 385–389, https://doi.org/10.1002/hyp.3360010406, 1987.
Lischeid, G., Lange, H., and Hauhs, M.: Information gain using single tracers under steady state and transient flow conditions: the Gårdsjön G1 multiple tracer experiments, in: Tracers and modelling in hydrogeology. Proceedings of TraM'2000, the International Conference on Tracers and Modelling in Hydrogeology held at Liège, Belgium, May 2000, 73–77, ISBN 1-901502-21-X, 2000.
McDonnell, J. J. and Beven, K.: Debates – The future of hydrological sciences: A (common) path forward? A call to action aimed at understanding velocities, celerities and residence time distributions of the headwater hydrograph, Water Resources Research, 50, 5342–5350, https://doi.org/10.1002/2013WR015141, 2014.
McDonnell, J. J., McGuire, K., Aggarwal, P., Beven, K. J., Biondi, D., Destouni, G., Dunn, S., James, A., Kirchner, J., Kraft, P., Lyon, S., Maloszewski, P., Newman, B., Pfister, L., Rinaldo, A., Rodhe, A., Sayama, T., Seibert, J., Solomon, K., Soulsby, C., Stewart, M., Tetzlaff, D., Tobin, C., Troch, P., Weiler, M., Western, A., Wörman, A., and Wrede, S.: How old is streamwater? Open questions in catchment transit time conceptualization, modelling and analysis, Hydrological Processes, 24, 1745–1754, https://doi.org/10.1002/hyp.7796, 2010.
McGlynn, B., McDonnell, J., Stewart, M., and Seibert, J.: On the relationships between catchment scale and streamwater mean residence time, Hydrological Processes, 17, 175–181, https://doi.org/10.1002/hyp.5085, 2003.
McGuire, K. J. and McDonnell, J. J.: A review and evaluation of catchment transit time modeling, Journal of Hydrology, 330, 543–563, https://doi.org/10.1016/j.jhydrol.2006.04.020, 2006.
Nissan, A. and Berkowitz, B.: Reactive transport in geterogeneous porous media under different péclet numbers, Water Resources Research, 1–11, https://doi.org/10.1029/2019wr025585, 2019.
Nissan, A., Dror, I., and Berkowitz, B.: Time-dependent velocity-field controls on anomalous chemical transport in porous media, Water Resources Research, 53, 3760–3769, https://doi.org/10.1111/j.1752-1688.1969.tb04897.x, 2017.
Rai, S. and Iqbal, M. Z.: Using fluorescein and bromide tracers to investigate the role of baseflow in a small suburban watershed in Iowa, USA, Hydrol. Process., 29, 173–186, https://doi.org/10.1002/hyp.10143, 2015.
Rinaldo, A., Beven, K. J., Bertuzzo, E., Nicotina, L., Davies, J., Fiori, A., Russo, D., and Botter, G.: Catchment travel time distributions and water flow in soils, Water Resources Research, 47, 1–13, https://doi.org/10.1029/2011WR010478, 2011.
Rodriguez, N. B., Pfister, L., Zehe, E., and Klaus, J.: A comparison of catchment travel times and storage deduced from deuterium and tritium tracers using StorAge Selection functions, Hydrol. Earth Syst. Sci., 25, 401–428, https://doi.org/10.5194/hess-25-401-2021, 2021.
Simmons, C. S.: A stochastic-convective transport representation of dispersion in one-dimensional porous media systems, Water Resources Research, 18, 1193–1214, https://doi.org/10.1029/WR018i004p01193, 1982.
Sivapalan, M.: From engineering hydrology to Earth system science: milestones in the transformation of hydrologic science, Hydrol. Earth Syst. Sci., 22, 1665–1693, https://doi.org/10.5194/hess-22-1665-2018, 2018.
Sternagel, A., Loritz, R., Klaus, J., Berkowitz, B., and Zehe, E.: Simulation of reactive solute transport in the critical zone: a Lagrangian model for transient flow and preferential transport, Hydrol. Earth Syst. Sci., 25, 1483–1508, https://doi.org/10.5194/hess-25-1483-2021, 2021.
Sternagel, A., Loritz, R., Berkowitz, B., and Zehe, E.: Stepping beyond perfectly mixed conditions in soil hydrological modelling using a Lagrangian approach, Hydrol. Earth Syst. Sci., 26, 1615–1629, https://doi.org/10.5194/hess-26-1615-2022, 2022.
Stewart, M. K., Morgenstern, U., and McDonnell, J. J.: Truncation of stream residence time: How the use of stable isotopes has skewed our concept of streamwater age and origin, Hydrological Processes, 24, 1646–1659, https://doi.org/10.1002/hyp.7576, 2010.
Weiler, M., McGlynn, B. L., McGuire, K. J., and McDonnell, J. J.: How does rainfall become runoff? A combined tracer and runoff transfer function approach, Water Resources Research, 39, 1–13, https://doi.org/10.1029/2003WR002331, 2003.
Wienhöfer, J., Germer, K., Lindenmaier, F., Färber, A., and Zehe, E.: Applied tracers for the observation of subsurface stormflow at the hillslope scale, Hydrol. Earth Syst. Sci., 13, 1145–1161, https://doi.org/10.5194/hess-13-1145-2009, 2009.