the Creative Commons Attribution 4.0 License.
the Creative Commons Attribution 4.0 License.
 | 19 Nov 2025
Impact of rainfall variability on sedimentary and hydropower dynamics in a dam reservoir of southern France
Anthony Foucher
Olivier Evrard
Benjamin Quesada
Hydropower is the leading renewable energy source, but its vulnerability to environmental pressures remains a critical concern, particularly under climate change. While climate impacts on hydropower are well studied, the interplay between precipitation variability, sediment dynamics, and dam operation strategies has received comparatively less attention. This study investigates these interactions in the French Mediterranean region, focusing on the Mont d'Orb dam reservoir. An integrated approach was adopted, combining (1) sediment core analysis using fallout radionuclide dating to assess the impact of extreme rainfall on sediment yield; (2) statistical analysis of meteorological records to detect long-term trends and seasonal shifts; and (3) hydrological and operational data analysis to evaluate how sedimentation, precipitation variability, and reservoir management influence hydropower generation. Results show that extreme rainfall events (top 1 %) contribute disproportionately – 20 %–50 % – to the annual sediment delivery. Although annual precipitation has not significantly changed since 1950, a clear seasonal shift from winter- to fall-dominant precipitation emerged. This change is driven by a significant increase in fall event frequency (+87 % to +400 % for 100 to 150 mm d−1 thresholds) and intensity (+31 %), alongside a −19 % decrease in winter precipitation, which is key to reservoir recharge. During the first two management periods, hydropower generation was more impacted by multipurpose dam objectives (e.g., flood control, water supply) than by direct climatic forcing. A high sedimentation rate of 19.3 mm yr−1 was observed. While sedimentation did not directly affect electricity production yet, it poses long-term risks to storage capacity and turbine functioning. Hydropower output declined by 25 % between 1976–1997 and 2006–2022, underlining the growing sensitivity of hydropower to hydroclimatic constraints. These findings highlight the need to better anticipate future environmental impacts in the context of rising electricity demand and climate uncertainty.
- Article
(5620 KB) - Full-text XML
-
Supplement
(31508 KB) - BibTeX
- EndNote


In 2020, hydropower emerged as the foremost renewable energy generation technology, providing approximately one-sixth of global electricity, outpacing the combined generation of all other renewable sources (International Energy Agency, 2021). With national capacities ranging from less than one MW to 22 500 MW, hydropower plays a crucial role in ensuring grid flexibility and stability worldwide. In addition to power generation, hydropower reservoirs serve multiple purposes, including the supply of water for irrigation in agriculture, the provision of drinking water, flood management and recreational activities. Nevertheless, reservoir infrastructure is well known to generate ecological impacts, including disruptions of river connectivity, sediment dynamics, and riverine biodiversity (He et al., 2024), as well as social challenges such as population resettlement (Wang et al., 2017). In addition, the availability of water stored in these reservoirs is strongly dependent on regional hydroclimatic conditions.
The dependence of rainfall patterns on temperature and their subsequent changes due to global warming play an important role in hydropower generation through their influence on the hydrological regime. The interplay between these two factors and their impacts on hydropower generation has been extensively studied (Shu et al., 2018; Qin et al., 2020; Shrestha et al., 2021). High-elevation reservoirs (above 1500 meters above sea level, m a.s.l.) with limited storage, are particularly vulnerable to temperature-induced snowmelt, while lower-elevation facilities are expected to be more affected by changes in precipitation and runoff (Shu et al., 2018; Anghileri et al., 2018). The Intergovernmental Panel on Climate Change (IPCC, 2023) has shown that shifts in global streamflow patterns are attributable to climate change, with extreme hydrometeorological events becoming increasingly likely as a consequence of human-induced greenhouse gas (GHG) emissions. While global hydropower production is projected to remain relatively stable under climate change (Hamududu and Killingtveit, 2012), regional variations in precipitation patterns could lead to different trends in hydroelectric power production, depending on the region considered (Turner et al., 2017). For instance, the Mediterranean region has emerged as a critical hotspot for climate change, which is exacerbated by the fact that it provides a home to multiple vulnerable ecosystems and socio-economic sectors (IPCC, 2023; Giorgi, 2006). Since the 1980s, warming in the Mediterranean region has consistently exceeded the global average (Lionello et al., 2014; Lionello and Scarascia, 2020; Cherif et al., 2021). Projections of future temperature increases indicate that the region will experience annual and summer warming rates being 20 % and 50 % above the global average, respectively (IPCC, 2023; Mariotti et al., 2015; Lionello and Scarascia, 2018). Intense summer warming is expected in the northern Mediterranean region, including southern France, Spain, Italy, Greece, and Turkey, accompanied by a projected decrease in annual precipitation of −9 % K−1. In contrast, winter precipitation in these areas is not expected to decline significantly (IPCC, 2023; Mariotti et al., 2015; Lionello and Scarascia, 2018). As a consequence, multiple studies suggested that hydropower production in this area could decline by 6 % to 33 %, also highlighting the future uncertainty in that matter (IPCC, 2023; Lobanova et al., 2016; Solaun and Cerdá, 2017; Payet-Burin et al., 2018). Among the observed consequence of climate change, the increased soil degradation, resulting primarily from accelerated erosion due to heavier rainfall, snowmelt events and wildfires is particularly concerning. (IPCC, 2023). However, studies have shown that soil degradation can be mitigated through reforestation and the adoption of sustainable land use practices such as contour farming and no-tillage (Scarciglia et al., 2020; Mariotti et al., 2015; Ricci et al., 2020).
In this context, the current lack of understanding of sediment dynamics and the limited awareness regarding this issue by dam managers have led to significant economic challenges for hydropower plants. These challenges range from a reduction in reservoir water levels, and consequently a reduction in available water for power generation, to increased turbine wear (Hauer et al., 2018). The reduction of available water through sedimentation and the reduction of precipitation are particularly critical issues over the medium to long terms. For instance, previous research projected that 80 % of the average reservoir capacity in Europe could be filled with sediment by 2080 (Basson, 2009, as cited in Hauer et al., 2018). Global annual power loss rates relative to the installed capacity are generally estimated to reach between 0.5 % and 1 % due to sedimentation (Wisser et al., 2013). These figures should however be relativized, as climate change impacts may either exacerbate or reduce sediment loads depending on regional hydro-climatic conditions. For instance, projections indicate increases of up to +14 % in sediment delivery in the Elbe basin (Uber et al., 2022) and a 41 % rise in road-related erosion in the western Carpathians (Juško et al., 2022), whereas reductions between −18.1 % and −52.8 % (Abdelwahab et al., 2025) in sediment loads have been projected for the Carapelle basin in southern Italy (Mediterranean region). In addition, sediment load estimates remain highly sensitive to the choice of meteorological data, reference period, and model ensemble (Szalińska et al., 2024), underlining the large uncertainties that accompany future projections. Moreover, increase in sedimentation leads to higher costs of turbine damage and maintenance (Hauer et al., 2018). It is therefore crucial to better understand the relationship between catchment erosion, reservoir sedimentation and precipitation, and their combined effects on hydroelectric power potential. Both experimental and modelling studies on the interaction between these factors have been carried out during the last decade. For instance, Raymond Pralong et al. (2015) predicted, on average, through the use of ensembles of Global Circulation Models (GCM) combined with hydrological models a decrease of sediment yield in summer due to runoff reduction and a shift in the seasonal peak of sediment fluxes to earlier months by the end of the century (2070–2090) in Alpine catchments. In parallel, the Skagit River Basin in the Washington State (USA) is predicted to observe a 29 % reduction in summer hydropower generation, a 19 % increase in winter hydropower generation and a 335 % increase in sediment load (Lee et al., 2016). This study was conducted using a suspended sediment transport equation developed based on historical measurements of sediment loads available for the Skagit River between 1974 and 1993, and then between 2006 and 2009 (Curran et al., 2016). Nevertheless, there are notable limitations in the availability of comparable datasets on sediment transport dynamics, including bedload and suspended sediment, across global river systems equipped with dam reservoirs (Hauer et al., 2018). In this context, there is a need to develop alternatives techniques to increase the number of datasets available on reservoir sedimentation. According to Hilgert et al. (2024), the analysis of sediment archives provides one of the most promising approaches for qualitatively assessing the properties of accumulated sediments in reservoirs, through the measurement of their thickness, volume, and the investigation of past sediment dynamics (Hilgert et al., 2024). For instance, the analysis of sediment cores from hydropower reservoirs enabled the reconstruction of sedimentation rates in Changshou Lake, China, highlighting the combined influence of natural and anthropogenic factors. Among these, climate change was identified as an important driver, with increased precipitation contributing to the raise in sediment accumulation (Anjum et al., 2018). Similarly, Foucher et al. (2023) examined how variations in precipitation and sediment fluxes affected water availability for hydropower production in the Poechos Reservoir, northern Peru. Nevertheless, a significant knowledge gap persists regarding the long-term combined influence of precipitation and sediment flux variability on hydropower facilities, particularly in terms of historical production trends and operational implications.
In this study, we therefore reconstructed the historical physico-chemical characteristics of sediment from cores extracted in a hydropower dam reservoir, where the last available sediment analyses for water quality monitoring dated back to 2008 (BRL, 2011). These cores were taken from Orb reservoir to assess the influence of extreme precipitation on sediment dynamics in the Monts d'Orb dam catchment throughout the depositional history recorded by the sediment cores during the last several decades. Despite the key role of sediment dynamics in reservoir management, studies specifically addressing sedimentation processes in this dam remain scarce. Therefore, we explored the relationship between precipitation variability and sediment dynamics within this reservoir, which supplies water to a hydropower plant in the Mediterranean region of Southern France. We further analyzed how these factors have influenced the historical evolution of water availability, assessing their combined impact on hydropower generation and initiating a discussion on the potential risks that they may present in the future.
The Monts d'Orb dam (see Fig. S1 in the Supplement) is located on the Orb River at geographic coordinates N, E, at an altitude of 433 m a.s.l. The Orb River, which rises from Mount Bouviala in Aveyron, France, runs for 145 km before flowing into the Mediterranean Sea. The dam, completed in 1962, created the reservoir of Avène (180 ha), which has a capacity of 30.6 Mm3. Originally built to provide irrigation and drinking water for the Biterrois plains, the dam also helps to sustain water levels in the lower reaches of the Orb during low flow periods and contributes to aquifer replenishment. In 1975, a 1.3 MW micro-hydropower plant, operated by the Compagnie Nationale d'Aménagement de la Région du Bas Rhône Languedoc (BRL), was installed, using a maximum flow of 3.2 m3 s−1 from the dam releases. Geologically, the upper part of the area drained by the dam consists mainly of limestone, while the area closer to the dam is dominated by clayey sandstone and dolomite (BURGEAP, 2013). Moreover, granite outcrops are observed in the southern part of the catchment near the reservoir, based on data from IGN Géoportail, the French national geoservices platform.
In 2018, broadleaf, evergreen and mixed forests covered respectively 28 %, 9 % and 4 % of the catchment surface area, while rangeland and agriculture areas accounted respectively for 45 % and 8 % as shown in Fig. 1. An analysis of land use changes over the past 30 years, based on CORINE Land Cover data from 1990–2000, 2000–2006, 2006–2012, and 2012–2018, revealed that 0.13 % of the area transitioned from vegetation to pasture, while 2.74 % underwent reforestation (see Fig. S2). Although both types of land use change occurred near the reservoir, they were considered to have a limited impact on long-term sediment supply, as also suggested by Folton et al. (2020). However, the reforestation observed in the vicinity of the dam during the 1990s–2000s likely contributed to a punctual increase in organic matter input during that period.
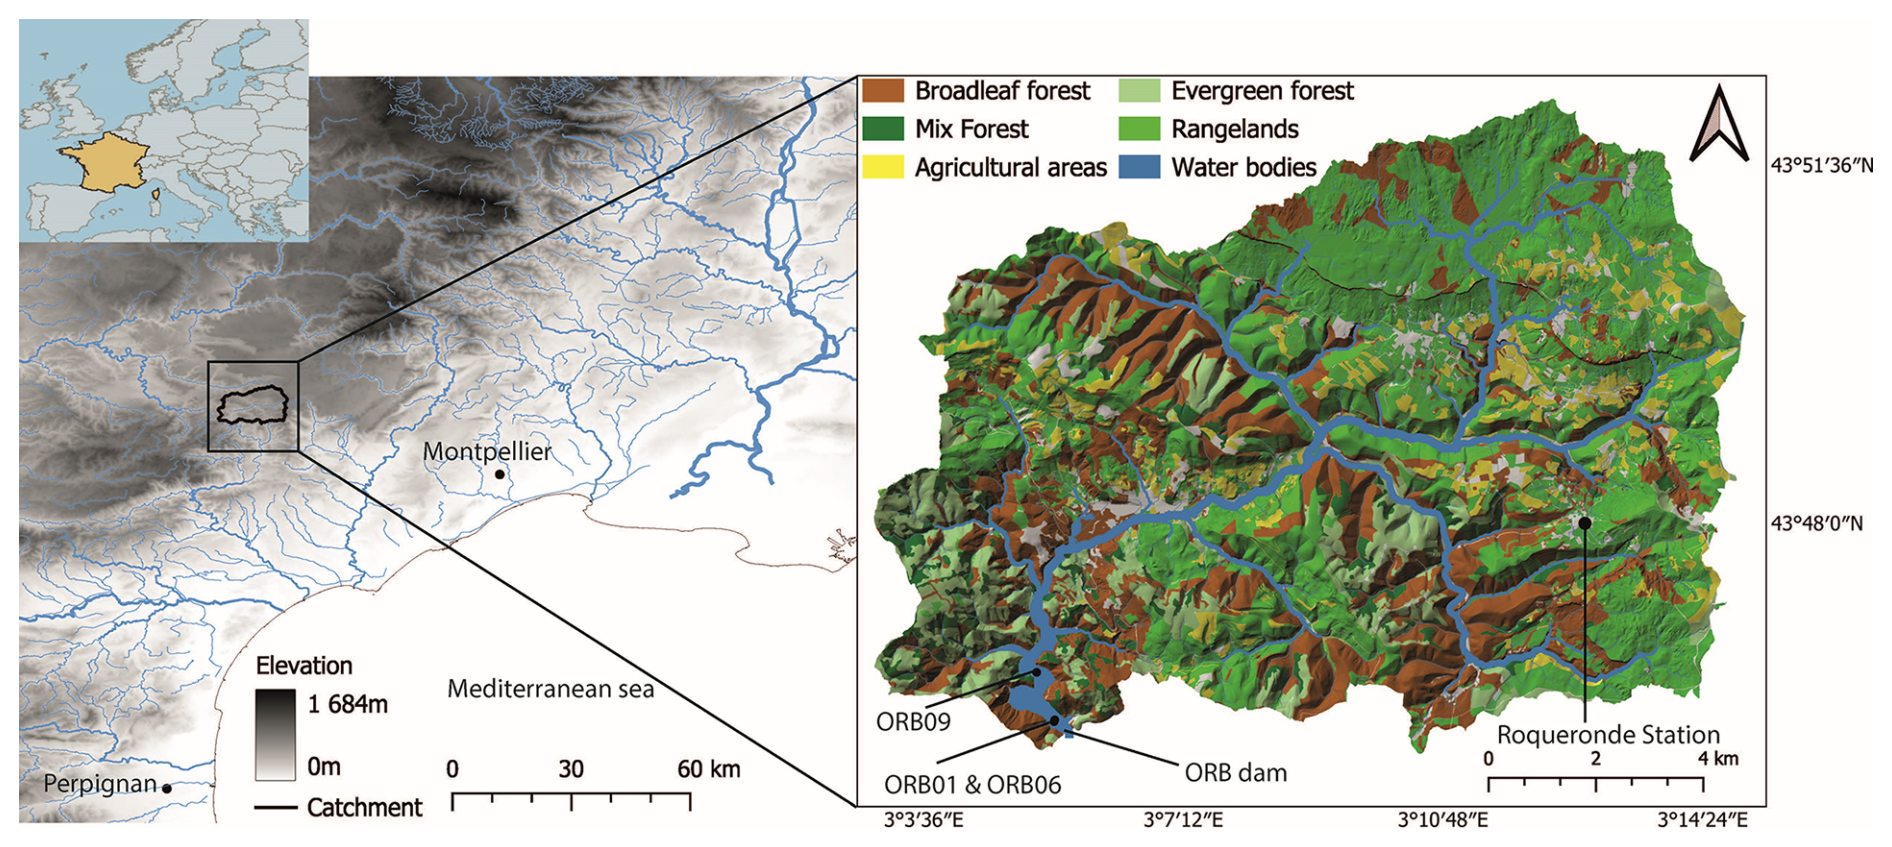
Figure 1Location of the Monts d'Orb catchment in France. The land use map was derived from IGN datasets: RPG (Registre Parcellaire Graphique) 2023, BD Forêt Aveyron 2014, and BD Forêt Hérault 2018. River networks were extracted from https://data.europa.eu/en (last access: 6 November 2025), while water bodies were taken from the BD ORTHO dataset. The 1 m resolution Digital Elevation Model (DEM) for the Hérault department was obtained from IGN Geoservices. The weather station from which the data originate is indicated as “Roqueronde station” on the graph.
The location of the dam in the uppermost part of the Orb catchment, only 15 km from its source, has two main consequences. The dam affects a large part of the River Orb, as 90 % of the river's length is under the influence of the dam while it controls a catchment area of 125 km2, representing only 8 % of the total Orb catchment area, which covers 1545 km2 (BRL, 2011).
Furthermore, the dam is located in the Hérault department, which has a Mediterranean climate with hot summers and mild winters. In contrast, the northern part of the department, where the upper catchment is located, is exposed to a temperate climate with colder winters and higher rainfall. Characterized by extreme rainfall events known as Mediterranean or Cevenol episodes, this region – part of which lies within the Cevennes mountains – is often subject to severe flash floods (BURGEAP, 2013). Although the dam was not originally designed for flood management, this role has become essential during some of these intense weather events.
Although the Cevenol climate is less dominant in the Orb catchment, the Roqueronde station recorded 35 daily rainfall events exceeding 150 mm between 1950 and 2023, including the most extreme Cevenol episode recorded, with 340 mm in a single day on 15 September 2023. The average annual rainfall during this period was 1487 mm.
3.1 Sampling
Three sediment cores were collected using a coring platform and an UWITEC gravity corer equipped with a 90 mm PVC liner. These cores served to the reconstruction of sedimentation dynamics over recent decades and to the evaluation of how extreme precipitation events have influenced sediment deposition within the Monts d'Orb dam catchment. Samples were collected near the dam to obtain sediment cores that are minimally affected by high-energy deposits (hereafter referred to as “instantaneous deposits”) and thus cover a longer time period, as the sedimentation rate was expected to be lower in this area. On 4 October 2023, sediment cores ORB01 (91.5 cm, IGSN https://doi.org/10.58052/IEFOU008V, Hazet, 2023a) and ORB06 (102 cm, IGSN https://doi.org/10.58052/IEFOU008W, Hazet, 2023b) were collected near the dam (280 m) at coordinates N, E and N, E, respectively. On 5 October 2023, the ORB09 core (94 cm, IGSN https://doi.org/10.58052/IEFOU008X, Hazet, 2023c) was retrieved at a distance of 1200 m from the dam, at coordinates N, E. Multiple cores were collected to maximise the probability of collecting an archive covering the maximum sedimentation period. The three cores were taken from the pre-dam river channel identified by the echosounder (Fig. 1). As the ORB01 and ORB06 cores taken the closest to the dam did not reach the previous channel layer, the current analysis focused on the ORB09 core, which was assumed to have reached this level.
3.2 Non-destructive laboratory analyses
The three cores were cut lengthwise and photographed. A visual macroscopic description was made to define the different sedimentary facies, which were then used to carry out a stratigraphic correlation between the cores. The samples were then analyzed at the Laboratoire des Sciences du Climat et de l'Environnement (LSCE, Paris-Saclay, France) using an Avaatech X-ray fluorescence (XRF) core scanner to measure geochemical elements using a rhodium anode. ORB01 and ORB06 were both measured with a 5 mm range step and a 10 s counting time (10 kV, 300 µA and 30 kV, 100 µA), while the ORB09 core was measured with a high resolution 1 mm range step (10 kV, 2000 µA and 30 kV, 1000 µA) and 10 s counting time. The areas of the element peaks provide an indication of the relative concentration of each element in the layer under consideration. After assessing the correlation between geochemical elements, relative density, and grain size, the ratio was identified as the most strongly correlated with particle size (Fig. S3). Consequently, it was prioritized as a high-resolution proxy for detecting high-energy events, such as sediment deposition following major floods, in the core (Croudace, 2015). To validate visually the breakpoints identified with their ratio, the ruptures Python library was applied using the least-squares (“l2”) model to delineate stratigraphic units. Non-calibrated sediment density was recorded with a 0.625 mm resolution along the sediment sequences using Computer Tomography scanner (CT-Scan). CT scan data was acquired using the GE Discovery CT750 HD scanner available at the DOSEO platform (French Atomic Energy and Alternative Energy Commission – CEA – in Paris-Saclay, France). The relative density (expressed in grey value), smoothed out along the width axis, was subsequently extracted from the reconstructed scan images using the open-source software ImageJ. The relative values were then calibrated with dry bulk density (DBD) by measuring the absolute density in a selection of 25 samples collected along the cores and covering the contrasted sedimentary facies identified. Then, a high-resolution Dry Bulk density value (expressed in g cm−3) was obtained through conducting a linear regression between the measured values and the relative density extracted from the CT scan (r2=0.43). Given the geology found in the catchment area, Zr is likely associated with sediment from magmatic or altered sedimentary units, while Rb was rather related to the clayey sandstone formation. Of the three sediment cores, only ORB09 was measured for grain size as it was likely to provide the best historical sedimentation records. Bulk particle size analyzes were performed at 0.5 cm intervals between 1.5 and 93.5 cm depths with a Malvern Mastersizer 3000 device. For each sample, particle size was characterized by the diameters of the fine D10, median D50, and coarse D90 fractions, corresponding to the 10th, 50th (median), and 90th percentiles of the particle size distribution, respectively.
3.3 Sediment core dating
The age-depth model was established based on the analysis of short-lived fallout radionuclide (i.e., 210Pbex, 7Be and 137Cs) concentrations obtained on a total of 26 1 cm thick depth increments collected and analysed along the sedimentary core sequences. Gamma spectrometry measurements were carried out using coaxial HPGe detectors (Canberra//Ortec) available at LSCE (Paris-Saclay, France). Sediment chronology was determined using the CF:CS model (Constant Flux: Constant Sedimentation), which assumes a constant rate of 210Pbex from atmospheric fallout with a constant rate of sedimentation, as no change in annual sedimentation rate trend was observed (Appleby and Oldfield, 1978). The use of this model implies the removal of all identified instantaneous sedimentation events. These events were identified by analyzing the combination of the variations of the following variables: 210Pbex, Density, Grain size, ratio, 7Be and visual observations. A depletion in 210Pbex activity in the measured section likely indicates the occurrence of a significant flood event deposit (Arnaud et al., 2002). A pronounced increase in and relative density values compared to the corresponding stratigraphic unit may serve as a high-resolution proxy for detecting such instantaneous sedimentary event as Zr is found enriched in coarser grains while Rb is mainly found in clay (Croudace, 2015). Moreover, the detection of 7Be in sediment layers suggests a very recent sediment deposition before sampling, as this radionuclide is supplied with rainfall, and exhibits a strong affinity for particles, while decaying with a particularly short half-life of approximately 54 d. Similarly to 210Pbex and 137Cs, 7Be serves as a valuable time marker for identifying the most recent sedimentation events.
The R package SERAC was used to compute the model CF:CS. Age validation was carried out through the identification of events associated with the 137Cs time marker such as the Chernobyl accident (with an emission peak expected in 1986) Bruel and Sabatier (2020). Each estimated age is associated with its uncertainty, defined as the difference between the maximum and minimum estimated ages. The best-estimated age corresponds to the average of these two values. The Sediment Accumulation Rate (SAR, expressed in mm yr−1) was then extracted from this model. By multiplying the SAR (converted to cm yr−1) with the calibrated high-resolution Dry Bulk Density (g cm−3), the Mass Accumulation Rate (MAR, expressed in ) was obtained. Accordingly, the MAR corresponds to the flux of organic and terrigenous material and its temporal changes.
3.4 Precipitation data
The hydroclimatic conditions impacting the hydroelectric capacity of the Mont d'Orb dam were analyzed using continuous and almost complete (99.77 % coverage) data from the Roqueronde station (ID: 34233001), obtained from the Météo-France website. This dataset covers the period from 1 January 1950 to 31 December 2023, and is made available on the French Météo Data Gouv website (https://meteo.data.gouv.fr/datasets/donnees-climatologiques-de-base-quotidiennes/, last access: 6 November 2025). The dataset was divided into two equal time series, 1950–1986 and 1987–2023, to ensure a representative sample on each side for statistical analysis. The only missing data correspond to August and September 1982. In the literature, and according to international guidelines, it is recommended to handle missing data to ensure data integrity and homogeneity (WMO, 2022). To address this gap, a non-parametric bootstrap resampling method was applied using the statistical properties of the 1950–1986 period. As no major flood was reported during this period (BRL, 2011), the resampling was constrained by an upper limit of 100 mm. Total annual accumulated precipitation was analyzed by season, along with potential shifts in its annual distribution, comparing the periods before and after 1986 to ensure an equal division of the time series. The non-parametric Mann-Whitney test was employed to compare the two time periods and assess the potential occurrence of statistical differences between their distributions. To ensure statistical significance, the study analyzed the annual and seasonal distributions of monthly summed precipitation. Q-Q plot analysis was carried out in order to compare the extremes that took place during the pre- and post-1986 periods. Additionally, the occurrence and the distribution of extreme daily precipitation were compared between the two periods using thresholds ranging from 100 to 150 mm, with a 10 mm step, as significant historical events have been linked to precipitation amounts being found within this range. Given the heterogeneous definitions of Cévenol episodes in the literature and the spatial variability of precipitation thresholds associated with extreme events (Boudevillain et al., 2009) our methodology is designed to (1) ensure robustness to threshold sensitivity, (2) retain a statistically representative sample of extreme events, and (3) account for the hydroclimatic specificities of the study region. The minimum threshold of 100 mm of precipitation in a single day was based on 99.5th quantile and 150 mm to the amount 99.9th quantile. This methodology aligns with Ribes et al. (2019), who quantified trends in extreme precipitation across the French Mediterranean using thresholds of 100–300 mm (10 mm increments). In addition, changes in extreme rainfall intensity between the two periods were assessed by analyzing annual and seasonal maximum daily precipitation. The Mann-Kendall and Mann-Whitney tests were performed to evaluate the statistical significance of changes between the two periods.
Following a similar approach, a sensitivity analysis was conducted to assess potential statistical changes in the distribution of Consecutive Dry Days (CDD) between the two periods. CDD is a drought index recommended by the World Meteorological Organization (WMO) to evaluate dry spell occurrences. A dry day was defined as a day with precipitation below 1 mm, following the criteria established by the Expert Team on Climate Change Detection and Indices (ETCCDI). CDD values were computed for quantiles ranging from the 90th to the 97.5th percentiles, corresponding to durations of 11 to 19 consecutive dry days.
Additionally, soil drought conditions were analyzed using the 12 month Standardized Precipitation Index (SPI-12). Precipitation data were aggregated with a 12 month left-aligned rolling window, fitted to a gamma distribution via maximum likelihood estimation, and subsequently transformed into a standard normal distribution (mean=0, standard deviation=1). To assess potential changes in the long-term frequency and severity of drought events, SPI-12 distributions before and after 1986 were compared using the Mann-Whitney test.
3.5 Hydropower variation assessment
Pearson correlation analyses were conducted to assess the relationship between annual hydropower generation (obtained from BRL, 2011) and precipitation totals at both annual and seasonal scales. To better understand historical variations in hydropower generation from 1976 to 2022, it is important to consider that the dam has been operated under different management guidelines over time. Three distinct water level management periods can be identified: 1976–1997, 1998–2005, and post-2005. For the 1976–1997 period, (BRL, 2011) indicates that the dam was managed with a maximum water level of 430 mNGF (Nivellement Général de la France). Given that the post-2005 guidelines aimed at restoring optimal storage conditions, it was assumed that the management practices of 1976–1997 were broadly similar to those implemented after 2005 which is the most detailed operational framework available (BRL, 2011). Then it was assumed that the maximum water level was managed from 426 to 430 mNGF. Between 1998 and 2005, at the request of local authorities, the maximum water level setpoint was lowered to 424.30 mNGF. Additionally, a proposal by BRL suggested a further reduction to 417.5 mNGF between 15 September and 15 February to enhance flood control. However, as this proposal was not officially validated and does not appear to have been consistently applied in historical data, the water level during this period was likely managed within a range of 417.5 to 424.30 mNGF, following a guideline similar to that prevailing for the post-2005 management. Since 2006, a monthly maximum water level setpoint has been applied, ranging from 426 to 430 mNGF (Table S1 in the Supplement). This framework provides a consistent framework for analyzing the influence of water level management on hydropower generation across the entire study period. Water level data from 1980 to 2024, provided by BRL, recorded at varying resolutions (averaging one measurement per week), was used to compute deviations from the corresponding setpoint, which varies by month and by period. These deviations were then averaged seasonally and annually, and a Pearson correlation was computed with annual hydropower generation, excluding years with dam emptying (i.e., 1980, 1990, and 2000). The most detailed operational framework is available for the post-2005 period, as outlined by BRL (2011). The assessment of reservoir operations under environmental constraints was guided by the dam's operational priority order: (1) maintaining water supply during low-flow conditions, (2) managing flood risks, and (3) optimizing hydropower production.
4.1 Core description and instantaneous events
ORB09 was subdivided into units showing similar geochemical properties, as illustrated by its ratio and granulometric range values. A certain heterogeneity of layer properties was observed in the three cores, with colours ranging from light to medium and dark brown. Alternation between thin light and dark layers reflects variations in geochemical properties and grain size distribution. The ORB09 core has been divided into three units: Unit 1 (0–44.5 cm), Unit 2 (44.5–67.5 cm), and Unit 3 (67.5–94 cm), based on visual observation and ratio breakpoint analysis as shown on Fig. 2.
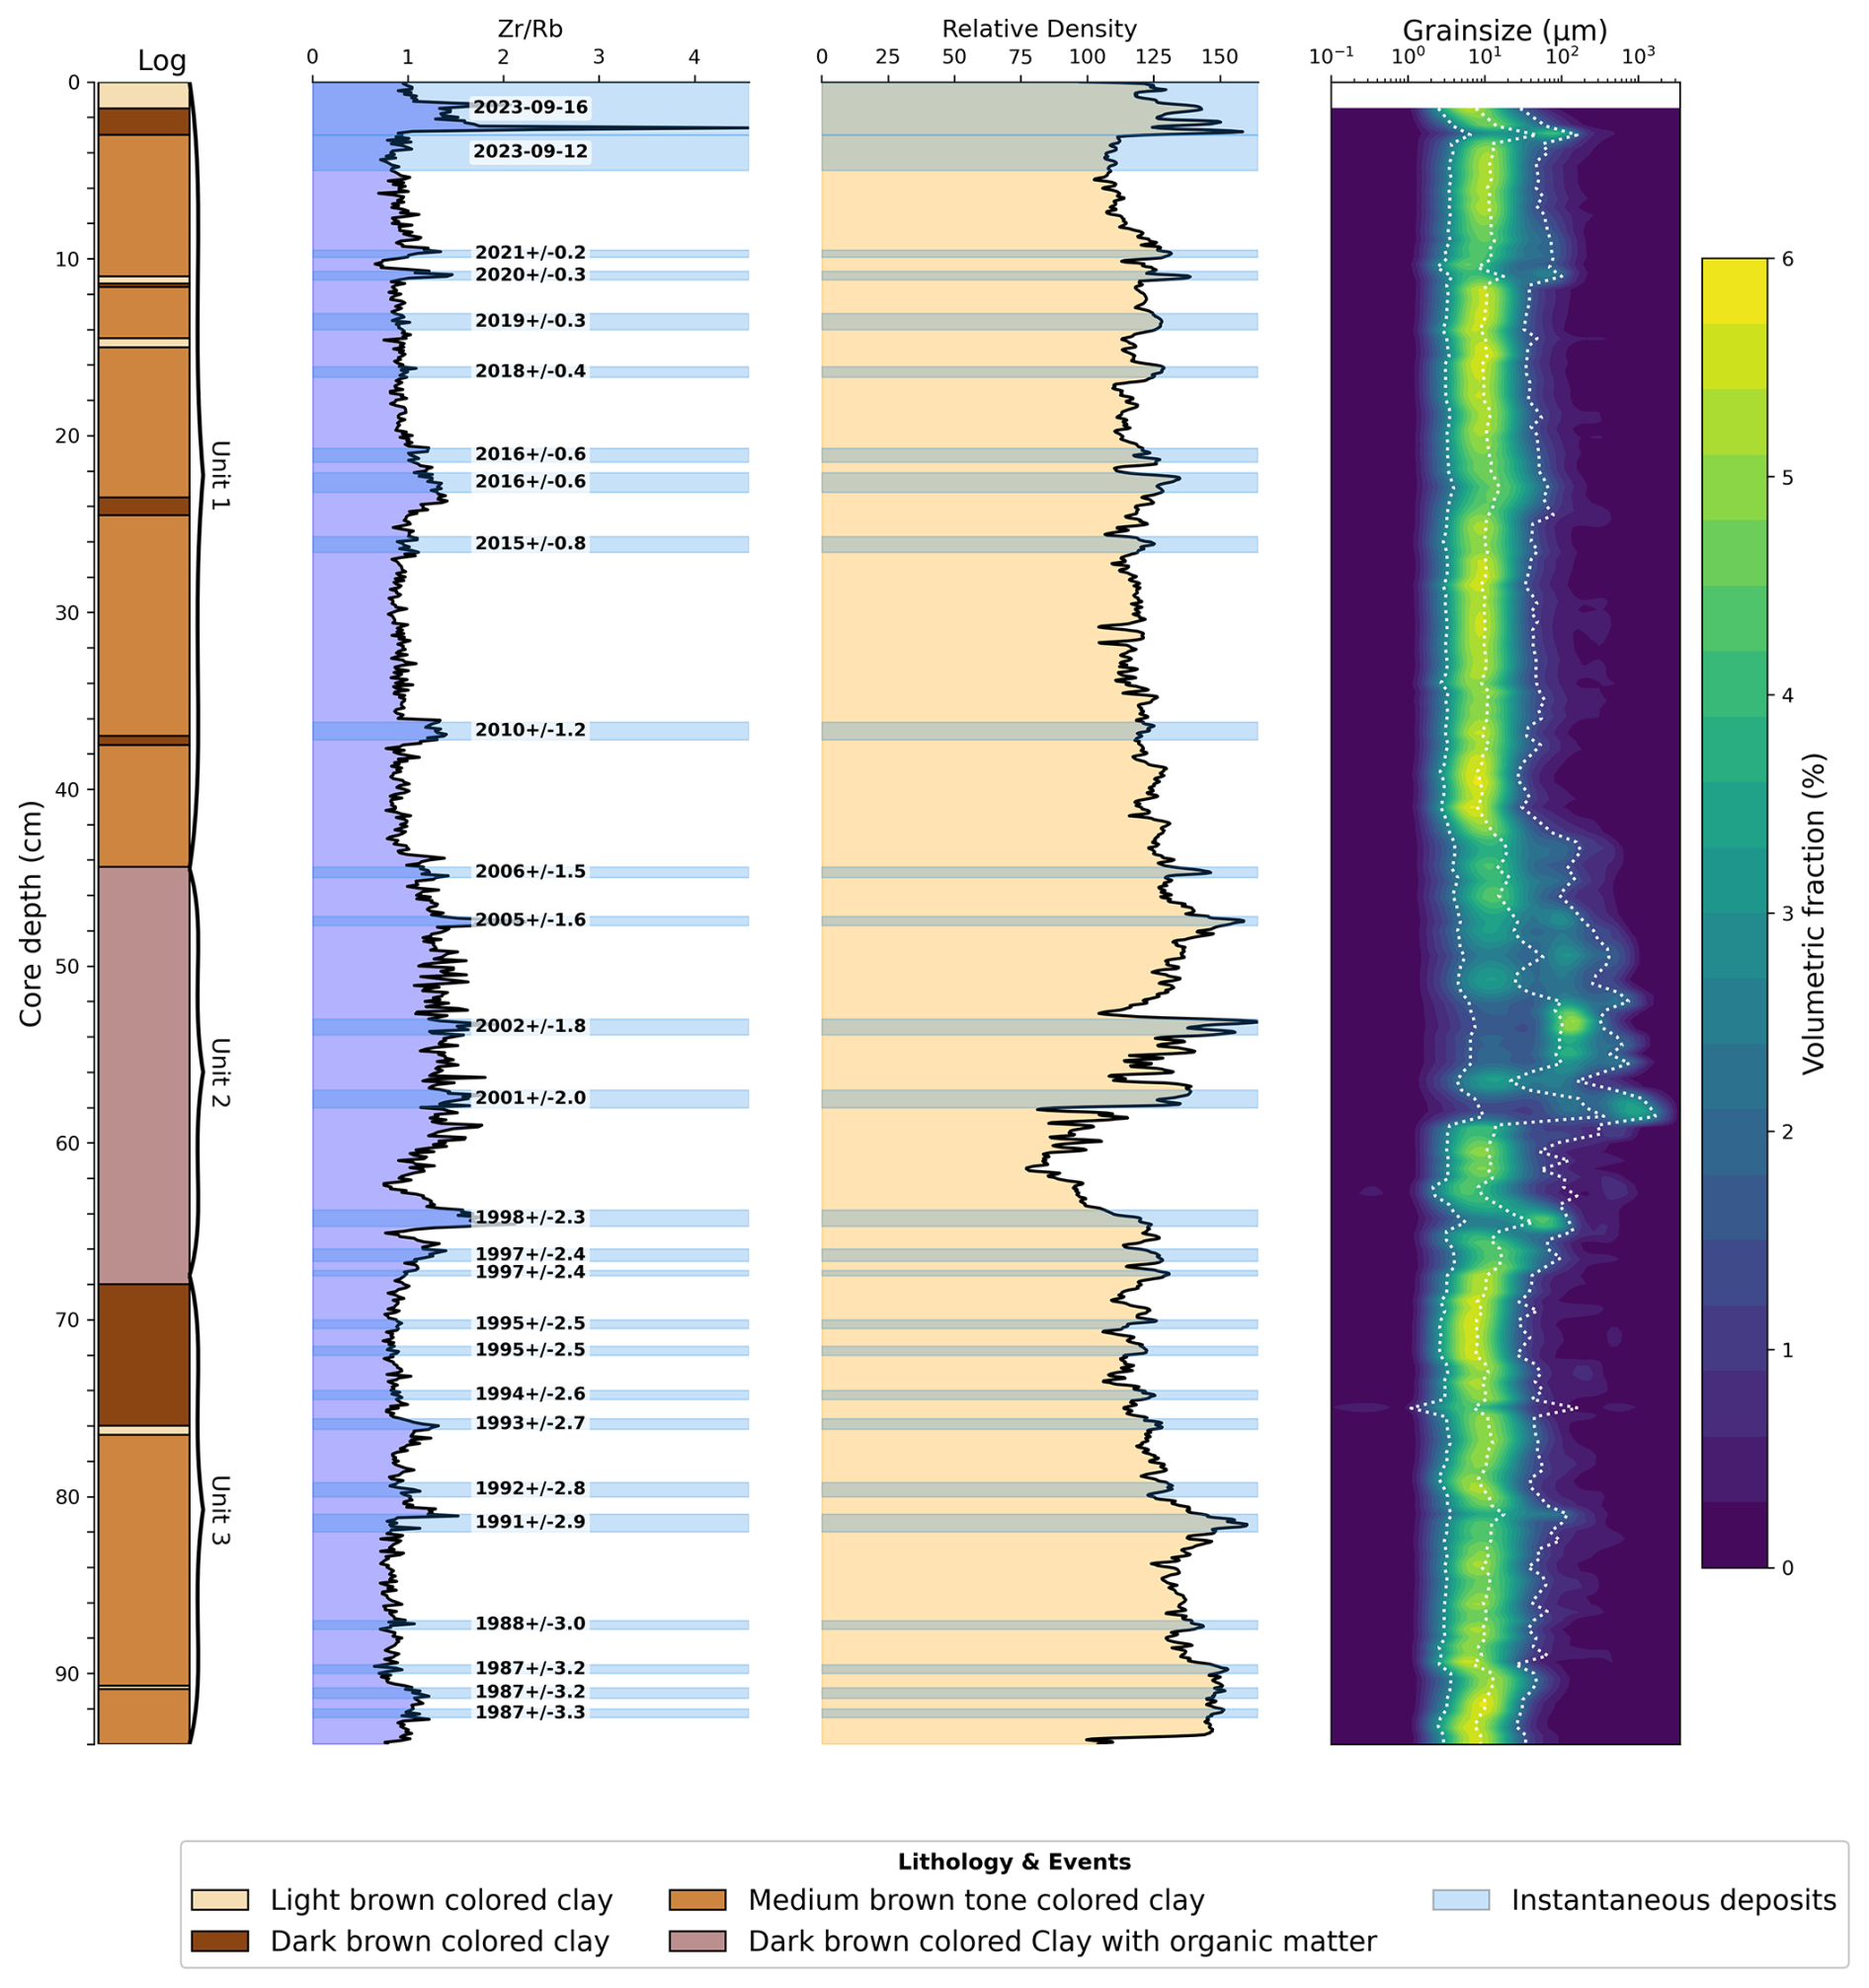
Figure 2Sediment core log (left), variations in ratio with depth and relative density profile (center), and spectral granulometry based on volumetric fraction (right). Blue rectangles represent instantaneous events detected with proxy methodology. The 10th quantile, median, and 90th quantile of particle size diameter along the core depth are represented by white dotted lines.
In Unit 1, the 0–3.0 cm layer shows mean (1.4) and relative density (131.2) values, higher than the stratigraphic averages excluding Cevenol episodes (1.0 for and 119.9 for relative density). A marked increase in grain size is observed toward the bottom of this section. Some variations in sediment core color coincide with fluctuations in and relative density. The average values for D10–D90 particle size is 3.3–53.6 µm. In Unit 2, the sediment core darkens, indicating a higher organic matter content. This unit contains crushed leaf residues, as observed in Fig. 3 and observed in CT-scan images. This color change is accompanied by an overall increase in values and grain size. An exceptional variation in particle size diameter is observed between 56.9 and 57.9 cm. A sharp decrease in both and relative density is observed between 61.0 and 63.0 cm, followed by a return to grain size values similar to those of Unit 1 before increasing again. In Unit 3, and particle size diameter averages return to values similar to those observed in Unit 1. The sediment color transitions back to medium to dark colour shades, with a lower organic matter content compared to Unit 2.
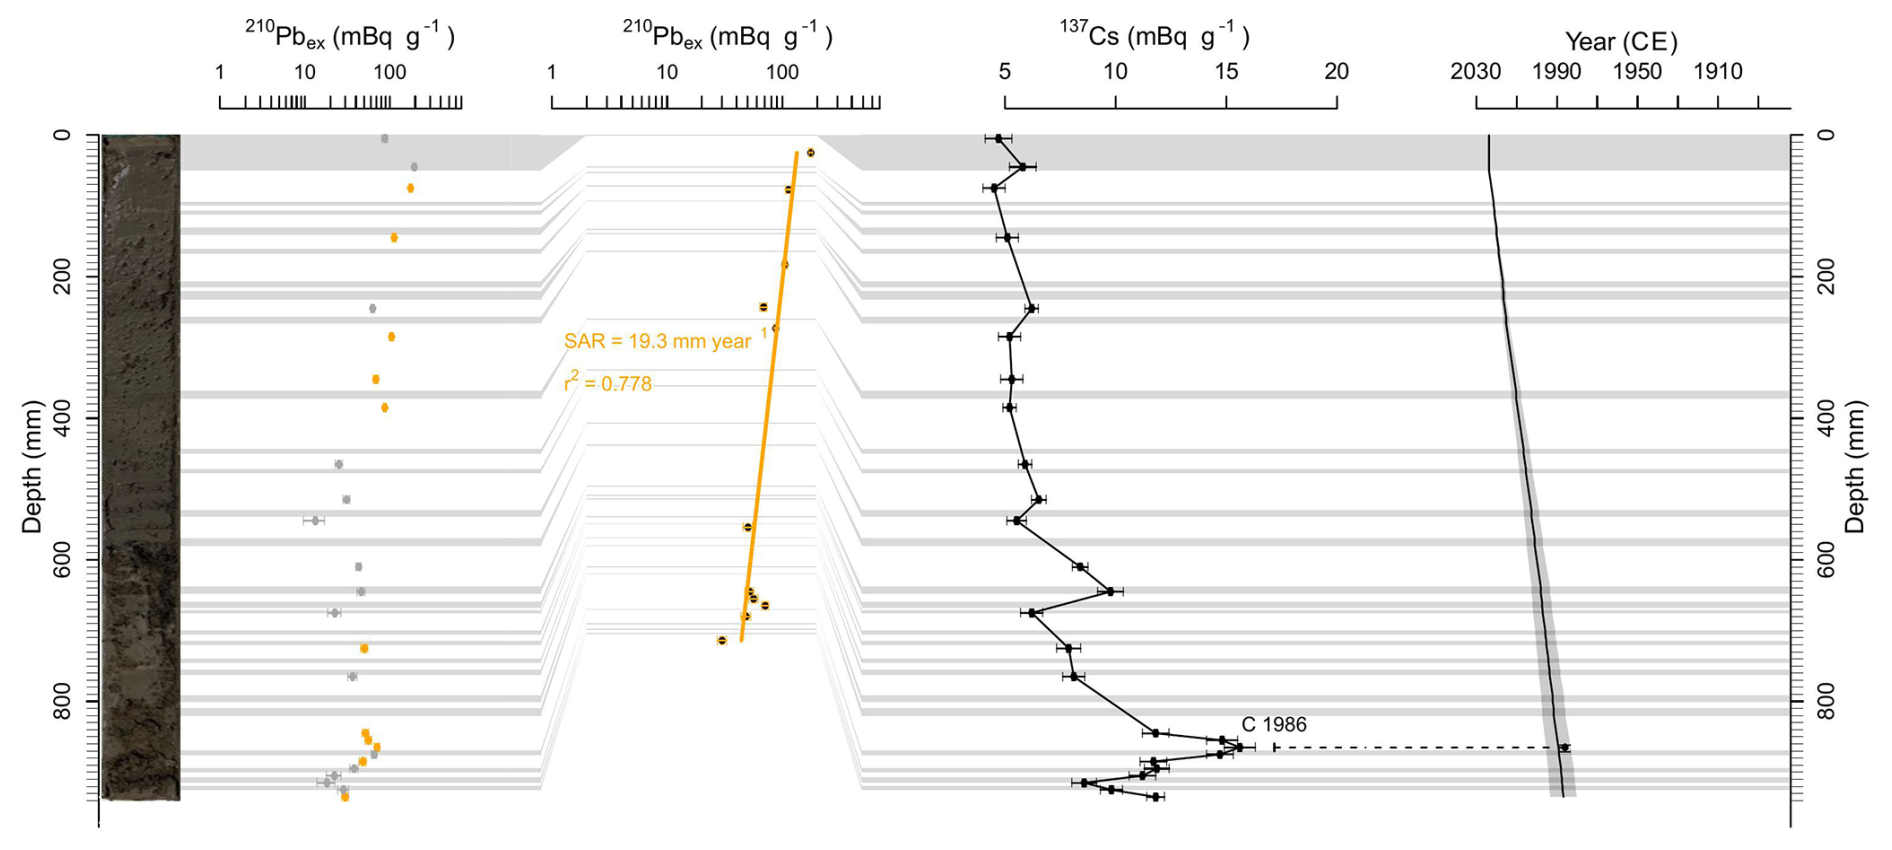
Figure 3Age model constructed for the ORB09 sediment core using fallout radionuclide activities. From left to right: measured 210Pbex values (orange dots indicate values retained for the model, grey dots excluded from depleted layers); log-linear regression applied to the retained 210Pbex values; 137Cs activity as a function of depth (the shallow peak at 640–650 mm is interpreted as bioturbation, while the deeper peak corresponds to the 1986 Chernobyl fallout); and estimated deposition years according to the age model. Age uncertainty was computed using the delta method (first-order error propagation).
A slight increasing trend in relative density is observed with depth. Across the three stratigraphic units, fluctuations in values closely follow those of relative density. Notably, increases in particle size diameter align with pronounced rises in relative density and values. Based on the , relative density, and particle size diameter proxy methodology, 27 notable instantaneous events were identified in core ORB09, with their characteristics being detailed in Table S2.
In Fig. 2, instantaneous deposits are identified based on proxy fluctuations. Their ages are shown according to the final chronology, i.e. after age model construction and validation (see Sect. 5.2.1).
4.2 Establishment of an age model
Deposits associated with instantaneous events were excluded before computing the age-depth model. The model was constrained to September 2023 for the upper two layers of the ORB09 core. The resulting 210Pbex age model is presented in Fig. 3. Variations in 210Pbex activity with depth follow a linear trend in a semi-logarithmic plot. The corresponding linear regression model, with a coefficient of determination r2=0.778, provides a Sediment Accumulation Rate (SAR) of 19.3 mm yr−1.
Two 137Cs peaks were identified along the core. The first peak corresponding to an activity of 15.6 mBq g−1 is located between 86 and 87 cm depths, while the second 9.8 mBq g−1 is found between 64 and 65 cm. The 210Pbex age model dates the first peak to 1989 and the second peak to 1997–1998. The 137Cs peak at 86–87 cm is consistent with the 1986 Chernobyl fallout, as reported in other studies conducted in the region (Sabatier et al., 2008; Meusburger et al., 2020). In our case, the age model assigns this peak to 1989, with an uncertainty range of [1983–1989], which encompasses 1986. This overlap supports the attribution to Chernobyl and validates the age model within approximately ±3 years – an uncertainty that falls within the same order of magnitude as reported in the existing literature (Sanchez-Cabeza and Ruiz-Fernández, 2012; Simms et al., 2008).
Age models were calculated for both ORB01 (Fig. S4) and ORB06 (Fig. S5) cores, yielding r2 values of 0.264 and 0.106, and sediment accumulation rates (SAR) of 112.57 and 224.8 mm yr−1 respectively. The bottom of core ORB01 was dated to approximately 2016, while that of ORB06 corresponded to around 2019.
4.3 Extreme rainfall events and sedimentation dynamics
Annual sediment fluxes were estimated using the MAR derived from the age model. However, uncertainties in the age model, combined with the high frequency of instantaneous deposits, complicated the identification of historical extreme events. Despite these challenges, major historical flood periods provided a complementary time reference, allowing for an assessment of the method's accuracy in detecting extreme rainfall events. The pronounced shift in proxy properties observed in Unit 2 between 44.4 and 67.5 cm may serve as a stratigraphic marker to this end. Weather data from the Roqueronde station, along with the 2011 BRL report (BRL, 2011), indicate a significant concentration of intense precipitation followed by widespread flooding between late 1994 and 1997, as summarized in Table S3. The estimated age of the sediment layer at 67.5 cm depth, corresponding to the base of Unit 2, is 1997 ±4.8 years.
By analyzing extreme event dynamics through particle-size proxies and MAR, erosion fluxes were quantified and classified based on the dominant process, distinguishing between continuous erosion and instantaneous events. This classification was made possible through the extreme event proxy methodology combined with age model estimations as shown in Fig. 4.
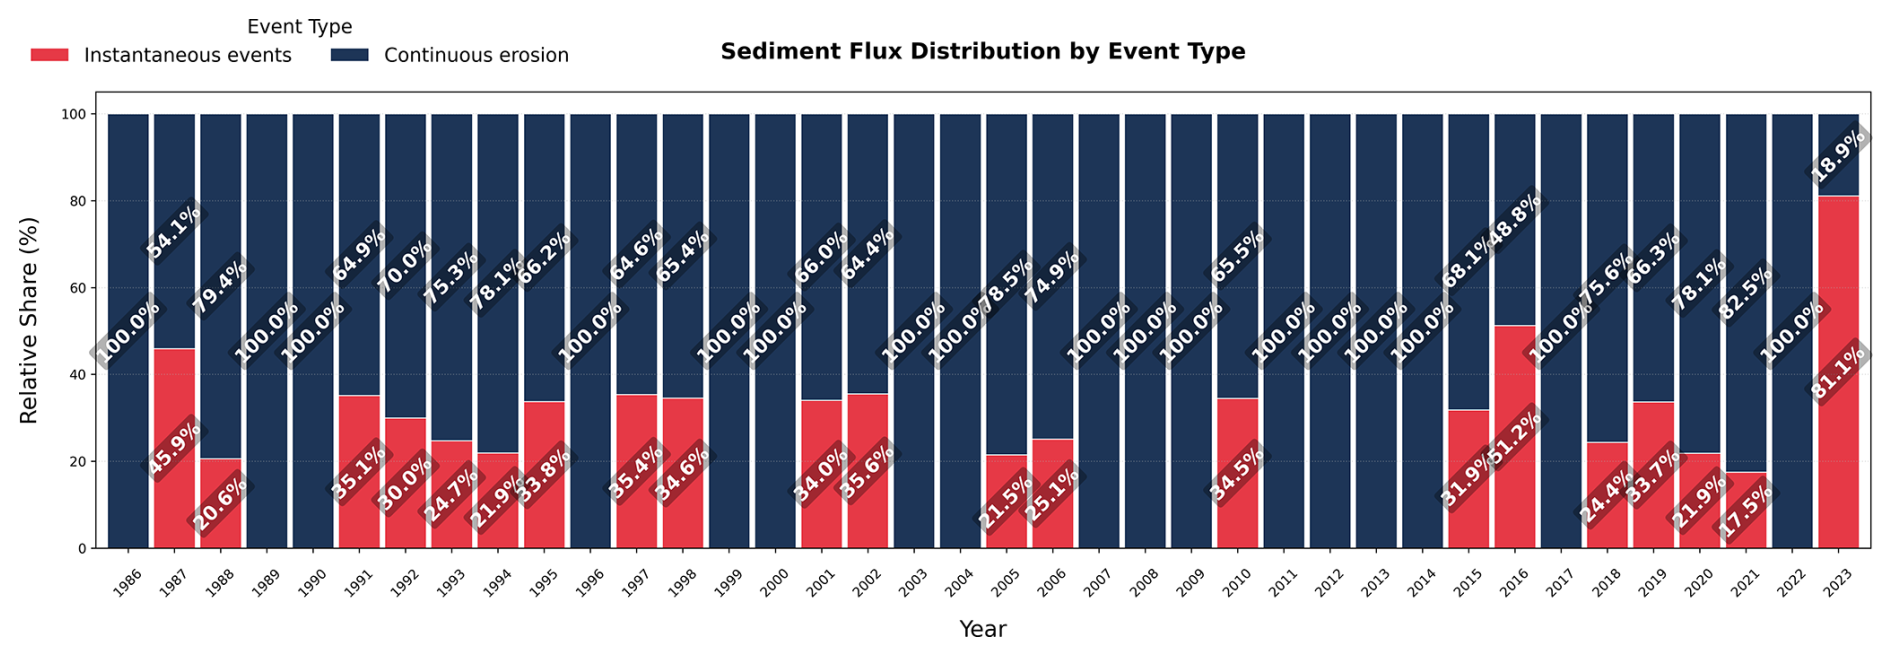
Figure 4Relative sediment supply delivered either by continuous erosion or by instantaneous events over the age range estimated by the age model.
It can be observed that in some years, no contribution from instantaneous events could be identified. According to this evaluation, the contribution of Cevenol episodes to the total annual sediment yield ranges from 20.6 % (±6.2 years for the estimated year 1988) to 81.1 % in 2023.
4.4 Historical mean and extreme precipitation changes
Figure 5a illustrates the seasonal contribution to annual precipitation from 1950 to 2023, with winter and fall showing the highest contributions. Figure 5b presents a violin plot of monthly cumulative precipitation, revealing a statistically significant decrease in the average monthly value between 1950–1986 and 1987–2023 (p=0.046), from 126.18 to 119.82 mm month−1 (−5.1 %). Both distributions remained unimodal. The second period exhibits a slightly longer upper tail for values exceeding 600 mm month−1 and a peak frequency shifted toward lower values.
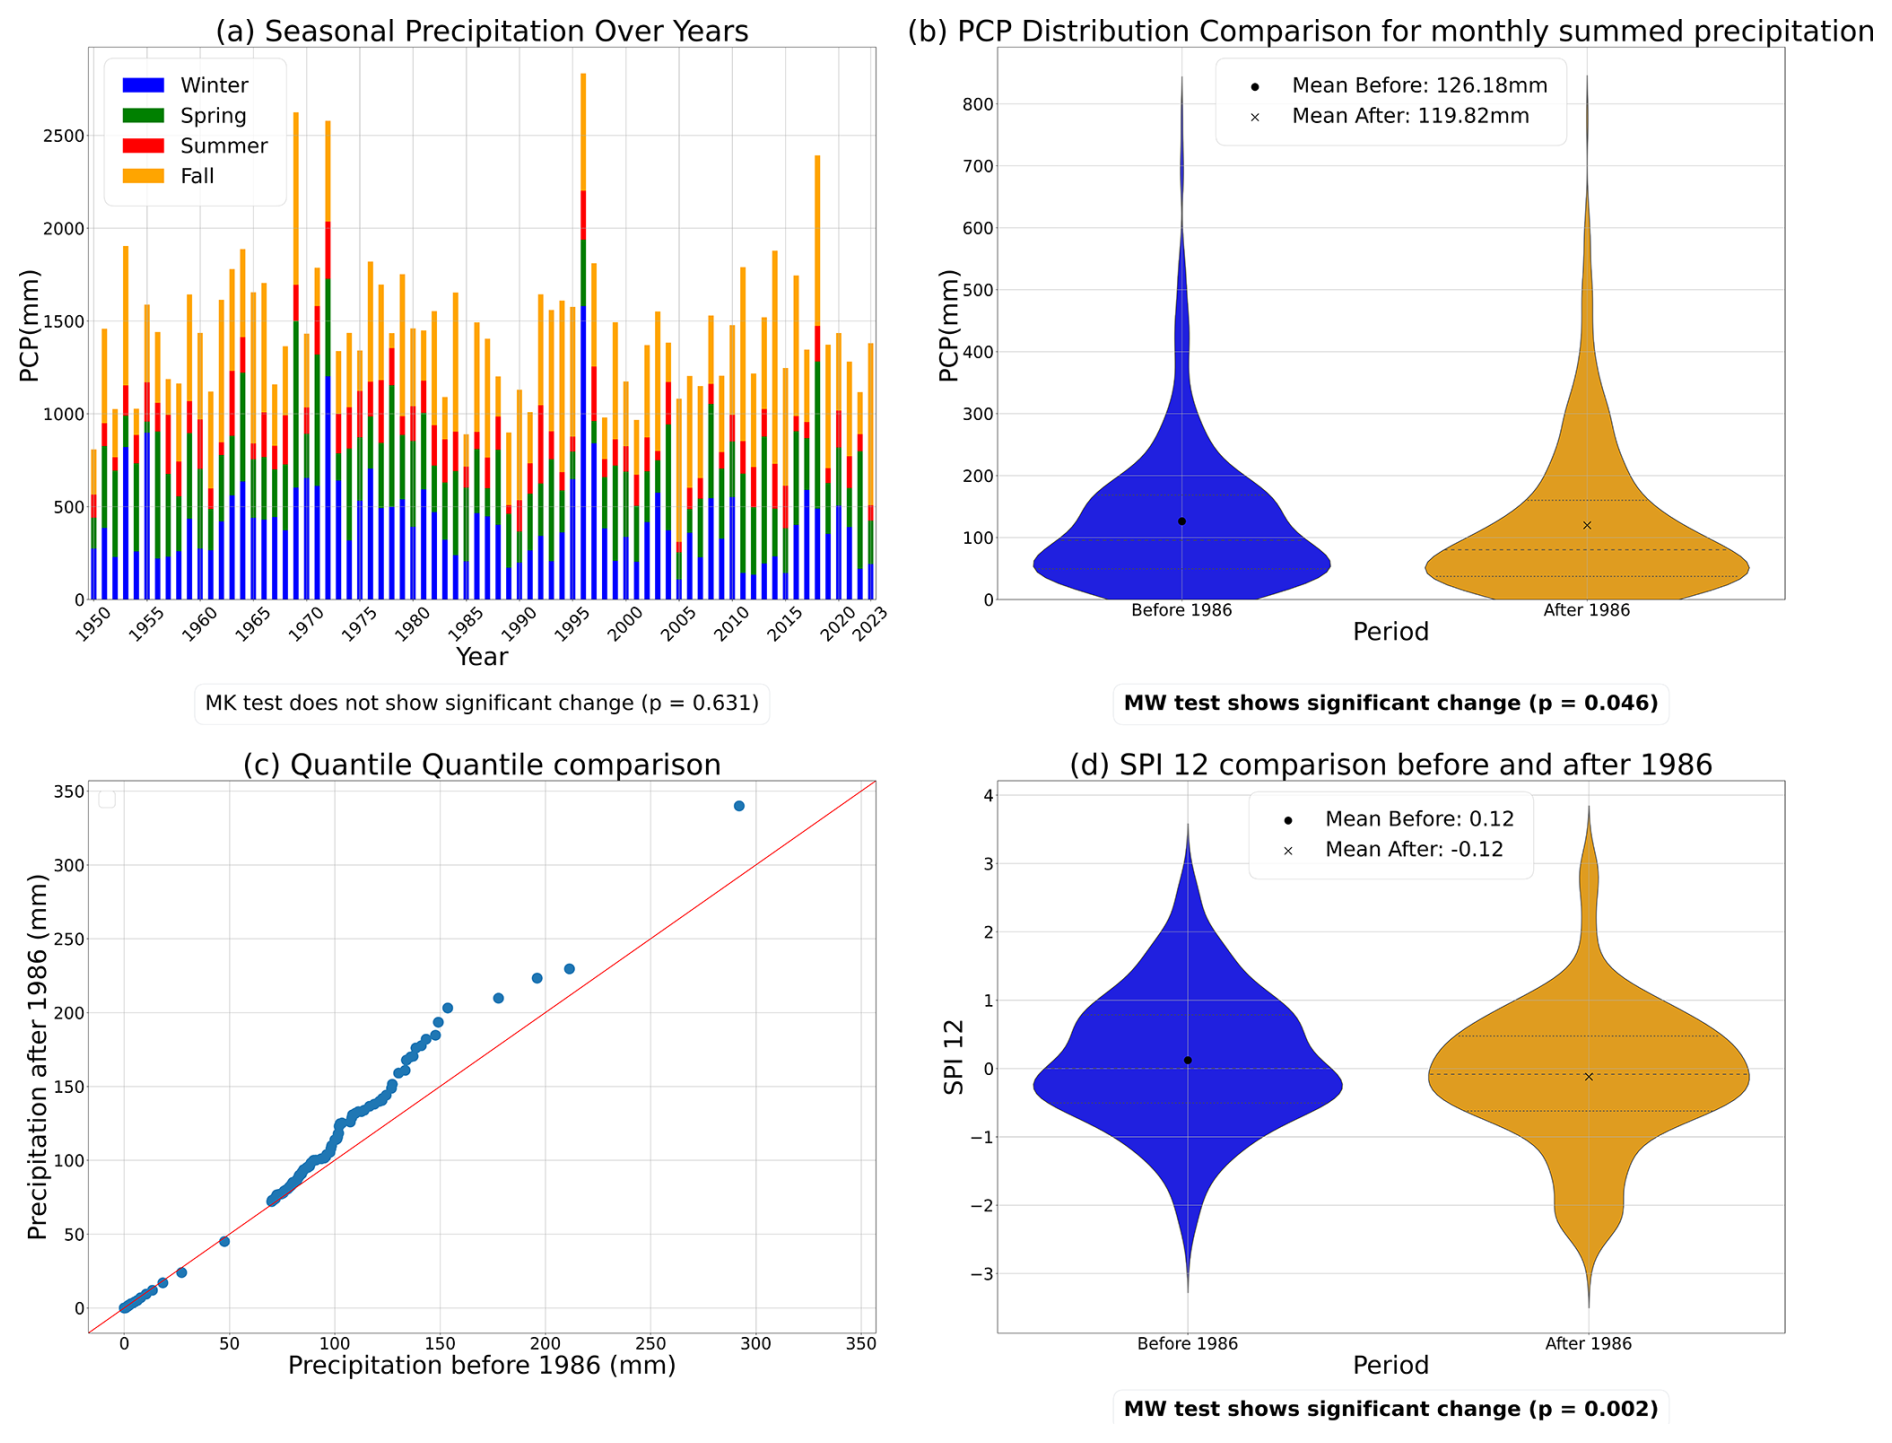
Figure 5(a) Distribution of total annual precipitation categorized by season. (b) Analysis of statistical changes in the annual distribution of monthly accumulated precipitation. (c) Quantile-quantile (Q-Q) comparison of precipitation data. (d) Analysis of statistical changes in the distribution of the 12 month Standardized Precipitation Index (SPI-12).
Figure 5c displays a Q-Q plot comparing the quantiles of both periods. Above 100 mm, the second-period quantiles are generally higher than those of the first period, as indicated by the points lying above the y=x line.
To assess changes in dry conditions, we generated a violin plot of the 12 month Standardized Precipitation Index (SPI-12) for the periods before and after 1986, which represents the midpoint of the dataset (Fig. 5d). The Mann-Whitney test indicates a statistically significant difference (p=0.002), with a decrease in the average SPI-12 after 1986. A higher frequency of SPI-12 values below −2 is observed, while values between 1 and 2.5 occurred less frequently. No noticeable changes were observed for values above 2.5.
To further refine our understanding of changes between the two time periods, a seasonal analysis was conducted. The seasonal distribution of monthly cumulative precipitation was compared between the two periods with violin plots in Fig. S6.
The analysis of seasonal precipitation distributions for the pre- and post-1986 periods reveals a unimodal pattern across all seasons (Fig. S6). In Fig. S7, a statistically significant reduction of 19 % in average winter precipitation was detected using both the Mann-Whitney (p=0.010) and Mann-Kendall tests (p=0.045). For summer, the Mann-Whitney test indicates a significant decline of 20 % (p=0.018), while the Mann-Kendall test suggests a nearly significant trend (p=0.057). Spring precipitation experienced a non-significant decrease of 13 % (MW p=0.105, MK p=0.343). In contrast, fall precipitation exhibited a 22 % increase, which was statistically significant according to the Mann-Kendall test (p=0.046) and close to significance following the Mann-Whitney test (p=0.069). A summary of seasonal precipitation changes is presented in Table S4.
As shown in Fig. S6a, the pre-1986 fall violin appears to have a slightly longer tail than the post-1986 violin. However, the post-1986 distribution exhibits a higher frequency of extreme values between 600 and 700 mm. Figure S6b illustrates that the post-1986 spring violin plot has a thinner tail compared to the pre-1986 period, with no significant change in length. The primary peak appears to have shifted downward, and the frequency of precipitation between 100 and 200 mm is reduced, while values below 100 mm are more frequent. In Fig. S6c, the summer violin plot shows no significant change in tail length, but the post-1986 tail is thinner compared to the pre-1986 plot. Additionally, intermediate values between 50 and 100 mm month−1 occur less frequently. Decrease in summer monthly precipitation is significant in Mann-Whitney test (p=0.031). Figure S6d reveals a very slight change in winter tail width between the two periods, without noticeable variations in tail length. The main peak in precipitation for the post-1986 period is significantly lower than that of the pre-1986 period, showing a marked decrease (p=0.009) based on the Mann-Whitney test performed on monthly cumulative precipitation, and confirmed by the Mann-Kendall test on seasonal cumulative precipitation (p=0.045).
To further refine our understanding of distributional changes, we conducted an analysis of precipitation variability (Fig. S8). At the annual scale, a non-significant increase of 7 % was observed in daily precipitation variability for both tests. In winter, a non-significant decrease of −12 % was found. Spring and summer respectively exhibited non significant and significant decreases of −10 % and −23 %, according to the Mann-Whitney test (p=0.068 and p=0.025). In contrast, fall showed a significant increase in variability of 28 % for both tests (MK p=0.014, MW p=0.025).
To further investigate the increase in quantiles in the second period compared to the first (Fig. 5c), a comparison of extreme precipitation occurrences was conducted across different thresholds. Increasing the threshold for intense precipitation from 100 to 150 mm led to a rise in annual occurrences ranging from +32 % to +214 % with significance for 140 and 150 mm threshold (see Fig. S9). The variation in extreme event occurrences across thresholds does not exhibit a consistent pattern, with fluctuations that lack a clear increasing or decreasing trend in summer and winter. In spring, the number of extreme event occurrences increases for thresholds between 110 and 150 mm, ranging from +20 % to +200 %. Conversely, a 25 % decrease is observed for the 100 mm threshold. The most pronounced annual increase is observed in fall, when occurrences rise by 87 % to 400 % for thresholds comprised between 100 and 150 mm. This increase is statistically significant according to both the Mann-Kendall and Mann-Whitney tests for precipitation thresholds ranging from 100 to 150 mm (MK p-values: 0.005–0.028; MW p-values: 0.008–0.041). The annual occurrence of extreme events was found to be statistically significant for both tests at the 140 mm threshold (Mann-Kendall: p=0.032; Mann-Whitney: p=0.032) and at the 150 mm threshold (Mann-Kendall: p=0.040; Mann-Whitney: p=0.023) see Fig. S9. Moreover, the intensity of extreme rainfall was analyzed through the annual and seasonal maximum daily precipitation, and assessed using the Mann-Kendall and Mann-Whitney tests. Annual maximum daily precipitation shows a non-significant increase for both tests of 16 % compared to the pre - 1986 period. A non-significant decrease of −11 % and −9 % of average maximum daily precipitation for the pre-1986 period was found for winter and spring for both tests. Summer showed a non significant decrease of −26 % of extreme rainfall intensity following the Mann-Kendall (p=0.24) test but it was found to be significant according to the Mann-Whitney test (p=0.025). In contrast, a significant increase of 31 % was observed for the fall season following both statistical tests (MK p=0.020 and MW p=0.035) (Fig. S10).
To assess more comprehensively the downward displacement of SPI distribution towards negatives values during the post- 1986 period, extreme drought conditions were assessed by analyzing changes in the occurrences of Consecutive Dry Days (CDD) between the two periods for thresholds ranging from 12 to 20 d. The results, summarized in Table S4, do not reveal a consistent trend across the threshold range for annual CDD (Consecutive Dry Days) evolution. In fall, non-significant decreases in CDD occurrences were observed for the 12, 16, and 20 d thresholds, with reductions of −2 %, −4 %, and −47 %, respectively, while a non-significant increase of +8 % was found for the 13 d threshold. Spring CDD occurrences show a non-significant increase between the two periods, ranging from +9 % to +24 %. In summer, CDD occurrences increased by 12 % and 5 % for the 12 and 13 d thresholds, respectively, while the 16 and 20 d thresholds showed a decrease of −13 % and −5 %. For winter, an increasing trend in CDD occurrences is observed, ranging from +33 % to +250 % for the 13 to 20 d thresholds, while a slight decrease of −3 % was found for the 12 d threshold. The Mann–Whitney test indicates statistically significant differences for the 13, 16, and 20 d thresholds (p=0.037, p=0.012, and p=0.035, respectively) (Fig. S11). To further explore changes in drought conditions between the two periods, the maximum annual value of CDD was analyzed at both annual and seasonal scales, as shown in the Supplement to assess drought intensity. The annual scale analysis revealed a non-significant increase of 4 %. Seasonal trends showed non-significant decrease of −1 % for spring and non significant increase of 2 % and 5 % in summer and fall respectively. Winter, however, exhibited a close to significance increase of 20 % in maximum consecutive days for Mann-Whitney test (p=0.078) (Fig. S12). The results are summarized in Table S4.
4.5 Hydropower generation change assessment
Figure 6 presents water level management, recorded at an average frequency of one measurement per week, alongside annual hydropower generation. The three subplots at the top of the figure correspond to distinct periods of water level management, each displaying the highest monthly maximum water level setpoint (black dotted line) and the lowest monthly maximum water level setpoint of the year (red dotted line). Water levels are plotted annually to analyze the seasonality of water management over time. During the first period (1976–1997) (Fig. 6a), greater variability in water levels is observed during winter and spring compared to the other periods. Water levels occasionally dropped below the minimum setpoint of 426 mNGF, reaching approximately 410 mNGF during the fall season for flood control purposes. Notably, in 1980 and 1990, water levels dropped to nearly 380 mNGF during the fall. For the 1998–2005 period (Fig. 6b), winter water level variability was reduced compared to 1976–1997, with levels generally maintained above the minimum setpoint of 417.5 mNGF, except during the fall flood control season. In 2000, water levels reached as low as 390 mNGF. Additionally, the fall low water level range was narrower than during the previous period, particularly after 2002–2003. In the post-2005 period (Fig. 6c), water level variability was drastically reduced during winter and spring, and no curve dropped significantly below 410 mNGF. During the January–August period, water level curves generally remained within the setpoint range, except for the 2023 curve, which fell below the red dotted line. A shift in hydropower generation has been observed since 1998, following a change in the operating law. Despite a return to baseline conditions, hydropower generation has not reached pre-1998 levels. A 29 % decrease in annual hydropower generation was recorded during the period 1999–2022 compared to the production between 1976–1998. More specifically, hydropower generation declined by 38 % during 1998–2005 and by 25 % after 2005, compared to the 1976–1997 baseline.
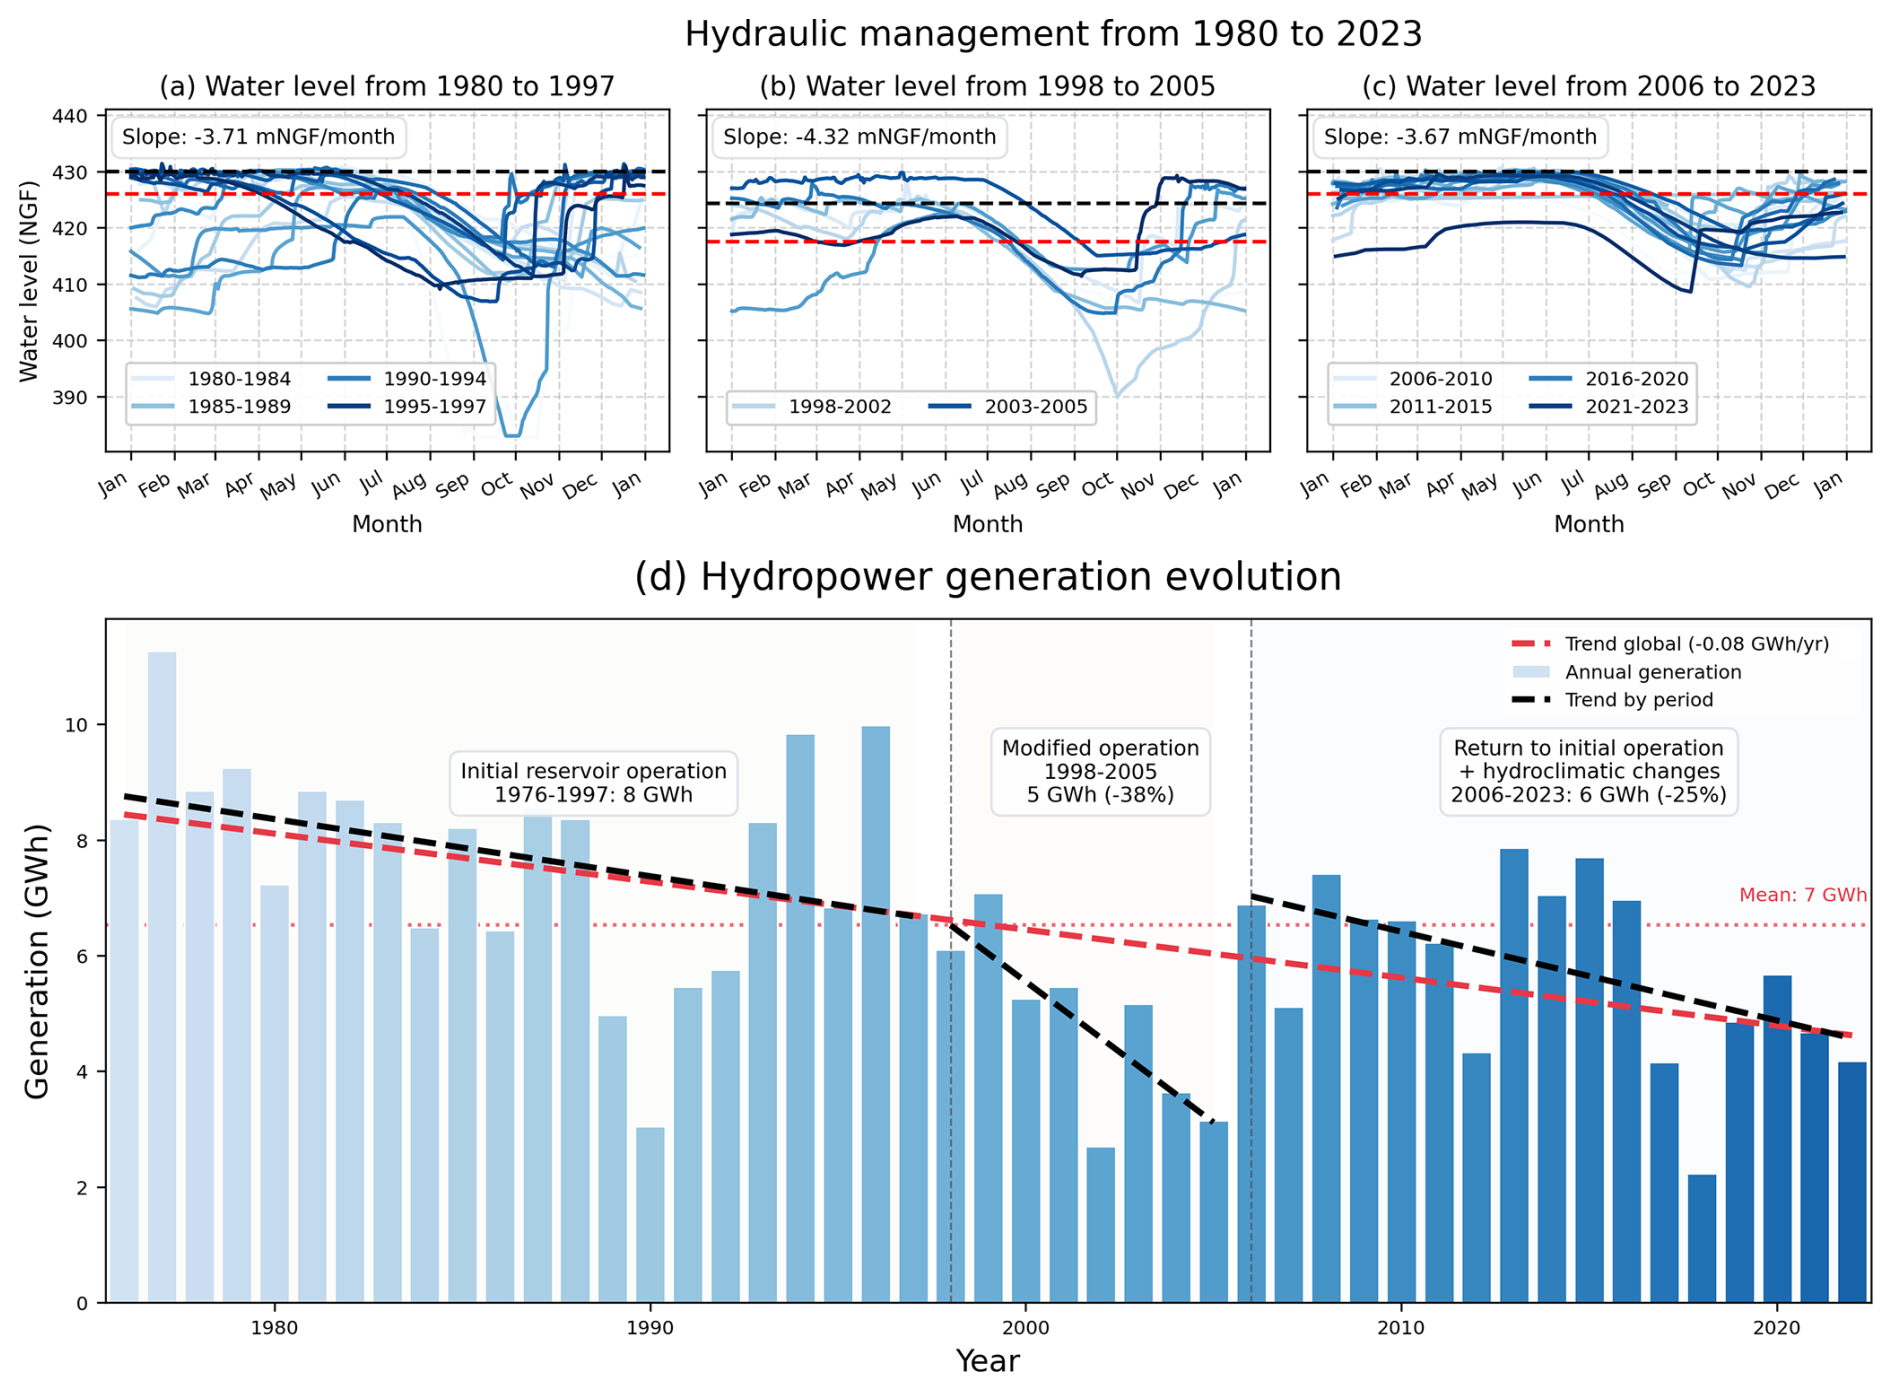
Figure 6Hydraulic management and historical annual hydropower generation. The three upper subplots represent the three management periods: 1976–1997, 1998–2005, and post-2005. Curves in different colors show annual water level variations over the months. The black and red dotted lines indicate the range of monthly maximum water level setpoints defined by the management guidelines for each period. The average slope of the water level decrease between July and September reflects water supply during low-flow river stages. The lower subplot illustrates the evolution of hydropower generation across the three periods, with a Mann-Kendall regression line. The variation in hydropower generation for each period is expressed compared to the 1976–1997 baseline.
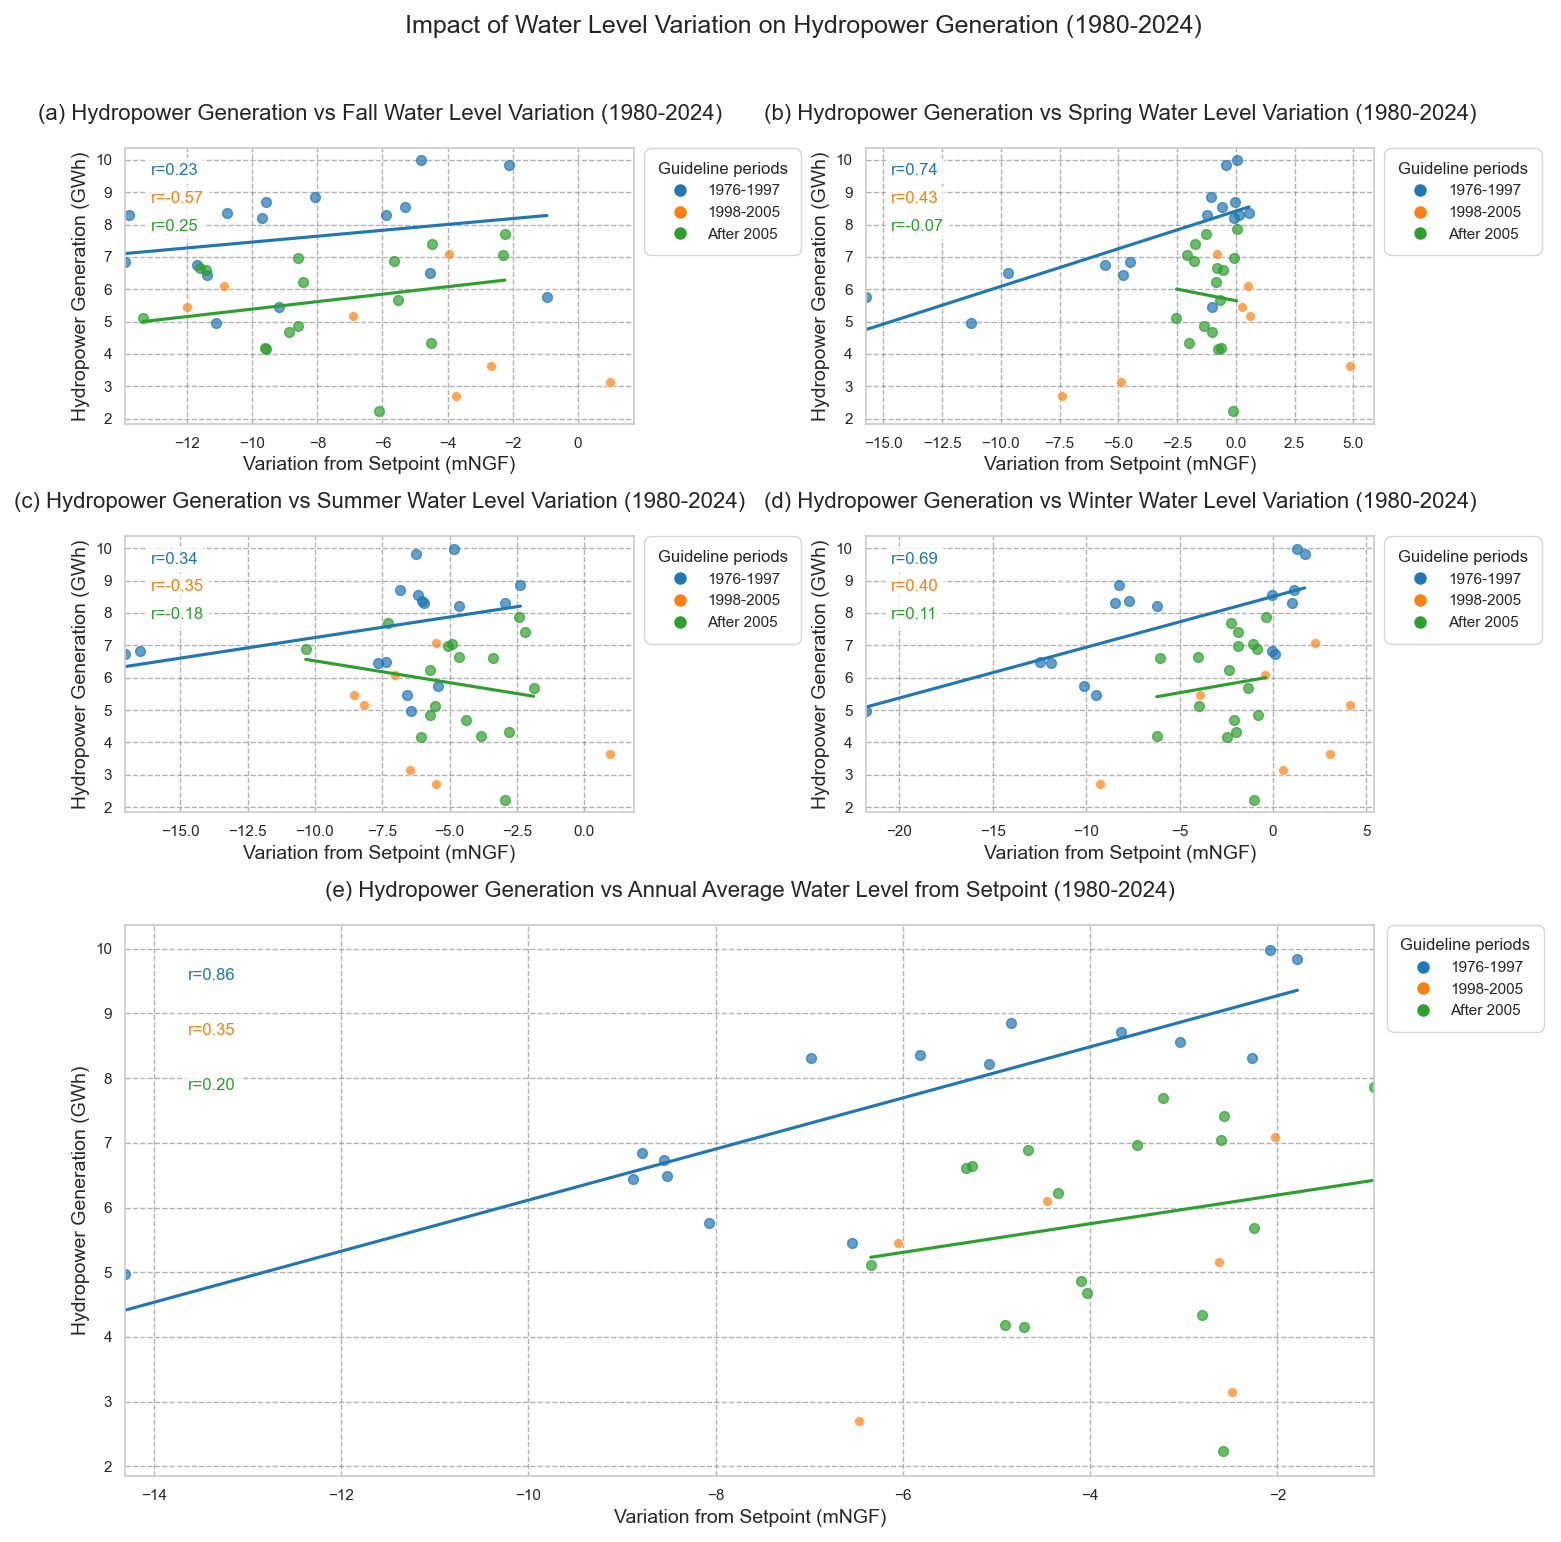
During these different periods, the relationship between precipitation and hydropower generation was analyzed both annually and seasonally, as shown in Fig. S13. The results indicate the absence of significant correlations, except for a moderate correlation observed after 2005 with total annual precipitation. The impact of deviations from maximum water level setpoints on hydropower was then assessed. Prior to 1998, hydropower generation was highly correlated with annual water level deviations from maximum setpoints in Fig. 7 (r=0.86). A seasonal analysis further reveals that this correlation was particularly strong in winter (r=0.69) and spring (r=0.74). However, this correlation was no longer observed after 1998.
5.1 Less water available during key periods of dam use, more droughts and more Cevenol episodes
5.1.1 Observed changes in seasonal precipitation and extremes
The recorded decreases in average accumulated precipitation during winter (−19 %), summer (−20 %), and spring (−13 %) are compensated by a marked increase in fall (+22 %), resulting in a relatively stable annual total. This pattern appears broadly consistent with IPCC findings, which indicate that, despite high spatial and temporal variability, long-term trends in annual precipitation across the Mediterranean are generally stationary. However, significant changes have been observed at the subregional level, highlighting the importance of the scale considered when interpreting hydrological trends (IPCC, 2023). In parallel, the observed rise in the frequency (+87 % to +400 %) and intensity (+31 %) of extreme precipitation events in fall, along with the increase in consecutive dry days (CDD) frequency (+33 % to +250 %) and intensity (+20 %) in winter, should be considered in light of future climate projections. These anticipate more intense and frequent extreme rainfall events during the fall season under high-emissions scenarios (Caillaud et al., 2024; Cramer et al., 2020), as well as more frequent and intense droughts across the region (Cramer et al., 2020; IPCC, 2023).
5.1.2 Implications for soil erosion
Although the evolution of soil erosion remains uncertain due to multiple interacting factors, climate change is generally expected to intensify erosion processes worldwide. Several studies indicate that rainfall intensity has a stronger impact on erosion than total precipitation amount (Li and Fang, 2016). According to Istanbulluoglu and Bras (2006), drought-induced vegetation loss can reduce infiltration capacity, thereby increasing soil susceptibility to erosion during subsequent intense rainfall events. Given that both droughts and extreme rainfall are projected to become more frequent and intense in the Mediterranean region (Cramer et al., 2020; IPCC, 2023), it is reasonable to anticipate an intensification of erosion dynamics within the studied catchment.
5.2 Sediment dynamics under extreme rainfall events
5.2.1 Validation of the Age Model
In addition to hydroclimatic constraints, sediment accumulation poses a risk to dam operations. To assess this, a sediment age model was constructed, allowing the relationship between precipitation and sedimentation to be analyzed. After removing instantaneous event layers, the model fit improved (r2=0.778), with a Sediment Accumulation Rate (SAR) of 19.3 mm yr−1 – substantially higher than in nearby coastal sites like the Pierre Blanche lagoon (3.0–4.2 mm yr−1; Sabatier et al., 2008), though likely reflective of local catchment dynamics and the specific conditions prevailing at the archive extraction site.
The top 5 cm of the core, sampled shortly after a Cévenol event, showed evidence of rapid deposition. Detection of 7Be confirmed recent accumulation down to 5 cm, and variations in and relative density helped distinguishing between two precipitation events (12 and 15–16 September 2023), with the latter (52 mm) being likely responsible for coarse-grain transport and 210Pbex-depleted signatures (Cabrera et al., 2023).
As mentioned in the Results section, the lower 137Cs peak in Unit 3 was associated with the 1986 Chernobyl fallout, providing an independent validation of the age model. The second peak, detected higher in the sequence (Unit 2, dated to 1997–1998), may reflect sediment remobilization or bioturbation. The model chronology spans from September 2023 to ca. 1986.
5.2.2 Notable Sedimentary Anomalies and their Potential Event Correlation
Breakpoint analysis of the ratio – a proxy for grain size and flood activity (Croudace, 2015; Pang et al., 2023; Schillereff et al., 2014; Jones et al., 2012) – identified three sedimentary units. Unit 2, beginning at 67.5 cm (∼1997), likely spans from 1994–1995 to 2005 after accounting for age model uncertainty and sedimentation rates. This interval coincides with a cluster of major floods (Table S3) and reforestation efforts, which may have enhanced erosion of organic-rich soils, explaining the unit's elevated organic content. The hypothesis of a 1990 dam emptying event was dismissed based on its temporal mismatch and the unit's heterogeneity. Organic-rich layers and low-density zones may reflect flood-induced inputs and post-depositional bioturbation. Despite model refinements, variable error depth complicates direct rainfall–sediment correlations, suggesting the need for flexible lag algorithms.
Only 27 Cévenol episodes were identified in the sedimentary archive between 1986 and 2023, compared to 71 and 22 extreme rainfall events exceeding 100 and 150 mm thresholds, respectively, identified in the measured precipitation records. This likely reflects detection limits and the spatial heterogeneity of rainfall (Delrieu et al., 2005; Boudevillain et al., 2009), as well as the fact that such events do not occur every year. Still, rare events (1 % of rainfall) contributed disproportionately (20 %–50 %) to annual sediment yields, which is consistent with what was reported in previous findings (Mano et al., 2009).
Extreme rainfall not only causes immediate damage but also accelerates reservoir siltation and associated risks for the turbine (Hauer et al., 2018). This effect may intensify as droughts and heavy rainfall events increase under climate change (Allen et al., 2011; Bentivenga et al., 2023; IPCC, 2023), which may be challenging for long-term dam operations.
5.3 Hydropower generation change assessment
5.3.1 Reference Period for Hydropower Generation: Business-as-Usual Phase (1976–1997)
During this period, no clear correlation was observed between annual or seasonal precipitation and hydropower production – contrarily to what would be commonly expected. This disconnection suggests that dam operations played a dominant role, potentially overriding the influence of hydroclimatic variability. Water level deviations from the setpoint showed strong correlations with annual hydropower production (r=0.86), especially in winter (r=0.69) and spring (r=0.74), highlighting the importance of winter replenishment for planning annual energy generation. Winter water levels were influenced by both the volume of precipitation and the initial reservoir level at the season's start, which itself depended on prior-year management decisions and extreme flood events (Fig. S14). Conversely, summer and fall levels had little predictive power for hydropower, reflecting their focus on water supply and flood control.
5.3.2 Revised Reservoir Management and Associated Hydropower Reduction (1998–2005)
In response to local authority requests, BRL lowered the maximum water level to 424.30 mNGF. This led to a 38 % decrease in average hydropower generation, making obsolete prior correlations with water levels. The management shift likely prioritized water supply – particularly in summer – over energy production, as evidenced by a steeper decline in water levels during the July–September period. The limited duration of this phase restricts trend detection, but the overall reduction in production indicates that human decision-making outweighed climatic drivers.
5.3.3 Return to Pre-1998 Management in a New Climate Context: No Recovery of Pre-1998 Hydropower Levels (Post-2005)
Although the pre-1998 setpoint (430 mNGF) was restored after 2005, hydropower levels did not recover. This suggests a shift in operational strategy, likely reflecting a more cautious approach under evolving climatic conditions. A weak correlation emerged between annual precipitation and hydropower generation (r=0.46), likely reflecting an increased sensitivity to annual-scale hydroclimatic variability. Despite the return of high water levels, the reliance on unpredictable Cévenol events and drier winters may impact the energy production. The post-2005 hydropower decline (−25 %) underscores that meeting both flood control and water supply objectives – amid changing precipitation patterns – has taken precedence over energy production.
5.3.4 Combined Impact of Sediment Accumulation and Hydroclimatic Trends
While sediment accumulation was historically overlooked, this study's age model indicates that at least 94 cm of sediment has accumulated at ORB09 over the past 37 years. Given ORB09's elevation (top of sediment core at 398.24 mNGF), determined using an echosounder, and its position well above the turbine intake (386.75 mNGF), concerns arise regarding reduced storage capacity and future operational risks. In comparison, sediment cores collected near the dam structure – ORB01 and ORB06 – show top elevations of 385.16 and 385.05 mNGF, respectively, indicating that sediment accumulation may soon reach critical levels and pose a direct risk to turbine operation.
Despite no direct evidence of sediment-related energy loss so far, turbidity and sediment resuspension during Cévenol events may occasionally prevent turbine use. These interactions remain understudied and would require further assessment, especially in light of evolving climate conditions.
5.3.5 Future Challenges for Hydropower at the Orb Dam
Climate projections suggest increasing drought intensity and more extreme rainfall events. These changes, alongside sediment buildup and more cautious water management, are likely to further constrain hydropower generation. Under a 2 °C warming scenario, Mediterranean hydropower losses could reach 6 %–33 %, rising to 20 %–60 % above 3 °C warming (IPCC, 2023). These projections align with observed trends: Orb dam hydropower dropped by 29 % between 1976–1998 and 1999–2022, with no production recorded since 2022 due to technical issues. Any future energy resumption must account for the following cumulative impacts: reduced water availability, flood-induced disruptions, sediment accumulation, and evolving land use. Together, these pressures pose a significant challenge for sustaining hydropower production at the Orb dam in the coming decades.
A proxy-based methodology was applied to a sediment core extracted from a dam reservoir in southern France to detect the impact of extreme events on sedimentation. The establishment of an age model for this core, combined with the identification of instantaneous event layers, enabled the reconstruction of Cévenol episodes and the assessment of their contribution to sediment deposition. The analysis revealed that approximately 1 % of annual precipitation events could account for 20 %–50 % of the total sediment supply to the reservoir. Moreover, a sediment accumulation rate (SAR) of 19.3 mm yr−1 was observed, which must be interpreted in light of the local catchment dynamics and core extraction location.
Climate analysis comparing the periods 1950–1986 and 1987–2023 showed a significant increase in both the occurrence and intensity of Cévenol episodes, along with a shift in seasonality from winter- to fall-dominated precipitation, due to increased extreme events in autumn and more pronounced winter droughts. Despite this shift, annual cumulative precipitation remained relatively stable, as the fall increase was offset by decreases in winter, spring, and summer precipitation.
Regarding hydropower production, a 25 % decline was observed between the periods 1976–1997 and 2006–2022 – two intervals associated with distinct yet internally consistent management regimes. This drop, occurring despite a return to initial storage levels after 2005, suggests that hydroclimatic factors may have become a more dominant constraint on electric power production. Sediment accumulation did not appear to directly impair electricity generation over the study period, but sediment levels are nearing critical thresholds, potentially threatening storage capacity and turbine functioning. Hydropower production, being a secondary objective of this multipurpose dam, remains particularly vulnerable to both climate variability and shifting water management priorities.
Projections indicate that climate change will further amplify these trends, with more frequent and intense droughts, extreme precipitation events, and increased erosion and sediment delivery. In the context of a 25 % decline in hydropower generation under stable management conditions, this study highlights the growing role of environmental pressures on dam operation. As electricity demand is expected to rise with the energy transition, anticipating and adapting to hydroclimatic constraints will be essential for guaranteeing a sustainable water and energy management in the coming decades.
Python scripts used for analysis and figure generation are available on request. SERAC code is available on https://github.com/rosalieb/serac (last access: 6 November 2025).
Data that can be provided are available on Zenodo depository: https://doi.org/10.5281/zenodo.17517481.
The supplement related to this article is available online at https://doi.org/10.5194/hess-29-6461-2025-supplement.
PH, AF, and OE conducted the fieldwork and collected the sediment cores. PH and AF performed the sediment core analyses, and PH carried out the hydroclimatic data analysis. PH drafted the initial manuscript. AF and OE provided scientific oversight and supervised the research. BQ specifically supervised the hydroclimatic analysis and contributed to the critical revision and finalization of the manuscript.
The contact author has declared that none of the authors has any competing interests.
Publisher's note: Copernicus Publications remains neutral with regard to jurisdictional claims made in the text, published maps, institutional affiliations, or any other geographical representation in this paper. While Copernicus Publications makes every effort to include appropriate place names, the final responsibility lies with the authors. Views expressed in the text are those of the authors and do not necessarily reflect the views of the publisher.
We thank BRL for authorizing the extraction of the sediment cores from the Orb reservoir and for sharing insightful information that greatly contributed to this study. We are grateful to the DOSEO platform (Université Paris-Saclay, CEA, List) and especially to A.-C. Simon and M. Agelou for performing the tomography scanner measurements on the sediment core sections. This work is supported by a public grant overseen by the French National research Agency (ANR) as part of the “Investissements d'Avenir” program, through the “ADI 2022” project funded by the IDEX Paris-Saclay, ANR-11-IDEX-0003-02. It was conducted within the framework of a double PhD-degree program with the Universidad del Rosario in Bogotá, which we also gratefully acknowledge. Special thanks to Eduer Giovanny Nova Rodriguez for his valuable expertise, insightful suggestions, and careful revision of the manuscript.
This research has been supported by the Université Paris-Saclay (grant no. ANR-11-IDEX-0003-02).
This paper was edited by Lixin Wang and reviewed by two anonymous referees.
Abdelwahab, O. M. M., Ricci, G. F., Gentile, F., and De Girolamo, A. M.: Modelling the impact of climate change on runoff and sediment yield in Mediterranean basins: the Carapelle case study (Apulia, Italy), Frontiers in Water, 7, 1486644, https://doi.org/10.3389/frwa.2025.1486644, 2025. a
Allen, P., Harmel, R., Dunbar, J., and Arnold, J.: Upland contribution of sediment and runoff during extreme drought: A study of the 1947–1956 drought in the Blackland Prairie, Texas, Journal of Hydrology, 407, 1–11, https://doi.org/10.1016/j.jhydrol.2011.04.039, 2011. a
Anghileri, D., Botter, M., Castelletti, A., Weigt, H., and Burlando, P.: A Comparative Assessment of the Impact of Climate Change and Energy Policies on Alpine Hydropower, Water Resources Research, 54, 9144–9161, https://doi.org/10.1029/2017WR022289, 2018. a
Anjum, R., Tang, Q., Collins, A. L., Gao, J., Long, Y., Zhang, X., He, X., Shi, Z., Wen, A., and Wei, J.: Sedimentary chronology reinterpreted from Changshou Lake of the Three Gorges Reservoir Area reveals natural and anthropogenic controls on sediment production, Environmental Science and Pollution Research, 25, 17620–17633, https://doi.org/10.1007/s11356-018-1916-3, 2018. a
Appleby, P. and Oldfield, F.: The calculation of lead-210 dates assuming a constant rate of supply of unsupported 210Pb to the sediment, CATENA, 5, 1–8, https://doi.org/10.1016/S0341-8162(78)80002-2, 1978. a
Arnaud, F., Lignier, V., Revel, M., Desmet, M., Beck, C., Pourchet, M., Charlet, F., Trentesaux, A., and Tribovillard, N.: Flood and earthquake disturbance of 210Pb geochronology (Lake Anterne, NW Alps), Terra Nova, 14, 225–232, https://doi.org/10.1046/j.1365-3121.2002.00413.x, 2002. a
Bentivenga, M., De Vente, J., Giano, S. I., Prosser, G., and Piccarreta, M.: Suspended sediment yield under alternating dry/wet cycles in a Mediterranean river catchment: the case of the Ofanto River, southern Italy, Hydrological Sciences Journal, 68, 1809–1825, https://doi.org/10.1080/02626667.2023.2236593, 2023. a
Boudevillain, B., Argence, S., Claud, C., Ducrocq, V., Joly, B., Joly, A., Lambert, D., Nuissier, O., Plu, M., Ricard, D., Arbogast, P., Berne, A., Chaboureau, J.-P., Chapon, B., Crepin, F., Delrieu, G., Doerflinger, E., Funatsu, B. M., Kirstetter, P.-E., Masson, F., Maynard, K., Richard, E., Sanchez, E., Terray, L., and Walpersdorf, A.: Projet Cyprim, partie I : Cyclogenèses et précipitations intenses en région méditerranéenne : origines et caractéristiques, La Météorologie, 8, 18, https://doi.org/10.4267/2042/28828, 2009 (in French). a, b
BRL: Perspectives d'évolution de la gestion des volumes stockés dans le barrage des monts d'Orb, Tech. rep., BRL, 2011 (in French). a, b, c, d, e, f, g, h
Bruel, R. and Sabatier, P.: serac: an R package for ShortlivEd RAdionuclide chronology of recent sediment cores, Journal of Environmental Radioactivity, 225, 106449, https://doi.org/10.1016/j.jenvrad.2020.106449, 2020. a
BURGEAP: Diagnostic du fonctionnement Hydro-morphologique du bassin versant de l'Orb – Phase 1, Tech. rep., BURGEAP, 2013 (in French). a, b
Cabrera, M., Sanabria, R., González, J., Cabral, P., Tejeda, S., Zarazua, G., Melgar-Paniagua, E., and Tassano, M.: Using 137Cs and 210Pbex to assess soil redistribution at different temporal scales along with lithogenic radionuclides to evaluate contrasted watersheds in the Uruguayan Pampa grassland, Geoderma, 435, 116502, https://doi.org/10.1016/j.geoderma.2023.116502, 2023. a
Caillaud, C., Somot, S., Douville, H., Alias, A., Bastin, S., Brienen, S., Demory, M., Dobler, A., Feldmann, H., Frisius, T., Goergen, K., Kendon, E. J., Keuler, K., Lenderink, G., Mercogliano, P., Pichelli, E., Soares, P. M. M., Tölle, M. H., and De Vries, H.: Northwestern Mediterranean Heavy Precipitation Events in a Warmer Climate: Robust Versus Uncertain Changes With a Large Convection-Permitting Model Ensemble, Geophysical Research Letters, 51, e2023GL105143, https://doi.org/10.1029/2023GL105143, 2024. a
Cherif, S., Doblas-Miranda, E., Lionello, P., Borrego, C., Giorgi, F., Iglesias, A., Jebari, S., Mahmoudi, E., Moriondo, M., Pringault, O., Rilov, G., Somot, S., Tsikliras, A., Vilà, M., Zittis, G., and Obermann-Hellhund, A.: Climate and Environmental Change in the Mediterranean Basin – Current Situation and Risks for the Future, Chapter 2 Drivers of Change, MedECC Reports, MedECC Secretariat, Marseille, France, https://doi.org/10.5281/zenodo.7100601, 2021. a
Cramer, W., Guiot, J., Marini, K., Azzopardi, B., Balzan, M. V., Cherif, S., Doblas-Miranda, E., dos Santos, M., Drobinski, P., Fader, M., Hassoun, A. E. R., Giupponi, C., Koubi, V., Lange, M. A., Lionello, P., Llassat, M. C., Moncada, S., Mrabet, R., Paz, S., Savé, R., Snoussi, M., Toreti, A., Vafeidis, A. T., Xoplaki, E., Wolfgang, C., Joël, G., and Katarzyna, M.: MedECC 2020 Summary for Policymakers, Tech. rep., MedECC Reports, MedECC Secretariat, Marseille, France, https://doi.org/10.5281/ZENODO.5513887, 2020. a, b, c
Croudace, R.: Micro-XRF Studies of Sediment Cores: Applications of a non-destructive tool for the environmental sciences, Developments in Paleoenvironmental Research, vol. 17, Springer Netherlands, Dordrecht, https://doi.org/10.1007/978-94-017-9849-5, 2015. a, b, c
Curran, C. A., Grossman, E. E., Mastin, M. C., and Huffman, R. L.: Sediment load and distribution in the lower Skagit River, Skagit County, Washington, Tech. Rep. 2016-5106, U. S. Geological Survey, https://doi.org/10.3133/sir20165106, 2016. a
Delrieu, G., Nicol, J., Yates, E., Kirstetter, P.-E., Creutin, J.-D., Anquetin, S., Obled, C., Saulnier, G.-M., Ducrocq, V., Gaume, E., Payrastre, O., Andrieu, H., Ayral, P.-A., Bouvier, C., Neppel, L., Livet, M., Lang, M., du Châtelet, J. P., Walpersdorf, A., and Wobrock, W.: The Catastrophic Flash-Flood Event of 8–9 September 2002 in the Gard Region, France: A First Case Study for the Cévennes–Vivarais Mediterranean Hydrometeorological Observatory, Journal of Hydrometeorology, 6, 34–52, https://doi.org/10.1175/JHM-400.1, 2005. a
Folton, N., Martin, É., Arnaud, P., and Tolsa, M.: Cinquante ans de processus hydrologiques observés dans des petits bassins versants méditerranéens : vers une raréfaction de la ressource en eau ?, La Houille Blanche, 106, 17–27, https://doi.org/10.1051/lhb/2020048, 2020 (in French). a
Foucher, A., Morera, S., Sanchez, M., Orrillo, J., and Evrard, O.: El Niño–Southern Oscillation (ENSO)-driven hypersedimentation in the Poechos Reservoir, northern Peru, Hydrol. Earth Syst. Sci., 27, 3191–3204, https://doi.org/10.5194/hess-27-3191-2023, 2023. a
Giorgi, F.: Climate change hot-spots, Geophysical Research Letters, 33, 2006GL025734, https://doi.org/10.1029/2006GL025734, 2006. a
Hamududu, B. and Killingtveit, A.: Assessing Climate Change Impacts on Global Hydropower, Energies, 5, 305–322, https://doi.org/10.3390/en5020305, 2012. a
Hauer, C., Wagner, B., Aigner, J., Holzapfel, P., Flödl, P., Liedermann, M., Tritthart, M., Sindelar, C., Pulg, U., Klösch, M., Haimann, M., Donnum, B., Stickler, M., and Habersack, H.: State of the art, shortcomings and future challenges for a sustainable sediment management in hydropower: A review, Renewable and Sustainable Energy Reviews, 98, 40–55, https://doi.org/10.1016/j.rser.2018.08.031, 2018. a, b, c, d, e
Hazet, P.: ORB01, Geo Samples [sample], https://doi.org/10.58052/IEFOU008V, 2023a. a
Hazet, P.: ORB06, Geo Samples [sample], https://doi.org/10.58052/IEFOU008W, 2023b. a
Hazet, P.: ORB09, Geo Samples [sample], https://doi.org/10.58052/IEFOU008X, 2023c. a
He, F., Zarfl, C., Tockner, K., Olden, J. D., Campos, Z., Muniz, F., Svenning, J.-C., and Jähnig, S. C.: Hydropower impacts on riverine biodiversity, Nature Reviews Earth & Environment, 5, 755–772, https://doi.org/10.1038/s43017-024-00596-0, 2024. a
Hilgert, S., Sotiri, K., and Fuchs, S.: Review of methods of sediment detection in reservoirs, International Journal of Sediment Research, 39, 28–43, https://doi.org/10.1016/j.ijsrc.2023.12.004, 2024. a
International Energy Agency: Hydropower Special Market Report: Analysis and forecast to 2030, OECD, https://doi.org/10.1787/07a7bac8-en, 2021. a
IPCC: Climate Change 2022 – Impacts, Adaptation and Vulnerability: Working Group II, 1st edn., Contribution to the Sixth Assessment Report of the Intergovernmental Panel on Climate Change chapter 4, Cambridge University Press, https://doi.org/10.1017/9781009325844.021, 2023. a, b, c, d, e, f, g, h, i, j, k
Istanbulluoglu, E. and Bras, R. L.: On the dynamics of soil moisture, vegetation, and erosion: Implications of climate variability and change, Water Resources Research, 42, 2005WR004113, https://doi.org/10.1029/2005WR004113, 2006. a
Jones, A. F., Macklin, M. G., and Brewer, P. A.: A geochemical record of flooding on the upper River Severn, UK, during the last 3750 years, Geomorphology, 179, 89–105, https://doi.org/10.1016/j.geomorph.2012.08.003, 2012. a
Juško, V., Sedmák, R., and Kúdela, P.: Siltation of Small Water Reservoir under Climate Change: A Case Study from Forested Mountain Landscape of Western Carpathians, Slovakia, Water, 14, 2606, https://doi.org/10.3390/w14172606, 2022. a
Lee, S.-Y., Hamlet, A. F., and Grossman, E. E.: Impacts of Climate Change on Regulated Streamflow, Hydrologic Extremes, Hydropower Production, and Sediment Discharge in the Skagit River Basin, Northwest Science, 90, 23–43, https://doi.org/10.3955/046.090.0104, 2016. a
Li, Z. and Fang, H.: Impacts of climate change on water erosion: A review, Earth-Science Reviews, 163, 94–117, https://doi.org/10.1016/j.earscirev.2016.10.004, 2016. a
Lionello, P. and Scarascia, L.: The relation between climate change in the Mediterranean region and global warming, Regional Environmental Change, 18, 1481–1493, https://doi.org/10.1007/s10113-018-1290-1, 2018. a, b
Lionello, P. and Scarascia, L.: The relation of climate extremes with global warming in the Mediterranean region and its north versus south contrast, Regional Environmental Change, 20, 31, https://doi.org/10.1007/s10113-020-01610-z, 2020. a
Lionello, P., Abrantes, F., Gacic, M., Planton, S., Trigo, R., and Ulbrich, U.: The climate of the Mediterranean region: research progress and climate change impacts, Regional Environmental Change, 14, 1679–1684, https://doi.org/10.1007/s10113-014-0666-0, 2014. a
Lobanova, A., Koch, H., Liersch, S., Hattermann, F. F., and Krysanova, V.: Impacts of changing climate on the hydrology and hydropower production of the Tagus River basin, Hydrological Processes, 30, 5039–5052, https://doi.org/10.1002/hyp.10966, 2016. a
Mano, V., Nemery, J., Belleudy, P., and Poirel, A.: Assessment of suspended sediment transport in four alpine watersheds (France): influence of the climatic regime, Hydrological Processes, 23, 777–792, https://doi.org/10.1002/hyp.7178, 2009. a
Mariotti, A., Pan, Y., Zeng, N., and Alessandri, A.: Long-term climate change in the Mediterranean region in the midst of decadal variability, Climate Dynamics, 44, 1437–1456, https://doi.org/10.1007/s00382-015-2487-3, 2015. a, b, c
Meusburger, K., Evrard, O., Alewell, C., Borrelli, P., Cinelli, G., Ketterer, M., Mabit, L., Panagos, P., Van Oost, K., and Ballabio, C.: Plutonium aided reconstruction of caesium atmospheric fallout in European topsoils, Scientific Reports, 10, 11858, https://doi.org/10.1038/s41598-020-68736-2, 2020. a
Pang, H., Jia, Y., Li, F., Qin, L., and Chen, L.: An improved method for paleoflood reconstruction from core sediments in the upper Yellow River, Frontiers in Earth Science, 11, 1149502, https://doi.org/10.3389/feart.2023.1149502, 2023. a
Payet-Burin, R., Bertoni, F., Davidsen, C., and Bauer-Gottwein, P.: Optimization of regional water – power systems under cooling constraints and climate change, Energy, 155, 484–494, https://doi.org/10.1016/j.energy.2018.05.043, 2018. a
Qin, P., Xu, H., Liu, M., Du, L., Xiao, C., Liu, L., and Tarroja, B.: Climate change impacts on Three Gorges Reservoir impoundment and hydropower generation, Journal of Hydrology, 580, 123922, https://doi.org/10.1016/j.jhydrol.2019.123922, 2020. a
Raymond Pralong, M., Turowski, J. M., Rickenmann, D., and Zappa, M.: Climate change impacts on bedload transport in alpine drainage basins with hydropower exploitation, Earth Surface Processes and Landforms, 40, 1587–1599, https://doi.org/10.1002/esp.3737, 2015. a
Ribes, A., Thao, S., Vautard, R., Dubuisson, B., Somot, S., Colin, J., Planton, S., and Soubeyroux, J.-M.: Observed increase in extreme daily rainfall in the French Mediterranean, Climate Dynamics, 52, 1095–1114, https://doi.org/10.1007/s00382-018-4179-2, 2019. a
Ricci, G., Jeong, J., De Girolamo, A., and Gentile, F.: Effectiveness and feasibility of different management practices to reduce soil erosion in an agricultural watershed, Land Use Policy, 90, 104306, https://doi.org/10.1016/j.landusepol.2019.104306, 2020. a
Sabatier, P., Dezileau, L., Condomines, M., Briqueu, L., Colin, C., Bouchette, F., Le Duff, M., and Blanchemanche, P.: Reconstruction of paleostorm events in a coastal lagoon (Hérault, South of France), Marine Geology, 251, 224–232, https://doi.org/10.1016/j.margeo.2008.03.001, 2008. a, b
Sanchez-Cabeza, J. and Ruiz-Fernández, A.: 210Pb sediment radiochronology: An integrated formulation and classification of dating models, Geochimica et Cosmochimica Acta, 82, 183–200, https://doi.org/10.1016/j.gca.2010.12.024, 2012. a
Scarciglia, F., Nicolaci, A., Del Bianco, S., Pelle, T., Soligo, M., Tuccimei, P., Marzaioli, F., Passariello, I., and Iovino, F.: Reforestation and soil recovery in a Mediterranean mountain environment: Insights into historical geomorphic and vegetation dynamics in the Sila Massif, Calabria, southern Italy, CATENA, 194, 104707, https://doi.org/10.1016/j.catena.2020.104707, 2020. a
Schillereff, D. N., Chiverrell, R. C., Macdonald, N., and Hooke, J. M.: Flood stratigraphies in lake sediments: A review, Earth-Science Reviews, 135, 17–37, https://doi.org/10.1016/j.earscirev.2014.03.011, 2014. a
Shrestha, A., Shrestha, S., Tingsanchali, T., Budhathoki, A., and Ninsawat, S.: Adapting hydropower production to climate change: A case study of Kulekhani Hydropower Project in Nepal, Journal of Cleaner Production, 279, 123483, https://doi.org/10.1016/j.jclepro.2020.123483, 2021. a
Shu, J., Qu, J. J., Motha, R., Xu, J. C., and Dong, D. F.: Impacts of climate change on hydropower development and sustainability: a review, IOP Conference Series: Earth and Environmental Science, 163, 012126, https://doi.org/10.1088/1755-1315/163/1/012126, 2018. a, b
Simms, A. D., Woodroffe, C., Jones, B. G., Heijnis, H., Mann, R. A., and Harrison, J.: Use of 210Pb and 137Cs to simultaneously constrain ages and sources of post-dam sediments in the Cordeaux reservoir, Sydney, Australia, Journal of Environmental Radioactivity, 99, 1111–1120, https://doi.org/10.1016/j.jenvrad.2008.01.002, 2008. a
Solaun, K. and Cerdá, E.: The Impact of Climate Change on the Generation of Hydroelectric Power – A Case Study in Southern Spain, Energies, 10, 1343, https://doi.org/10.3390/en10091343, 2017. a
Szalińska, E., Orlińska-Woźniak, P., Wilk, P., Jakusik, E., Skalák, P., Wypych, A., and Arnold, J.: Sediment load assessments under climate change scenarios and a lack of integration between climatologists and environmental modelers, Scientific Reports, 14, 21727, https://doi.org/10.1038/s41598-024-72699-z, 2024. a
Turner, S. W., Hejazi, M., Kim, S. H., Clarke, L., and Edmonds, J.: Climate impacts on hydropower and consequences for global electricity supply investment needs, Energy, 141, 2081–2090, https://doi.org/10.1016/j.energy.2017.11.089, 2017. a
Uber, M., Rössler, O., Astor, B., Hoffmann, T., Van Oost, K., and Hillebrand, G.: Climate Change Impacts on Soil Erosion and Sediment Delivery to German Federal Waterways: A Case Study of the Elbe Basin, Atmosphere, 13, 1752, https://doi.org/10.3390/atmos13111752, 2022. a
Wang, K., Liu, H., Deng, Y., and Chen, J.: Review of and analysis on resettlement induced by hydropower projects in China, in: Proceedings of the 2017 2nd International Conference on Civil, Transportation and Environmental Engineering (ICCTE 2017), Atlantis Press, Shenzhen, China, https://doi.org/10.2991/iccte-17.2017.118, 2017. a
Wisser, D., Frolking, S., Hagen, S., and Bierkens, M. F. P.: Beyond peak reservoir storage? A global estimate of declining water storage capacity in large reservoirs, Water Resources Research, 49, 5732–5739, https://doi.org/10.1002/wrcr.20452, 2013. a
WMO: Guide to Climatological Practices, WMO, Tech. Rep. 100, 2022. a