the Creative Commons Attribution 4.0 License.
the Creative Commons Attribution 4.0 License.
 | 18 Nov 2025
Soil oxygen dynamics: a key mediator of tile drainage impacts on coupled hydrological, biogeochemical, and crop systems
Bin Peng
Wang Zhou
Robert Grant
Jinyun Tang
Murugesu Sivapalan
Zhenong Jin
Tile drainage removes excess water and is an essential, widely adopted management practice to enhance crop productivity in the US Midwest and throughout the world. Tile drainage has been shown to significantly change hydrological and biogeochemical cycles by lowering the water table and reducing the residence time of soil water, although examining the complex interactions and feedbacks in an integrated hydrology–biogeochemistry–crop system remains elusive. Oxygen dynamics are critical to unraveling these interactions and have been ignored or oversimplified in existing models. Understanding these impacts is essential, particularly so because tile drainage has been highlighted as an adaptation under projected wetter springs and drier summers in the changing climate in the US Midwest. We used the ecosys model that uniquely incorporates first-principle soil oxygen dynamics and crop oxygen uptake mechanisms to quantify the impacts of tile drainage on hydrological and biogeochemical cycles and crop growth in corn–soybean rotation fields. The model was validated with data from a multi-treatment, multi-year experiment in Washington, IA. The relative root mean square error (rRMSE) for the corn and soybean yield in validation is 5.66 % and 12.57 %, respectively. The Pearson coefficient (r) of the monthly tile flow during the growing season is 0.78. Plant oxygen stress turns out as an emergent property of the equilibrium between the soil oxygen supply and biological demand. The impact of tile drainage on the system is achieved through a series of coupled feedback mechanisms. The model results show that tile drainage reduces the soil water content and enhances soil oxygenation. It additionally increases the subsurface discharge and elevates inorganic nitrogen leaching, with seasonal variations influenced by climate and crop phenology. The improved aerobic condition alleviates crop oxygen stress during wet springs, thereby promoting crop root growth during the early growth stage. The development of greater root density, in turn, mitigates water stress during dry summers, leading to an overall increase in the crop yield by ∼6 %. These functions indicate the potential of tile drainage in bolstering crop resilience to climate change and the use of this modeling tool for large-scale assessments of tile drainage. The model reveals the underlying causal mechanisms that drive the agroecosystem response to drainage on the coupled hydrology, biogeochemistry, and crop system dynamics.
- Article
(6428 KB) - Full-text XML
-
Supplement
(5625 KB) - BibTeX
- EndNote


Agricultural subsurface drainage, commonly referred to as tile drainage, is one of the most important agricultural management practices that enables timely planting and enhances crop productivity in the US Midwest (Moore, 2016; Shen et al., 2013; Skaggs et al., 1994). Over 80 % of the tile-drained fields in the US are concentrated in six US Midwestern states, covering one-third of the region's cropland (NASS-USDA, 2017; Valayamkunnath et al., 2020; Zulauf and Brown, 2019). Notably, nearly half of the fields in the 3I states (i.e., Iowa, Indiana, and Illinois) are tile-drained, and the adoption rate of tile drainage continues to grow (NASS-USDA, 2017; Valayamkunnath et al., 2020; Zulauf and Brown, 2019). Tile drainage improves drainage conditions by removing excessive water and lowering the water table (Kalita et al., 2007), which benefits seed germination and crop growth (Ashraf, 2012; Nóia Júnior et al., 2023). Tile drainage also helps reduce the risk of delays in crop planting by enabling the timely operation of farm machinery during wet spring months, and thereby extending the crop growing period (Kucharik, 2008; Shirzaei et al., 2021). Tile drainage will become even more important under climate change, as the US Midwest is expected to experience wetter springs with more frequent and intense late-spring storms (Lesk et al., 2016; Li et al., 2019; Lobell et al., 2014; Schmidhuber and Tubiello, 2007; Seneviratne et al., 2022; Zhou et al., 2022). Thus, understanding the tile drainage impacts and managing the hydrological condition over the Midwestern agroecosystem are critically needed.
Extensive studies have explored the impact of tile drainage from different perspectives, such as hydrology, soil biogeochemistry, and crop growth. Hydrologically, tile drainage induces changes in both water storage and water fluxes (Blann et al., 2009; Boland-Brien et al., 2014; Hanrahan et al., 2020). Tile drainage has been shown to lower the water table, reduce the soil water content, and increase the temporal soil water storage capacity, which might enhance percolation, reduce surface runoff, and mitigate flooding at the field scale (Blann et al., 2009; Rahman et al., 2014; Skaggs et al., 1994; Yimer et al., 2023). These local-scale changes additionally alter watershed hydrology (Hansen et al., 2013; Miller and Lyon, 2021; Woo and Kumar, 2019). The impacts of tile drainage on hydrology are complicated by the interacting environmental conditions and management practices, soil properties, and antecedent soil moisture (Blann et al., 2009; Cain et al., 2022; Stops et al., 2022; Thomas et al., 2016; Wiskow and van der Ploeg, 2003). For instance, tile drainage may either increase baseflow or result in a flashier hydrograph, depending on the specific meteorological and physical characteristics (Adelsperger et al., 2023; Miller and Lyon, 2021; Schilling et al., 2012; Schilling and Helmers, 2008; Thomas et al., 2016; Valayamkunnath et al., 2022). The impact of tile drainage on evapotranspiration (ET) is generally more associated with land conversion (Ma et al., 2023; Wiskow and van der Ploeg, 2003), and the ET in tile-drained fields may be similar to that in undrained fields in the same crop systems (Khand et al., 2017; Yang et al., 2017). Tile drainage degrades stream water quality by increasing both field nitrogen and phosphate leaching (Castellano et al., 2019; David et al., 2010; Grenon et al., 2021; Ma et al., 2023; Ren et al., 2022; Sims et al., 1998). Further, tile drainage fosters a more aerobic soil condition, which would largely alter soil microbe activities, i.e., mineralization and immobilization (Brown et al., 2017; Jacinthe et al., 2015; Kumar et al., 2014). Notably, the impacts of tile drainage on both hydrology and biogeochemistry exhibit seasonal variation (Lam et al., 2016; Macrae et al., 2007; Ma et al., 2023; Williams et al., 2015). Despite the substantial attention on tile drainage, the impacts of tile drainage on hydrology, biogeochemistry, and crop growth are often studied separately within disciplinary boundaries, preventing an integrated understanding of their complex interactions.
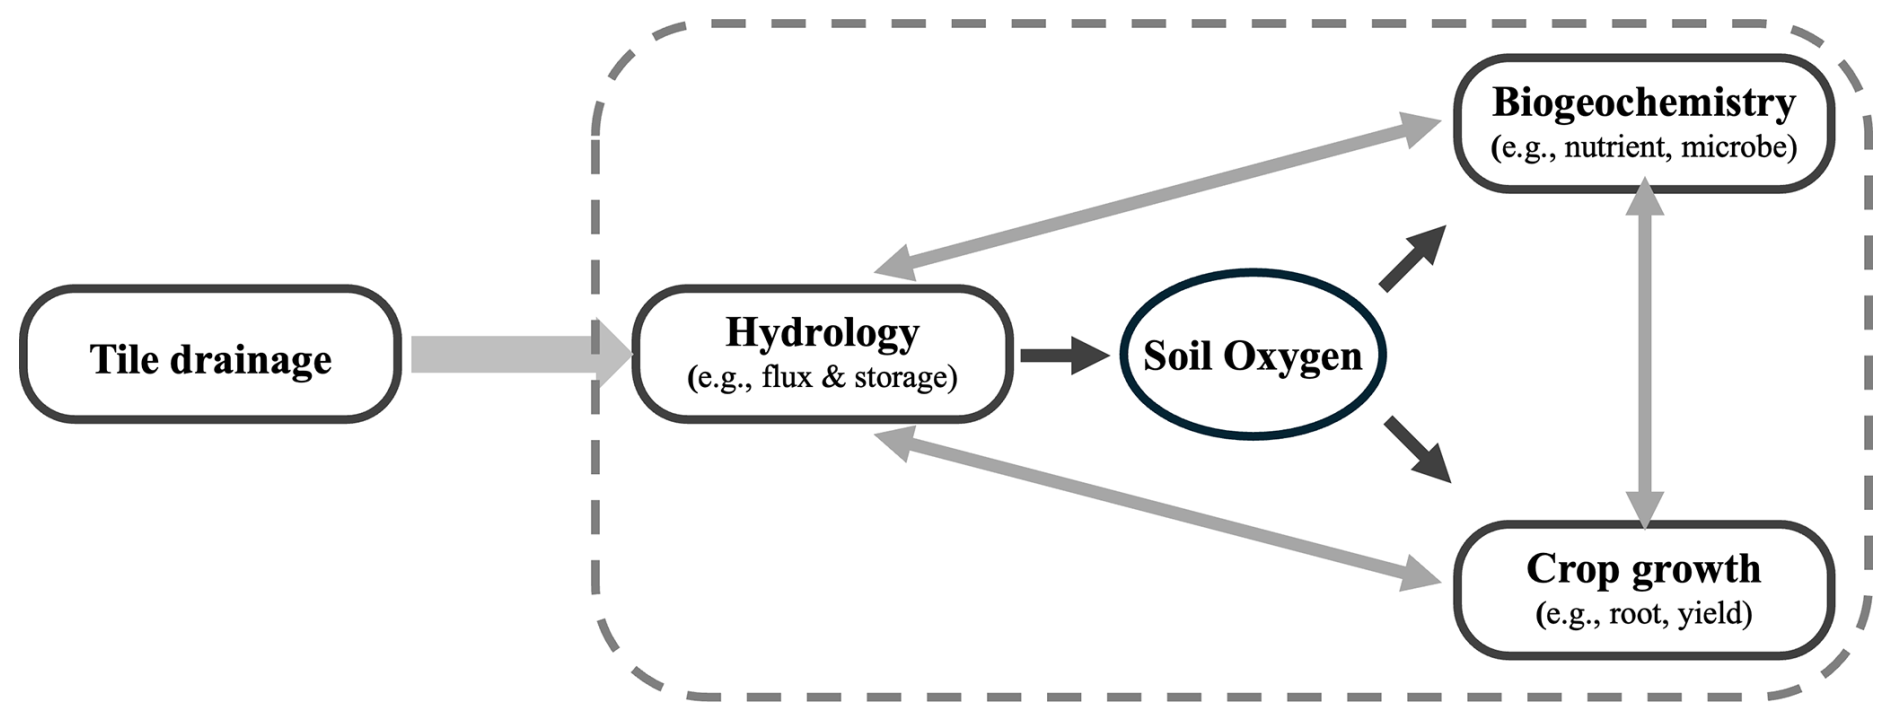
Figure 1Hypothesis for how tile drainage impacts hydrology, soil biogeochemistry, and crop growth. Tile drainage directly changes the field hydrology, and then changes the soil biogeochemistry and crop growth. Among those, soil oxygen is a key mediator that links hydrology, soil biogeochemistry, and crop growth in the coupled system.
Process-based models are promising for their capabilities of integrating physical, chemical, and biological processes, thus providing a cost-efficient and time-efficient means to advance scientific understanding and offer decision/policy support compared to field experiments (Jones et al., 2017). Tile drainage modeling has a long history and has recently gained attention for its integration into comprehensive hydrology and land surface models (Bailey et al., 2022; De Schepper and Therrien, 2017; Hansen et al., 2013; Li et al., 2010; Muma et al., 2017; Rumph Frederiksen and Molina-Navarro, 2021; Smith et al., 2020; Valayamkunnath et al., 2022). However, many of these models are specialized for particular processes, and, in some cases, they either omit or oversimplify other critical processes. Hydrologic models primarily focus on hydrological responses but do not represent soil biogeochemistry and crop growth, such as the National Water Model, the Soil Water Assessment Tool (SWAT), and the Tsinghua Hydrological Model (THREW) (Arnold et al., 2012; Li et al., 2010; Valayamkunnath et al., 2022). Similarly, reactive transport models, such as the PFLOTRAN and Advanced Terrestrial Simulator (ATS), simulate water and nutrient transport and biogeochemical transformation but lack the capability of representing crop growth and agricultural management activities (Hammond et al., 2014; Li et al., 2017, 2021). Crop growth models have recently been used to illuminate the impacts of waterlogging, but they often lack a comprehensive representation of the interconnections between hydrology, crop dynamics, and soil biogeochemistry. For instance, many such models, such as the DRAINMOD model, the Soil-Water-Atmosphere-Plant (SWAP) model, the Agricultural Production Systems sIMulator (APSIM), the decision support system for agrotechnology transfer (DSSAT) model, and the Environmental Policy Integrated Climate (EPIC) model, do not adequately represent root respiration, a key process influencing root development, maintenance, and nutrient uptake. Instead, they rely on soil water content as a proxy for oxygen stress, potentially neglecting important nuances in the interconnections between these critical processes (Ebrahimi-Mollabashi et al., 2019; Liu et al., 2020; Pasley et al., 2020; Skaggs et al., 2012; Sharpley, 1990).
Representations of ecophysiological and biochemical mechanisms under excessive water are critical in using process-based models to understand the interlinkage and interaction between hydrology, biogeochemistry, and crop growth. The limited soil oxygen diffusion under water-saturated conditions has been recognized as a key factor altering crop growth and soil biogeochemistry (Elzenga and van Veen, 2010; Pan et al., 2020; Rubol et al., 2013). Restricted soil oxygen under excessive water will suppress root respiration, decrease root activity, and even lead to root senescence, which further affects crop yield (Pan et al., 2020). Soil oxygen availability regulates soil biogeochemistry and composition by altering the redox potential, influencing microbial processes, nutrient cycling, and the mobility of elements (Elzenga and van Veen, 2010; Rubol et al., 2013). Under saturated conditions, anaerobic microbial respiration is favored to consume electron acceptors such as nitrate, sulfate, or iron instead of oxygen for respiration, producing greenhouse gases, and changing the availability of essential nutrients for crop uptake. However, those processes are not well represented in the aforementioned process-based models.
Here we aim to use a process-based model, ecosys, that incorporates all the essential physical mechanisms, especially oxygen-related dynamics, to understand the role of tile drainage in the integrated hydrology–biogeochemistry–crop agroecosystem dynamics by addressing the following questions: (1) how does tile drainage alter the agroecosystem hydrology, biogeochemistry, and crop growth? (2) More importantly, how are those impacts on the three aspects interrelated? (3) How do seasonal precipitation patterns influence tile drainage and agricultural production? We hypothesize that tile drainage positively influences crop growth by altering in-field hydrology and soil biogeochemistry, with soil oxygen acting as the critical mediator that links these three components. Specifically, tile drainage improves soil aeration by reducing the soil water content. The resulting increase in oxygen availability stimulates root development and microbial activity, subsequently enhancing overall crop growth. In turn, this greater biological activity creates a feedback loop: enhanced microbial activity accelerates organic matter mineralization, and the root system alters the hydrology through increased water and nutrient uptake (Fig. 1). We further hypothesize that tile drainage could bolster agricultural production and potentially serve as an efficient adaptation strategy in the context of climate change. We first validate the ecosys model using data from a multi-year field experiment at a research and demonstration farm in Washington, Iowa. In Sect. 2, we provide an overview, and some key processes related to tile drainage and soil oxygen simulations in the ecosys model and introduce the data used in this study and hypothetical numerical experiment designs. Sect. 3 presents the model calibration and simulation results. In Sect. 4, we specifically discuss and answer the above-mentioned questions and draw conclusions in Sect. 5.
2.1 Ecosys model
2.1.1 Overview of ecosys model
The ecosys model is an agroecosystem model with essential mechanistic representations of hydrology, soil biogeochemistry, and crop growth in the soil–vegetation–atmosphere continuum at the hourly time step (Figs. 2 and S1–S3 in the Supplement) (Grant, 2001; Grant et al., 2017). Ecosys can be configured to run in 1D, 2D, or 3D. For typical field-scale applications, it operates as a highly detailed, multi-layered 1D model. And 2D and 3D configurations have been employed to investigate topography control on ecosystem processes (Grant et al., 2017). It has shown promising performance in simulating water fluxes (e.g., ET), biogeochemistry (e.g., soil carbon storage, greenhouse gas emission), and crop growth (e.g., gross primary productivity and crop yield) in different cropping systems (Grant, 1993, 1998; Li et al., 2022; Mezbahuddin et al., 2016; Qin et al., 2021; Yang et al., 2022; Zhang et al., 2021; Zhou et al., 2021). In this study, we configured the model to study the impact of tile drainage to run in a 1D setting, which also ensures a greater numerical stability.
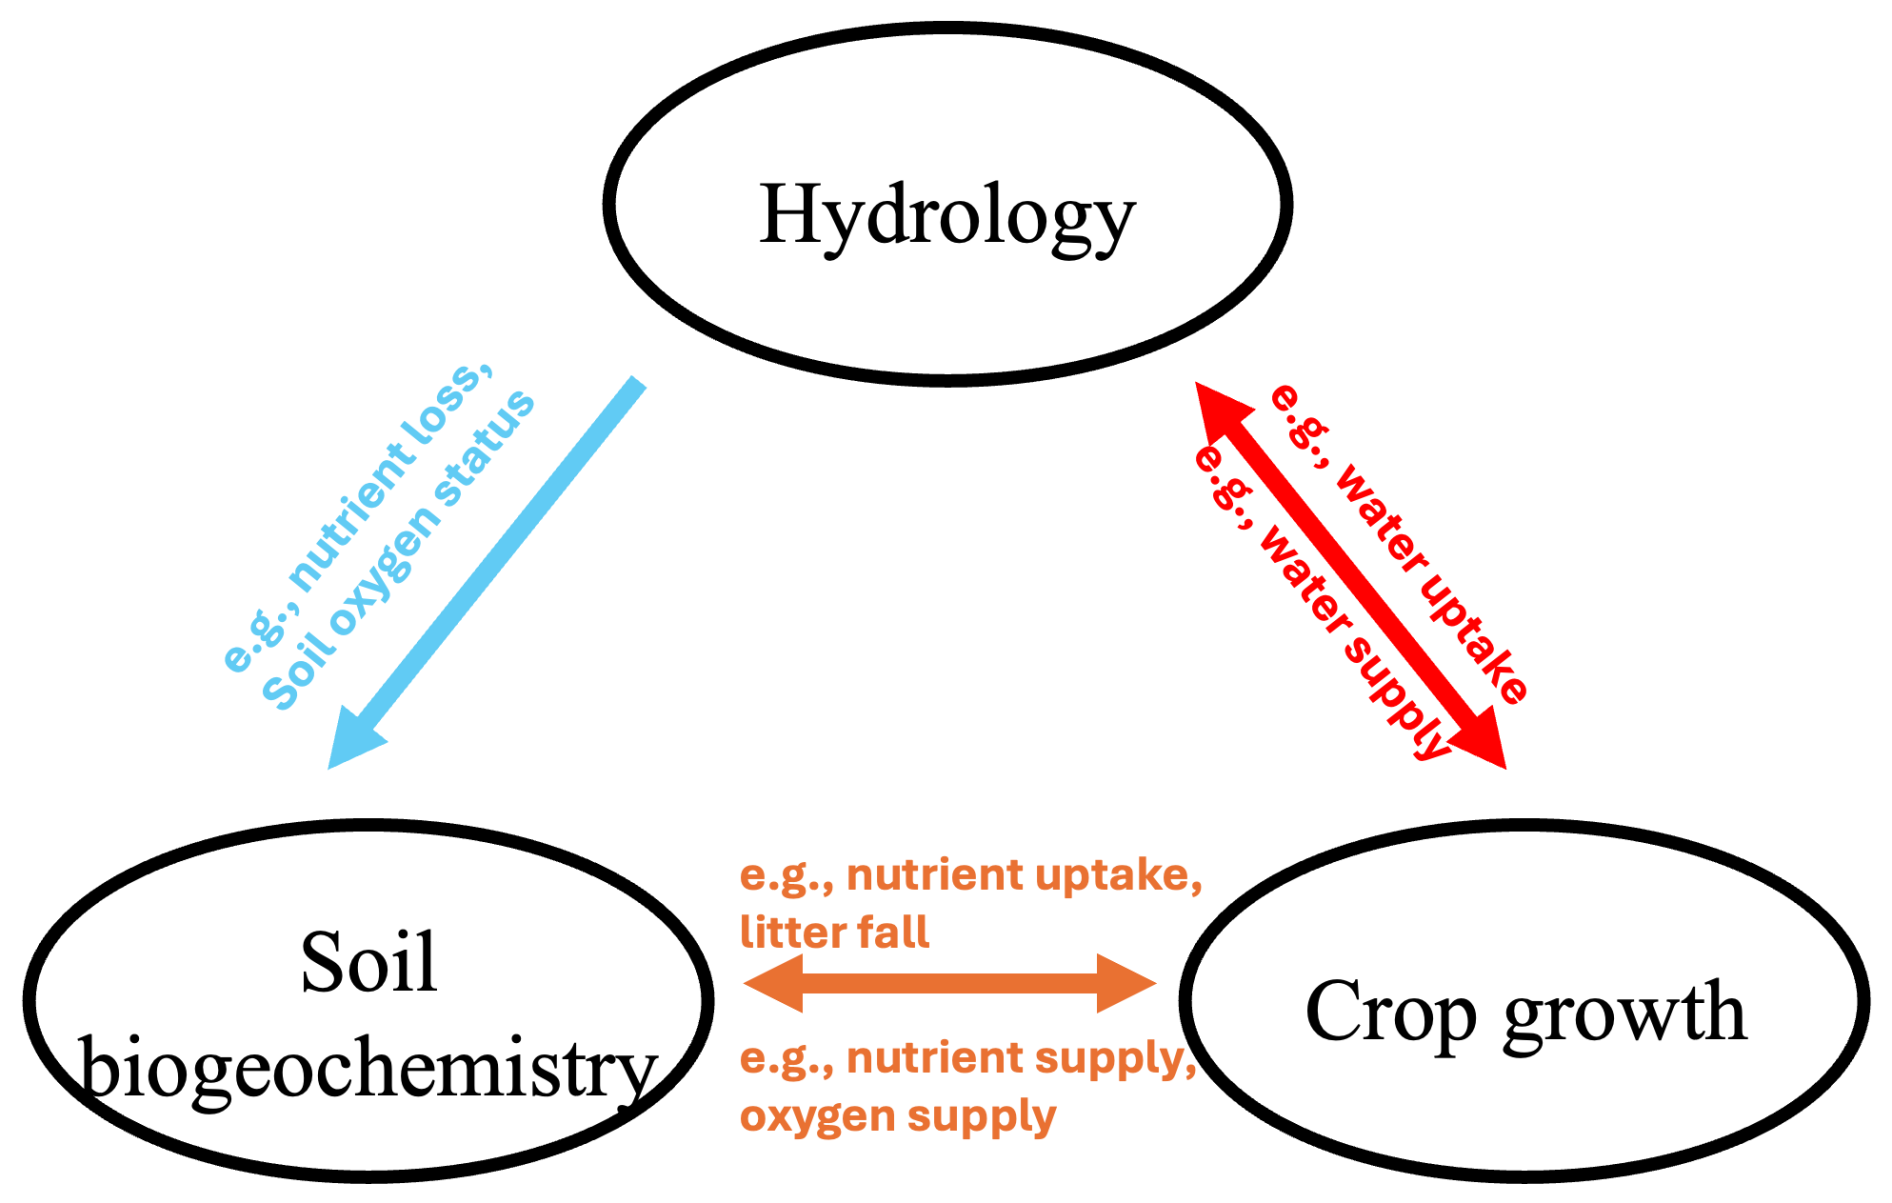
Figure 2Examples of the interplays between hydrology, soil biogeochemistry, and crop growth in the ecosys model.
Ecosys simulates the movement of water through the soil–crop–atmosphere continuum, with the representation of crop interception of precipitation, irrigation, soil and residue evaporation, crop transpiration, infiltration, surface runoff, subsurface discharge, and snow (Fig. S1). All the water fluxes in both the soil and crop are driven by water potential and are tightly coupled with energy cycles (Grant et al., 1999; Mezbahuddin et al., 2016).
Soil biogeochemistry in ecosys is simulated by tracking the flow of carbon (C), nitrogen (N), and phosphorus (P) among various organic states within the soil (Fig. S2). The model represents organic matter into six organic states (i.e., solid organic matter, soluble organic matter, sorbed organic matter, acetate, microbial communities, and microbial residues). Each state is further divided into components with varying vulnerability to hydrolysis by microbial populations. Microbes are the agents that control the C, N, and P transformation. Microbial activity is simulated based on the energetics of oxidation-reduction reactions, driving processes such as decomposition, nitrification, denitrification, and methanogenesis. Meanwhile, the energy generated in those processes and the nutrients will also be used for microbe maintenance and growth. Microbes also undergo decomposition (Grant et al., 1993a, b).
Ecosys simulates crop growth by representing the crop as a collection of individual branches and organs. The growth of branches and organs is driven by the balance between carbon fixation through photosynthesis and carbon losses through respiration and senescence. Carbon fixation happens in the leaves via the Farquhar model, and the fixed carbon is then mobilized to other branches and organs (Grant, 1994). Water and nutrient uptake (i.e., of P and N) is simulated with a hierarchical root system (Grant, 1993, 1998) as affected by temperature, nutrient availability, and soil oxygen concentration. Similarly, the nutrients absorbed by the root (i.e., N and P) are remobilized to other branches and organs for crop growth. For example, the N mobilized to the leaves determines the specific activities and surficial concentrations of leaf rubisco and chlorophyll, further affecting the CO2 fixation rate.
The three components (hydrology, soil biogeochemistry, and crop growth) are tightly interconnected within ecosys. For example, carbon assimilation in crop growth is tightly coupled to canopy transpiration, as stomatal conductance, affected by canopy turgor potential, determines both the transpiration rate and photosynthesis rate (Grant and Pattey, 1999). Root water uptake is the driver for root nutrient uptake in the dispersivity–diffusivity processes; see details in Sect. S3. The hydrological cycle in the model is also tightly linked to soil biogeochemistry. Soil water movement drives the movement of soil nutrients, determining nutrient vertical distribution and loss. In addition, the movement of water also drives the movement of soil gas, e.g., soil oxygen, and subsequently changes both root respiration and microbe activities; see details in Sects. S4–S8. Further, microbial activities control the release of nutrients from organic matter, influencing the availability of nitrogen and phosphorus for crop uptake, which dynamically links soil biogeochemistry with crop growth.
We used ecosys to evaluate the impact of tile drainage on field hydrology, soil biogeochemistry, and crop growth. We provide details about soil oxygen–related processes and tile drainage processes in the following section as soil oxygen is a critical component linking hydrology, biogeochemistry, and crop growth. More detailed processes of the various components, like ecosystem–atmosphere energy exchange, canopy carbon fixation, etc., of the ecosys model can be found on GitHub (https://github.com/jinyun1tang/ECOSYS/blob/master/ecosys_documentation.pdf, last access: January 2024; Grant, 2023).
2.1.2 Soil oxygen dynamics
Oxygen is represented in two phases in ecosys: the gaseous oxygen in the air-filled porosity and the dissolved oxygen in the soil water. The vertical transport of both gaseous and dissolved oxygen, the transfer between dissolved and gaseous oxygen, and the oxygen consumption by both the crop roots and soil microbes are explicitly represented in the model. The volatilization–dissolution transfer between dissolved and gaseous oxygen is driven by the oxygen difference in the two phases, and is determined by the diffusive transfer coefficient, and the air–water interfacial area.
where is the volatilization–dissolution of O2 between the solute and gaseous phases [g m−2 h]; is the O2 volatilization–dissolution transfer coefficient [m2 h−1]; ag is the air–water interfacial area [m2 m−2]; is the Ostwald solubility coefficient of O2 at 30 °C [–]; is the temperature dependence function of [–]; is the gaseous concentration of O2 in the soil [g m−3]; is the corresponding solute concentration in the soil [g m−3].
The vertical transport of dissolved and gaseous oxygen in the soil is calculated from the convective–dispersive equation,
where is the gaseous flux of O2 in the soil [g m−2 h]; Qw is the water flow rate in the soil [m3 m−2 h−1]; is the gaseous concentration of O2 in the soil [g m−3]; is the gaseous diffusivity of O2 in the soil [m2 h−1], determined by its gaseous diffusivity at 0 °C () [m2 h−1], temperature dependence function for gaseous diffusivity (ft,g) [–], air-filled porosity (θg) [m3 m−3], and soil porosity (θp) [m3 m−3]; is the concentration gradient of gaseous O2 in the soil [g m−3 m−1]; is the solute flux of O2 in the soil [g m−2 h]; is the solute concentration of O2 in the soil [g m−3]; is the solute diffusivity of O2 in the soil [m2 h−1], determined by the dispersivity in the soil (Dq) [m], its solute diffusivity at 0 °C () [g m−2 h], Qw, temperature dependence function for solute diffusivity (ft,s) [–], soil water-filled porosity (θw) [m3 m−3], and soil tortuosity (τ) [–].
Soil oxygen will be used by crops, mycorrhizal, and microbes for their maintenance and growth. See Sect. 2.1.3 for a detailed description of the crop oxygen uptake. See the Supplement and the online document on GitHub (https://github.com/jinyun1tang/ECOSYS/blob/master/ecosys_documentation.pdf) for a detailed description of the microbial growth and oxygen uptake.
2.1.3 Root respiration and crop oxygen demand
Roots play a critical role in crop growth by acquiring necessary resources, including water and nutrients (i.e., nitrogen, phosphorus, etc.), from the soil for crop development and stabilizing the crop body structure (Hodge et al., 2009). Understanding the interactions between the root system and soil is essential to quantify the impacts of different environmental factors on crop growth (Jin et al., 2020). Ecosys explicitly simulates the root system with a representation of vertical primary axes and horizontal secondary axes (details in Grant, 1993, 1998). In the model, root growth and maintenance are driven by root respiration, and the rate of root respiration at maximum turgor in each soil layer is controlled by the available carbon storage, soil moisture, temperature, oxygen availability, and nutrient status,
where RT is the root respiration for maintenance and growth [gC m−2 h−1]; QR is the specific respiration of CH2O [g g−1 h−1]; CR is the nonstructural CH2O in the root [gC m−2]; ft,R is the temperature function for respiration [–]; fo,R is the oxygen function for respiration, represented as the ratio of O2 uptake to O2 demand [–], and will be described in detail below; fλ,R is the nutrient status function for respiration [–]. The actual respiration rate is further adjusted by the root turgor and soil strength (Grant, 1993, 1998). Nutrient uptake (NO, NH, PO) also respires CH2O,
where RU is the respiration for nutrient uptake [gC m−2 h−1]; α is the specific respiration rate for nutrient uptake [–]; Uλ is the uptake rate of nutrient Z (NO, NH, PO) [gN m−2 h−1 or gP m−2 h−1]. The total root respiration is, then, the total respiration for root maintenance, root growth, and root nutrient uptake (RT+RU). The crop oxygen demand () is defined as the oxygen uptake rate without soil oxygen limits,
where RQ is the respiratory quotient [gC(gO2)−1].
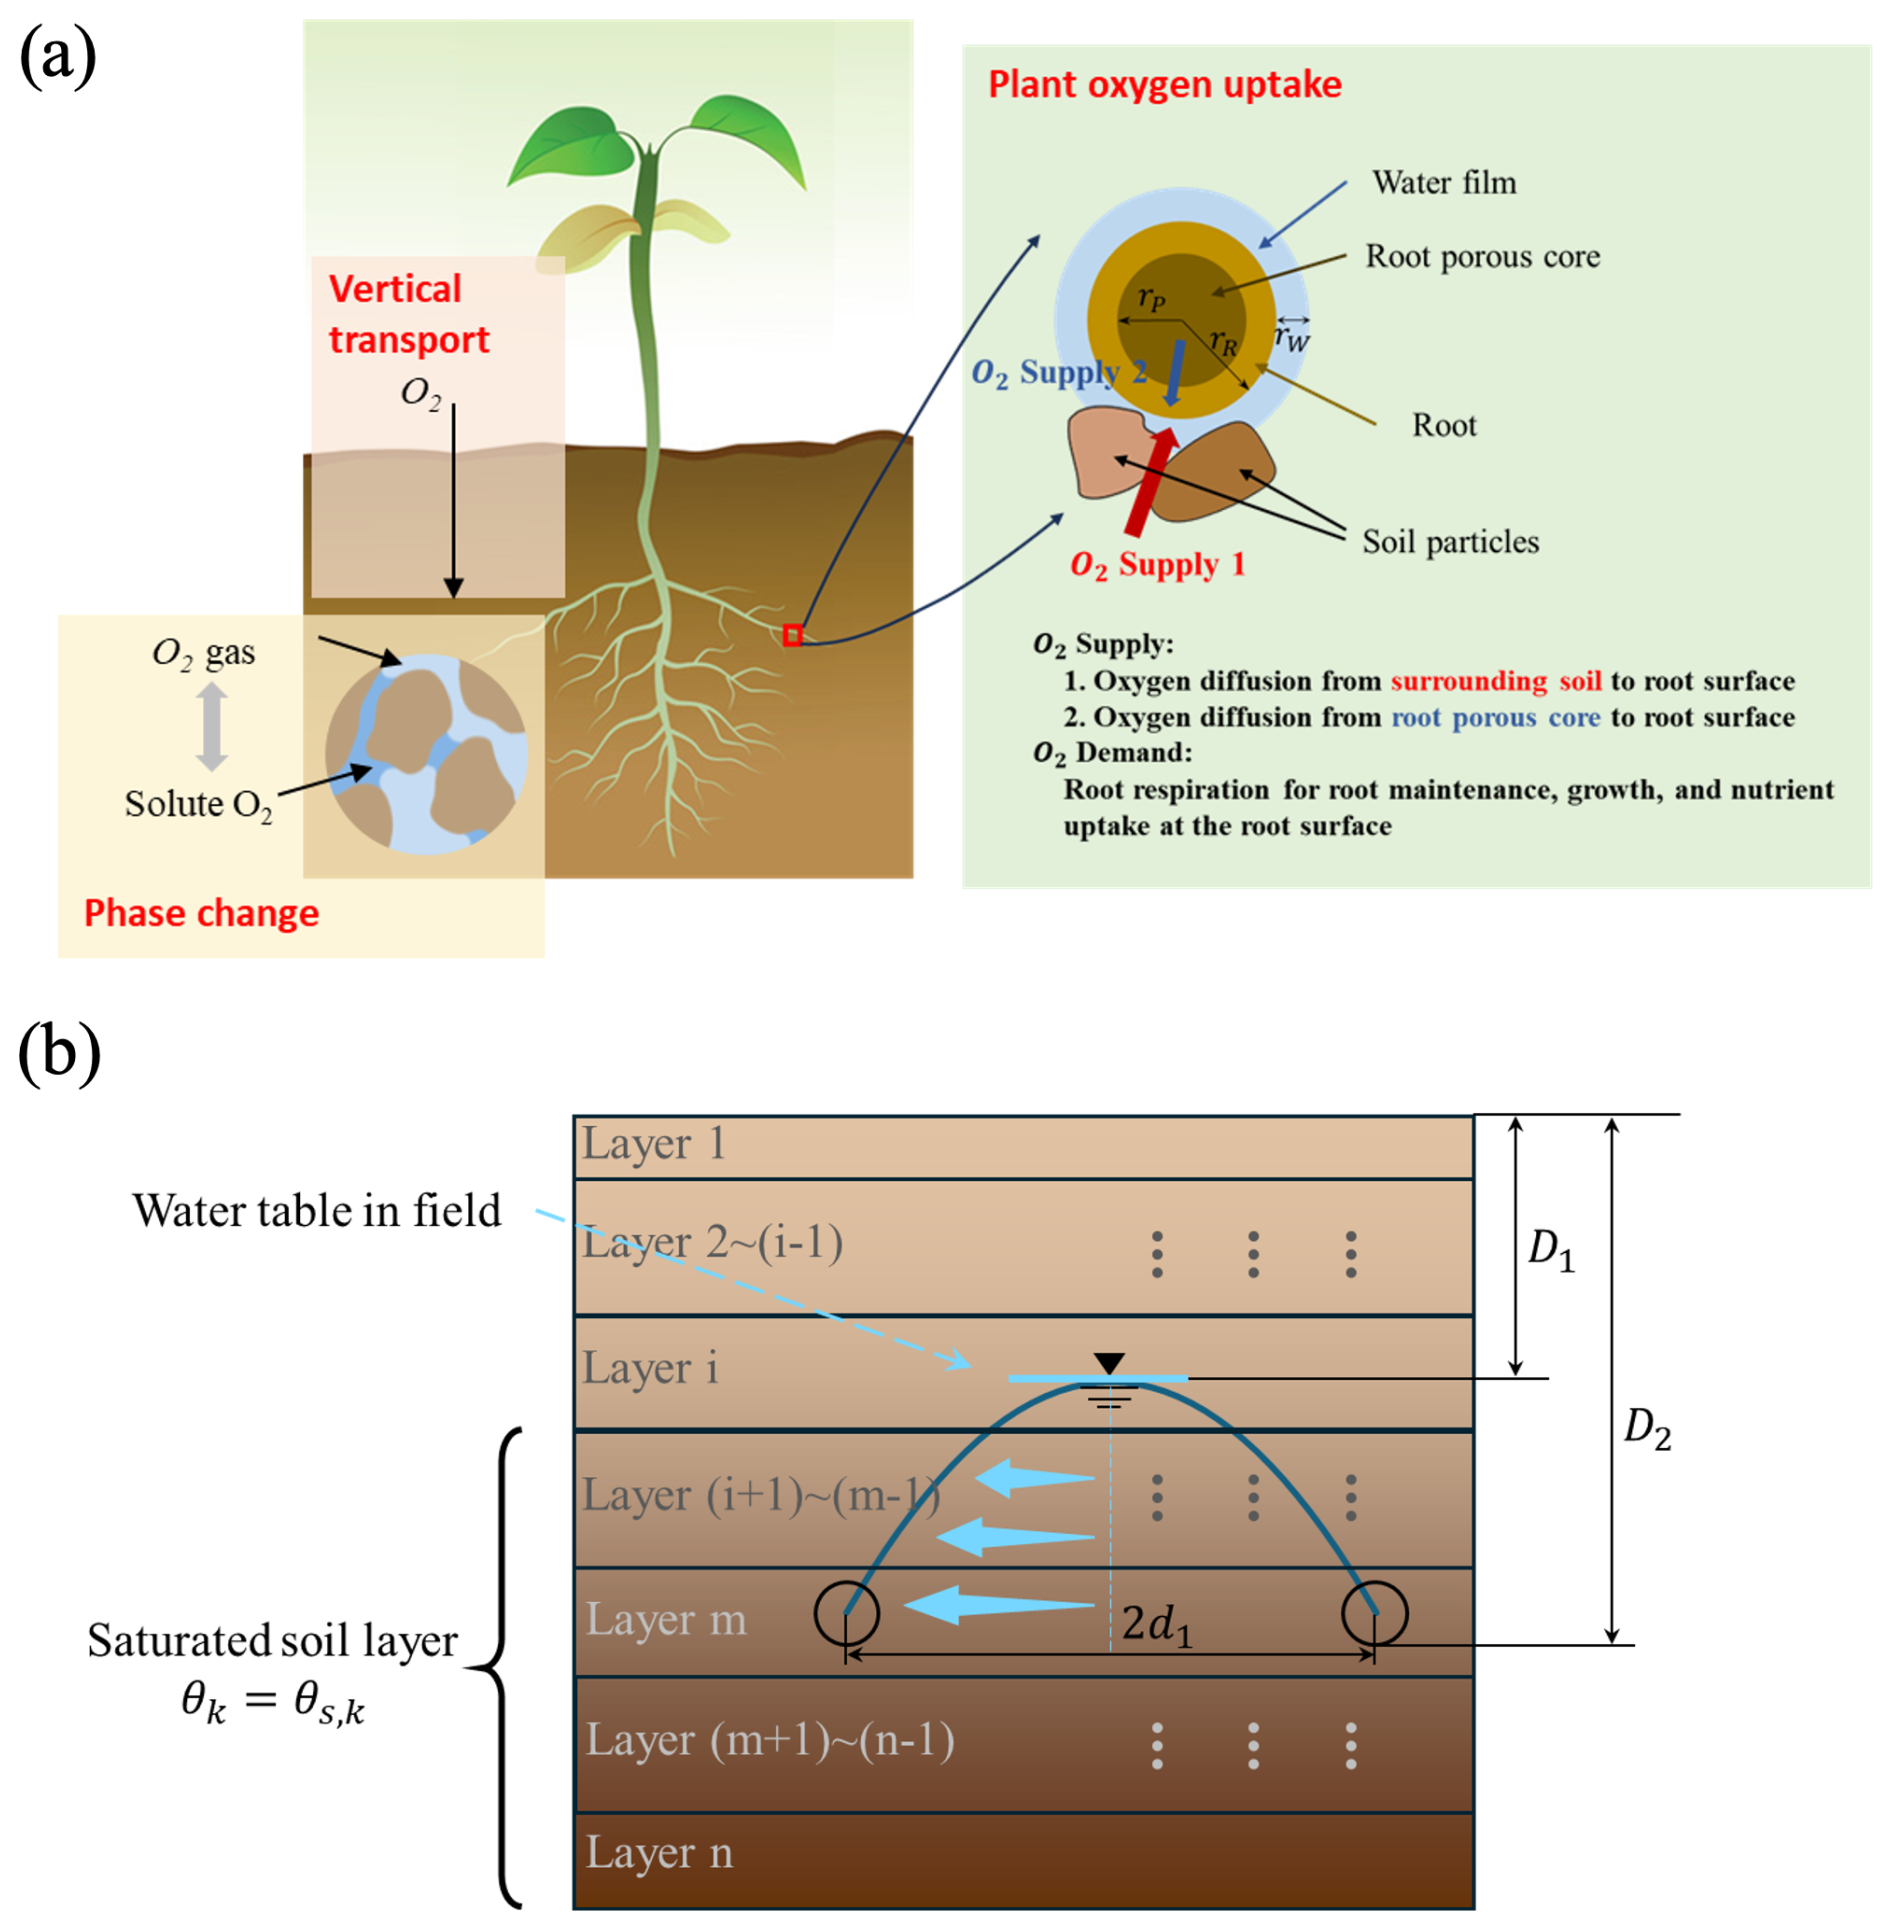
Figure 3Representation of (a) oxygen dynamics and root oxygen uptake, and (b) subsurface tile flow in the ecosys model. rR is the root radius [m]; rW is the thickness of the water film [m]; rP is the radius of the root porous core [m]. D1: water table depth in the field [m]; D2: tile depth [m]; 2d1: tile spacing [m]; θk: soil water content in the kth soil layer [m3 m−3]; θs,k: saturated soil water content in the kth soil layer [m3 m−3]. In this schematic, the field water table is in the ith soil layer, and tile drainage is installed in the mth soil layer. The vertical dots represent the intermediate soil layers not shown. The diagram only represents the case that the water table in the field is higher than the tile drainage.
The oxygen uptake rate in ecosys is controlled by both the soil oxygen supply (dissolved oxygen transport rates to the root surfaces) and the ability of roots to take up oxygen (active uptake rates at the root surface where respiration is modeled). The conceptualization of crop roots is depicted in Fig. 3a, with a porous core in the middle, surrounded by an aqueous zone where respiration happens, then encased in a water film. Gaseous and dissolved oxygen transport in both the root porous core and the soil contributes to root respiration. The movement of oxygen is assumed to be radial, and the rate of oxygen moving from the soil water to the root surface and the rate of oxygen moving from the aqueous zone of the root porous core to the root surface are obtained from Eqs. (9) and (10), respectively.
where UO,s is the rate of oxygen uptake by the root from the soil [g m2 h−1]; UO,P is the rate of oxygen uptake by the root from the root porous core [g m2 h−1]; Uw is the root water uptake rate [m3 m−2 h−1], determined by the soil and root water potential and root resistances (Grant, 1998); is the dispersivity–diffusivity of dissolved oxygen [m2 h−1] (Bresler, 1973); L is the root length [m m−2]; is the dissolved oxygen concentration in the soil [g m−3]; is the oxygen concentration at the respiration site [g m−3]; is the dissolved oxygen concentration in the root porous core [g m−3]; rR is the root radius [m]; rW is the thickness of the water film [m] (Kemper and Rollins, 1966); rP is the radius of the root porous core [m]. The active oxygen uptake rate by the roots is modeled in the Michaelis–Menten format,
where UO is the root oxygen uptake rate [g m2 h−1], KO is the Michaelis–Menten constant for the root oxygen uptake [g m−3]. UO is solved iteratively from Eqs. (6)–(8), with . All dissolved oxygen concentrations are driven by the oxygen transport in gaseous phases, and by dissolution from gaseous to aqueous phases in the soil and roots, which will be affected by the soil drainage conditions. Details of the oxygen transport and dissolution (i.e., solute and gaseous) in the soil and root could be found in Grant (1993). Then, the oxygen stress indicator (fo,R) in Eq. (6) is defined as the ratio between the UO and ,
2.1.4 Water balance
The water balance in the simulated field is given by
All terms are defined as fluxes per unit area [m3 m−2] at the time step i. Specifically, ΔSi is the change in the soil water storage; Pi is the precipitation; Ri is the surface runoff, referring to the water leaving the system above the soil surface, and it is estimated with Manning's equation (Sect. S1 in the Supplement); Qi represents the total water exchange across the subsurface boundary and tile drainage. A positive value indicates outflow (subsurface discharge) and a negative value indicates inflow (subsurface recharge). Although the model operates on an hourly time step, in the following analysis, the subsurface exchange was aggregated and attributed to discharge and recharge on a daily basis. The lateral water exchange is controlled by a lateral subsurface boundary condition, with a specific external water table depth and a specific lateral distance over which the lateral subsurface water flow occurs (Fig. S4). The external water table depth represents the water table depth of the surrounding environment; for instance, the water table depth at the field boundary, channel, or nearby lakes.
2.1.5 Tile drainage
The vertical soil water flow is governed by the Richards' equation,
where θw is the soil water content [m3 m−3]; K(θw) is the soil hydraulic conductance at θw [m h−1]. S is the soil water sink term [m3 m−3 h−1], including the crop and mycorrhizal water uptake, lateral water fluxes to/from the external water table, and lateral discharge to the tile drainage. To solve the equation, the soil column is discretized into several user-specified layers (Fig. 3b).
Water fluxes to the tile pipes are estimated laterally with Darcy's law in saturated soil layers,
where v is the flow velocity [m h−1]; K is the saturated hydraulic conductance [m h−1]; ΔD is the pressure drop [m] over a distance d [m]. The pressure drop is defined as the difference between the internal water table depth and the tile depth (D2–D1), and the distance is then defined as half of the tile space (d1). Similar to the Dupuit–Forchheimer assumption, we assume water flow horizontally. Thus, the tile flow is only calculated in the soil layers above and containing tile drains. There is no tile flow if the water table in the field is below the tile pipes. The water table in the field is in the lowest unsaturated soil layer below which all soil layers are saturated. Specifically, the water table in the field is estimated with
where D1 is the water table depth [m]; ds is the depth to the top of the uppermost saturated soil layer [m]; Li is the thickness of the lowest unsaturated soil layer [m]; θi is the volumetric soil water content of the lowest unsaturated soil layer [m3 m−3]; θi,s is the saturated volumetric soil water content of the lowest unsaturated soil layer [m3 m−3].
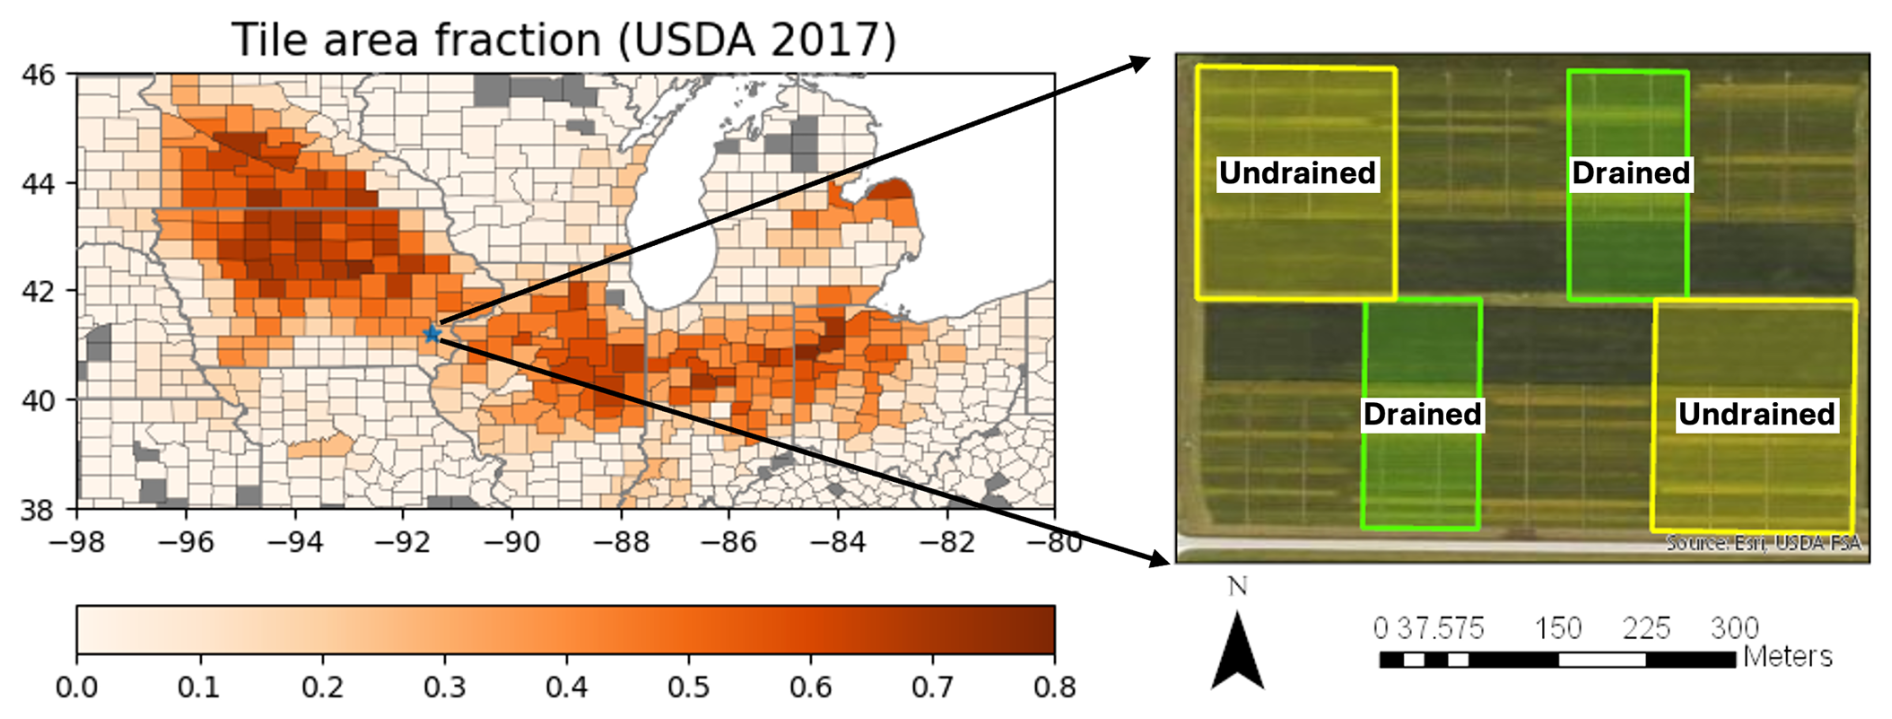
Figure 4Tile fractions over the US Midwest region, and the location and layout of the selected experiment field. The yellow boxes represent sub-fields without tile drainage and the green boxes represent sub-fields with conventional drainage.
2.2 Model setups
2.2.1 Field data
Data from an experimental field site (Fig. 4) in the Iowa State University Southeast Research and Demonstration Farm in Washington County (41.20, −91.49°), were used for the model setup and validation (Chighladze et al., 2021). The major soil types in this site are the Tanitor and Kalona soils (silty clay loam soil) (Fig. S5). The study site consists of four tile drainage treatments: conventional drainage, shallow drainage, controlled drainage, and no drainage. Each of these treatments had two replicates with corn–soybean rotations. Border tiles without monitoring were installed to reduce the interaction between adjacent plots. Only the conventional drainage and no drainage plots were used in this study. Tile drainage was installed in 2006 and the tile flow, crop yield, and daily water table depth were monitored from 2007 to 2017. The tile diameter, tile depth, and tile spacing between tiles drains are 25.4, 122, and 18.3 m, respectively. Management practices, such as tillage and fertilizer application, were documented and used as model inputs. On-site daily precipitation was monitored from 2007 to 2017. The precipitation data in 2007 were removed due to quality issues (Fig. S6). All these data can be accessed on a website of Iowa State University (https://datateam.agron.iastate.edu/td/, last access: May 2023; Chighladze et al., 2021).
2.2.2 Model calibration, validation, and experiment design
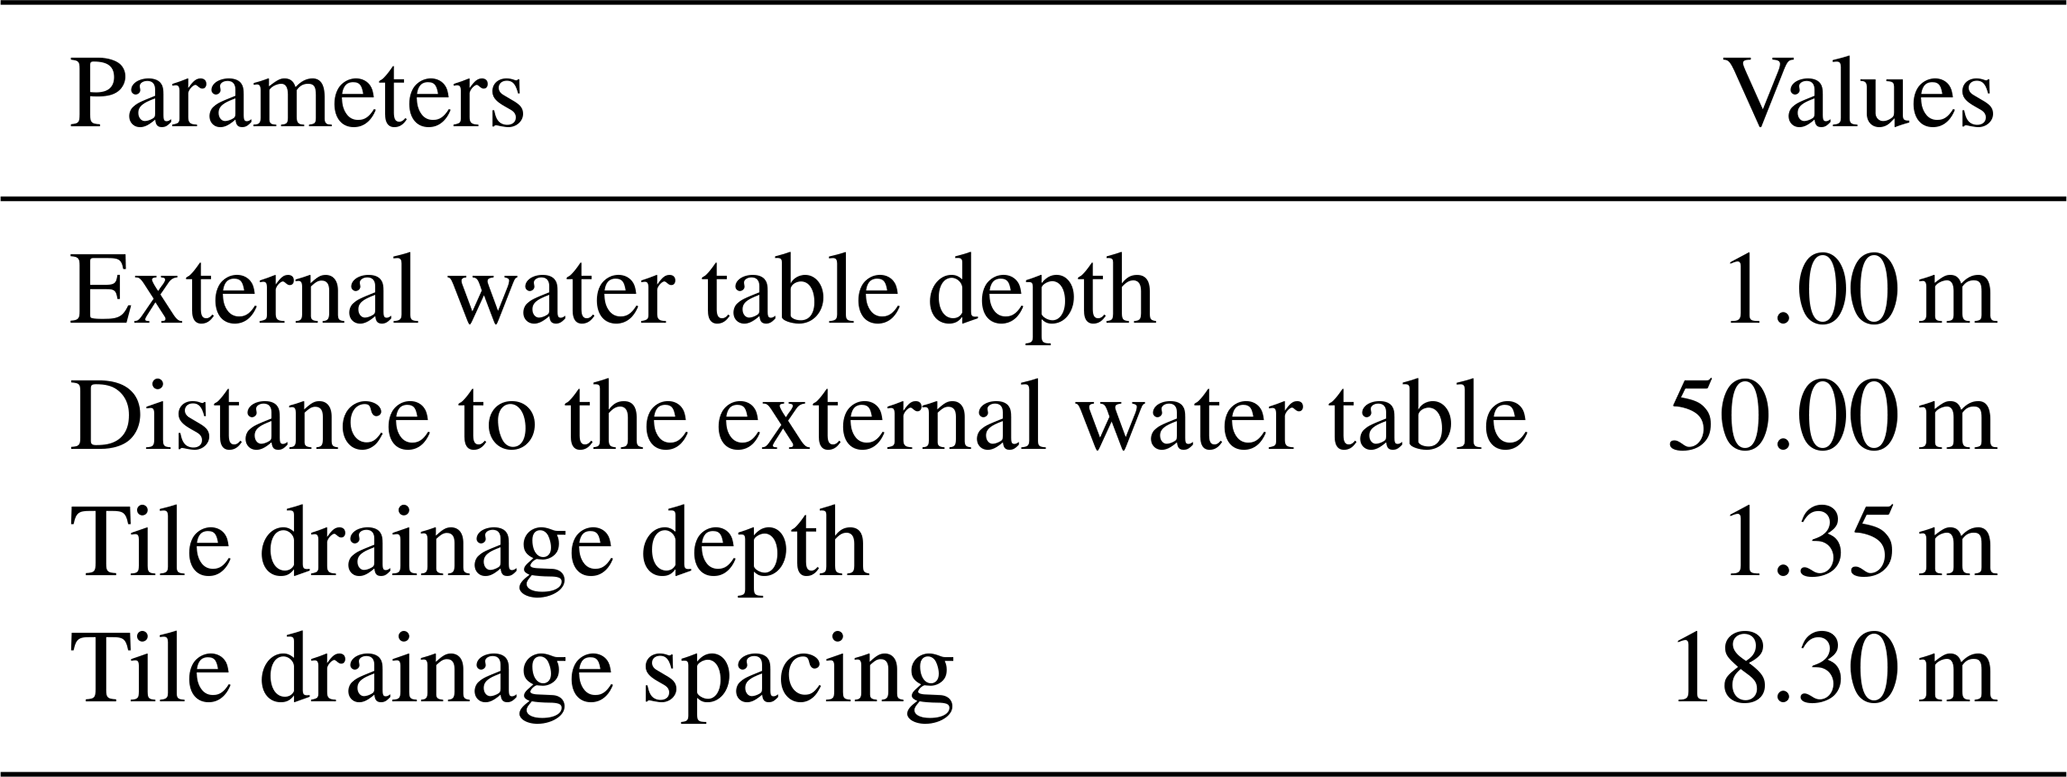
Soil properties, weather, management practice data, and tile drainage settings are required to drive the ecosys model. The North American Land Data Assimilation System (NLDAS-2) dataset was used as the major meteorology driver, including temperature, solar radiation, humidity, and wind speed (Xia et al., 2012). Daily precipitation data from on-site observations for the years 2008 to 2017 were substituted for the NLDAS-2 dataset to better capture the local rainfall pattern. As hourly data were unavailable, daily precipitation totals were uniformly distributed over two separate hours on each rainy day. This approach was chosen because common downscaling techniques, such as AWE-GEN (Ivanov et al., 2007), require sub-daily precipitation statistics that were not available for our site. Furthermore, this simplification is justified as our analysis focuses on the system's response at monthly and annual time scales. The soil information was obtained from the Gridded Soil Survey Geographic Database (gSSURGO) dataset, and the detailed soil information used in the study can be found in Fig. S5 and Table S2 (Soil Survey Staff, 2023). The settings for the tile drainage in the tile field are shown in Table 1. We referred to one observation well in the undrained field to set the subsurface boundary condition. Specifically, the external water table depth was set as the mean value of the observed water table depths (1.00 m), and the distance to the external water table was set as 50 m, which is around half of the length of the experimental field. The tile drainage depth was set as the lowest point of the tile drainage, which was the depth of the tile drainage plus the radius of the tile drainage, 1.35 m. The tile drainage spacing was 18.3 m.
The ecosys simulation was started in 1990, with the initial 17 years (1990–2006) as the initialization period to stabilize the model, followed by an 11-year analysis period (2007–2017). Due to the limited length of the observational record, the model was calibrated against the undrained field and validated against the tile-drained field. The configuration of the model relied on established crop parameters in the US Midwest conditions (Li et al., 2022). Key parameters sensitive to local conditions were calibrated using observed crop yields from the undrained field, such as the maturity group and maximum rate of carboxylation (VCMX). The parameter ranges and final values were shown in Table S1 in the Supplement. The Pearson coefficient (r), percent error (PE), root mean square error (RMSE), and relative root mean square error (rRMSE) were used to assess the model's performance, comparing the simulated yield with the observed yield. The tile flow simulation was assessed on a monthly basis by comparing the simulated and observed values through r, RMSE, and the Nash–Sutcliffe model efficiency coefficient (NSE),
where xi is the observation, yi is the simulation, and and are the mean value of observation and simulation, respectively. N is the number of observations.
To investigate the effects of tile drainage in wetter conditions, we ran the calibrated model to simulate hydrological processes, biogeochemical dynamics, and crop growth across a spectrum of precipitation scenarios. Specifically, we manually adjusted the precipitation inputs with a scale factor, λ, to evaluate wetter conditions (Fig. S7),
where P is the original precipitation time series that drives the model and pi is the precipitation at ith time step [mm]. Pλ is the precipitation time series with the scale factor corresponding to five hypothetical scenarios. Given that the temperature, which dominates the vapor pressure deficit, is more influential on the crop yield in drought over the US Midwest (Lobell et al., 2014), this hypothetical experiment is mainly targeted at understanding the system's response to flooding with more precipitation.
3.1 Model validation
The ecosys model's crop yield simulations were evaluated against field observations (Fig. 5 and Table 2). Overall, the Pearson coefficient r for the yield simulation was over 0.95 for both calibration and validation. Specifically, the PE for corn in calibration and validation was −0.50 % and −3.10 %, respectively. The PE for soybean in calibration and validation was −8.75 % and −1.57 %, respectively. The rRMSE for corn and soybean in validation was 5.66 % and 12.57 %, respectively. Both the observations and simulation showed the benefit of tile drainage for crop yield. For corn, tile drainage increased the yield by 0.830 t ha−1 (6.97 %) and 0.515 t ha−1 (4.20 %) in the model simulation and observations, respectively. For soybean, the tile drainage increased the yield by 0.193 t ha−1 (5.37 %) and 0.498 t ha−1 (13.66 %) in the model simulation and observations, respectively (Table 3). Besides, the model successfully captured the seasonal pattern of more tile flow in the late spring and early summer (Fig. 6). The observations suggested that there was no tile flow in January and February, and we hypothesized that this was due to the low temperature that disabled the measurement device. Thus, we only validated the tile flow in the growing season (April to October). The r, RMSE, and NSE for the monthly tile flow simulation in the growing season were 0.785, 28.42 mm per month, and 0.43, respectively. These results indicate that the ecosys model is promising for estimating both crop yield and tile drainage flow.
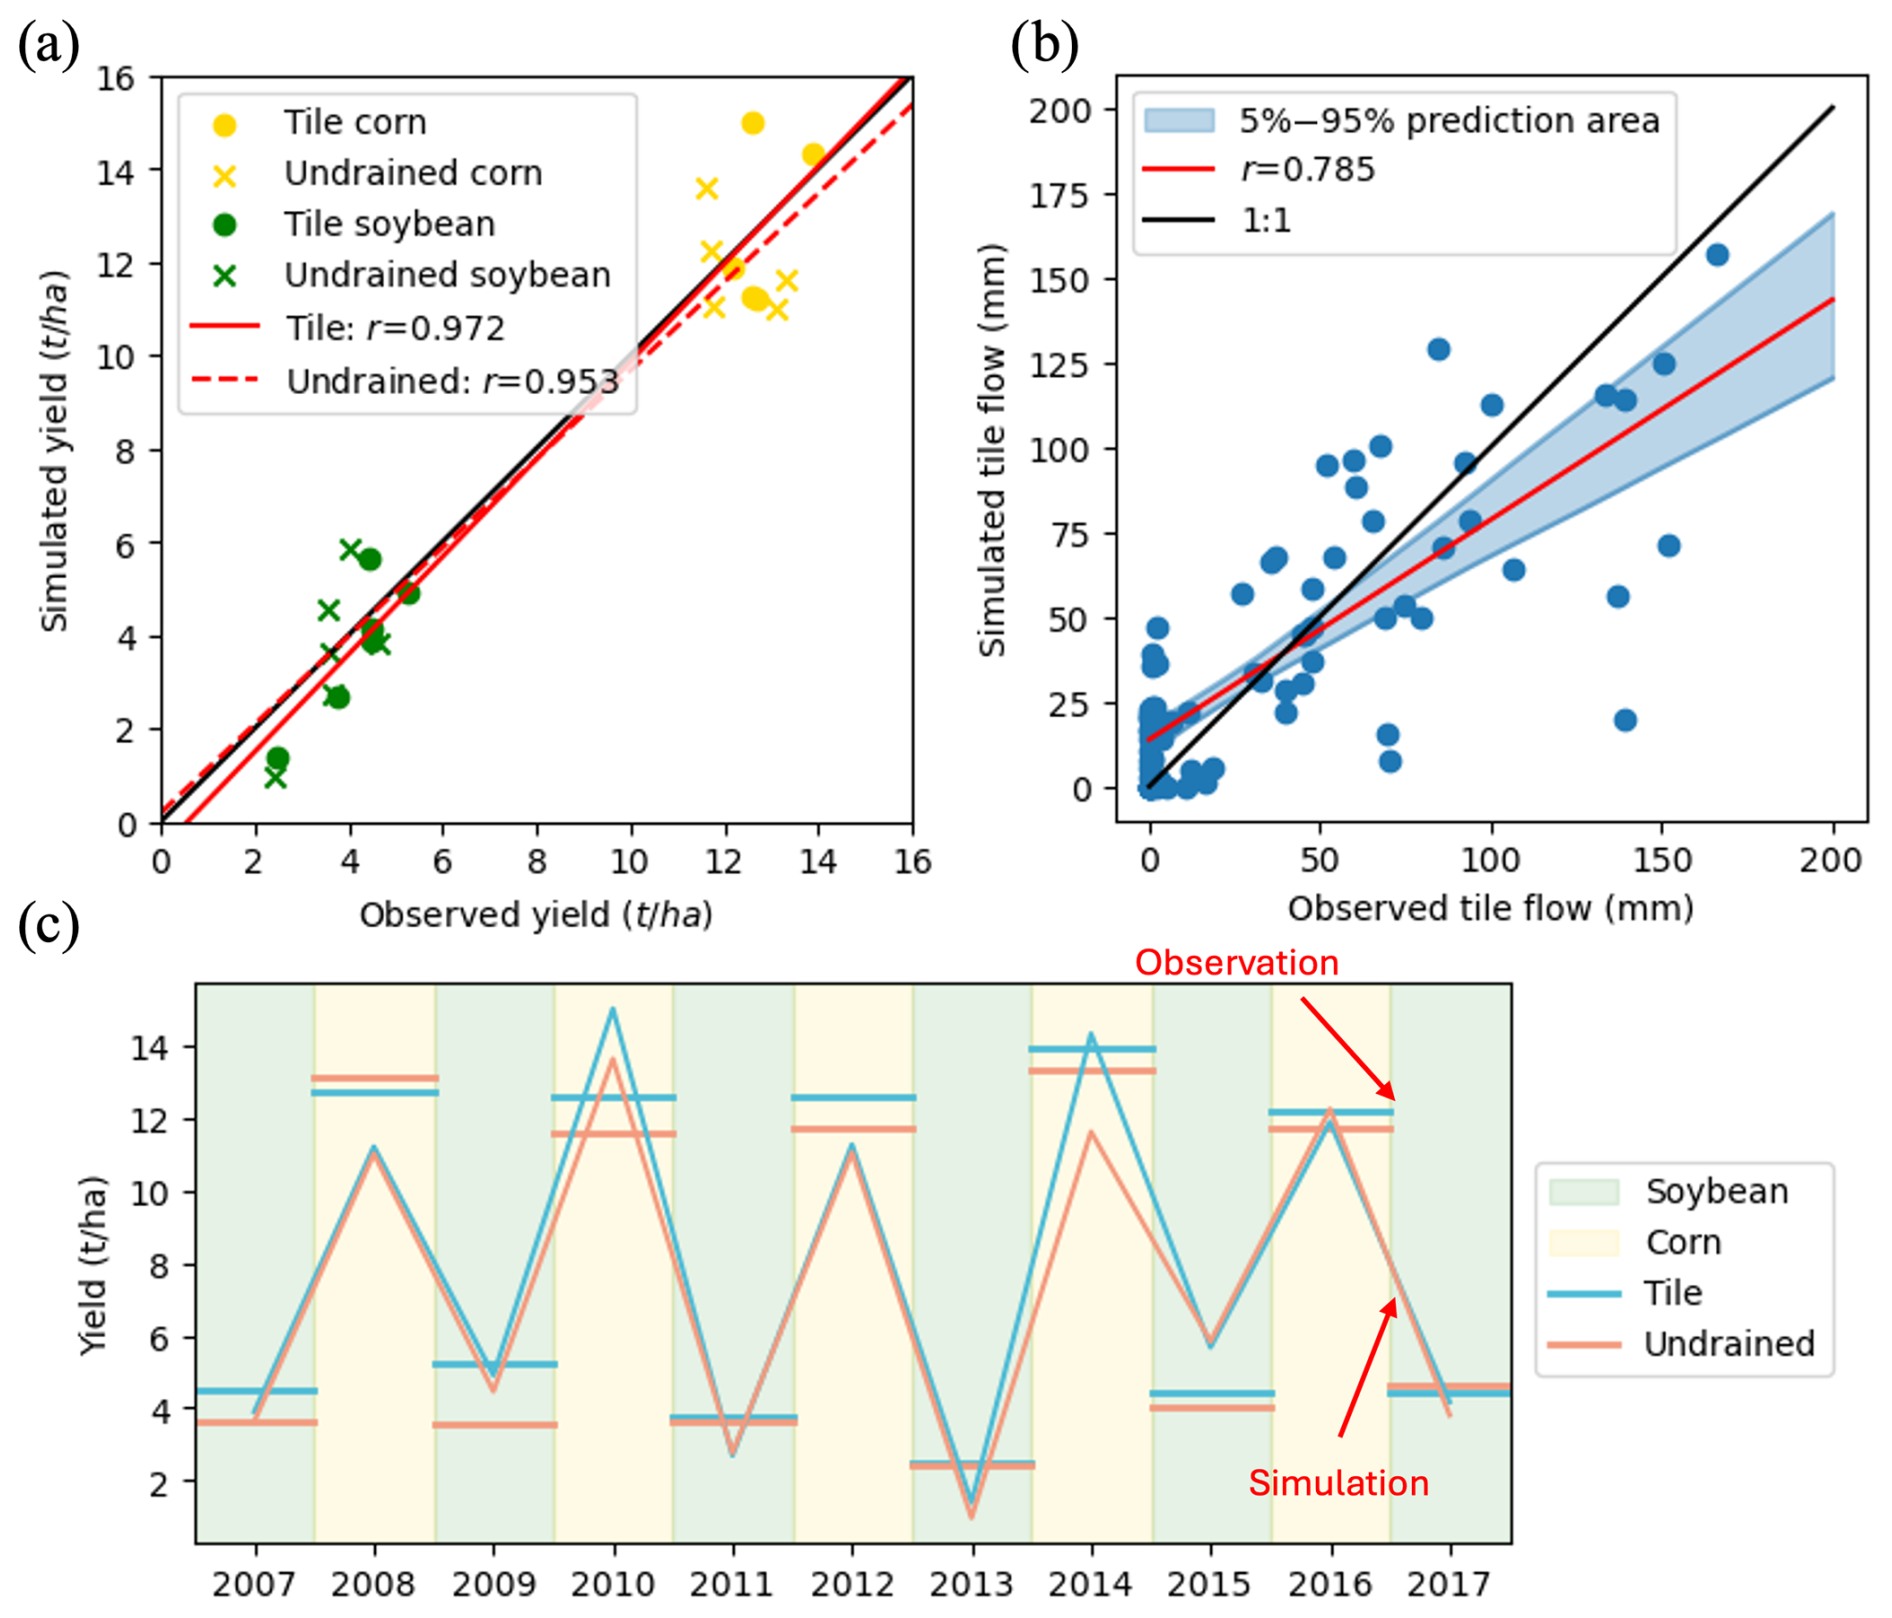
Figure 5Validation for the crop yield and tile flow. Comparison of ecosys-simulated and ground-measured (a) maize (15 % moisture) and soybean (13 % moisture) grain yield, and (b) monthly tile flow in the growing season (April to October). (c) Time series of the simulated and observed yield. Corn years (light gold) and soybean years (light green) are indicated with different background colors.
Table 2Goodness-of-fit statistics for crop growth for calibration and validation. PE: percent error; rRMSE: relative root mean square error; RMSE: root mean square error.
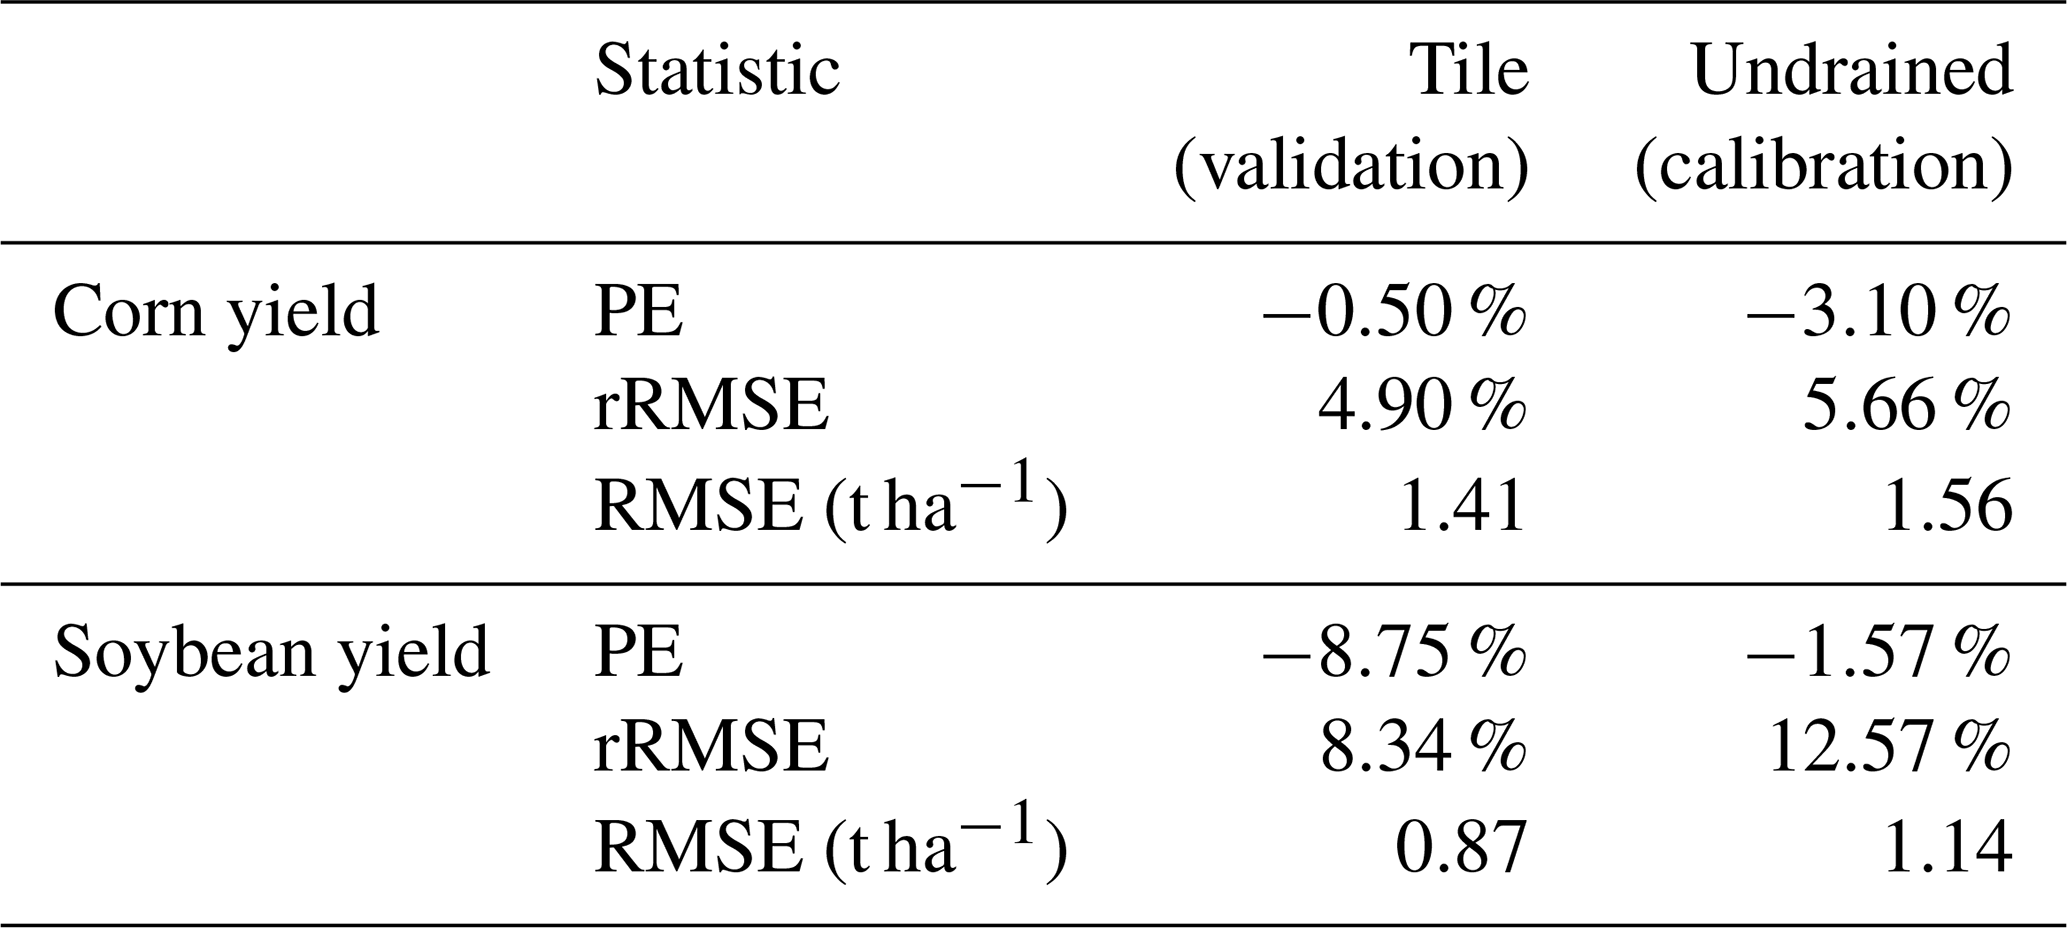
Table 3Observed and simulated crop yield under the tile and undrained conditions.
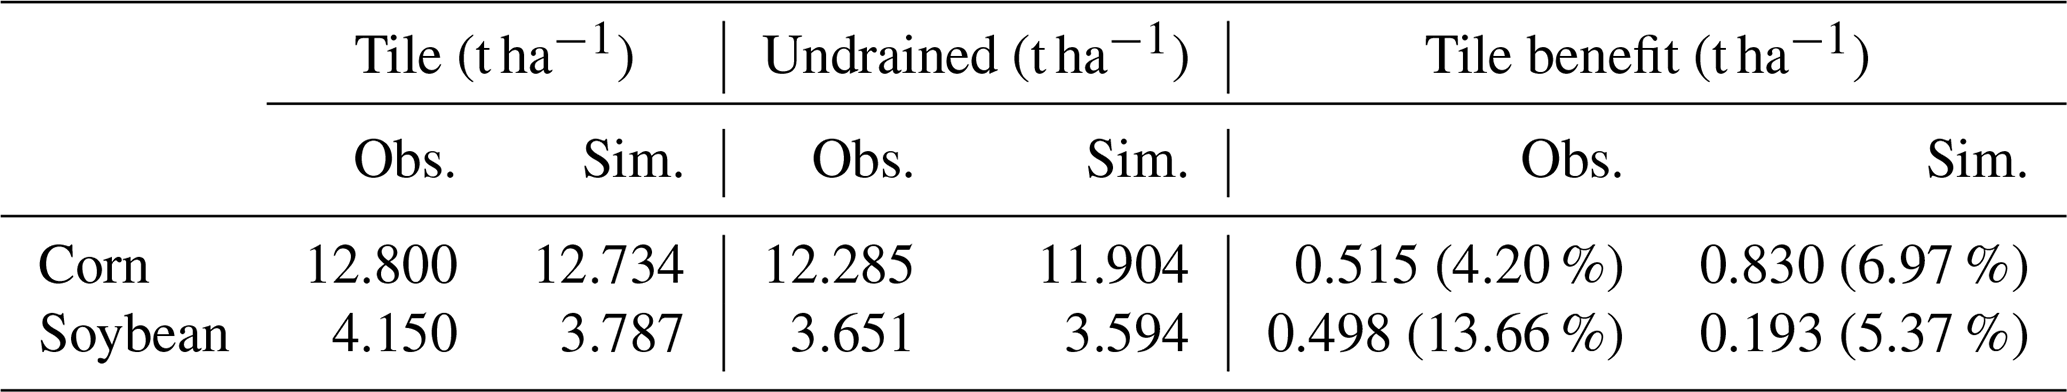
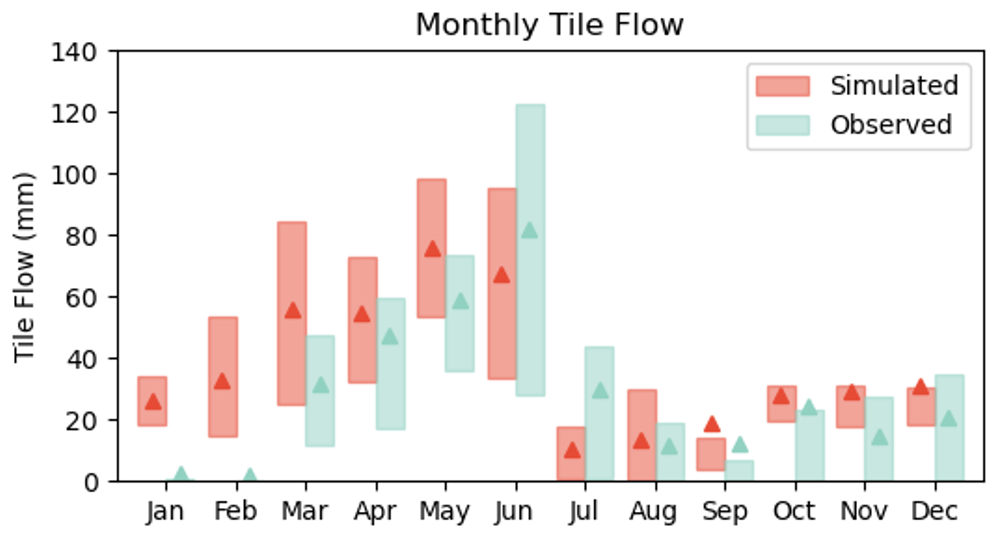
Figure 6Ecosys-simulated and observed tile flow. The boxes represent 25 %–75 % of the tile flow for the simulated period (2007–2017), and the triangles represent the mean tile flows. The triangles represent the multi-year mean tile flow in a certain month.
3.2 The impacts of tile drainage on hydrology
We first evaluated the water fluxes and partitioning with the ecosys model under the tile and undrained conditions at the study site. The annual mean precipitation was 881 mm from 2007 to 2017, and most of the precipitation (66.4 %) occurred from April to August (Figs. 7 and S8). The simulations indicated that the tile drainage primarily altered the subsurface water exchange (Fig. 7). Compared to the undrained condition, the tile drainage increased the annual mean subsurface discharge from 216 to 276 mm and increased the subsurface recharge from 34 to 104 mm. In contrast, the tile drainage had a limited impact on other fluxes. The annual mean ET was similar under the tile (659 mm) and undrained (655 mm) conditions, as was the surface runoff (48 and 46 mm, respectively). As a direct consequence of the increased subsurface drainage, the simulations showed that the tile drainage reduced the soil water content (Fig. S11a).
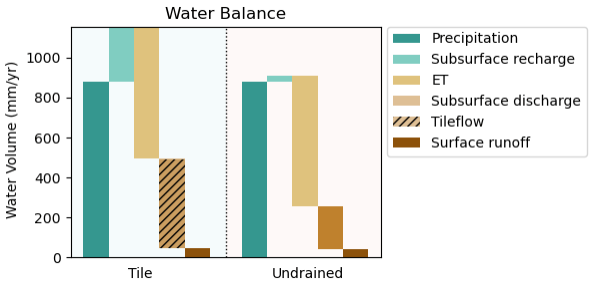
Figure 7Ecosys-simulated annual water balance under the tile and undrained conditions. Overall, tile drainage increases both subsurface discharge (water coming out of the field) and subsurface recharge (water going into the field), and the ET and surface runoff are similar under the tile and undrained conditions. The imbalance between influxes and outfluxes is subject to storage change.
The results indicated that the effects of the tile drainage followed a seasonal pattern (Fig. 6). For the study site, the tile drainage actively removed excess water in the spring, leading to an increase in the net subsurface discharge from 120 to 137 mm, corresponding to high precipitation and low ET during those months. Less water was drained by the tile drainage in the summer due to high crop water consumption despite high precipitation (Figs. 6, 8, and S10). On average, the net subsurface discharge was −53 mm in the summer under tile conditions, indicating a significant recharge from the surrounding soils to the tile-drained field. Tile drainage increased the net subsurface discharge from 17 to 28 mm and from 48 to 60 mm in the autumn and winter, respectively, when compared to the undrained condition. Tile drainage slightly raised the ET in the summer months from 226 to 238 mm, and slightly reduced the ET in other months (Fig. 8).
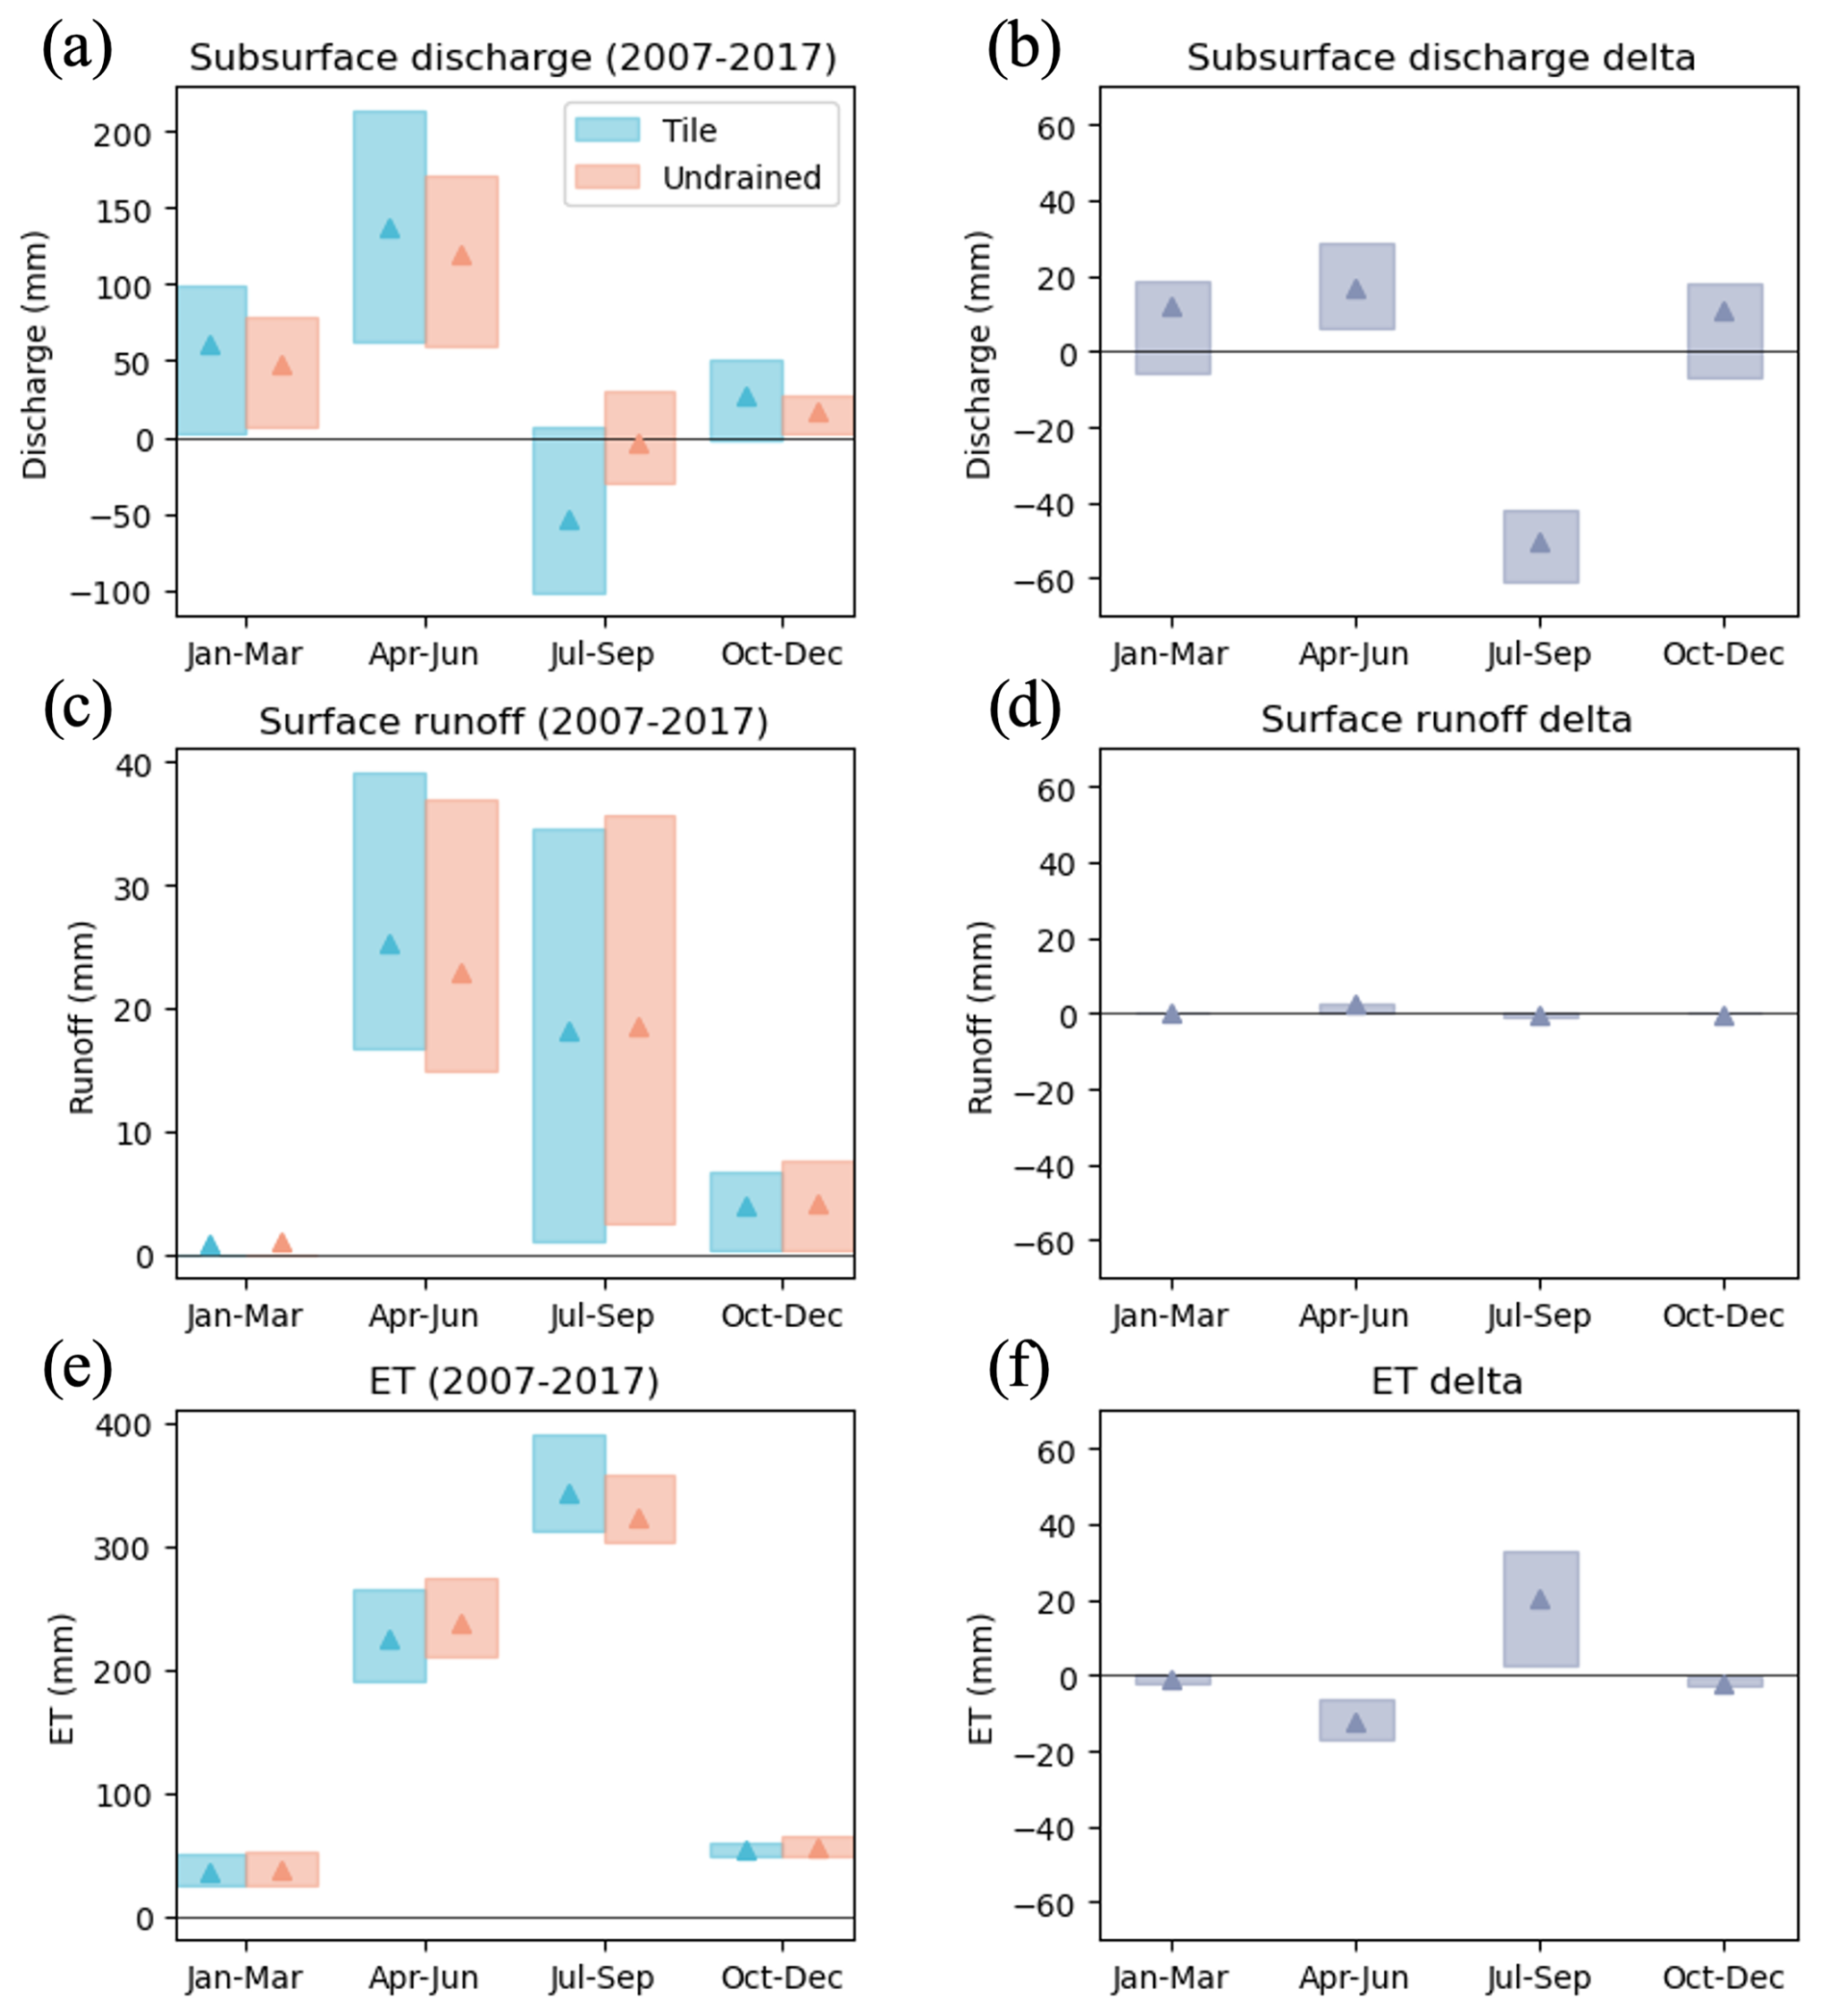
Figure 8Ecosys-simulated water fluxes under the tile and undrained conditions from 2007 to 2017. (a) Boxplot of the quarterly net subsurface discharge (subsurface discharge – subsurface recharge); (b) boxplot of the quarterly net subsurface discharge difference between the tile and undrained conditions; (c) boxplot of the quarterly surface runoff; (d) boxplot of the quarterly surface runoff difference between the tile and undrained conditions; (e) boxplot of the quarterly ET; (f) boxplot of the quarterly ET difference between the tile and undrained conditions. The upper and lower parts of the boxplots indicate the 25 % and 75 % quantiles, and the boxes indicate the interquartile variation. The triangles indicate the mean values. Delta is the difference between the tile and undrained conditions. The corresponding monthly results are shown in Fig. S10.
3.3 The impacts of tile drainage on the soil biogeochemistry and subsequent crop growth
In addition to altering water fluxes, the model showed that tile drainage significantly changed the fate and transport of inorganic nitrogen (IN). At the study site, the annual mean total IN loss was 2.72 and 1.89 g Nm−2 for the tile and undrained conditions, respectively (Fig. 9). Tile drainage primarily increased the subsurface IN loss, with values rising from 1.89 to 2.45 g Nm−2, while the surface IN loss remained relatively constant, with no significant differences noted between the tile and undrained conditions, around 0.27 g Nm−2. These values were within the range of riverine nitrogen yield in the central US Midwest reported by David et al. (2010). Over 85 % of IN left the system through the subsurface in both the tile and undrained conditions. Most IN loss happened in the spring, coinciding with fertilizer application and the peak precipitation period. The impacts of tile drainage on IN loss also exhibited a seasonality. Our model revealed that subsurface IN loss had the most substantial increase in the spring with an increase of 0.35 g Nm−2, while the increase of subsurface IN loss in the summer was only 0.08 g Nm−2. Furthermore, the model results showed that nitrogen loss increased with the total precipitation in the hypothetical experiments (Fig. S12).
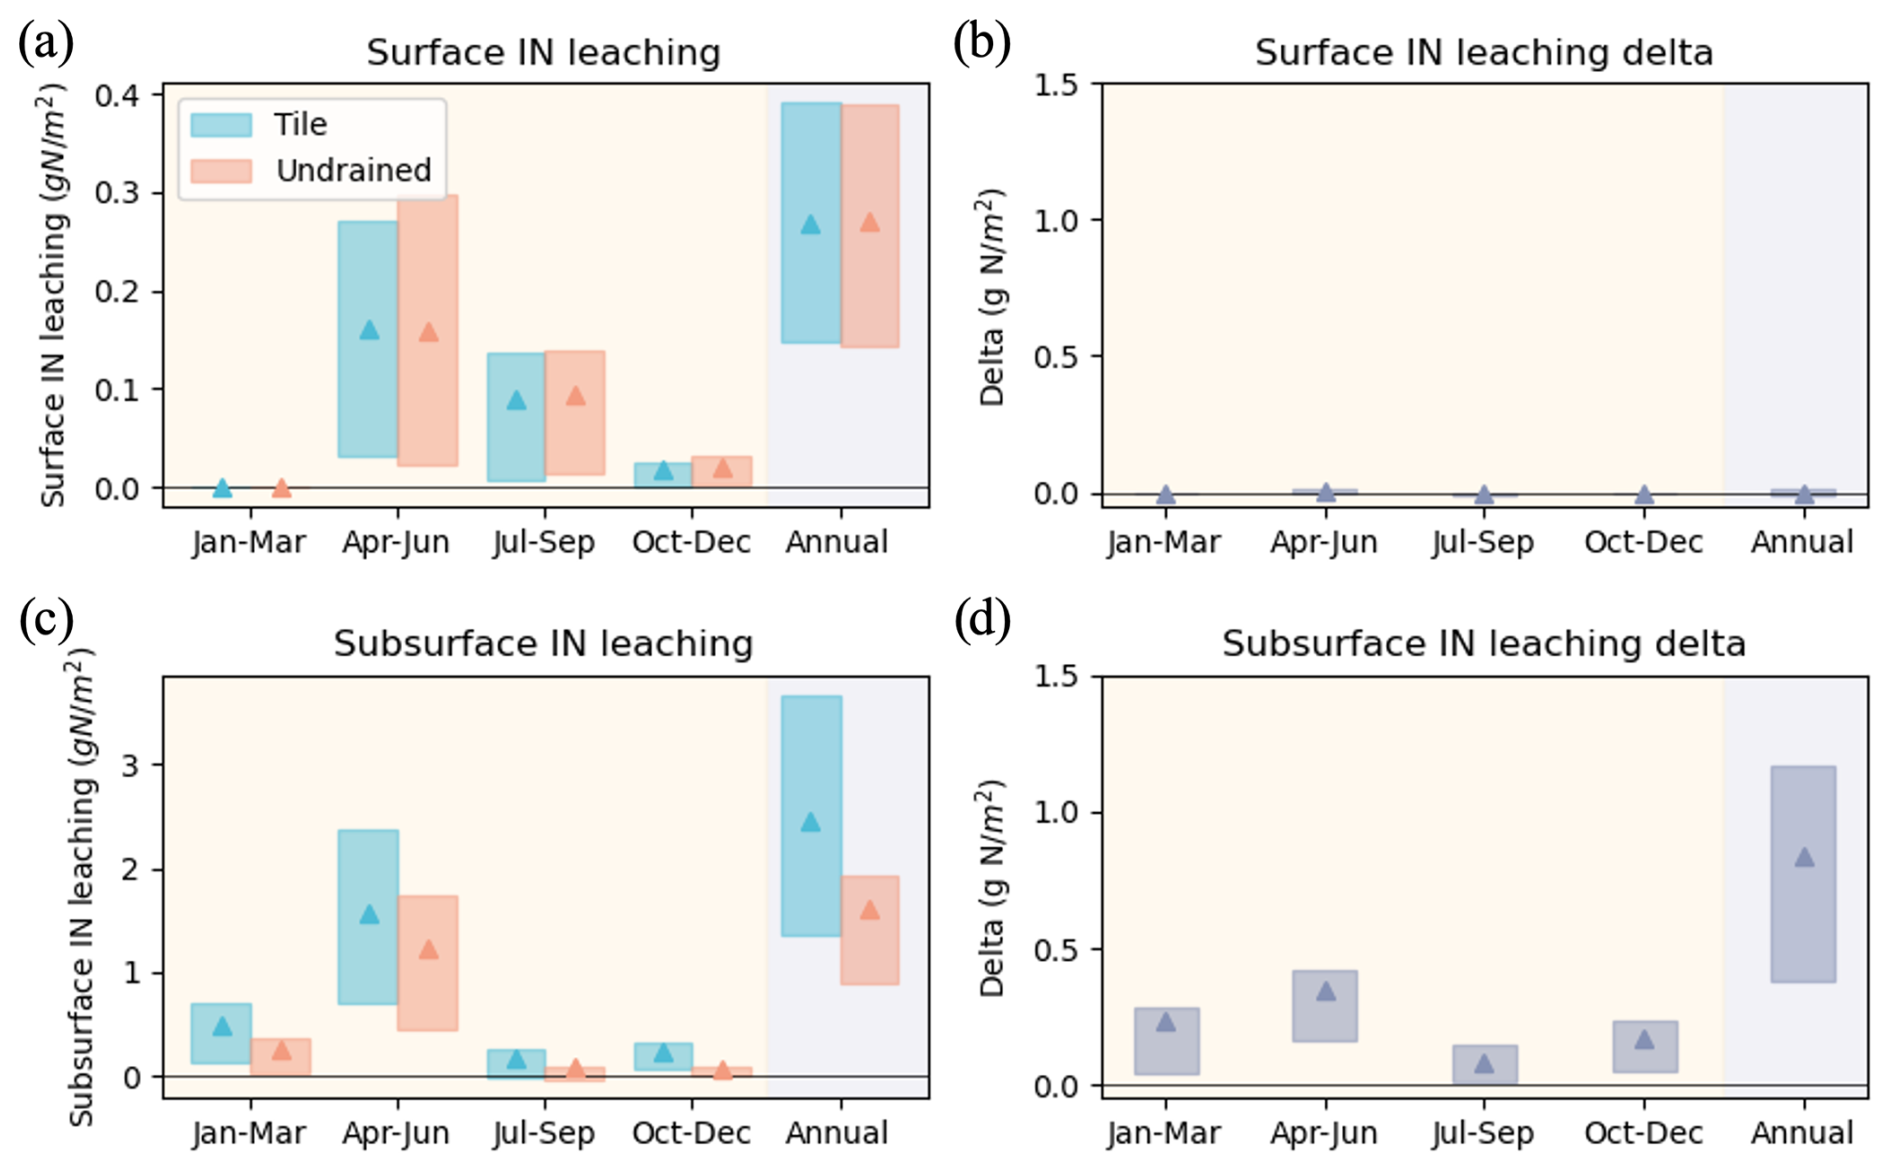
Figure 9Ecosys-simulated inorganic nitrogen (IN) lost under the tile and undrained conditions from 2007 to 2017. (a) Boxplot of the quarterly and annual subsurface IN discharge; (b) boxplot of the difference of the quarterly and annual subsurface IN loss between the tile and undrained conditions; (c) boxplot of the quarterly and annual surface IN loss; and (d) boxplot of difference of the quarterly and annual surface IN loss between the tile and undrained conditions.
The model suggested that tile drainage increased the soil oxygen concentration (Fig. S11), further affecting the soil biogeochemistry and crop growth. Fig. 10a and b suggest that tile drainage promoted soil microbe activity and accelerated soil organic nitrogen mineralization and soil heterotrophic respiration (Brown et al., 2017; Castellano et al., 2019). Our model showed that the annual mean IN generated in mineralization–immobilization processes increased by 0.36 g Nm−2, from 9.39 to 9.75 g Nm−2, with tile drainage. The elevated oxygen concentration also promoted crop root growth and nutrient uptake, as indicated by the increase of mean annual root respiration from 182 to 193 g Cm−2 (Fig. 10c).
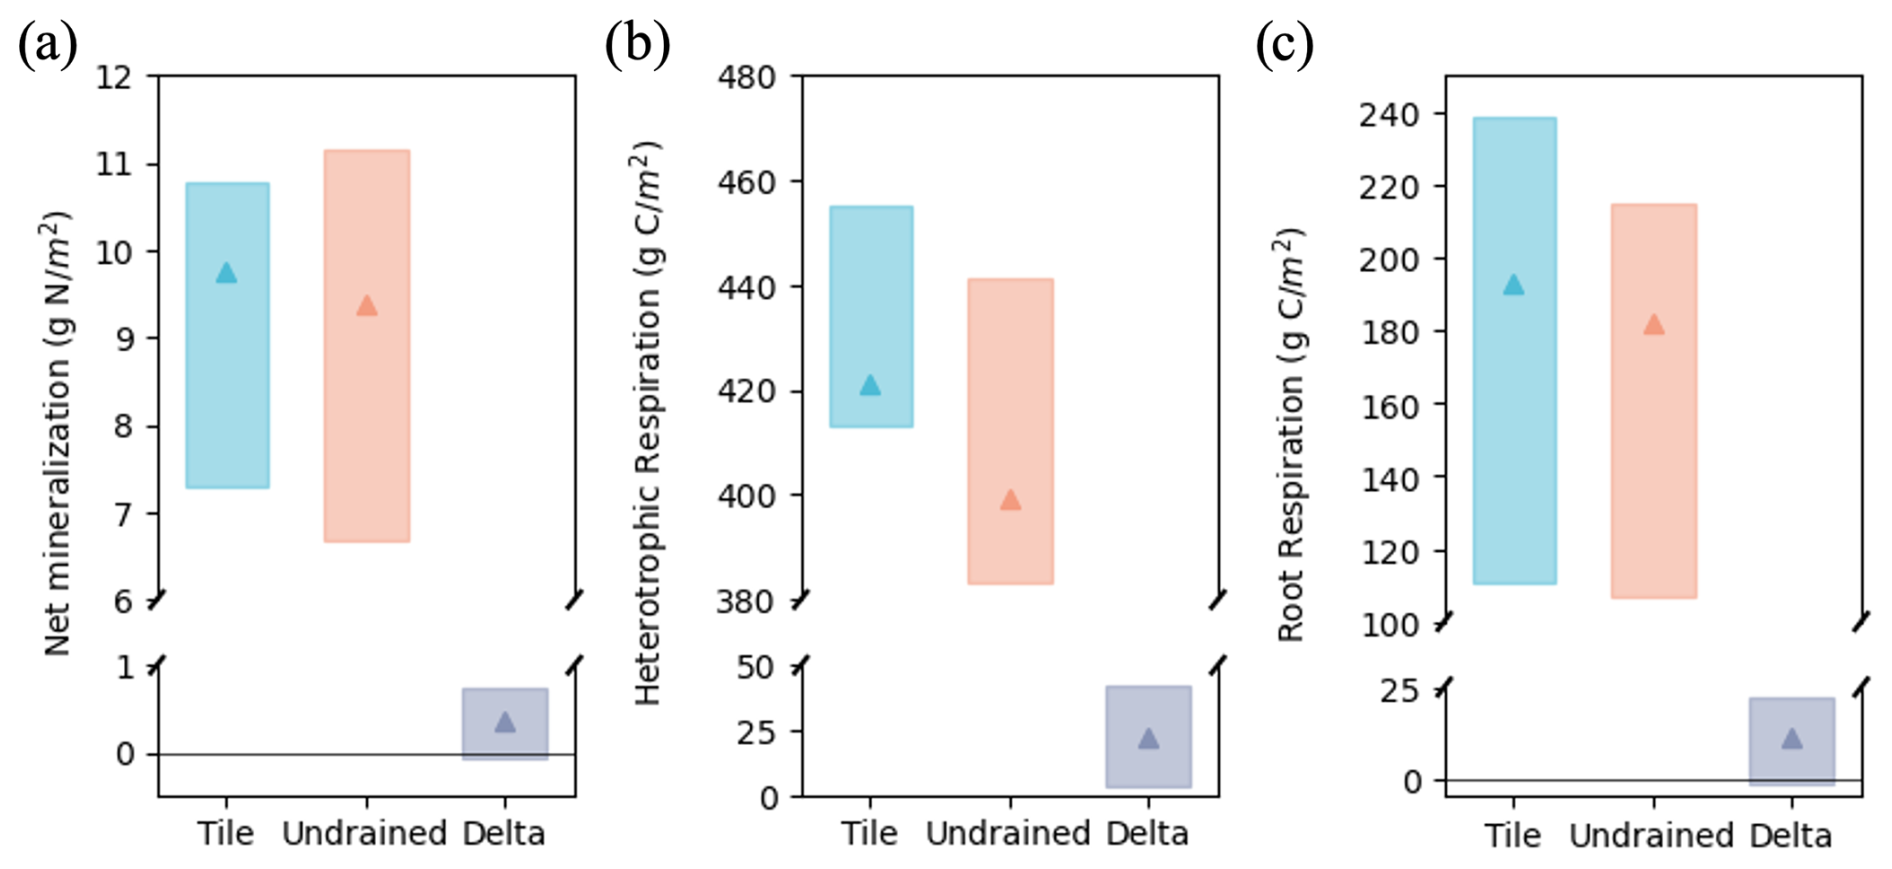
Figure 10Ecosys-simulated soil root and soil microbe activities from 2007 to 2017. Boxplot of ecosys-simulated (a) annual soil net mineralization (mineralization – immobilization) under the tile and undrained conditions and their difference; (b) annual root respiration under the tile and undrained conditions and their difference; and (c) annual heterotrophic respiration under the tile and undrained conditions and their difference. The upper and lower parts of the boxplots indicate the 25 % and 75 % quantile, and the boxes indicate the interquartile variation. The triangles indicate the mean values. Delta is the difference between the tile and undrained conditions.
To understand the role of tile drainage on crop growth under excessive precipitation, we specifically looked into a typical wet year, 2009. This year was characterized by high annual precipitation, and June in particular received 197 mm of rain, surpassing the multi-year average of 158 mm. Both the simulation and the observation showed that the tile drainage helped to increase the soybean yield during 2009 (Fig. S11). The profile of the soil water content (SWC), O2, and root density in the soil column on 30 June are presented in Fig. 11. Under the undrained conditions, the soil profile was nearly saturated below a 0.4 m depth. In contrast, the tile-drained profile was not saturated until below 1.1 m, which demonstrated that the tile drainage effectively mitigated excess water accumulation in the soil. Consequently, the soil oxygen concentration was higher under the tile condition (Fig. 11b), which provided aerated conditions for crop root growth. This improved the oxygen availability, contributing to denser and deeper root development (Fig. 11c). Fig. 11e shows the time series of the O2 stress indicator, defined in Sect. 2.1.3, which showed that the tile drainage helped to reduce the O2 stress. We observed that the tile promoted crop transpiration, especially during the early growth season (Fig. 11f and g). Similar impacts of tile drainage on the crop yield and soil conditions were observed for corn during another wet year, 2010 (Fig. S14).
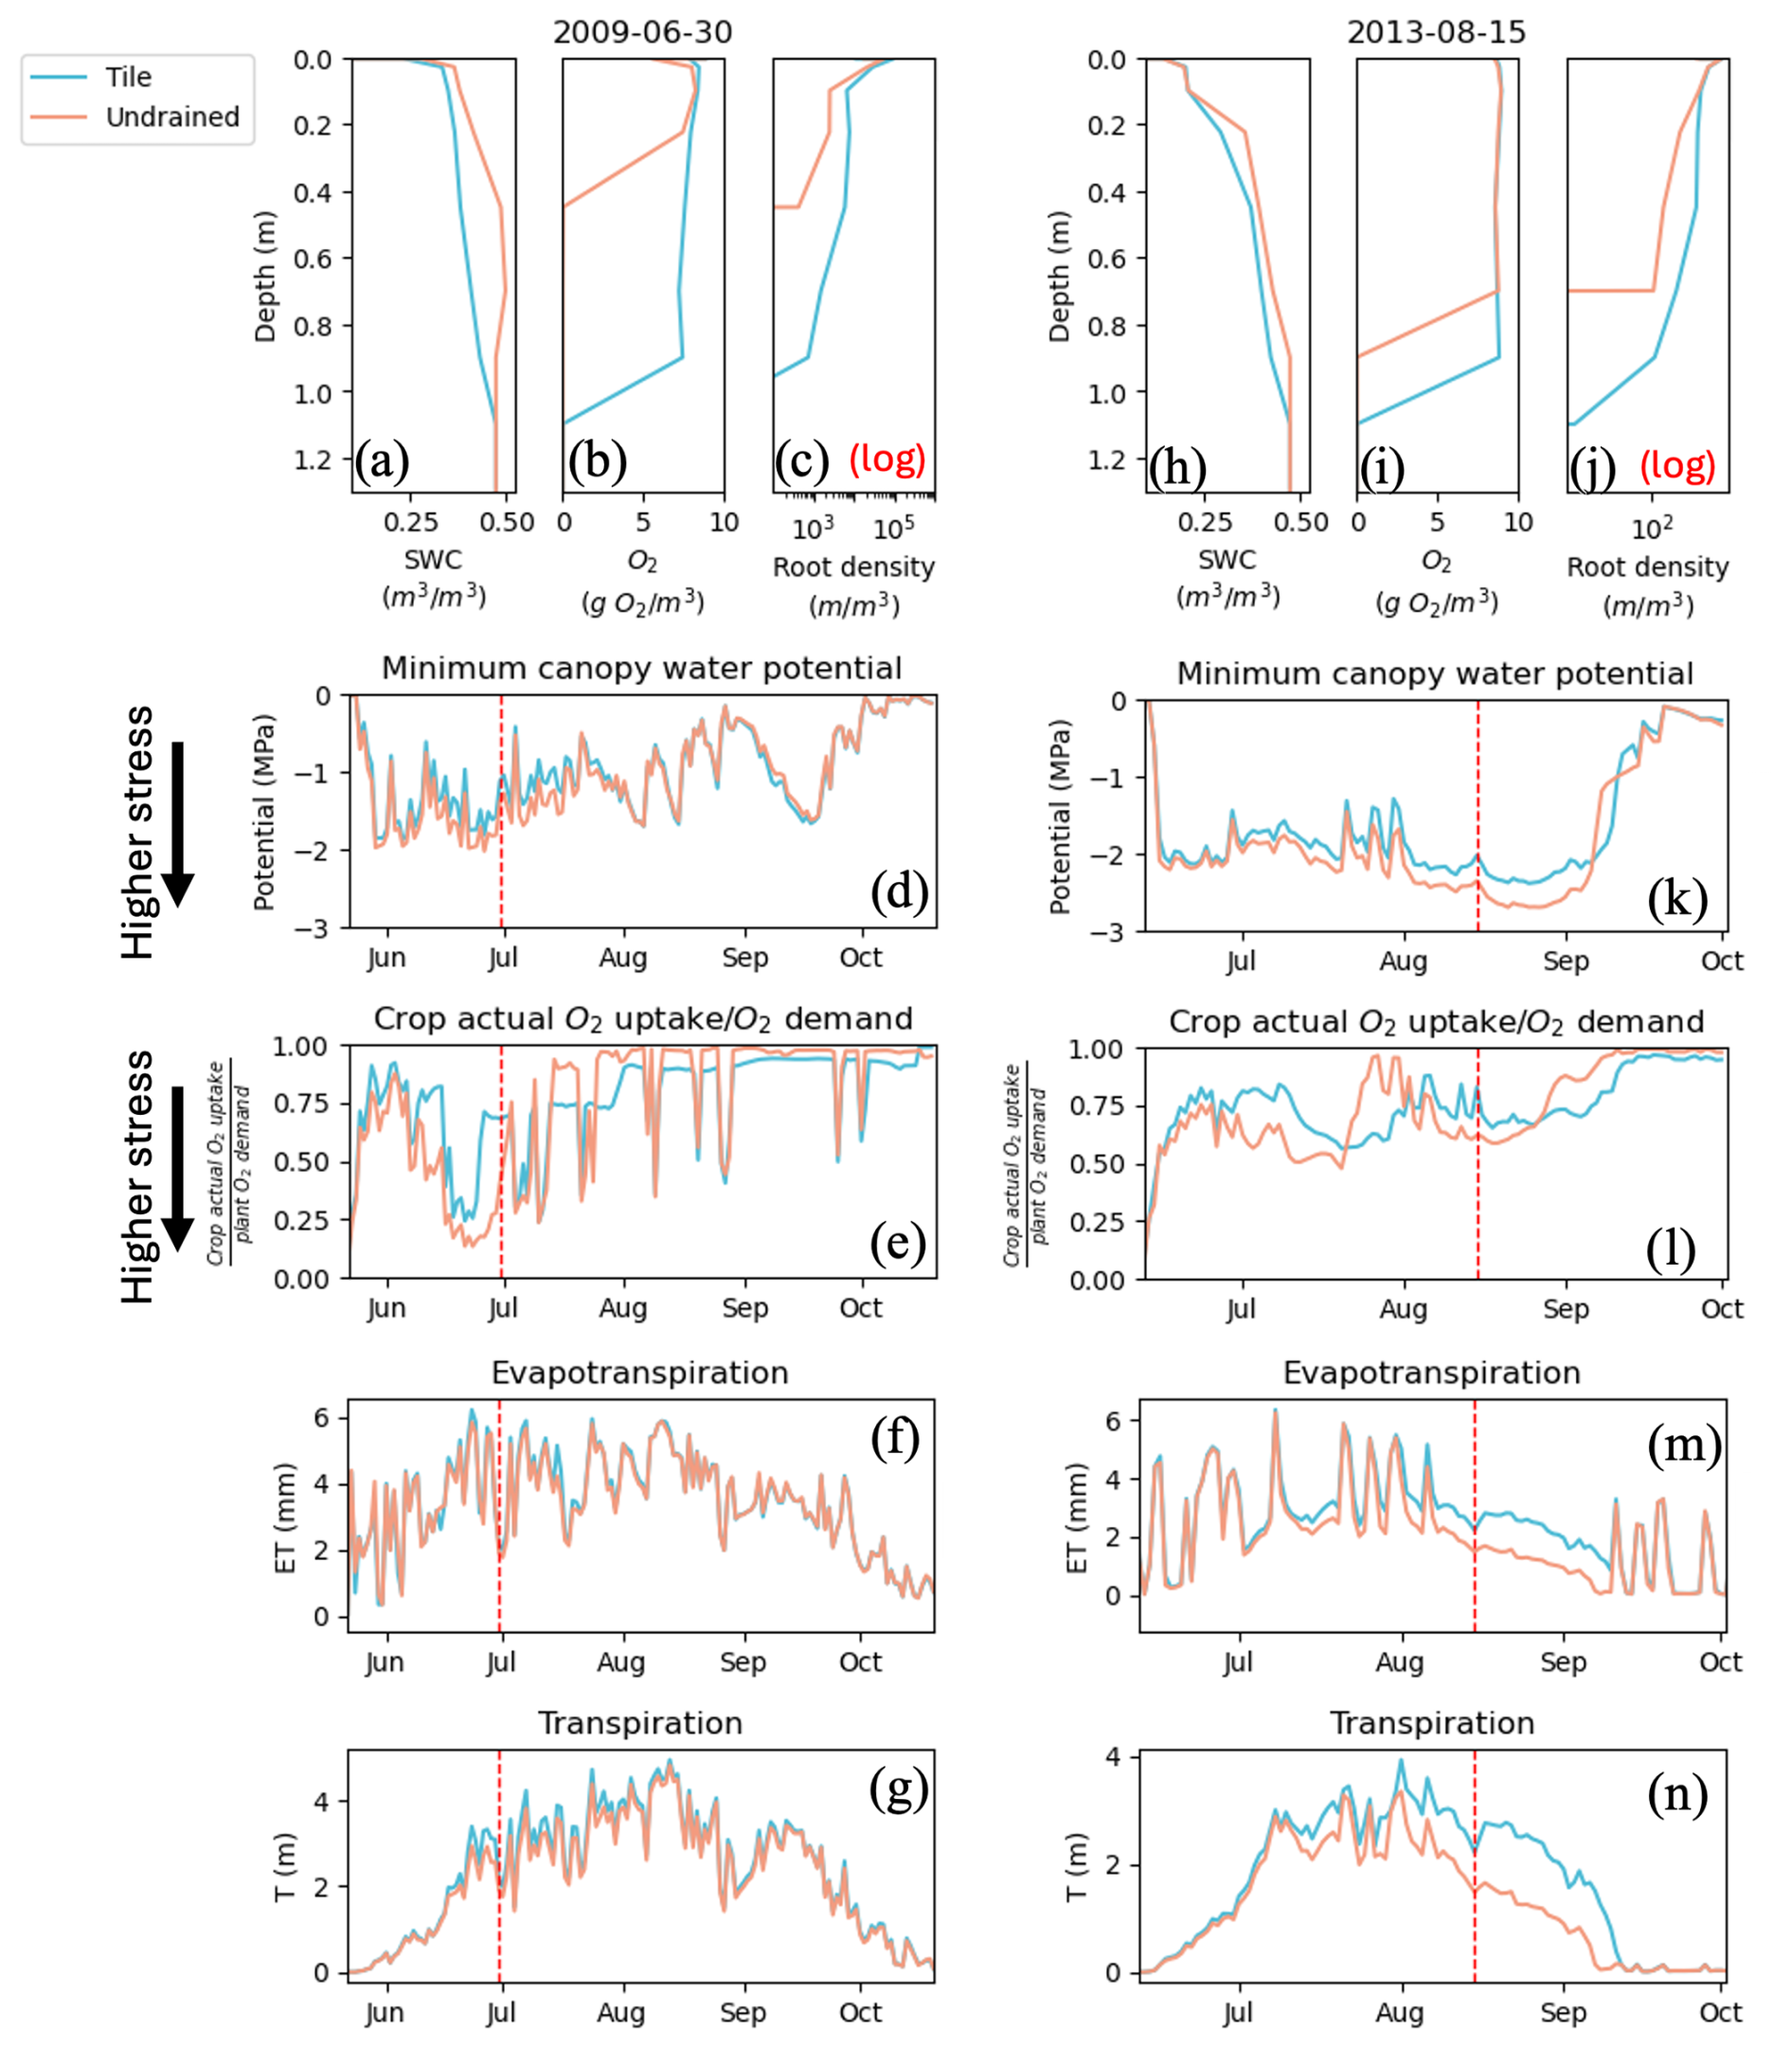
Figure 11Ecosys-simulated soil profile and time series of water stress, oxygen stress, and ET in typical wet and dry soybean years. The profile of (a) soil water content, (b) soil O2 concentration, and (c) root density profiles in the soil column on 30 June 2009. Time series of (d) minimum canopy water potential, (e) crop actual O2 uptake rate/O2 demand (potential O2 uptake rate under a non-limiting O2 condition), (f) ET, (g) crop transpiration in the 2009 growing season (a typical wet year for soybeans). The profile of (h) soil water content, (i) soil O2 concentration, and (j) root density profiles in the soil column on 15 August 2013. Time series of (k) minimum canopy water potential, (l) crop actual O2 uptake rate/O2 demand (potential O2 uptake rate under non-limiting O2 condition), (m) ET, (n) crop transpiration in the 2013 growing season (a typical year with a wet spring and dry summer for soybean). The vertical red lines indicate the days to get soil profiles. The x axis of (c) and (j) is in log-scale; see Fig. S29 for the plots showing root density in the linear scale.
The results also showed the potential of tile drainage to enhance crop resilience to drought in summer with a wet spring. The annual precipitation in 2013 was 874 mm, slightly below the annual mean value of 881 mm. In 2013, a severe summer drought occurred, with 71 mm of precipitation recorded during the summer months (Fig. S8), and the drought led to a yield drop (Fig. S13). The precipitation in May reached 230.61 mm, which saturated the soil in the early stage of crop growth. Both the observation and model showed an increase in the soybean yield under the tile drainage condition, although our model underestimated the yield (Fig. 5 and Sect. S9). Our results suggested that the tile drainage reduced the soil water content while increasing the soil oxygen concentration and promoting root growth (Fig. 11h–j). Fig. 11k shows that the tile drainage increased the minimum canopy water potential modeled in the summer, indicating that soybeans suffered less water stress under the tile conditions. Our model also suggested that the crop transpired more water during the summer drought under the tile condition, even with less soil water content (Fig. 11h–n), which evidenced that the more developed root system helped crops access the soil water in deeper soil (Fan et al., 2017; Schenk and Jackson, 2005; Steudle, 2001).
3.4 The impact of tile drainage on crop growth under different precipitation amounts
The validated model was then used to assess the impact of tile drainage under various precipitation amounts in hypothetical numerical experiments. Our simulation revealed that the mean crop yield over the assessment period decreased for both corn and soybeans, as precipitation levels increased. The yield reductions with the increase of precipitation were more pronounced under the undrained conditions, and the yield difference between the tile and the undrained conditions became increasingly substantial with rising precipitation levels (Fig. 12). Those findings indicated that tile drainage provided a yield benefit, and this benefit became even more pronounced in conditions of higher precipitation in the sites that already had relatively abundant precipitation. Tile drainage increased the resilience of crops to precipitation increase, indicated by higher crop yield variation with the change of precipitation (Fig. S18).
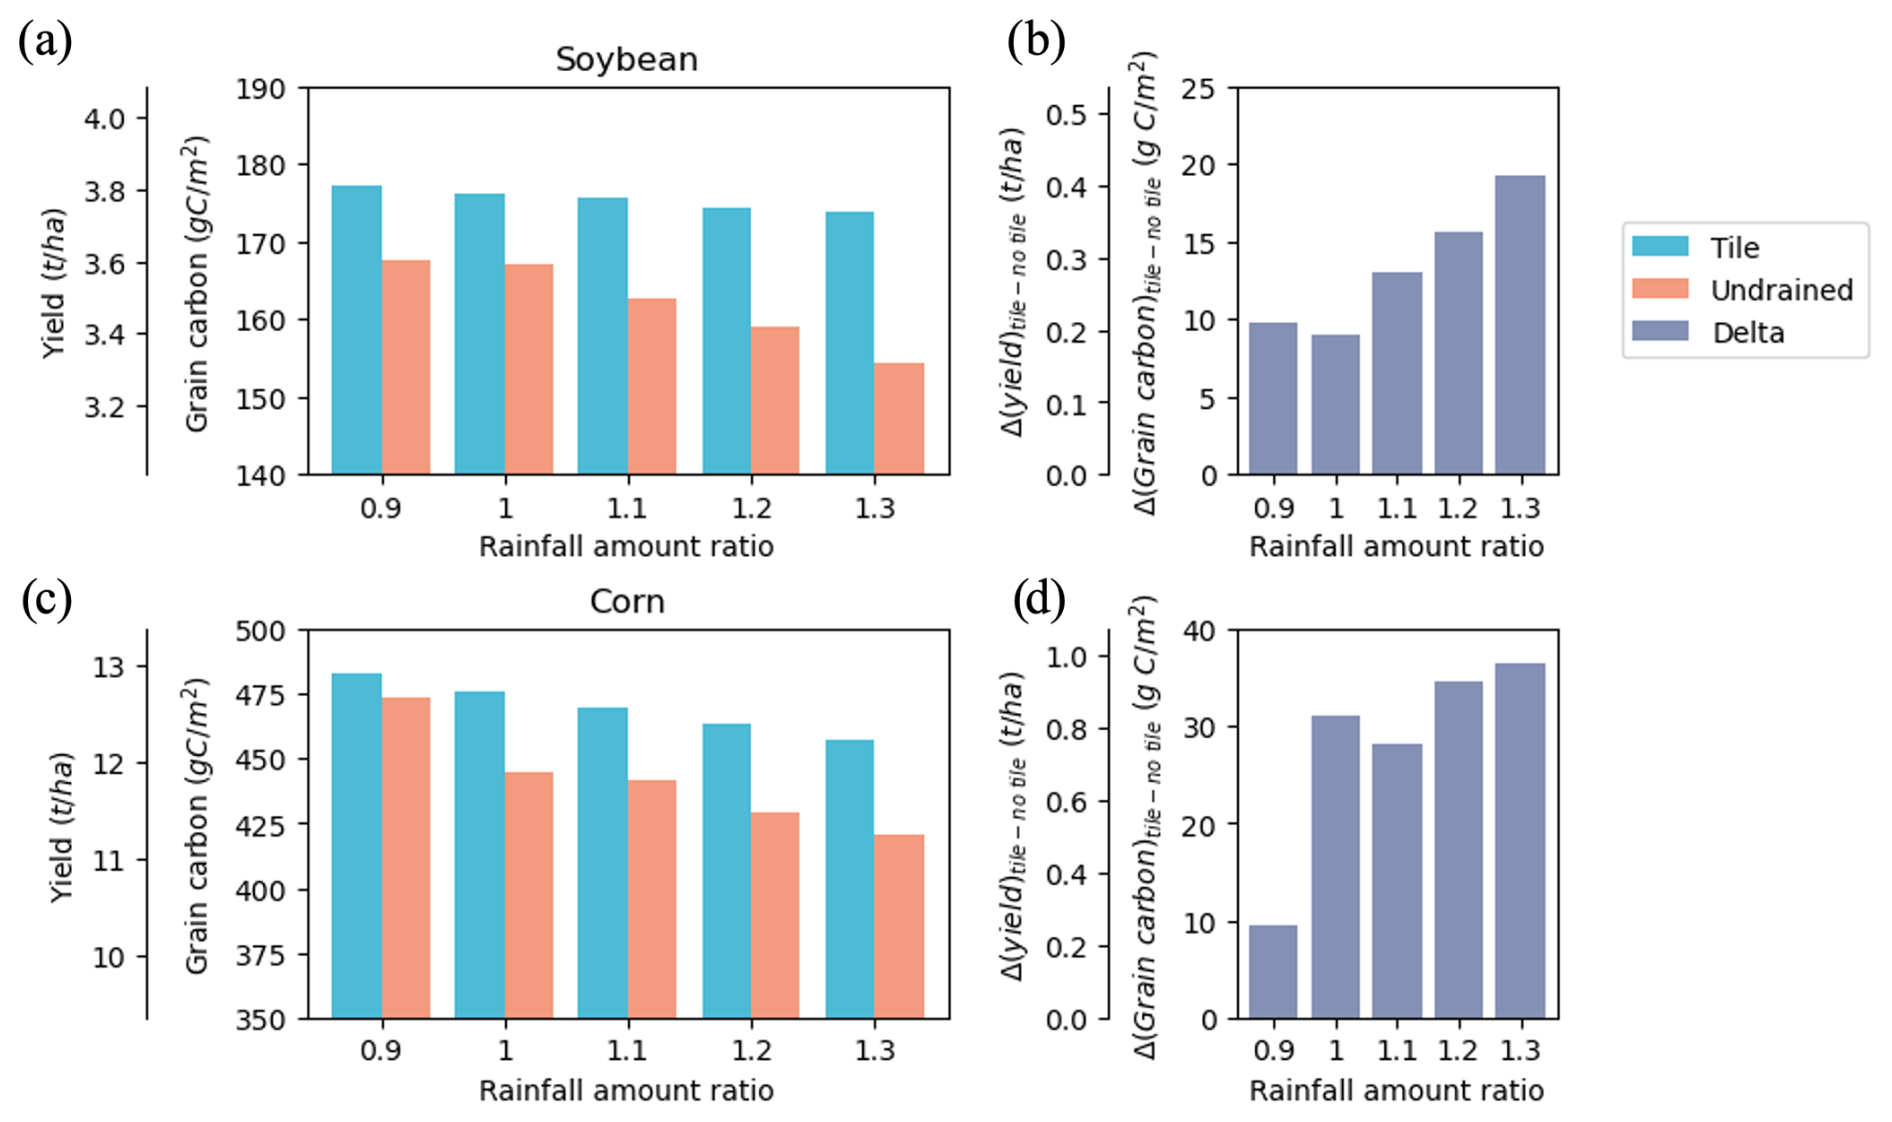
Figure 12Ecosys-simulated crop yield in the hypothetical numerical experiment under different precipitations. (a) Multi-year mean soybean yield under the tile and undrained conditions. (b) The soybean yield benefit (yield/grain carbon difference between the tile and undrained conditions). (c) Multi-year mean corn yield under the tile and undrained conditions. (d) The corn yield benefit (yield/grain carbon difference between the tile and undrained conditions). The x axis, rainfall amount ratio, is the scale factor in the hypothetical numerical experiment. For example, 1.3 represents that the precipitation amount at each time step is 1.3 times of the original precipitation.
To examine the impacts of increased precipitation and tile drainage on crop growth, we examined the responses of biogeochemistry and crop growth to varying precipitation levels under the tile and undrained conditions in a typical wet year for soybeans (2009). Fig. 13a shows that the mean soil O2 content in the top 1 m soil during June decreased with rising precipitation, under both the tile and undrained conditions ( and −0.977 for the tile and undrained conditions, respectively). Higher oxygen concentration further led to lower crop oxygen stress, indicated by elevated values of the O2 stress indicator under conditions of high soil O2 (Fig. 13b; r=0.931 and 0.995 for the tile and undrained conditions, respectively). Crops suffering from less oxygen stress tended to develop denser root systems (Fig. 13c; r=0.982 and 0.984 for the tile and undrained conditions, respectively). Our results revealed that the grain carbon reduced as precipitation increased (Fig. 13d). Furthermore, the soil O2 concentration, crop O2 stress indicator, root density, and grain carbon under the tile conditions were consistently higher compared with those under the undrained condition (Fig. 13), which indicates that tile drainage would benefit crop growth by elevating the soil O2 content and then reducing the crop oxygen stress. Besides, the steeper slopes in Fig. 13 under the undrained conditions suggested that the crop system without tile drainage exhibited higher sensitivity to changes in precipitation. This implies that tile drainage could bolster the system's resilience to precipitation variability, and the benefits of tile drainage become more pronounced with more precipitation. Similar results were also shown in the typical wet year for corn (Fig. S19).
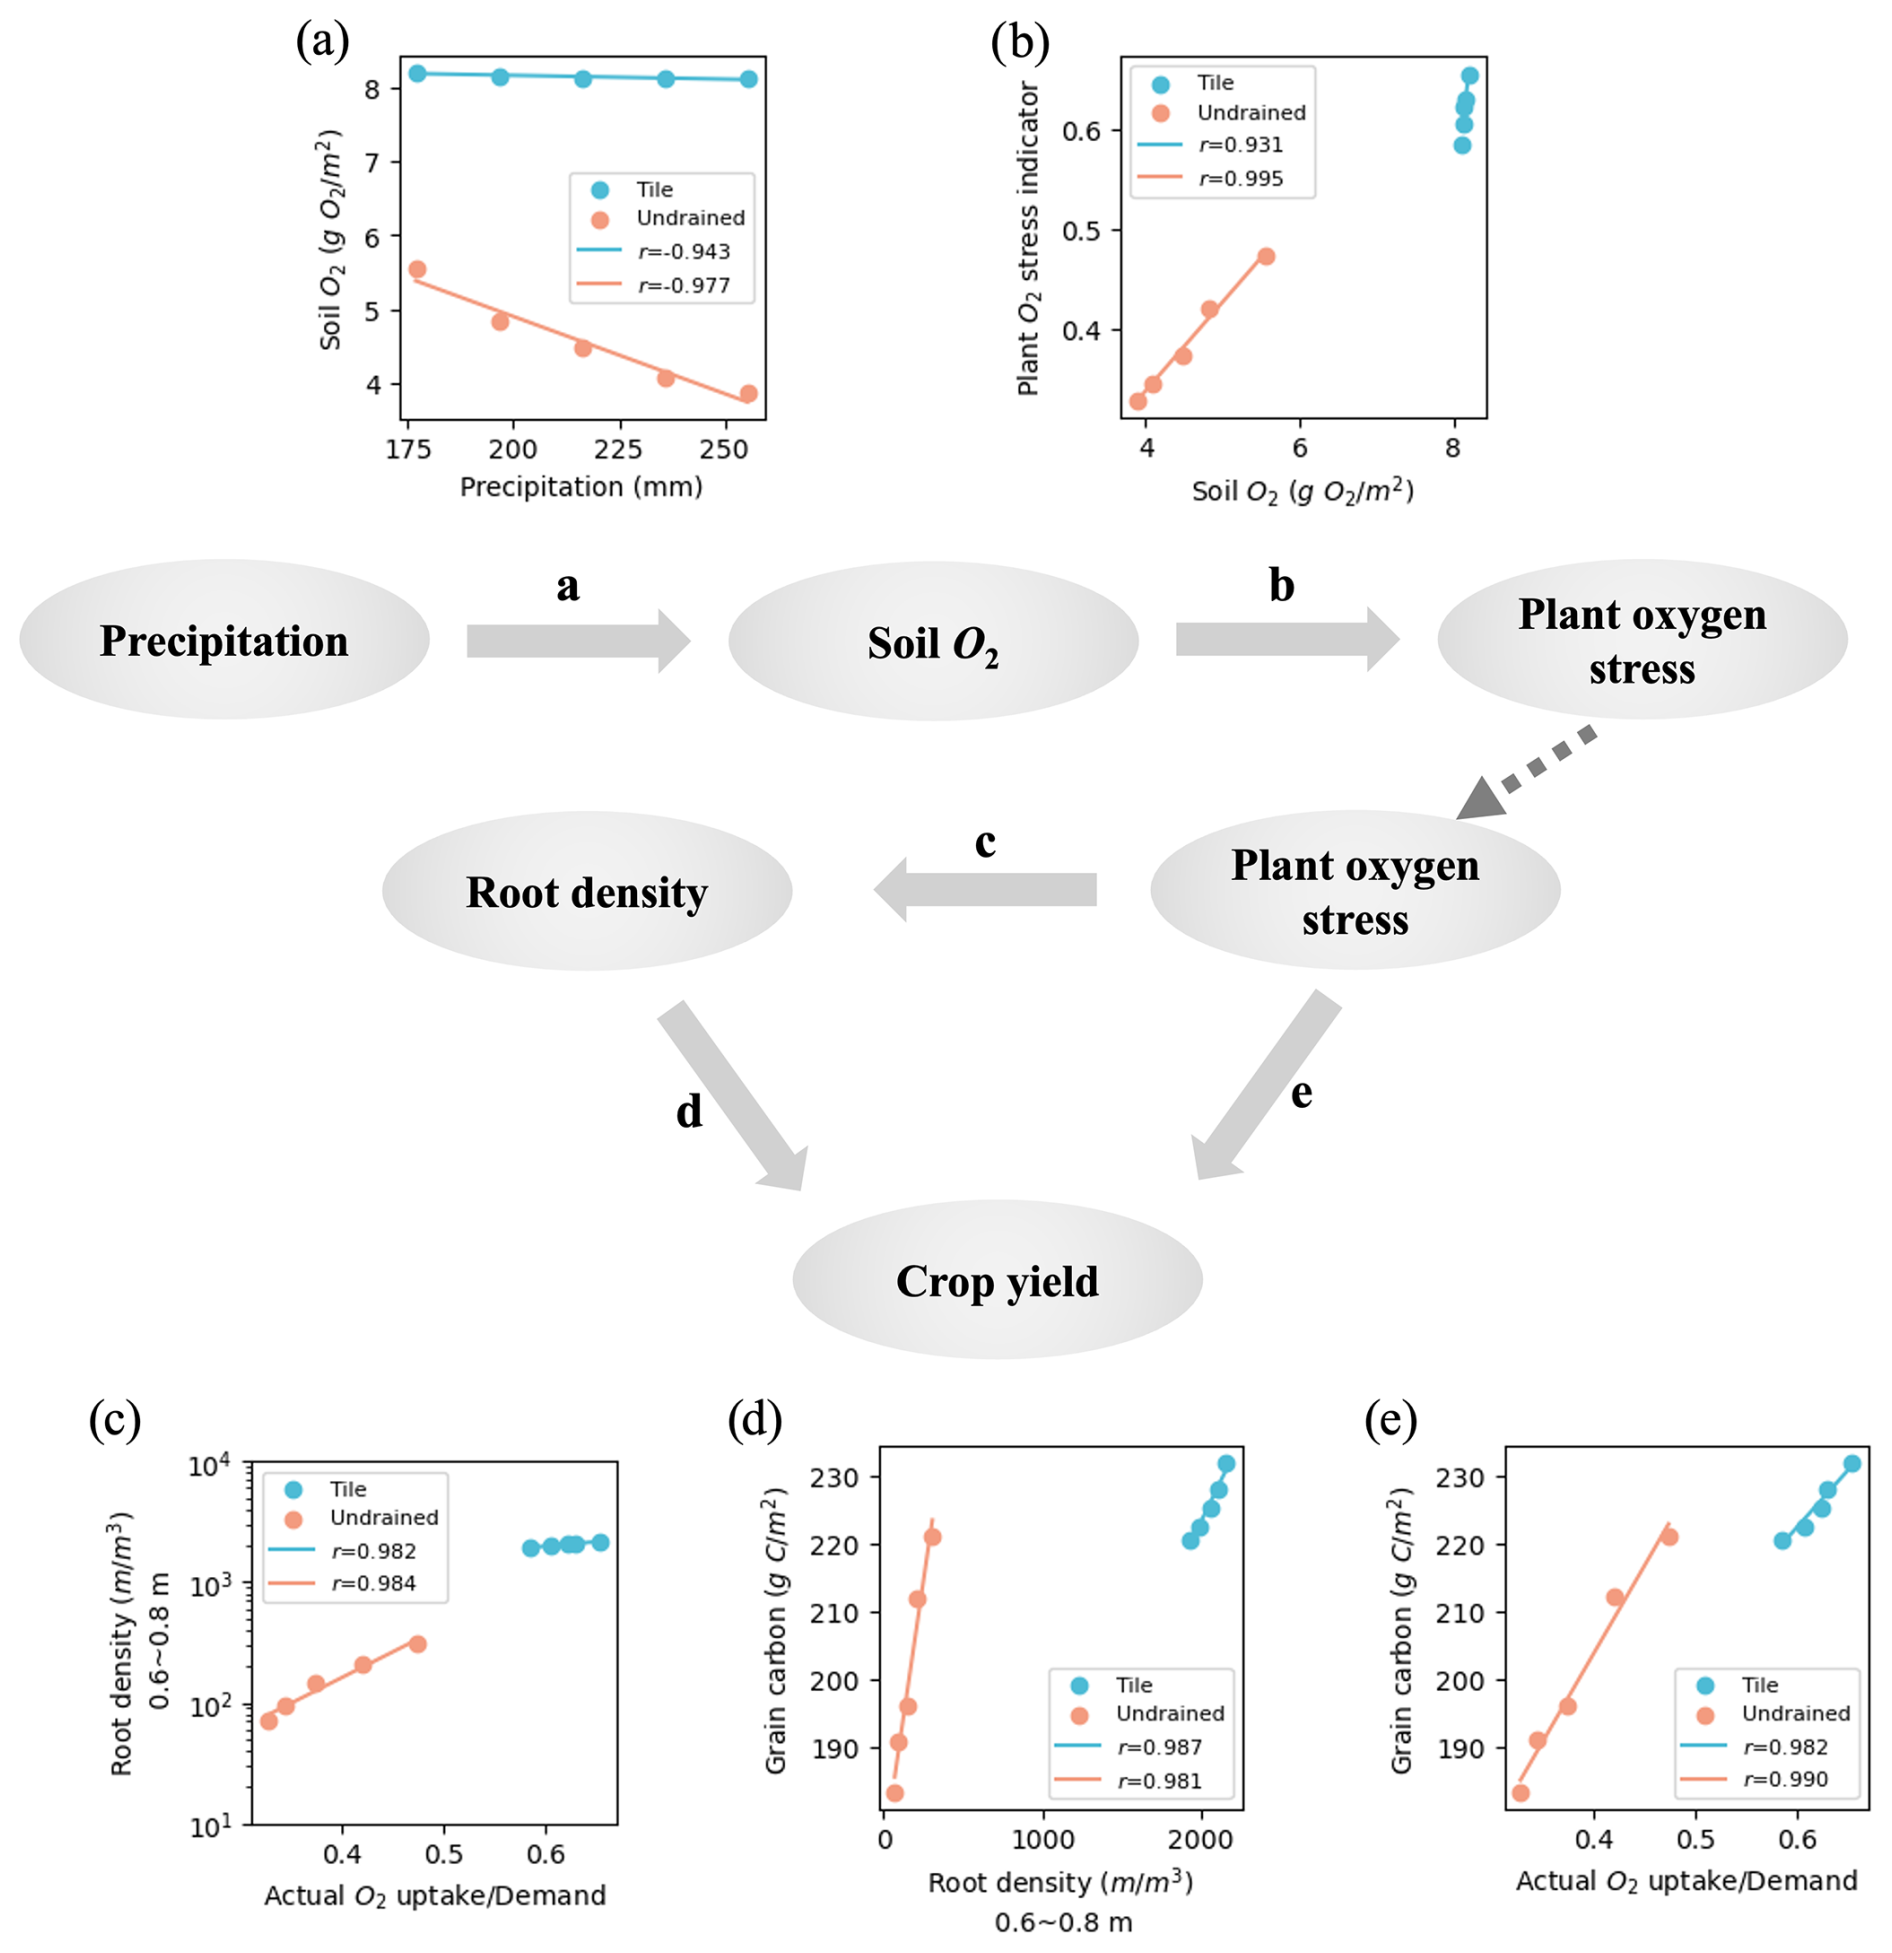
Figure 13Ecosys-simulated responses of the biogeochemistry and crop growth to the precipitation amounts in a typical wet year for soybeans (2009) under the tile and undrained conditions. The relationships between (a) soil O2 concentration in the top 1 m soil column and precipitation in June; (b) crop O2 stress indicator and soil O2 concentration in the top 1 m soil column in June; (c) root density (0.6–0.8 m soil layer) and crop actual O2 uptake rate/potential O2 uptake rate under a non-limiting O2 condition in June; (d) grain carbon and root density (0.6–0.8 m soil layer) in June; and (e) grain carbon and crop O2 stress indicator in June.
4.1 On the necessary processes to simulate the tile drainage impacts and the effectiveness of the ecosys model
A central challenge in quantifying the full impact of tile drainage is capturing the complex interactions between hydrology, soil biogeochemistry, and crop growth. In this study, we utilized the ecosys model for its first-principles approach to simulating the coupled feedbacks between the soil water, aeration, biogeochemistry, and crop growth (Grant, 2001), which offers a unique lens to investigate the underlying causal mechanisms that drive the agroecosystem response to drainage. To evaluate the benefits of improved soil aeration, this study relies on the model's mechanistic simulation of the complete soil oxygen cycle, including its transport, phase changes, and biological consumption (Sect. 2.1.2). This provides a direct biophysical connection between a lowered water table and the oxygen available for root function. In ecosys, oxygen stress is an emergent property of the balance between supply and biological demand, while many crop models either ignore this stress or approximate it by applying empirical functions tied to soil water status (Ebrahimi-Mollabashi et al., 2019; Feddes et al., 1978, 2001; Šimůnek and Hopmans, 2009; Vrettas and Fung, 2017). The crop's response to drainage also emerges from a series of simulated feedbacks in the model. For instance, soil oxygen availability regulates root respiration, which provides the energy for root maintenance and growth, and root nutrient uptake (Sect. 2.1.3). Then, the impact on the root system further cascades to the whole crop through processes, such as the coupled plant hydraulics and photosynthesis model over the soil–crop–atmosphere continuum, nitrogen remobilization in the crop root, shoot, and leaf, etc. (Sect. 2.1.1). The effectiveness of this approach is demonstrated in our results, which show how improved soil oxygen under tile drainage alleviates crop oxygen stress, particularly during wet springs, leading to denser root systems (Figs. 11 and 13). By mechanistically linking the hydrological modification to these detailed physiological responses, this modeling approach allows us to dissect the causal chains driving crop yield benefits, providing a more transferable and systematic process-level understanding (Warren et al., 2015).
The application of the model, despite recent advances in modeling capability and process realism, is limited by the availability of observation data. Ecosys relies on hourly weather input to drive the water and energy cycles. However, accurate hourly weather data are not always available. Here we downscaled the daily in-situ precipitation data to provide hourly inputs by assuming even precipitation within two hours in a day. However, precipitation intensity is a key factor that determines the runoff generation mechanisms (i.e., infiltration-excess runoff and saturation-excess runoff) (Horton, 1933; Nanda and Safeeq, 2023; Tromp-van Meerveld and McDonnell, 2006). Our results under different precipitation amounts also show that the proportion of water leaving the system through surface runoff increases with the increase of precipitation amount/intensity (Fig. S20). The simple downscaling method (Sect. 2.2.2) inadvertently reduces the occurrence of intense precipitation events while increasing the frequency of smaller, milder precipitation events, which might underestimate the surface runoff and overestimate the subsurface discharge. Further, to fully leverage the capability of the ecosys and improve its accuracy, a wealth of observational data are necessary for both model calibration and validation. For instance, we did not find work that directly contrasts the root system and soil oxygen status in the tile and undrained conditions, potentially due to the difficulty in measuring the quantities. We suggest that future field and greenhouse experiments prioritize the systematic collections of data on various variables such as water fluxes, solute nutrient fluxes, greenhouse gas emissions, root development, above-ground crop biomass, and more. These datasets would serve a dual purpose: facilitating model validation and performance assessment while deepening our understanding of the underlying physical processes. This improved understanding can then be leveraged to refine model mechanisms and parameterization (Liu et al., 2020; Nóia Júnior et al., 2023; Warren et al., 2015). Expanding the availability of such data would be invaluable in advancing our modeling efforts and increasing their applicability to real-world scenarios. In this case, observation, experiments, and measurement are integrated together, which aligns with the DOE well-proposed model–data experimentation (ModEx) framework (Hoffman et al., 2017).
4.2 The impact of tile drainage on hydrology
Our results demonstrate that tile drainage has a pronounced impact on field hydrological cycles, influencing both water storage and water fluxes (Fig. 14). Overall, tile drainage functions as an efficient conduit for expediting subsurface water drainage (Gramlich et al., 2018; Miller and Lyon, 2021; Pluer et al., 2020; Schilling et al., 2012), directly contributing to an increase in the subsurface discharge (Fig. 7). Concurrently, tile drainage leads to a reduction in the soil water content (Fig. S11). Besides, we found that precipitation alone cannot sustain both the tile flow and field ET, and recharge from an external source is required to close the system water balance at the study site (Fig. S21). Our model indicates that tile drainage increases the subsurface recharge (Fig. 7), and tile drainage has a limited impact on the surface runoff at our study sites (Fig. 7). Though the model predicted less soil water content under the tile conditions, the topsoil layer might be more affected by the soil atmospheric interaction and the soil water content there is similar (Fig. S13). The infiltration rate is largely affected by the soil water content in the top soil layer, which might account for the similar surface runoff in the tile and undrained conditions. Our simplified 1D column representation of the field limits the surface water holding capacity, which might in turn diminish the perceived role of tile drainage in managing the surface water. We also acknowledge that we currently do not consider the macropores that directly connect the tile drainage with the surface soil, which might underestimate the effects of tile drainage on the surface runoff (Askar et al., 2020; Williams et al., 2023). We found that tile drainage does not significantly change the annual ET at the study site, similar to some previous studies (Khand et al., 2017; Yang et al., 2017).
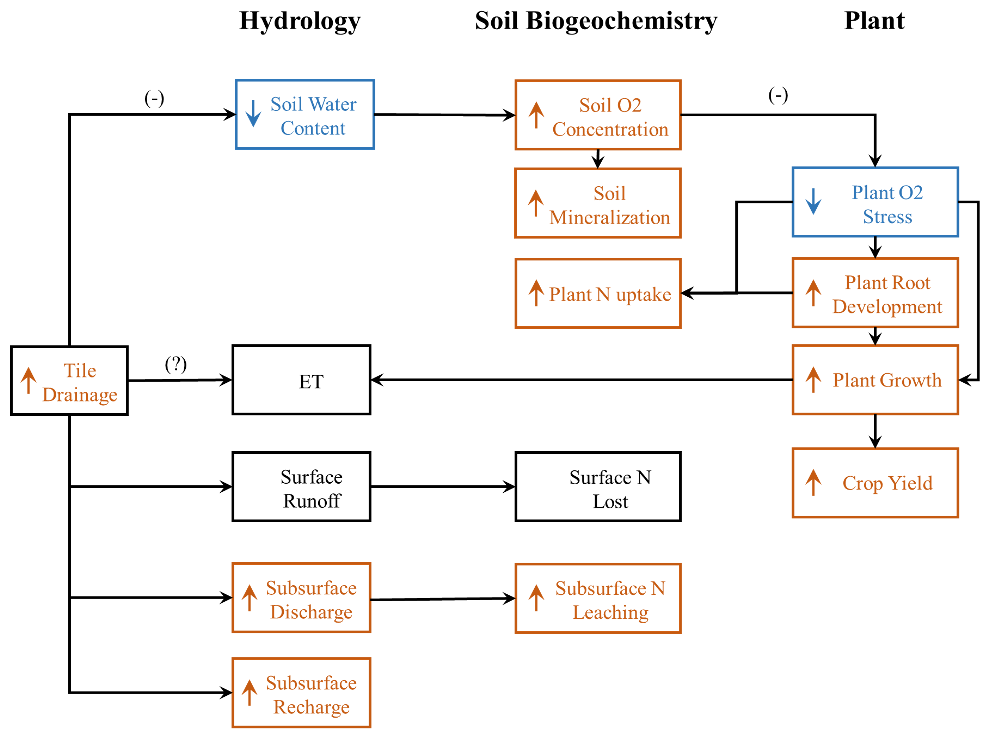
Figure 14Schematic of the impact of tile drainage on the hydrology, soil biogeochemistry, and crops in the US Midwest agroecosystems with sufficient precipitation in the spring.
The impact of tile drainage on the hydrological cycle exhibits a seasonality, coinciding with the seasonality of climate and crop phenology. Tile drainage actively functions from May to June, corresponding to high precipitation in this period, and tile drainage significantly increases the subsurface discharge (Figs. 6 and 8). In the summer, crops actively draw water from the soil, which reduces the soil water content. High ET, coupled with reduced soil water storage under the tile conditions, results in an increase in the subsurface recharge (Fig. 8). Tile drainage slightly increases the ET during the peak growing seasons, which is balanced by the decrease in the early growing season. In the early growing season, the soil evaporation might be reduced due to the reduction of soil water content under the tile conditions (Yang et al., 2017). In the summer, crop transpiration dominates the total ET (Paul-Limoges et al., 2022; Song et al., 2018), and higher crop productivity under the tile conditions (Fig. 11) would increase the ET in the peak growing season (Beer et al., 2009; Guerrieri et al., 2016; Yang et al., 2017). The hydrological and crop phenological seasonality has informed the design of the controlled drainage and subirrigation system. Specifically, excessive water was removed in wet springs, and retained in dry summers and the non-growing season in controlled drainage (Helmers et al., 2022). With an irrigation system, the removed water can be cycled and irrigate the field crop in summers with less precipitation (Singh et al., 2022).
4.3 The impact of tile drainage on biogeochemistry
The impacts of tile drainage on hydrology further lead to downstream ramifications for the soil biogeochemistry (Fig. 14). Tile drainage has long been recognized as a major contributor to nitrate exporting from agricultural landscapes (David et al., 1997, 2010). The results here similarly suggest that tile drainage increases the subsurface IN loss by 28.5 %, accompanied by a 29.6 % increase of the subsurface discharge in water partitioning at the study site (Figs. 7 and 9). Furthermore, the impact of tile drainage on nitrogen loss exhibits a seasonal variation, mirroring the seasonality in water partitioning, with a more pronounced increase in the early growing season, corresponding to high tile flow (Figs. 6 and 9) (Ma et al., 2023; Williams et al., 2015). The reduction of the soil water content under the tile conditions also leads to an increase in the soil oxygen concentration, which subsequently promotes soil microbe activities (Linn and Doran, 1984), indicated by higher heterotrophic respiration (Fig. 10b). The elevated soil oxygen content also hastens both mineralization and immobilization (Castellano et al., 2019; Randall and Mulla, 2001), ultimately increasing the net mineralization (Fig. 10a). The increased net mineralization compensates for the decreased soil IN through subsurface loss.
4.4 The impact of tile drainage on crop growth
The impacts of tile drainage through hydrology and biogeochemistry on crop growth and yield are intricate and multifaceted. Tile drainage reduces the soil water content, which may limit crop water availability while reducing crop oxygen stress (Fig. 11). The increased IN loss by tile drainage reduces the soil IN content, while the increased net mineralization, contradictorily, increases the soil IN content (Figs. 9 and 10). They, together, might also alter the temporal variation of the soil IN content (Castellano et al., 2019; Drinkwater and Snapp, 2007). Crops and soil microbe communities can also adapt to environmental changes (Fan et al., 2017; Waldrop and Firestone, 2006). As a result, the intricate interplay between tile drainage, hydrology, biogeochemistry, and crop responses can collectively exert a significant influence on crop growth. Also, the intricate interactions are likely to change with environmental variations and make it challenging to gain a full understanding of their impacts on crop growth.
Here we use the root system as a proxy to understand the impact of the tile drainage on crop growth, as crop roots are the key mediator between soil hydrological and biogeochemical changes and crop growth (Hodge, 2004; Hodge et al., 2009; Jochen Schenk, 2005; Wang et al., 2021). In wet springs, tile drainage alleviates crop oxygen stress by reducing the soil water content and elevating the soil oxygen concentration (Figs. 11 and 13), which guarantees the early growth of both the root system and the above-ground part of the crop under excessive precipitation. Deeper and denser root systems are observed under the tile drainage conditions (Fig. 11), which further benefits the crop water and nutrient uptake (Ebrahimi-Mollabashi et al., 2019). Further, we observed that the developed root system also helped to reduce water stress in the dry summer, potentially due to accessibility to water in the deep soil with a developed root system (Fig. 11f–j). The lower oxygen stress and developed root system together benefit crop growth (Fig. 14). The findings are consistent with previous field and greenhouse studies showing shallower root development under waterlogged conditions and high water tables (Ebrahimi-Mollabashi et al., 2019; Follett et al., 1974; Ordóñez et al., 2018; Ren et al., 2016). This modeling study also provides valuable insights into these complex and difficult-to-observe processes and provides a reference for future field investigations.
In summary, our study reveals that tile drainage significantly enhances the production of both corn and soybeans at the study site that has abundant precipitation in the spring. Firstly, tile drainage proves beneficial for crop yield by directly mitigating crop oxygen stress during wet years (Figs. 11 and S14). Secondly, the crop with better developed roots under the tile conditions would have a better ability to absorb soil water and thus reduce crop water stress and benefit the crop yield (Fig. 11). Lastly, our hypothetical numerical experiments indicate that the yield benefit of tile drainage amplifies with increasing precipitation across various amounts (Fig. 12).
4.5 The implications of tile drainage for climate change adaptation
Our results at the study site indicate that tile drainage might be a valuable adaptation strategy to enhance agricultural production under climate change. Our results at the study site have demonstrated that tile drainage has the potential to increase crop yield under excessive precipitation conditions (Figs. 11, 12, and S14), and it might play a more critical role in sustaining high crop yields in the future, especially given the projected increase in spring precipitation and the likelihood of more intense precipitation events in the US Midwest (Seneviratne et al., 2022; Zhou et al., 2022). Furthermore, our results suggest that tile drainage enhances yield stability under different precipitation amounts (Fig. S18), which implies that tile drainage might also help mitigate the risks associated with variable weather conditions, especially the excessive precipitation conditions. Our results also reveal that tile drainage has the potential to sustain a high crop yield under a projected increase in the summer drought due to the better developed root systems under the tile drainage conditions (Fig. 11) (Zhou et al., 2022). While tile drainage benefits crop yield in a severe drought (2013), the crop still faces high water stress, resulting in a relatively low yield (Figs. 12 and S13). We advocate other approaches to sustain high crop yield with increasing summer drought risks, for instance, subirrigation systems and control drainage systems (Singh et al., 2022; Youssef et al., 2023).
However, tile drainage also poses threats to downstream water quality under climate change. Tile drainage increases the nitrogen loss to freshwater systems and, ultimately, coastal regions, degrading downstream and coastal water quality (David et al., 2010; Ma et al., 2023). Under climate change, the increased spring precipitation may flush more nitrogen through the tile drainage (Fig. S12), further burdening impaired water systems (Jiang et al., 2020; Sinha et al., 2017; Wang et al., 2015). Recent initiatives are focused on mitigating nitrate loading in tile-drained systems through within-field management practices (e.g., improved fertilizer management and cover crops) and edge-of-field practices (e.g., controlled drainage, saturated buffers, woodchip bioreactors, and subirrigation systems) (Mitchell et al., 2023; USDA NRCS, 2017, 2023). While many studies suggest promising outcomes of these conservation practices in terms of reducing nitrogen loss and enhancing other ecosystem services, debates persist on their effectiveness for controlling the nutrient loss under different environments and socioeconomic feasibility for a broad adoption (Frankenberger et al., 2023; Mitchell et al., 2023). For instance, the controlled drainage, involving a water control structure at the tile drainage system outlet, holds water in the field when drainage is unnecessary, which may help reduce the nitrogen loss and potentially provide yield benefits under dry conditions (Delbecq et al., 2012; Ghane et al., 2012; Singh and Nelson, 2021; Youssef et al., 2023). Controlled drainage could potentially enhance yield with more available water in such cases. Nevertheless, an existing study shows that controlled drainage might have negative impacts on yield during wet seasons (Youssef et al., 2023). Moreover, the efficacy of controlled drainage in reducing nitrogen loads remains highly uncertain (Mitchell et al., 2023; Ross et al., 2016; Shedekar et al., 2021). While controlled drainage directly reduces nitrogen loading by retaining water, uncertainties arise as the retained water and nitrogen may exit the system through other pathways, such as surface/subsurface runoff, adjacent tile systems, or deep percolation (Lavaire et al., 2017; Ross et al., 2016; Shedekar et al., 2021). Furthermore, higher financial costs for the control structure installation also prevent its adoption by farmers and landowners. Similar issues of high uncertainty and additional financial costs are faced by other practices aiming to reduce nitrogen loading. Consequently, more research is needed to comprehensively understand the impacts of conservation practices on agricultural productivity, nutrient loss reduction, and other ecosystem services as well as their tradeoffs and balance in the context of climate change mitigation and adaptation in tile-drained agricultural ecosystems.
In this study, we used a process-based model to evaluate the impact of tile drainage on the coupled hydrology, biogeochemistry, and crop system. Our results reveal that soil oxygen dynamics are the key emergent property and central mediator that link the physical alterations in hydrology to the profound responses in biogeochemical cycles and crop growth in tile-drained systems. Specifically, crop oxygen stress in the root system emerges as the competition between the crop oxygen demand and the soil oxygen supply, governed by oxygen transport, phase changes, and biological consumption mechanisms in the model. Tile drainage influences the system firstly by altering the water fluxes and storage, which subsequently changes the soil aeration and further regulates the crop oxygen stress. Its impacts on the root zone further cascade to the whole crop system through the tightly coupled soil–crop–atmosphere processes. Meanwhile, the biological oxygen consumption also drives the change in the soil biogeochemistry processes and further affects crop growth. The model performance is validated with field crop yield data and tile flow observation. We systematically compared model simulations under both the tile-drained and undrained conditions to quantitatively evaluate the influence of tile drainage on the hydrology, biogeochemistry, and crop growth of the agroecosystem. Further, through a series of numerical experiments, we revealed the pivotal role of tile drainage in the face of climate change, considering various precipitation scenarios.
-
The impact of tile drainage on hydrology: We found that tile drainage firstly modifies the hydrological cycles, influencing both the water storage and water fluxes. At the study site, our results reveal that tile drainage reduces the soil water content, and increases the annual subsurface discharge and subsurface recharge, while it does not significantly change the surface runoff and ET. Those impacts on hydrology exhibit a seasonality, controlled by the seasonality of the climate and crop phenology. Specifically, tile drainage mainly increases the subsurface discharge when there is high precipitation or low ET and increases the subsurface recharge when the crops actively transpire water from the soil.
-
The impact of tile drainage on soil biogeochemistry: The changes in hydrology further propagate through the agroecosystem, instigating ramifications within the biogeochemical cycles. Specifically, tile drainage increases the subsurface nitrogen leaching with the increase of subsurface discharge. Tile drainage also elevates the soil oxygen content, as fewer soil pores are occupied by water. The elevated soil oxygen content further increases the soil net mineralization.
-
The impact of tile drainage on crop growth and its implications under climate change: Those changes in the hydrology and biogeochemistry substantially benefit crop growth under both wet springs and dry summers. High soil oxygen concentration under the tile-drained conditions provides an aeration condition that mitigates crop oxygen stress, promoting robust root development and overall crop growth in wet springs. The developed root system also enhances crop resilience to summer drought. We also found that the yield benefit of tile drainage increases with the increase of precipitation and higher crop resilience to precipitation variation under the tile drainage conditions.
In conclusion, this study reveals the underlying causal mechanisms that drive the agroecosystem response to drainage on hydrology, biogeochemistry, crop growth, and their interconnections with oxygen dynamics as the key mediator. Our study also highlights tile drainage as a promising and adaptable climate change adaptation and mitigation strategy with the potential to enhance agricultural resilience in the US Midwest agroecosystems.
Ecosys can be freely downloaded from GitHub (https://github.com/jinyun1tang/ECOSYS, Grant, 2023). The field experiment data can be freely accessed via a website at Iowa State University at https://doi.org/10.15482/USDA.ADC/1521092 (Chighladze et al., 2021). The meteorological variables from the North American Land Data Assimilation System (NLDAS-2) can be freely accessed from https://ldas.gsfc.nasa.gov/nldas/v2/forcing (last access: January 2024; Xia et al., 2012). The soil information from the Gridded Soil Survey Geographic Database (gSSURGO) datasets can be freely accessed from https://data.nal.usda.gov/dataset/gridded-soil-survey-geographic-database-gssurgo (Soil Survey Staff, 2023).
The supplement related to this article is available online at https://doi.org/10.5194/hess-29-6393-2025-supplement.
ZWM: conceptualization, investigation, methodology, software, writing – original draft, writing – review and editing. KYG, BP: conceptualization, supervision, methodology, writing – original draft, writing – review and editing. WZ, RG, MS: conceptualization, methodology, writing – review and editing, validation, supervision. JYT, MP, LL, ZNJ: supervision and review.
The contact author has declared that none of the authors has any competing interests.
Publisher's note: Copernicus Publications remains neutral with regard to jurisdictional claims made in the text, published maps, institutional affiliations, or any other geographical representation in this paper. While Copernicus Publications makes every effort to include appropriate place names, the final responsibility lies with the authors. Views expressed in the text are those of the authors and do not necessarily reflect the views of the publisher.
The authors acknowledge the financial support from the NSF CAREER Award managed by the NSF Environmental Sustainability Program (award no. 1847334), the USDA NIFA program (grant no. 2023-67013-39046) and the Foundation for Food & Agriculture Research (FFAR) Seeding Solutions Award (grant no. CA20-SS-0000000137). Kaiyu Guan, Bin Peng, and Zewei Ma are also funded by the DOE Center for Advanced Bioenergy and Bioproducts Innovation (U.S. Department of Energy, Office of Science, Biological and Environmental Research Program under award no. DE-SC0018420). Jinyun Tang was supported by the Director, Office of Science, Office of Biological and Environmental Research, of the US Department of Energy under contract no. DE-AC02-05CH11231 as part of the Reducing Uncertainties in Biogeochemical Interactions through Synthesis and Computation (RUBISCO) Scientific Focus Area. Any opinions, findings, and conclusions or recommendations expressed in this publication are those of the author(s) and do not necessarily reflect the views of the U.S. government agencies.
This research has been supported by the NSF CAREER (award no. 1847334), USDA NIFA (grant no. 2023-67013-39046), Foundation for Food & Agriculture Research (grant no. CA20-SS-0000000137), the DOE Center for Advanced Bioenergy and Bioproducts Innovation (U.S. Department of Energy, Office of Science, Biological and Environmental Research Program under award no. DE-SC0018420) and the Director, Office of Science, Office of Biological and Environmental Research, of the US Department of Energy (contract no. DE-AC02-05CH11231).
This paper was edited by Xavier Sanchez-Vila and reviewed by two anonymous referees.
Adelsperger, S. R., Ficklin, D. L., and Robeson, S. M.: Tile drainage as a driver of streamflow flashiness in agricultural areas of the Midwest, USA, Hydrol. Process., 37, https://doi.org/10.1002/hyp.15021, 2023.
Arnold, J. G., Moriasi, D. N., Gassman, P. W., Abbaspour, K. C., White, M. J., Srinivasan, R., Santhi, C., Harmel, R. D., van Griensven, A., Van Liew, M. W., Kannan, N., and Jha, M. K.: SWAT: Model use, calibration, and validation, T. ASABE, 55, 1491–1508, 2012.
Ashraf, M. A.: Waterlogging stress in plants: A review, Afr. J. Agric. Res., 7, 1976–1981, 2012.
Askar, M. H., Youssef, M. A., Chescheir, G. M., Negm, L. M., King, K. W., Hesterberg, D. L., Amoozegar, A., and Skaggs, R. W.: DRAINMOD Simulation of macropore flow at subsurface drained agricultural fields: Model modification and field testing, Agr. Water Manage., 242, 106401, https://doi.org/10.1016/j.agwat.2020.106401, 2020.
Bailey, R. T., Bieger, K., Flores, L., and Tomer, M.: Evaluating the contribution of subsurface drainage to watershed water yield using SWAT+ with groundwater modeling, Sci. Total Environ., 802, 149962, https://doi.org/10.1016/j.scitotenv.2021.149962, 2022.
Beer, C., Ciais, P., Reichstein, M., Baldocchi, D., Law, B. E., Papale, D., Soussana, J.-F., Ammann, C., Buchmann, N., Frank, D., Gianelle, D., Janssens, I. A., Knohl, A., Köstner, B., Moors, E., Roupsard, O., Verbeeck, H., Vesala, T., Williams, C. A., and Wohlfahrt, G.: Temporal and among-site variability of inherent water use efficiency at the ecosystem level, Global Biogeochem. Cy., 23, https://doi.org/10.1029/2008gb003233, 2009.
Blann, K. L., Anderson, J. L., Sands, G. R., and Vondracek, B.: Effects of Agricultural Drainage on Aquatic Ecosystems: A Review, Crit. Rev. Environ. Sci. Technol., 39, 909–1001, 2009.
Boland-Brien, S. J., Basu, N. B., and Schilling, K. E.: Homogenization of spatial patterns of hydrologic response in artificially drained agricultural catchments, Hydrol. Process., 28, 5010–5020, 2014.
Bresler, E.: Simultaneous transport of solutes and water under transient unsaturated flow conditions, Water Resour. Res., 9, 975–986, 1973.
Brown, R. L., Hangs, R., Schoenau, J., and Bedard-Haughn, A.: Soil nitrogen and phosphorus dynamics and uptake by wheat grown in drained prairie soils under three moisture scenarios, Soil Sci. Soc. Am. J., 81, 1496–1504, 2017.
Cain, M. R., Woo, D. K., Kumar, P., Keefer, L., and Ward, A. S.: Antecedent conditions control thresholds of tile-runoff generation and nitrogen export in intensively managed landscapes, Water Resour. Res., 58, e2021WR030507, https://doi.org/10.1029/2021wr030507, 2022.
Castellano, M. J., Archontoulis, S. V., Helmers, M. J., Poffenbarger, H. J., and Six, J.: Sustainable intensification of agricultural drainage, Nat. Sustainabil., 2, 914–921, 2019.
Chighladze, G., Abendroth, L. J., Herzmann, D., Helmers, M., Ahiablame, L., Allred, B., Bowling, L., Brown, L., Fausey, N., Frankenberger, J., Jaynes, D., Jia, X., Kjaersgaard, J., King, K., Kladivko, E., Nelson, K., Pease, L., Reinhart, B., Strock, J., and Youssef, M.: Transforming Drainage Research Data (USDA-NIFA Award No. 2015-68007-23193), National Agricultural Library - ARS - USDA [data set], https://doi.org/10.15482/USDA.ADC/1521092, 2021.
David, M. B., Gentry, L. E., Kovacic, D. A., and Smith, K. M.: Nitrogen balance in and export from an agricultural watershed, J. Environ. Qual., 26, 1038–1048, 1997.
David, M. B., Drinkwater, L. E., and McIsaac, G. F.: Sources of nitrate yields in the Mississippi River Basin, J. Environ. Qual., 39, 1657–1667, 2010.
Delbecq, B. A., Brown, J. P., Florax, R. J. G. M., Kladivko, E. J., Nistor, A. P., and Lowenberg-DeBoer, J. M.: The impact of drainage water management technology on corn yields, Agron. J., 104, 1100–1109, 2012.
De Schepper, G. and Therrien, R.: Simulating seasonal variations of tile drainage discharge in an agricultural catchment, Resour. Res., 53, 3896–3920, https://doi.org/10.1002/2016WR020209, 2017.
Drinkwater, L. E. and Snapp, S. S.: Nutrients in Agroecosystems: Rethinking the Management Paradigm, Advances in Agronomy, 92, 163–186, https://doi.org/10.1016/S0065-2113(04)92003-2, 2007.
Ebrahimi-Mollabashi, E., Huth, N. I., Holzwoth, D. P., Ordóñez, R. A., Hatfield, J. L., Huber, I., Castellano, M. J., and Archontoulis, S. V.: Enhancing APSIM to simulate excessive moisture effects on root growth, Field Crops Res., 236, 58–67, 2019.
Elzenga, J. T. M. and van Veen, H.: Waterlogging and Plant Nutrient Uptake, in: Waterlogging Signalling and Tolerance in Plants, edited by: Mancuso, S. and Shabala, S., Springer, Berlin, Heidelberg, 23–35, https://doi.org/10.1007/978-3-642-10305-6_2, 2010.
Fan, Y., Miguez-Macho, G., Jobbágy, E. G., Jackson, R. B., and Otero-Casal, C.: Hydrologic regulation of plant rooting depth, P. Natl. Acad. Sci. USA, 114, 10572–10577, 2017.
Feddes, R., Kowalik, P., and Zaradny, H.: Simulation of field water use and crop yield, Wiley, ISBN 0470264632, ISBN 9780470264638, 1978.
Feddes, R. A., Hoff, H., Bruen, M., Dawson, T., de Rosnay, P., Dirmeyer, P., Jackson, R. B., Kabat, P., Kleidon, A., Lilly, A., and Pitman, A. J.: Modeling Root Water Uptake in Hydrological and Climate Models, B. Am. Meteorol. Soc., 82, 2797–2810, 2001.
Follett, R. F., Allmaras, R. R., and Reichman, G. A.: Distribution of corn roots in sandy soil with a declining water table, Agron. J., 66, 288–292, 1974.
Frankenberger, J., McMillan, S. K., Williams, M. R., Mazer, K., Ross, J., and Sohngen, B.: Drainage water management: A review of nutrient load reductions and cost effectiveness, J. ASABE, 67, https://doi.org/10.13031/ja.15549, 2023.
Ghane, E., Fausey, N. R., Shedekar, V. S., Piepho, H. P., Shang, Y., and Brown, L. C.: Crop yield evaluation under controlled drainage in Ohio, United States, J. Soil Water Conserv., 67, 465–473, 2012.
Gramlich, A., Stoll, S., Stamm, C., Walter, T., and Prasuhn, V.: Effects of artificial land drainage on hydrology, nutrient and pesticide fluxes from agricultural fields – A review, Agr. Ecosyst. Environ., 266, 84–99, 2018.
Grant, R.: Simulation of competition between barley and wild oats under different managements and climates, Ecol. Model., 71, 269–287, 1994.
Grant, R.: Chapter 6: Review of the Canadian Ecosystem Model – ecosys, in: Modeling Carbon and Nitrogen Dynamics for Soil Management, edited by: Shaffer, M. J., Ma, L., and Hansen, S., CRC Press, 173–264, ISBN: 1566705290, ISBN: 9781566705295, 2001.
Grant, R.: ECOSYS: The ECOSYS model for terrestrial ecosystem biogeochemistry, GitHub [code], https://github.com/jinyun1tang/ECOSYS (last access: January 2024), 2023.
Grant, R. F.: Simulation model of soil compaction and root growth, Plant Soil, 150, 1–14, 1993.
Grant, R. F.: Simulation in ecosys of root growth response to contrasting soil water and nitrogen, Ecol. Model., 107, 237–264, 1998.
Grant, R. F. and Pattey, E.: Mathematical modeling of nitrous oxide emissions from an agricultural field during spring thaw, Global Biogeochem. Cy., 13, 679–694, 1999.
Grant, R. F., Juma, N. G., and McGill, W. B.: Simulation of carbon and nitrogen transformations in soil: microbial biomass and metabolic products, Soil Biol. Biochem., 25, https://doi.org/10.1016/0038-0717(93)90047-F, 1993a.
Grant, R. F., Juma, N. G., and McGill, W. B.: Simulation of carbon and nitrogen transformations in soil: Mineralization, Soil Biol. Biochem., 25, 1317–1329, 1993b.
Grant, R. F., Wall, G. W., Kimball, B. A., Frumau, K. F. A., Pinter Jr., P. J., Hunsaker, D. J., and Lamorte, R. L.: Crop water relations under different CO2 and irrigation: testing of ecosys with the free air CO2 enrichment (FACE) experiment, Agr. Forest Meteorol., 95, 27–51, 1999.
Grant, R. F., Mekonnen, Z. A., Riley, W. J., Wainwright, H. M., Graham, D., and Torn, M. S.: Mathematical modelling of arctic polygonal tundra with ecosys: 1. Microtopography determines how active layer depths respond to changes in temperature and precipitation: Active layer depth in polygonal tundra, J. Geophys. Res.-Biogeo., 122, 3161–3173, 2017.
Grenon, G., Singh, B., De Sena, A., Madramootoo, C. A., von Sperber, C., Goyal, M. K., and Zhang, T.: Phosphorus fate, transport and management on subsurface drained agricultural organic soils: a review, Environ. Res. Lett., 16, 013004, https://doi.org/10.1088/1748-9326/abce81, 2021.
Guerrieri, R., Lepine, L., Asbjornsen, H., Xiao, J., and Ollinger, S. V.: Evapotranspiration and water use efficiency in relation to climate and canopy nitrogen in U.S. forests, J. Geophys. Res.-Biogeo., 121, 2610–2629, 2016.
Hammond, G. E., Lichtner, P. C., and Mills, R. T.: Evaluating the performance of parallel subsurface simulators: An illustrative example with PFLOTRAN, Water Resour. Res., 50, 208–228, 2014.
Hanrahan, B. R., King, K. W., Macrae, M. L., Williams, M. R., and Stinner, J. H.: Among-site variability in environmental and management characteristics: Effect on nutrient loss in agricultural tile drainage, J. Great Lakes Res., 46, 486–499, 2020.
Hansen, A. L., Refsgaard, J. C., Christensen, B. S. B., and Jensen, K. H.: Importance of including small-scale tile drain discharge in the calibration of a coupled groundwater-surface water catchment model, Water Resour. Res., 49, 585–603, 2013.
Helmers, M. J., Abendroth, L., Reinhart, B., Chighladze, G., Pease, L., Bowling, L., Youssef, M., Ghane, E., Ahiablame, L., Brown, L., Fausey, N., Frankenberger, J., Jaynes, D., King, K., Kladivko, E., Nelson, K., and Strock, J.: Impact of controlled drainage on subsurface drain flow and nitrate load: A synthesis of studies across the U.S. Midwest and Southeast, Agr. Water Manage., 259, 107265, https://doi.org/10.1016/j.agwat.2021.107265, 2022.
Hodge, A.: The plastic plant: root responses to heterogeneous supplies of nutrients, New Phytol., 162, 9–24, 2004.
Hodge, A., Berta, G., Doussan, C., Merchan, F., and Crespi, M.: Plant root growth, architecture and function, Plant Soil, 321, 153–187, 2009.
Hoffman, F. M., Koven, C. D., Keppel-Aleks, G., Lawrence, D. M., Riley, W. J., Randerson, J. T., Ahlström, A., Abramowitz, G., Baldocchi, D. D., Best, M. J., Bond-Lamberty, B., De Kauwe, M. G., Denning, A. S., Desai, A. R., Eyring, V., Fisher, J. B., Fisher, R. A., Gleckler, P. J., Huang, M., Hugelius, G., Jain, A. K., Kiang, N. Y., Kim, H., Koster, R. D., Kumar, S. V., Li, H., Luo, Y., Mao, J., McDowell, N. G., Mishra, U., Moorcroft, P. R., Pau, G. S. H., Ricciuto, D. M., Schaefer, K., Schwalm, C. R., Serbin, S. P., Shevliakova, E., Slater, A. G., Tang, J., Williams, M., Xia, J., Xu, C., Joseph, R., and Koch, D.: 2016 International Land Model Benchmarking (ILAMB) Workshop Report, USDOE Office of Science, Washington, D.C., USA, https://doi.org/10.2172/1330803, 2017.
Horton, R. E.: The role of infiltration in the hydrologic cycle, Eos Trans. Am. Geophys. Union, 14, 446–460, 1933.
Ivanov, V. Y., Bras, R. L., and Curtis, D. C.: A weather generator for hydrological, ecological, and agricultural applications, Water Resour. Res., 43, https://doi.org/10.1029/2006wr005364, 2007.
Jacinthe, P. A., Vidon, P., Fisher, K., Liu, X., and Baker, M. E.: Soil Methane and Carbon Dioxide Fluxes from Cropland and Riparian Buffers in Different Hydrogeomorphic Settings, J. Environ. Qual., 44, 1080–1090, 2015.
Jiang, Q., Qi, Z., Xue, L., Bukovsky, M., Madramootoo, C. A., and Smith, W.: Assessing climate change impacts on greenhouse gas emissions, N losses in drainage and crop production in a subsurface drained field, Sci. Total Environ., 705, 135969, https://doi.org/10.1016/j.scitotenv.2019.135969, 2020.
Jin, W., Aufrecht, J., Patino-Ramirez, F., Cabral, H., Arson, C., and Retterer, S. T.: Modeling root system growth around obstacles, Sci. Rep., 10, 15868, https://doi.org/10.1038/s41598-020-72557-8, 2020.
Jochen Schenk, H.: Vertical Vegetation Structure Below Ground: Scaling from Root to Globe, in: Progress in Botany: Genetics Physiology Systematics Ecology, edited by: Esser, K., Lüttge, U., Beyschlag, W., and Murata, J., Springer, Berlin, Heidelberg, 341–373, https://doi.org/10.1007/3-540-27043-4_14, 2005.
Jones, J. W., Antle, J. M., Basso, B., Boote, K. J., Conant, R. T., Foster, I., Godfray, H. C. J., Herrero, M., Howitt, R. E., Janssen, S., Keating, B. A., Munoz-Carpena, R., Porter, C. H., Rosenzweig, C., and Wheeler, T. R.: Brief history of agricultural systems modeling, Agric. Syst., 155, 240–254, 2017.
Kalita, P. K., Cooke, R. A. C., Anderson, S. M., Hirschi, M. C., and Mitchell, J. K.: Subsurface drainage and water quality: The Illinois experience, T. ASABE, 50, 1651–1656, 2007.
Kemper, W. D. and Rollins, J. B.: Osmotic efficiency coefficients across compacted clays, Soil Sci. Soc. Am. J., 30, 529–534, 1966.
Khand, K., Kjaersgaard, J., Hay, C., and Jia, X.: Estimating Impacts of Agricultural Subsurface Drainage on Evapotranspiration Using the Landsat Imagery-Based METRIC Model, Hydrology, 4, 49, https://doi.org/10.3390/hydrology4040049, 2017.
Kucharik, C. J.: Contribution of planting date trends to increased maize yields in the central United States, Agron. J., 100, 328–336, 2008.
Kumar, S., Nakajima, T., Kadono, A., Lal, R., and Fausey, N.: Long-term tillage and drainage influences on greenhouse gas fluxes from a poorly drained soil of central Ohio, J. Soil Water Conserv., 69, 553–563, 2014.
Lam, W. V., Macrae, M. L., English, M. C., O'Halloran, I. P., Plach, J. M., and Wang, Y.: Seasonal and event-based drivers of runoff and phosphorus export through agricultural tile drains under sandy loam soil in a cool temperate region, Hydrol. Process., 30, 2644–2656, 2016.
Lavaire, T., Gentry, L. E., David, M. B., and Cooke, R. A.: Fate of water and nitrate using drainage water management on tile systems in east-central Illinois, Agr. Water Manage., 191, 218–228, 2017.
Lesk, C., Rowhani, P., and Ramankutty, N.: Influence of extreme weather disasters on global crop production, Nature, 529, 84–87, 2016.
Li, H., Sivapalan, M., Tian, F., and Liu, D.: Water and nutrient balances in a large tile-drained agricultural catchment: a distributed modeling study, Hydrol. Earth Syst. Sci., 14, 2259–2275, https://doi.org/10.5194/hess-14-2259-2010, 2010.
Li, L., Maher, K., Navarre-Sitchler, A., Druhan, J., and Meile, C.: Expanding the role of reactive transport models in critical zone processes, Earth-Sci. Rev., 165, https://doi.org/10.1016/j.earscirev.2016.09.001, 2017.
Li, L., Sullivan, P. L., Benettin, P., Cirpka, O. A., Bishop, K., Brantley, S. L., Knapp, J. L. A., Meerveld, I., Rinaldo, A., Seibert, J., Wen, H., and Kirchner, J. W.: Toward catchment hydro-biogeochemical theories, WIREs Water, 8, https://doi.org/10.1002/wat2.1495, 2021.
Li, Y., Guan, K., Yu, A., Peng, B., Zhao, L., Li, B., and Peng, J.: Toward building a transparent statistical model for improving crop yield prediction: Modeling rainfed corn in the U.S., Field Crops Res., 234, 55–65, 2019.
Li, Z., Guan, K., Zhou, W., Peng, B., Jin, Z., Tang, J., Grant, R. F., Nafziger, E. D., Margenot, A. J., Gentry, L. E., DeLucia, E. H., Yang, W. H., Cai, Y., Qin, Z., Archontoulis, S. V., Fernández, F. G., Yu, Z., Lee, D., and Yang, Y.: Assessing the impacts of pre-growing-season weather conditions on soil nitrogen dynamics and corn productivity in the U.S. Midwest, Field Crops Res., 284, 108563, https://doi.org/10.1016/j.fcr.2022.108563, 2022.
Linn, D. M. and Doran, J. W.: Effect of water-filled pore space on carbon dioxide and nitrous oxide production in tilled and nontilled soils, Soil Sci. Soc. Am. J., 48, 1267–1272, 1984.
Liu, K., Harrison, M. T., Shabala, S., Meinke, H., Ahmed, I., Zhang, Y., Tian, X., and Zhou, M.: The state of the art in modeling waterlogging impacts on plants: What do we know and what do we need to know, Earths Future, 8, https://doi.org/10.1029/2020ef001801, 2020.
Lobell, D. B., Roberts, M. J., Schlenker, W., Braun, N., Little, B. B., Rejesus, R. M., and Hammer, G. L.: Greater sensitivity to drought accompanies maize yield increase in the U.S. Midwest, Science, 344, 516–519, 2014.
Ma, Z., Guan, K., Peng, B., Sivapalan, M., Li, L., Pan, M., Zhou, W., Warner, R., and Zhang, J.: Agricultural nitrate export patterns shaped by crop rotation and tile drainage, Water Res., 229, 119468, https://doi.org/10.1016/j.watres.2022.119468, 2023.
Macrae, M. L., English, M. C., Schiff, S. L., and Stone, M.: Intra-annual variability in the contribution of tile drains to basin discharge and phosphorus export in a first-order agricultural catchment, Agr. Water Manage., 92, 171–182, 2007.
Mezbahuddin, M., Grant, R. F., and Flanagan, L. B.: Modeling hydrological controls on variations in peat water content, water table depth, and surface energy exchange of a boreal western Canadian fen peatland, J. Geophys. Res.-Biogeo., https://doi.org/10.1002/2016JG003501, 2016.
Miller, S. A. and Lyon, S. W.: Tile drainage causes flashy streamflow response in Ohio watersheds, Hydrol. Process., 35, https://doi.org/10.1002/hyp.14326, 2021.
Mitchell, M. E., Newcomer-Johnson, T., Christensen, J., Crumpton, W., Dyson, B., Canfield, T. J., Helmers, M., and Forshay, K. J.: A review of ecosystem services from edge-of-field practices in tile-drained agricultural systems in the United States Corn Belt Region, J. Environ. Manage., 348, 119220, https://doi.org/10.1016/j.jenvman.2023.119220, 2023.
Moore, J.: Literature review: tile drainage and phosphorus losses from agricultural land, Lake Champlain Basin Program, https://www.lcbp.org/wp-content/uploads/2017/01/83_TileDrainage_LitReview.pdf (last access: October 2025), 2016.
Muma, M., Rousseau, A. N., and Gumiere, S. J.: Modeling of subsurface agricultural drainage using two hydrological models with different conceptual approaches as well as dimensions and spatial scales, Canadian Water Resources Journal/Revue canadienne des ressources hydriques, 42, 38–53, 2017.
Nanda, A. and Safeeq, M.: Threshold controlling runoff generation mechanisms in Mediterranean headwater catchments, J. Hydrol., 620, 129532, https://doi.org/10.1016/j.jhydrol.2023.129532, 2023.
NASS-USDA: 2017 Census of Agriculture, https://quickstats.nass.usda.gov/ (last access: May 2023), 2017.
Nóia Júnior, R. de S., Asseng, S., García-Vila, M., Liu, K., Stocca, V., dos Santos Vianna, M., Weber, T. K. D., Zhao, J., Palosuo, T., and Harrison, M. T.: A call to action for global research on the implications of waterlogging for wheat growth and yield, Agr. Water Manage., 284, 108334, https://doi.org/10.1016/j.agwat.2023.108334, 2023.
Ordóñez, R. A., Castellano, M. J., Hatfield, J. L., Helmers, M. J., Licht, M. A., Liebman, M., Dietzel, R., Martinez-Feria, R., Iqbal, J., Puntel, L. A., Córdova, S. C., Togliatti, K., Wright, E. E., and Archontoulis, S. V.: Maize and soybean root front velocity and maximum depth in Iowa, USA, Field Crops Res., 215, 122–131, 2018.
Pan, J., Sharif, R., Xu, X., and Chen, X.: Mechanisms of Waterlogging Tolerance in Plants: Research Progress and Prospects, Front. Plant Sci., 11, 627331, https://doi.org/10.3389/fpls.2020.627331, 2020.
Pasley, H. R., Huber, I., Castellano, M. J., and Archontoulis, S. V.: Modeling Flood-Induced Stress in Soybeans, Front. Plant Sci., 11, 62, https://doi.org/10.3389/fpls.2020.00062, 2020.
Paul-Limoges, E., Revill, A., Maier, R., Buchmann, N., and Damm, A.: Insights for the partitioning of ecosystem evaporation and transpiration in short-statured croplands, J. Geophys. Res.-Biogeo., 127, https://doi.org/10.1029/2021jg006760, 2022.
Pluer, W. T., Macrae, M., Buckley, A., and Reid, K.: Contribution of preferential flow to tile drainage varies spatially and temporally, Vadose Zone J., 19, https://doi.org/10.1002/vzj2.20043, 2020.
Qin, Z., Guan, K., Zhou, W., Peng, B., Villamil, M. B., Jin, Z., Tang, J., Grant, R., Gentry, L., Margenot, A. J., Bollero, G., and Li, Z.: Assessing the impacts of cover crops on maize and soybean yield in the U.S. Midwestern agroecosystems, Field Crops Res., 273, 108264, https://doi.org/10.1016/j.fcr.2021.108264, 2021.
Rahman, M. M., Lin, Z., Jia, X., Steele, D. D., and DeSutter, T. M.: Impact of subsurface drainage on streamflows in the Red River of the North basin, J. Hydrol., 511, 474–483, 2014.
Randall, G. W. and Mulla, D. J.: Nitrate nitrogen in surface waters as influenced by climatic conditions and agricultural practices, J. Environ. Qual., 30, 337–344, 2001.
Ren, B., Zhang, J., Dong, S., Liu, P., and Zhao, B.: Root and shoot responses of summer maize to waterlogging at different stages, Agron. J., 108, 1060–1069, 2016.
Ren, D., Engel, B., Mercado, J. A. V., Guo, T., Liu, Y., and Huang, G.: Modeling and assessing water and nutrient balances in a tile-drained agricultural watershed in the U.S. Corn Belt, Water Res., 210, 117976, https://doi.org/10.1016/j.watres.2021.117976, 2022.
Ross, J. A., Herbert, M. E., Sowa, S. P., Frankenberger, J. R., King, K. W., Christopher, S. F., Tank, J. L., Arnold, J. G., White, M. J., and Yen, H.: A synthesis and comparative evaluation of factors influencing the effectiveness of drainage water management, Agr. Water Manage., 178, 366–376, 2016.
Rubol, S., Manzoni, S., Bellin, A., and Porporato, A.: Modeling soil moisture and oxygen effects on soil biogeochemical cycles including dissimilatory nitrate reduction to ammonium (DNRA), Adv. Water Resour., 62, 106–124, 2013.
Rumph Frederiksen, R. and Molina-Navarro, E.: The importance of subsurface drainage on model performance and water balance in an agricultural catchment using SWAT and SWAT-MODFLOW, Agr. Water Manage., 255, 107058, https://doi.org/10.1016/j.agwat.2021.107058, 2021.
Schenk, H. J. and Jackson, R. B.: Mapping the global distribution of deep roots in relation to climate and soil characteristics, Geoderma, 126, 129–140, 2005.
Schilling, K. E. and Helmers, M.: Effects of subsurface drainage tiles on streamflow in Iowa agricultural watersheds: Exploratory hydrograph analysis, Hydrol. Process., 22, 4497–4506, 2008.
Schilling, K. E., Jindal, P., Basu, N. B., and Helmers, M. J.: Impact of artificial subsurface drainage on groundwater travel times and baseflow discharge in an agricultural watershed, Iowa (USA), Hydrol. Process., 26, 3092–3100, 2012.
Schmidhuber, J. and Tubiello, F. N.: Global food security under climate change, P. Natl. Acad. Sci. USA, 104, 19703–19708, 2007.
Seneviratne, S. I., Adnan, M., Badi, W., Dereczynski, C., Luca, A. D., Ghosh, S., Iskandar, I., Kossin, J., Lewis, S., Otto, F., Pinto, I., Satoh, M., Vicente-Serrano, S. M., Wehner, M., and Zhou, B.: Weather and climate extreme events in a changing climate, Climate Change 2021: The Physical Science Basis, in: Contribution of Working Group I to the Sixth Assessment Report of the Intergovernmental Panel on Climate Change, Cambridge University Press, https://doi.org/10.1017/9781009157896.013, 1513–1766, 2022.
Sharpley, A. N.: EPIC-erosion/productivity impact calculator: 1, model documentation, USDA Techn. Bull. 1759, USDA, 235 pp., https://agrilife.org/epicapex/files/2015/05/EpicModelDocumentation.pdf (last access: May 2024), 1990.
Shedekar, V. S., King, K. W., Fausey, N. R., Islam, K. R., Soboyejo, A. B. O., Kalcic, M. M., and Brown, L. C.: Exploring the effectiveness of drainage water management on water budgets and nitrate loss using three evaluation approaches, Agr. Water Manage., 243, 106501, https://doi.org/10.1016/j.agwat.2020.106501, 2021.
Shen, C., Niu, J., and Phanikumar, M. S.: Evaluating controls on coupled hydrologic and vegetation dynamics in a humid continental climate watershed using a subsurface-land surface processes model, Water Resour. Res., 49, 2552–2572, 2013.
Shirzaei, M., Khoshmanesh, M., Ojha, C., Werth, S., Kerner, H., Carlson, G., Sherpa, S. F., Zhai, G., and Lee, J.-C.: Persistent impact of spring floods on crop loss in U.S. Midwest, Weather Clim. Ext., 34, 100392, https://doi.org/10.1016/j.wace.2021.100392, 2021.
Sims, J. T., Simard, R. R., and Joern, B. C.: Phosphorus loss in agricultural drainage: Historical perspective and current research, J. Environ. Qual., 27, 277–293, 1998.
Šimůnek, J. and Hopmans, J. W.: Modeling compensated root water and nutrient uptake, Ecol. Model., 220, 505–521, 2009.
Singh, G. and Nelson, K. A.: Long-term drainage, subirrigation, and tile spacing effects on maize production, Field Crops Res., 262, 108032, https://doi.org/10.1016/j.fcr.2020.108032, 2021.
Singh, N., Kogan, C., Chaudhary, S., Rajagopalan, K., and LaHue, G. T.: Controlled drainage and subirrigation suitability in the United States: A meta-analysis of crop yield and soil moisture effects, Vadose Zone J., 21, https://doi.org/10.1002/vzj2.20219, 2022.
Sinha, E., Michalak, A. M., and Balaji, V.: Eutrophication will increase during the 21st century as a result of precipitation changes, Science, 357, 405–408, 2017.
Skaggs, R. W., Brevé, M. A., and Gilliam, J. W.: Hydrologic and water quality impacts of agricultural drainage, Crit. Rev. Environ. Sci. Technol., 24, 1–32, 1994.
Skaggs, R. W., Youssef, M. A., and Chescheir, G. M.: DRAINMOD: Model use, calibration, and validation, T. ASABE, 55, 1509–1522, 2012.
Smith, W., Grant, B., Qi, Z., He, W., VanderZaag, A., Drury, C. F., and Helmers, M.: Development of the DNDC model to improve soil hydrology and incorporate mechanistic tile drainage: A comparative analysis with RZWQM2, Environ. Model. Softw., 123, 104577, https://doi.org/10.1016/j.envsoft.2019.104577, 2020.
Soil Survey Staff: Gridded Soil Survey Geographic (gSSURGO) Database for the Conterminous United States, United States Department of Agriculture, Natural Resources Conservation Service [data set], https://data.nal.usda.gov/dataset/gridded-soil-survey-geographic-database-gssurgo (last access: 23 January 2024), 2023.
Song, L., Liu, S., Kustas, W. P., Nieto, H., Sun, L., Xu, Z., Skaggs, T. H., Yang, Y., Ma, M., Xu, T., Tang, X., and Li, Q.: Monitoring and validating spatially and temporally continuous daily evaporation and transpiration at river basin scale, Remote Sens. Environ., 219, 72–88, 2018.
Steudle, E.: The cohesion-tension mechanism and the acquisition of water by plant roots, Annu. Rev. Plant Physiol. Plant Mol. Biol., 52, 847–875, 2001.
Stops, M. W., Sullivan, P. L., Peltier, E., Young, B., and Brookfield, A. E.: Tracking the hydrologic response of agricultural tile outlet terraces to storm events, Agr. Water Manage., 263, 107382, https://doi.org/10.1016/j.agwat.2021.107382, 2022.
Thomas, N. W., Arenas, A. A., Schilling, K. E., and Weber, L. J.: Numerical investigation of the spatial scale and time dependency of tile drainage contribution to stream flow, J. Hydrol., 538, 651–666, 2016.
Tromp-van Meerveld, H. J. and McDonnell, J. J.: Threshold relations in subsurface stormflow: 2. The fill and spill hypothesis, Water Resour. Res., 42, https://doi.org/10.1029/2004WR003800, 2006.
USDA NRCS: Conservation Practice Standard: Saturated Riparian Buffers, Federal Register, 604-CPS, https://www.nrcs.usda.gov/sites/default/files/2022-09/Saturated_Buffer_604_CPS_9_2020.pdf (last access: August 2024), 2017.
USDA NRCS: Conservation Practice Standard: Drainage Water Management, Federal Register, 554-CPS, https://www.nrcs.usda.gov/sites/default/files/2023-04/554-NHCP-CPS-Drainage-Water-Management-2023.pdf (last access: August 2024), 2023.
Valayamkunnath, P., Barlage, M., Chen, F., Gochis, D. J., and Franz, K. J.: Mapping of 30-meter resolution tile-drained croplands using a geospatial modeling approach, Sci, Data, 7, 257, https://doi.org/10.1038/s41597-020-00596-x, 2020.
Valayamkunnath, P., Gochis, D. J., Chen, F., Barlage, M., and Franz, K. J.: Modeling the hydrologic influence of subsurface tile drainage using the national water model, Water Resour. Res., 58, https://doi.org/10.1029/2021wr031242, 2022.
Vrettas, M. D. and Fung, I. Y.: Sensitivity of transpiration to subsurface properties: Exploration with a 1-D model, J. Adv. Model. Earth Syst., 9, 1030–1045, 2017.
Waldrop, M. P. and Firestone, M. K.: Response of microbial community composition and function to soil climate change, Microb. Ecol., 52, 716–724, 2006.
Wang, Z., Qi, Z., Xue, L., Bukovsky, M., and Helmers, M. J.: Modeling the impacts of climate change on nitrogen losses and crop yield in a subsurface drained field, Climatic Change, 129, 323–335, 2015.
Wang, Z., Timlin, D., Li, S., Fleisher, D., Dathe, A., Luo, C., Dong, L., Reddy, V. R., and Tully, K.: A diffusive model of maize root growth in MAIZSIM and its applications in Ridge-Furrow Rainfall Harvesting, Agr. Water Manage., 254, 106966, https://doi.org/10.1016/j.agwat.2021.106966, 2021.
Warren, J. M., Hanson, P. J., Iversen, C. M., Kumar, J., Walker, A. P., and Wullschleger, S. D.: Root structural and functional dynamics in terrestrial biosphere models–evaluation and recommendations, New Phytol., 205, 59–78, 2015.
Williams, M. R., King, K. W., and Fausey, N. R.: Contribution of tile drains to basin discharge and nitrogen export in a headwater agricultural watershed, Agr. Water Manage., 158, 42–50, 2015.
Williams, M. R., Penn, C. J., King, K. W., and McAfee, S. J.: Surface-to-tile drain connectivity and phosphorus transport: Effect of antecedent soil moisture, Hydrol. Process., 37, https://doi.org/10.1002/hyp.14831, 2023.
Wiskow, E. and van der Ploeg, R. R.: Calculation of drain spacings for optimal rainstorm flood control, J. Hydrol., 272, 163–174, 2003.
Woo, D. K. and Kumar, P.: Impacts of subsurface tile drainage on age – Concentration dynamics of inorganic nitrogen in soil, Water Resour. Res., https://doi.org/10.1029/2018WR024139, 2019.
Xia, Y., Mitchell, K., Ek, M., Sheffield, J., Cosgrove, B., Wood, E., Luo, L., Alonge, C., Wei, H., Meng, J., Livneh, B., Lettenmaier, D., Koren, V., Duan, Q., Mo, K., Fan, Y., and Mocko, D.: Continental-scale water and energy flux analysis and validation for the North American Land Data Assimilation System project phase 2 (NLDAS-2): 1. Intercomparison and application of model products, J. Geophys. Res. [data set], 117, https://doi.org/10.1029/2011jd016048, 2012.
Yang, Y., Anderson, M., Gao, F., Hain, C., Kustas, W., Meyers, T., Crow, W., Finocchiaro, R., Otkin, J., Sun, L., and Yang, Y.: Impact of Tile Drainage on Evapotranspiration in South Dakota, USA, Based on High Spatiotemporal Resolution Evapotranspiration Time Series From a Multisatellite Data Fusion System, IEEE J. Select. Top. Appl. Earth Obs. Remote Sens., 10, 2550–2564, 2017.
Yang, Y., Liu, L., Zhou, W., Guan, K., Tang, J., Kim, T., Grant, R. F., Peng, B., Zhu, P., Li, Z., Griffis, T. J., and Jin, Z.: Distinct driving mechanisms of non-growing season N2O emissions call for spatial-specific mitigation strategies in the US Midwest, Agr. For. Meteorol., 324, 109108, https://doi.org/10.1016/j.agrformet.2022.109108, 2022.
Yimer, E. A., Riakhi, F.-E., Bailey, R. T., Nossent, J., and van Griensven, A.: The impact of extensive agricultural water drainage on the hydrology of the Kleine Nete watershed, Belgium, Sci. Total Environ., 885, 163903, https://doi.org/10.1016/j.scitotenv.2023.163903, 2023.
Youssef, M. A., Strock, J., Bagheri, E., Reinhart, B. D., Abendroth, L. J., Chighladze, G., Ghane, E., Shedekar, V., Fausey, N. R., Frankenberger, J. R., Helmers, M. J., Jaynes, D. B., Kladivko, E., Negm, L., Nelson, K., and Pease, L.: Impact of controlled drainage on corn yield under varying precipitation patterns: A synthesis of studies across the U.S. Midwest and Southeast, Agr. Water Manage., 275, 107993, https://doi.org/10.1016/j.agwat.2022.107993, 2023.
Zhang, J., Guan, K., Peng, B., Pan, M., Zhou, W., Jiang, C., Kimm, H., Franz, T. E., Grant, R. F., Yang, Y., Rudnick, D. R., Heeren, D. M., Suyker, A. E., Bauerle, W. L., and Miner, G. L.: Sustainable irrigation based on co-regulation of soil water supply and atmospheric evaporative demand, Nat. Commun., 12, 5549, https://doi.org/10.1038/s41467-021-25254-7, 2021.
Zhou, W., Guan, K., Peng, B., Tang, J., Jin, Z., Jiang, C., Grant, R., and Mezbahuddin, S.: Quantifying carbon budget, crop yields and their responses to environmental variability using the ecosys model for U.S. Midwestern agroecosystems, Agr. For. Meteorol., 307, 108521, https://doi.org/10.1016/j.agrformet.2021.108521, 2021.
Zhou, W., Ruby Leung, L., and Lu, J.: Seasonally Dependent Future Changes in the U.S. Midwest Hydroclimate and Extremes, J. Climate, 35, 17–27, 2022.
Zulauf, C. and Brown, B.: Use of tile, 2017 US Census of agriculture, farmdoc daily, https://farmdocdaily.illinois.edu/2019/08/use-of-tile-2017-us-census-of-agriculture.html (last access: August 2024), 2019.