the Creative Commons Attribution 4.0 License.
the Creative Commons Attribution 4.0 License.
 | 06 Nov 2025
Decoding the architecture of drought: SHAP-enhanced insights into the climate forces reshaping the Sahel
Fabio Di Nunno
Mehmet Berkant Yıldız
Francesco Granata
The Sahel region faces increasing drought variability, driven by complex interactions between climatic indices and hydrological extremes. This study explores the correlation between the Standardized Precipitation Evapotranspiration Index (SPEI) and multiple climatic indices – including the Global Mean Temperature (GMT), Indo-Pacific Warm Pool (IPWP), Atlantic Multidecadal Oscillation (AMO), and North Tropical Atlantic Index (NTA) – using trend analysis, cross-correlation, and an innovative SHAP-driven (SHapley Additive exPlanations) clustering approach. The Seasonal Kendall (SK) test identified statistically significant decreasing SPEI-12 trends in 57.5 % of the grid cells, especially in the western (Senegal, Mauritania) and southeastern Sahel (South Sudan), while 19.3 %, mainly in central-western areas (Burkina Faso, Niger), showed significant increases. Correlation analysis revealed strong negative relationships between SPEI-12 and GMT (up to −0.76) and IPWP (−0.71), underscoring their role in drought intensification. Conversely, AMO (0.40) showed a positive correlation, meaning that during its warm phase rainfall tends to increase, alleviating drought severity, while its cold phase intensifies drought. This reflects a spatially heterogeneous influence distinct from the consistently negative effects of GMT and IPWP. Using the SHAP-driven clustering, AMO and NTA emerged as key discriminators of regional drought regimes. Thus, correlation analysis and RF/SHAP highlight complementary perspectives: parameters such as GMT and IPWP drive overall drought intensification, while parameters such as AMO and NTA govern the regional differentiation of drought patterns. This study introduces a novel framework that integrates explainable Artificial Intelligence (AI) into drought assessment, offering actionable insights for climate adaptation and water resource management in the Sahel.
- Article
(11442 KB) - Full-text XML
-
Supplement
(546 KB) - BibTeX
- EndNote


Drought represents one of the most critical environmental threats in the Sahel, where chronic water scarcity profoundly influences agricultural productivity, food security, and socio-economic stability (Nicholson, 2013). The region's climate is characterized by pronounced interannual rainfall variability, with monsoonal precipitation confined to a brief seasonal window each year (Guilbert et al., 2024). However, climate change is intensifying this variability, triggering more frequent, prolonged, and severe droughts that disrupt hydrological cycles and amplify water stress (Taylor et al., 2013).
These extreme events diminish water availability, accelerate land degradation, and intensify desertification, particularly affecting groundwater reserves that are vital for local resilience (Cuthbert et al., 2019). Rainfall deficits now often persist for years or decades, as witnessed during the devastating droughts of the 1970s and 1980s, which led to widespread famine, displacement, and long-term ecological degradation (Sarr et al., 2024). Although some rainfall recovery has occurred in recent decades, it remains highly erratic and often takes the form of short, intense storms that cause surface runoff but fail to replenish groundwater effectively (Panthou et al., 2014).
Rising temperatures further exacerbate drought severity by increasing evapotranspiration, depleting soil moisture, and reducing groundwater recharge (Hao et al., 2018; Nigatu et al., 2022). As a result, the Sahel faces an increasingly unpredictable hydrological future, where traditional water management strategies may no longer suffice to mitigate the impacts of prolonged dry periods.
The socio-economic repercussions of these droughts are profound, affecting millions who rely on rain-fed agriculture and pastoralism for their livelihoods (MacDonald et al., 2012). As surface water sources become increasingly unreliable, communities are forced to extract groundwater at unsustainable rates, accelerating resource depletion (Hamdi et al., 2020). This over-extraction, coupled with diminished recharge opportunities due to shifting precipitation patterns, raises serious concerns about long-term water security and the sustainability of groundwater-dependent ecosystems (Döll and Fiedler, 2008; Gleeson et al., 2012). Furthermore, the intensifying scarcity of water resources has been linked to escalating social tensions, forced migration, and regional conflicts, underscoring the urgent need for adaptive and sustainable drought management strategies.
Understanding the cascading effects of drought on agriculture, ecosystems, and livelihoods requires a comprehensive analytical framework. Drought patterns are shaped by a complex interplay of climatic variables influencing atmospheric circulation, precipitation, and temperature anomalies. Large-scale climate drivers can exacerbate droughts, altering hydrological cycles and intensifying water deficits. Prolonged dry spells reduce soil moisture, river discharge, and reservoir levels, threatening irrigation, drinking water supply, and ecosystem stability.
Traditional methods for analyzing drought trends, such as the Mann–Kendall (MK) test, are widely used but have limitations in detecting non-monotonic changes and seasonal variability. To address these constraints, this study employs the Seasonal Kendall (SK) test – an extension of the MK test that stratifies data into seasonal components prior to trend detection, thereby reducing bias from periodic fluctuations (Hirsch and Slack, 1984). This enhances the detection of long-term trends in the Standardized Precipitation Evapotranspiration Index (SPEI; Vicente-Serrano et al., 2010) and ensures that seasonality does not distort drought assessments.
Beyond trend detection, examining how large-scale climate drivers influence drought requires methods capable of capturing complex, potentially nonlinear interactions. While traditional correlation-based approaches offer insights, they often miss these subtleties. Therefore, this study uses cross-correlation analysis to quantify the strength and direction of associations between SPEI and key climatic indices, enabling a more nuanced understanding of the dominant teleconnections shaping drought variability in the Sahel.
A critical yet frequently overlooked aspect of drought characterization involves identifying spatially homogeneous regions that exhibit consistent drought-climate relationships. Traditionally, clustering techniques such as K-means and Hierarchical clustering have been used to delineate these regions based on hydroclimatic features. K-means, while computationally efficient, assumes spherical clusters and equal variance, often oversimplifying complex spatial patterns. Hierarchical clustering, although more flexible in capturing nested relationships, can be sensitive to noise and lacks scalability for large datasets. Moreover, both methods operate as unsupervised learning algorithms, providing little insight into the underlying climatic drivers that influence cluster formation. As a result, these techniques often fall short in interpretability and in explaining the climatic processes shaping spatial drought variability.
To overcome these limitations, this study introduces an innovative SHAP-driven clustering framework, which integrates RF classification with SHAP analysis. In this approach, RF is used to classify observations into drought-prone clusters identified during the unsupervised phase, while SHAP quantifies the contribution of each climatic variable to the predicted cluster membership. This combination offers a transparent and interpretable alternative to traditional clustering by uncovering not only the spatial patterns of drought but also the relative importance of different climate drivers in shaping those patterns. The framework shifts from a purely data-partitioning paradigm to one that integrates explainable AI, significantly enhancing the understanding of how climatic variability governs regional drought dynamics.
This study introduces a pioneering multi-method framework that transcends conventional drought analysis by integrating trend detection, climate-drought interactions, and an interpretable Machine Learning (ML)-based clustering approach. Unlike traditional methodologies, which often rely on linear assumptions and overlook seasonal complexities, this approach employs the Seasonal Kendall test to capture nuanced hydrological trends, cross-correlation analysis to identify dominant climate drivers, and an innovative SHAP-driven clustering technique to reveal the underlying mechanisms governing spatial drought variability. By quantifying the contribution of individual climatic variables, this framework advances beyond conventional classification techniques, offering an unprecedented level of transparency and interpretability. These methodological advancements not only refine the characterization of drought dynamics in the Sahel but also provide a robust foundation for data-driven climate adaptation strategies, enabling more precise risk assessment and sustainable water resource management in vulnerable regions.
2.1 Study Area and Dataset
The Sahel (Fig. 1) is a vast semi-arid region in Africa, extending across the continent from the Atlantic Ocean in the west to the Red Sea in the east. It forms a transitional zone between the arid Sahara Desert to the north and the more humid savannas to the south. Geographically, the Sahel spans parts of the main African Basins, including Senegal, Niger, Volta, Lake Chad and Nile rivers. Its topography is characterized by flat plains interspersed with rocky outcrops, dunes, and seasonal river systems. Morphologically, the Sahel is marked by sparse vegetation, dominated by drought-resistant grasses, shrubs, and scattered trees, which are adapted to its harsh conditions. Soil types vary but are generally sandy and nutrient-poor, further constraining agricultural productivity. The climate of the Sahel is hot and dry, with a short and highly variable rainy season, typically lasting from June to September. Annual rainfall ranges between 100 and 600 mm, decreasing from south to north. The region is highly susceptible to prolonged droughts and erratic rainfall patterns, exacerbated by climate change. These conditions have profound impacts on water availability, agriculture, and the livelihoods of the predominantly rural population, making the Sahel one of the most vulnerable regions to climatic and environmental stressors.
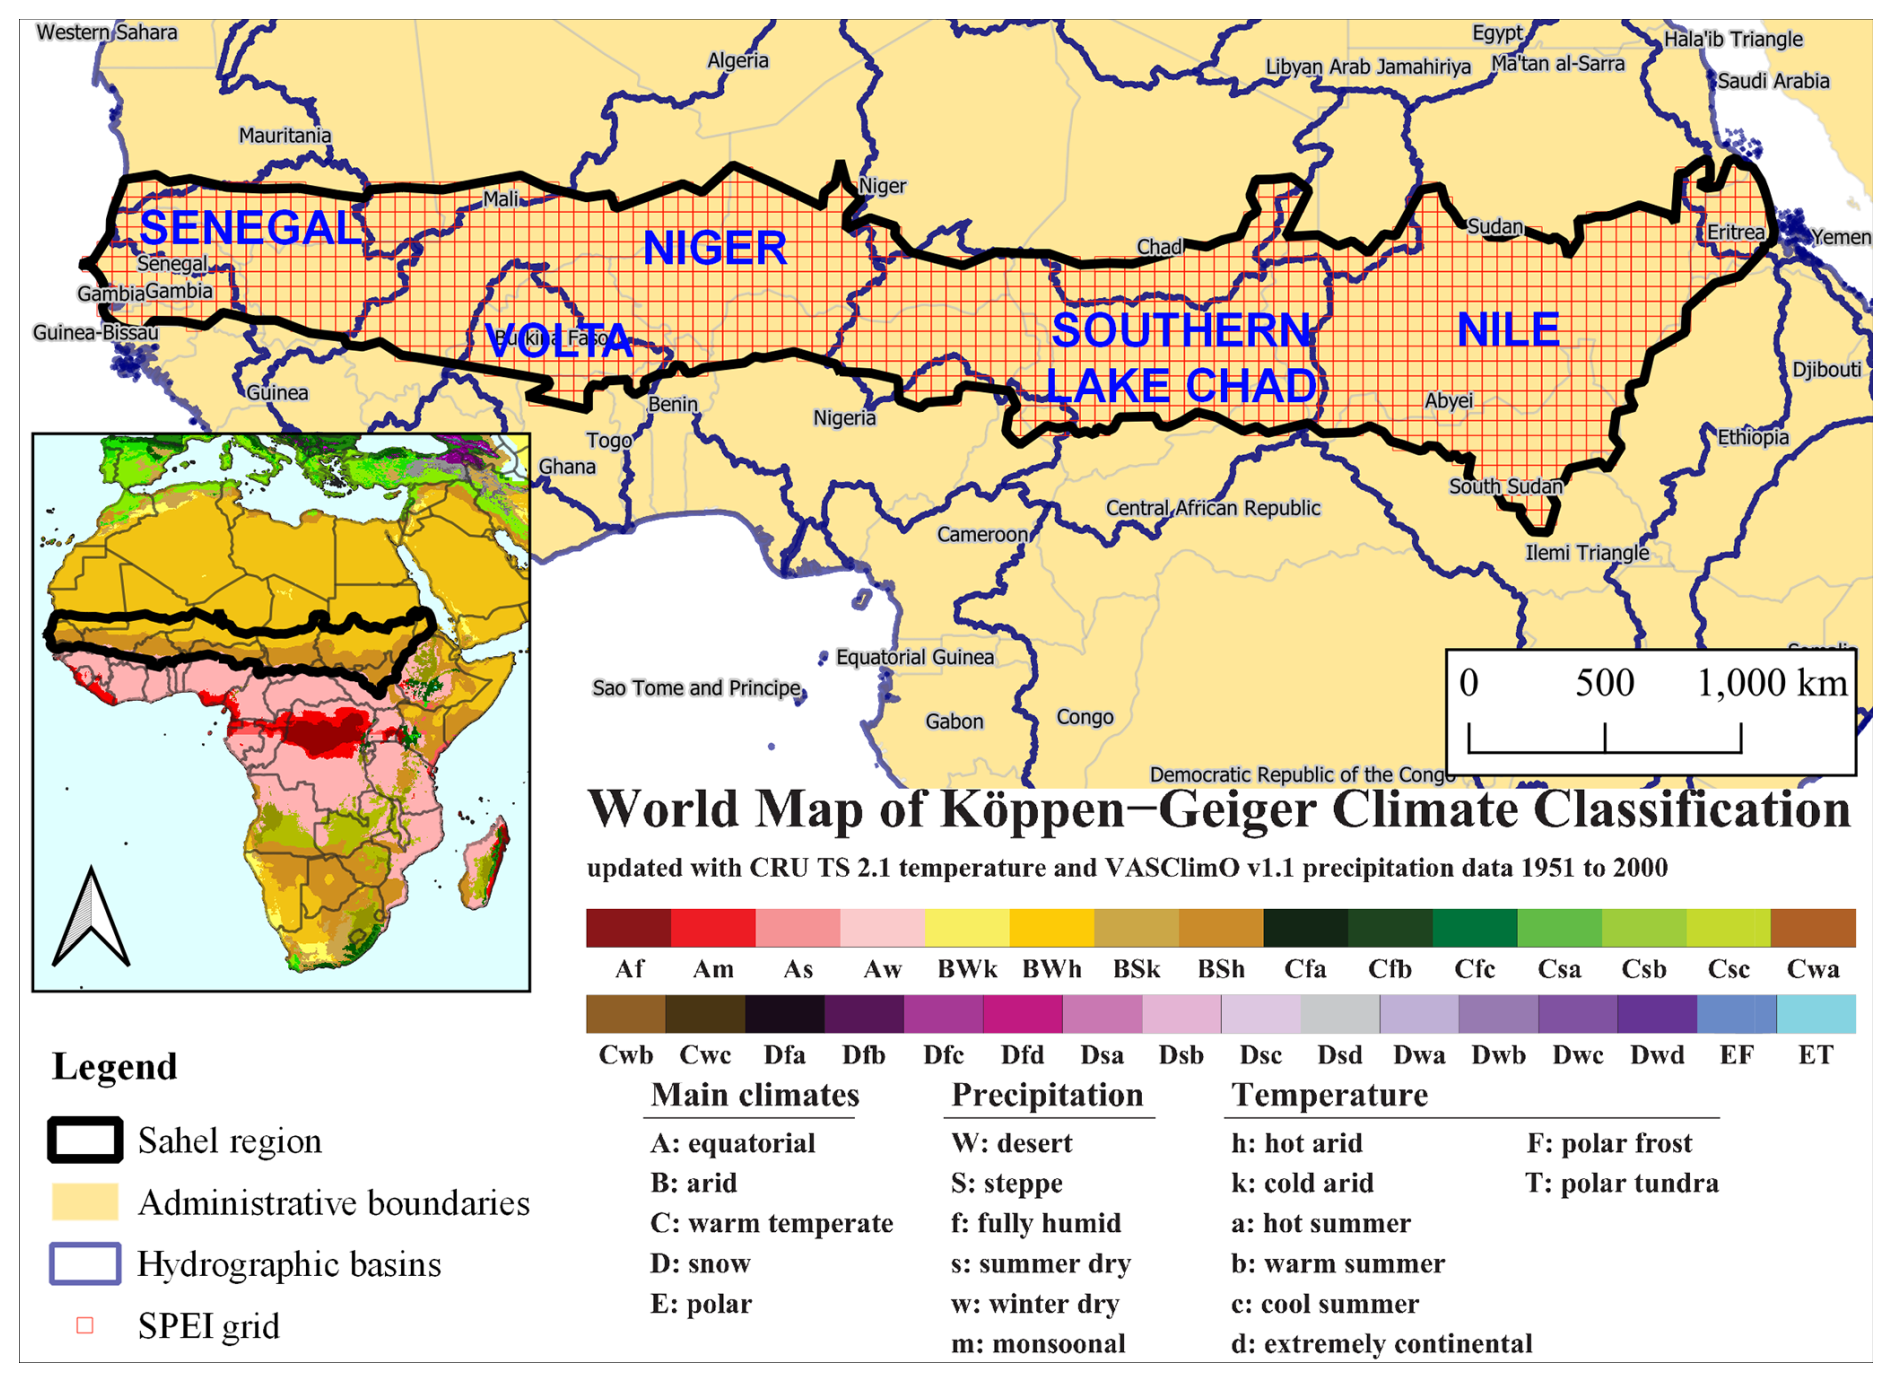
Figure 1Location of the selected SPEI grid in the Sahel region with the Köppen-Geiger Climate Classification.
For this study, the SPEI gridded data from the Global SPEI Database (GSD) were utilized (details at https://spei.csic.es/, last access: 3 November 2025). The GSD provides global coverage of SPEI data for the period from January 1901–December 2023, with a spatial resolution of 0.5° and time scales ranging from 1–48 months. The spatial resolution of the GSD has been shown to be suitable for accurate drought analyses in regions with diverse climates, including the Northeastern United States (Krakauer et al., 2019), Iran (Roushangar and Ghasempour, 2021), Somalia (Musei et al., 2021), Turkey (Danandeh Mehr and Attar, 2021), Southwest China (Sun et al., 2022), India (Vishwakarma et al., 2022), and Southern Italy (Di Nunno and Granata, 2023). This makes the GSD a valuable tool for studying drought in areas with limited or incomplete weather data. Figure 1 illustrates the study area and the 1335 SPEI gridded data points covering the Sahel region. The SPEI is advantageous as it incorporates the effects of evapotranspiration on drought severity. Specifically, it is based on the climatic water balance between precipitation (P) and potential evapotranspiration (ETp). In the dataset used, ETp was computed using the well-established FAO-56 Penman–Monteith equation (Allen et al., 1998).
The SPEI can be calculated at various time scales, capturing both short- and long-term drought effects. For agricultural drought monitoring, 3 or 6 month scales are commonly used, whereas scales of 12 months or longer are applied for hydrological droughts (Tan et al., 2015). In this study, a 12 month time scale (SPEI-12) was used. The choice of the 12 month timescale in this analysis is grounded in the need to capture both seasonal and inter-annual variations in the Sahel's climate system, which are essential for understanding drought dynamics and water availability. The Sahel, characterized by a highly variable climate, experiences significant shifts between wet and dry periods. The 12 month timescale is particularly well-suited to account for these fluctuations, as it integrates both the seasonal rainfall patterns (which typically occur during the rainy season) and the cumulative effect of evapotranspiration, offering a more comprehensive measure of drought conditions over a yearly cycle. Based on SPEI values, drought or wetness severity is classified from extreme drought () to extremely wet conditions (SPEI>2).
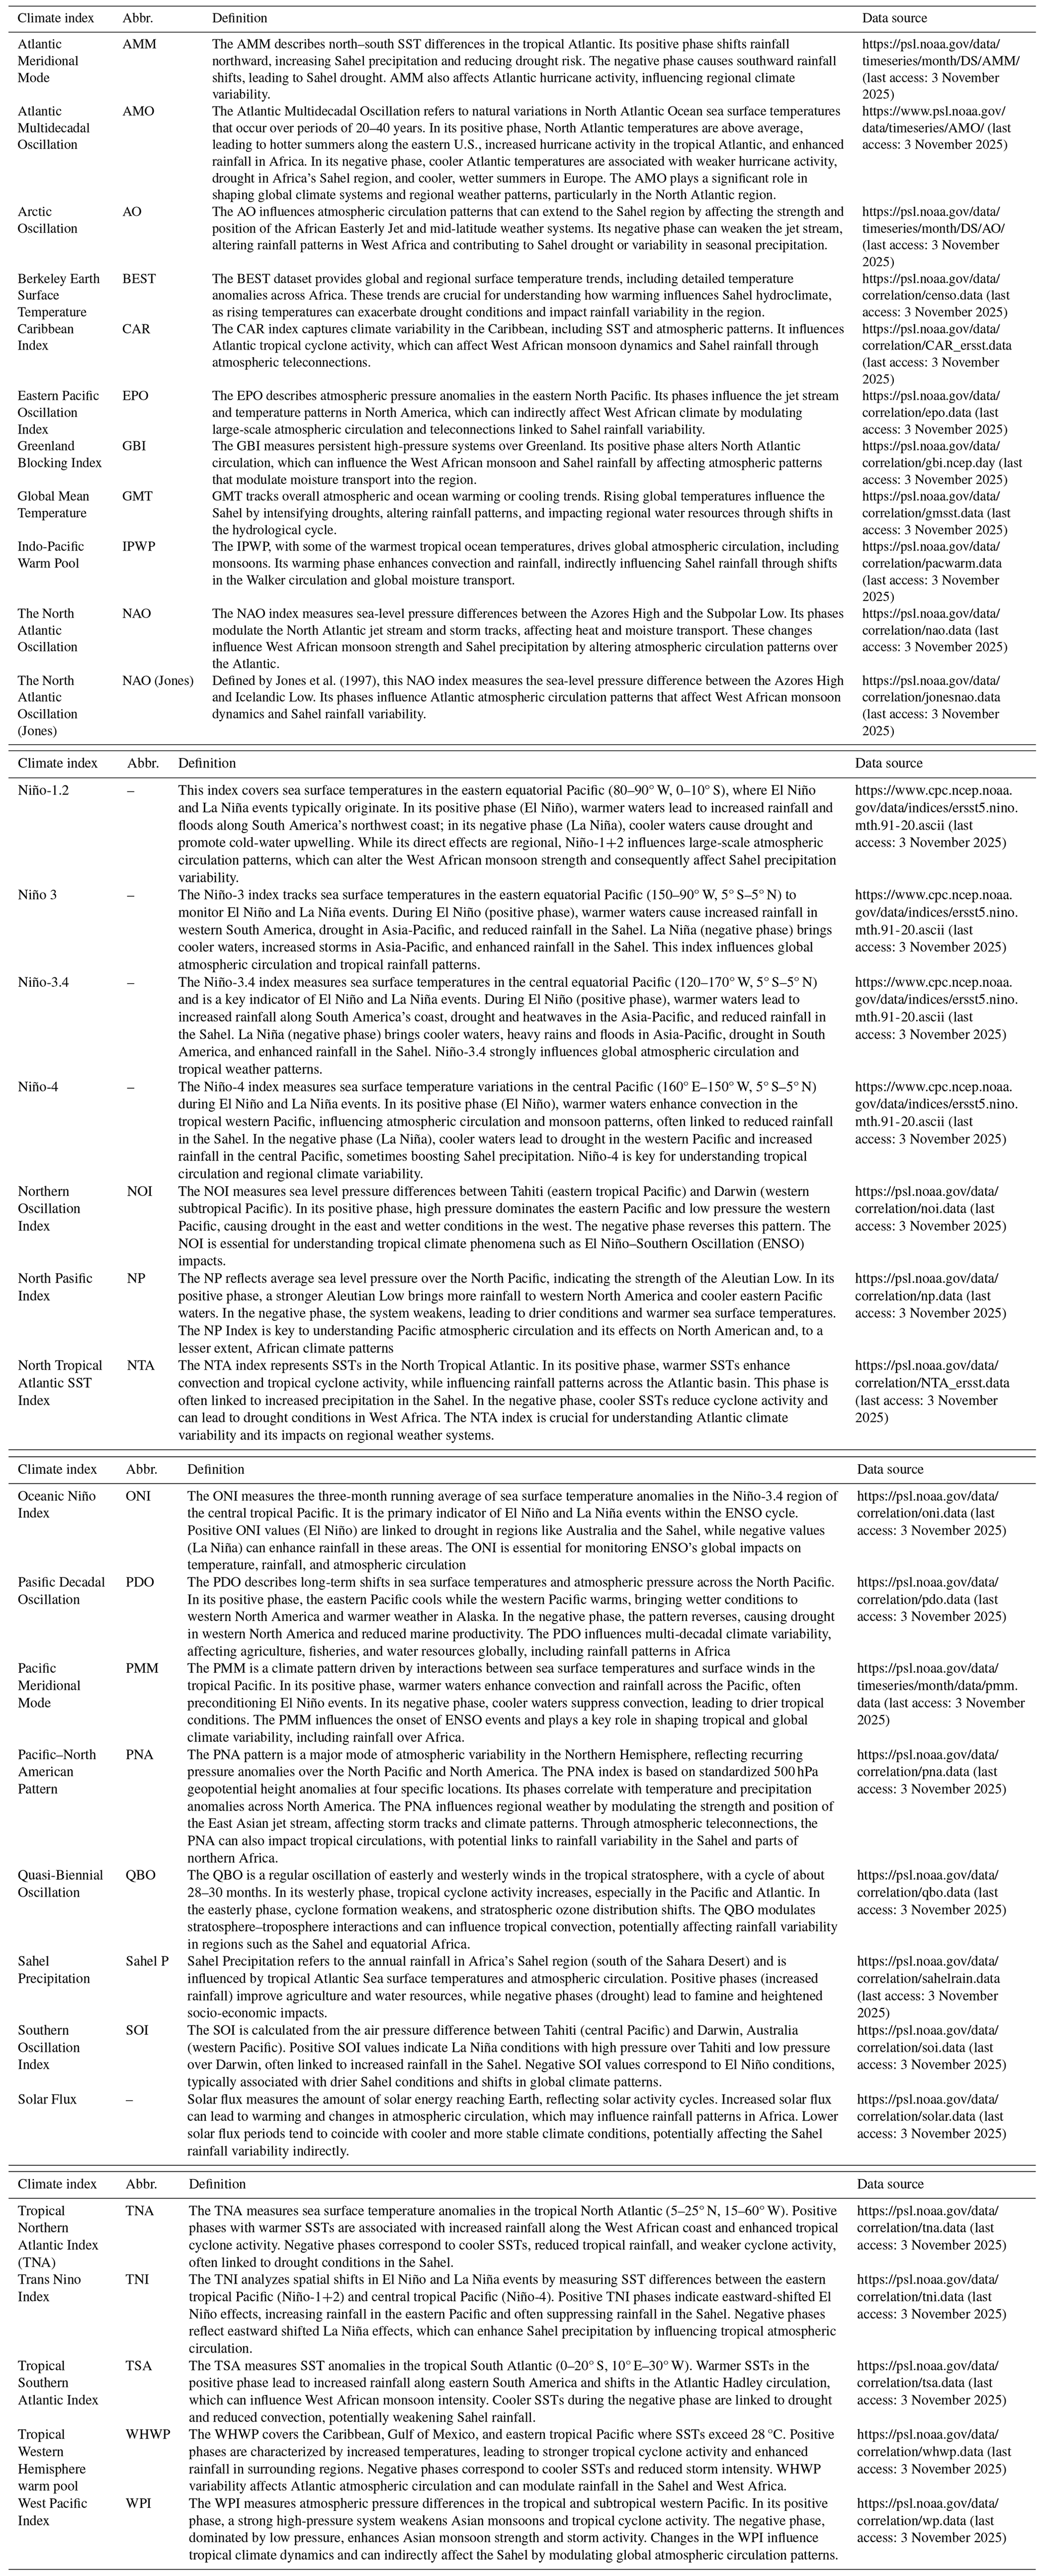
Drought assessment in the Sahel is complicated by the complex, nonlinear, and dynamic nature of atmospheric processes, which challenge the accurate representation of spatial–temporal patterns, multi-scale interactions, and the influence of extreme events and topographic variability. To address these complexities, this study incorporates time series of various climate indices into the modeling framework.
In this context, climate indices refer to large-scale indicators of atmospheric and oceanic variability derived from standardized measurements such as sea surface temperature (SST), sea-level pressure, and wind anomalies over specific regions. Examples include the AMO, GMT and North Atlantic Oscillation (NAO). Unlike drought indicators such as SPEI, which quantify regional hydroclimatic conditions, climate indices capture broader patterns of variability that serve as external drivers of local drought dynamics.
These indices offer critical insights into the mechanisms regulating regional drought variability. For instance, warm phases of the AMO are associated with increased rainfall in the Sahel, whereas El Niño events often lead to drier conditions (Okonkwo, 2014). The 12 month SPEI timescale was selected to reflect both seasonal and interannual climate variability, enabling the detection of annual hydrological responses to the prevailing phases of large-scale climate drivers. While some indices, such as the AMO, operate on multidecadal timescales, their current phase can still exert influence on precipitation patterns within a given year. Thus, the 12 month period is not intended to resolve long-term climate variability itself, but rather to integrate its effects as expressed in a single year's climate system. This timescale effectively captures the cumulative influence of slow-acting processes such as oceanic and atmospheric anomalies, allowing SPEI to reflect integrated climate impacts on precipitation and evapotranspiration. As a result, the use of climate indices alongside long-term SPEI enhances the ability to identify meaningful correlations, detect persistent drought trends, and better understand the climatic forces shaping drought conditions in the region.
Although the analysis incorporated 31 climate indices, the historical period from 1951–2018 was deemed appropriate for this study. This timeframe balances the need for a sufficiently long record to capture long-term climatic variability with the availability of consistent and overlapping data for a large set of indices. While the inclusion of many indices can pose challenges – such as reduced temporal overlap, increased multicollinearity, and potential noise in statistical relationships – the 1951–2018 period provided a common baseline that ensured temporal consistency across most indices. As a result, it was possible to conduct a robust analysis of long-term climate-drought relationships while minimizing data limitations associated with differing index availability.
Table 1 summarizes the climate indices considered, emphasizing their relevance to drought variability. In the context of SPEI analysis, these indices are crucial for understanding temporal patterns and variations.
2.2 Modeling procedure
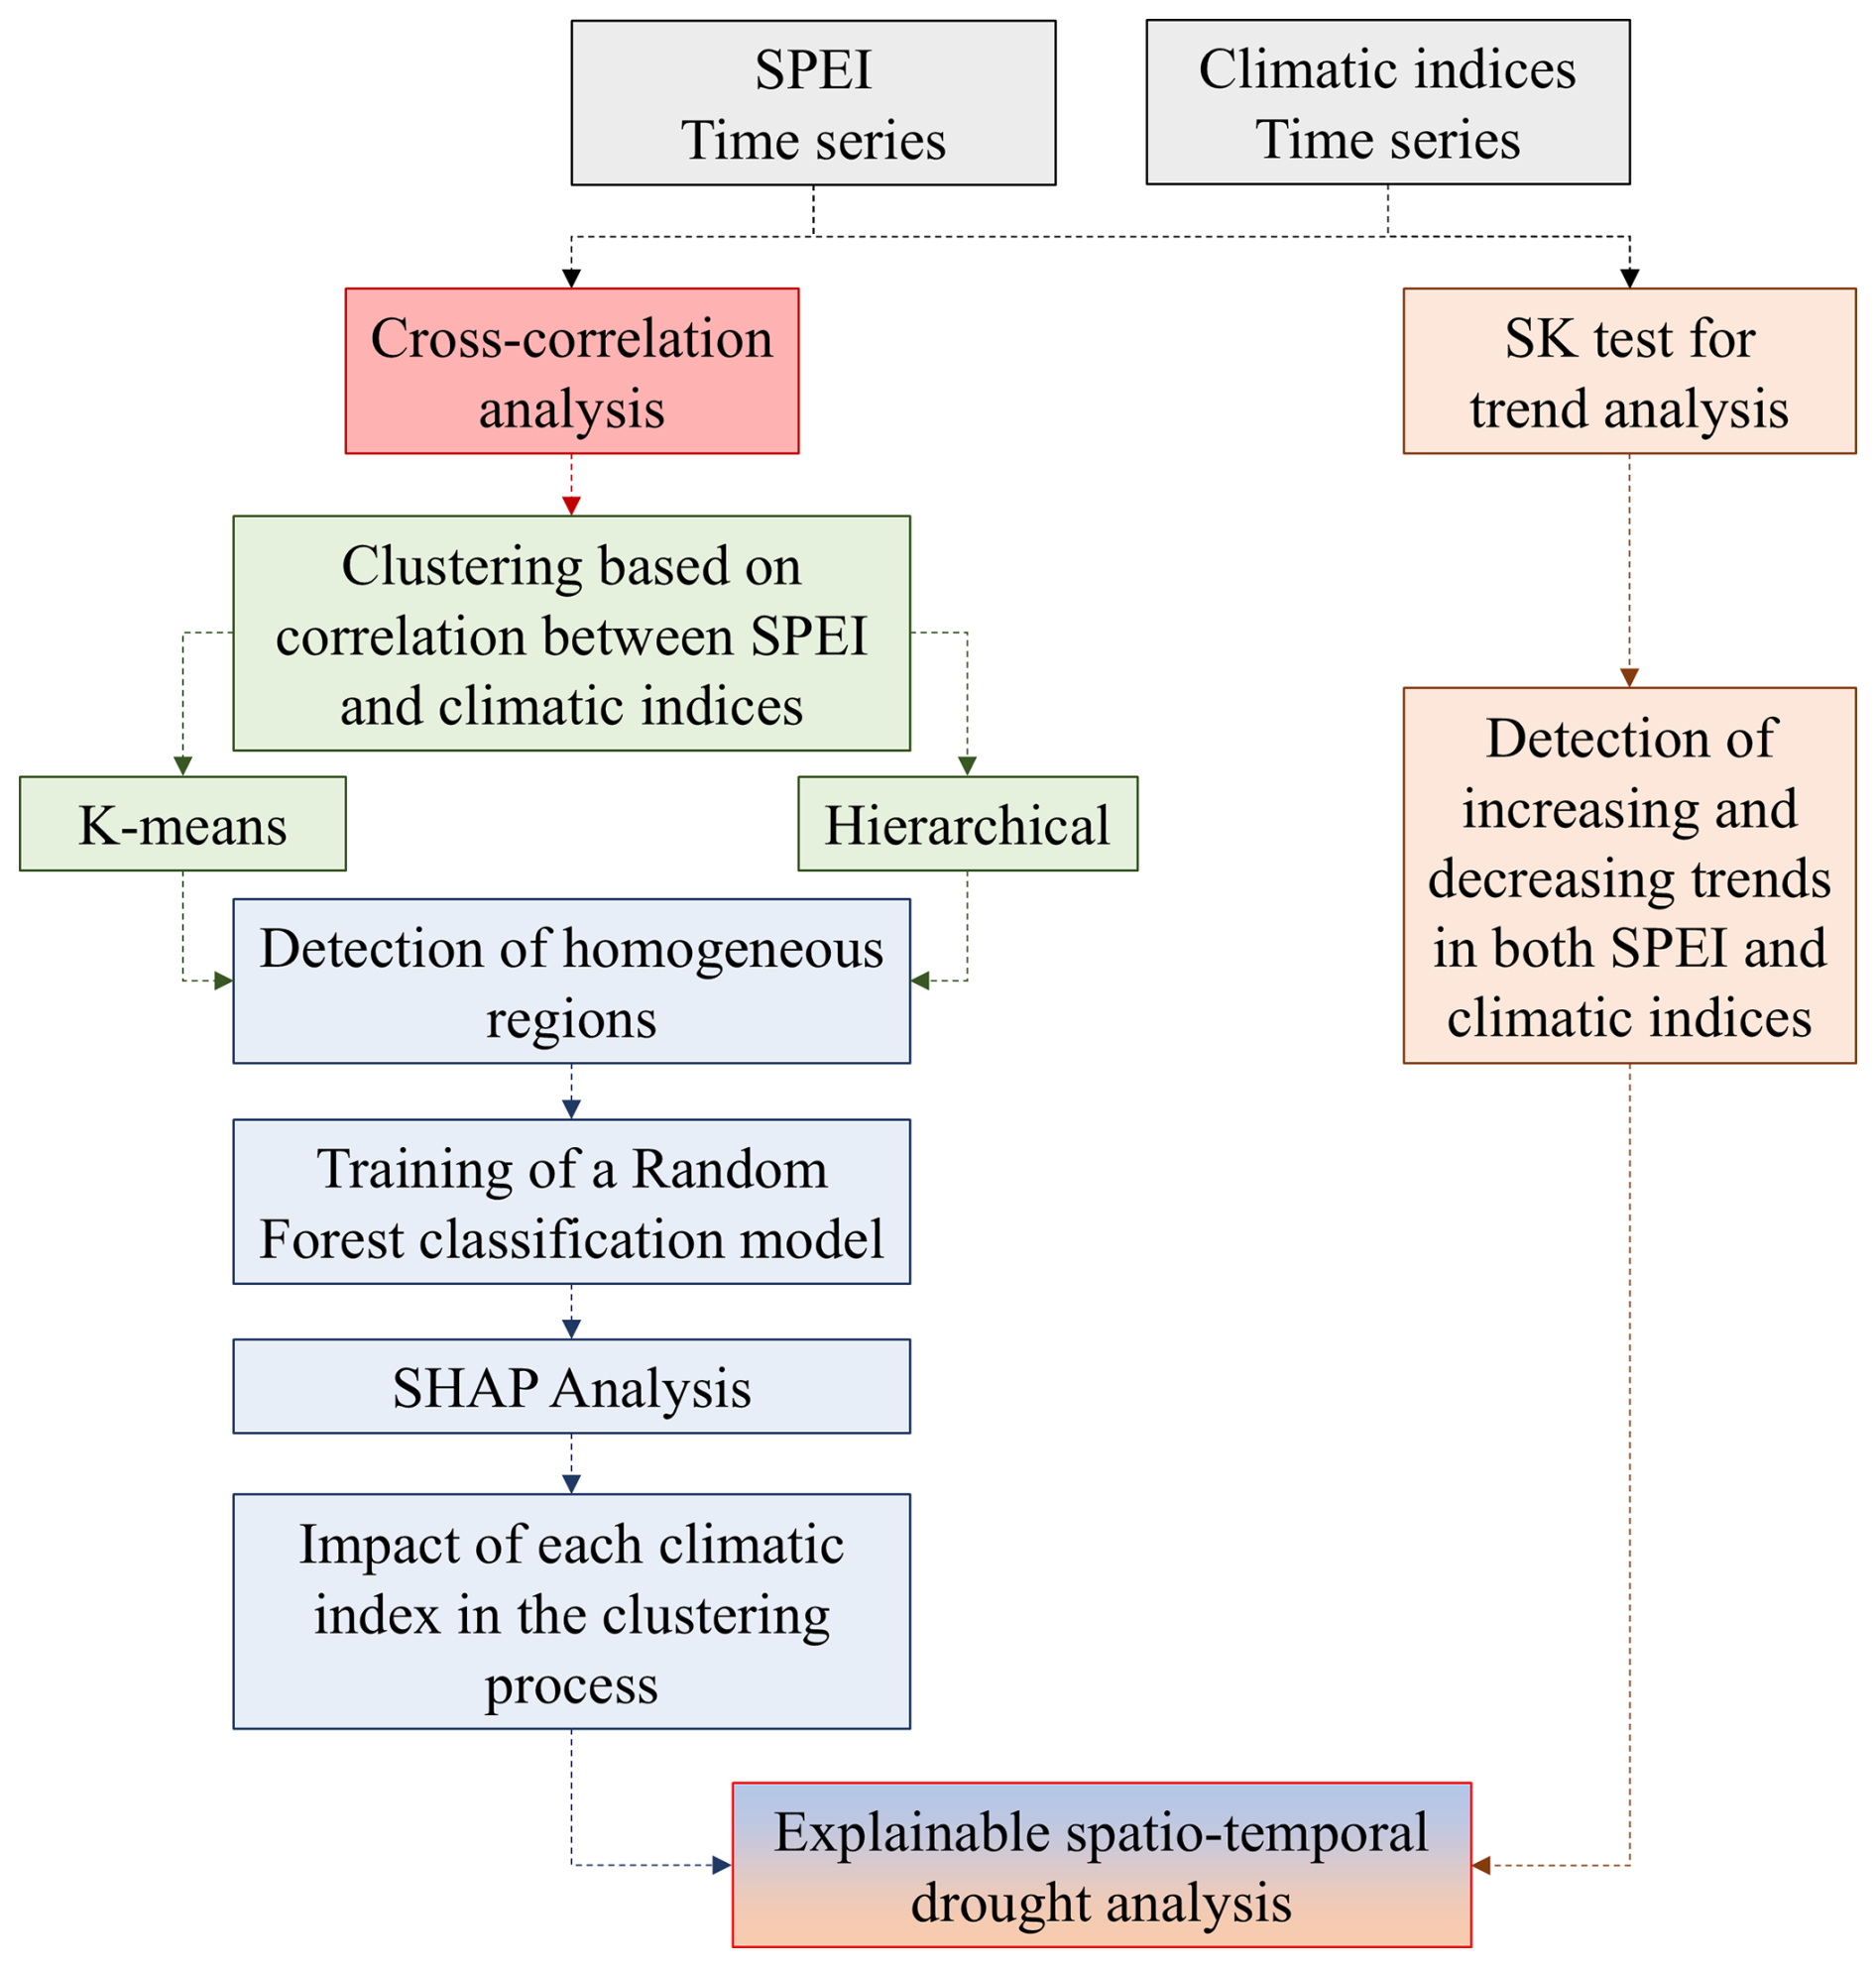
To better understand the complex dynamics of drought fluctuations, this study adopted a comprehensive analytical framework that incorporated the SK test, along with correlation and clustering analyses (Fig. 2). The SK test was selected due to its ability to account for seasonal variations in SPEI and climatic indices time series, addressing the shortcomings of conventional methods like the MK test, which often fail to consider the seasonality inherent in groundwater dynamics. In the case of SPEI, a negative Z-value obtained from the SK test signals a decline typically linked to drought conditions, whereas a positive Z-value indicates an increase often associated with wetter climatic scenarios. In this study, the SK test was conducted with a strict 95 % confidence level (p-value≤0.05) to enhance the reliability of the identified trends. For further details, refer to the foundational works of Hirsch and Slack (1984) and a recent application by Di Nunno et al. (2023).
Then, to gain a deeper understanding of how climatic indices influence drought conditions, this study analyzed the correlation between SPEI and various climatic indices. This analysis is crucial because climatic indices play a significant role in shaping drought dynamics. By examining these relationships, it becomes possible to identify the key drivers behind drought variability and their relative contributions over time. Such insights are essential not only for advancing scientific knowledge but also for informing targeted mitigation and adaptation strategies, particularly in regions where hydrological cycles are highly sensitive to climatic fluctuations.
Furthermore, by focusing on the climatic indices most strongly correlated with the SPEI, a clustering analysis was performed to divide the Sahel into homogeneous regions based on the correlation between SPEI and these climatic indices. This approach is entirely innovative, as it allows for the identification of distinct zones where specific climatic factors have a pronounced influence on drought dynamics. By delineating these homogeneous regions, this methodology provides valuable insights into localized drought drivers and their variability across the Sahel.
In general, clustering is the process of classifying a large dataset into a smaller number of groups, or clusters. Data within the same cluster shares common features, while data from different clusters exhibit some degree of heterogeneity (Barton et al., 2016). In this study, two widely recognized clustering algorithms, K-means and Hierarchical clustering, were preliminarily tested to divide the study area into homogeneous regions with shared characteristics. These algorithms have been previously applied in drought analyses to identify such regions. A detailed description of both algorithms can be found in the work of Di Nunno and Granata (2023).
It is important to note that the optimal clustering algorithm and the number of clusters are not predetermined. To address this, the Silhouette technique was applied. This widely recognized method is used for interpreting and validating the consistency of clustering results, offering a measure of how well an object fits within its assigned cluster compared to other clusters (Shutaywi and Kachouie, 2021). The Silhouette score ranges from −1, indicating that clusters are poorly assigned, to 1, signifying well-separated and distinct clusters. A score close to 0 suggests that the separation between clusters is negligible or ambiguous.
However, this criterion does not allow for a clear assessment of the impact of each climatic index on the clustering process. To enhance the interpretability of clustering analyses in hydrological studies, particularly concerning drought patterns, this study integrates SHAP (values with RF models). This approach addresses the limitations of traditional clustering methods, which often lack explanatory power regarding the influence of individual climatic variables on cluster formation.
SHAP, grounded in cooperative game theory, assigns each feature an important value for a particular prediction, offering a unified measure of feature influence across the model. In this study, SHAP values are employed to interpret the output of an RF classifier trained to predict cluster assignments based on climatic indices (Lundberg and Lee, 2017). The process involves:
-
Model Training: An RF classifier is trained using climatic indices as input features and the cluster labels (obtained from initial clustering analyses) as the target variable.
-
SHAP Value Computation: Post-training, SHAP values are computed for each feature, quantifying the contribution of each climatic index to the model's prediction for each data point. This computation considers all possible combinations of features, ensuring a fair distribution of importance among them.
-
Interpretation: The resulting SHAP values provide insights into how each climatic index influences the assignment of data points to specific clusters. Positive SHAP values indicate a feature's positive contribution to predicting a particular cluster, while negative values suggest a negative contribution.
By employing this SHAP-driven approach, the study transforms clustering from a purely statistical exercise into an interpretable framework that reveals the underlying climatic drivers of drought patterns. This enhanced interpretability facilitates more informed decision-making and targeted adaptation strategies, especially in regions like the Sahel, where drought dynamics are influenced by complex interactions among multiple climatic factors.
This methodology aligns with recent advancements in explainable AI, where SHAP values have been utilized to enhance the interpretability of clustering analyses in various domains (Cohen et al., 2024). By integrating SHAP with RF models, the study not only identifies homogeneous drought regions but also elucidates the specific climatic variables driving these patterns, thereby contributing to more effective drought mitigation and resource management strategies.
3.1 Trend analysis
The SK test analyzed SPEI-12 trends across the Sahel, highlighting patterns of drought and wetness (Fig. 3a). Results showed that Z-values between −1.96 and 1.96 indicate no significant trends at the 95 % confidence level, while values outside this range denote statistically significant trends. Furthermore, Z-values between −2.58 and 2.58 indicate no significant trends at the 99 % confidence level, with values beyond this range reflecting highly significant trends. Significant trends were identified in various regions. Specifically, 57.5 % of the cells exhibited statistically significant decreasing trends (), while 19.3 % showed statistically significant increasing trends (Z>1.96). The remaining 23.2 % displayed increasing or decreasing trends that were not statistically significant (Z between ±1.96). Statistically significant decreasing trends were observed in the western Sahel, spanning from Senegal's Atlantic Coast and Gambia to Mali, as well as in the southeastern region, including South Sudan. Another area experiencing marked increases in drought is the northern-central Sahel, particularly in Chad. These findings should be potentially linked to reduced rainfall and rising temperatures. On the other hand, the Sahel region between Burkina Faso and Nigeria exhibited increasing SPEI-12 trends, indicating a tendency toward wetter conditions. These wetter tendencies highlight the heterogeneous nature of climatic changes across the Sahel, where some areas may benefit from increased rainfall while others face mounting water stress.
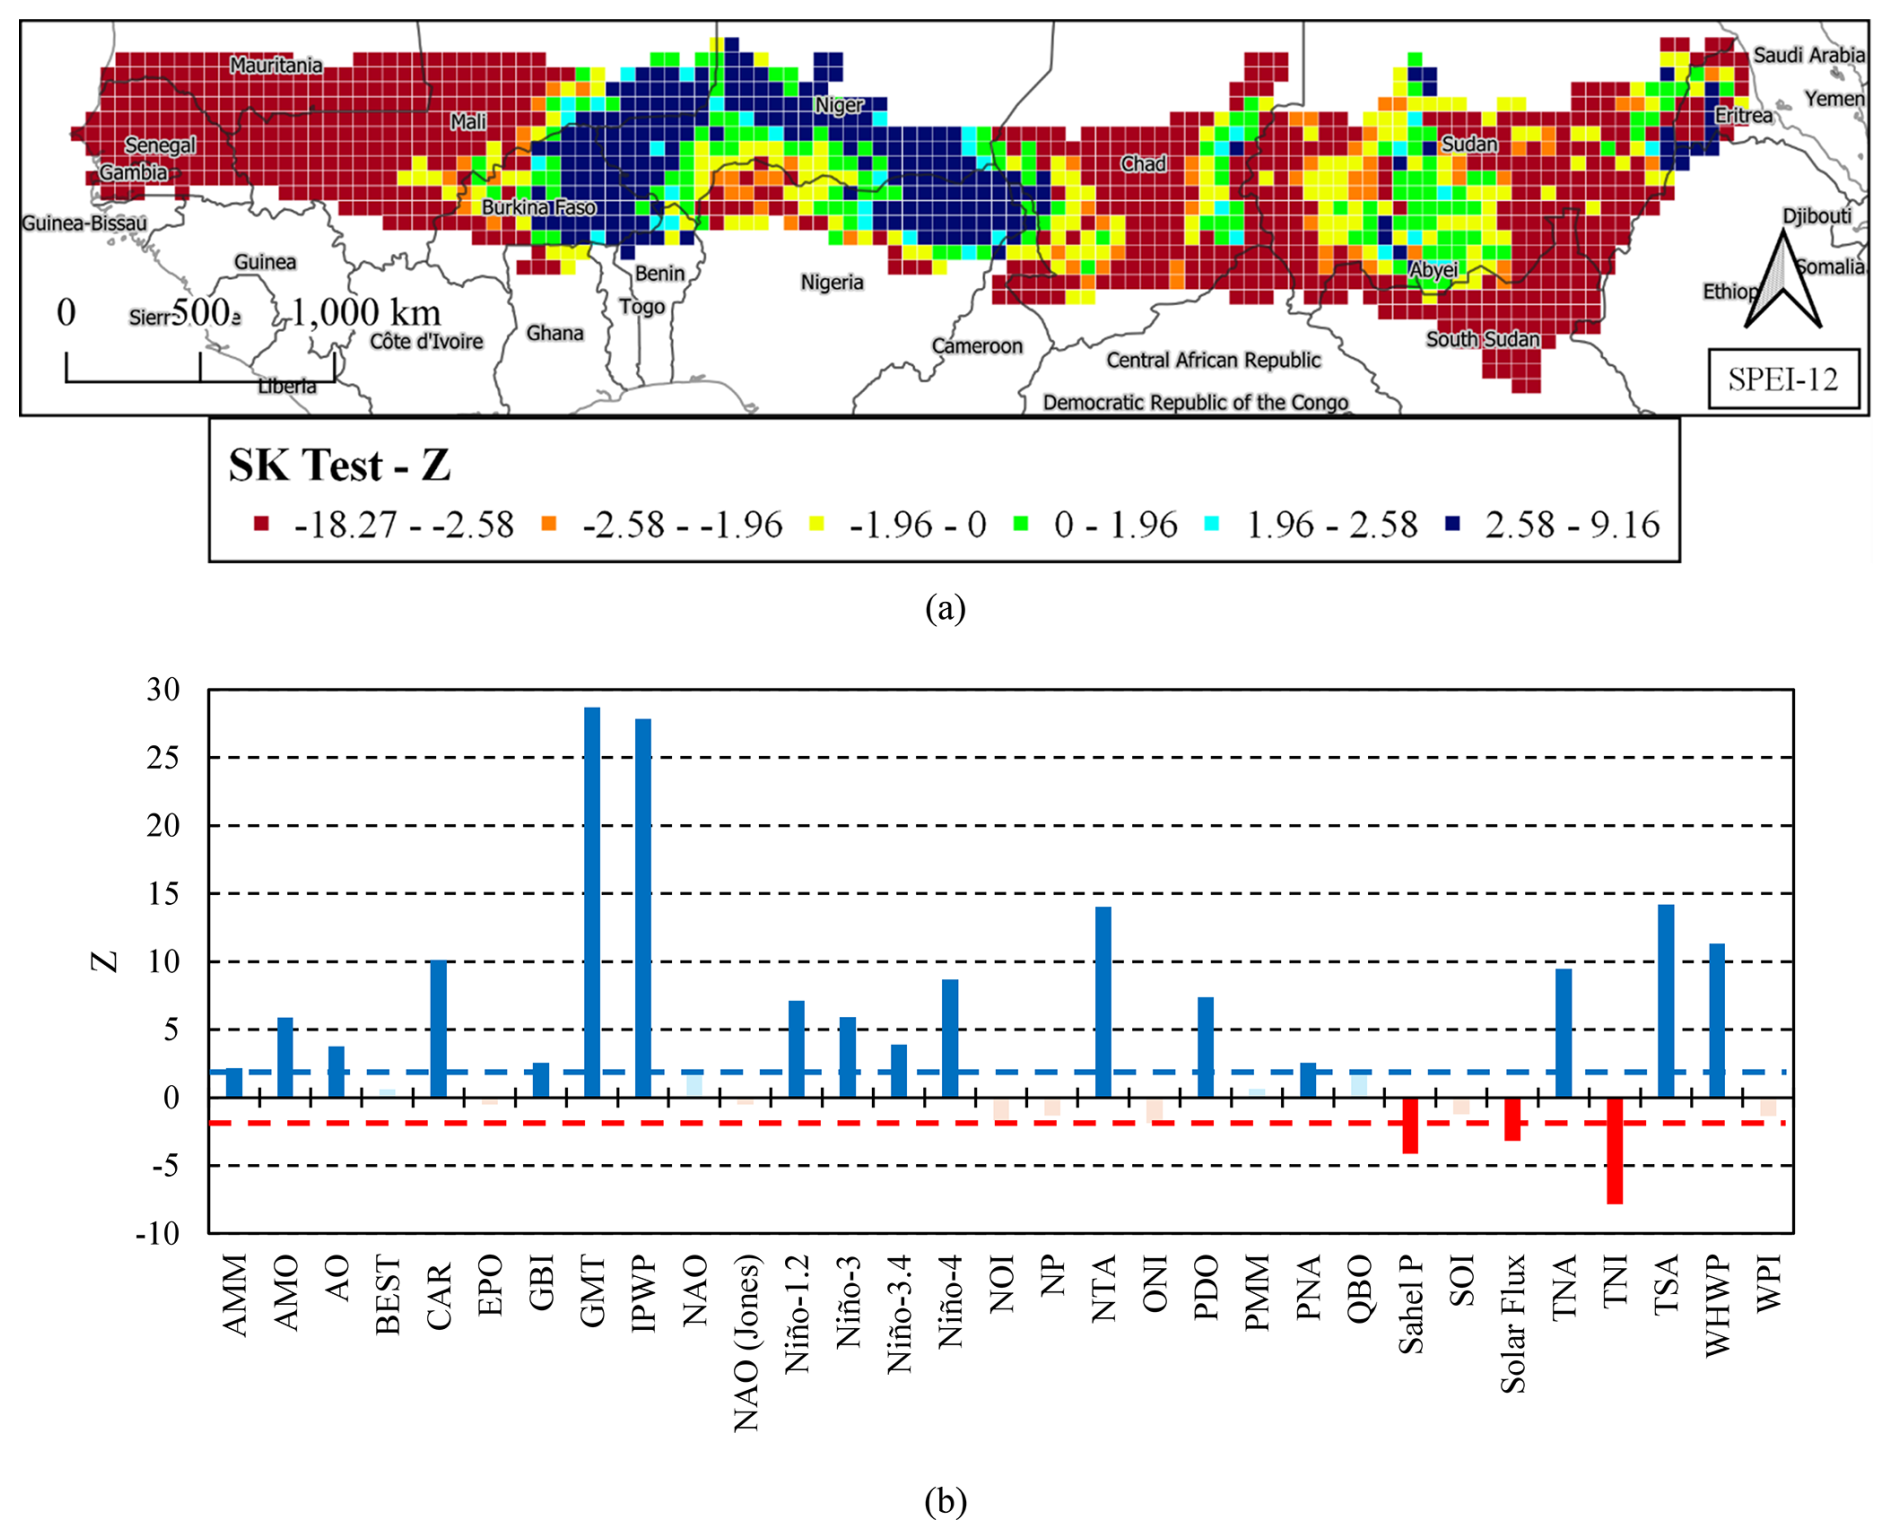
Figure 3Z parameter of the SK test: SPEI-12 map (a); climatic indices, with the blue and red dashed lines that indicate the statistically significant trend ().
The SK test was also performed for the climatic indices (Fig. 3b). The predominance of statistically significant increasing trends, particularly for the IPWP (Z=27.83) and GMT (Z=28.70), underscores the substantial role of global warming and oceanic heat distribution in shaping regional climate dynamics. These upward trends reflect broader increases in sea surface temperatures and global temperature anomalies, which are generally associated with reduced precipitation and enhanced drought conditions in the Sahel due to shifts in atmospheric circulation and moisture availability.
Conversely, statistically significant decreasing trends were observed in three indices: TNI (), Solar Flux (), and Sahel P (), each suggesting mechanisms that contribute to regional drying. The decline in TNI implies a weakening of tropical convection and changes in atmospheric circulation patterns that can reduce moisture transport toward the Sahel. The decrease in Solar Flux may be indicative of increased aerosol concentrations or cloud cover, both of which tend to reduce surface solar radiation, leading to lower evaporation and altered atmospheric dynamics that often result in reduced rainfall. Finally, the negative trend in Sahel P reflects a direct decline in regional precipitation, consistent with the observed intensification and persistence of drought conditions in recent decades.
3.2 Cross-correlation analysis
The cross-correlation analysis between the SPEI-12 and the different climatic indices was conducted to evaluate the influence of large-scale atmospheric and oceanic patterns on drought variability and intensity. This approach enables a deeper understanding of how global phenomena modulate Sahel's regional hydrological extremes.
Figure 4 reports a combined box and violin plots representation of the correlations for all climatic indices, while Fig. 5 provides the maps of correlations between SPEI-12 gridded data and a subset of 12 climatic indices, selected either for their high mean absolute correlations (IPWP, TSA, GMT, PDO, Sahel P, Niño-4, NTA and WHWP) with SPEI-12 or for their distinctive spatial patterns across the Sahel (e.g., AMO, AMM, CAR, TNA). In addition, Tables S1 and S2 in the Supplement report the correlation coefficient and the p-value, respectively, computed between climatic indices. Finally, Table S3 provides the mean, maximum, minimum values, standard deviation of the correlations, and mean of the absolute correlations, calculated between SPEI-12 gridded data and climatic indices.
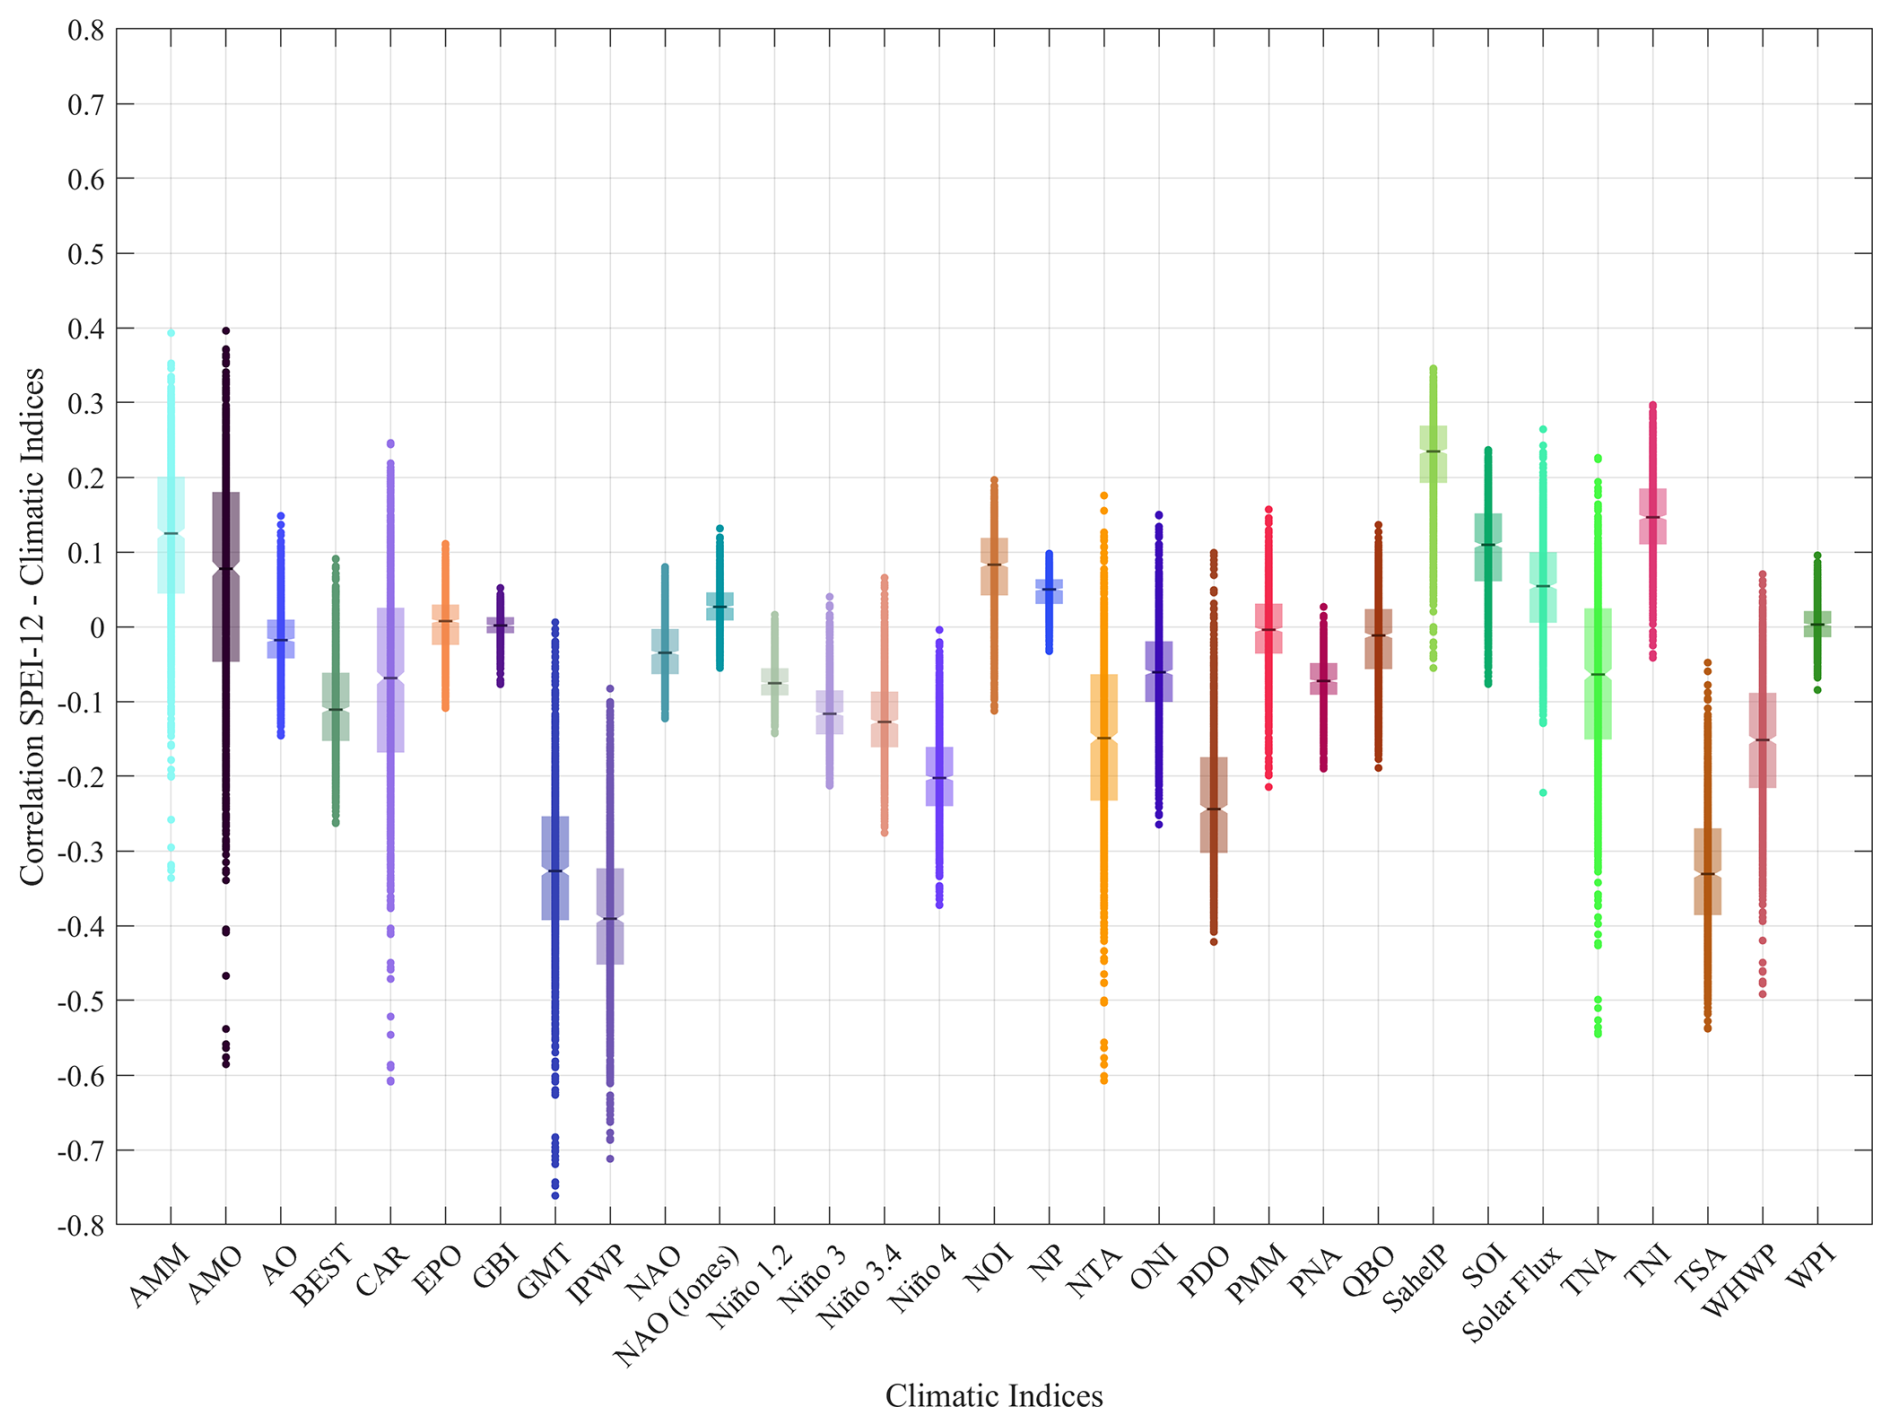
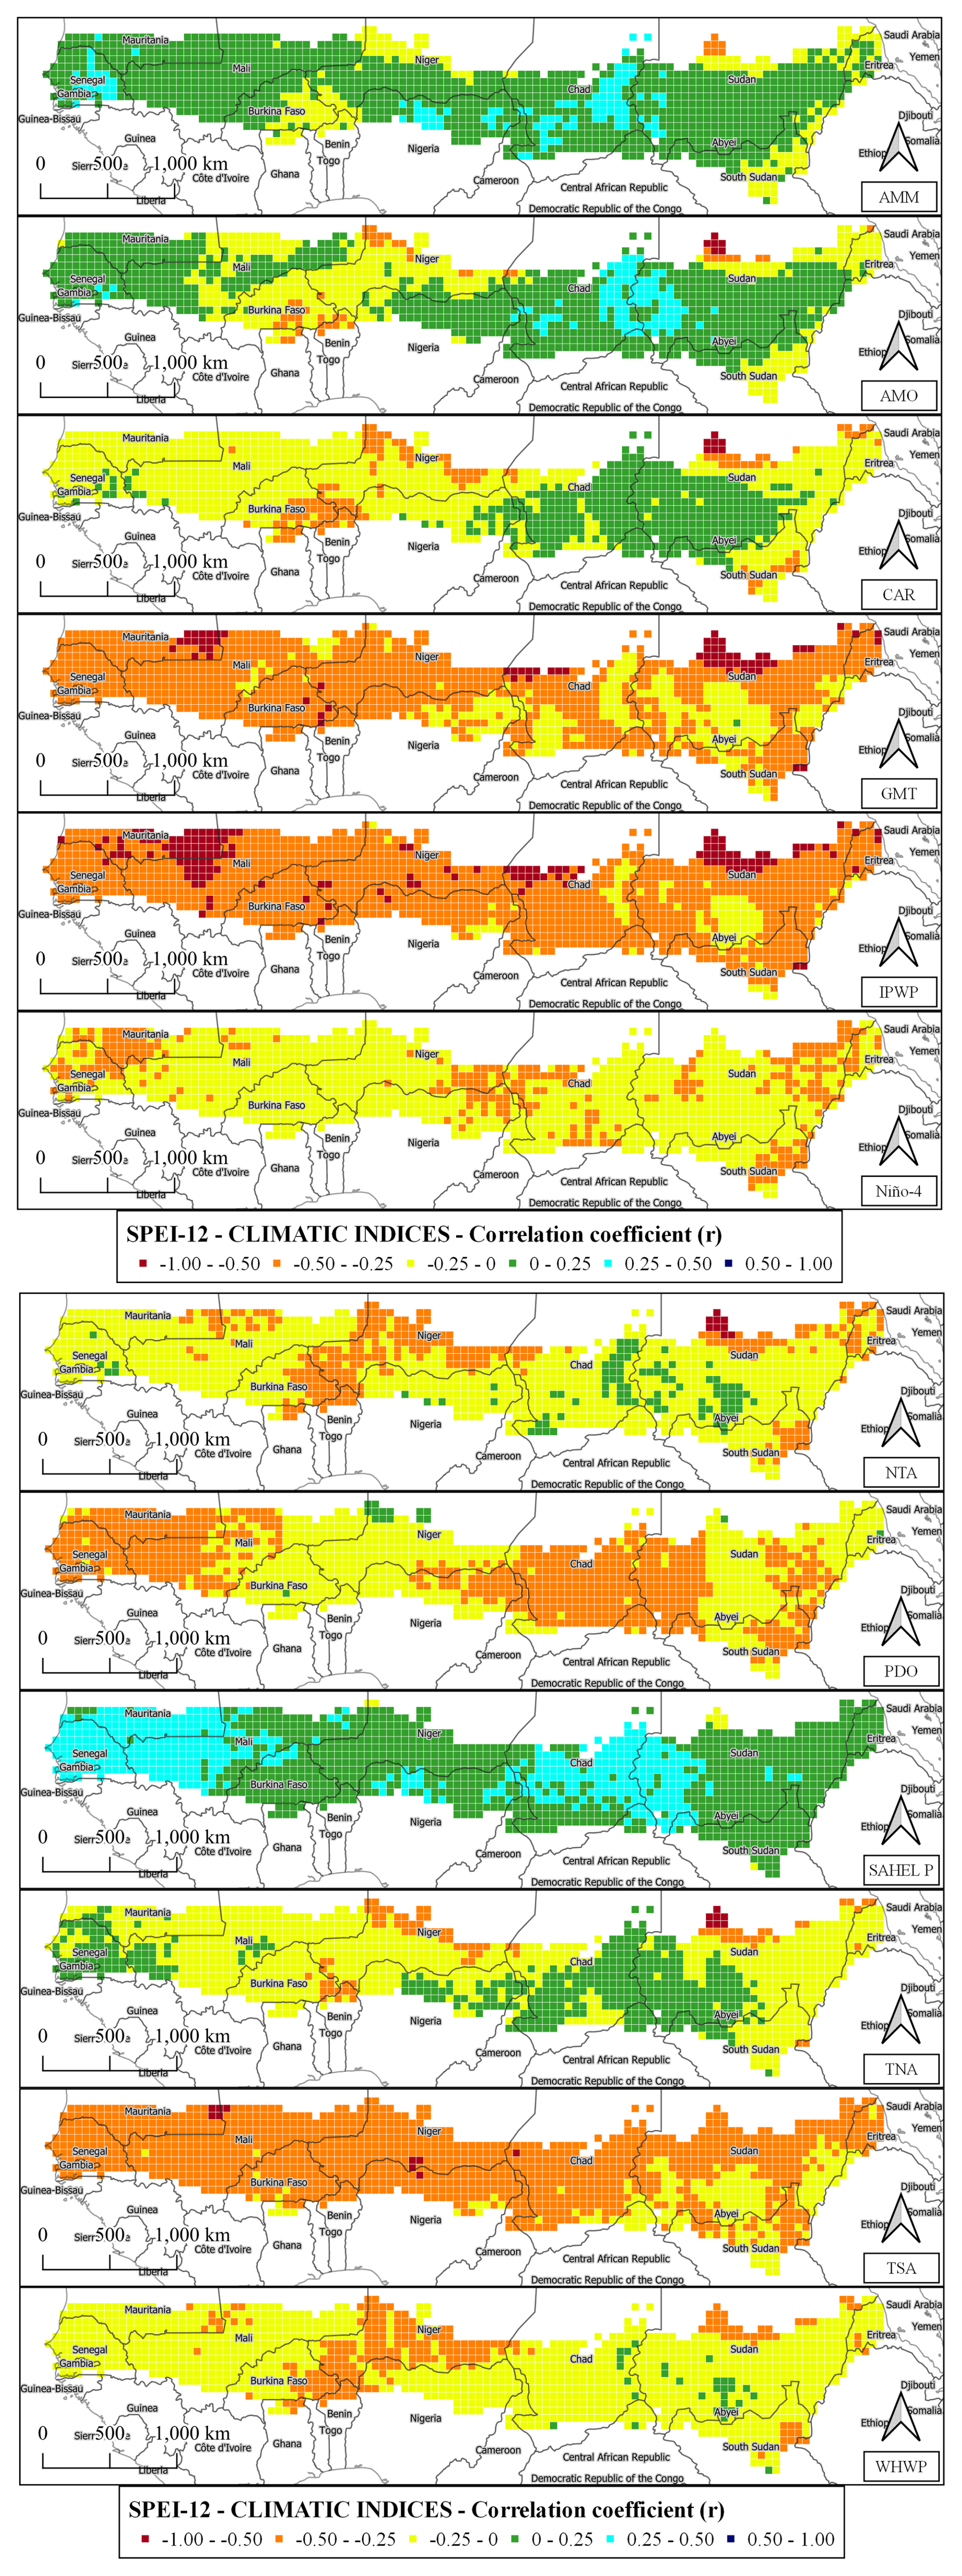
Figure 5Maps of the correlations between SPEI-12 gridded data and a subset of 12 climatic indices.
The cross-correlation analysis between SPEI-12 and various climatic indices for the Sahel region reveals a complex interplay of global atmospheric and oceanic drivers on regional drought variability. The AMM (Interquartile range – IQR=0.16) showed a moderate positive influence, with a mean correlation of 0.12 and peaks reaching 0.39. This suggests that the AMM's modulation of sea surface temperatures in the Atlantic plays a significant role in shaping precipitation patterns in the Sahel. Similarly, the AMO (IQR=0.23) displayed a wide range of correlation values, from , with a modest mean of 0.06. Specifically, the western regions of the Sahel, from Senegal's Atlantic coast to western Mali, exhibited a positive correlation with the SPEI-12. However, the strongest positive correlations were observed in the Sahel region along the border between Chad and Sudan. In contrast, the central-western region, including countries like Burkina Faso and Niger, showed a negative correlation. Figure 6 presents a detailed analysis of the correlation between SPEI-12 for Cell 2042 and the AMO. Among all analyzed locations, Cell 2042, located in the aforementioned border region between Chad and Sudan, exhibited the highest positive correlation with the AMO index. This relationship is reflected in the long-term trends, where both SPEI-12 and AMO remained predominantly positive from the 1950s to the 1970s, turned negative from the 1970s to the late 1990s, and shifted positive again from the late 1990s to the present. This region, significantly affected by the oscillations of the Intertropical Convergence Zone (ITCZ), is characterized by highly seasonal rainfall, primarily governed by the West African Monsoon, and is highly sensitive to fluctuations in sea surface temperatures. The strong correlation with AMO suggests that warmer North Atlantic conditions enhance monsoonal precipitation, while cooler phases contribute to drought conditions.
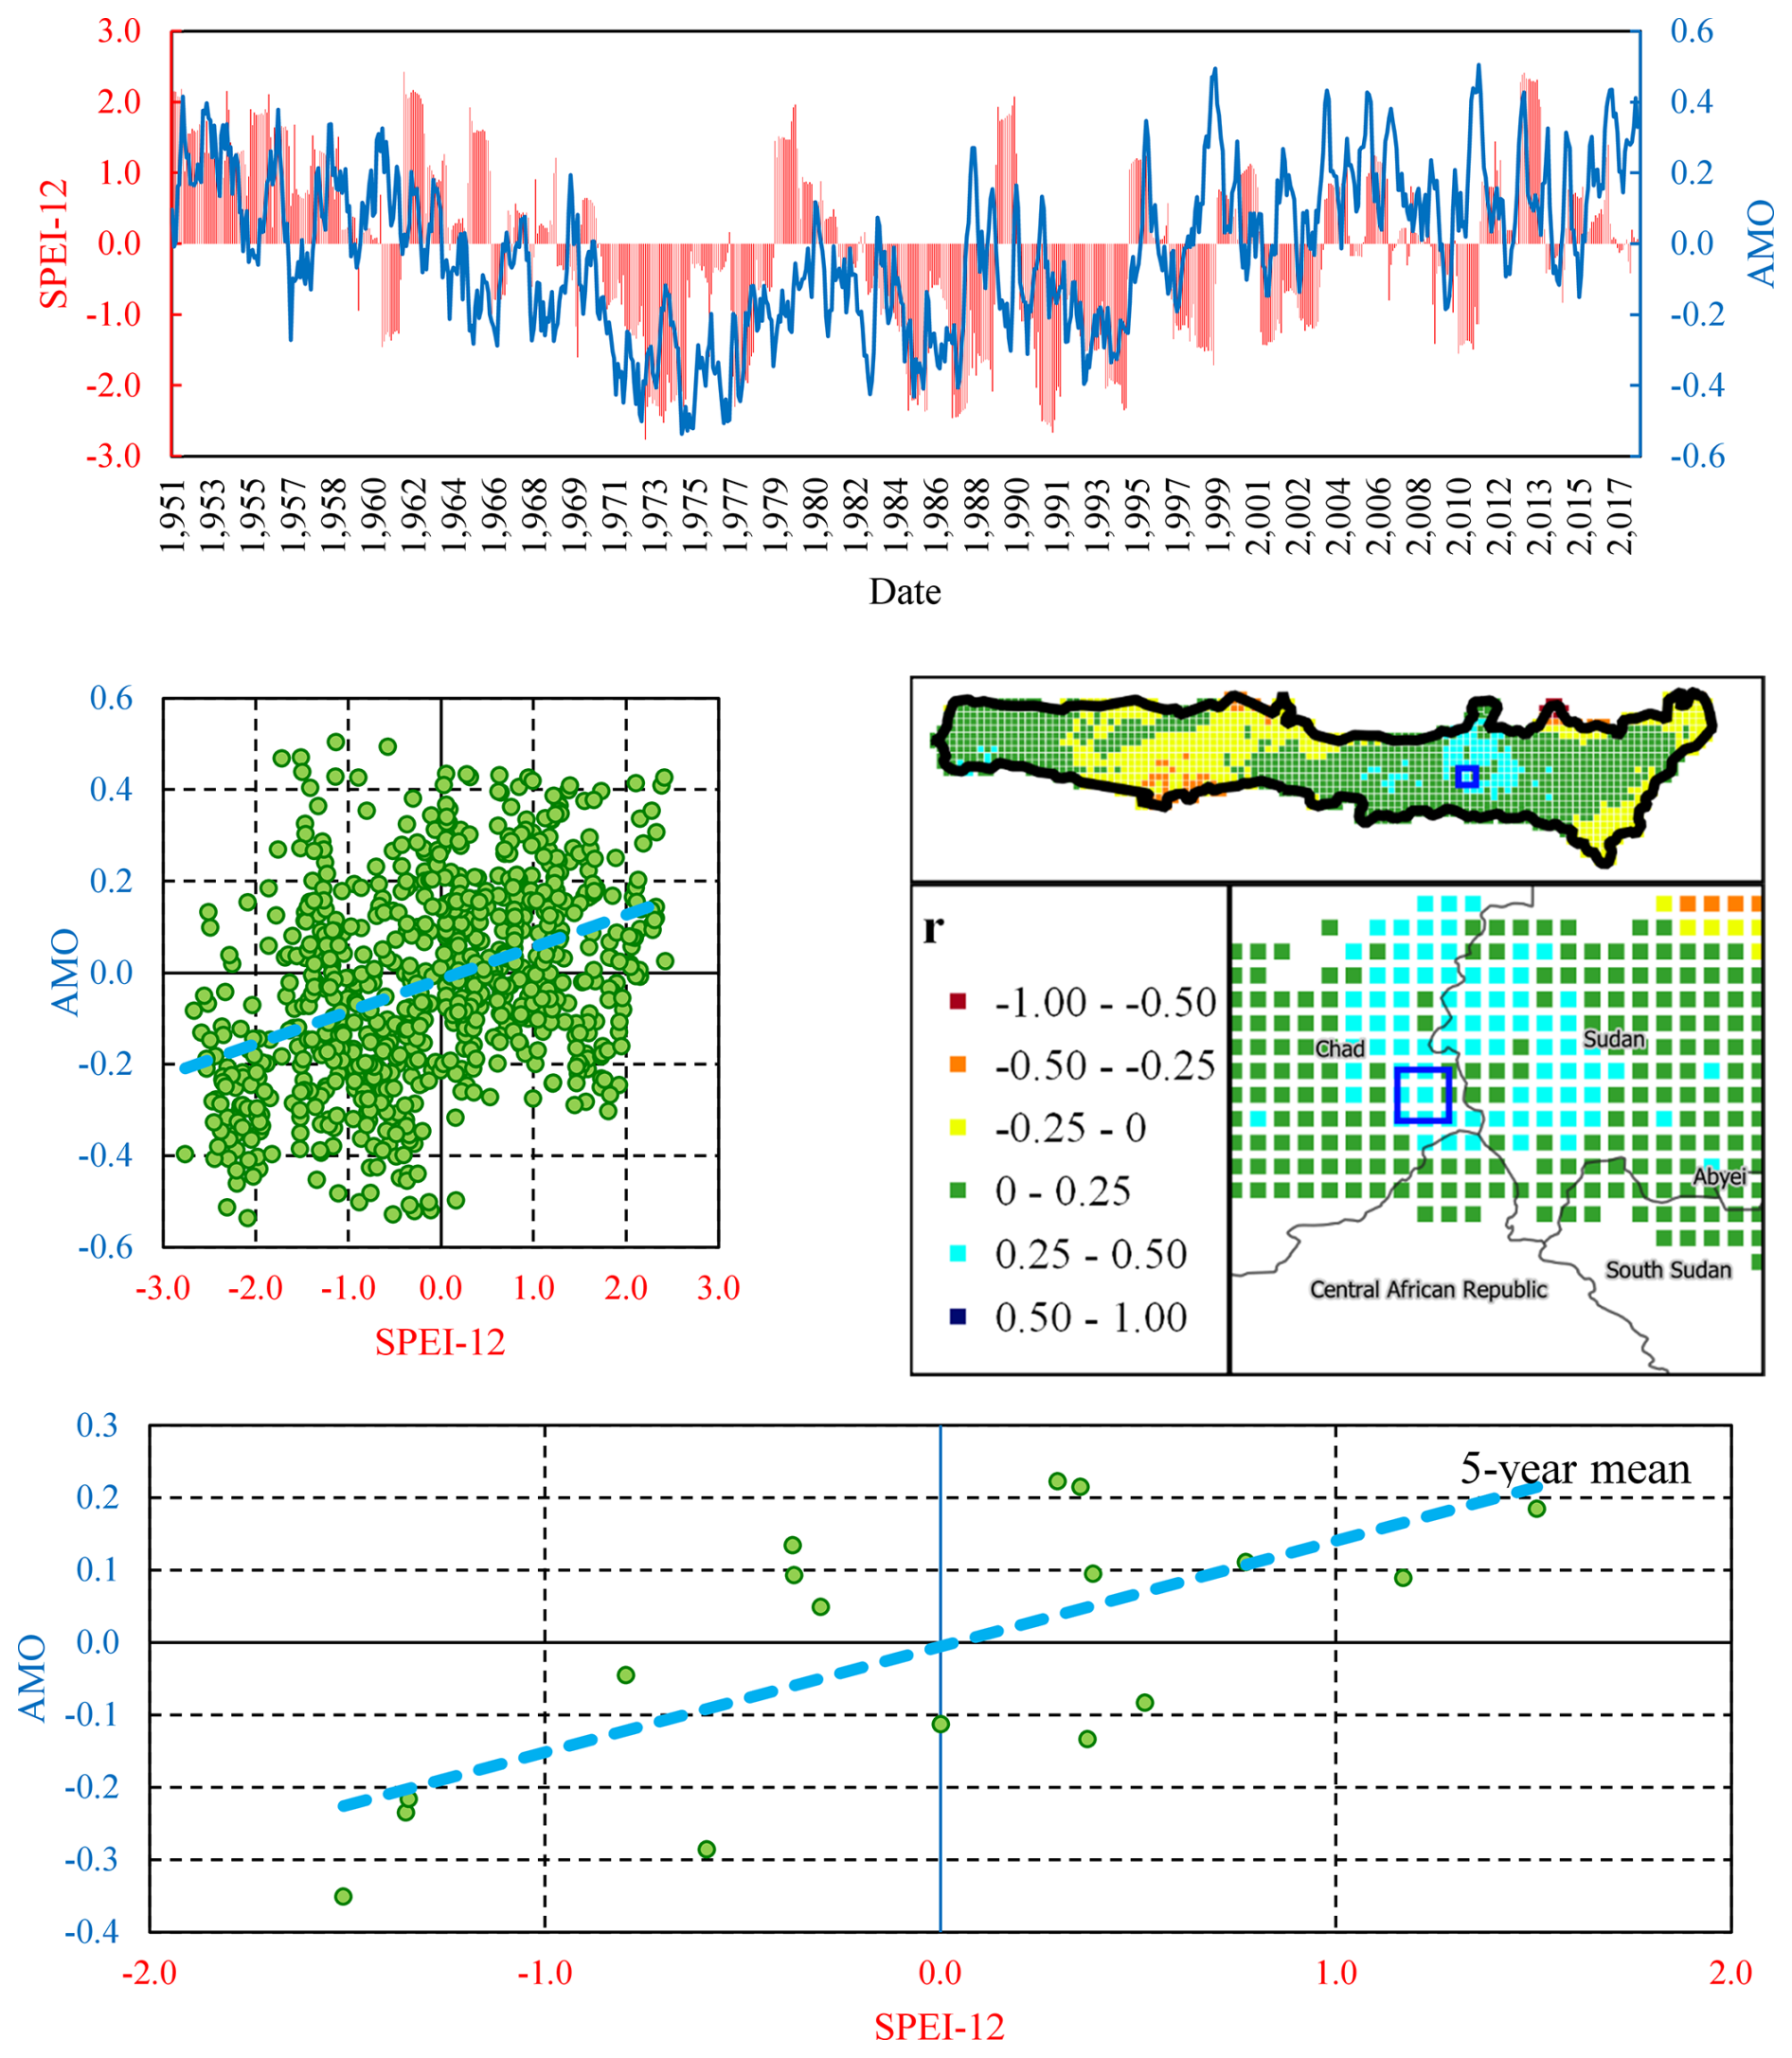
Figure 6Correlation analysis between SPEI-12 for Cell 2042 and AMO. The figure presents the time series of AMO and SPEI-12 for Cell 2042, located at the border between Chad and Sudan. Additionally, it includes a scatter plot illustrating their relationship on both a monthly scale and a five-year mean scale.
The GMT (IQR=0.14, ) and IPWP (IQR=0.13, ) indices exhibited strong negative correlations, reaching values of −0.76 and −0.71, respectively. These results underscore the adverse effects of warming in these regions, likely to intensify evapotranspiration and reduce soil moisture availability in the Sahel. The significant influence of GMT further highlights the overarching impact of global warming on regional hydrological cycles. Figure 7 presents a detailed analysis of the correlation between SPEI-12 for Cell 2319 and the GMT. Among all analyzed locations, Cell 2319 exhibited the strongest negative correlation with the GMT index. This relationship is evident in the opposing trends of SPEI-12 and GMT: SPEI-12 was predominantly positive from 1950 to the late 1990s and negative from 2000 to the present, whereas GMT showed an inverse pattern, remaining mostly negative until the late 1990s before turning positive from 2000 onward. Cell 2319 is situated at the northern boundary of the Sahel in central Sudan, bordering the hyper-arid Sahara Desert. This region is highly sensitive to climate variability, as it marks the transition between semi-arid and arid conditions. Rainfall is scarce and primarily influenced by the northward penetration of the West African Monsoon, which is highly susceptible to global temperature shifts. The strong negative correlation with GMT suggests that global warming has exacerbated aridity in this zone, likely by reducing monsoonal rainfall and intensifying evapotranspiration.
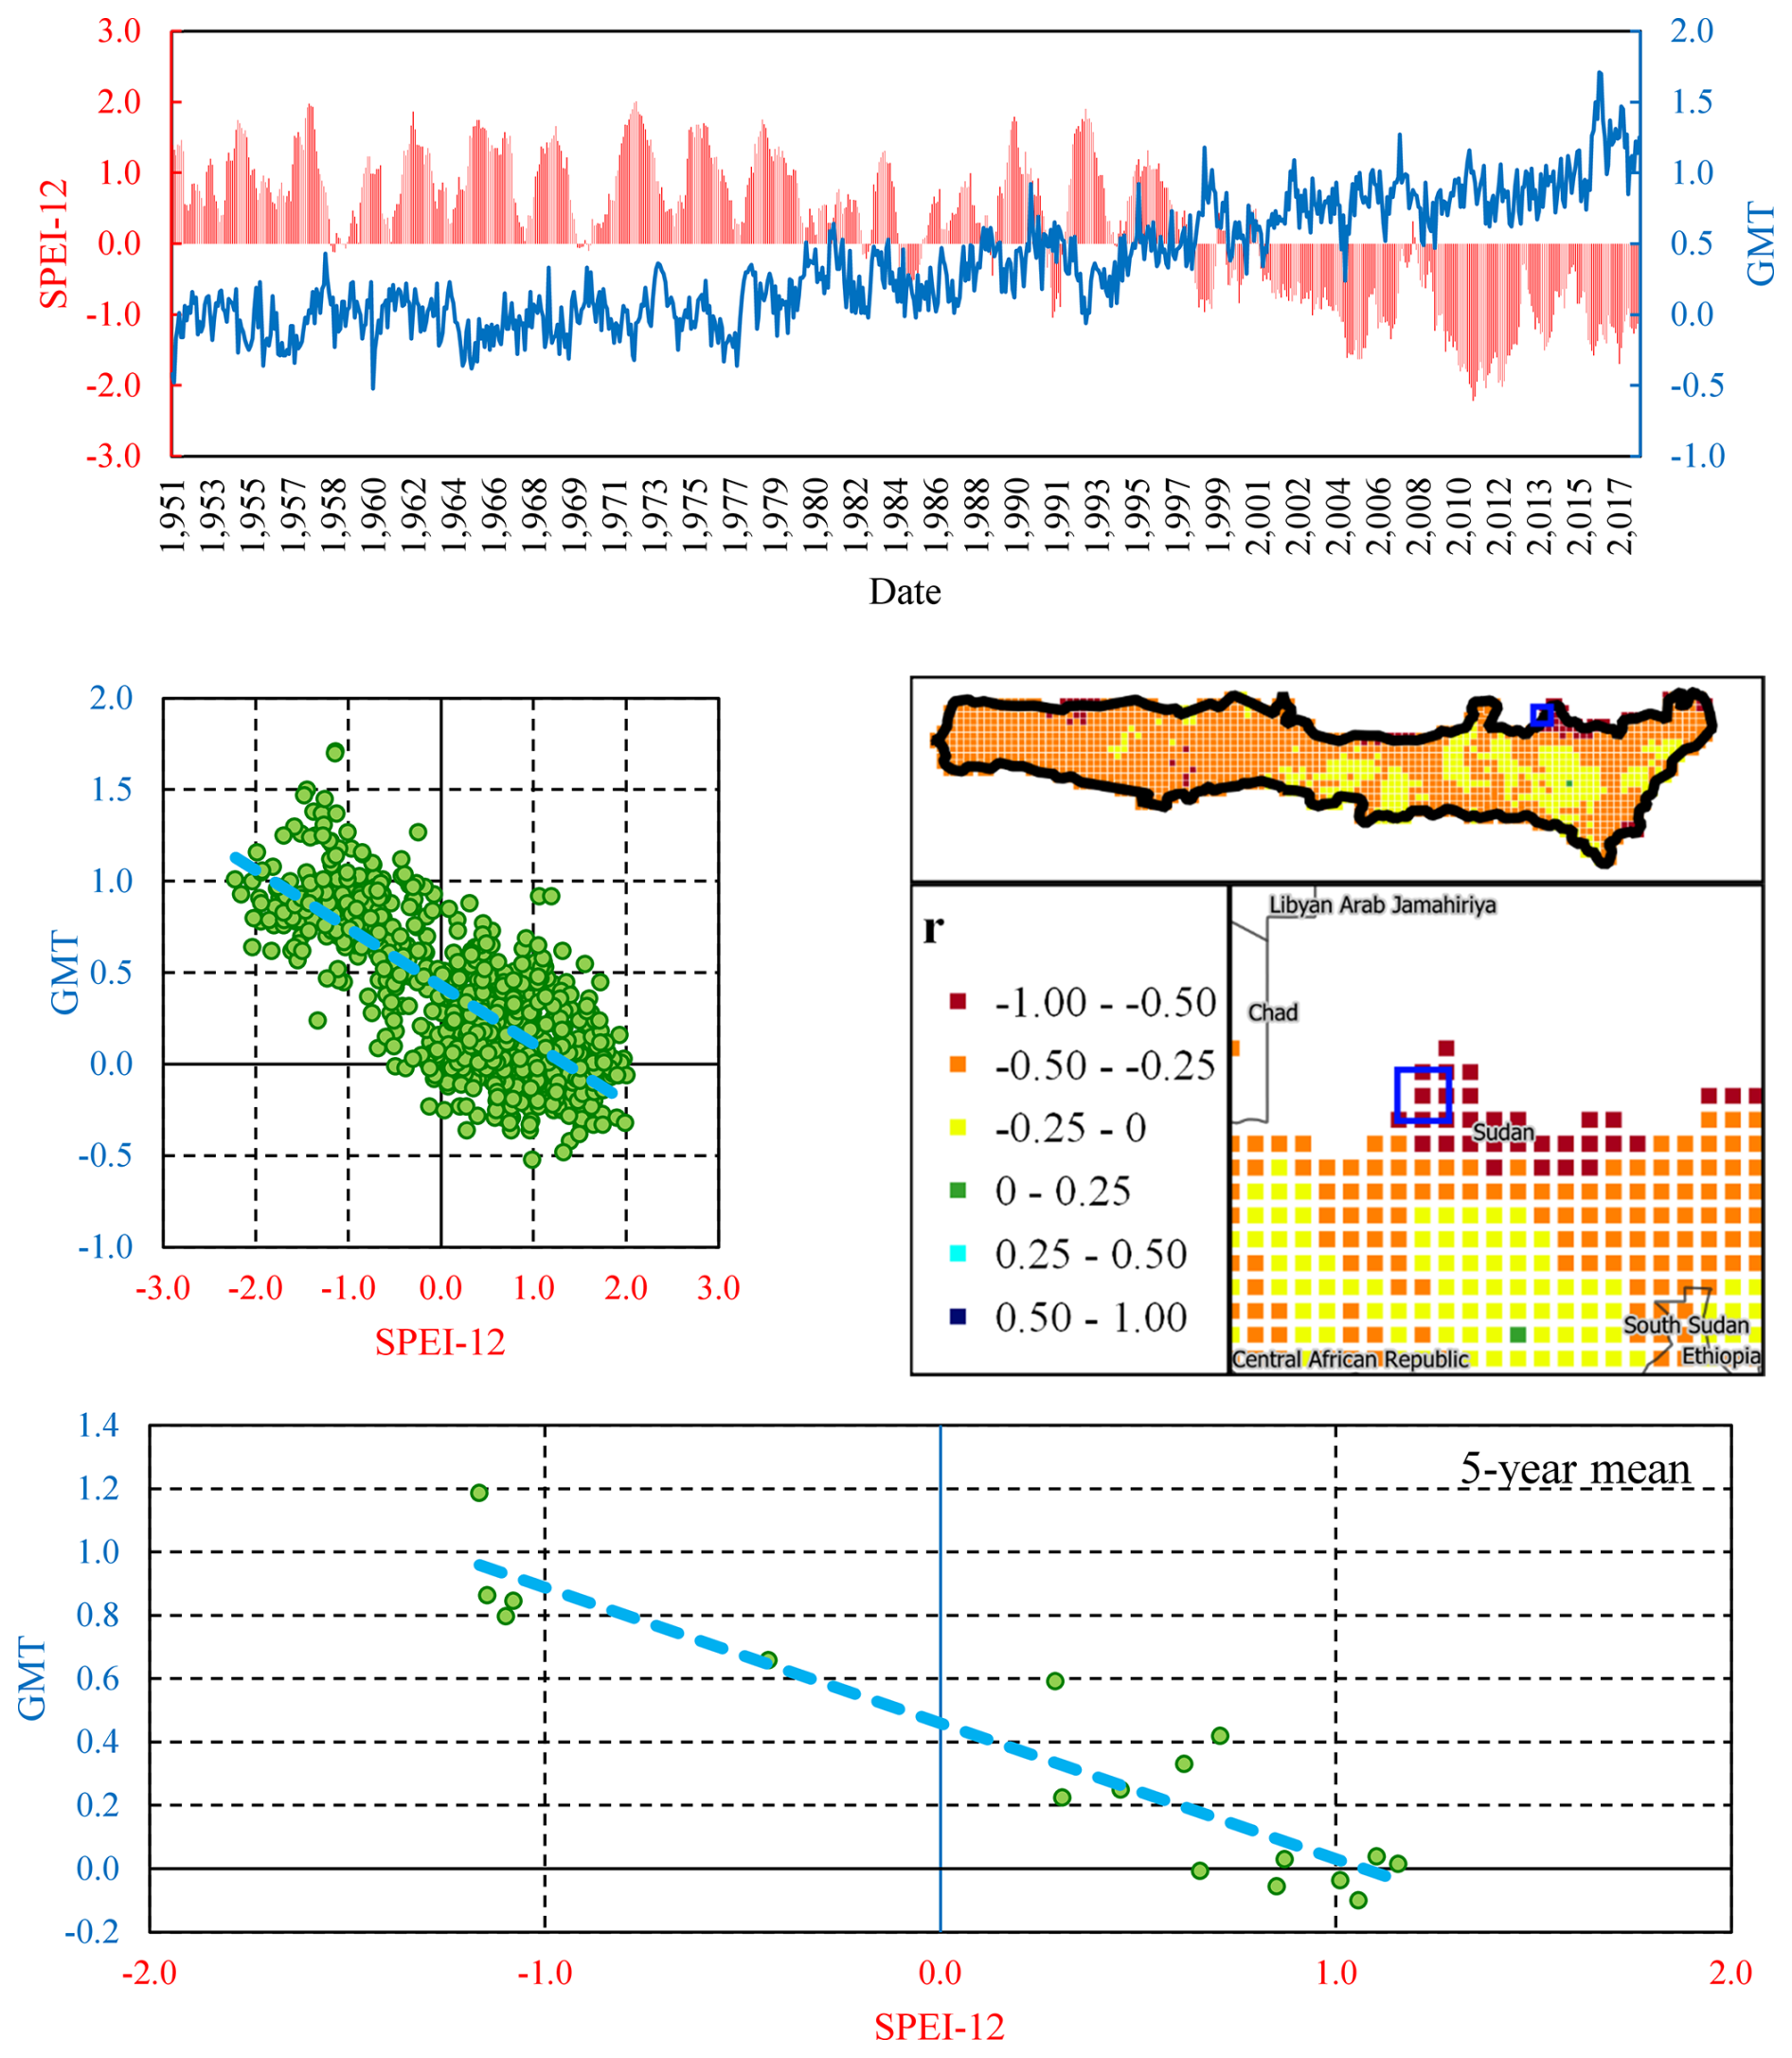
Figure 7Correlation analysis between SPEI-12 for Cell 2319 and GMT. The figure presents the time series of AMO and SPEI-12 for Cell 2319, located at the Sahel's border in Central Sudan. Additionally, it includes a scatter plot illustrating their relationship on both a monthly scale and a five-year mean scale.
In contrast, the Sahel P (IQR=0.08, mean=0.22) index stood out with a maximum correlation of 0.35, reinforcing its role as a local climatic driver that directly reflects rainfall conditions in the region. Meanwhile, indices such as the AO (IQR=0.05, ) and NAO (IQR=0.06, ) exhibited weaker correlations compared to the previously discussed indices, indicating that while these global-scale patterns might influence the Sahel indirectly, their direct impact on drought variability is limited or less consistent.
The variability in correlations, as indicated by standard deviations (see Table S3), was notable across indices. For instance, the AMO (Dev.st=0.16) and CAR (Dev.st=0.14) reflected significant spatial and temporal heterogeneity in their relationships with SPEI-12, whereas indices like the GBI and AO showed much lower variability (Dev.st<0.05), suggesting more stable but weaker connections. These findings emphasize that while certain indices like AMO are closely tied to sub-regional drought dynamics, others like GMT and IPWP reveal broader, systemic influences linked to global warming.
3.3 Clustering
A preliminary analysis was conducted to determine the more suitable algorithm between K-means and Hierarchical clustering. The analysis considered a range of cluster numbers from 3–8. However, for the sake of brevity, only the results for the optimal number of clusters, identified as 3 based on the highest mean Silhouette Scores (see Fig. 8a), are presented here. As inputs for the clustering, the most correlated climatic indices, whose correlations with SPEI-12 are depicted in Fig. 5, were considered: AMM, AMO, CAR, GMT, IPWP, NTA, PDO, Sahel P, TNA, TSA and WHWP.
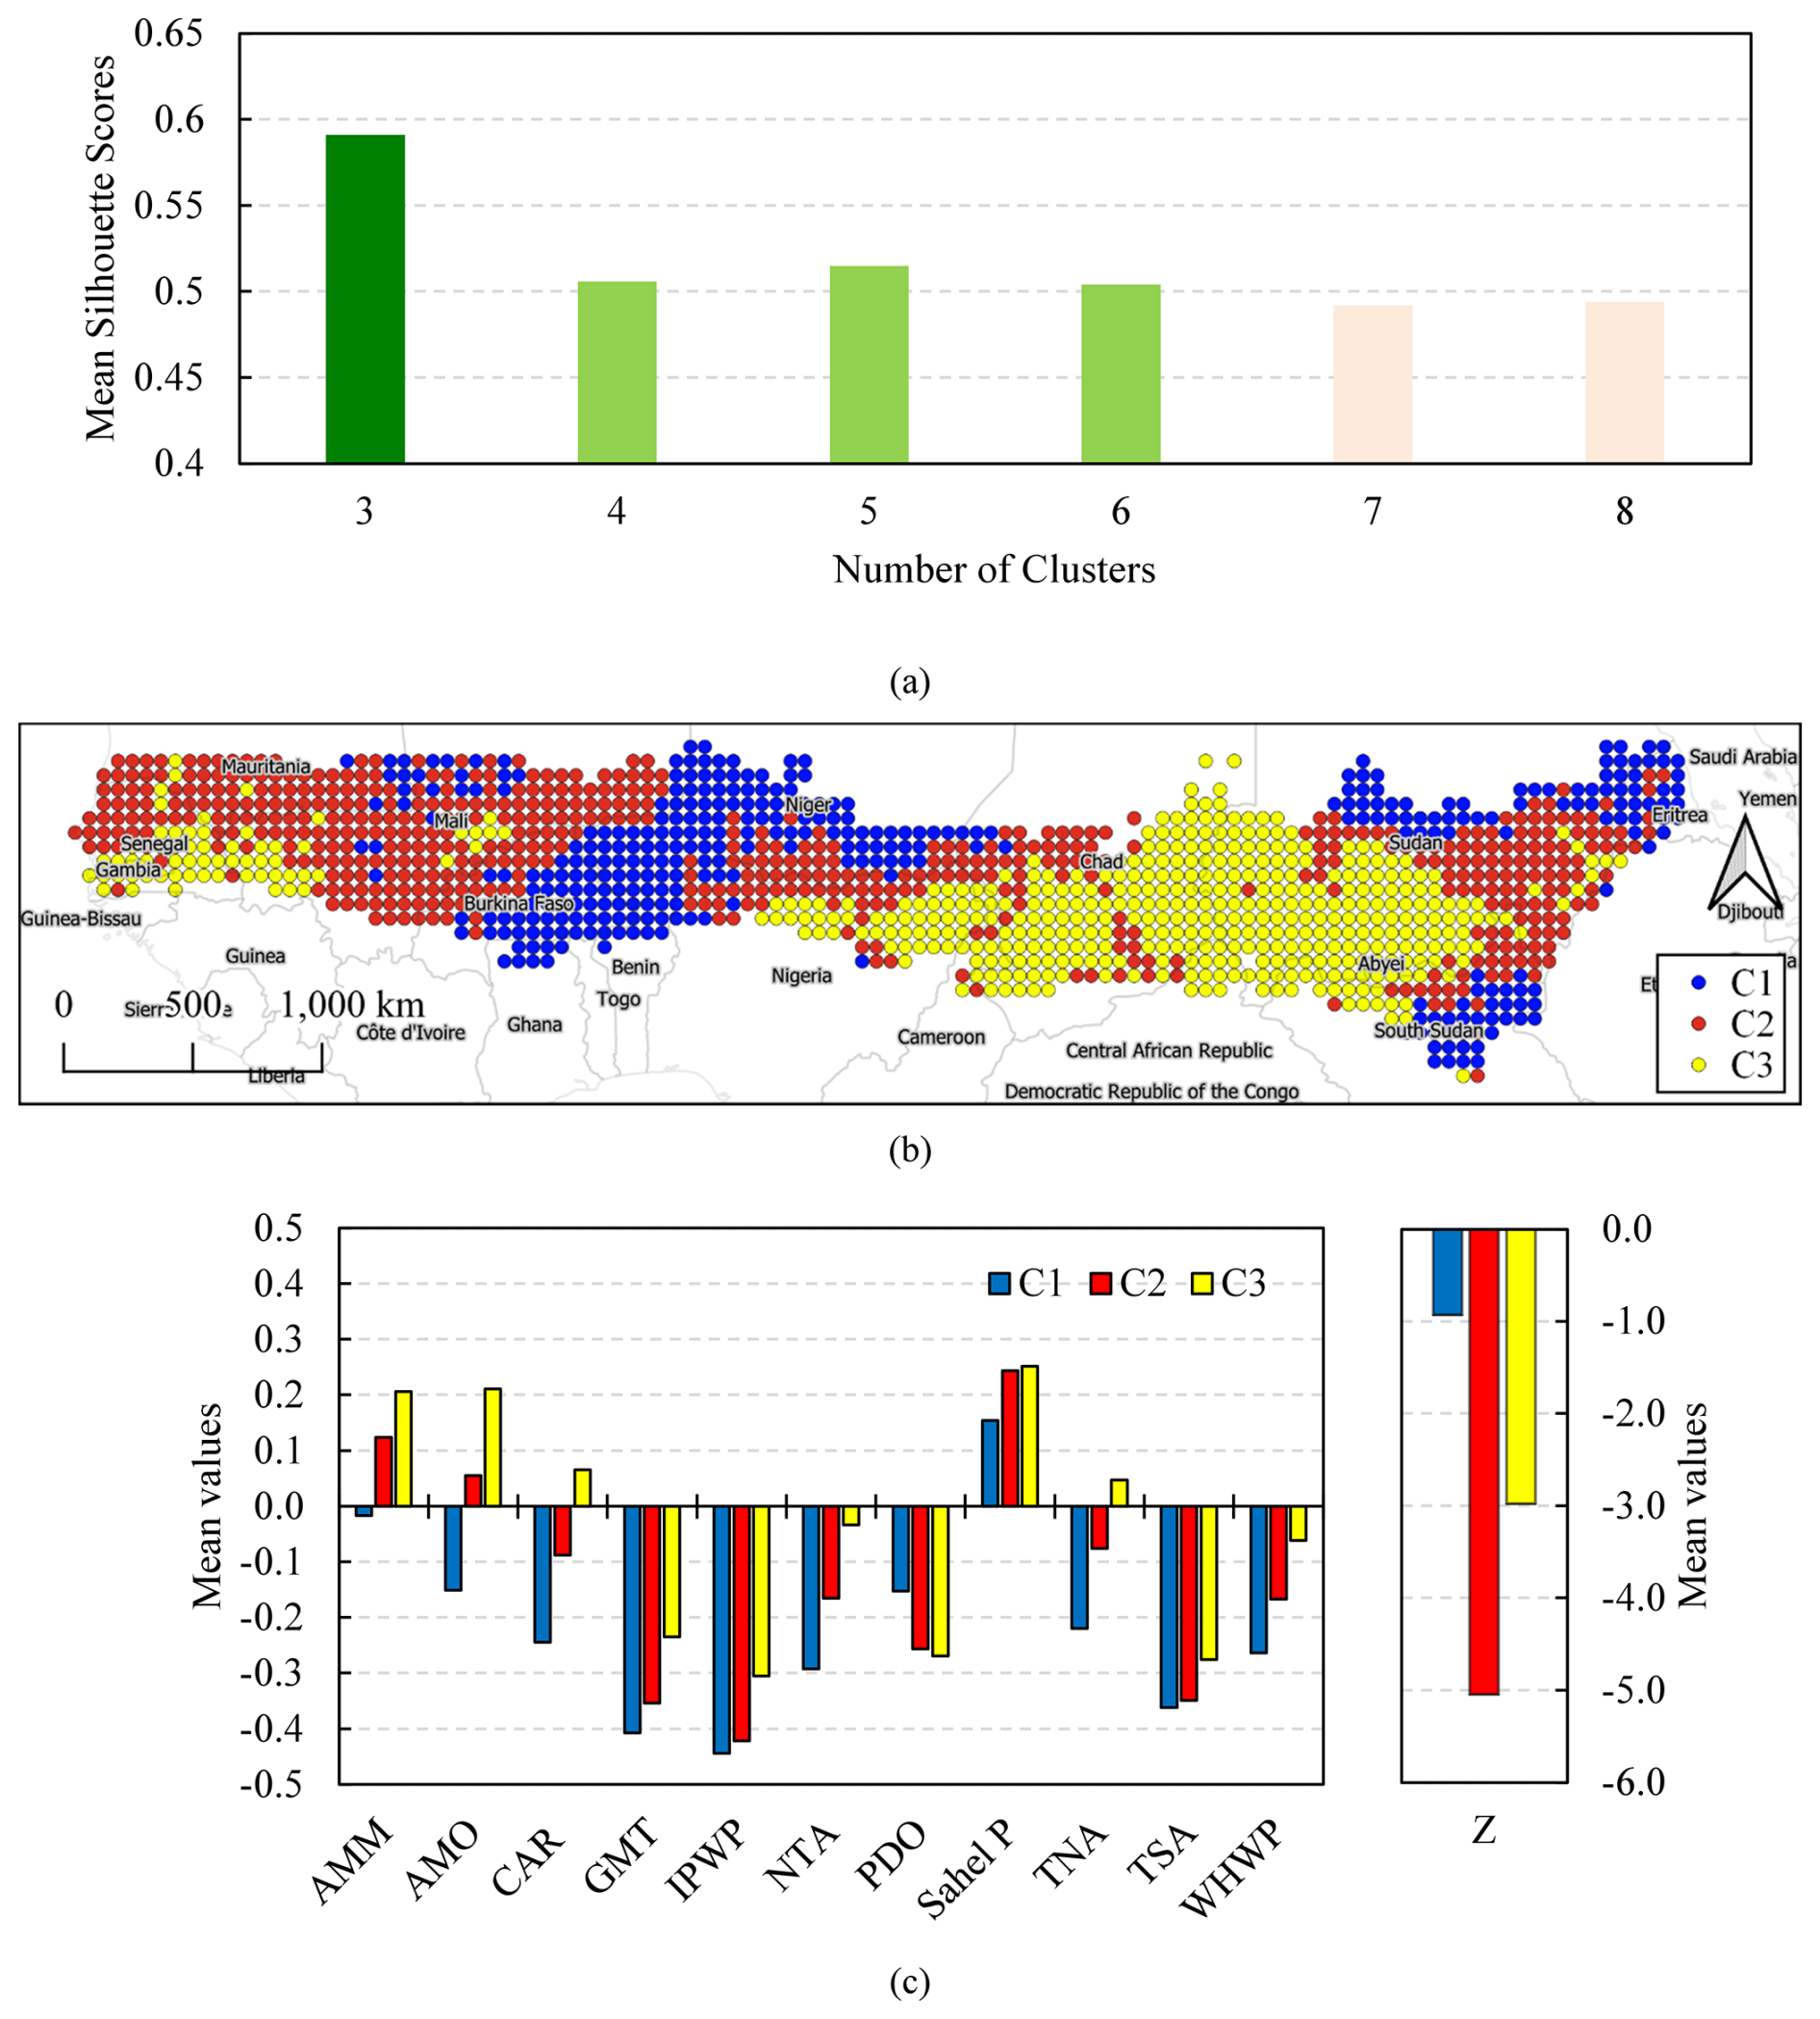
Figure 8Clustering analysis: mean Silhouette Scores calculated for cluster numbers ranging from 3–8 (a); K-means clustering map of the Sahel Region (b); mean values of correlations between SPEI-12 and selected climatic indices and the Z statistic from the SK test performed on SPEI-12 for each cluster (c).
The minimum, mean, and maximum Silhouette Scores for the K-means and Hierarchical clustering algorithms are reported in Fig. S1 in the Supplement. K-means consistently achieved higher Silhouette Scores compared to Hierarchical clustering across all clusters. For K-means, the minimum, mean, and maximum scores ranged from 0.47 (C1) to 0.50 (C2), 0.58 (C1) to 0.61 (C3), and 0.64 (C1) to 0.66 (C3), respectively. In contrast, Hierarchical clustering exhibited negative minimum values, ranging from −0.47 (C1) to 0.21 (C3), along with lower mean scores, from 0.19 (C1) to 0.29 (C2), and maximum values, from 0.46 (C1) to 0.50 (C2). Therefore, the subsequent discussion focuses on the clustering analysis performed using the K-means algorithm, which has been considered and examined in detail.
Cluster C1 (blue circles in Fig. 8b), covered most of the central-western Sahel, corresponding to part of Niger and Burkina Faso. Cluster C2 (red circles in Fig. 8b) covered most of the western Sahel, including the Sahel regions of Senegal, Mauritania, and Mali, except for the southwestern portion, corresponding to Gambia and Southern Senegal, which falls under Cluster C3. Other parts of the Sahel also fall within Cluster C2, such as some central areas of the Sahel and the easternmost part of the Sahel, including a part of Sudan, South Sudan and Eritrea, which is shared with Cluster C1. Finally, Cluster C3 (yellow circles in Fig. 8b) included the extensive central-eastern portion of the Sahel, including large territories of Chad, Sudan and Nigeria.
Notable differences and similarities among the three clusters in terms of their response to climatic indices and long-term trends in SPEI-12 were also observed (Fig. 8c), highlighting a spatial heterogeneity of drought conditions across the Sahel.
Clusters C1 and C2 exhibit broadly similar patterns, with negative correlations dominating the relationship between SPEI-12 and most climatic indices. Both clusters show particularly strong negative correlations with the GMT and IPWP, suggesting that these indices play a key role in driving aridity in these regions. However, the magnitude of these relationships differs, with C1 generally showing slightly stronger negative correlations than C2. A key distinction is that C2 demonstrates a stronger positive correlation of SPEI-12 with Sahel P (0.24), which suggests this cluster benefits from regional precipitation patterns in mitigating drought, unlike C1, where Sahel P shows a weaker positive effect (0.15). Cluster C3 stands out from the other two clusters, showing weaker negative correlations of SPEI-12 with most indices and even positive correlations with some, such as the AMO and AMM. This indicates that the drivers of drought in C3 are less linked to the same global climatic indices that strongly influence C1 and C2. Additionally, the weaker negative correlation with GMT and IPWP in C3 highlights a distinct climatic regime compared to the other clusters.
In terms of long-term drought trends, Cluster C2 shows the most pronounced worsening, with the lowest Z-value (−5.04). This indicates a sharp decline in SPEI-12, reflecting severe drought intensification. Cluster C3, while still experiencing a negative trend (−2.98), exhibits a less severe decline compared to C2, with its moderate correlations suggesting more stable conditions overall. Cluster C1 occupies an intermediate position, with a relatively mild decreasing trend (−0.93) and weaker correlations with regional precipitation patterns, pointing to a more gradual but persistent worsening of drought conditions.
Overall, while C1 and C2 share similarities in their drought responses, C2 is more vulnerable to severe drought intensification, whereas C3 differs fundamentally, with weaker correlations and a slower trend toward worsening conditions. These differences underline the need for cluster-specific approaches to understanding and addressing drought impacts in the Sahel.
To evaluate the relative influence of each climatic index on the clustering process and assess the predictive performance of the classifier, we employed an explainable AI approach that integrates a Random Forest (RF) classifier with SHAP. The RF model, a robust tree-based ensemble algorithm, effectively captures complex nonlinear interactions among variables but lacks inherent interpretability. To address both model performance and transparency, a comprehensive protocol was implemented.
First, the dataset was split using stratified sampling into training (90 %) and testing (10 %) subsets to preserve the original class distribution. A Random Forest classifier (100 estimators, criterion=Gini, random_state=42) was trained on the training data, and standard evaluation metrics – accuracy, class-wise precision, recall, F1-score, and the confusion matrix – were computed on the test set. The model achieved an accuracy of 0.985 on the independent test set. Class-wise precision, recall, and F1-scores were all above 0.97, confirming the classifier's strong discriminative power (see Table S4). Second, model explainability was addressed using SHAP values computed through the TreeExplainer framework. Beeswarm plots were generated for each cluster to visualize the magnitude and direction of feature contributions. Moreover, for each cluster, mean absolute SHAP values were computed for each feature, and a bootstrap procedure (n=100) was performed to calculate 95 % confidence intervals, providing statistical robustness to the importance rankings.
SHAP values represent the marginal impact of each feature on a model's prediction, averaged over all possible feature subsets. In this context, a positive SHAP value indicates that the feature increases the likelihood of a data point being assigned to a particular cluster, while a negative value suggests a suppressing effect. In the SHAP beeswarm plots (Fig. 9), the x axis represents SHAP values – the impact of each feature on the clustering outcome – while the color gradient (Feature value) encodes the actual correlation value between the climatic index and SPEI-12 for each data point, ranging from low (blue) to high (red). This dual encoding enables a nuanced interpretation of the model's behavior: the position along the x axis reflects the strength and direction of influence, while the color reveals whether strong or weak correlations drive the effect.
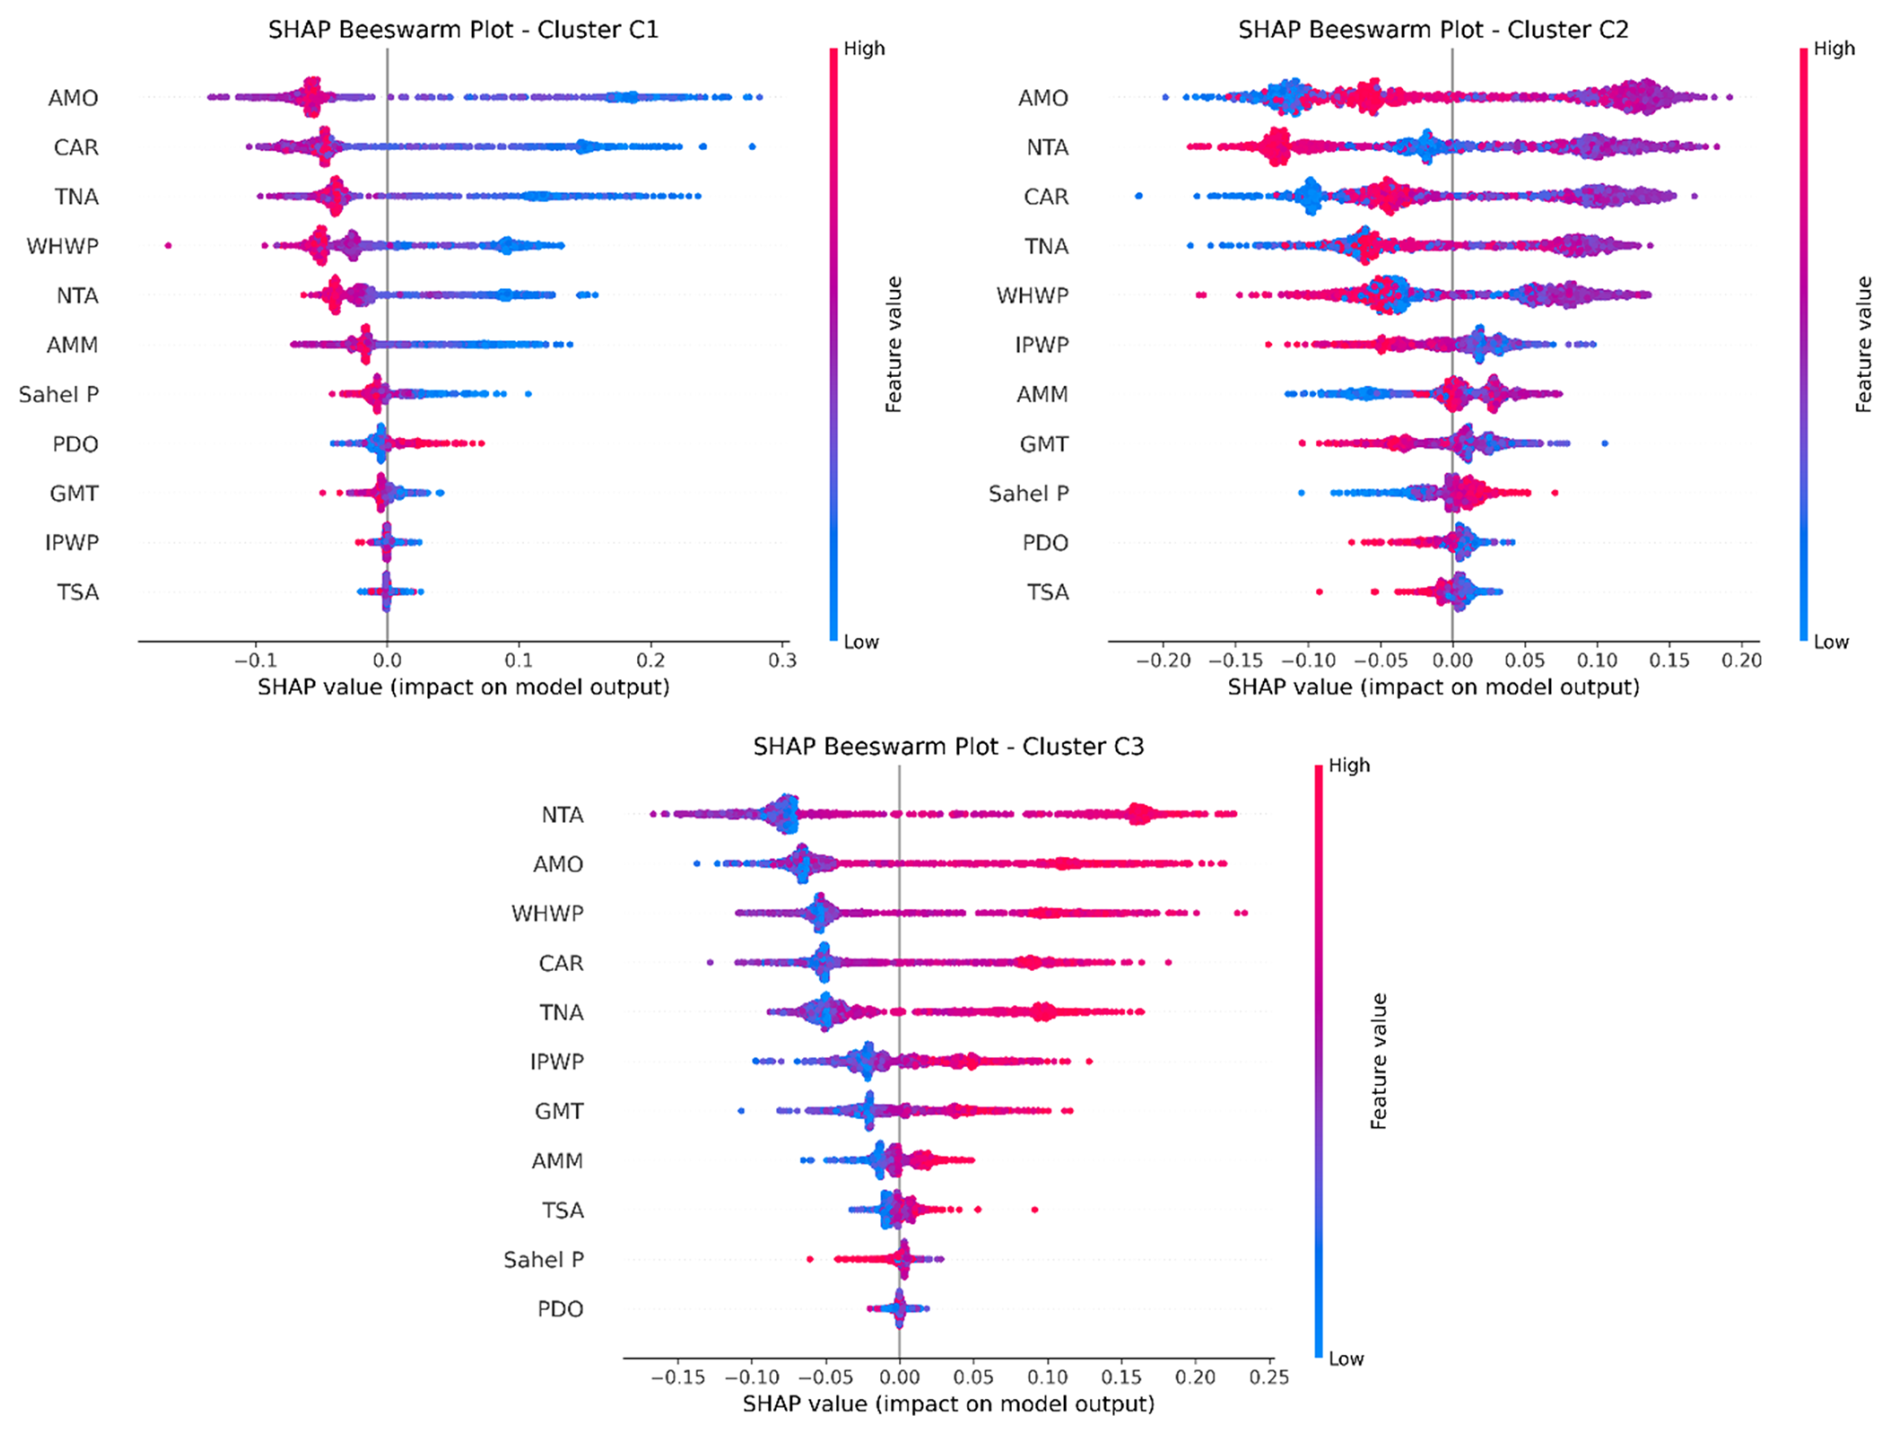
Figure 9SHAP beeswarm plot for the three clusters. The x axis shows SHAP values representing each feature's impact on cluster assignment. The color gradient indicates the corresponding climatic index–SPEI-12 correlation value, ranging from low (blue) to high (red).
The SHAP beeswarm plots for Clusters C1, C2, and C3 provide a comprehensive breakdown of the influence that each climate index exerts on the Random Forest classifier's clustering outcomes. Each plot reveals both the magnitude and direction of influence through SHAP values, offering insight into the discriminative role of individual features in defining cluster membership.
In Cluster C1, the AMO, CAR and TNA emerged as the most influential variables, with mean absolute SHAP values of 0.088, 0.72 and 0.059, respectively (see Table S5). Their distributions are notably skewed toward positive SHAP values, with dense concentrations between 0.05 and 0.15. This pattern indicates a strong and consistent association between high index values and increased likelihood of C1 classification. Moderately influential indices such as WHWP, NTA, and AMM present narrower spreads (−0.05–0.2) and more symmetric profiles, suggesting subtler but still directional contributions. Conversely, indices like PDO, GMT, IPWP, and TSA show very limited SHAP influence, with values clustered near zero and minimal dispersion, highlighting their negligible role in defining this cluster.
Cluster C2, in contrast, was characterized by AMO and the NTA indices as the most important features (mean absolute SHAP equal to 0.096 and 0.084, respectively), followed by CAR and TNA. These variables show significant spread on both sides of zero, implying a bidirectional influence where both high and low values can affect classification, depending on the context. Secondary contributors such as IPWP, AMM, and GMT exhibit tighter distributions centered around zero but with occasional asymmetries, pointing to context-dependent roles. Sahel P, PDO, and TSA remain minimally influential, with narrow SHAP ranges and modes at or near zero. Compared to Cluster C1, the SHAP profiles in C2 suggest greater interaction complexity among variables rather than dominance by a few.
For Cluster C3, NTA dominated the feature importance ranking (mean absolute SHAP: 0.102), followed by AMO (0.080) and WHWP (0.072). These distributions are distinctly positively skewed, and the color gradient confirms that high feature values strongly align with positive SHAP contributions. Variables such as CAR, TNA, and IPWP follow a similar, though slightly less pronounced, pattern. Mid-tier contributors like GMT, AMM, and TSA are more symmetrically distributed, with modal SHAP values just above zero. Finally, Sahel P and PDO again register as the least impactful, mirroring the behavior observed in the other clusters.
Across all three clusters, a consistent pattern emerges in the relative importance of certain indices. AMO, and NTA are among the most influential features throughout, though the nature of their impact differs. In Clusters C1 and C3, their SHAP distributions are positively skewed, indicating a clear, directional relationship between high index values and cluster membership. In contrast, Cluster C2 exhibits more symmetric SHAP profiles, highlighting bidirectional effects and greater context dependency.
Another key distinction lies in the degree of feature dominance. Cluster C1 and C3 are shaped by a small subset of highly influential variables with strong directional effects, whereas Cluster C2 displays a more distributed influence among multiple variables with less sharply skewed contributions.
Low-impact indices such as PDO and TSA consistently show minimal influence across all clusters. Their SHAP values remain centered around zero with low density, suggesting that these variables have limited utility in discriminating among the regimes captured by the clustering model.
4.1 Reconceptualizing Drought Dynamics in the Sahel: A Multiscale Perspective
The findings of this study reveal a profound reconfiguration of hydroclimatic regimes across the Sahel, with an alarming 57.5 % of grid cells exhibiting a statistically significant decline in SPEI-12. This extensive drying is not a localized phenomenon but rather a manifestation of large-scale climatic reorganization, where the intensification of drought aligns with a convergence of atmospheric and oceanic anomalies. The most affected regions – the western Sahel (Senegal, Gambia, Mali), southeastern Sahel (South Sudan), and northern-central Sahel (Chad) – serve as hydroclimatic sentinels, encapsulating the broader destabilization of the West African monsoon system. Yet, amidst this widespread aridification, a contrasting signal emerges between Burkina Faso and Nigeria, where a tendency toward wetter conditions underscores the region's inherent climatic heterogeneity and the nonlinear interplay of local and global forcing mechanisms.
The intensification of drought correlates with unequivocal global warming signatures, as reflected in the strong increasing trends of GMT (Z=28.70) and IPWP (Z=27.83). These indices do not merely co-evolve with regional drying; rather, they act as thermal amplifiers, accelerating evapotranspiration rates, altering atmospheric moisture gradients, and modulating land–atmosphere feedback in ways that redefine conventional paradigms of drought causality. Meanwhile, the observed decline in TNI, Solar Flux, and Sahel P suggests a shift in moisture transport dynamics and radiative forcing, further reinforcing the complexity of hydrological reorganization in the region.
Beyond linear associations, the correlation structure between global climate drivers and regional drought variability reveals an intricately woven network of teleconnections that challenge traditional dichotomies of cause and effect. The AMO emerges as a bifurcated influence, exerting positive correlations in western and central-eastern Sahel but negative correlations in central-western regions such as Burkina Faso. This spatially divergent response suggests that the AMO does not exert uniform control over Sahelian drought but rather interacts with localized boundary conditions in ways that defy simplistic interpretations. It is important to note that the apparent differences between the correlation maps (Fig. 5) and the SHAP-based feature importance results do not represent inconsistencies but rather reflect the different nature of these diagnostics. Correlation analysis highlights the strength of direct, linear associations between climatic indices and drought intensity, which explains why GMT and IPWP show strong correlations across much of the Sahel. In contrast, SHAP-driven Random Forest analysis evaluates the contribution of each index to the classification of distinct drought regimes. Although AMO shows relatively weak average correlations, its spatial heterogeneity and nonlinear interactions with other indices allow it to emerge as a key discriminator among clusters. Conversely, the more spatially uniform influence of GMT and IPWP, while important for overall drought intensification, contributes less to distinguishing regional drought regimes. Thus, correlation and SHAP/RF provide complementary insights: the former identifies direct associations with drought severity, while the latter uncovers the indices most relevant for separating hydroclimatic regimes. Similarly, GMT and IPWP exhibit strong negative correlations with SPEI-12 (−0.76 and −0.71), reinforcing their role as primary drought intensifiers, while Sahel P maintains a positive correlation (0.22), acting as a partial counterbalance to the prevailing drying trend. The weaker and inconsistent influence of AO and NAO underscores the selective and spatially constrained nature of extratropical climatic influences on the Sahel.
The application of K-means clustering transcends conventional regional classifications, revealing three distinct drought-prone domains that reflect not only geographic coherence but also fundamentally different climate-drought interaction mechanisms. Cluster C1 (central-western Sahel, primarily Niger) is predominantly governed by global warming indices, suggesting that anthropogenic climate change plays an outsized role in dictating its hydroclimatic trajectory. Cluster C2 (western Sahel, including Senegal, Mauritania, and Mali) exhibits the most severe drought intensification (), positioning it as a critical hotspot for future hydroclimatic vulnerability. In contrast, Cluster C3 (central-eastern Sahel, including Chad and Sudan) demonstrates weaker correlations with global indices, indicating that regional-scale processes and localized land–atmosphere interactions may exert a more dominant control over its drought evolution.
Across all three clusters, AMO and NTA consistently emerge as key indices, though their SHAP value distributions differ. Clusters C1 and C3 show positively skewed SHAP values, indicating that higher values of these indices strongly associate with cluster membership. In contrast, Cluster C2 displays more symmetric distributions, reflecting bidirectional influences and a more complex hydroclimatic regime driven by multiple moderately influential variables rather than a few dominant ones.
This SHAP-based clustering approach represents a paradigm shift by quantifying the relative influence of climate drivers with unprecedented clarity. The prominence of AMO and NTA, alongside the significant roles of GMT and IPWP in drought intensification, reshapes the understanding of the region's hydroclimate. These findings challenge deterministic views of Sahelian drought and highlight the value of machine-learning frameworks for capturing climate variability and its hydrological impacts.
4.2 A Reassessment of Climate-Drought Interactions in Light of Existing Literature
A comparative analysis with previous studies on the relationship between drought and climatic indices provides a critical context for interpreting the present findings. The work of Okonkwo (2014), which explores precipitation variability in the Sahel in relation to climate indices, aligns with the present study by confirming the strong influence of the Atlantic Multidecadal Oscillation (AMO). Okonkwo (2014) demonstrates that the warm and cold phases of the AMO are associated with increased and decreased precipitation, respectively – a pattern that has been reaffirmed here. However, while previous studies have largely treated AMO as a broad-scale modulator of precipitation, the SHAP-driven clustering approach applied in this study reveals that AMO's influence is spatially heterogeneous, exhibiting positive correlations with SPEI-12 across much of the Sahel but negative correlations in specific subregions, particularly Burkina Faso and Niger (Cluster C1). This nuanced perspective challenges the assumption of uniform AMO control over Sahelian hydroclimatic variability and underscores the need for regionally adaptive models.
Similarly, Ndehedehe et al. (2020) investigate the correlation between climatic indices and drought variability using both SPEI and SPI, confirming that AMO exerts a dominant influence over precipitation patterns in the central Sahel. Their findings resonate with the present study, reinforcing AMO's multi-scalar control over drought evolution. However, while Ndehedehe et al. (2020) highlight a significant role of the Pacific Decadal Oscillation (PDO) in modulating Sahelian drought conditions – reporting a negative correlation () between PDO and SPI – the present analysis, based on SPEI-12, identifies a weaker but still notable negative correlation (up to −0.40) in the western and central-eastern Sahel. This result is corroborated by Lüdecke et al. (2021), who also identify a negative PDO-rainfall relationship. These findings reinforce the multidecadal Pacific-Sahel teleconnection but suggest that its strength and consistency depend on the drought metric employed and the temporal scale of analysis.
The relationship between NTA and SSTs and Sahelian rainfall, explored by Wane et al. (2023), further illustrates the intricacies of ocean–atmosphere interactions. Their findings indicate that positive SST anomalies in the NTA enhance rainfall in the western Sahel, while negative anomalies suppress it. This process is driven by changes in atmospheric circulation and moisture transport. The present study confirms the remarkable role of NTA in shaping drought dynamics and clustering patterns. However, an inverse correlation between NTA and SPEI-12 is observed, deviating from the rainfall-based perspective provided by Wane et al. (2023). This divergence is likely attributable to the fundamental difference between precipitation anomalies and drought indices incorporating evapotranspiration, highlighting the necessity of adopting integrated hydroclimatic indicators when assessing drought mechanisms.
The complex interaction between hydrological drought variability and large-scale climatic drivers is further explored by Ogunrinde et al. (2024), whose study on SPEI-based drought analysis in Nigeria identifies an increasing frequency of drought events, consistent with the present findings. Their correlation analysis ranks the influence of climate indices on drought as SOI > NAO > AMO, whereas in this study, NAO and SOI exhibit only weak correlations with SPEI and negligible impacts on clustering outcomes. A notable discrepancy emerges in the regional breakdown of drought influences: while both studies identify AMO as a key determinant of Nigerian drought conditions, the relationships with NAO and SOI diverge considerably. In contrast to Ogunrinde et al. (2024), where NAO and SOI exert a measurable impact, the present study finds their effect to be statistically insignificant. These differences likely stem from methodological variations, including the spatial domain of analysis, the clustering methodology employed, and the timescales considered. More broadly, these results underscore the complexity of climate-drought interactions in the Sahel, suggesting that the influence of extratropical climate oscillations is neither spatially uniform nor temporally consistent, but instead varies according to local climatic regimes and feedback processes.
The present study builds upon and extends prior research by moving beyond conventional correlation analyses, incorporating a multi-method approach that disentangles the mechanistic drivers of drought at an unprecedented level of granularity. Previous studies have largely treated climatic indices as static modulators of Sahelian precipitation, relying on broad correlation patterns to infer causality. However, by integrating SHAP-driven clustering, this study advances the conceptual understanding of drought variability by quantifying the individual contributions of each climate driver, demonstrating that their influence is often localized, nonlinear, and scale-dependent.
This refined perspective challenges the notion of uniform climate-drought relationships, advocating for a more adaptive, ML-informed approach to hydroclimatic research. The findings emphasize the importance of re-evaluating deterministic frameworks in favor of probabilistic, interpretable, and data-driven methodologies that better capture the dynamic nature of Sahelian drought evolution.
4.3 Advancing Hydrological Clustering: From Conventional Methods to SHAP-Enhanced Insights
Traditional clustering methods, such as K-means, hierarchical clustering, and fuzzy c-means, have long been employed in hydrological studies to identify regions with similar drought characteristics. For instance, Najafi and Khanbilvardi (2018) used K-means clustering on the Palmer Drought Severity Index (PDSI) to assess global extreme drought patterns, while studies in South Korea (Azam et al., 2018) and western India (Goyal and Sharma, 2016) applied hierarchical or fuzzy clustering to group rainfall stations or drought-prone regions for improved water resource planning. Similarly, Di Nunno and Granata (2023) applied K-means, Hierarchical, and Expectation–Maximization clustering to delineate homogeneous drought regions in Southern Italy based on gridded SPEI-6 data. These approaches effectively capture statistical similarity but offer limited insight into the underlying climatic mechanisms that drive drought variability.
Such methods, which rely on distance metrics and variance minimization, inherently lack explanatory power: they cluster based on observable similarities without clarifying which variables most influence the results. This is especially limiting in regions like the Sahel, where drought dynamics are shaped by multiple, interacting climatic drivers with often non-linear and context-specific influences.
The proposed framework addresses these limitations by integrating SHAP into the clustering process. By coupling SHAP with machine learning models such as Random Forest, the approach moves beyond surface-level pattern recognition to quantify the contribution of each climatic index to cluster formation. This integration transforms clustering into an interpretable and mechanistically grounded analysis of climate-drought interactions, supporting both pattern detection and causal attribution.
The benefits of this approach are evident in the Sahelian context. SHAP-based analysis reveals the strong, directional influence of indices such as the AMO and the NTA in specific clusters (e.g., C1 and C3), where drought regimes are governed by a narrow set of dominant drivers. In contrast, other clusters (e.g., C2) exhibit a more complex, bidirectional interaction among multiple indices, necessitating more flexible and adaptive management strategies.
Moreover, our framework identifies low-impact indices – such as PDO and TSA – allowing policymakers to focus monitoring efforts on the most influential drivers. This prioritization improves the efficiency of early warning systems and resource allocation. Without SHAP, such insights into causal mechanisms would remain inaccessible, as conventional clustering results lack interpretability beyond spatial similarity.
In practical terms, SHAP-driven clustering provides actionable insights for adaptation planning. For example, anticipating AMO phase shifts in regions where its influence is dominant can enhance preparedness. Likewise, the observed negative correlation between NTA and SPEI-12 underscores the value of monitoring ocean–atmosphere interactions for timely intervention.
In addition, the spatial heterogeneity revealed across the three clusters highlights the need for targeted adaptation strategies that align with each cluster's specific climatic vulnerabilities. Cluster C2, which faces the most severe drought intensification, would benefit from proactive investment in water harvesting infrastructure, drought-resilient crop varieties, and transboundary water governance mechanisms to manage shared resources. Cluster C1, more strongly influenced by indices such as AMO, CAR, and TNA according to SHAP analysis, may require policies focused on long-term resilience, such as promoting sustainable groundwater extraction, enhancing soil moisture retention through agroecological practices, and integrating climate-smart irrigation systems. Although global warming indicators such as GMT and IPWP play an overarching role in drought intensification across the Sahel, their direct influence on Cluster C1 is comparatively limited. In contrast, Cluster C3, where local and regional dynamics dominate, presents an opportunity for community-based water management, improved land use planning, and localized climate services tailored to support decision-making at the grassroots level. These differentiated strategies are crucial to building adaptive capacity in the Sahel and ensuring that resource allocation reflects both scientific insight and regional socio-environmental contexts.
In summary, while conventional clustering methods have laid the foundation for spatial drought analysis, the integration of SHAP enables a significant methodological advancement. It bridges the gap between data-driven classification and physical climate understanding, offering a transparent, interpretable, and operationally useful tool for drought mitigation and climate resilience planning. This work thus complements and extends the literature by embedding explanatory power into hydrological clustering, enhancing its relevance for both science and policy.
4.4 Limitations and Future Directions
While this study provides a comprehensive and data-driven framework for assessing drought variability in the Sahel, certain limitations warrant consideration. One inherent constraint lies in the geographical scope of the analysis. Although the Sahel represents a vast and climatically significant region, the findings are inherently tailored to its semi-arid hydroclimatic regime. As a result, the generalizability of the proposed methodology to regions with markedly different climatic and hydrogeological conditions remains an open question. Future research should seek to extend this framework to diverse environmental contexts, including humid tropical zones, arid desert landscapes, and temperate regions, to evaluate the transferability and adaptability of the approach across varying hydroclimatic gradients. Such an extension would provide a more holistic understanding of drought dynamics, revealing how different climatic drivers modulate hydrological extremes under contrasting environmental forcings.
Additionally, while this study successfully integrates trend analysis and explainable clustering, further investigation is needed to assess its performance in highly anthropized environments, where urbanization, land-use change, and water extraction exert non-climatic controls on drought evolution. Notably, some areas showing weak correlations between climate indices and SPEI-12 may coincide with regions undergoing extensive human-induced modifications, such as agricultural expansion, irrigation, or groundwater exploitation. These anthropogenic factors can decouple local drought dynamics from large-scale climate drivers, potentially obscuring the climate signal detected by statistical models. Expanding the application of this methodology to regions experiencing rapid demographic growth and infrastructural development, such as peri-urban zones increasingly reliant on groundwater, would offer critical insights into the interplay between human activities and climatic variability. Similarly, applying the approach to colder climates would enable an evaluation of its robustness in regions where snowpack dynamics, freeze–thaw processes, and permafrost degradation introduce additional layers of hydrological complexity.
Furthermore, the temporal range of the analysis (1951–2018), although selected to ensure consistency and adequate overlap among multiple climate indices, may not fully capture recent accelerations in climate change and extreme event frequency, especially post-2018. As newer datasets become available, extending the analysis to include the most recent years will be critical for capturing ongoing hydroclimatic shifts. Moreover, while the 0.5° spatial resolution of the Global SPEI Database is adequate for regional-scale assessments, it may smooth out local variations critical for decision-making at finer administrative levels. This can introduce spatial biases, particularly in areas where terrain, land use, or rainfall gradients are highly variable. Finally, despite the broad suite of 31 climate indices considered, the exclusion of potentially relevant drivers – such as dust aerosol concentrations, local vegetation indices, or land surface temperature – could limit the full explanatory power of the model. Incorporating such variables in future iterations may improve the detection of drought triggers and feedbacks, especially where local biogeophysical processes play a pivotal role.
Beyond spatial expansion, methodological advancements represent a key avenue for future research. While the integration of SHAP-driven clustering with traditional statistical techniques has enhanced the interpretability of drought patterns, the incorporation of hybrid ML models and advanced change-point detection algorithms could further refine the detection of non-stationary behaviors in drought variability. ML models – particularly deep learning architectures and ensemble learning frameworks – hold promise for capturing high-dimensional dependencies within climate-drought interactions, thereby improving predictive accuracy. Similarly, the application of advanced change-point detection methods could enhance the ability to identify abrupt hydroclimatic regime shifts, offering a more granular perspective on the evolving nature of drought risk.
Moreover, while the percentage of grid cells showing statistically significant trends is reported to convey a general sense of spatial extent, we acknowledge that such figures can be affected by spatial autocorrelation, potentially inflating the number of significant results. As such, these values should be interpreted cautiously, with emphasis placed on coherent spatial patterns rather than individual significance. This limitation, discussed in the literature (e.g., Wilks, 2006), highlights the importance of adopting field significance approaches in future work to address spatial dependencies in gridded climate data.
Future studies should also consider integrating multi-source datasets, including remote sensing observations, high-resolution reanalysis products, and socio-economic indicators, to develop a more holistic and cross-disciplinary framework for drought assessment. This would facilitate a transition from a purely climatological perspective to a socio-hydrological paradigm, acknowledging the feedback between climate variability, human adaptation strategies, and water resource sustainability.
Ultimately, the continued evolution of interpretable and adaptive methodologies is essential to advancing the understanding of drought risk in a rapidly changing global climate. By bridging the gap between statistical inference, ML, and hydroclimatic process understanding, future research has the potential to redefine drought analysis, enabling more effective climate adaptation and water resource management strategies at both regional and global scales.
This study presents a comprehensive framework for assessing drought variability in the Sahel by integrating trend analysis, cross-correlation, and an innovative SHAP-driven clustering approach. The analysis revealed that 57.5 % of the region exhibits a significant drying trend in SPEI-12, particularly in the western and southeastern Sahel, driven by increasing temperatures and declining precipitation. Conversely, 19.3 % of the region shows statistically significant wetting trends, highlighting the spatial heterogeneity of drought evolution primarily through increased evapotranspiration and reduced soil moisture availability. At a regional scale, AMO and NTA emerged as key modulators of drought variability, influencing distinct drought-prone zones. Clustering identified three major drought regimes, with Cluster C2 (western Sahel: Senegal, Mauritania, Mali) experiencing the most severe intensification ().
The SHAP-driven clustering approach integrates a Random Forest (RF) model with SHAP values to identify distinct drought patterns across the Sahel. By quantifying the contribution of each climatic index to the clustering results, this method makes the model's decision-making process transparent and highlights the prominent influence of AMO and NTA on regional drought variability. This level of interpretability allows for a deeper understanding of the climatic mechanisms behind spatial drought patterns, offering a robust basis for designing targeted adaptation strategies.
Beyond its application in the Sahel, the proposed framework offers strong potential for generalization to other drought-prone regions worldwide. Its modular structure – combining seasonal trend detection, teleconnection analysis, and explainable machine learning – can be readily adapted to different hydroclimatic contexts, including temperate zones, monsoonal climates, and arid environments. By incorporating local drought indices and relevant climate drivers, this methodology can support region-specific assessments while maintaining the advantages of transparency and model interpretability. As such, it provides a scalable and transferrable tool for advancing drought risk management in a changing global climate.
By bridging advanced statistical analysis with explainable AI techniques, this study contributes a novel and interpretable approach for understanding climate impacts on regional water security, offering actionable insights for policymakers, researchers, and resource managers well beyond the Sahel context.
The SPEI gridded data from the Global SPEI Database (GSD) were available at the following website: https://spei.csic.es/ (last access: 3 November 2025).
The supplement related to this article is available online at https://doi.org/10.5194/hess-29-6043-2025-supplement.
FDN contributed with conceptualization, data curation, formal analysis, investigation, methodology, software, visualization, writing – original draft, writing – review and editing. MBY contributed with data curation, investigation, formal analysis, software, visualization, writing – original draft, writing – review and editing. FG contributed with supervision, conceptualization, data curation, formal analysis, investigation, methodology, software, validation, visualization, writing – original draft, writing – review and editing.
The contact author has declared that none of the authors has any competing interests.
Publisher's note: Copernicus Publications remains neutral with regard to jurisdictional claims made in the text, published maps, institutional affiliations, or any other geographical representation in this paper. While Copernicus Publications makes every effort to include appropriate place names, the final responsibility lies with the authors. Views expressed in the text are those of the authors and do not necessarily reflect the views of the publisher.
This paper was edited by Efrat Morin and reviewed by Alban Kuriqi and one anonymous referee.
Allen, R. G., Pereira, L., Raes, D., and Smith, M.: Crop Evapotranspiration: Guidelines for Computing Crop Water Requirements, FAO Irrigation and Drainage Paper 56, Food and Agriculture Organisation, Rome, Italy, ISBN 92-5-104219-5, 1998.
Azam, M., Park, H. K., Maeng, S. J., and Kim, H. S.: Regionalization of Drought across South Korea Using Multivariate Methods, Water, 10, 24, https://doi.org/10.3390/w10010024, 2018.
Barton, Y., Giannakaki, P., Von Waldow, H., Chevalier, C., Pfahl, S., and Martius, O.: Clustering of regional-scale extreme precipitation events in southern Switzerland, Mon. Weather Rev., 144, 347–369, 2016.
Cohen, J., Huan, X., and Ni, J.: Shapley-based explainable AI for clustering applications in fault diagnosis and prognosis, Journal of Intelligent Manufacturing, 35, 4071–4086, https://doi.org/10.1007/s10845-024-02468-2, 2024.
Cuthbert, M. O., Taylor, R. G., Favreau, G., Todd, M. C., Shamsudduha, M., Villholth, K. G., MacDonald, A. M., Scanlon, B. R., Kotchoni, V. O., Vouillamoz, J. M., Lawson, F. M. A., Adjomayi, P. A., Kashaigili, J., Seddon, D., Sorensen, J. P. R., Ebrahim, G. Y., Owor, M., Nyenje, P. M., Nazoumou, Y., Goni, I., Ousmane, B. I., Sibanda, T., Ascott, M. J., Macdonald, D. M. J., Agyekum, W., Koussoubé, Y., Wanke, H., Kim, H., Wada, Y., Lo, M.-H., Oki, T., and Kukuric, N.: Observed controls on resilience of groundwater to climate variability in sub-Saharan Africa, Nature, 572, 230–234, https://doi.org/10.1038/s41586-019-1441-7, 2019.
Danandeh Mehr, A. and Attar, N. F.: A gradient boosting tree approach for SPEI classification and prediction in Turkey, Hydrol. Sci. J., 66, 1653–1663, https://doi.org/10.1080/02626667.2021.1962884, 2021.
Di Nunno, F. and Granata, F.: Spatio-temporal analysis of drought in Southern Italy: a combined clustering-forecasting approach based on SPEI index and artificial intelligence algorithms, Stoch. Environ. Res. Risk Assess., 37, 2349–2375, https://doi.org/10.1007/s00477-023-02390-8, 2023.
Di Nunno, F., De Matteo, M., Izzo, G., and Granata, F.: A Combined Clustering and Trends Analysis Approach for Characterizing Reference Evapotranspiration in Veneto, Sustainability, 15, 11091, https://doi.org/10.3390/su151411091, 2023.
Döll, P. and Fiedler, K.: Global-scale modeling of groundwater recharge, Hydrol. Earth Syst. Sci., 12, 863–885, https://doi.org/10.5194/hess-12-863-2008, 2008.
Gleeson, T., Wada, Y., Bierkens, M. F. P., and Van Beek, L. P. H.: Water balance of global aquifers revealed by groundwater footprint, Nature, 488, 197–200, https://doi.org/10.1038/nature11295, 2012.
Goyal, M. K. and Sharma, A.: A fuzzy c-means approach regionalization for analysis of meteorological drought homogeneous regions in western India, Nat. Hazards, 84, 1831–1847, https://doi.org/10.1007/s11069-016-2520-9, 2016.
Guilbert, M., Terray, P., Mignot, J., Ollier, L., and Gastineau, G.: Interhemispheric Temperature Gradient and Equatorial Pacific SSTs Drive Sahel Monsoon Uncertainties under Global Warming, J. Climate, 37, 1033–1052, https://doi.org/10.1175/JCLI-D-23-0162.1, 2024.
Hamdi, M., Goïta, K., Jerbi, H., and Zagrarni, M. F.: Modeling of the natural groundwater recharge under climate change: Sisseb El Alem Nadhour Saouaf basin (Central Tunisia) case study, Environ. Earth Sci., 79, 398, https://doi.org/10.1007/s12665-020-09010-6, 2020.
Hao, Z., Hao, F., Singh, V. P., and Zhang, X.: Changes in the severity of compound drought and hot extremes over global land areas, Environ. Res. Lett., 13, 124022, https://doi.org/10.1088/1748-9326/aaee96, 2018.
Hirsch, R. M. and Slack, J. R.: A nonparametric trend test for seasonal data with serial dependence, Water Resour. Res., 20, 727–732, https://doi.org/10.1029/WR020i006p00727, 1984.
Jones, P. D., Jónsson, T., and Wheeler, D.: Extension to the North Atlantic Oscillation using early instrumental pressure observations from Gibraltar and South-West Iceland, Int. J. Climatol., 17, 1433–1450, https://doi.org/10.1002/(SICI)1097-0088(19971115)17:13<1433::AID-JOC203>3.0.CO;2-P, 1997.
Krakauer, N. Y., Lakhankar, T., and Hudson, D.: Trends in Drought over the Northeast United States, Water, 11, 1834, https://doi.org/10.3390/w11091834, 2019.
Lüdecke, H. J., Müller-Plath, G., Wallace, M. G., and Lüning, S.: Decadal and multidecadal natural variability of African rainfall, J. Hydrol. Reg. Stud., 34, 100795, https://doi.org/10.1016/j.ejrh.2021.100795, 2021.
Lundberg, S. and Lee, S.: A unified approach to interpreting model predictions, Adv. Neural Inf. Process. Syst., 30, 4765–4774, 2017.
MacDonald, A. M., Bonsor, H. C., Dochartaigh, B. É. Ó., and Taylor, R. G.: Quantitative maps of groundwater resources in Africa, Environ. Res. Lett., 7, 024009, https://doi.org/10.1088/1748-9326/7/2/024009, 2012.
Musei, S. K., Nyaga, J. M., and Dubow, A. Z.: SPEI-based spatial and temporal evaluation of drought in Somalia, J. Arid Environ., 184, 104296, https://doi.org/10.1016/j.jaridenv.2020.104296, 2021.
Najafi, E. and Khanbilvardi, R.: Clustering and Trend Analysis of Global Extreme Droughts from 1900 to 2014, arXiv [preprint], https://doi.org/10.48550/arXiv.1901.00052, 2018.
Ndehedehe, C. E., Agutu, N. O., Ferreira, V. G., and Getirana, A.: Evolutionary drought patterns over the Sahel and their teleconnections with low frequency climate oscillations, Atmos. Res., 233, 104700, https://doi.org/10.1016/j.atmosres.2019.104700, 2020.
Nicholson, S. E.: The West African Sahel: A Review of Recent Studies on the Rainfall Regime and Its Interannual Variability, ISRN Meteorol., 2013, 453521, https://doi.org/10.1155/2013/453521, 2013.
Nigatu, Z. M., Fan, D., You, W., Melesse, A. M., Pu, L., Yang, X., Wan, X., and Jiang, Z.: Crop production response to soil moisture and groundwater depletion in the Nile Basin based on multi-source data, Sci. Total Environ., 825, 154007, https://doi.org/10.1016/j.scitotenv.2022.154007, 2022.
Ogunrinde, A. T., Emmanuel, I., Olasehinde, D. A., Faloye, O. T., Babalola, T., and Animashaun, I. M.: Impact of climate teleconnections on hydrological drought in the Sahel Region of Nigeria (SRN), Meteorol. Atmos. Phys., 136, 18, https://doi.org/10.1007/s00703-024-01016-0, 2024.
Okonkwo, C.: An Advanced Review of the Relationships between Sahel Precipitation and Climate Indices: A Wavelet Approach, Int. J. Atmos. Sci., 2014, 759067, https://doi.org/10.1155/2014/759067, 2014.
Panthou, G., Vischel, T., and Lebel, T.: Recent trends in the regime of extreme rainfall in the Central Sahel, Int. J. Climatol., 34, 3998–4006, https://doi.org/10.1002/joc.3984, 2014.
Roushangar, K. and Ghasempour, R.: Multi-temporal analysis for drought classifying based on SPEI gridded data and hybrid maximal overlap discrete wavelet transform, Int. J. Environ. Sci. Technol., https://doi.org/10.1007/s13762-021-03453-5, 2021.
Sarr, M., Moussa, A., Wade, M., Deme, E., and Diop, B.: Regional Climate Models in the Simulation of the Drought of the 1970's and 1980's Years in Senegal (In West Africa), J. Water Resour. Prot., 16, 585–604, https://doi.org/10.4236/jwarp.2024.169034, 2024.
Shutaywi, M. and Kachouie, N. N.: Silhouette Analysis for Performance Evaluation in Machine Learning with Applications to Clustering, Entropy, 23, 759, https://doi.org/10.3390/e23060759, 2021.
Sun, X., Lai, P., Wang, S., Song, L., Ma, M., and Han, X.: Monitoring of Extreme Agricultural Drought of the Past 20 Years in Southwest China Using GLDAS Soil Moisture, Remote Sens., 14, 1323, https://doi.org/10.3390/rs14061323, 2022.
Tan, C., Yang, J., and Li, M.: Temporal-spatial variation of drought indicated by SPI and SPEI in Ningxia Hui autonomous region China, Atmosphere, 6, 1399–1421, https://doi.org/10.3390/atmos6101399, 2015.
Taylor, R. G., Todd, M. C., Kongola, L., Maurice, L., Nahozya, E., Sanga, H., and Macdonald, A. M.: Evidence of the dependence of groundwater resources on extreme rainfall in East Africa, Nat. Clim. Change, 3, 374–378, https://doi.org/10.1038/nclimate1731, 2013.
Vicente-Serrano, S. M., Beguería, S., and Lopez-Moreno, J. I.: A multi-scalar drought index sensitive to global warming: the Standardized Precipitation Evapotranspiration Index, J. Climate, 23, 1696–1718, https://doi.org/10.1175/2009JCLI2909.1, 2010.
Vishwakarma, A., Choudhary, M. K., and Chauhan, M. S.: Non-parametric trend and the validity of a newly developed drought indicator for agricultural application over the central India region, Arab. J. Geosci., 15, 365, https://doi.org/10.1007/s12517-022-09631-0, 2022.
Wane, D., Dieng, A. L., Niang, C., and Gaye, A. T.: Northeastern Tropical Atlantic SST and Sahel Rainfall Variability, Atmos. Clim. Sci., 13, 431–454, https://doi.org/10.4236/acs.2023.134024, 2023.
Wilks, D. S.: On “Field Significance” and the False Discovery Rate, J. Appl. Meteorol. Climatol., 45, 1181–1189, https://doi.org/10.1175/JAM2404.1, 2006.