the Creative Commons Attribution 4.0 License.
the Creative Commons Attribution 4.0 License.
 | 03 Nov 2025
Altitudinal variation in impacts of snow cover, reservoirs and precipitation seasonality on monthly runoff in Tibetan Plateau catchments
Nan Wu
Amir Naghibi
Hossein Hashemi
Zhongrui Ning
Jerker Jarsjö
Understanding monthly runoff variability, its spatio–temporal characteristics, and key drivers under climate change and human impacts is crucial for long-term water resource management. However, current knowledge remains limited, especially in high-elevation, seasonally cold regions. Focusing on 10 sub-basins along an elevation gradient (1000 to 5900 ) in the hydrologically complex Yalong River basin, China, this study developed an extended Budyko framework based on monthly water balances (2002–2016), explicitly separating snow storage dynamics (ΔSsnow) from other terrestrial water storage changes (ΔS′), including those related to hydropower reservoir construction. Results showed that snow accumulation and snowmelt are main drivers of runoff seasonality in the upper sub-catchments, and their effects propagate to the lower-elevation snow-free sub-catchments, which are also subject to additional influence from hydropower reservoirs. This created pronounced altitudinal heterogeneity in drivers of monthly runoff, a phenomenon suggested but rarely quantified at high spatio–temporal resolution in other global regions. Furthermore, a decrease in runoff seasonality in the Yalong River at its Yangtze River outlet (that receives water from all 10 investigated sub-basins) was observed, this change appeared unrelated to snow storage changes and was more likely driven by trends in unfrozen precipitation seasonality and/or flow-modulating impacts of reservoirs, natural lakes and groundwater. Future snow thinning may exacerbate these trends. Implementing the variance decomposition method within the extended Budyko framework, the intra-annual runoff variability () was captured by calculating the variance and covariance of influencing factors, achieving R2 values above 0.9 in most sub-basins, and the rainfall (Pr) and ΔS′variances were identified as the main contributors. Methodologically, we have verified the substantial contribution of hydropower reservoir storage changes on total storage changes by independent analysis of reservoir storage data. These findings supported the applicability of the extended monthly Budyko framework for identifying dominant processes in the context of runoff generation and the rapid environmental changes that the Yalong River basin and other cold regions (not least of the Tibetan plateau) are currently experiencing.
- Article
(7622 KB) - Full-text XML
-
Supplement
(1029 KB) - BibTeX
- EndNote


Runoff is a key component of the hydrological cycle and is highly susceptible to external environmental factors, primarily climate change and human activities, which can lead to significant changes in hydrological processes (Bao et al., 2023). Climate variations such as precipitation intensity, rising temperature, and enhanced radiation not only affect the water vapor content in the atmosphere but also alter the surface characteristics of catchments (Li and Quiring, 2021). Moreover, extensive human activities such as reservoir construction increase the complexity of surface water flow, making accurate analysis of the hydrological cycle a challenge (Gutenson et al., 2020). Observations indicate that 24 % of the global river flow has undergone significant changes (Li et al., 2020). Runoff changes, influenced by evolving factors (Yao et al., 2020), show the sensitivity of hydrological cycles to climate conditions and surface characteristics (Huang et al., 2021). While intra-annual analysis of runoff response to climate variability and change provides vital information for the effective allocation of water resources, a significant amount of research is focused on multi-annual timescale analysis (Huo et al., 2021; Ning et al., 2017; Tu et al., 2015). Changes in monthly climate conditions and human activities largely drive variations in monthly runoff (Xin et al., 2019; Yao et al., 2020).
In many parts of the world, seasonal storage of snow and ice provides meltwater and secures water supply over the growing season (Qi et al., 2019). Although climate change impacts frequently act to reduce seasonal volumes of stored snow and ice, it is challenging to predict the consequences for runoff. This is partly due to the difficulty of disentangling such impacts from other influences on runoff, such as changes in precipitation and temperature, and reservoir construction (Gan et al., 2022). Benchmark estimates have shown that that snowmelt during the rainy season (April to June) contributed to 31 % of the annual runoff for the source regions of the Indus River, while the source regions of the Yellow River, Yangtze River, Mekong River, Thanlwin River, and Brahmaputra River received snowmelt from April to June, contributing to 20 %–23 % of the annual runoff (Zhang et al., 2013). Additionally, the snowfall-to-precipitation ratio has been found to exert a significant influence on both annual runoff and intra-annual runoff variation (Berghuijs et al., 2014; Liu et al., 2022; Zhang et al., 2015a).
Recent studies on this topic have also shown evidence of decreased runoff seasonality, e.g. in snow-dominated rivers of central Europe (Rottler et al., 2020). In cold regions of China, water storage and runoff characteristics show quite complex spatio–temporal patterns over the last 30 years (Fang et al., 2019). This is particularly the case in the downstream regions that use reservoirs to alter the intra-annual hydrological cycle and store water to ensure a sustainable water supply during dry seasons in the face of agricultural, industrial, and domestic demands (Shen, 2018). More generally, water storage in lakes, reservoirs and groundwater aquifers may contribute considerably to monthly runoff dynamics (Bai et al., 2018; Hwang and Devineni, 2022; Shi and Gao, 2022). It is hence most likely that distinct differences in drivers of monthly runoff exist across altitudinal gradients of different mountainous regions of the world (Kuhn et al., 2016; Rottler et al., 2020; Shen, 2018), although the details of such patterns are largely unexplored. Zhang et al. (Zhang et al., 2016a) emphasized that main factors (e.g., human activities and climate-driven changes in runoff) that affect the runoff variance deserve more attention. A more detailed understanding of intra-annual runoff characteristics in mountainous watersheds under changing environments combined with attribution analyses are crucial for sustainable water resource management (Dethier et al., 2020; Liu et al., 2017).
Precipitation and potential evapotranspiration define catchment water availability and storage capacity (Huang et al., 2021; Li et al., 2021; Yao et al., 2020). On a multi-year scale, precipitation is partitioned into evapotranspiration and runoff, reflecting competition between water supply (precipitation) and available energy (potential evapotranspiration) and regulated by the corresponding underlying surface characteristics (Wu et al., 2018). To analyze annual and multi-year scale hydrological processes considering rainfall and runoff changes, the Budyko framework has been widely used (Choudhury, 1999). The framework was initially developed to address water resource constraints through multi-year averages (Kazemi et al., 2021; Wang and Tang, 2014; Yang et al., 2008; Zhang et al., 2004) and has been widely applied to quantitatively analyze the impact of climate change and human activity on runoff (Liu et al., 2021; Wang and Tang, 2014; Xu et al., 2014). However, since this framework assumes multi-year, steady-state conditions, it is not applicable at intra-annual timescales. Furthermore, most assessments investigate the main drivers only by comparing runoff sensitivity, rather than their relative contribution to the actual variance of runoff (Liu et al., 2019a).
Recently, some studies have attempted to extend the Budyko framework to intra-annual timescales, mainly by including monthly terrestrial water storage changes as part of the water supply (Du et al., 2016; Liu et al., 2019a) and establishing a new water supply-demand relationship on monthly scale (Huang et al., 2021; Wu et al., 2019). Other studies have also integrated monthly terrestrial water storage in water balance using the Budyko framework along with hydrological models (Yao et al., 2020; Zhang et al., 2020). Some studies have demonstrated that incorporating terrestrial water storage significantly enhances predictability compared to the previous precipitation and potential evapotranspiration relationship (Wu et al., 2018; Zhang et al., 2010). Although the extended Budyko framework has been effective to analyze monthly runoff changes, the attribution analysis of intra-annual runoff changes needs to consider more driving factors, particularly due to the complexity and interaction of climate change and human activities in the cold mountainous regions (Liu et al., 2018; Luo and Lau, 2018). Equally important from a process understanding perspective is the consideration of sufficiently fine-resolved temporal and spatial scales (Fang et al., 2016).
The Qinghai-Tibet Plateau, often referred to as the “Third Pole”, is a region where the atmosphere, hydrosphere, cryosphere, and biosphere intricately interact (Bao et al., 2023; Cui et al., 2023). Snow accumulation begins in the fall, lasting until the subsequent spring, and in some high-altitude areas, snow cover persists even into the summer months (Wang et al., 2018; Wu et al., 2012). Snowmelt runoff stands as a crucial component of the primary runoff source on the Qinghai-Tibet Plateau, exhibiting distinct seasonal variations and primarily impacting spring runoff (Gao et al., 2017; Han et al., 2019).
We here consider the Yalong River basin, situated between 1000 and 5900 in the southeastern part of the Tibetan Plateau, which experiences seasonal snow cover in its upstream regions (with few glaciers, which can be ignored; Qi et al., 2022), while the construction of downstream cascade hydropower stations has greatly affected terrestrial water storage capacity. These factors exert significant influences on regional water cycling, especially at the intra-annual scales (Wang et al., 2018; Wu and Shen, 2007). Therefore, this study aims to (1) extend the Budyko framework to distinguish between snow storage change (ΔSsnow) and remaining water storage change (ΔS′) in monthly water balances; (2) determine interannual and intra-annual variations of hydrological variables including runoff (R), rainfall (Pr), snowmelt (Smelt), evapotranspiration (E) and terrestrial water storage change (ΔS) in nested catchments along a pronounced altitudinal gradient, and (3) examine how relationships between runoff and other factors can vary with elevation, including assessments of major contributors to runoff variation (using variance decomposition analysis); and (4) discuss wider implications including the susceptibility of the identified monthly runoff contributors to climate-change and other human impacts.
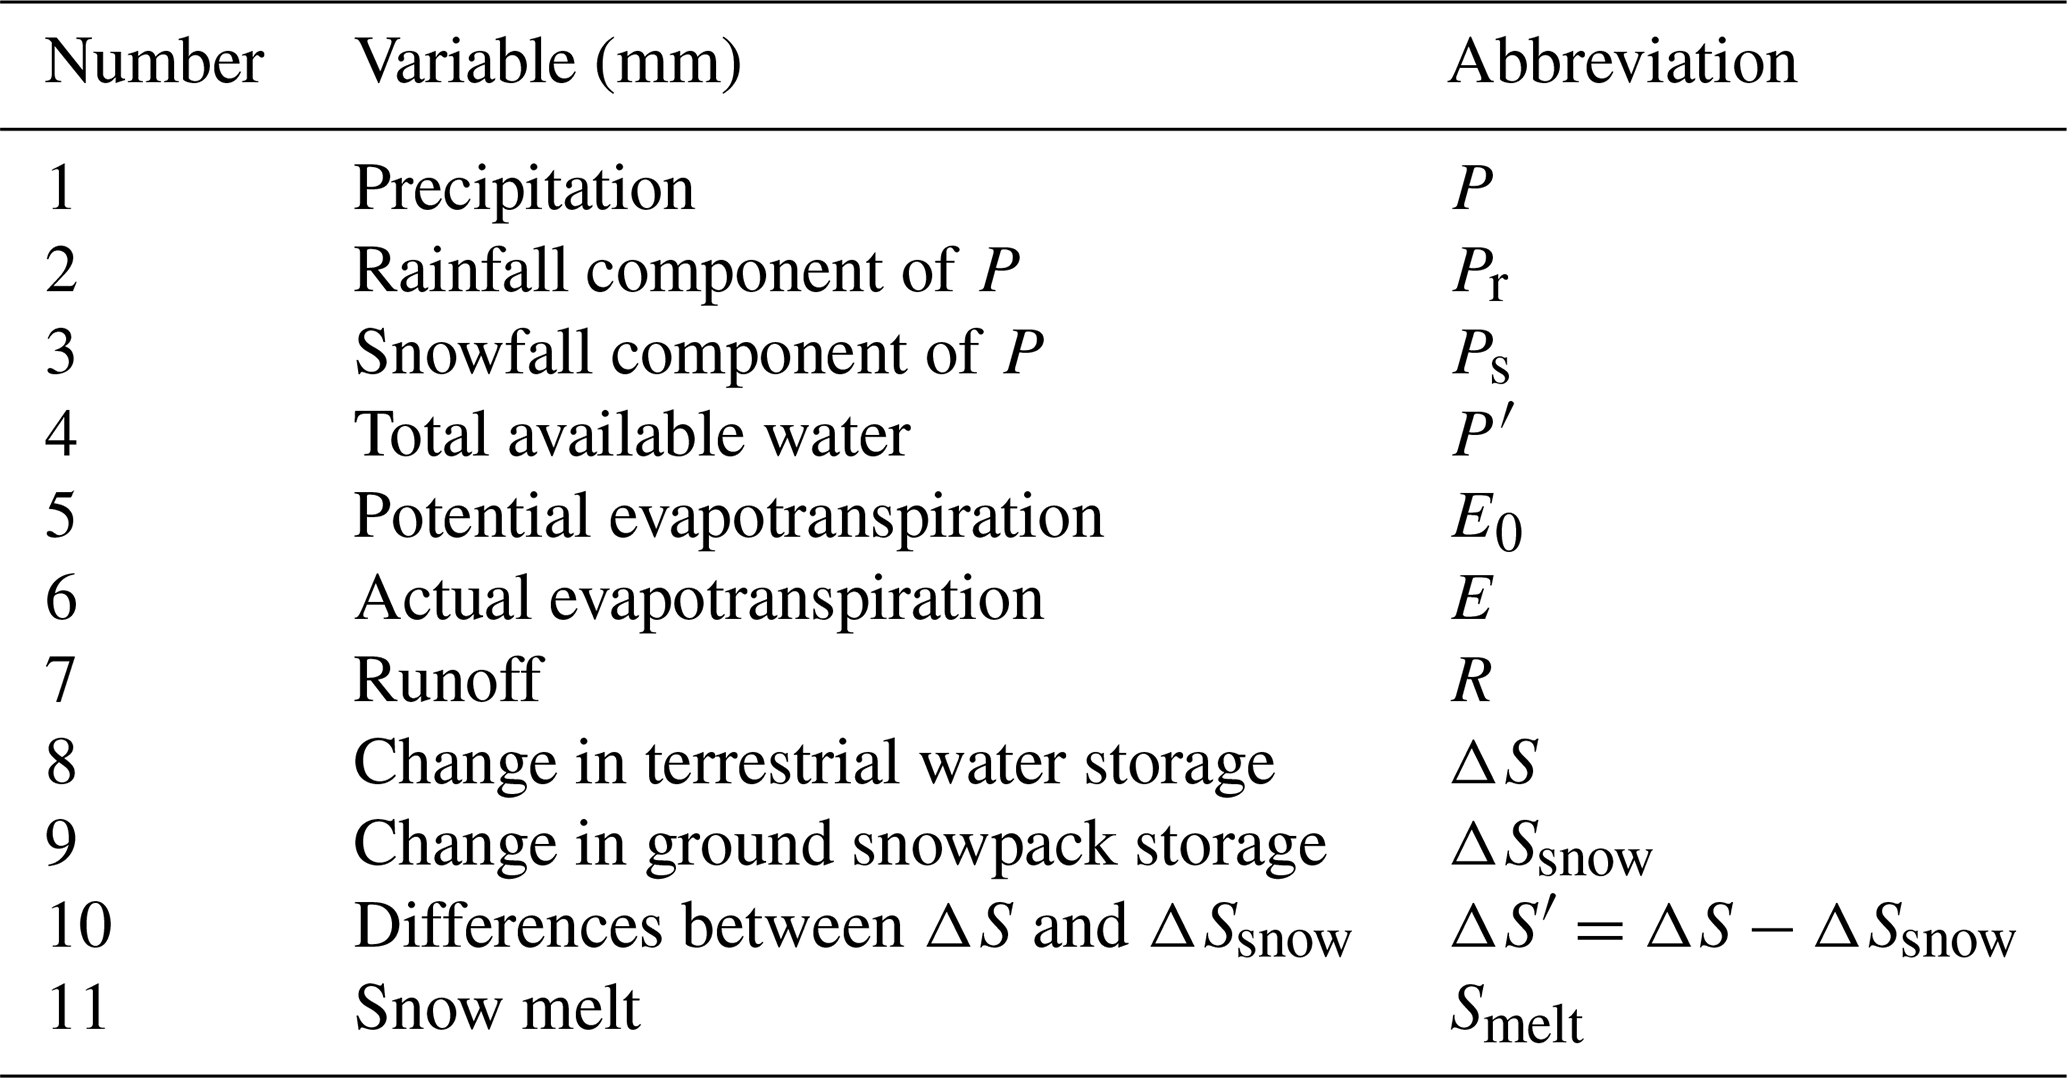
In this section, the representative study area and the required data for this study are introduced in Sect. 2.1, while the theoretical framework for attributing runoff variability based on the extended Budyko is described in Sect. 2.2. Table 1 presents the variables and acronyms used in this study.
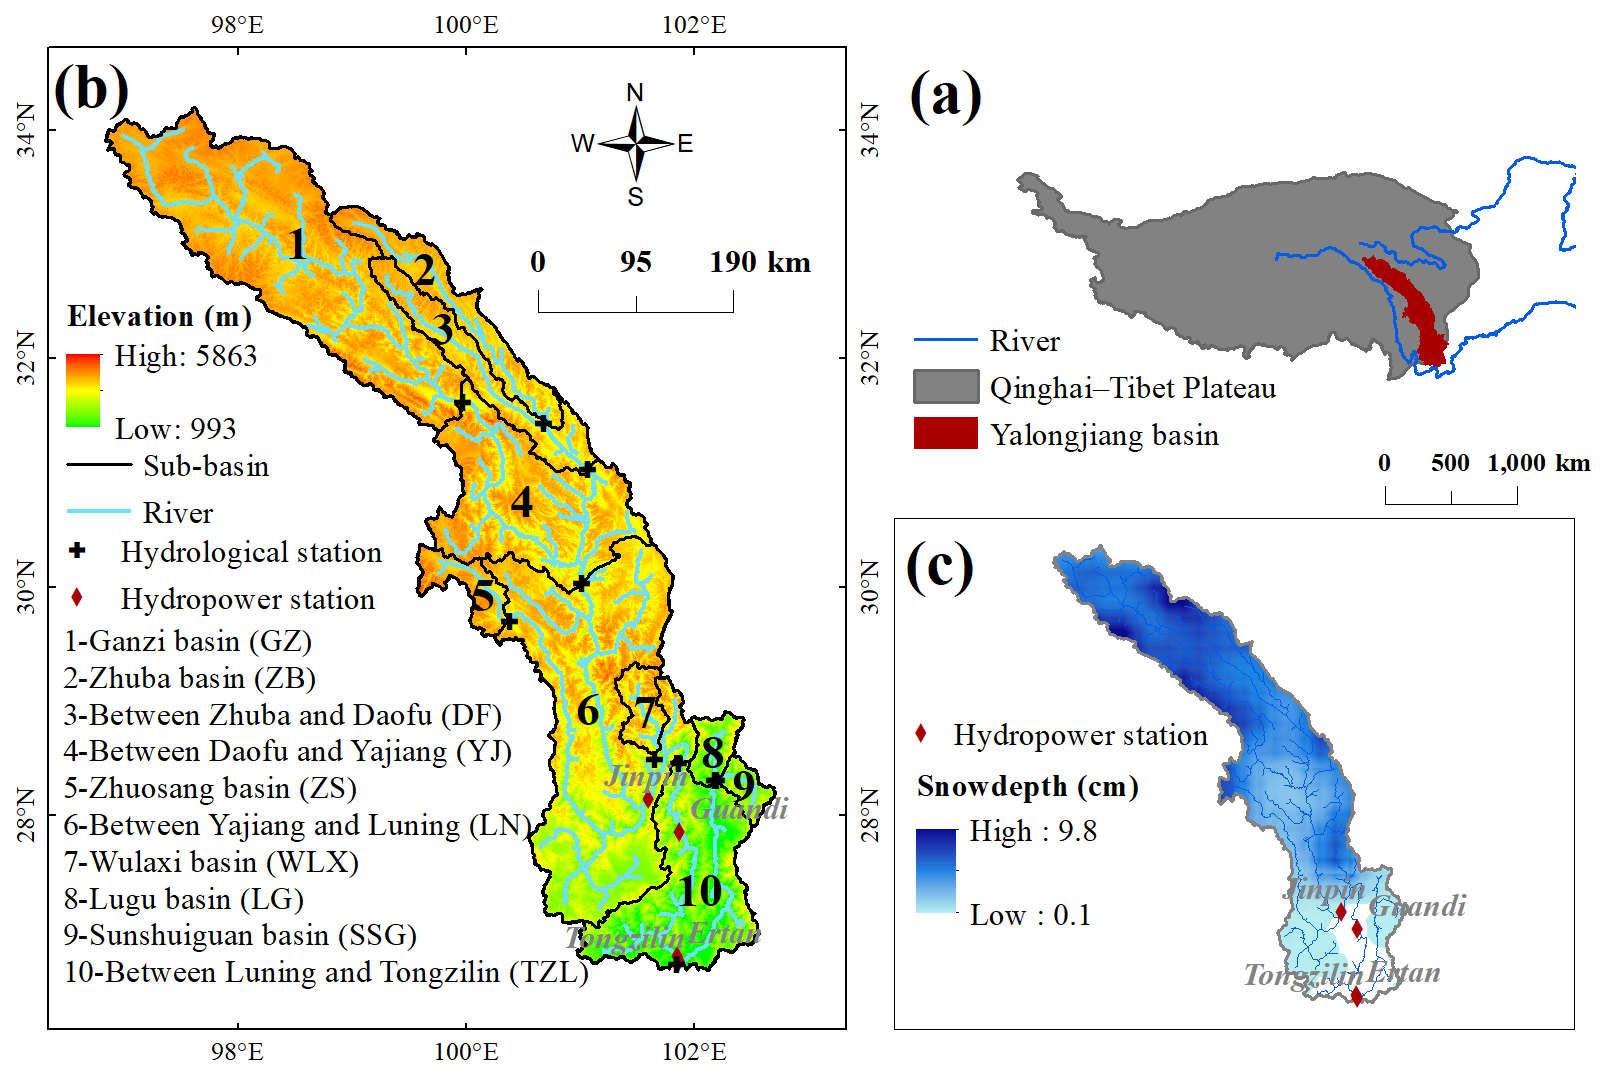
Figure 1(a) Geographic locations, (b) elevation of the 10 sub-basins (based on data from the U.S. Geological Survey), and (c) mean annual snow depth (based on data from the National Tibetan Plateau Data Center) for the period 2002–2016 in the Yalong River basin.
2.1 Study area and data
2.1.1 Study area
The Yalong River is the largest tributary of the Jinsha River, which forms the upper reaches of the Yangtze River. Encompassing a wide range of altitudes (1000–5900 ) and hydro-climatic conditions, and increasingly impacted by human activities such as hydropower development, the Yalong River basin serves as an ideal case study to test our method. It flows from northwest to southeast, with a total length of 1570 km and a drainage area of 128 000 km2. Due to the complex topography, meteorological observations in the upper reaches are limited (Fig. 1). Precipitation and temperature generally increase from north to south, with summer temperatures ranging from −3 °C in the north to 26 °C in the south, and winter temperatures from −18 to 14 °C. Annual precipitation ranges from 600–800 mm in the upper region, 1000–1400 mm in the middle region, and 900–1300 mm in the lower region. The rainy season occurs from June to October. The annual average discharge at the confluence with the Yangtze River is 1900 m3 s−1, with a total annual runoff of nearly 60 billion m3, accounting for 13 % of the upstream flow of the Yangtze River (He et al., 2015).
The Yalong River is renowned for its abundant hydropower resources. The middle and lower reaches have been designated as a national hydropower base, ranking third among the 13 major hydropower bases in China Wu et al., 2024). In the downstream section, the construction of five major hydropower stations – including Jinping I (2013), Jinping II (2013), Guandi (2012), Ertan (1999), and Tongzilin (2015) – has significantly altered terrestrial water storage and flow regimes Wu et al., 2024).
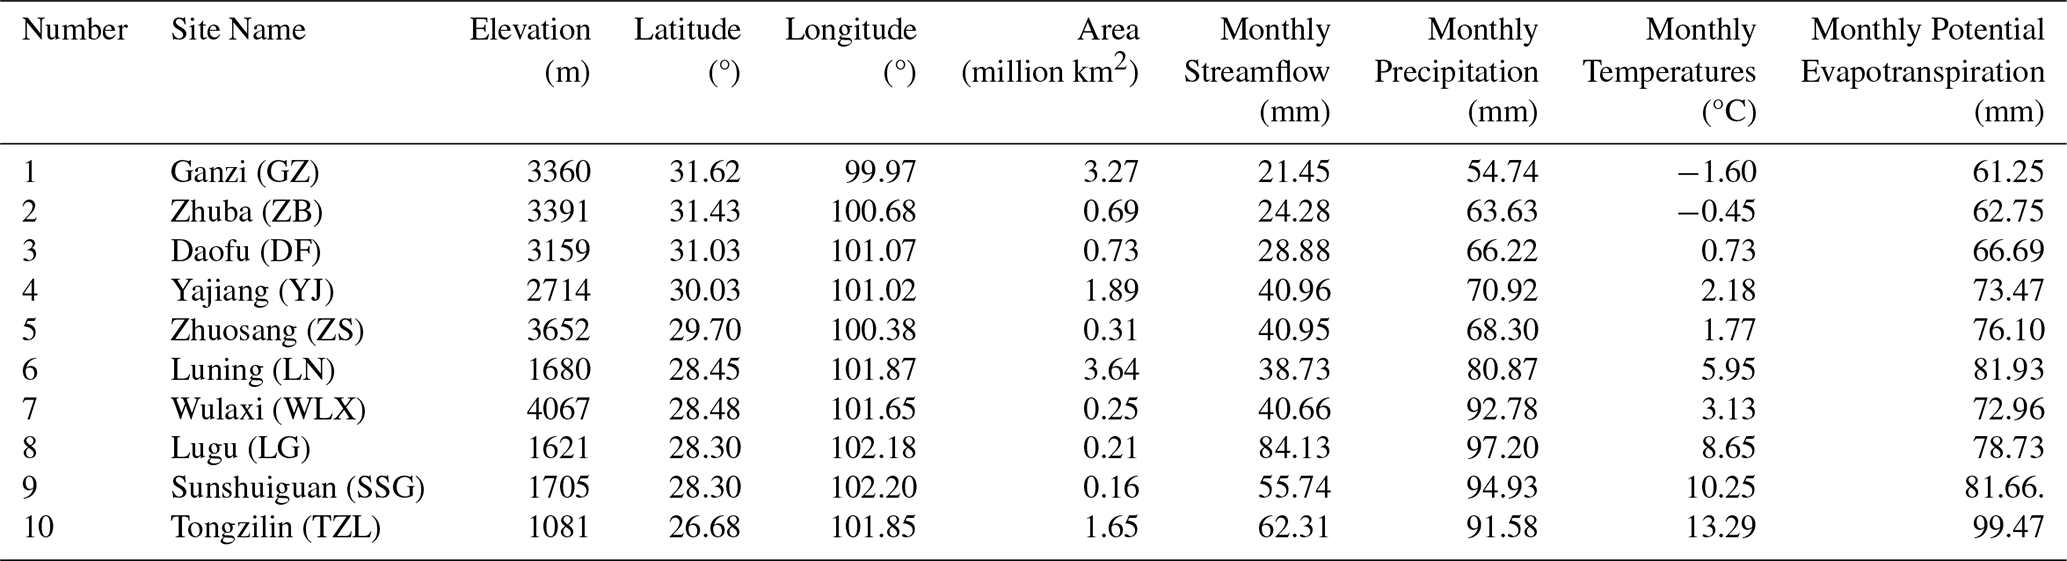
Table 2Location of outlet stations in 10 sub-basins and basic hydrological and meteorological information.
To assess the spatially varying impacts of hydropower regulation on runoff seasonality, the Yalong River basin was divided into ten sub-basins, forming a nested catchment structure. The upstream sub-basins, located in high-altitude regions, are primarily influenced by seasonal snow accumulation and melt, while glaciers are sparse and thus negligible. These areas experience limited human interference, serving as relatively natural or minimally disturbed reference catchments. In contrast, the downstream sub-basins are heavily regulated by cascade hydropower operations, which have significantly modified water storage dynamics and streamflow patterns. This upstream–downstream contrast enables a comparative analysis of natural versus regulated runoff responses within the Budyko framework. The sub-basins were delineated based on the distribution of hydrological stations (Fig. 1), and the coordinates and basic hydrological and meteorological characteristics of each sub-basin are listed in Table 2.
2.1.2 Dataset
The average monthly runoff records during the period 2002–2016 at 10 hydrometry stations were obtained from the China Hydrological Yearbook provided by the Ministry of Water Resources of China (Ministry of Water Resources of China, 2002–2016). This period was chosen because it represents the timeframe during which consistent runoff data were available for all ten sub-basins. Moreover, this period enables an assessment of the impacts of reservoir construction and operation on the hydrological processes in the region. Table 2 gives information about the locations of stations and their corresponding sub-basins, including runoff, precipitation, temperature, and potential evapotranspiration. The first column represents the labels of the 10 sub-basins, as depicted in Fig. 1, with the Tongzilin Hydrological Station serving as the controlling station for the entire Yalong River basin.
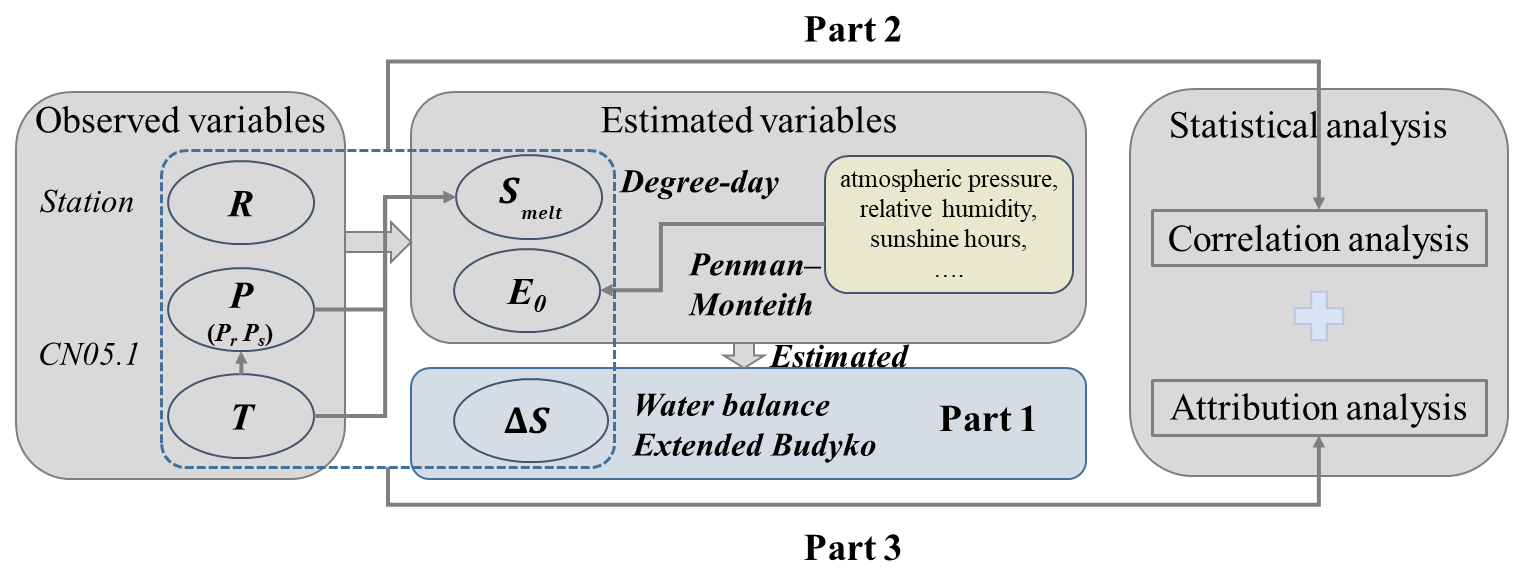
Figure 2Flowchart of the extended Budyko framework. Italic text represents the data source, and italic-bold text represents the calculation method for obtaining the data.
For meteorological data, the CN05.1 dataset (1961–2020) was utilized in this study, which provides a daily grid resolution of 0.25° × 0.25°, covering various meteorological variables, including precipitation, temperature, atmospheric pressure, relative humidity, sunshine hours, and wind speed across China (Wu and Gao, 2021). The dataset has been generated by interpolation of data from over 2400 observation stations throughout China using the “abnormal method” (New et al., 2000). Digital Elevation Model data at a 1 km resolution were sourced from the U.S. Geological Survey (USGS) (USGS EROS, 2018) (https://www.usgs.gov /centers/eros/science/usgs-eros-archive-digital-elevation-global-30-arc-second-elevation-gtopo30, last access: 29 August 2025). This study used a dataset of the spatial distribution of degree-day factors for glaciers and snow in High Mountain Asia (Zhang et al., 2019), which was derived from observations over 40 glaciers. The spatial resolution of this dataset is 0.5°, with units of . The evapotranspiration data was derived from GLEAM (Global Land–surface Evaporation: the Amsterdam Methodology; Miralles, 2024) (1980–2020), which combines a wide range of remote sensing observations to derive daily actual evapotranspiration and its different components, including snow sublimation (Miralles et al., 2011).
2.2 Methods
Figure 2 provides an overview of the workflow applied in this study, summarizing the extended Budyko calculations and the subsequent statistical analyses, which are organized into three main parts. Part 1 corresponds to the estimation of monthly water balance components across the ten sub-basins of the Yalong River basin using observed temperature (T), precipitation (P), and runoff (R) data. These calculations follow the extended Budyko framework introduced in Sect. 2.2.1, and the derived hydrological variables are listed in Table 1. In addition to two relatively large headwater catchments and four smaller ones, four nested catchment areas were also considered (see Sect. 2.1.1 for details). For each nested catchment, the net runoff (R) at a given time was calculated as the difference in measured discharges () between the downstream and upstream gauging stations, divided by the difference in catchment areas (). For the headwater catchments, Qup and Aup are per definition equal to zero. Part 2 involves exploring the statistical relationships between R and the hydrological variables (including potential drivers of R, such as Pr, Smelt, ΔS, and E; Table 1). This analysis focuses particularly on identifying any lag times in the runoff response to precipitation events and is described in Sect. 2.2.2. Part 3 consists of quantifying the relative contributions of different driving factors to monthly runoff variability through a variance decomposition approach, as explained in Sect. 2.2.3. Together, these three parts provide a comprehensive framework for investigating the processes that control intra-annual runoff variability in the Yalong River basin. All hydrological variables used in this study are summarized in Table 1.
2.2.1 Extended Budyko framework by decomposing ΔS
The present analyses use water balance methods based on the Budyko hydrothermal coupling theory, which, compared with statistical empirical methods, offers clearer physical meaning and is easier to calculate and parameterize (Hwang and Devineni, 2022; Shi and Gao, 2022). The partitioning of annual precipitation into evapotranspiration and runoff is governed by the balance between available water and energy (Huang et al., 2021), and several empirical equations have been developed to characterize this relationship. (Choudhury, 1999; Wang and Tang, 2014; Yang et al., 2008; Zhang et al., 2004), We consider one of the most popular equations, namely Choudhury-Yang:
where potential evapotranspiration (E0, mm) and precipitation (P, mm) act as indicators for energy and water supply, respectively, and where E (mm) is the calculated actual evapotranspiration, and n is a landscape parameter, mainly expressing impacts of prevailing surface conditions within the basin.
The water balance equation on the decadal time scale for a basin can be expressed using Eq. (2), wherein P represents the total water input to the basin. The outputs comprise runoff (R, mm) and evapotranspiration (E, mm).
The change in terrestrial water storage can be assumed to be approximately 0 on the decadal time scale, while on the intra-annual time scale, it cannot be neglected (Huang et al., 2021; Xu et al., 2012):
In order to consider the dynamic changes of monthly snow accumulation and melting separately, P was differentiated into rainfall (Pr, mm) and snowfall (Ps, mm) using daily temperature thresholds (Widen-Nilsson et al., 2007), and the terrestrial water storage change was also divided into two components: one accounts for snow storage change (ΔSsnow, mm), and the other represents the remaining storage changes (ΔS, mm; mainly including storage changes in surface water, groundwater and soil water). Thus, Eq. (3) can be expressed as:
In this study, the cumulative value of daily Pr (and Ps) was calculated based on daily temperature to derive monthly Pr (and Ps). ΔSsnow is mainly supplied in solid form by Ps and depleted in liquid form by melting snow (Smelt, mm). Equation (4) can then be expressed as:
The monthly water balance equation can be written as:
Therefore, the total available water (P′) for E and R is expressed as the sum of Pr, Smelt and ΔS (Zeng and Cai, 2015). Accordingly, Eq. (6) can be modified as follows:
Combining Eqs. (1) and (7), an extended Budyko framework with a parameter n can be formulated as:
In this study, the Penman–Monteith method (Allen et al., 1998) was used for E0 calculation. Consistent with the FAO Irrigation and Drainage Paper No. 56, the Penman–Monteith method is recognized as a physically based and reliable approach for estimating E0, and is often used as a benchmark for evaluating empirical methods (Chen et al., 2005). It has also been widely applied to estimate evapotranspiration from snow surfaces (Stigter et al., 2018; Xin et al., 2021), considering it a saturated or unstressed surface similar to water surfaces (Yang and Bai, 2023) . Due to the high albedo of snow surface, the outgoing radiation is often greater than the incoming radiation, leading to negative net radiation in many snow-covered areas. Since the evaporation mechanisms under negative net radiation condition are still not well understood, E is assumed to be 0 when the net radiation is less than 0, following (Gan et al., 2022).
Therefore, the monthly runoff R can be expressed as:
in which R was obtained from direct discharge measurements, and Smelt was computed using the degree-day method. The n parameter is primarily employed to characterize the underlying surface conditions, including factors such as average slope (Zhang et al., 2004) and vegetation type or land use (Bounoua et al., 2004). Although n may vary over long-term scales due to landscape changes, it typically remains stable at shorter, monthly timescales. Therefore, following Huang et al. (2021), we assumed that n can be treated as constant value for monthly scales. We hypothesized and tested our assumption, n, by calculating the evapotranspiration using the Budyko and extended Budyko. As shown in Table S1 in the Supplement, the results demonstrated a high correlation coefficient between the two models, supporting our assumption of a constant n. Based on this, the monthly ΔS was calculated by closing the water balance.
The degree-day method was adopted for Smelt estimation as it requires only readily available temperature data and straightforward calculations, while offering comparable accuracy to the energy balance method at the basin scale (Hock, 2003). This method assumes a strong positive linear relationship between temperature and snowmelt. The fundamental equation, presented as Eq. (10), states that if the daily temperature (Ti) exceeds a threshold temperature (T0), the Smelt is determined by the degree-day factor (D, ) and temperature:
In this method, the parameter D typically falls within the range of 2.5–14 , with specific values described in Sect. 2.2.2. T0 is commonly assumed to be 0 °C, and Smelt is constrained by the presence of existing snow depth.
2.2.2 Cross correlation analysis
Runoff is influenced by various natural and geographical factors. To further examine the relationships between R and individual hydrological drivers (such as , E), we applied partial correlation analysis, which allows us to control for the effects of other variables. Before performing these correlation analyses, all time series were detrended to minimize the influence of long-term trends that could otherwise bias the estimated relationships Wu et al., 2024). This approach helps to isolate the independent contribution of each variable to runoff variability, reducing confounding effects from other hydrological processes.
In addition, because runoff responses in the basin tend to become smoothed and delayed after undergoing complex surface and subsurface hydrological processes (Brutsaert and Hiyama, 2012), we introduced the variable τ to characterize the lag time between monthly precipitation events and corresponding runoff responses in the Yalong River basin. τ was calculated within a range of 0 to 5 months, with statistical significance assessed at a threshold of p≤ 0.05.
2.2.3 Quantifying the contributions of different factors to runoff variability
Equation (9) could be expressed as ). The variance of R (within a year) is determined by the variance of each driving factor () and their covariance (Ye et al., 2015):
Hence, Eq. (11) are utilized to compute the contributions of the variance of each driving factor () and their covariance to intra-annual runoff variability for the period 2002–2016.
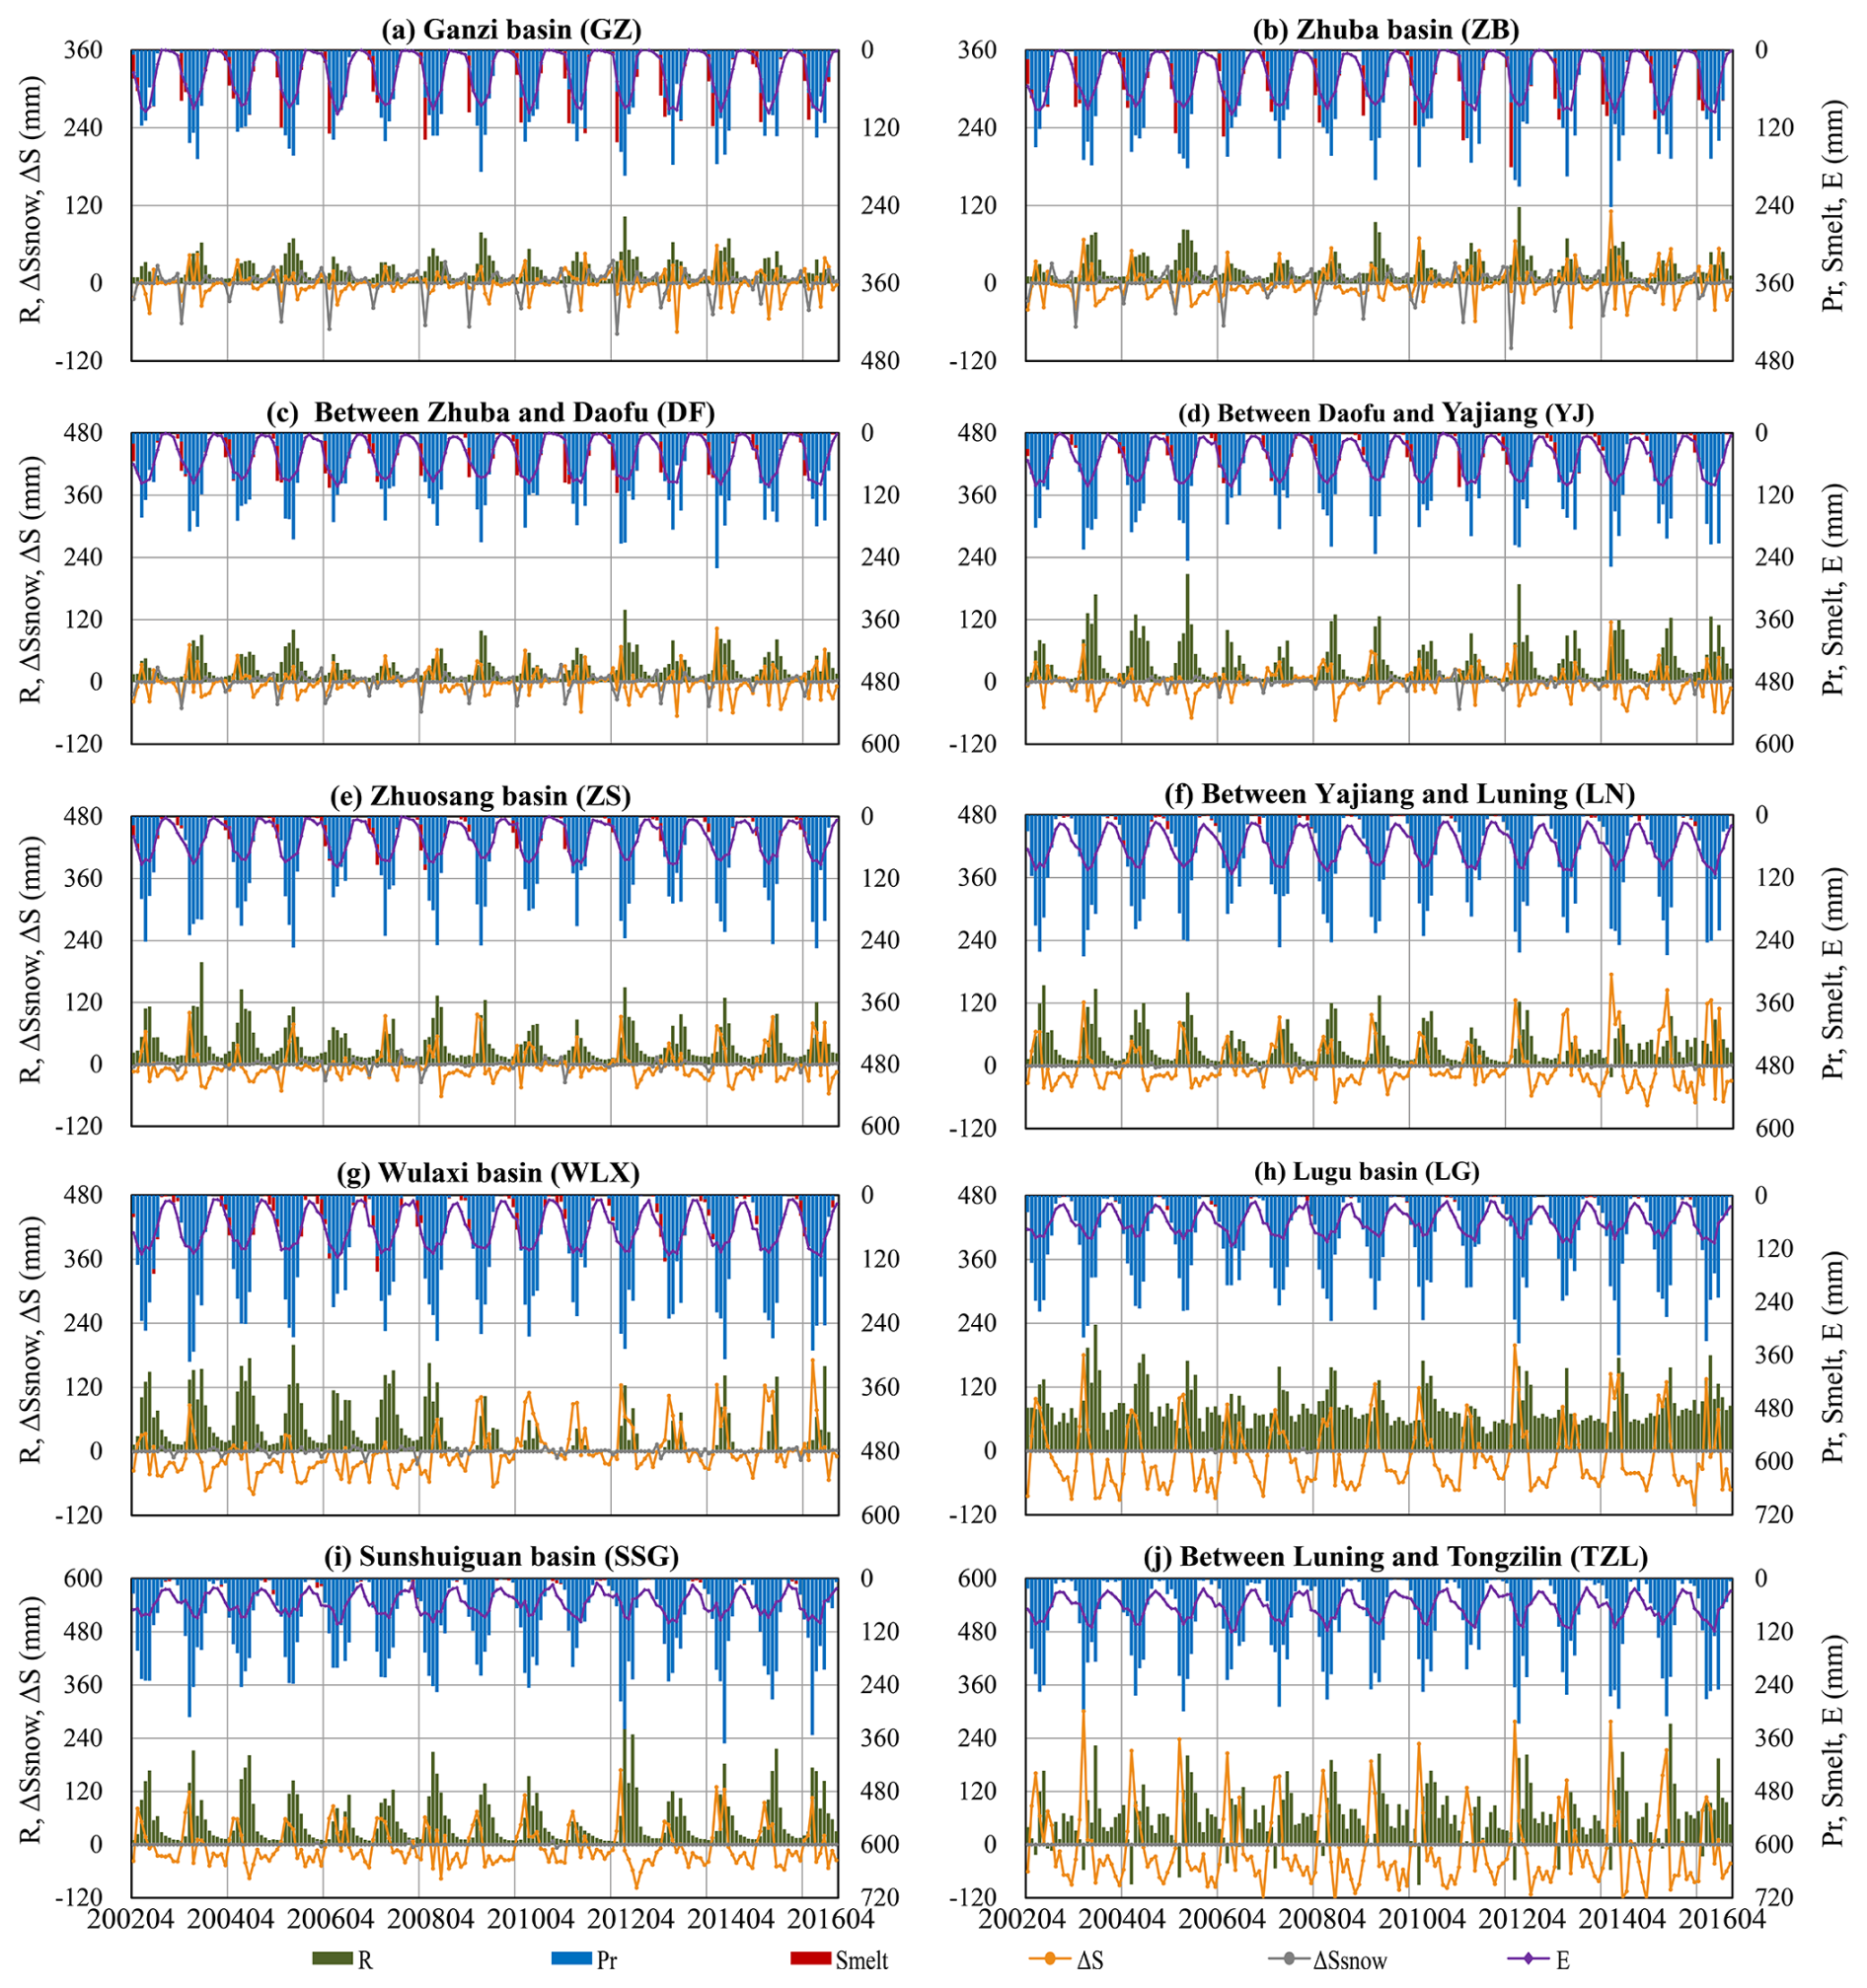
Figure 3Time series of runoff (R), rainfall (Pr), snowmelt (Smelt), total storage change (ΔS), snow storage change (ΔSsnow) and evapotranspiration (E) from 2002 to 2016 in the 10 sub-basins.
3.1 Intra-annual changes in hydrological variables
Figure 3 depicts the full time series of Pr, Smelt, E, R,ΔSsnow, and ΔS of 10 sub-basins within the Yalong River basin from 2002 to 2016. It should be noted that R refers to the net runoff generated locally within the sub-basin, which in case of nested basins (DF, YJ, LN and TZL) excludes flows generated by areas further upstream. Figure 3 shows that Pr exhibited pronounced interannual variation and was additionally higher in downstream areas. Smelt and ΔSsnow primarily occurred in the middle and upper reaches, including upstream sub-basins such as GZ, ZB, DF and YJ (Fig. 3). Lower reaches subbasins with ΔSsnow=0 (WLX, LG, SSG, TZL) would hence per definition have (ΔS>0 means storage water, otherwise release). Within upstream areas E approached zero in the winter. Notably, the R and ΔS in WLX underwent an abrupt change in 2009, demonstrating a significant decrease in R and general increases in ΔS. The R decrease may in part be caused by filling of reservoirs and reservoir-induced increases in ΔS. In LN, the R and ΔS began to change around 2013, with locally created R fluctuating gently and ΔS starting to show pronounced intra-annual fluctuations including considerably higher positive values, which is consistent with the construction period of the Jinping hydropower station including the filling of the dam and the start of intra-annual flow regulations. In the upstream sub-basins unaffected by reservoir regulation, long-term ΔS values fluctuated around zero, suggesting that the hydrological system remained balanced under natural conditions. In contrast, the downstream sub-basins influenced by reservoir operations (e.g., WLX, LG, TZL) exhibited larger and more frequent fluctuations in ΔS, predominantly negative. This pattern was likely due to the cumulative effects of long-term reservoir regulation in the study area. Additionally, the periodic characteristics of R (more runoff in summer and less in winter) in lower elevation regions of LG and TZL were not as clear as in other regions, and the amplitude of ΔS varied significantly, including sharp transitions. There were even individual negative values of net R in TZL. Such phenomena are closely related to the influence of reservoirs (including hydropower dams) on the net runoff in nested catchment segments, where monthly outflow may be lower than monthly inflow, for instance when a hydropower dam near the outlet of a nested catchment temporarily stores more water (ΔSdam) than what is created from local (positive) R+ΔS just upstream of the dam.
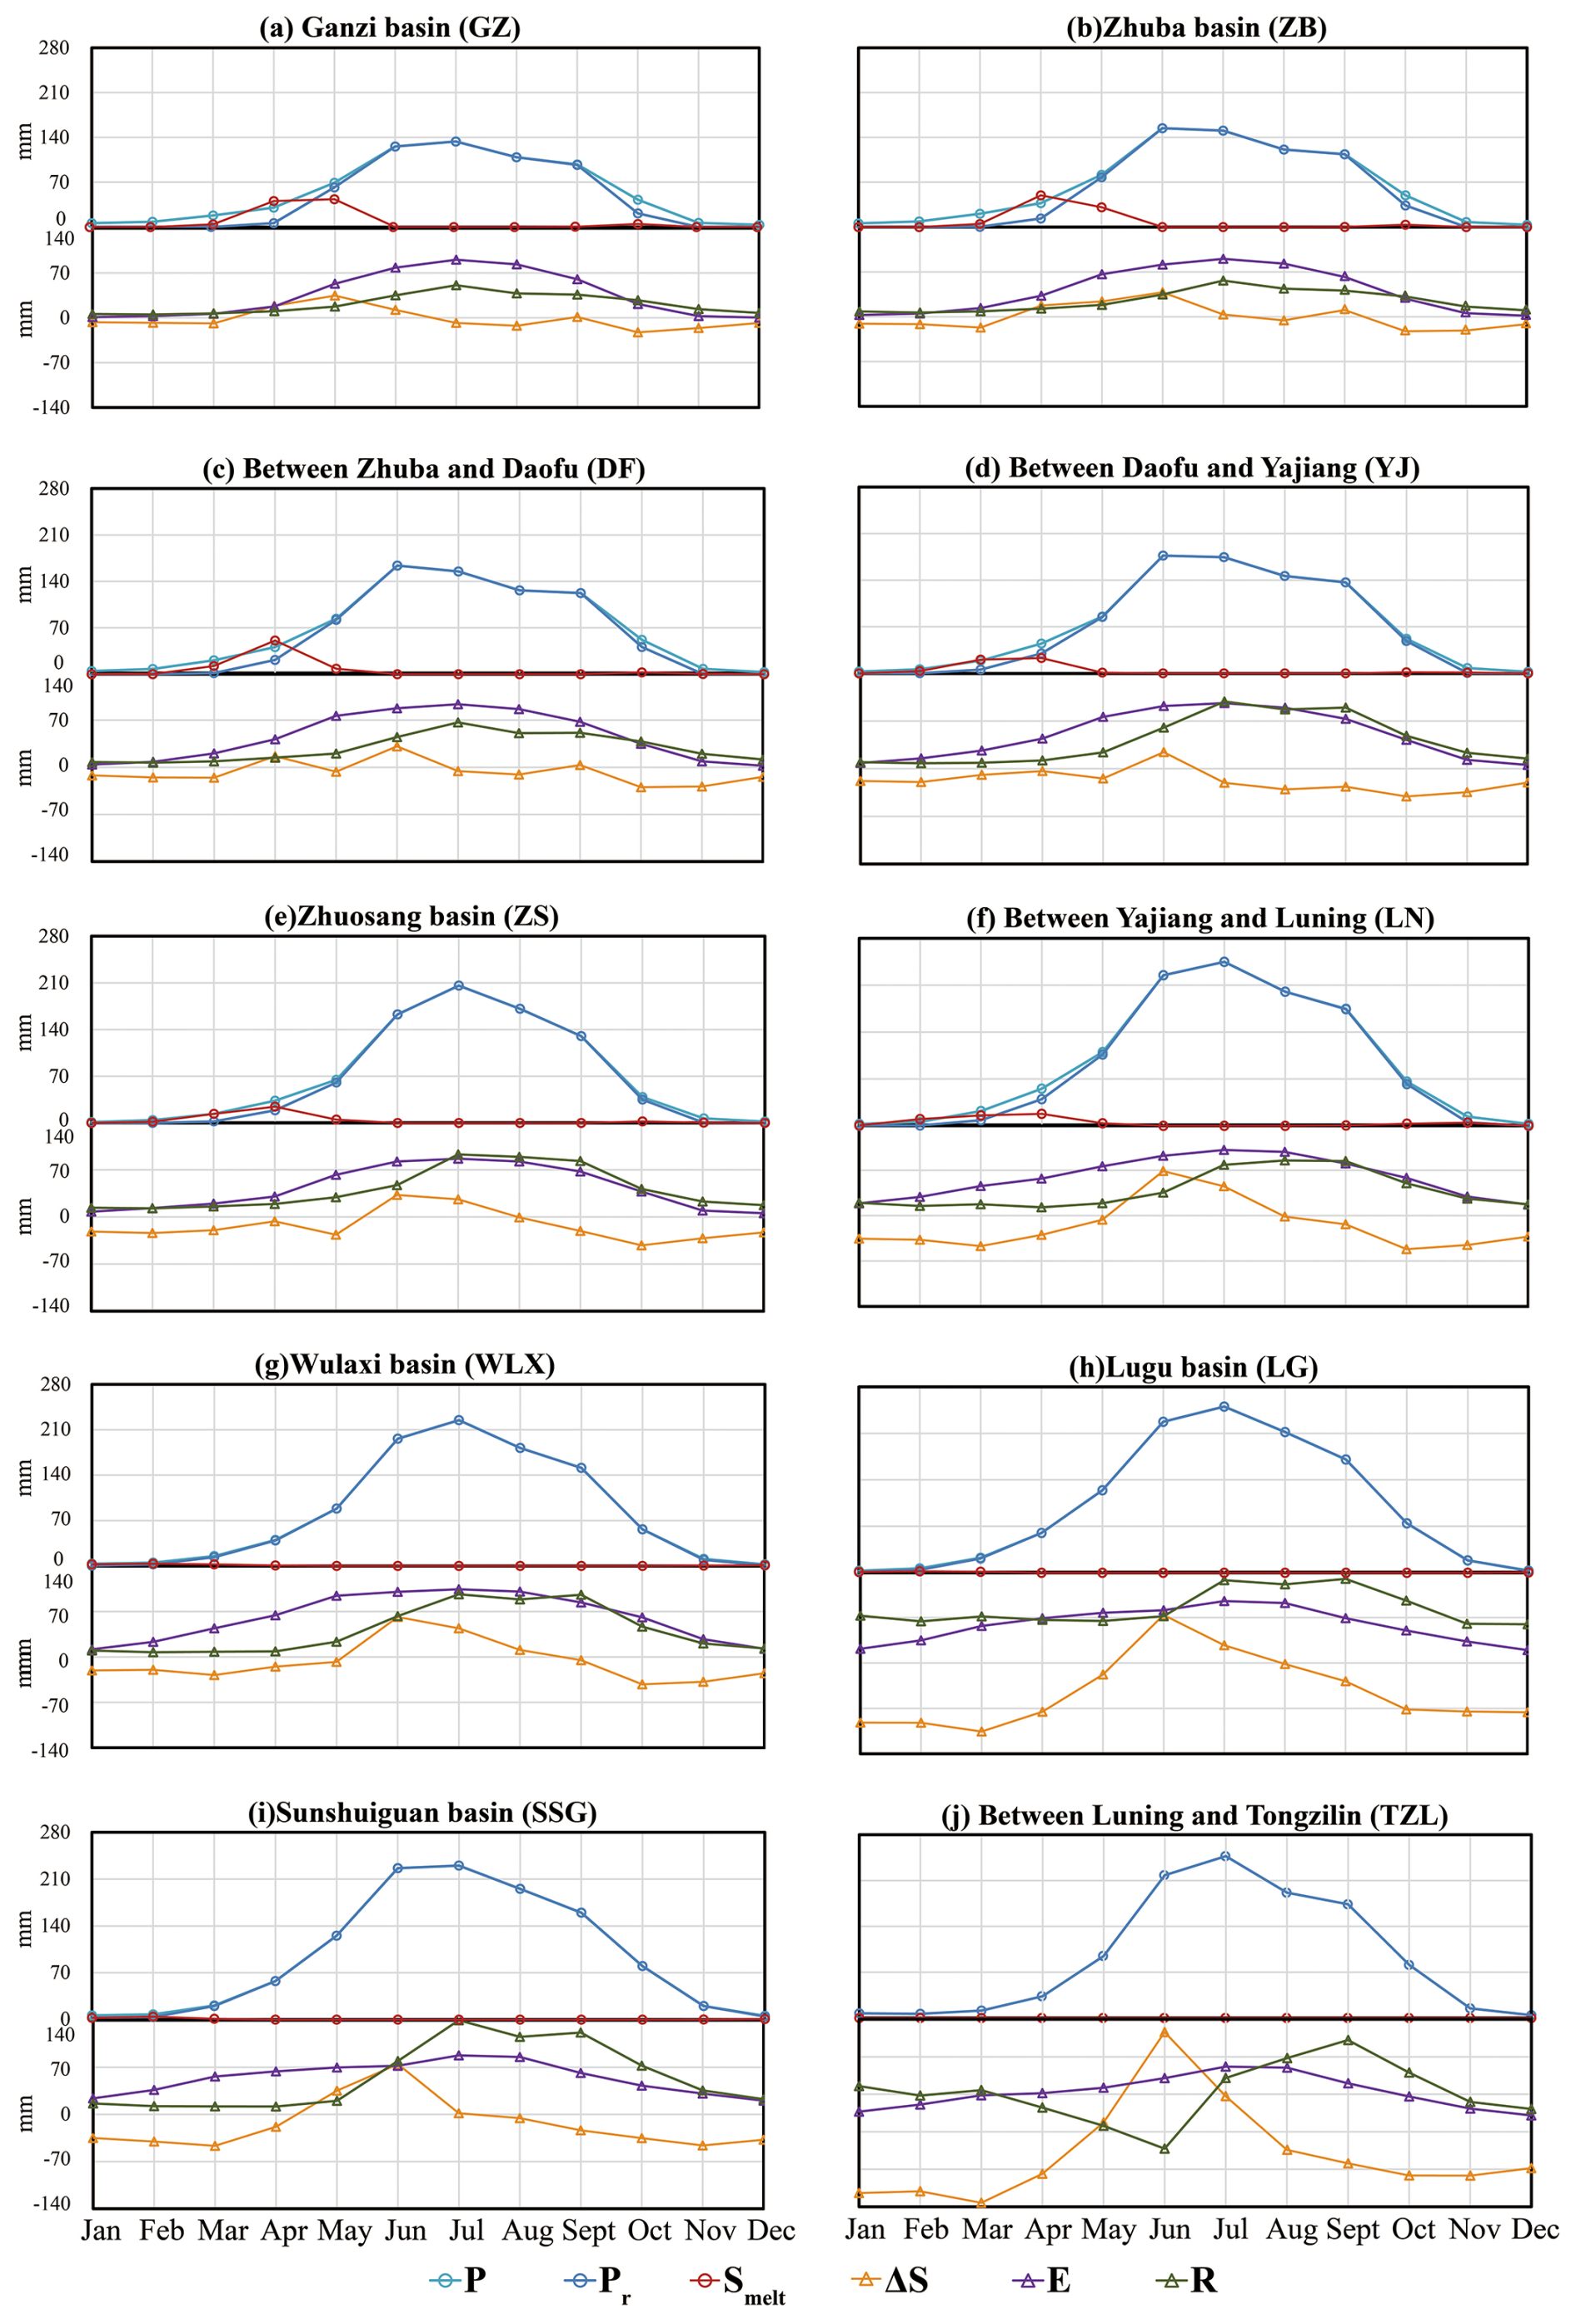
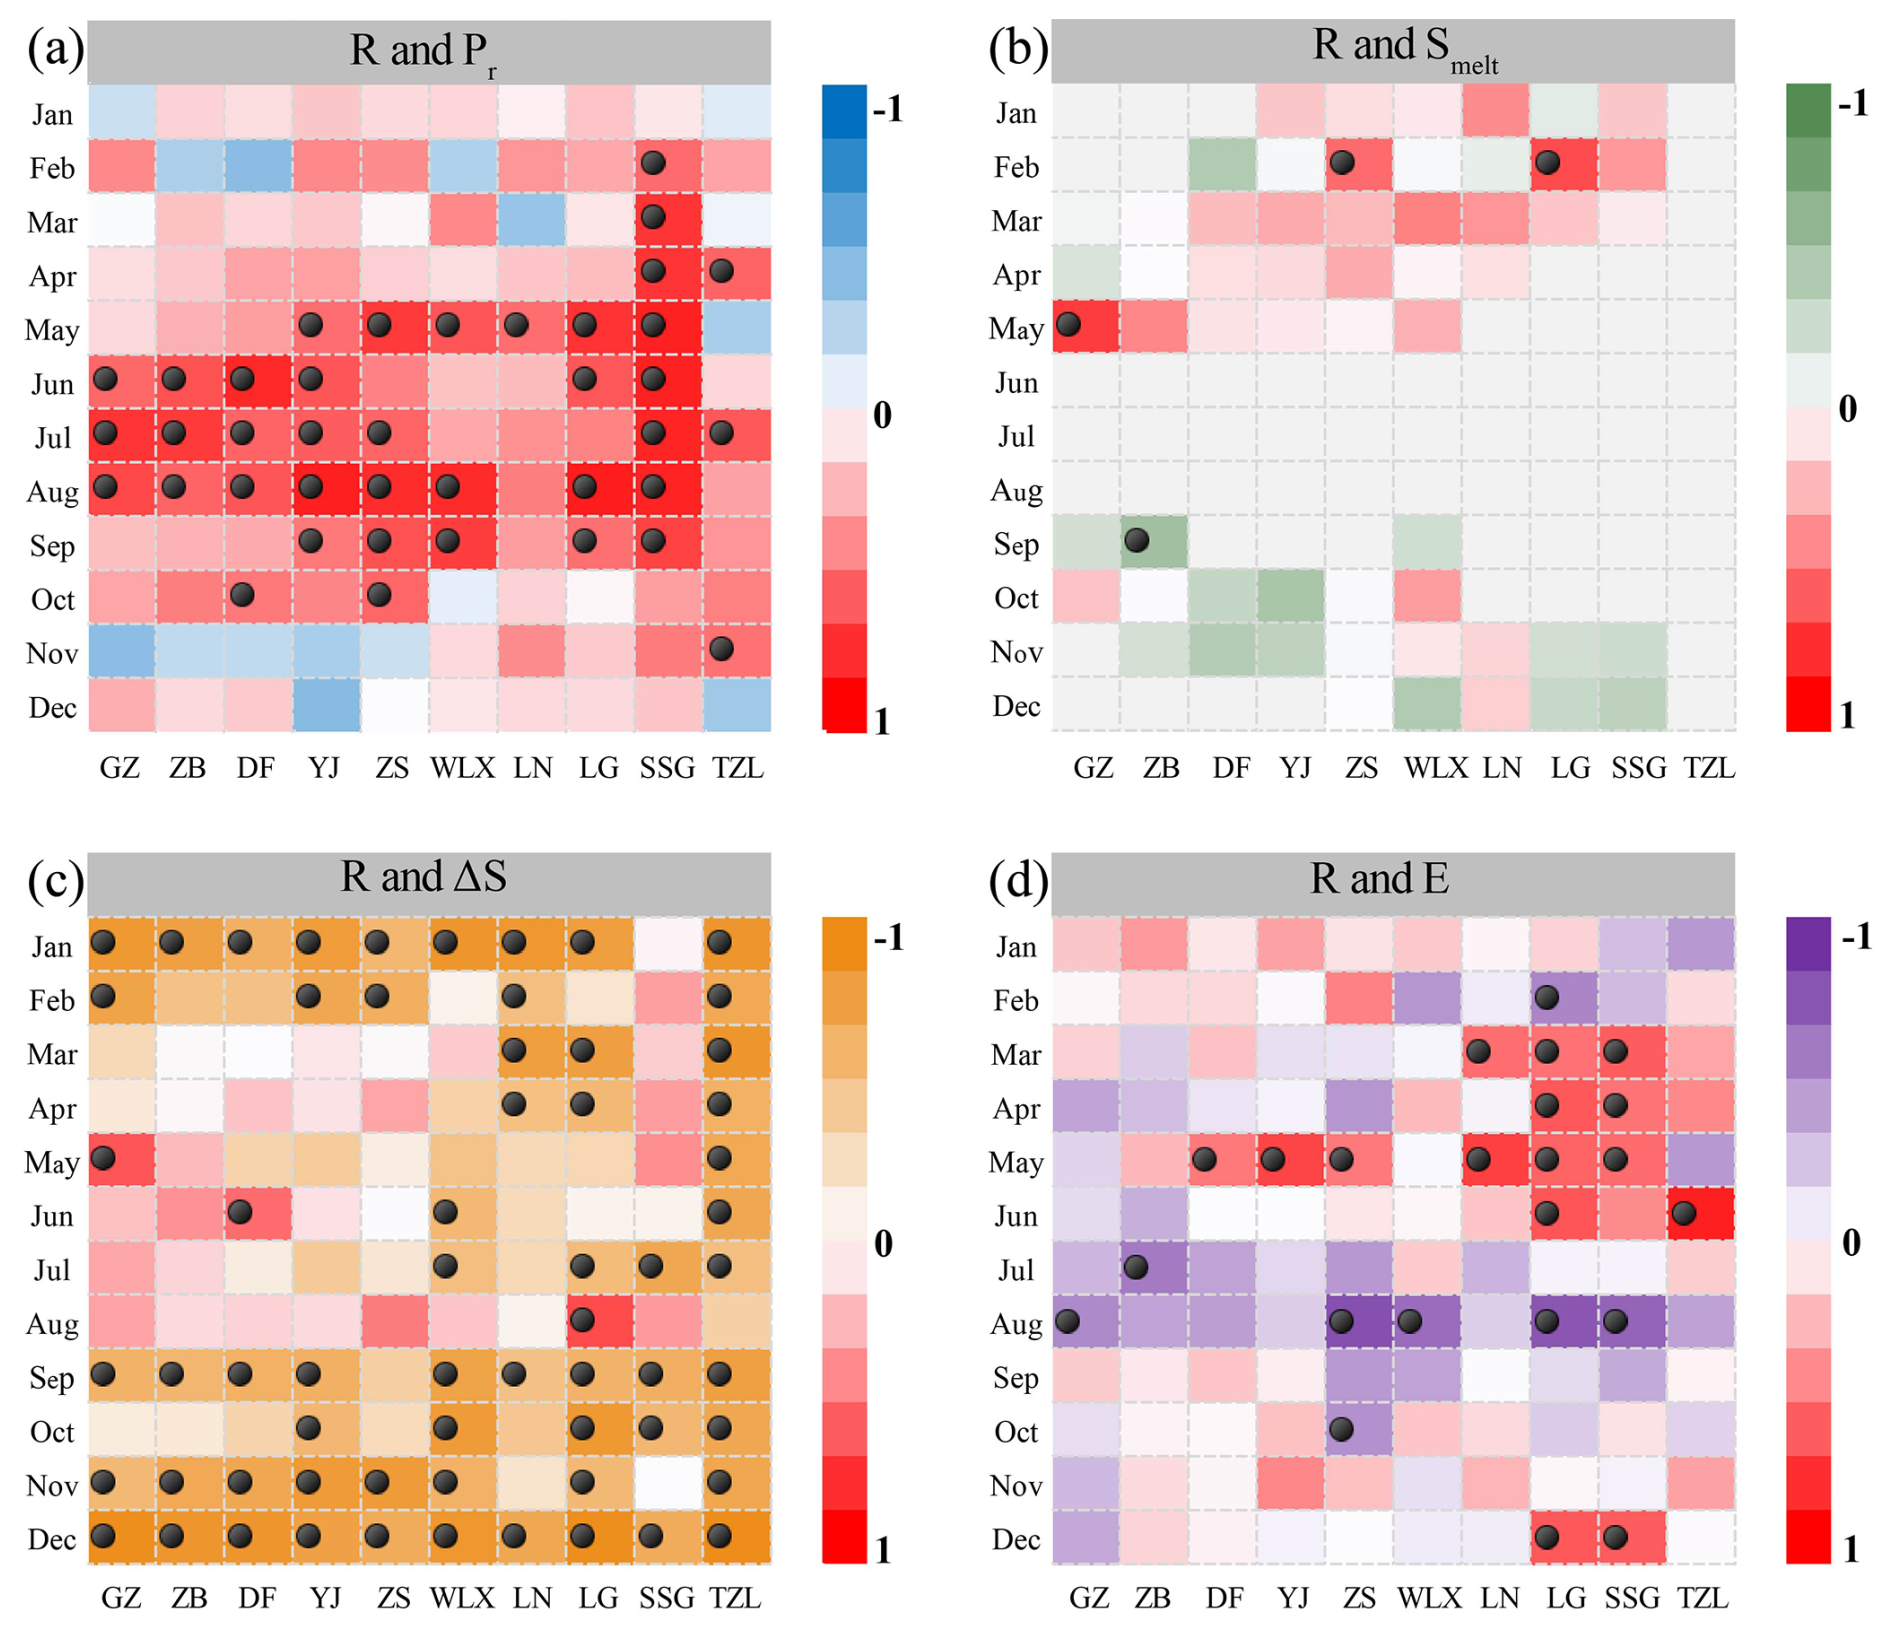
Figure 5Correlation matrices between monthly R and its driving factors (Pr, Smelt, ΔS, and E) during the 2002–2016 period in all sub-basins (GZ to TZL). The colors indicate the degree of correlation with darker colors reflecting stronger correlations. The dots represent significant correlations (p≤0.05).
To further examine the intra-annual characteristics of key hydrological variables, Fig. 4 illustrates the average monthly time series of P, Pr, Smelt, ΔS, E, and R across the 10 sub-basins from 2002 to 2016. Differences between P and Pr are due to Ps and occurred primarily in the middle and upper regions including GZ and ZB during October to April. The Smelt, which is mainly caused by rising spring temperatures, reflects a delayed impact of Ps on runoff. Peak values of Smelt occurred between March and May. Constrained by the potential evapotranspiration and water supply conditions, E steadily increased from January to July, reaching its peak value in July before declining until December. Rywas positively correlated to Pr as as shown in Sect. 3.2, while ΔS primarily was positive during spring and summer, reflecting water storage. The contrasting negative ΔS during autumn and winter reflects water release. The maximum positive value of ΔS was typically observed in June because of the Pr and Smelt characteristics. The intra-annual variability of ΔS was more pronounced in the downstream basin compared to the upstream, which emphasizes the increasing impacts of flow regulation. The net R in the nested TZL-catchment exhibited a minimum (negative) value in June, coinciding with a maximum value of ΔS.This reflects a situation where the local water storage consists of considerable water volumes created upstream of the nested catchment itself. Such storage ensured high R in LG and TZL during the dry season.
The relative contribution of the different water balance terms varies across seasons and regions (Fig. S1 in the Supplement). Pr was generally the main contributor across catchments during May–October, while in most catchments ΔS′ was the main contributor during January–April and November–December. It is noteworthy to mention that the proportions of Pr and Smelt in the high elevation catchments of GZ (in January, February, November, and December), ZB (in January, February, and December), DF (in January and December), and YJ (in December) were all 0 %, as snow accumulation due to temperatures below 0 °C essentially prevented effective water input into these basins. During this period, ΔS′ were primarily driven by the output terms of R and E, although their values were low (Fig. 4).
3.2 Monthly runoff response to different factors
Partial correlation analysis was conducted after detrending to examine relationships between monthly R and each of its driving factors Pr, Smelt, ΔS, and E. As shown in Fig. 5, the results revealed strong positive correlations between R and Pr, however mainly around the summer period (May–September) only. There were considerable differences between the catchments, with the highest correlation coefficient observed for the low-elevation small headwater catchment of SSG between March and September (reaching 0.87 in May) and the overall lowest correlations found in the large central and nested catchment of LN where statistical significance was only obtained for May. Conversely, robust negative correlations between R and ΔS were observed from September to January. The correlations were remarkably strong throughout almost all subcatchments. They were e.g. significant in 8 out of 10 catchments in November, 10 out of 10 in December (including a peak correlation of −0.98 in TZL), and 9 out of 10 in January. The effect reflects an increased dominance of ΔS as a source of R, which is in wintertime can be explained by negligible Pr, Smelt and E. Furthermore, in the downstream catchments including LG and TZL, ΔS continues to be a dominating source of R throughout the year, reflecting that ΔS most likely boosted by reservoir storage to values well above those of Pr, Smelt and E. This is hence in contrast to upstream catchments including GZ, ZB, DF, YJ, and ZS, which with few exceptions do not exhibit significant correlations between R and ΔS between March and August. From January to May, Smelt served as an additional contributor to locally created R during one or more months in all sub-basins except for the downstram-most TZL (Fig. 5). Regarding correlations between R and E they were found to be positive particularly in spring and early summer, probably because an increased availability of effective water supports simultaneous increases in R and E. In August however, correlations were negative in all of the investigated basins (Fig. 5) implying pronounced losses to the atmosphere.
The delayed effect of P on R was investigated considering the entire study period from 2002 to 2016 (Fig. 6). When τ=0, indicating R responses to P in the same month, the upper and middle reaches of the basin exhibited higher correlations, with the headwater catchments of GZ (0.85), ZS (0.84), and WLX (0.74) showing significant correlations. Conversely, LN (0.67), LG (0.60), and TZL (0.2) had relatively lower correlation coefficient values. A delay of τ=1 resulted in better P–R correlations for many basins, including all of the nested (non-headwater) basins DF (0.84), YJ (0.83), LN (0.82), and TZL (0.5) of which the latter two additionally contain hydropower dams. However, as the lag time increased to 2 and 3 months, correlations significantly started to weaken, except for the downstream-most TZL, which showed the most significant correlation (0.61) at a lag of 2 months. These results demonstrate that upstream mountainous headwater catchments on average exhibited relatively prompt R responses to P, despite seasonal snow storage, whereas (τ≥1) in downstream nested catchments including those containing hydropower dams that may have effectively altered the natural precipitation-runoff response.
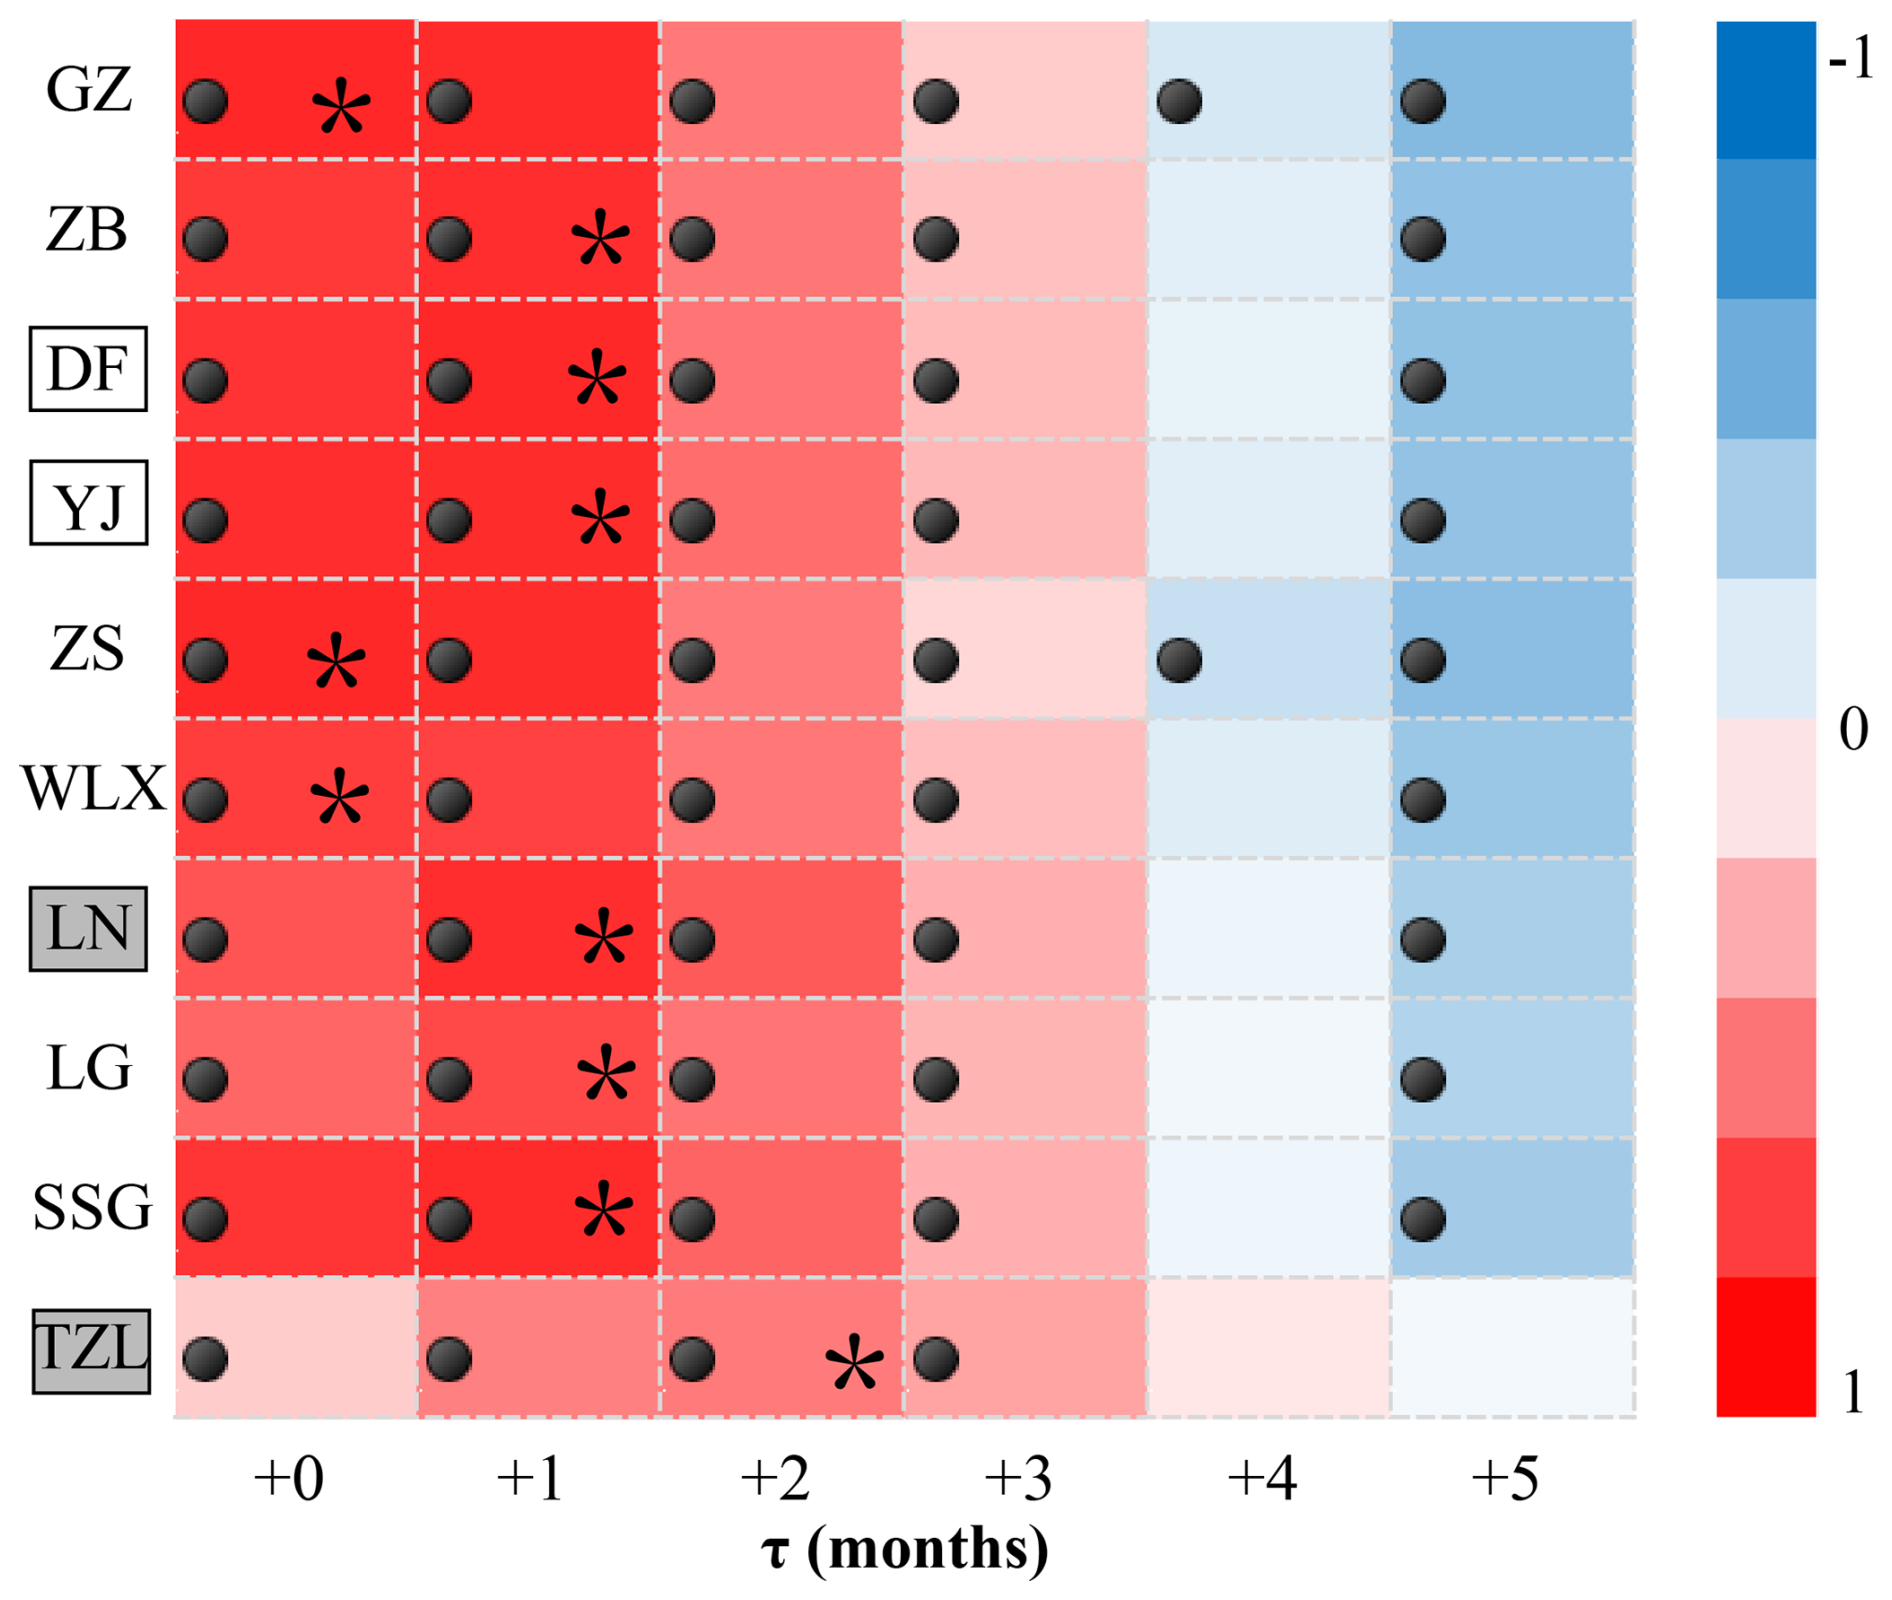
Figure 6Correlation matrix between R and P during the period 2002–2016 in all sub-basins (GZ to TZL; nested sub-basins have rectancles around their names, with additional grey shading if they contain hydropower dams). The lagged response in months between R and P is denoted “τ”. The colors indicate the degree of correlation with darker colors reflecting stronger correlations. The dots represent significant correlations (p≤0.05). Each basin's best fitted τ is indicated by an asterisk.
3.3 Contribution of different factors to runoff variability
Using the Budyko-based variance decomposition method, the influence of various factors on the intra-annual variance of runoff () in the ten sub-basins during the period 2002 to 2016 was quantified, as illustrated in Fig. 7. The determination coefficients R2 of all sub-basins were greater than or equal to 0.9, except for LN (0.83), ZS (0.89), and TZL (0.63). The slope of the LG, ZB, and DF were 1.0, while SSG and YJ reached a maximum R2 of 0.99. Substantially, the variance and covariance of Pr, Smelt, E0, and ΔS′ effectively captured , which emphasized the significant contribution of these factors to .
Figure 7Relationships between the observed and the simulated (Eq. 11) using Budyko-based framework in all sub-basins.
Figure 8Relative contribution matrix of how variances in different water balance terms (, , and ) and the covariances cov(Pr,Smelt), , cov(Pr,E0), , cov(Smelt,E0), and contribute to runoff variance () during the period 2002–2016 in all sub-basins. The colors indicate the degree of contribution.
Figure 8 illustrates the relative contribution matrix of how variances and covariances of water balance terms contribute to the runoff variance . On average, was the primary factor driving the intra-annual variance of runoff in the 10 sub-basins, contributing more than 40 %, except for TZL (30.2 %) and LG (36.6 %). The contribution of to did not exceed 20 %, except for TZL (24.3 %). Among the covariance contribution of driving factors, had a significant impact on , reaching a maximum value of 43.3 % in LG. The contributions of other factors were limited, within 10 %. These findings indicated that variation in Pr and ΔS′ were the primary drivers of intra-annual R variability in the Yalong River basin, with the contribution of Pr variation being most prominent in the middle reaches. The impact of ΔS′ variability was primarily observed downstream, while Smelt variability primarily affected the upstream reaches. The magnitude of contribution of the variances and covariances of the water balance terms to R variability is presented in Fig. S2 in the Supplement. The impact of and cov(Pr,Smelt), on in the upper and middle reaches of the basin was highly volatile. The contribution of had a significant negative impact on , reaching a maximum value of −48 % in LG, and the contributions of cov(Pr,Smelt), cov(Pr,E0), and , were all in the range of 5 to −20 %.
4.1 Contributions of Smelt and ΔS to monthly runoff
This study considered the individual contributions of snow storage ΔSsnow and other storage components ΔS′ (reservoirs, lakes, soil water, groundwater) on monthly runoff in the context of the Budyko framework (Bai et al., 2018; Hwang and Devineni, 2022; Shi and Gao, 2022). The findings suggest that ΔSsnow and the associated meltwater term Smelt played a prominent role as a source of runoff in the spring hydrological processes, which is consistent with other research findings e.g. by Huang et al. (2018). Present results supported previous results also regarding the dominance of ΔS′ as a source of R in the downstream regions (Huang et al., 2021; Xu et al., 2012). This dominance in recent years has been reinforced by increased storage in hydropower reservoirs within the Yalong River basin (e.g., Huang et al., 2021; Ning et al., 2024; Wu et al., 2024; Xu et al., 2012). However, in contrast to the decreased runoff seasonality that e.g. is found in snow-dominated rivers of central Europe (Rottler et al., 2020), the present study showed that the snow thinning (decreasing ΔSsnow; Wu et al., 2024) seen in the upper snow dominated sub-catchments of the Yalong River basin is not yet clearly mirrored in runoff seasonality trends (Fig. 3). A contributing factor was found to be the relatively high runoff sensitivity to unfrozen precipitation (rain; Fig. 8). Nevertheless, results also showed that, in the upstream Yalong sub-catchments, the seasonal storage of snow still constitutes a large part of the total seasonal water storage (Fig. 3). As temperatures rise, the transition of precipitation from snow to rain in high-elevation regions may lead to earlier snowmelt, thus changing the timing and intensity of runoff. This implies that future runoff seasonality is at risk of decreasing if the climate-driven snow thinning of China's cold regions Wu et al., 2024; Yang et al., 2015) will continue. Additionally, based on the applied nested catchment/ Budyko approach, this study contributed to disentangling some of the knowledge gaps related to the acknowledged (Fang et al., 2019) complex spatio–temporal runoff patterns in China's cold regions. In particular, we showed that the snow influence propagates to downstream snow-free regions; as e.g. seen in Fig. S3 in the Supplement, snowmelt contributes approximately 6 % to the annual runoff at the Yalong River outlet (Qi et al., 2022). Furthermore, the construction of large reservoirs in 1999 and 2013, mainly in the downstream part of the Yalong River basin, has redistributed the intra-annual runoff pattern of the lower basin (Fig. S3, Liu et al., 2019a). We here showed that reservoirs contribute approximately 7 % to the annual runoff at the Yalong River outlet (Fig. S3), primarily during January to April. Hence, snow storage and reservoir storage is currently of about the same importance for monthly runoff characteristics of the entire Yalong River basin, with the relative impact of snow processes and Smelt being considerably larger in its upstream parts. Additionally, since changed snow storage did not yet decrease runoff variability in the snow-covered upstream part of the basin, it cannot have contributed to the recent-year decreases total runoff variability of the entire basin either (Fig. S3, top panel).
Regarding water availability present results showed that, for most of the year, there was sufficient water for Pr to simultaneously replenish both R and ΔS, resulting in a positive correlation between Pr and R (Fig. 5a). During the relatively cold dry season, R was then supplemented by consuming ΔS (negative correlation in Fig. 5c), thus highlighting the crucial role of ΔS in ensuring the availability of water resources throughout the year (Fig. 4). However, with rising temperatures, Pr and Smelt will increasingly be partitioned into E and decreasingly into R and/or ΔS during prolonged non-frozen (Condon et al., 2020; Zhang et al., 2015b). This disturbs the balance of water supply and demand (Zhang et al., 2016a) and calls for further research on the availability of ΔS to regulate and sufficiently redistribute R among rainy and dry seasons is essential considering the multiple and partially contrasting needs from energy demand, food demand and other human consumption.
4.2 Uncertainties and model performance evaluations
Although the Choudhury–Yang and Penman–Monteith equations adopted here are widely used for estimating actual and potential evapotranspiration, their site-specific applications involve uncertainties related to both parameters and processes, for instance, the under-studied evaporation mechanism under snow cover conditions (Gan et al., 2022). Since potential errors in E-estimations may translate into our ΔS′-results when we close water balances, we here independently check the E-estimation consistency by comparing the simulated E from the extended Budyko framework with remote sensing-derived E (GLEAM). The comparison showed good agreement (Table S2 in the Supplement), with Nash-Sutcliffe Efficiency (NSE) coefficients exceeding 0.8 for all 10 sub-basins, indicating high model accuracy and reliability. Furthermore, regarding seasonal water supply and demand, the relationship between the monthly ratio of water demand to water supply () and monthly ratio of potential water demand to water supply () as expressed in the extended Budyko framework was further examined for three representative basins: LN, YJ and ZS (Fig. S4 in the Supplement). Water supply constraints typically occurred in the spring, while water demand constraints were more prevalent in the summer and autumn.
Regarding the partitioning of P into corresponding Pr and Ps components including e.g. snow melt Smelt processes, we recognize that there are several challenges of determining temperature threshold values. These include impacts of solar radiation on snowmelt (Liu et al., 2017), as well as topography and hydrometeorological factors, particularly in mountainous regions, where topographical elements such as slope, aspect, and mountain cover exert a substantial influence on snow melting (Gan et al., 2022). The energy exchange of snow is furthermore a dynamic process that undergoes temporal variations, leading to discrepancies in the timescales of degree-day factors across different zones (Zhang et al., 2006). In this study, a dataset with the spatial distribution of degree-day factors for glaciers in High Mountain Asia was employed, for which its accuracy had been verified through typical regional simulation applications (Zhang et al., 2016a; Zhang et al., 2017). The fact that the degree-day factor method yielded satisfactory simulation results at both daily and monthly time scales (Zhang et al., 2016a, 2017) underpins the assumption that our can effectively utilized to calculate monthly snow melt in the here considered Yalong River basin (see also Wu et al., 2024). At the same time, we acknowledge that remaining, difficult-to-reduce process and parameter uncertainties may have non-negligible impacts the presented results.
Facing such remaining uncertainties, we independently ascertained that our main (model-derived) results were consistent with actual, site-specific water storage change outcomes. This was done by collecting and taking advantage of daily storage and release data from several reservoirs within the downstream, nested TZL sub-basin (in which ΔSsnow=0). This sub-basin includes the Ertan, Tongzilin and Guandi hydropower reservoirs, which due to their considerable size together represent a large part of the sub-basin's water storage change ΔS, making it reasonable to assume that ΔSReservoirs≈ΔS. This hence provides a means to constrain and verify our estimates regarding the magnitudes and characteristics of ΔS dynamics, which were derived through water balance closure. We therefore assessed the agreement between the combined monthly storage changes of these reservoirs ΔSReservoirs and our estimated storage change ΔS, as illustrated in Fig. S5 in the Supplement. The figure specifically shows that the estimated dynamics of ΔS fully encloses the amplitudes and reproduces the trends of observed ΔSReservoirs. Regarding the differences in magnitude of storage change, the standard deviation of estimated ΔS was 86 mm, which can be compared with the standard deviation of observed ΔSReservoirs of 46 mm. This hence suggests that reservoirs account for about 53 % of the estimated total water storage changes, with the missing part originating from unmonitored contributions e.g. stemming from storage changes in groundwater reservoirs, unmonitored surface water reservoirs and soil water. From a methodological viewpoint, we note that the value of 53 % also provides an upper limit on our possible overestimation of ΔS, for the unlikely case that storage changes in groundwater reservoirs, unmonitored surface water reservoirs and soil water of TZL would in fact be negligible (i.e. approximately equal to 0), such that the differences in storage changes between the two curves of Fig. S5 would be entirely due to errors in snow melt modelling and water balance closure. However, even for such lowest possible limit value of actual ΔS, the storage volumes are still considerable. These findings hence highlight the critical role that reservoirs, influenced by human activities, can increasingly play in modulating surface water storage in high-mountain areas subject to climate change.
This study employed an extended Budyko framework in 10 nested catchments of the cold and mountainous Yalong River basin, to analyze spatio–temporal characteristics in water balance terms, and to identify main drivers of monthly runoff variability across an elevation gradient (from 5900 to 1000 ). The main findings of this study are:
-
Snow accumulation and snowmelt are main drivers of runoff seasonality in the upper sub-catchments of the Yalong River basin, with propagating impacts also on lower elevation snow-free sub-catchments. These are under increasing additional influence of hydropower reservoirs, creating a relatively strong altitudinal heterogeneity in drivers of monthly runoff. Similar elevation-dependent mechanisms may occur in other snow-affected basins, such as Alpine-origin rivers in Europe, though further high-resolution studies are needed to confirm this.
-
Presently, snow storage and reservoir storage have approximately equal contributions (6 %–7 % each) to discharge at the Yalong River outlet at its confluence with the Yangtze River, implying that both factors need to be accounted for in predictive models.
-
Snow thinning in the high-elevation, snow dominated sub-catchments of the Yalong River basin is not yet clearly mirrored in time-series of high-elevation runoff seasonality, e.g. due to a considerable runoff sensitivity to unfrozen precipitation.
The observed lowered runoff seasonality in the lower Yalong River basin (at its Yangtze River outlet) is therefore not snow-related and hence likely caused by trends in unfrozen precipitation seasonality and/or flow-modulating impacts of constructed reservoirs, natural lakes and groundwater, implying that continued snow thinning may further exacerbate such trends in the future.
-
Regarding lag times, the upstream mountainous headwater catchments of the Yalong basin showed relatively prompt runoff (R) responses to precipitation (P), with lag times (τ) of one month or less (i.e., τ≤1), despite the presence of seasonal snow storage. In contrast, downstream nested catchments, including those containing man-made reservoirs, exhibited more significant delays (i.e., τ>1).
-
Methodologically, we showed by independent verification with reservoir storage data that the extended monthly Budyko framework could be used to distinguish between water storage and seasonal snow accumulation, which has important implications for understanding dominant runoff processes, and more generally for mitigating adverse effect related to the rapid environmental changes that the Yalong River basin and other cold regions (not least of the Tibetan plateau) are currently experiencing.
The code and data used in this study are publicly available at Zenodo (https://doi.org/10.5281/zenodo.17357390) (Wu, 2025) and on GitHub (https://github.com/NanWu16/Budyko-code-and-data). They include the source code, input data, and documentation necessary to reproduce the main results. Further information can also be obtained from the corresponding author (kzhang@hhu.edu.cn).
The supplement related to this article is available online at https://doi.org/10.5194/hess-29-5913-2025-supplement.
NW, KZ and JJ conceived the idea and designed the research framework. ZN carried out data collection, preprocessing, and method determination. NW and HH performed data analysis, graphical visualization, and manuscript preparation. KZ and AN contributed to manuscript refinement. KZ acquired the funding and provided supervision. All authors have read and agreed to the published version of the manuscript.
The contact author has declared that none of the authors has any competing interests.
Publisher's note: Copernicus Publications remains neutral with regard to jurisdictional claims made in the text, published maps, institutional affiliations, or any other geographical representation in this paper. While Copernicus Publications makes every effort to include appropriate place names, the final responsibility lies with the authors. Also, please note that this paper has not received English language copy-editing. Views expressed in the text are those of the authors and do not necessarily reflect the views of the publisher.
This study was supported by the National Key Research and Development Program of China (2023YFC3006500), the Special Fund Project of Jiangsu Province Science and Technology Program (BZ2024035), the fund of National Key Laboratory of Water Disaster Prevention (524015222), and the project “Applied Scientific Research on the `Three-Line Defense' Strengthening Foundation Project for Rainfall and Water Monitoring&Forecasting in Shandong Province” (37000000025001720240235)
This paper was edited by Markus Hrachowitz and reviewed by three anonymous referees.
Allen, R. G., Pereira, L. S., Raes, D., and Smith, M.: Crop evapotranspiration-Guidelines for computing crop water requirements-FAO Irrigation and drainage paper 56, Food and Agriculture Organization of the United Nations, Rome, 1998.
Bai, J., Li, J., Shi, H., Liu, T., and Zhong, R.: Snowmelt Water Alters the Regime of Runoff in the Arid Region of Northwest China, Water, 10, 902, https://doi.org/10.3390/w10070902, 2018.
Bao, Z., Zhang, J., Lian, Y., Wang, G., Jin, J., Ning, Z., Zhang, J., Liu, Y., and Wang, X.: Changes in Headwater Streamflow from Impacts of Climate Change in the Tibetan Plateau, Engineering, https://doi.org/10.1016/j.eng.2023.05.025, 2023.
Berghuijs, W. R., Sivapalan, M., Woods, R. A., and Savenije, H. H. G.: Patterns of similarity of seasonal water balances: A window into streamflow variability over a range of time scales, Water Resour. Res., 50, 5638–5661, https://doi.org/10.1002/2014WR015692, 2014.
Bounoua, L., DeFries, R. S., Imhoff, M. L., and Steininger, M. K.: Land use and local climate: A case study near Santa Cruz, Bolivia, Meteorol. Atmos. Phys., 86, 73–85, https://doi.org/10.1007/s00703-003-0616-8, 2004.
Brutsaert, W. and Hiyama, T.: The determination of permafrost thawing trends from long-term streamflow measurements with an application in eastern Siberia, J. Geophys. Res.-Atmos., 117, D22110, https://doi.org/10.1029/2012JD018344, 2012.
Chen, D. L., Gao, G., Xu, C. Y., Guo, J., and Ren, G. Y.: Comparison of the Thornthwaite method and pan data with the standard Penman-Monteith estimates of reference evapotranspiration in China, Clim. Res., 28, 123–132, https://doi.org/10.3354/cr028123, 2005.
Choudhury, B. J.: Evaluation of an empirical equation for annual evaporation using field observations and results from a biophysical model, J. Hydrol., 216, 99–110, https://doi.org/10.1016/S0022-1694(98)00293-5, 1999.
Condon, L. E., Atchley, A. L., and Maxwell, R. M.: Evapotranspiration depletes groundwater under warming over the contiguous United States, Nat. Commun., 11, 873, https://doi.org/10.1038/s41467-020-14688-0, 2020.
Cui, T., Li, Y., Yang, L., Nan, Y., Li, K., Tudaji, M., Hu, H., Long, D., Shahid, M., Mubeen, A., He, Z., Yong, B., Lu, H., Li, C., Ni, G., Hu, C., and Tian, F.: Non-monotonic changes in Asian Water Towers' streamflow at increasing warming levels, Nat. Commun., 14, 1176, https://doi.org/10.1038/s41467-023-36804-6, 2023.
Dethier, E. N., Sartain, S. L., Renshaw, C. E., and Magilligan, F. J.: Spatially coherent regional changes in seasonal extreme streamflow events in the United States and Canada since 1950, Sci. Adv., 6, eaba5939, https://doi.org/10.1126/sciadv.aba5939, 2020.
Du, C., Sun, F., Yu, J., Liu, X., and Chen, Y.: New interpretation of the role of water balance in an extended Budyko hypothesis in arid regions, Hydrol. Earth Syst. Sci., 20, 393–409, https://doi.org/10.5194/hess-20-393-2016, 2016.
Fang, H., Huang, L., Wang, J., He, G., and Reible, D.: Environmental assessment of heavy metal transport and transformation in the Hangzhou Bay, China, J. Hazard. Mater., 302, 447–457, https://doi.org/10.1016/j.jhazmat.2015.09.060, 2016.
Fang, Y., Li, H., Wan, W., Zhu, S., Wang, Z., Hong, Y., and Wang, H.: Assessment of Water Storage Change in China's Lakes and Reservoirs over the Last Three Decades, Remote Sens., 11, 1467, https://doi.org/10.3390/rs11121467, 2019.
Gan, G., Wu, J., Hori, M., Fan, X., and Liu, Y.: Attribution of decadal runoff changes by considering remotely sensed snow/ice melt and actual evapotranspiration in two contrasting watersheds in the Tienshan Mountains, J. Hydrol., 610, 127810, https://doi.org/10.1016/j.jhydrol.2022.127810, 2022.
Gao, H., Ding, Y., Zhao, Q., Hrachowitz, M., and Savenije, H. H. G.: The importance of aspect for modelling the hydrological response in a glacier catchment in Central Asia, Hydrol. Process., 31, 2842–2859, https://doi.org/10.1002/hyp.11224, 2017.
Gutenson, J. L., Tavakoly, A. A., Wahl, M. D., and Follum, M. L.: Comparison of generalized non-data-driven lake and reservoir routing models for global-scale hydrologic forecasting of reservoir outflow at diurnal time steps, Hydrol. Earth Syst. Sci., 24, 2711–2729, https://doi.org/10.5194/hess-24-2711-2020, 2020.
Han, P., Long, D., Han, Z., Du, M., Dai, L., and Hao, X.: Improved understanding of snowmelt runoff from the headwaters of China's Yangtze River using remotely sensed snow products and hydrological modeling, Remote Sens. Environ., 224, 44–59, https://doi.org/10.1016/j.rse.2019.01.041, 2019.
He, Z., Zhang, X., Bao, S., Qiao, Y., Sheng, Y., Liu, X., He, X., Yang, X., Zhao, J., Liu, R., and Lu, C.: Multiple climatic cycles imprinted on regional uplift-controlled fluvial terraces in the lower Yalong River and Anning River, SE Tibetan Plateau, Geomorphology, 250, 95–112, https://doi.org/10.1016/j.geomorph.2015.08.010, 2015.
Hock, R.: Temperature index melt modelling in mountain areas, J. Hydrol., 282, 104–115, https://doi.org/10.1016/S0022-1694(03)00257-9, 2003.
Huang, P., Song, J., Cheng, D., Sun, H., Kong, F., Jing, K., and Wu, Q.: Understanding the intra-annual variability of streamflow by incorporating terrestrial water storage from GRACE into the Budyko framework in the Qinba Mountains, J. Hydrol., 603, 126988, https://doi.org/10.1016/j.jhydrol.2021.126988, 2021.
Huang, Y., Zhao, H., Jiang, Y., and Lu, X.: Runoff and its influencing factors in the upper reaches of the Yalong River, Arid Land Geo., 41, 127–133, https://doi.org/10.13826/j.cnki.cn65-1103/x.2018.01.016, 2018.
Huo, J., Liu, C., Yu, X., Jia, G., and Chen, L.: Effects of watershed char and climate variables on annual runoff in different climatic zones in China, Sci. Total Environ., 754, 142157, https://doi.org/10.1016/j.scitotenv.2020.142157, 2021.
Hwang, J. and Devineni, N.: An Improved Zhang's Dynamic Water Balance Model Using Budyko-Based Snow Representation for Better Streamflow Predictions, Water Resour. Res., 58, e2021WR030203, https://doi.org/10.1029/2021WR030203, 2022.
Kazemi, H., Hashemi, H., Maghsood, F. F., Hosseini, S. H., Sarukkalige, R., Jamali, S., and Berndtsson, R.: Climate vs. Human Impact: Quantitative and Qualitative Assessment of Streamflow Variation, Water, 13, 2404, https://doi.org/10.3390/w13172404, 2021.
Kuhn, M., Helfricht, K., Ortner, M., Landmann, J., and Gurgiser, W.: Liquid water storage in snow and ice in 86 Eastern Alpine basins and its changes from 1970–97 to 1998-2006, Ann. Glaciol., 57, 11–18, https://doi.org/10.1017/aog.2016.24, 2016.
Li, L., Ni, J., Chang, F., Yue, Y., Frolova, N., Magritsky, D., Borthwick, A. G. L., Ciais, P., Wang, Y., Zheng, C., and Walling, D. E.: Global trends in water and sediment fluxes of the world's large rivers, Sci. Bull., 65, 62–69, https://doi.org/10.1016/j.scib.2019.09.012, 2020.
Li, X., Zhang, K., Gu, P., Feng, H., Yin, Y., Chen, W., and Cheng, B.: Changes in precipitation extremes in the Yangtze River Basin during 1960-2019 and the association with global warming, ENSO, and local effects, Sci. Total Environ., 760, 144244, https://doi.org/10.1016/j.scitotenv.2020.144244, 2021.
Li, Z. and Quiring, S. M.: Investigating spatial heterogeneity of the controls of surface water balance in the contiguous United States by considering anthropogenic factors, J. Hydrol., 601, 126621, https://doi.org/10.1016/j.jhydrol.2021.126621, 2021.
Liu, J., Zhang, Q., Singh, V. P., and Shi, P.: Contribution of multiple climatic variables and human activities to streamflow changes across China, J. Hydrol., 545, 145–162, https://doi.org/10.1016/j.jhydrol.2016.12.016, 2017.
Liu, J., Zhang, Q., Singh, V. P., Song, C., Zhang, Y., Sun, P., and Gu, X.: Hydrological effects of climate variability and vegetation dynamics on annual fluvial water balance in global large river basins, Hydrol. Earth Syst. Sci., 22, 4047–4060, https://doi.org/10.5194/hess-22-4047-2018, 2018.
Liu, J., You, Y., Zhang, Q., and Gu, X.: Attribution of streamflow changes across the globe based on the Budyko framework, Sci. Total Environ., 794, 148662, https://doi.org/10.1016/j.scitotenv.2021.148662, 2021.
Liu, Z., Wang, T., Han, J., Yang, W., and Yang, H.: Decreases in Mean Annual Streamflow and Interannual Streamflow Variability Across Snow-Affected Catchments Under a Warming Climate, Geophys. Res. Lett., 49, e2021GL097442, https://doi.org/10.1029/2021GL097442, 2022.
Luo, M. and Lau, N.-C.: Synoptic characteristics, atmospheric controls, and long-term changes of heat waves over the Indochina Peninsula, Clim. Dynam., 51, 2707–2723, https://doi.org/10.1007/s00382-017-4038-6, 2018.
Ministry of Water Resources of China: China Hydrological Yearbook, http://mwr.gov.cn (last access: 24 October 2025), 2002.
Miralles, D. G., De Jeu, R. A. M., Gash, J. H., Holmes, T. R. H., and Dolman, A. J.: Magnitude and variability of land evaporation and its components at the global scale, Hydrol. Earth Syst. Sci., 15, 967–981, https://doi.org/10.5194/hess-15-967-2011, 2011.
Miralles, D. G.: GLEAM v4.1, https://doi.org/10.5281/zenodo.14056079, 2024.
New, M., Hulme, M., and Jones, P.: Representing twentieth-century space-time climate variability. Part II: Development of 1901–96 monthly grids of terrestrial surface climate, J. Climate, 13, 2217–2238, https://doi.org/10.1175/1520-0442(2000)013<2217:RTCSTC>2.0.CO;2, 2000.
Ning, T., Li, Z., and Liu, W.: Vegetation dynamics and climate seasonality jointly control the interannual catchment water balance in the Loess Plateau under the Budyko framework, Hydrol. Earth Syst. Sci., 21, 1515–1526, https://doi.org/10.5194/hess-21-1515-2017, 2017.
Ning, Z., Wu, N., Zhang, J., Ruan, Y., Tang, Z., Sun, J., Shi, J., Liu, C., and Wang, G.: Wetter trend in source region of Yangtze River by runoff simulating based on Grid-RCCC-WBM, J. Hydrol., 631, 130702, https://doi.org/10.1016/j.jhydrol.2024.130702, 2024.
Qi, J., Wang, L., Zhou, J., Song, L., Li, X., and Zeng, T.: Coupled Snow and Frozen Ground Physics Improves Cold Region Hydrological Simulations: An Evaluation at the upper Yangtze River Basin (Tibetan Plateau), J. Geophys. Res.-Atmos., 124, 12985–13004, https://doi.org/10.1029/2019JD031622, 2019.
Qi, W., Feng, L., Kuang, X., Zheng, C., Liu, J., Chen, D., Tian, Y., and Yao, Y.: Divergent and Changing Importance of Glaciers and Snow as Natural Water Reservoirs in the Eastern and Southern Tibetan Plateau, J. Geophys. Res.-Atmos., 127, e2021JD035888, https://doi.org/10.1029/2021JD035888, 2022.
Rottler, E., Francke, T., Bürger, G., and Bronstert, A.: Long-term changes in central European river discharge for 1869–2016: impact of changing snow covers, reservoir constructions and an intensified hydrological cycle, Hydrol. Earth Syst. Sci., 24, 1721–1740, https://doi.org/10.5194/hess-24-1721-2020, 2020.
Shen, C.: A Transdisciplinary Review of Deep Learning Research and Its Relevance for Water Resources Scientists, Water Resour. Res., 54, 8558–8593, https://doi.org/10.1029/2018WR022643, 2018.
Shi, G. and Gao, B.: Attribution Analysis of Runoff Change in the Upper Reaches of the Kaidu River Basin Based on a Modified Budyko Framework, Atmosphere, 13, 1385, https://doi.org/10.3390/atmos13091385, 2022.
Stigter, E. E., Litt, M., Steiner, J. F., Bonekamp, P. N. J., Shea, J. M., Bierkens, M. F. P., and Immerzeel, W. W.: The Importance of Snow Sublimation on a Himalayan Glacier, Front. Earth Sci., 6, 108, https://doi.org/10.3389/feart.2018.00108, 2018.
Tu, X., Singh, V. P., Chen, X., Chen, L., Zhang, Q., and Zhao, Y.: Intra-annual Distribution of Streamflow and Individual Impacts of Climate Change and Human Activities in the Dongijang River Basin, China, Water Resour. Manag., 29, 2677–2695, https://doi.org/10.1007/s11269-015-0963-5, 2015.
USGS EROS: Digital Elevation – Global 30 Arc-Second Elevation (GTOPO30), https://doi.org/10.5066/F7DF6PQS, 2018.
Wang, D. and Tang, Y.: A one-parameter Budyko model for water balance captures emergent behavior in darwinian hydrologic models, Geophys. Res. Lett., 41, 4569–4577, https://doi.org/10.1002/2014GL060509, 2014.
Wang, Z., Wu, R., Chen, S., Huang, G., Liu, G., and Zhu, L.: Influence of Western Tibetan Plateau Summer Snow Cover on East Asian Summer Rainfall, J. Geophys. Res.-Atmos., 123, 2371–2386, https://doi.org/10.1002/2017JD028016, 2018.
Widen-Nilsson, E., Halldin, S., and Xu, C.: Global water-balance modelling with WASMOD-M: Parameter estimation and regionalisation, J. Hydrol., 340, 105–118, https://doi.org/10.1016/j.jhydrol.2007.04.002, 2007.
Wu, N: Budyko code and data, Zenodo [code and data set], https://doi.org/10.5281/zenodo.17357390, 2025.
Wu, J. and Gao, X.: CN05.1 dataset, https://ccrc.iap.ac.cn/resource/detail?id=228 (last access: 24 October 2025), 2021
Wu, C., Yeh, P. J.-F., Hu, B. X., and Huang, G.: Controlling factors of errors in the predicted annual and monthly evaporation from the Budyko framework, Adv. Water Resour., 121, 432–445, https://doi.org/10.1016/j.advwatres.2018.09.013, 2018.
Wu, C., Yeh, P. J.-F., Wu, H., Hu, B. X., and Huang, G.: Global Analysis of the Role of Terrestrial Water Storage in the Evapotranspiration Estimated from the Budyko Framework at Annual to Monthly Time Scales, J. Hydrometeorol., 20, 2003–2021, https://doi.org/10.1175/JHM-D-19-0065.1, 2019.
Wu, N., Zhang, K., Chao, L., Ning, Z., Wang, S., and Jarsjö, J.: Snow cover expansion with contrasting depth thinning in the recent 40 years: Evidence from the Yalong River Basin, South-eastern Tibetan Plateau, J. Hydrol.-Reg. Stud., 53, 101786, https://doi.org/10.1016/j.ejrh.2024.101786, 2024.
Wu S. and Shen M.: The key technical issue and its research advance in Yalong River hydropower development, J. Hydrau. Eng., 15–19, 2007.
Wu, Z., Li, J., Jiang, Z., and Ma, T.: Modulation of the Tibetan Plateau Snow Cover on the ENSO Teleconnections: From the East Asian Summer Monsoon Perspective, J. Climate, 25, 2481–2489, https://doi.org/10.1175/JCLI-D-11-00135.1, 2012.
Xin, J., Sun, X., Liu, L., Li, H., Liu, X., Li, X., Cheng, L., and Xu, Z.: Quantifying the contribution of climate and underlying surface changes to alpine runoff alterations associated with glacier melting, Hydrol. Process., 35, e14069, https://doi.org/10.1002/hyp.14069, 2021.
Xin, Z., Li, Y., Zhang, L., Ding, W., Ye, L., Wu, J., and Zhang, C.: Quantifying the relative contribution of climate and human impacts on seasonal streamflow, J. Hydrol., 574, 936–945, https://doi.org/10.1016/j.jhydrol.2019.04.095, 2019.
Xu, X., Yang, D., and Sivapalan, M.: Assessing the impact of climate variability on catchment water balance and vegetation cover, Hydrol. Earth Syst. Sci., 16, 43–58, https://doi.org/10.5194/hess-16-43-2012, 2012.
Xu, X., Yang, D., Yang, H., and Lei, H.: Attribution analysis based on the Budyko hypothesis for detecting the dominant cause of runoff decline in Haihe basin, J. Hydrol., 510, 530–540, https://doi.org/10.1016/j.jhydrol.2013.12.052, 2014.
Yang, H., Yang, D., Lei, Z., and Sun, F.: New analytical derivation of the mean annual water-energy balance equation, Water Resour. Res., 44, W03410, https://doi.org/10.1029/2007WR006135, 2008.
Yang, T., Wang, C., Chen, Y., Chen, X., and Yu, Z.: Climate change and water storage variability over an arid endorheic region, J. Hydrol., 529, 330–339, https://doi.org/10.1016/j.jhydrol.2015.07.051, 2015.
Yang, Z. and Bai, P.: Evaporation from snow surface: A multi-model evaluation with the FLUXNET2015 dataset, J. Hydrol., 621, 129587, https://doi.org/10.1016/j.jhydrol.2023.129587, 2023.
Yao, L., Libera, D. A., Kheimi, M., Sankarasubramanian, A., and Wang, D.: The Roles of Climate Forcing and Its Variability on Streamflow at Daily, Monthly, Annual, and Long-Term Scales, Water Resour. Res., 56, https://doi.org/10.1029/2020WR027111, 2020.
Ye, S., Li, H.-Y., Li, S., Leung, L. R., Demissie, Y., Ran, Q., and Bloeschl, G.: Vegetation regulation on streamflow intra-annual variability through adaption to climate variations, Geophys. Res. Lett., 42, 10307–10315, https://doi.org/10.1002/2015GL066396, 2015.
Zeng, R. and Cai, X.: Assessing the temporal variance of evapotranspiration considering climate and catchment storage factors, Adv. Water Resour., 79, 51–60, https://doi.org/10.1016/j.advwatres.2015.02.008, 2015.
Zhang, D., Cong, Z., Ni, G., Yang, D., and Hu, S.: Effects of snow ratio on annual runoff within the Budyko framework, Hydrol. Earth Syst. Sci., 19, 1977–1992, https://doi.org/10.5194/hess-19-1977-2015, 2015a.
Zhang, L., Hickel, K., Dawes, W. R., Chiew, F. H. S., Western, A. W., and Briggs, P. R.: A rational function approach for estimating mean annual evapotranspiration, Water Resour. Res., 40, W02502, https://doi.org/10.1029/2003WR002710, 2004.
Zhang, L., Potter, N. J., and Zhang, Y.: Water balance modeling over variable time scales based on the Budyko framework – Model development and testing (vol 360, pg 117, 2008), J. Hydrol., 390, 121–122, https://doi.org/10.1016/j.jhydrol.2010.05.027, 2010.
Zhang, L., Su, F., Yang, D., Hao, Z., and Tong, K.: Discharge regime and simulation for the upstream of major rivers over Tibetan Plateau, J. Geophys. Res.-Atmos., 118, 8500–8518, https://doi.org/10.1002/jgrd.50665, 2013.
Zhang, X., Dong, Q., Zhang, Q., and Yu, Y.: A unified framework of water balance models for monthly, annual, and mean annual timescales, J. Hydrol., 589, 125186, https://doi.org/10.1016/j.jhydrol.2020.125186, 2020.
Zhang, Y., Liu, S., and Ding, Y.: Spatial variation of degree-day factors on the observed glaciers in western China, Acta Geographica Sinica, 61, 89–98, https://doi.org/10.11821/xb200601009, 2006.
Zhang, Y., Enomoto, H., Ohata, T., Kitabata, H., Kadota, T., and Hirabayashi, Y.: Glacier mass balance and its potential impacts in the Altai Mountains over the period 1990-2011, J. Hydrol., 553, 662–677, https://doi.org/10.1016/j.jhydrol.2017.08.026, 2017.
Zhang, Y., Liu, S., and Wang, X.: A dataset of spatial distribution of degree-day factors for glaciers in High Mountain Asia, https://doi.org/10.11922/sciencedb.747, 2019.