the Creative Commons Attribution 4.0 License.
the Creative Commons Attribution 4.0 License.
 | 21 Oct 2025
Explicit simulation of microbial transport with a dual-permeability, two-site kinetic deposition formulation using the integrated surface–subsurface hydrological model HydroGeoSphere
Friederike Currle
René Therrien
Oliver S. Schilling
Assessing the transport behaviour of microbes in surface water–groundwater systems is important to prevent contamination of drinking-water resources by pathogens. While wellhead protection area (WHPA) delineation is predominantly based on dye injection tests and advective transport modelling, size exclusion of colloid-sized microbes from the smaller and usually less conductive pore spaces causes a faster breakthrough and thus faster apparent transport of microbes compared to that of solutes. To provide a tool for better assessment of the differences between solute and microbial transport in surface water–groundwater systems, here, we present the implementation of a dual-permeability, two-site kinetic deposition formulation for microbial transport in the integrated surface–subsurface hydrological model HydroGeoSphere (HGS). The implementation considers attachment, detachment, and inactivation of microbes in both permeability regions and allows for multispecies transport. The dual-permeability, two-site kinetic deposition implementation in HGS was verified against an analytical solution for dual-permeability colloid transport. The suitability of the model for microbial transport in integrated surface–subsurface hydrological settings at the wellfield or small headwater catchment scale is demonstrated by two illustrative examples. The first example is a benchmark for integrated rainfall–runoff and streamflow generation modelling to which we added microbial transport from a conceptual manure application, demonstrating the novelty of explicit and coupled microbial and solute transport simulations in an integrated surface–subsurface hydrological scenario. The second example is a multi-tracer flow and transport study of an idealized alluvial riverbank filtration site, in which we simulate in parallel the transport of reactive microbes, conservative 4He, and reactive 222Rn, demonstrating the assessment of mixing ratios, tracer breakthrough curves, and travel times in an integrated manner via multiple approaches. The developed simulation tool represents the first integrated surface–subsurface hydrological simulator for reactive solute and microbial transport and marks an important advancement to unlock and quantify governing microbial transport processes in coupled surface water–groundwater settings. It enables meaningful WHPA delineation and risk assessments of riverbank filtration sites with respect to microbial contamination even under situations of extreme hydrological and microbial stress, such as flood events.
- Article
(4216 KB) - Full-text XML
- BibTeX
- EndNote


Riverbank filtration is a popular and widely used method for drinking-water production as the filtration of river water through riverbanks and alluvial sediments naturally removes many microbial and chemical contaminants (Weiss et al., 2005; Hollender et al., 2018; Ray, 2002). To ensure the quality of the pumped filtrate, riverbank filtration wells are usually installed at distances from the river that allow for sufficient groundwater travel distance and time. Analogously to how wellhead protection areas (WHPAs) or capture zones are delineated, these distances are typically identified based purely on hydraulic analyses and/or advective transport modelling or under additional consideration of dye injection tests that allow for the delineation of time-of-travel WHPA (Molson and Frind, 2012; Paradis et al., 2007). However, especially after heavy-rain and discharge events, groundwater pumped from riverbank filtration systems can contain high microbial loads in spite of the natural filtration process (Derx et al., 2013; Brand and Wülser, 2018). Thus, understanding the transport of microbes in river–aquifer systems is crucial to prevent contamination of drinking water by pathogens, particularly in the widely employed riverbank filtration context (Bradford et al., 2017; Tufenkji et al., 2002; Ferguson et al., 2003).
In contrast to solutes, microbes are orders of magnitudes larger, with a typical size of 0.1 nm for simple ions compared to 0.1 to 750 µm for bacteria and other prokaryotes. Microbes are classified as colloids and are suspended rather than dissolved in water. Microbes can thus get trapped in pores too small for them to flow through – a process called “straining”. Due to this size exclusion, microbial transport is limited to the larger and, usually, more conductive pores (Bradford et al., 2003), which is why microbes appear to travel faster than solutes, showing an earlier breakthrough (Hunt and Johnson, 2017) and posing an increased risk for drinking-water contamination (Bradford and Harvey, 2017). WHPAs delineated based on advective solute transport are therefore not representative of microbial transport pathways. Unfortunately, unlike dissolved chemical contaminants, for which chronic exposure is typically of most concern, a very small acute exposure to waterborne pathogens can cause illness (Hunt and Johnson, 2017; Sasidharan, 2016). Therefore, it is the first arrival of pathogens rather than that of the peak or the centre of mass that is the most relevant waterborne transport health risk to be considered in drinking-water protection (Hunt and Johnson, 2017).
The transport and fate of microbes in the subsurface are mainly governed by advection, diffusion and dispersion, interaction with the grain surfaces, size exclusion, and growth and inactivation by grazing or death (Tufenkji, 2007; Bradford et al., 2014). Several different mathematical approaches and models to conceptualize the transport of these bio-colloids have been developed (Bradford et al., 2014). A conventional approach is the classical colloid filtration theory (CFT) (Yao et al., 1971), which is a form of the advection–dispersion equation enhanced by a single kinetic attachment coefficient. This kinetic attachment coefficient is an upscaled rate coefficient considering both mass transport from the pore space to the grain surfaces and the efficiency of attachment to the surface. Classical CFT assumes irreversible attachment of colloids to the sediment grains (Tufenkji, 2007; Ryan et al., 1999; Schijven and Hassanizadeh, 2000). For attractive forces between colloid and collector (i.e., sediment grains), which correspond to the so-called favourable conditions for attachment, various column experiments confirmed that the single-rate description of the classical CFT, allowing fast and irreversible attachment, is in good agreement with observations of the colloid concentrations in the liquid phase and, if available, also the retained colloid concentrations (Li et al., 2004; Li et al., 2005; Tufenkji and Elimelech, 2004, 2005). However, classical CFT breaks down under unfavourable conditions and, hence, in the presence of repulsive forces between colloid and collector (Tufenkji and Elimelech, 2004, 2005; Li et al., 2005). Colloid attachment under unfavourable conditions is either fast and reversible for colloids that are retained in the secondary energy minimum (i.e., shallow energy minimum for weak colloid attraction) or slow and irreversible for colloids that overcome the repulsive energy barrier and reach the primary energy minimum (Tufenkji, 2007). Attachment conditions of microbes in the environment are usually unfavourable as surfaces of both microorganisms and sediment grains are typically negatively charged (Loveland et al., 1996; Ryan et al., 1999; Molnar et al., 2015; Bradford et al., 2009), and, consequently, the classical CFT is not appropriate to describe microbial transport under environmental conditions.
A common enhancement of the classical CFT is a one-site kinetic sorption model with additional first-order detachment and/or inactivation rates (Schijven et al., 2000; Zhang et al., 2001; Dong et al., 2002; Blanford et al., 2005; Zhang et al., 2018; Oudega et al., 2021; Knabe et al., 2021). Beyond that, Bradford et al. (2003) developed an irreversible first-order straining term to incorporate straining in addition to a first-order attachment and detachment. The dual-deposition mode by Tufenkji and Elimelech (2004) comprises a bimodal distribution of the deposition rate in the classical CFT to consider both fast and slow deposition under favourable and unfavourable attachment conditions. Furthermore, two-site kinetic sorption models have been shown to reproduce the breakthrough of bio-colloids in both column and field experiments. Schijven and Šimùnek (2002), for example, showed that the shape of the breakthrough curves of a bacteriophage tracer experiment at a managed aquifer recharge site could be fitted well using a 1D two-site model. Sasidharan et al. (2018) outlined that a two-site kinetic retention model with different solid-phase inactivation rates accurately describes the observed tailing of a virus breakthrough curve of a column experiment. While all of these models addressed colloid attachment, detachment, inactivation, or straining, they did not consider parallel simulation of the different transport characteristics of colloids and solutes.
Making another step forward, Bradford et al. (2009) presented a dual-permeability model (also known as a dual-region model) with two kinetic deposition sites to account for different colloid retention mechanisms. Initially applied to study preferential flow and transport in structured porous media and fractured rocks (Gerke and Van Genuchten, 1993), Bradford et al. (2009) reinterpreted the dual-permeability model to account for facilitated colloid transport in porous media. While the mathematical formulation remains similar to its traditional use, the reinterpretation addresses a different physical system in which colloid attachment is influenced by small-scale velocity variations within the porous medium. Slow and irreversible colloid attachment is considered to occur in the small-pore, low-velocity regions of the porous media, whereas fast and potentially reversible retention occurs in the large-pore, high-velocity region. The dual-permeability approach was able to reproduce the breakthrough curve and the retention profile of a monodispersed colloid suspension in a packed column under highly unfavourable conditions and performed better compared to a single-region attachment–detachment model (Bradford et al., 2009). In addition to the application for colloid transport under unfavourable conditions, the dual-permeability model formulation can be adjusted to completely favourable conditions or to not clearly defined mixed favourable–unfavourable conditions (Bradford et al., 2014), making it an ideal and flexible approach for natural heterogeneous porous media. Furthermore, the dual-permeability model enables the co-simulation of fast microbial transport in the high-permeability pore space and slower bulk solute transport in both the high- and low-permeability pore spaces. The dual-permeability, two-site kinetic deposition model is therefore a promising approach to co-simulate microbial and solute transport under environmental conditions, which is required for the characterization of relevant processes in river–groundwater systems.
Bradford et al. (2009) performed simulations according to the dual-permeability formulation with two kinetic deposition sites using the finite-element, variably saturated subsurface flow and transport model HYDRUS 1D (Simùnek and Van Genuchten, 2008). HYDRUS 1D and its 2D and 3D extensions, HYDRUS 2D and HYDRUS 3D (Simùnek et al., 2013; Šimùnek et al., 2016), are well suited to study flow and transport phenomena in the variably saturated zone. However, to study the transport phenomena on the surface; in the subsurface; and, in particular, across the river–aquifer interface, integrated surface–subsurface hydrological models (ISSHMs) are needed. ISSHMs simulate both the surface and the variably and fully saturated subsurface hydrological environments in a fully coupled manner and thereby eliminate the necessity to parameterize the surface domain as external boundary conditions (BCs) (Brunner et al., 2017; Schilling et al., 2019; Maxwell et al., 2014; Partington et al., 2017; Delottier et al., 2024). Examples of ISSHMs include HydroGeoSphere (Aquanty Inc., 2024; Therrien and Sudicky, 1996; Brunner and Simmons, 2012), Cast3M (Weill et al., 2009), CATHY (CATchment HYdrology) (Bixio et al., 2002; Camporese et al., 2010), or ParFlow (Maxwell et al., 2024; Beisman et al., 2015).
So far, none of these ISSHMs included the possibility of studying reactive colloid transport, including interactions with the grain surfaces in a dual-permeability system. To fill this gap, here, we present the first implementation and verification of a dual-permeability, two-site kinetic deposition flow and transport formulation, combined with first-order decay terms in both permeability regions, in an integrated surface–subsurface flow and transport model. The new implementation was first announced in the HydroGeoSphere release notes (revision no. 2582), and the final implementation as presented in this study has been available in HydroGeoSphere from revision no. 2699 onwards. The suitability of the approach to simulate microbial transport at the wellfield scale in integrated surface–subsurface hydrological systems is highlighted by two illustrative examples. The first illustrative example is based on an existing rainfall–runoff benchmark that is modified to simulate streamflow generation from groundwater exfiltration. The remainder of the paper also refers to groundwater exfiltration as return flow. This first example demonstrates the potential of the new implemented approach to study microbial transport in river–aquifer systems with varying infiltrating and exfiltrating conditions. The second illustrative example uses a riverbank filtration benchmark model and simulates microbial transport in tandem with the reactive transport of the dissolved natural radiogenic and radioactive gas tracers of 4He and 222Rn, respectively. These have been shown to be suitable tracers to estimate groundwater mixing ratios and residence times of freshly infiltrated river water in riverbank filtration wellfields (Popp et al., 2021). An artificial 4He injection pulse in the river water is also simulated based on recent work by Blanc et al. (2024), who demonstrate that, for such an injection, 4He is a conservative tracer as efficient as a dye.
2.1 Coupled surface water and dual-permeability subsurface flow
HydroGeoSphere (HGS) is an integrated surface–subsurface hydrological model capable of simulating surface water and variably saturated subsurface flow, as well as heat and (reactive) mass transport. It has been employed to study many aspects of river–aquifer interactions, such as the influence of riverbed heterogeneity (Tang et al., 2017) and the impact of catchment-scale river–aquifer interactions on groundwater levels (Delottier et al., 2024). It has also been used to improve model calibration by including river–aquifer exchange fluxes (Schilling et al., 2022).
Variably saturated flow in the subsurface in HGS is described by a modified form of Richards' equation to account for specific storage in the saturated zone (Therrien and Sudicky, 1996). In the dual-permeability configuration, the subsurface is subdivided into a high-permeability region and a low-permeability region. Flow is described for both regions individually using a modified form of Richards' equation (Gerke and Van Genuchten, 1993):
where subscripts h and l refer to the high-permeability and low-permeability regions, respectively. The volume fraction of each region is given by w [–], with ; Θ [–] is the saturated water content, which is equal to porosity; S [–] is the relative water saturation; Γo [] is the volumetric fluid exchange rate between the surface and each subsurface region; and Q [T−1] refers to sources and sinks as defined, for example, by boundary conditions.
The fluid fluxes q [L T−1] in the high- and low-permeability subsurface regions are defined as follows:
where K [L T−1] is the hydraulic conductivity tensor; kr [–] is the relative permeability, which is a function of water saturation; ψ [L] is pressure head; and z [L] is the elevation head.
The water exchange term between the high- and low-permeability regions Γhl [] is defined as follows:
where αw [L−2] is a first-order fluid transfer coefficient, Ka [L T−1] is the hydraulic conductivity at the interface between the two regions, and kra [–] is the relative permeability of the interface.
The total flux qt in the subsurface is then given by
A similar relationship holds to define the total hydraulic conductivity and total water saturation in the subsurface.
Surface flow in HGS is described by the following depth-averaged diffusion wave approximation:
where ho [L] is the surface water level, do [L] is the surface water depth, and doΓo [L T−1] represents flow between the surface and subsurface domains. The volumetric flow rate per unit area Qo [L T−1] accounts for external sources and sinks, and ϕo [–] is the porosity of the surface domain, which also considers rill storage and obstruction storage exclusion.
The 2D fluid flux qo [L T−1] is given by
where Ko [L T−1] represents the surface conductance, and kro [–] is a factor to reduce the conductance up to the obstruction height.
Coupling between the surface and the subsurface domain is achieved via a dual-node implementation. In general, the surface–subsurface exchange term is a first-order coupling term that depends on the head differences between the surface and subsurface domains over a user-defined coupling length for the exchange. For a dual-permeability subsurface, the surface–subsurface exchange term is the sum of individual exchanges between the surface domain and the high- and low-permeability subsurface regions and is defined as follows:
where hh and hl [L] are the hydraulic heads of the high- and low-permeability subsurface regions, and Kzh and Kzl [L T−1] are the vertical saturated hydraulic conductivities. lexch [L] is the coupling length between the surface and each of the two subsurface regions.
2.2 Dual-permeability mass transport with two-site kinetic deposition mode
As outlined above, classical (reactive) solute transport and/or colloid filtration theory are not suitable for describing microbial transport in groundwater, but a modified colloid filtration approach that is conceptualized as a dual-permeability domain with two-site kinetic deposition mode has been shown to be suitable for the simulation of microbial transport at the wellfield scale. Here, we implemented the governing equations for modelling microbial transport in dual-permeability systems as introduced by Bradford et al. (2009) in HGS. In this formulation, the pore space of the subsurface is divided into two regions, and, in each region, colloids can exist both in the liquid phase and attached to the solid phase. The transfer of colloids between the liquid and solid phases is described through first-order kinetic terms, representing attachment and detachment. Bradford et al. (2009) only simulated colloid transport at the column scale. We extended the model by adding first-order sink terms in the liquid and solid phases to account for microbial inactivation relevant to the wellfield or catchment scale. The governing equations for the liquid concentrations in the high- and low-permeability subsurface regions are as follows:
where c [Nc L−3] is the liquid-phase concentration, Nc is the number of colloids, katt [T−1] is the first-order attachment rate coefficient, kdet [T−1] is the first-order detachment rate coefficient, λ [T−1] is the first-order sink term in the liquid phase, and J [] is the sum of the advective and dispersive fluxes. Ωoh and Ωol [] are the mass exchange terms between the surface domain and the high- and low-permeability subsurface regions, respectively. The term Ωex [] describes the mass exchange in the liquid phase between the two subsurface regions and is given by
where the coefficient ωex [T−1] accounts for colloid transfer from the high-permeability liquid phase to the low-permeability liquid phase.
The solid concentrations in the high- and low-permeability subsurface regions are defined as follows:
where s [Nc M−1] is the solid-phase concentration, ρb is the bulk density [M L−3], and λs [T−1] is the decay term in the solid phase, while kt [T−1] is a coefficient for the colloid exchange from the solid phase in the high-permeability region to the solid phase in low-permeability region, driven by rolling or sliding of microbes on solid surfaces due to hydrodynamic forces (Bradford et al., 2009; Molnar et al., 2015).
The irreversible process of microbial straining in the smaller pore space can be incorporated either by assuming irreversible attachment in the low-permeability region by setting kdetl = 0 or, in settings of reversible attachment–detachment conditions in both the high- and low-permeability regions, by utilizing the first-order sink terms as effective parameters for inactivation and straining. Both approaches can eliminate microbes permanently from the liquid phase, but only by considering the elimination terms can we address irreversible straining alongside reversible attachment–detachment in both permeability zones as two distinct processes.
The total flux concentration of the two liquid phases in the subsurface ct [Nc L−3] is
The total solid-phase concentration in the subsurface st [Nc M−1] is given by
2.3 Coupled surface–subsurface solute transport
Solute transport in the surface domain is defined in HGS as follows:
where co [M L−3] is the concentration in the surface water domain, is the depth-integrated gradient operator, Do [L2 T−1] is the hydrodynamic dispersion tensor, and λo [T−1] is the first-order decay constant in the surface domain. Ωo [] represents the mass exchange flux between the surface and subsurface domain.
In a surface–subsurface HGS model set-up coupled with the dual-node approach, a first-order term is used to transfer mass between the surface and subsurface domains. In a dual-permeability subsurface system, the total surface–subsurface mass exchange is the sum of the exchange between the surface and each of the two subsurface regions, here the high- and low-permeability regions as introduced in the previous section. The total surface–subsurface mass exchange Ωo is conceptualized as follows:
where αc [L] is the coupling dispersivity between the surface and the subsurface, Dfree [L2 T−1] is the free-solution diffusion coefficient, and τ [–] is the tortuosity. cupsh and cupsl [M L−3] are the upstream concentration terms for the exchange between the surface and the high- and low-permeability regions, respectively. The upstream concentration equals the surface water concentration co in the case of infiltrating surface water conditions. For exfiltrating groundwater conditions, the upstream concentration equals the concentration of the respective subsurface region.
2.4 Solute transport as a benchmark for microbial transport
In contrast to colloids, which undergo straining in the low-permeability pore space, solute transport occurs equally in the high- and low-permeability pore space. Thus, in theory, the transport of conservative solutes could be used as a benchmark for the quantification of size exclusion (i.e., straining) of microbes so long as the attachment, detachment, and inactivation rates are sufficiently well known (Flynn et al., 2006).
Dissolved atmospheric noble gases are conservative tracers for river–aquifer interactions and provide information on mixing ratios of different water types (Beyerle et al., 1999; Mattle et al., 2001; Schilling et al., 2017, 2022; Blanc et al., 2024). As noble gases are ubiquitous in the atmosphere, water that is in contact with the atmosphere can be assumed to have an atmospheric noble gas content that is characterized by the air–water exchange equilibrium. Groundwater from different recharge zones can therefore be distinguished by its atmospheric noble gas composition (Kipfer et al., 2002; Aeschbach-Hertig and Solomon, 2013; Cook and Herczeg, 2000). If the recharge zones or compositions of the different mixing components are known, the fractions of the different components in a mixture can be estimated using linear endmember mixing analysis, which was demonstrated by Popp et al. (2021). At the wellfield scale, 4He acts as a conservative tracer for disentangling locally infiltrated river water and regional groundwater. Once the fractions of locally infiltrated river water and regional groundwater in riverbank filtration wellfields are known, concentrations of the radioactive noble gas 222Rn, which is only produced and present in significant quantities in the subsurface, can be used to estimate the travel times of locally infiltrated river water (Hoehn and Von Gunten, 1989; Cecil and Green, 2000; Vogt et al., 2010; Peel et al., 2022, 2023; Popp et al., 2021).
The transport, production, and decay of environmental gas tracers in the subsurface as implemented in HGS are described in detail in Delottier et al. (2022). In short, the production of 222Rn can be simulated by using a zero-order source with partitioning. The production rate per unit pore volume [] is the product of the steady-state equilibrium 222Rn activity, its decay constant, and the porosity. Furthermore, the aqueous–gas-phase partitioning coefficient [–] needs to be specified. 4He production in the subsurface can also be simulated using a zero-order source with partitioning. However, at the wellfield scale, owing to the very low production rate of 4He, the concentrations of different water components are dominated by either their background concentrations (e.g., that of regional alluvial groundwater entering the wellfield) or the air–water exchange equilibrium and excess air components that characterize freshly recharged water such as locally infiltrated river water (Popp et al., 2021; Schilling et al., 2017). Hence, for simulations of riverbank filtration sites, as long as the background concentrations of the different groundwater components are known, 4He can be treated like a conservative solute such as a dye, for example.
Moreover, Blanc et al. (2024) showed recently that, in settings with only small variations in the natural 4He concentrations of different water types, the breakthrough of a sufficiently large artificial 4He injection into the surface water or groundwater can be attributed to the injection experiment and can provide an alternative to classical conservative dye tracing.
To verify the dual-permeability approach with two-site kinetic deposition mode as implemented in HGS, a synthetic numerical experiment simulating reactive colloid transport through a soil column was performed. The simulation results were compared to an analytical solution for colloid transport in dual-permeability media developed by Leij and Bradford (2013). The synthetic experiment was designed after an experiment by Bradford et al. (2009) and consists of a 1 m vertical soil column with a low-permeability region and a high-permeability region. Flow is at steady state, and a constant colloid injection pulse is applied to the top of the soil column for a total of 1.2 h. The colloid breakthrough curves simulated by HGS at the bottom of the soil column for the two permeability regions and the retained colloid concentrations on the grain surfaces of the two permeability regions were compared to those of the analytical solution.
3.1 Numerical model set-up
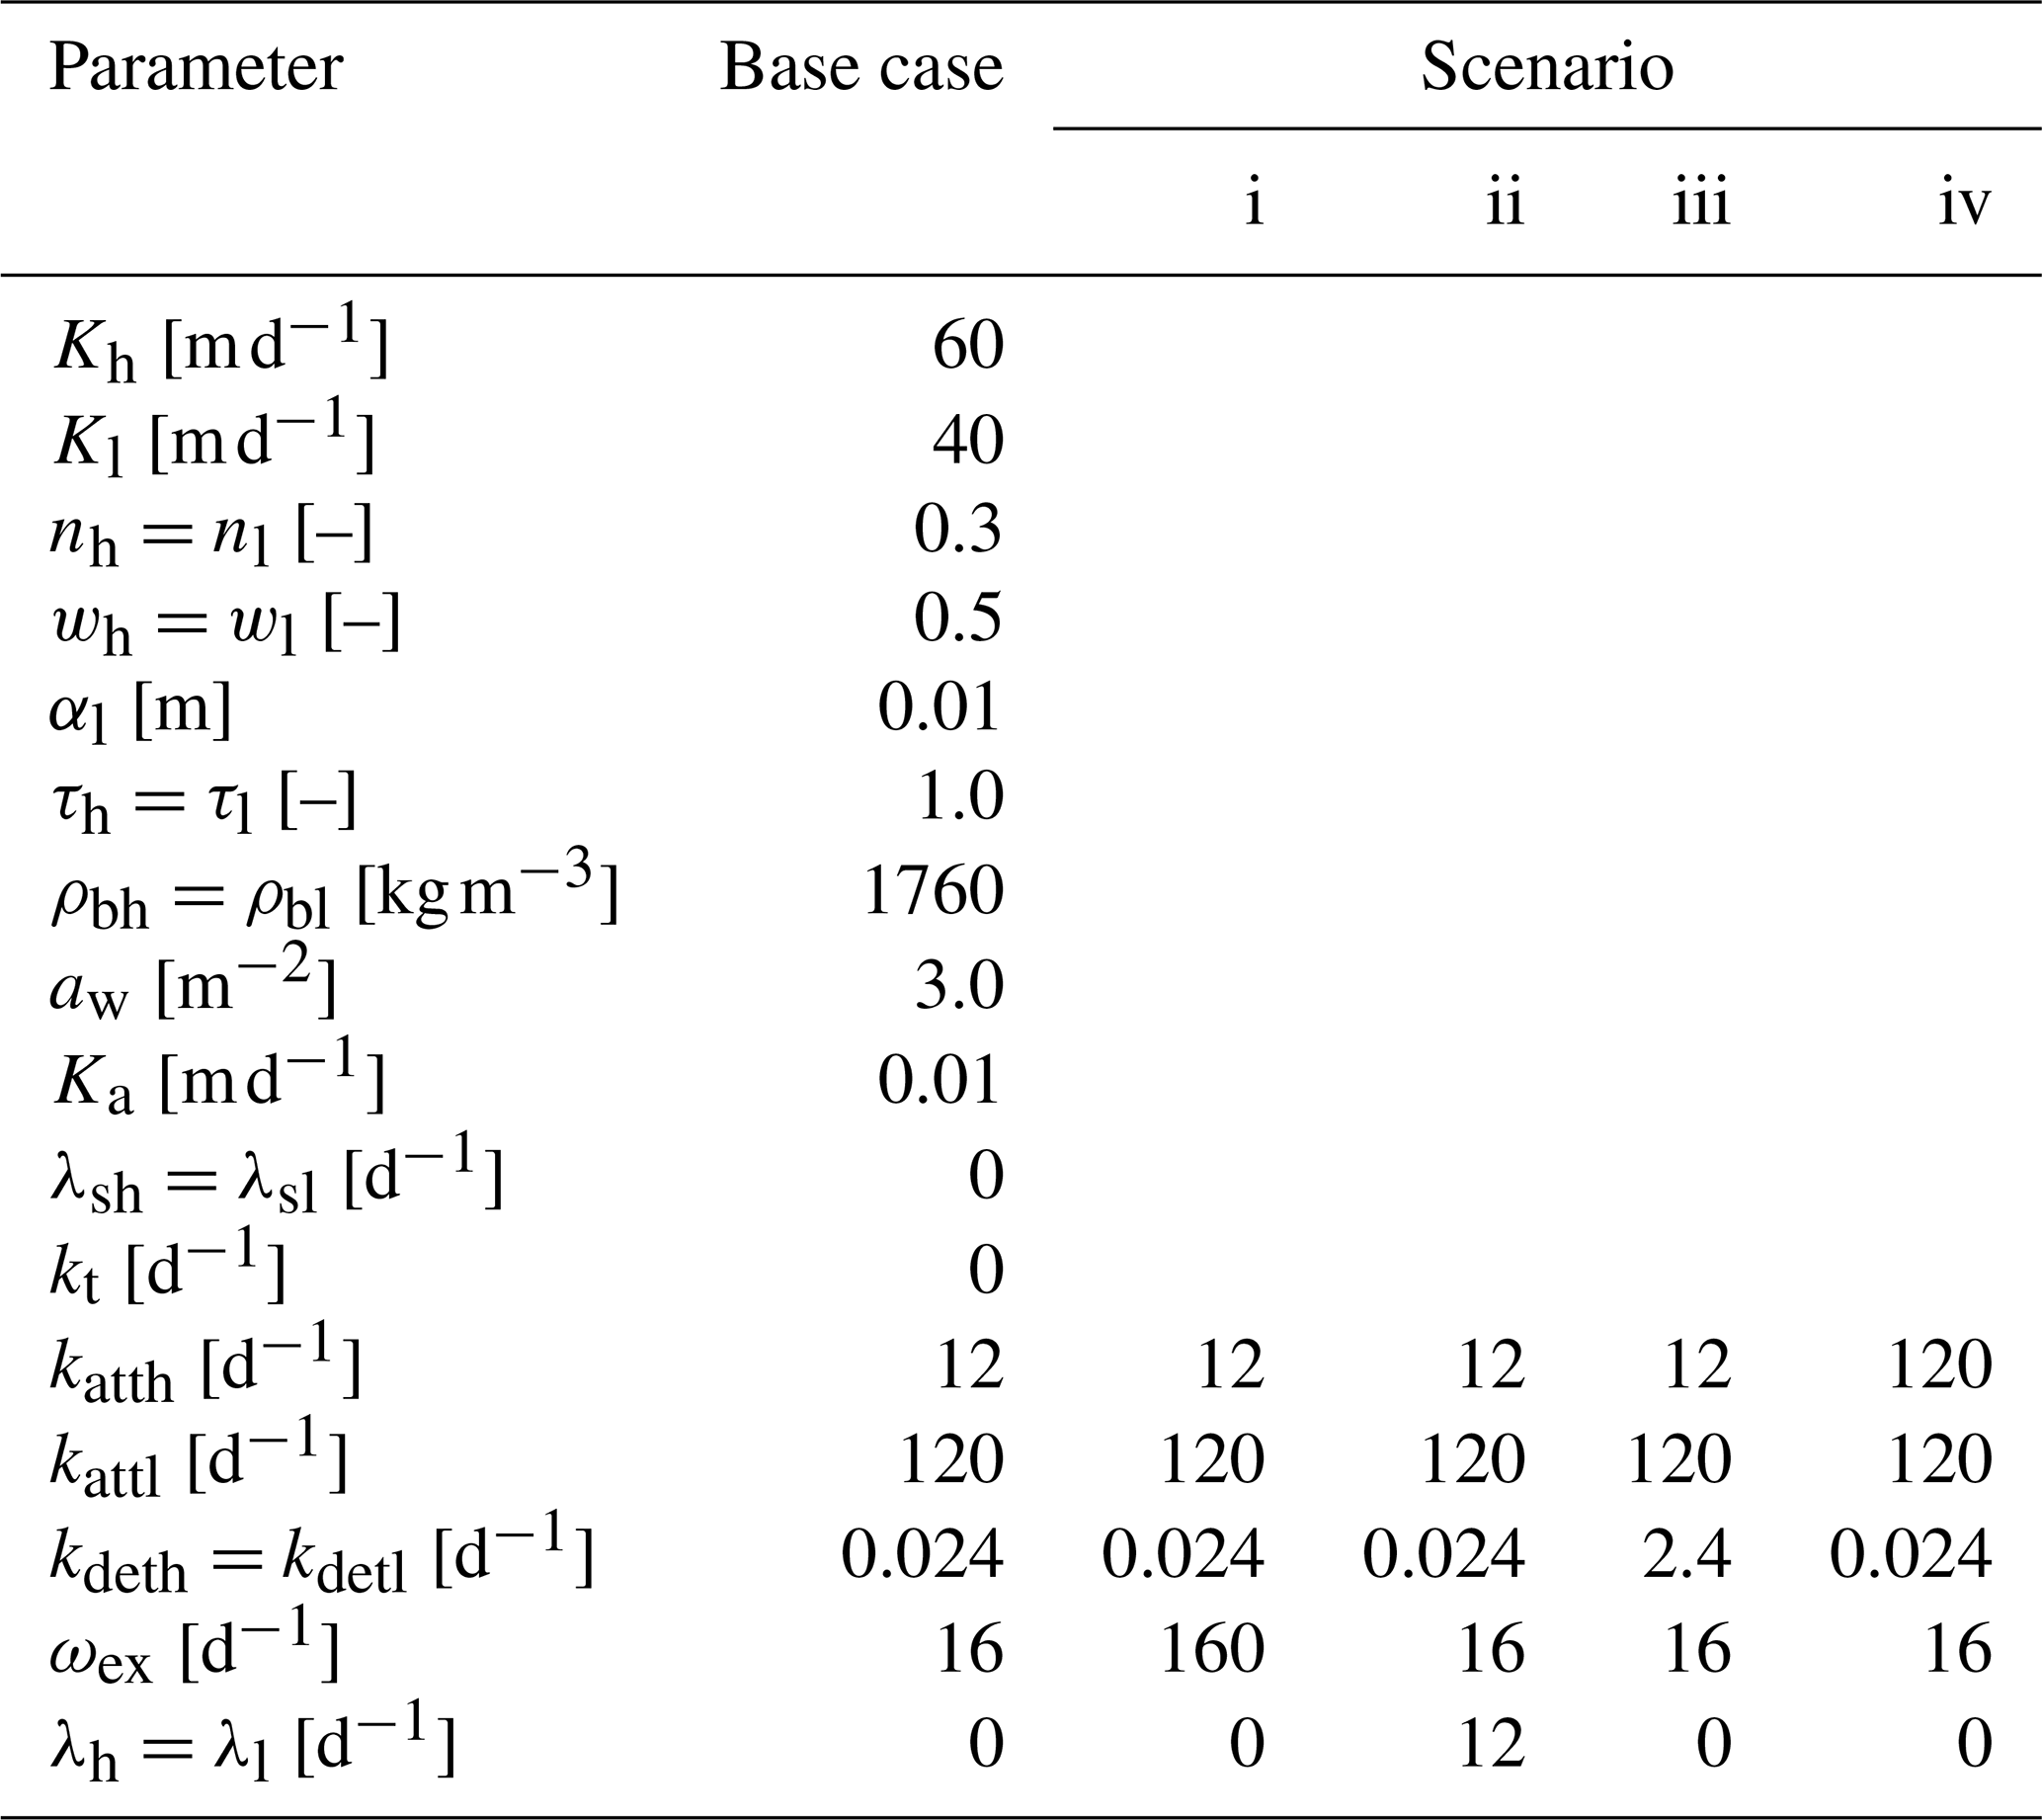
In HGS, the 1D column with a total height of 1 m is discretized with vertical intervals of 0.025 m. A homogeneous and fully saturated soil column with a high- and low-permeability pore space is assumed. The hydraulic conductivities for the high- and low-permeability pore spaces are set to 60 and 40 m d−1, respectively. A steady flow field is generated by applying fixed-head boundary conditions at the top (inlet, hin) and the bottom (outlet, hout) of the soil column, such that hin−hout = 0.15 m. The total porosity is defined as 0.3. Assuming an equal fraction of high- and low-permeability pore space (i.e., wh=wl = 0.5), the resulting total fluid flux amounts to 7.5 m d−1. In both permeability regions, the longitudinal dispersivity αl is equal to 0.01 m, and tortuosities τh and τl are equal to 1.0. The bulk density in both regions is set to 1760 kg m−3.
The first-order fluid exchange coefficient aw between the two permeability regions is set to 3.0 m−2, and the hydraulic conductivity at the interface between the two regions Ka is equal to 0.01 m d−1.
The colloid attachment rates katth and kattl are set to 12 and 120 d−1 in the high- and low-permeability regions, respectively. In both regions, a detachment rate of kdeth=kdetl = 0.024 d−1 is assigned, the transfer coefficient for the liquid phase ωex is set to 16 d−1, while the coefficient for colloid exchange between the solid phases in the high- and low-permeability regions kt is set to 0 d−1.
The soil column is initially free of colloids. A 1.2 h colloid input pulse using a third-type concentration boundary with a colloid inflow concentration of 1000 Nc m−3 is applied, and the flow and transport within the column are simulated for 3 h.
In addition to the base case simulation, the following four scenarios of flow and transport are simulated where (i) the liquid exchange coefficient ωex is increased by a factor of 10, (ii) first-order decay in both liquid regions is assumed to occur with λh=λl = 12 d−1, (iii) the detachment rate in both regions (kdeth and kdetl) is increased by a factor of 100, and (iv) the attachment rate in the high-permeability region katth is increased by a factor of 10. All parameters are summarized in Table 1.
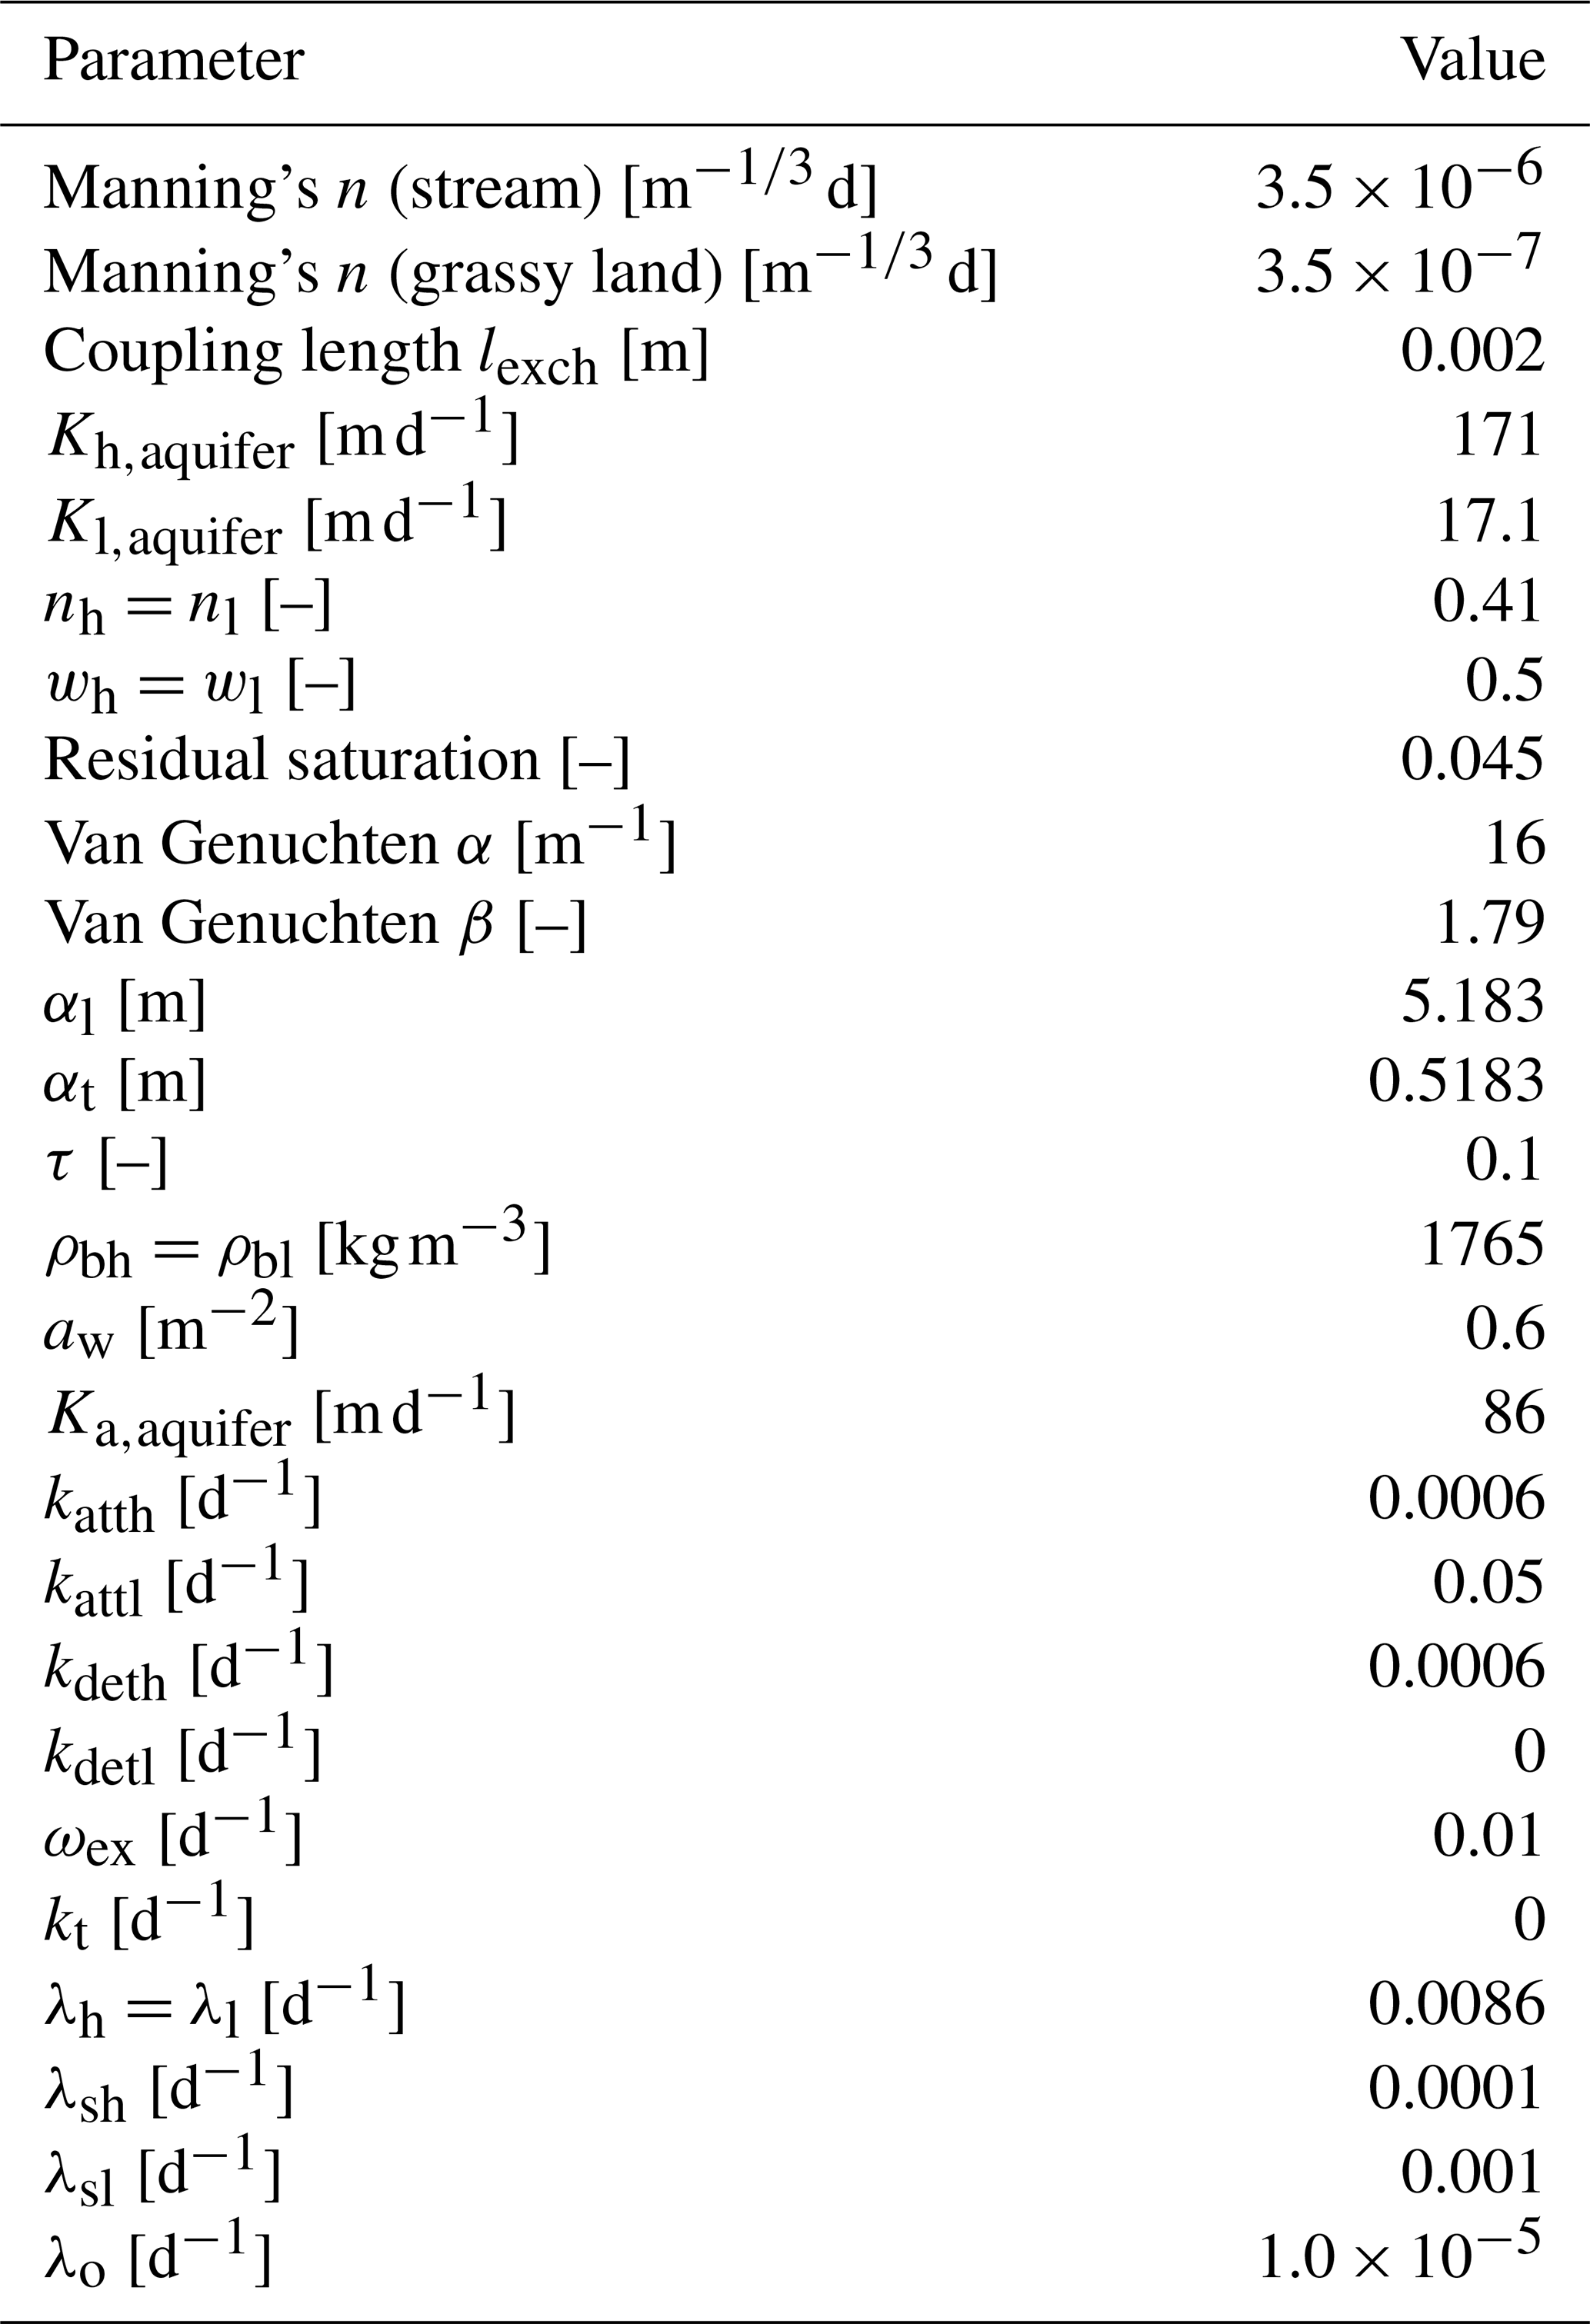
Table 1Simulation base parameters and simulation scenarios as employed for model verification.
3.2 Analytical solution for colloid transport in dual-permeability media
The analytical solution derived by Leij and Bradford (2013) is based on the same partial differential equations as outlined for the HGS model implementation (Eqs. 10–14) and accounts for advective and dispersive transport in both a high- and a low-permeability region, with reversible kinetic-sorption sites in each region and exchange between the liquid phases. Moreover, the analytical solution includes a second, irreversible retention site in both regions. As outlined by Leij and Bradford (2013), these irreversible retention sites can also be used to account for other first-order sink terms such as, e.g., inactivation. Limitations of the analytical solution for verifying the implementation in HGS are that, in the analytical solution, the pore space is shared equally by the high- and low-permeability regions (), the detachment rates of both regions are equal (kdeth=kdetl), and there is no colloid exchange between the two solid phases (kt=0).
The same parameterization as used for the numerical experiments was employed for the analytical solution (see Table 1). The spatial and temporal discretizations were set to 0.2 m and 0.01 h, respectively. The analytical solution was computed using the original Fortran executable of Leij and Bradford (2013).
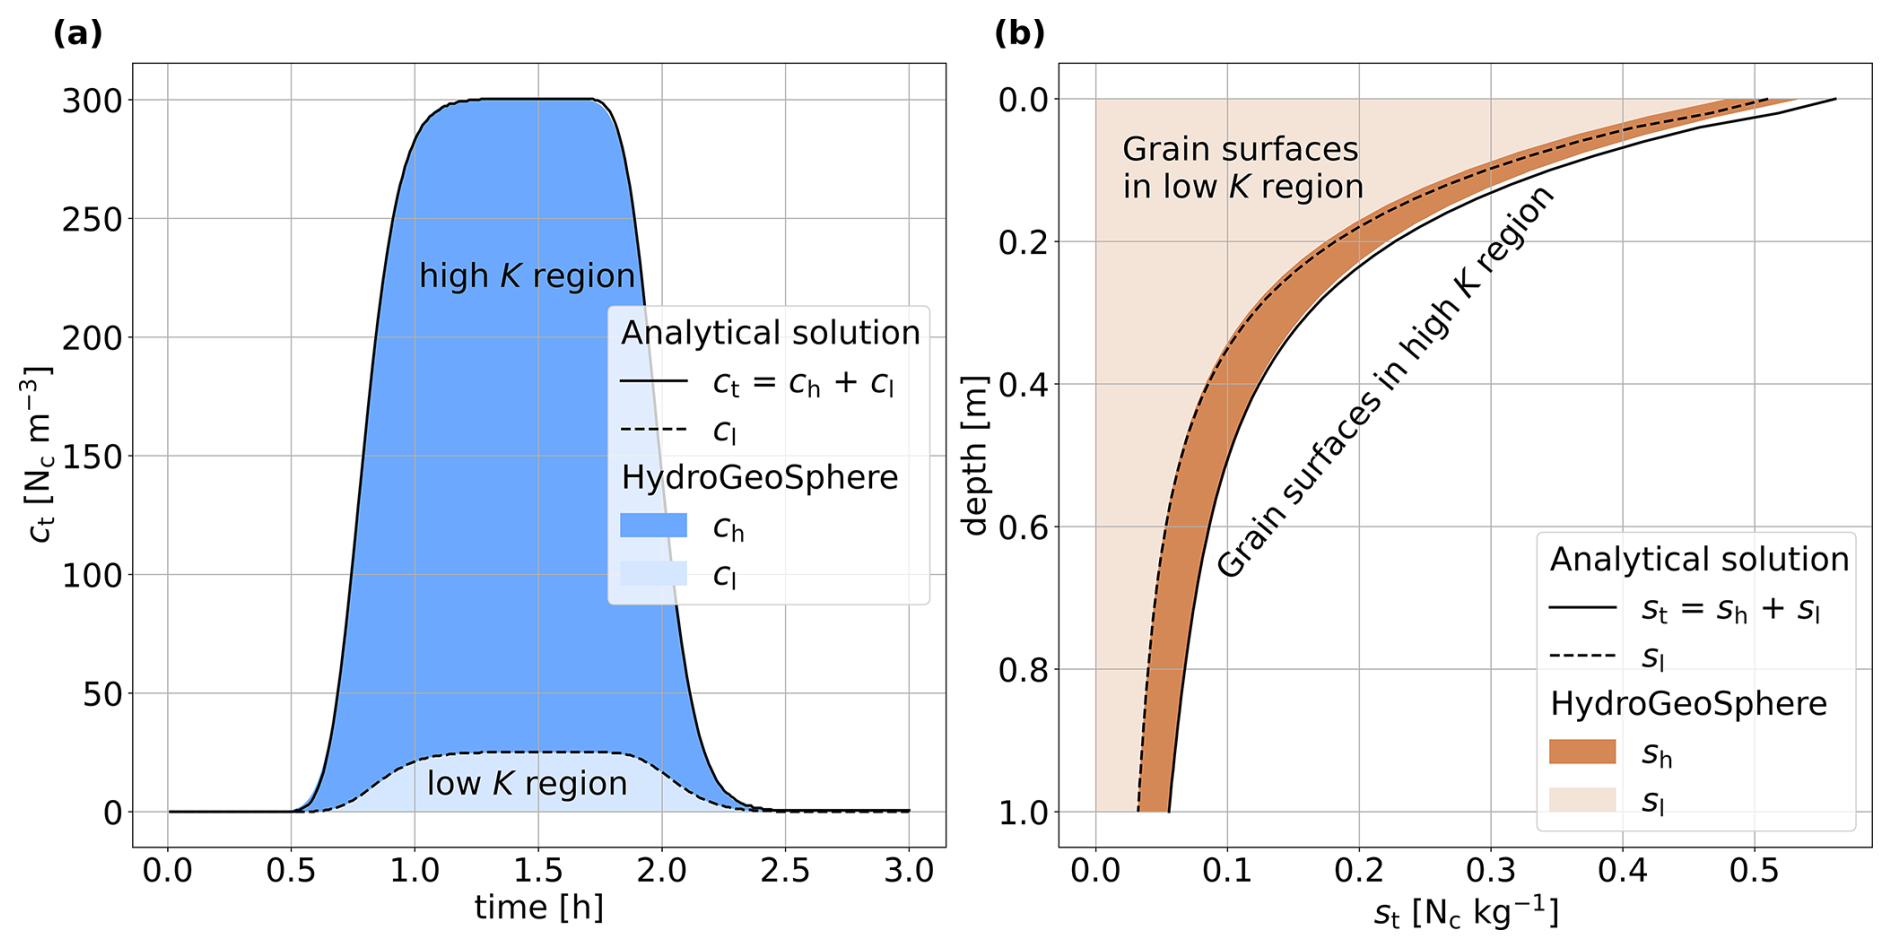
Figure 1Comparison of the simulation results in HGS and the analytical solution for a synthetic 1D soil column, showing (a) the breakthrough curve () of a 1.2 h colloid injection in the liquid phase at the column outlet and (b) the final retention of the attached colloid concentration st after 3 h, with the two sub-components sh and sl indicated as well.
3.3 Results
Figure 1 illustrates the breakthrough of colloids in the liquid phase at the column outlet for the base case parameterization (Fig. 1a), as well as the final profile of attached colloids at the end of the experiment (Fig. 1b). The concentrations in the low-permeability region as simulated with HGS are depicted in lighter shades, and the concentrations in the high-permeability region are depicted in darker shades. The analytical solutions for the low-permeability (cl and sl) space and for the combined low-permeability–high-permeability (ct and st) space are plotted using dashed and solid black lines, respectively. The liquid and the solid concentrations in both regions simulated by HGS are in very good agreement with the analytical solution. At the column inlet, a perfect match was not possible because of the vicinity to the inflow boundary condition and related numerical instabilities in the evaluation of the integrals within the analytical solution.
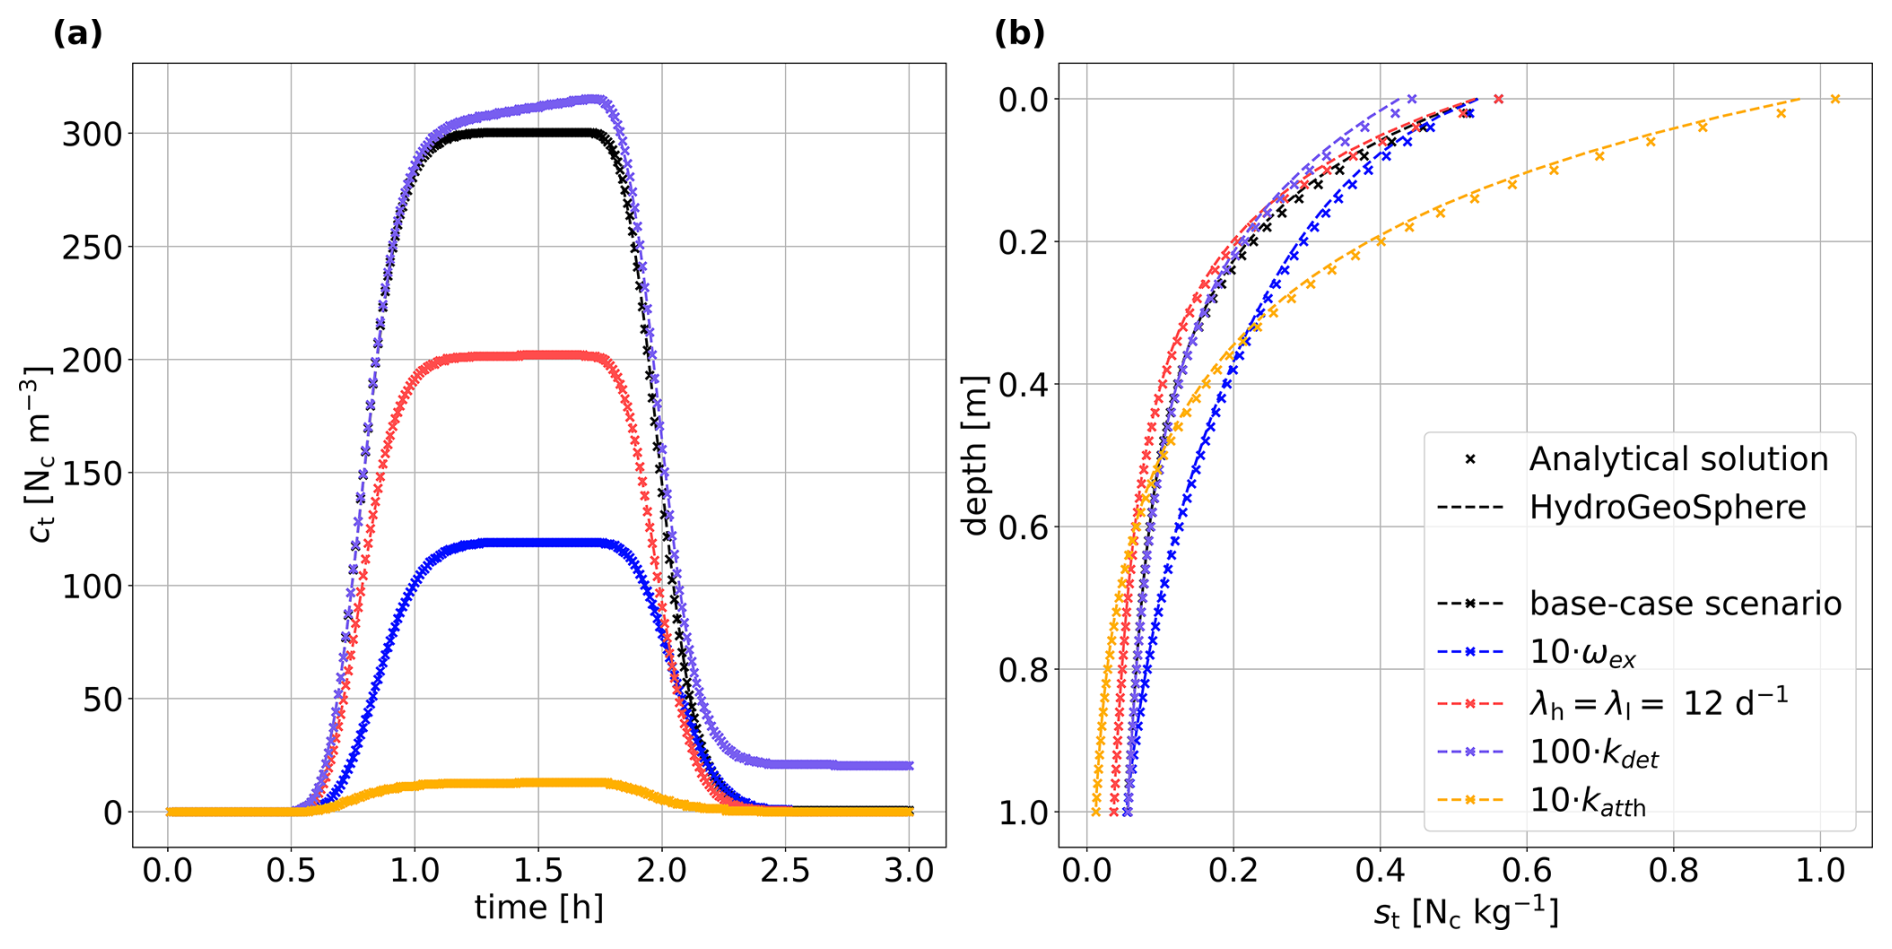
Figure 2(a) Breakthrough curves of total colloid concentration in the liquid phase ct at the column outlet and (b) final retention profile of the total attached colloid concentration st for the base case scenario, as well as scenarios with a (i) a 10-times-higher colloid transfer coefficient between the two regions ωex, (ii) first-order decay in both liquid regions (λh=λl = 12 d−1), (iii) a 100-times-higher detachment rate in both regions (kdeth and kdetl) , and (iv) a 10-times-higher attachment rate in the high-permeability region katth.
The total liquid-phase concentrations (Eq. 15) and the corresponding total solid-phase concentrations (Eq. 16) for the five scenarios are presented in Fig. 2. Also, under varying parameterizations, an excellent fit between the numerical solution of HGS and the analytical solution could be achieved. As mentioned above, minor discrepancies between the analytical and numerical solutions at the solid-phase column inlet can also be observed for the different scenarios.
In comparison to the base case scenario, scenario i (blue markers and line in Fig. 2) has an increased liquid exchange coefficient, and, thus, more colloids are transported in the low-permeability pore space, where the attachment rate is higher. This results in a lower breakthrough of the liquid concentration at the column outlet and in an increased final sorbed concentration. In scenario ii (depicted in red in Fig. 2), the total liquid concentration and the total sorbed concentration are lower than in the base case scenario due to colloid decay in both liquid regions. The increased detachment rate in region 1 (scenario iii, purple markers and line in Fig. 2) affects the liquid breakthrough concentration at later simulation times. The column is initially colloid free, and colloids need to attach first before the enhanced detachment rate impacts the colloid distribution. Similarly, the solid-phase concentration is solely affected at the column inlet, where the colloid pulse arrives first and where sufficient time for attachment and enhanced detachment is given. The higher attachment rate in region 1 (scenario iv, depicted in yellow in Fig. 2) results in a peak concentration of the breakthrough curve that is more than 10 times lower. The total sorbed concentration is significantly higher at the column inlet; however, it is lower at the column outlet as fewer colloids reach the column outlet via advective and dispersive transport.
In summary, the dual-permeability approach with a two-site kinetic deposition mode as implemented in HGS could be verified successfully against the existing analytical solution by Leij and Bradford (2013).
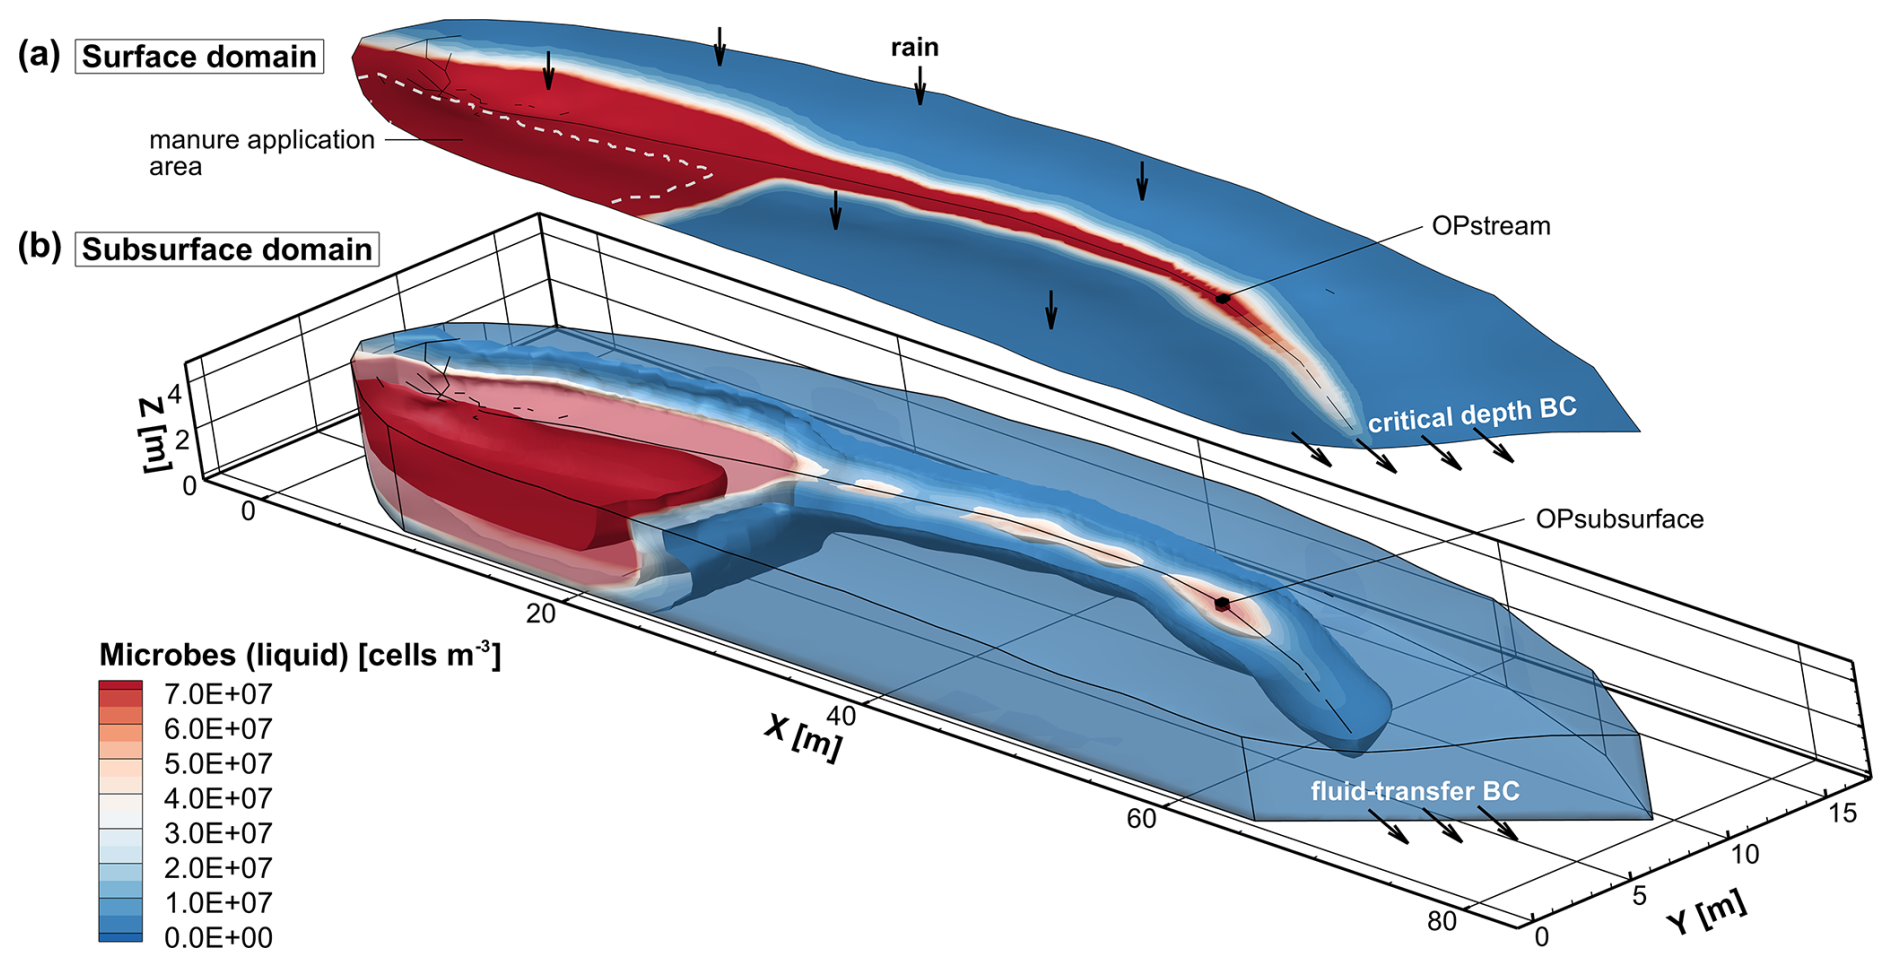
Figure 3Illustration of the streamflow generation model with microbial transport. The upper 2D surface (a) shows the microbial concentration in the surface domain, while the lower 3D domain (b) shows the microbial concentration in the subsurface. The manure application area in the surface domain is marked by a dashed white line, and the observation points in the stream (OPstream) and 0.2 m below the streambed in the subsurface (OPsubsurface) are shown by black cubes. Depicted is the simulated total concentration of the microbial species in the liquid phase 10 d after a heavy, 6 h rainfall event.
4.1 Streamflow generation by return flow
To illustrate microbial transport in surface water and groundwater and across the surface water–groundwater interface, an existing benchmark for rainfall–runoff and streamflow generation simulations was used. The benchmark is based on a small-scale sandy catchment located at the Borden research site in Canada that was first studied and simulated by Abdul (1985). The surface topography of this V-shaped catchment consists of gentle hillslopes and a central, runoff-collecting depression whose width is about 2 m. Several studies have been based on this benchmark for rainfall–runoff and solute transport simulations with ISSHMs (e.g., Jones et al., 2006; Thomas et al., 2016; De Maet et al., 2015). Kollet et al. (2017) finally established the set-up as a benchmark to compare various ISSHMs in simulating hydrological surface–subsurface interactions and streamflow generation. More recently, Gutiérrez-Jurado et al. (2019) modified the benchmark to systematically investigate the influence of soil types and precipitation intensity on streamflow generation with the HGS model. The simulations presented here are based on the benchmark modified by Gutiérrez-Jurado et al. (2019), where it is assumed that the catchment consists of a sandy-gravel soil instead of sand. A 6 h heavy-precipitation event is simulated to illustrate a situation where streamflow generation during rainfall events is predominantly driven by exfiltration of pre-event groundwater and interflow. For the purpose of this study, the model is further extended to include a dual-permeability subsurface. Moreover, a conceptual microbial contamination event in the form of an agricultural manure application shortly before the 6 h heavy-precipitation event is added. To simultaneously track microbial transport, solute transport, and streamflow generation mechanisms, advective–dispersive transport of a conservative solute and a hydraulic-mixing-cell analysis are also employed.
4.1.1 Model set-up
The extent of the model is 80, 16, and 4.6 m in the x, y, and z directions, respectively (Fig. 3). Compared to Gutiérrez-Jurado et al. (2019), the triangular mesh was significantly refined using the mesh generator AlgoMesh (Hydroalgorithmics Pty Ltd., 2020). The element size ranges from 0.3 m in the runoff-collecting depression up to a maximum of 2.0 m at the catchment boundaries. The model is discretized vertically into 15 layers, starting from a layer thickness of 0.1 m at the ground surface and gradually increasing with depth to a maximum of 0.5 m at the model bottom. In total, the mesh comprises 64 704 nodes and 119 445 triangular elements.
Manning's roughness coefficient n for the runoff-collecting depression and for the surrounding grassy hillslope is equal to 3.5 × 10⁻⁶ and 3.5 × 10⁻⁷ , respectively, with these values being used by Gutiérrez-Jurado et al. (2019). The sandy gravel has a total porosity of 0.41, van Genuchten parameters α and β of 16 m−1 and 1.79, and a residual saturation of 0.045. For the purpose of this study, the subsurface is extended into a dual-permeability medium, consisting, in equal proportions, of a high-permeability region and a low-permeability region with effective hydraulic conductivities of 171 and 17.1 m d−1, respectively. The first-order fluid exchange coefficient between the two permeability regions is 0.6 m−2, and the hydraulic conductivity of the interface is 86 m d−1.
The simulation is started from an initially dry channel and a uniform initial hydraulic head of 2.78 m in both subsurface permeability regions, resulting in an initial depth to water table of 0.2 m below the channel. At the outlet of the catchment, a critical depth boundary condition is applied in the surface domain. In both permeability subsurface regions, a fluid transfer boundary condition is applied with a reference head of 2.8 m at a distance of 5 m from the downstream model boundary to allow groundwater outflow. Analogously to Gutiérrez-Jurado et al. (2019), a precipitation rate of 0.39 m d−1 (second-type BC, corresponding to 16 mm h−1) is applied to the surface water domain for 6 h to generate streamflow from exfiltrating groundwater. After 6 h, the precipitation rate is reduced to a value of 3.9 × 10⁻⁷ m d−1 to maintain a small value of stream discharge until the end of the simulation. The total simulation time is 20 d.
An agricultural application of manure in the upper half of the catchment is mimicked to represent a source of microbial contamination (Fig. 3). The application is assumed to occur immediately before the precipitation event, and the manure contains a generic faecal microbial species. In the application area, the initial concentration of the microbial species is 1.0 × 10⁹ cells m−3 in the surface domain and at the top of the high- and low-permeability subsurface regions. The attachment and detachment rate coefficients are both equal to 0.0006 d−1 in the high-permeability region, and the attachment and detachment rate coefficients in the low-permeability regions are set to 0.05 and 0 d−1, respectively. The irreversible attachment in the low-permeability region, resulting from the detachment rate equal to 0 d−1, represents straining due to size exclusion of the faecal microbial species. The microbial decay rates in the liquid phase are set to 0.0086 d−1 in both regions. The decay constants for the solid phases are set to 0.0001 and 0.001 d−1 in the high- and low-permeability regions, respectively. The coefficient for microbial transfer between the liquid phases in both regions is defined as 0.01 d−1, and the coefficient for colloid exchange between the solid phases is set to 0 d−1. A first-order decay coefficient in the surface domain of 1.0 × 10⁻⁵ d−1 is applied (Brooks and Field, 2016). To provide a comparison for the transport of microbes undergoing inactivation and attachment, a conservative solute is also applied simultaneously to the generic faecal microbe during the conceptual manure application phase. Table 2 lists all simulation parameters for the first illustrative example.
Table 2Simulation parameters as employed for the illustrative streamflow generation model.
To identify and quantify sources of water in the stream discharge, the hydraulic-mixing-cell (HMC) method in HGS is used (Partington et al., 2011; Schilling et al., 2017). Three possible water sources for streamflow are considered: direct runoff, return flow (exfiltrating groundwater) from the high-permeability region, and return flow from the low-permeability region. Surface water that infiltrates into the subsurface is immediately marked as groundwater of the respective permeability region, while groundwater that exfiltrates to the surface remains marked as groundwater, allowing us to distinguish strictly between direct runoff and water that has infiltrated and travelled through the subsurface. To further enable the separation of return flow into pre-event water and event water (Kirchner, 2003), the groundwater initially present in the system is labelled with a second conservative solute with an initial concentration of 100 kg m−3, representing 100 % pre-event groundwater. Two virtual observation points, one in the stream (OPstream, Fig. 3) and one 0.2 m below the streambed (OPsubsurface, Fig. 3), are located about 20 m upstream of the catchment's outlet to monitor the stream discharge (OPstream) and the contributions of the three water sources, as well as the microbial and solute concentrations in the stream (OPstream) and the subsurface (OPsubsurface).
4.1.2 Results
Figure 3 shows the simulated concentration of the microbial species in the liquid phase 10 d after a heavy, 6 h rainfall event. The microbial species gets transported through the subsurface and, at the surface, along the topographic gradient from the manure application area towards and along the stream channel. In the subsurface, the highest concentrations can be observed directly below the application area due to the water infiltration during and after the heavy-rainfall event. Moreover, the microbial species migrates below the stream due to exchange fluxes between the surface and subsurface domains. The plume of microbes below the stream clusters in areas of higher microbial concentrations, indicating increased stream water infiltration, and in areas of lower microbial concentrations, indicating increased groundwater exfiltration. These are typical patterns of hyporheic exchange flow along the stream–aquifer interface, reflecting the bathymetry of the streambed.
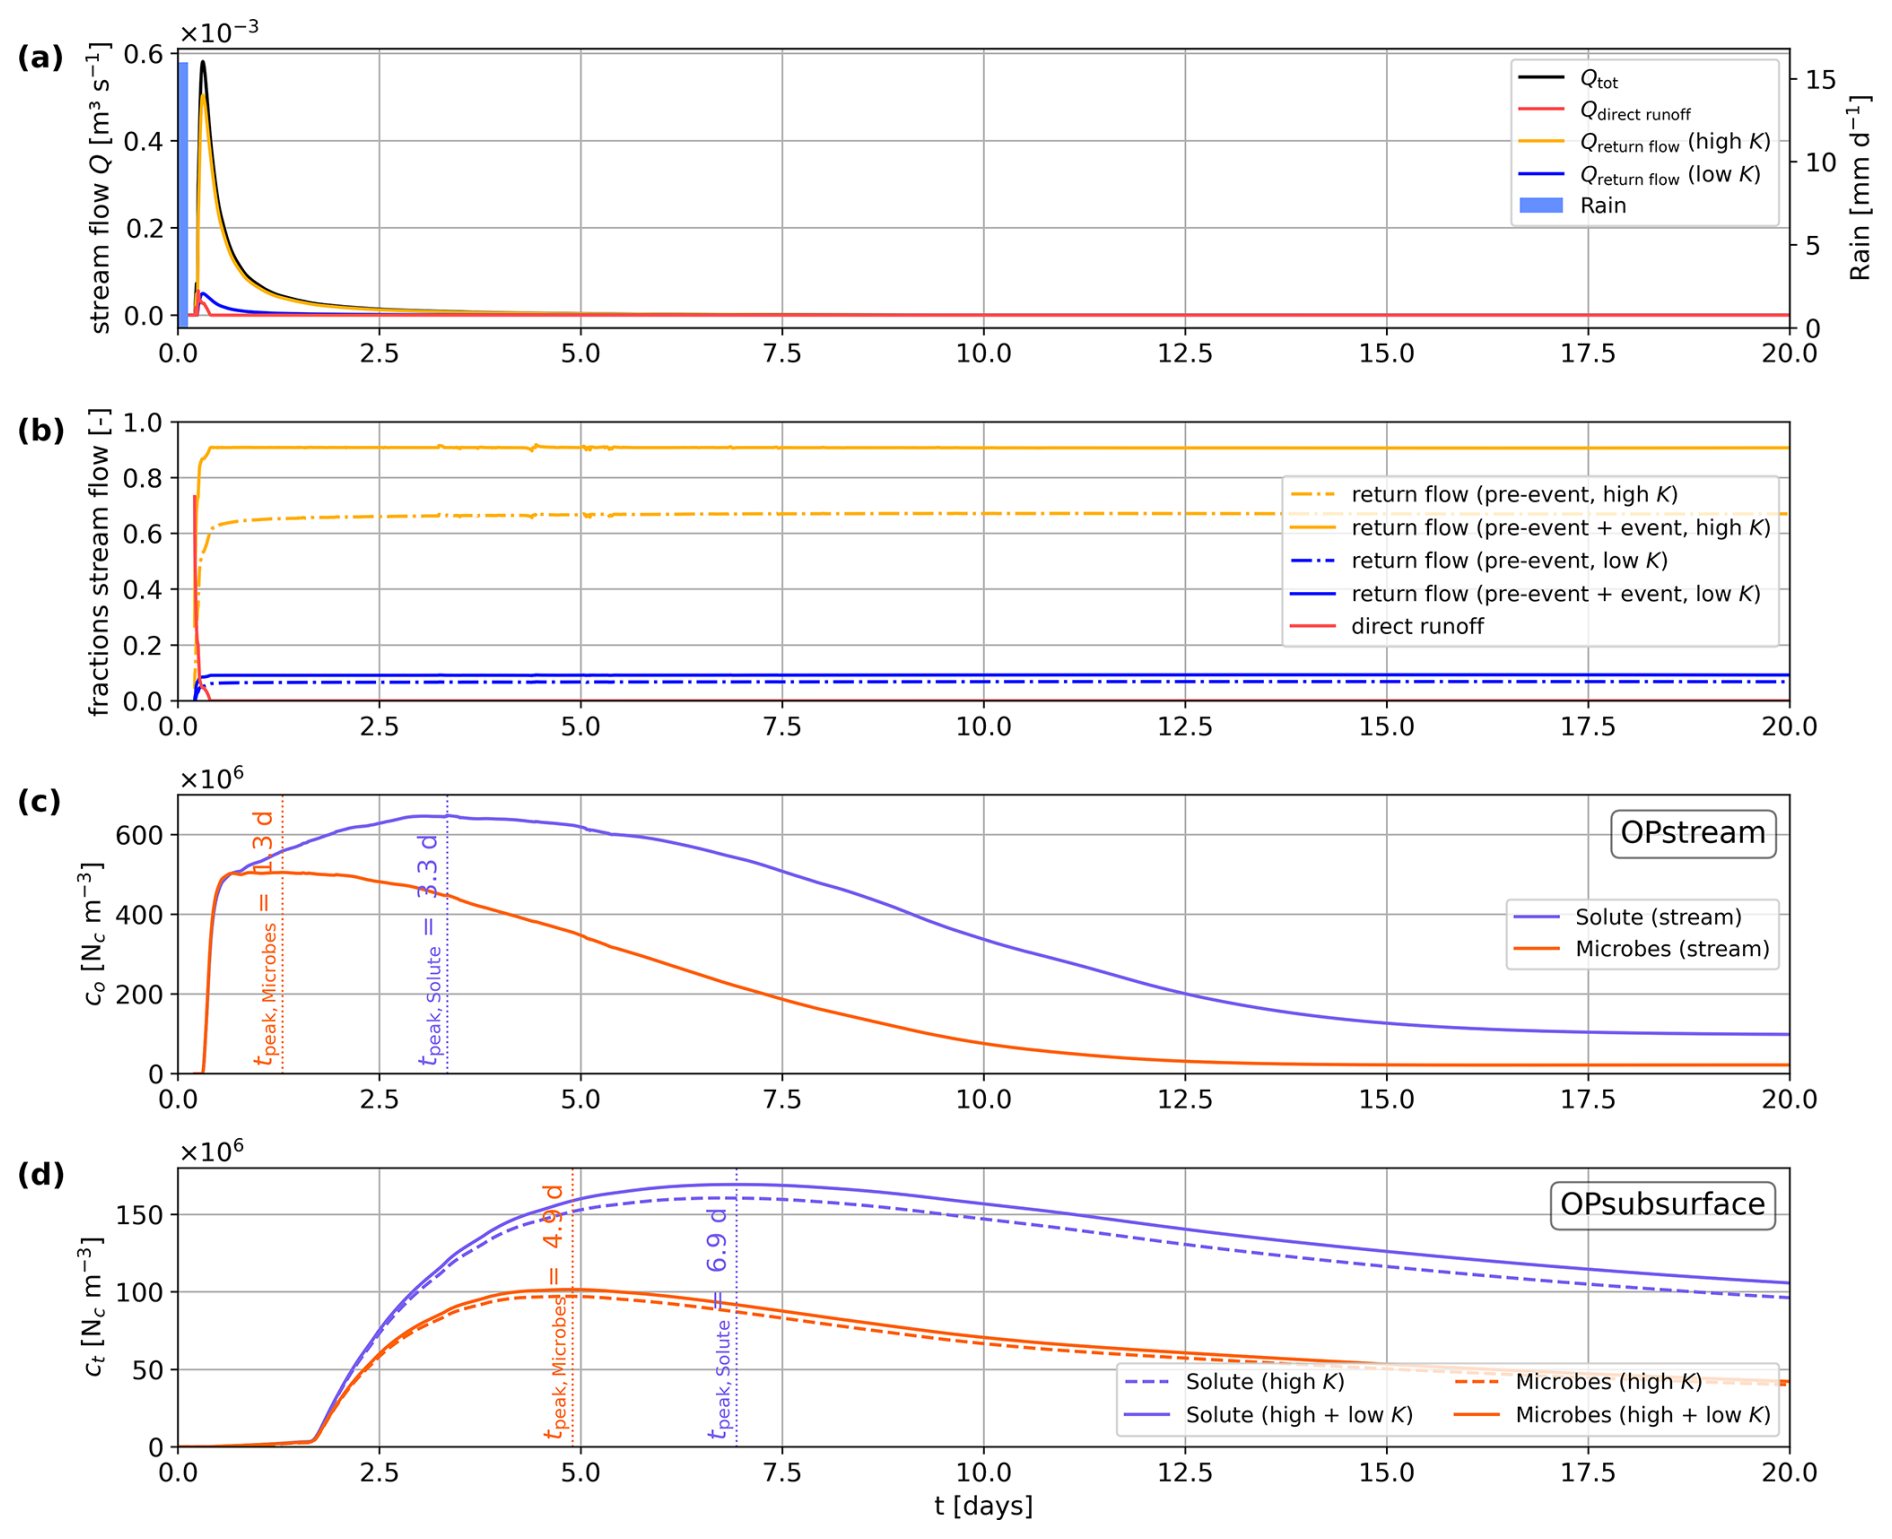
Figure 4(a) Total discharge of the stream and (b) contributions of surface runoff and return flow from the high- and low-permeability subsurface regions during the 20 d simulation period, as well as (c) simulated faecal microbial and conservative solute (liquid) concentrations at the observation point at the surface (OPstream, co) and (d) in the subsurface (OPsubsurface, ct) subdivided into contributions from the high- and low-permeability regions.
Figure 4 illustrates the temporal evolution of stream discharge, the contributing fractions of the three water types, and the microbial and solute concentrations at the two observation points. The total peak discharge is reached after 0.3 d (Fig. 4a). The fraction of stream water originating from direct runoff peaks shortly after the rainfall, with a short-term contribution reaching a maximum of about 70 %, and it decreases very rapidly to a contribution of less than 0.1 % (Fig. 4b). The major contribution to stream discharge is return flow from the high-permeability subsurface region, with a value reaching 90 %, on average, for combined pre-event and event water. The contribution of return flow from the low-permeability region for combined pre-event and event water is much lower, and its maximum is 10 %. As the fraction of direct runoff decreases, the fraction of pre-event groundwater from the high-permeability region increases and stabilizes at about 70 %.
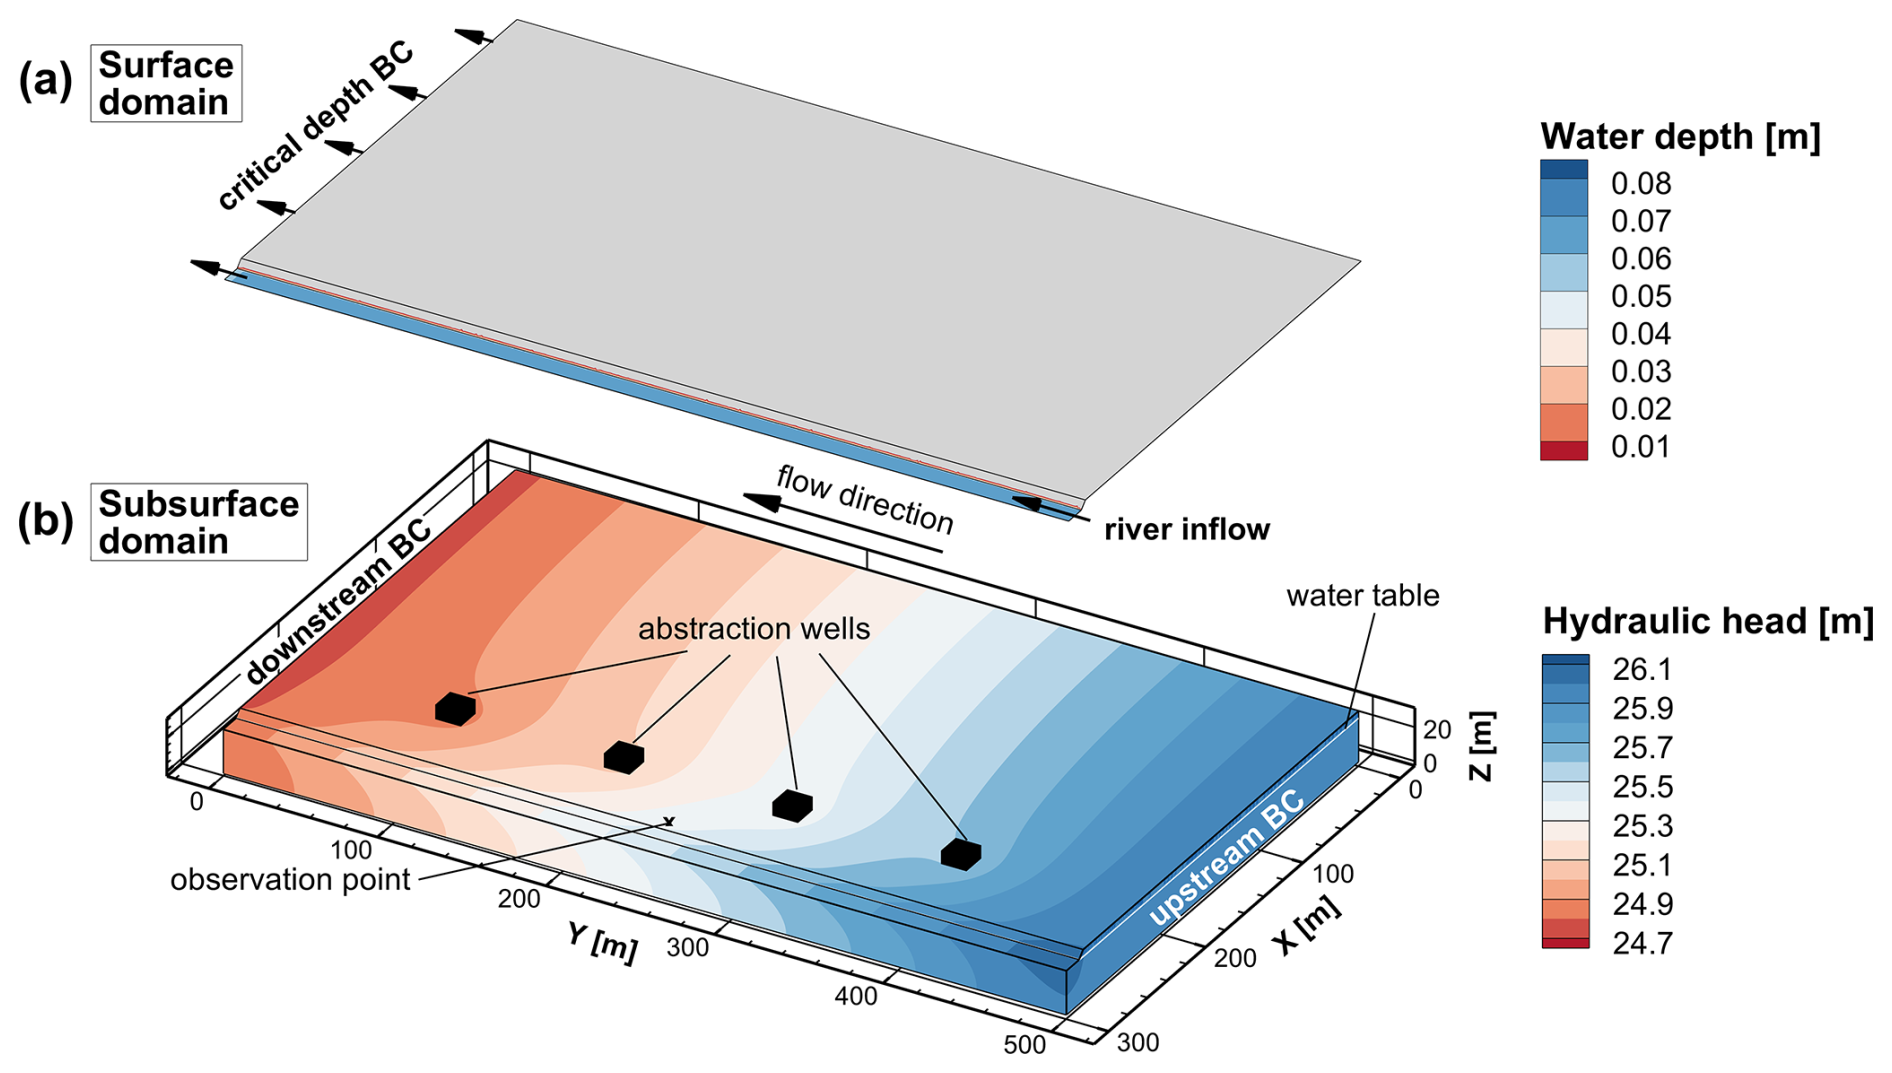
Figure 5Conceptual model of the synthetic riverbank filtration site model. The upper 2D surface (a) shows the initial water depth in the surface domain. The lower 3D plot (b) shows the subsurface domain with four abstraction wells that are evenly spaced in the alluvial plain at a distance of 65 m from the river. The observation point is at x = 275 m and y = 250 m. The initial hydraulic head distribution before the flood wave is shown, and it indicates infiltration from the river and drawdowns around the pumping wells.
With the onset of stream discharge by direct runoff, microbes and solutes rapidly migrate into the stream channel, leading to a rapid initial increase in their concentrations in the surface water at OPstream (Fig. 4c). After this rapid initial increase, the rates of increase begin to decline at around 0.6 d. Despite this slowdown, the solute concentration continues to rise and reaches its peak after 3.3 d (Fig. 4c). This subsequent increase in the solute concentration can be attributed to return flow. The peak of the microbial concentration in the stream water is reached 2 d before the peak of the conservative solute concentration (Fig. 4c), which results from the faster apparent transport of microbes in the subsurface due to size exclusion and, to a lesser degree, from microbial inactivation in the subsurface and surface domains. At OPsubsurface (Fig. 4d), the first arrival and a minor increase in total liquid solute and microbial concentrations ct, barely visible in Fig. 4d, occur shortly after the rapid concentration increase in the river. Concentrations then start to increase significantly after 1.7 d. Return flow dominates stream discharge shortly after the rain event and near the manure application area. Further down the channel, hyporheic flow starts to develop, which transports microbes and solutes in and out of the streambed. The microbial concentration at the subsurface observation points peaks 2 d before the conservative solute. This illustrates both the faster apparent transport of colloidal microbes due to size exclusion and microbial inactivation.
This illustrative streamflow generation simulation with microbial transport highlights the suitability of the new transport implementation to co-simulate explicit microbial and solute transport with an ISSHM at the surface, in the subsurface, and across the surface–subsurface interface, processes and surface–subsurface interactions which cannot be simulated or studied with pure groundwater or pure surface water models in such a rigorous manner.
4.2 Riverbank filtration
As a second illustrative example for coupled reactive microbial and solute transport at the wellfield scale, the quasi-hypothetical riverbank filtration wellfield model developed by Delottier et al. (2022) was extended to a dual-permeability system and forced by a river flood pulse with temporarily increasing microbial and 4He concentrations in the river water. The model was built after a real-world alluvial riverbank filtration site in Switzerland characterized by a high-permeability buried paleo-channel (Schilling et al., 2022) and set up to illustrate the reactive simulation of environmental gas tracer transport, production, and decay (Delottier et al., 2022). It was used to understand and inversely reproduce the impact of preferential-flow structures on river–aquifer interactions (Delottier et al., 2023) and to demonstrate modular, multi-variate data assimilation with an ISSHM (Tang et al., 2024). Besides the reactive microbial transport as implemented via the new dual-permeability, two-site kinetic deposition mode, reactive transport of 222Rn and conservative transport of 4He were simulated in order to demonstrate the potential of the new transport formulation for the integrated simulation of tracers used for the derivation of mixing ratios and travel times.
4.2.1 Model set-up
The synthetic riverbank filtration wellfield model has a spatial extent of 300 m × 500 m × 30 m in the x, y, and z directions, respectively (Fig. 5). The alluvial plain and the channel are inclined in the y direction, with a slope of 0.003. Along the side of the wellfield (x = 282.9–300 m, y = 0–500 m), a trapezoidal river with a depth of 4 m, a riverbed of 12.9 m width, and a riverbank of 4.2 m width with a 0.95 m m−1 slope is simulated. On the floodplain, at a distance of 65 m from the river (i.e., at x = 235 m), four evenly spaced pumping wells are set to extract groundwater from a screened interval ranging from 9 to 27 m depth.
The 2D triangular mesh was generated using the mesh generator AlgoMesh (Hydroalgorithmics Pty Ltd., 2020). The triangular element side length is set to increased gradually from 0.75 m near the wells and 1.5 m in the river to 3.5 m throughout the rest of the alluvial plain (see Fig. 5). In total, the model is discretized vertically into 23 layers, with the layer thickness increasing from 0.1 m at the top of the model to 3.0 m at the bottom of the model. The final 3D mesh of the model consists of 622 200 nodes, forming 1 172 678 triangular elements.
The surface roughness is parameterized using a Manning's roughness coefficient n of 8.1 × 10⁻⁶ for the floodplain and 1.91 × 10⁻⁷ for the river. Streamflow is conceptualized by applying a specified flux boundary condition (second-type BC) at the upstream river nodes and a critical-depth BC at the downstream end of the river. The initial river discharge of 0.3 m3 s−1 for the model spin-up represents low-flow conditions.
The dual-node approach is chosen to couple the surface and subsurface domains with a coupling length of 0.007 and 0.001 m in the floodplain and the river, respectively.
The subsurface is split into two homogeneous zones, an alluvial aquifer and a 0.5 m thick riverbed zone underneath the riverbed and riverbank. Furthermore, the entire subsurface is extended to a dual-permeability domain, assuming 50 % high- and 50 % low-permeability pore space. The effective hydraulic conductivities are set to 166 and 1.66 m d−1 for the high- and low-permeability zones of the aquifer and 5 and 0.05 m d−1 for the high- and low-permeability zones of the riverbed, respectively. The first-order fluid exchange coefficient between the high- and low-permeability regions is set to 0.6 m−2 for both the riverbed and the aquifer. The hydraulic conductivity of the interface is set to 150 m d−1 in the aquifer and 1.5 m d−1 in the riverbed. In the entire subsurface, the porosity is set to 0.15. For all zones and regions, the residual saturation is set to 0.05, and the van Genuchten parameters α and β are set to 3.4 m−1 and 1.71, representing typical values for alluvial sandy-gravel deposits (Dann et al., 2009; Schilling et al., 2021).
Regional groundwater flow is accounted for by a fixed-head BC (first-type BC) in the high- and low-permeability regions at the upstream and downstream ends of the aquifer. The regional hydraulic gradient is set to equal the slope of the aquifer, and the water table is at the elevation of the riverbed, which is 4 m below the surface of the wellfield. Each of the four pumping wells abstracts water at a constant rate of 805 m3 d−1.
To assess mixing ratios, 4He is defined as a conservative solute, which is a valid assumption for travel times associated with this wellfield configuration. The concentration at the upstream boundary of the aquifer is set to 5.81 × 10⁻⁸ , which corresponds to the 4He concentration that was observed in the alluvial aquifer of the Swiss pre-Alps after which the synthetic model was designed (Schilling et al., 2017). At the nodes of the upstream river boundary condition, the concentration is defined as 4.3 × 10⁻⁸ , which corresponds to an air–water equilibrium at a water temperature of 6.4 °C and air pressure of 923 hPa – average winter conditions at the Swiss reference study site. As a proxy for groundwater age, the production and decay of the natural radioactive noble gas isotope 222Rn are considered and simulated following Delottier et al. (2022). The upstream boundary condition is set to the production–decay equilibrium activity of 15 Bq L−1, a typical secular equilibrium for sandy-gravel aquifers (Peel et al., 2022; Popp et al., 2021). Due to the absence of 222Rn in the atmosphere, the activity at the surface node upstream river boundary condition is set to 0 Bq L−3. The first-order decay constant of 222Rn is set to its decay rate of 0.181 d−1. The 222Rn secular equilibrium, the 222Rn decay rate, and the porosity of the subsurface result in a production rate of 0.40725 for both regions. The water–gas partitioning coefficient is set to 0.35.
Microbes are simulated as total cell count (TCC), representing all microbial cells in the system. The total cell concentration flowing into the aquifer is defined as 30 000 cells mL−1, and the microbial cell concentration at the surface is defined as 300 000 cells mL−1. These concentrations are in the typical range of cell concentrations present in Swiss surface water and groundwater (Kötzsch and Sinreich, 2014). The parameterization of the reactive microbial transport processes is based on literature values for prokaryotes and bacteriophages that were originally estimated by fitting transport models with two first-order kinetic sites to observations of experiments at the wellfield scale (Sasidharan et al., 2018; Schijven and Šimùnek, 2002; Hornstra et al., 2018; Kvitsand et al., 2015). The first-order rates in the high-permeability region are set to 0.06 d−1 for attachment and 0.06 d−1 for detachment. The attachment and detachment coefficients in the low-permeability regions are set to 0.005 and 5 × 10⁻⁵ d−1, respectively. The rates in the low-velocity regions are smaller by 1 order of magnitude than the ones in the high-permeability region. Thereby, the concept of fast and reversible attachment in the high-permeability region and slow and (almost) irreversible attachment in the low-permeability region (Bradford et al., 2009) is incorporated. No microbial decay is simulated in the liquid phases. The decay constants for the solid phases are set to 0.001 d−1, ensuring that the fraction of microbes removed from the liquid phase due to straining are eliminated irreversibly. The coefficient for microbial transfer between the liquid phases in both regions is defined as 0.01 d−1, and the coefficient for colloid exchange between the solid phases is set to 0 d−1. Table 3 lists all simulation parameters of the illustrative example.
Table 3Simulation parameters as employed for the riverbank filtration model.
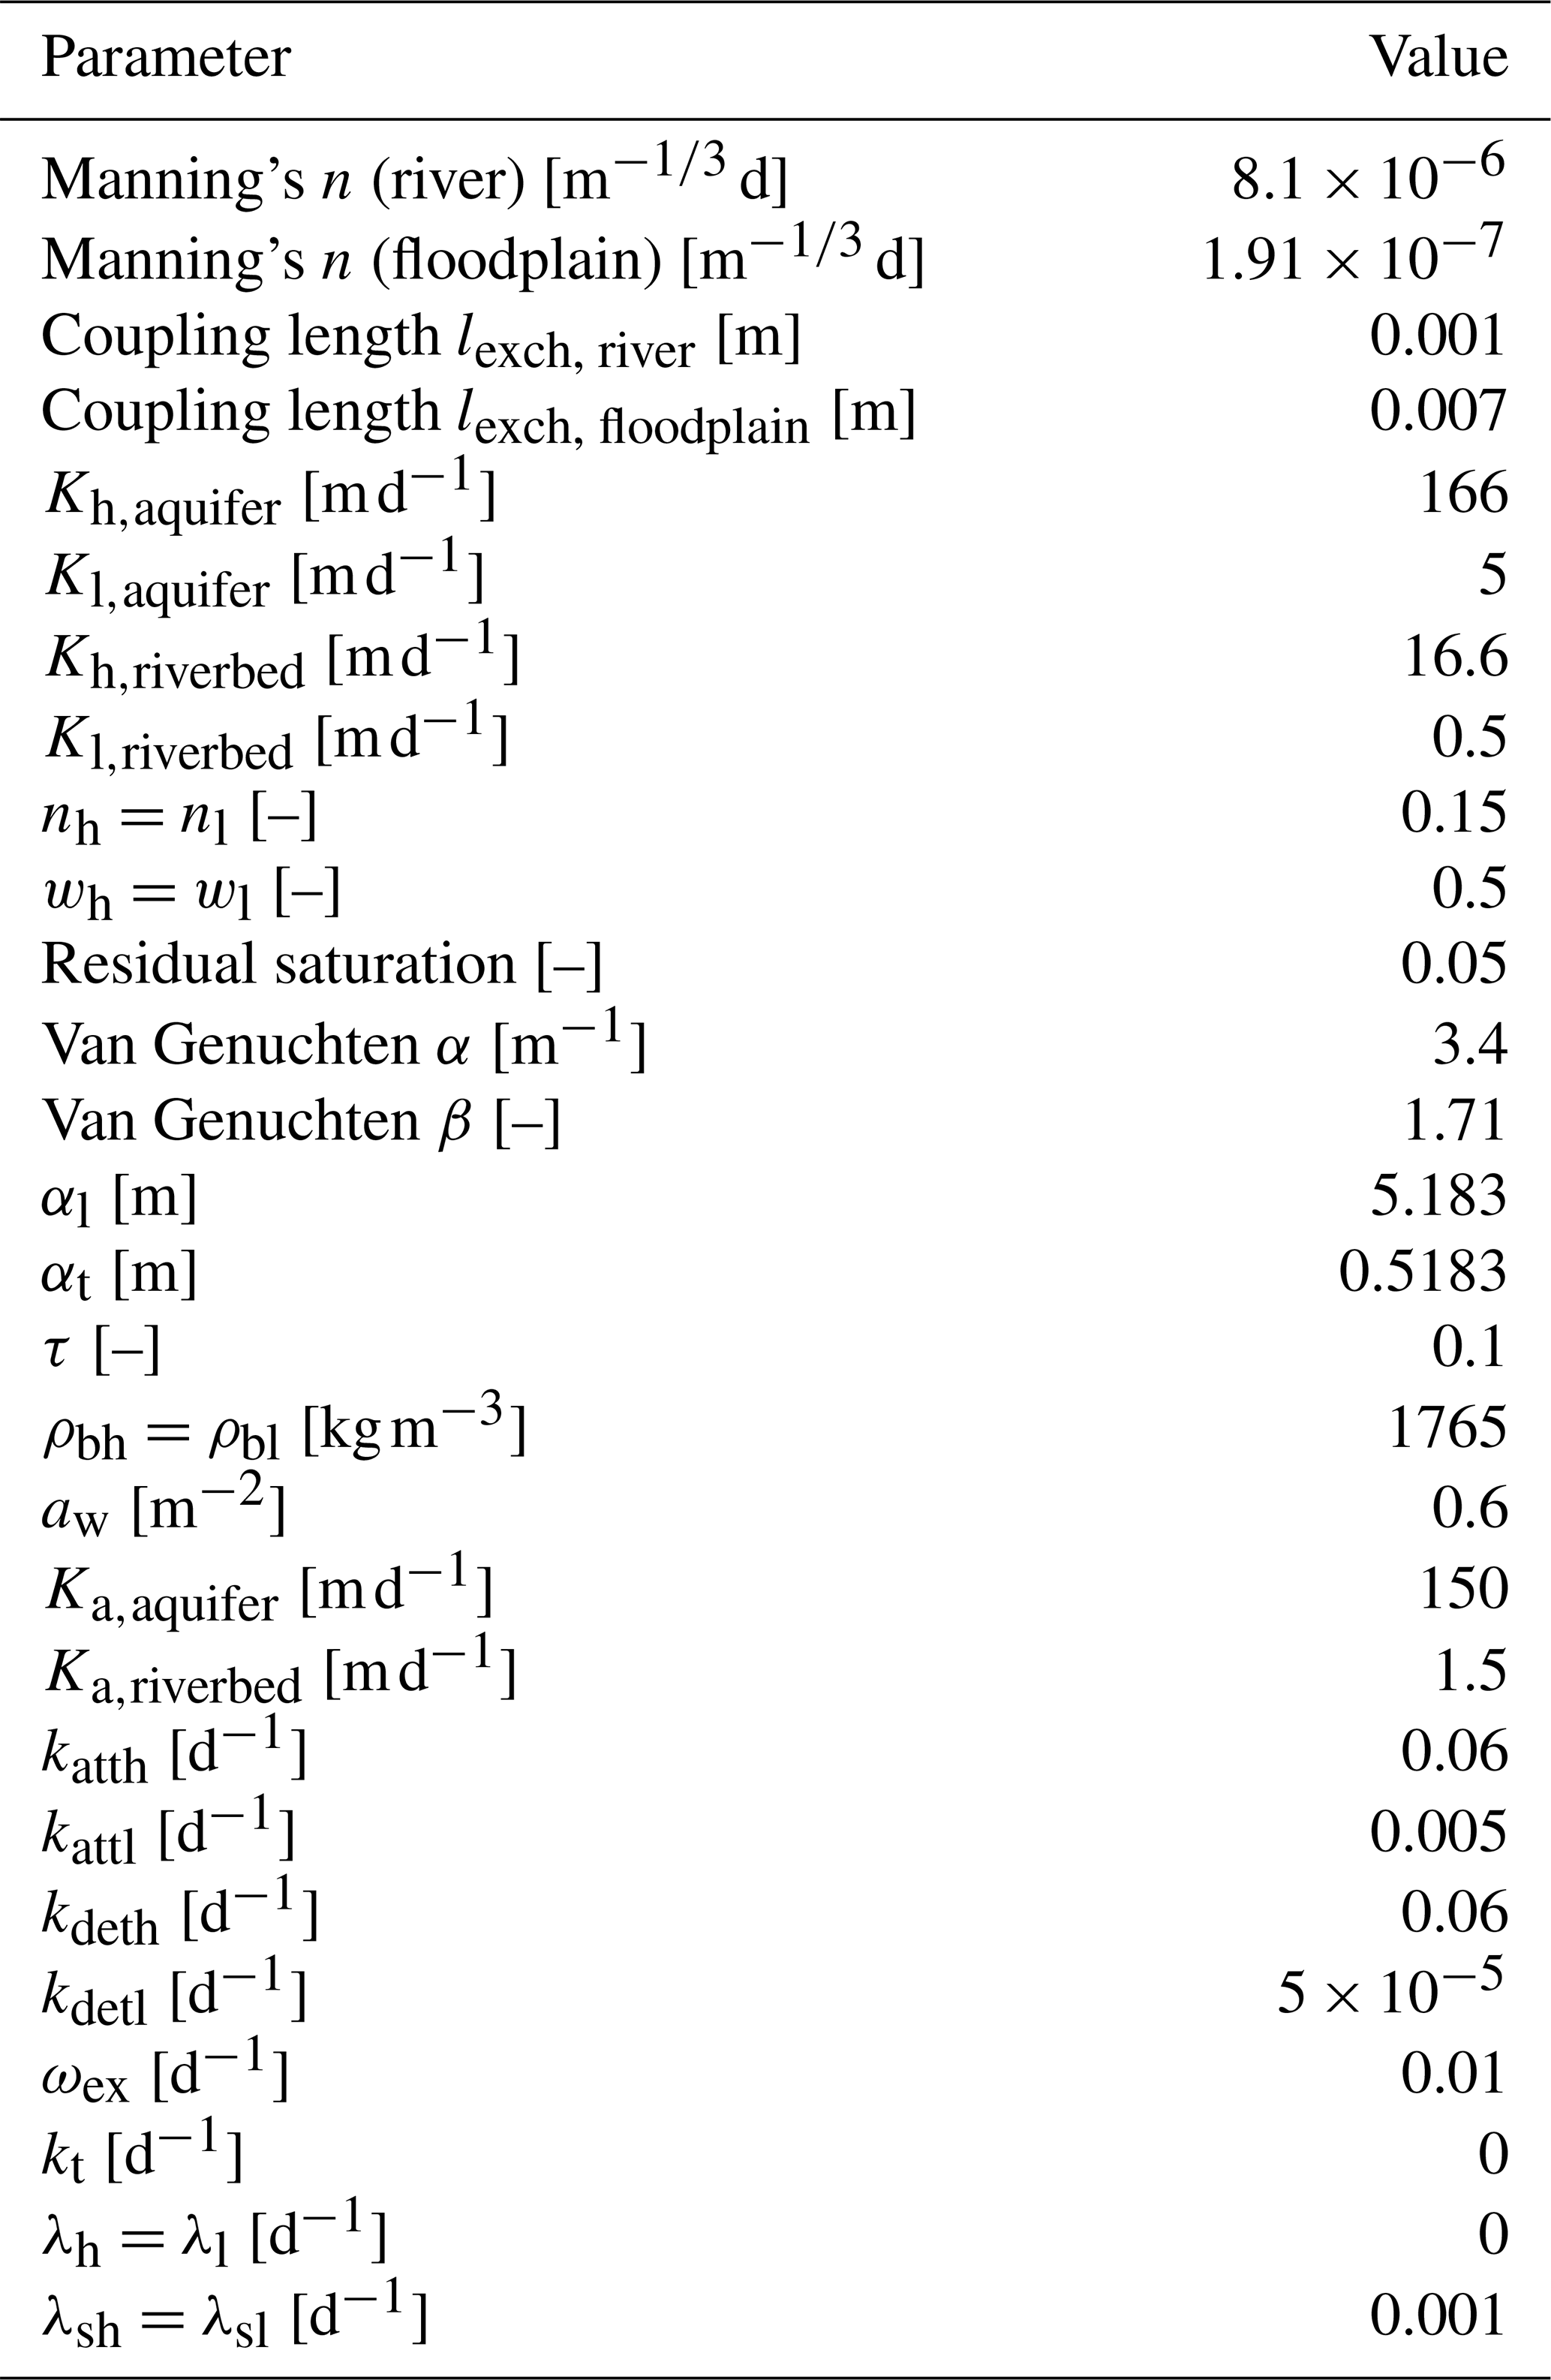
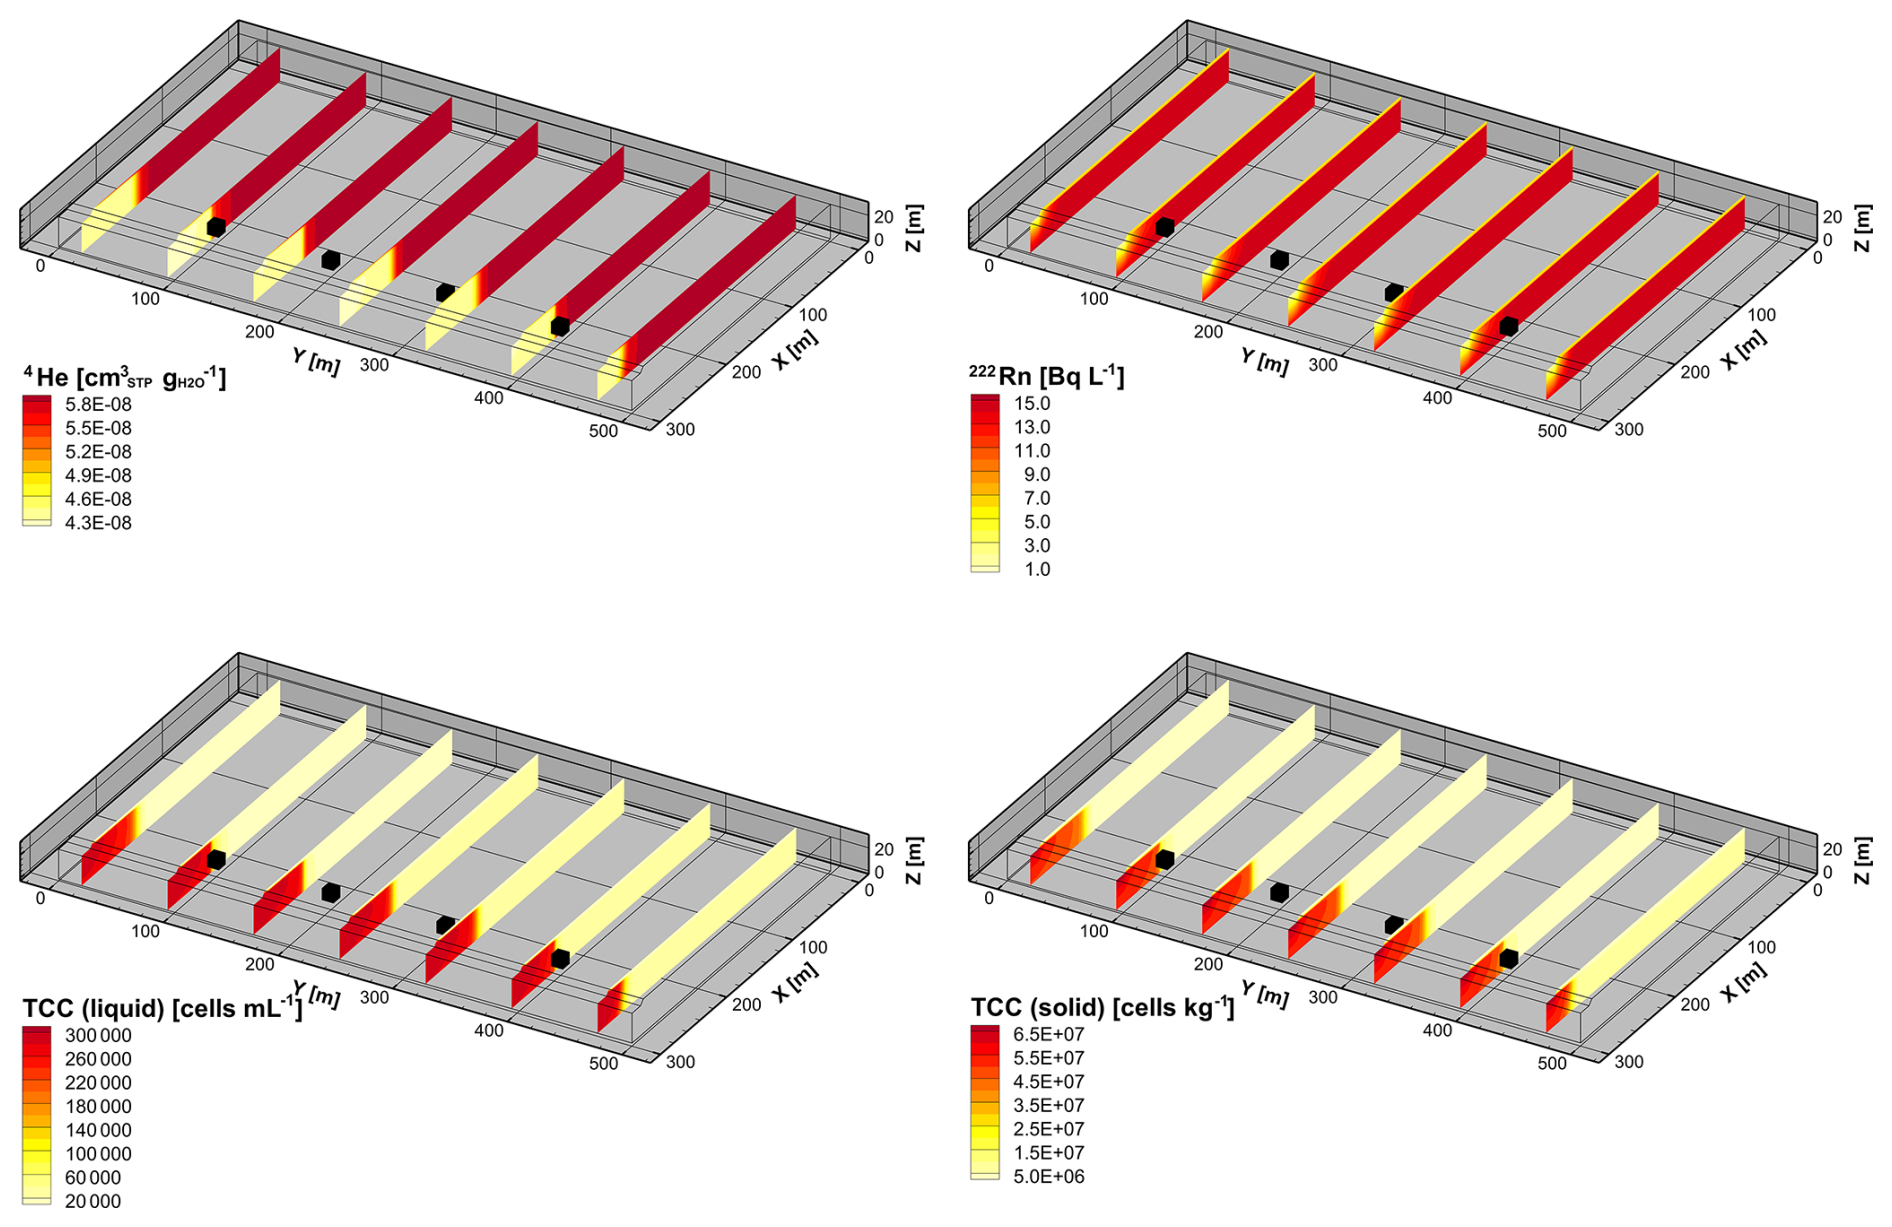
Figure 6Simulated steady-state concentrations of 4He, 222Rn, and TCC (liquid phase and solid phase) in the subsurface before the arrival of the flood wave.
A model spin-up of 10 000 d with constant BC was performed. The relatively long model spin-up was necessary to reach steady-state conditions for both liquid- and solid-phase concentrations. The initial hydraulic head and concentration distributions are illustrated in Figs. 5 and 6 and represent steady-state and low-flow conditions.
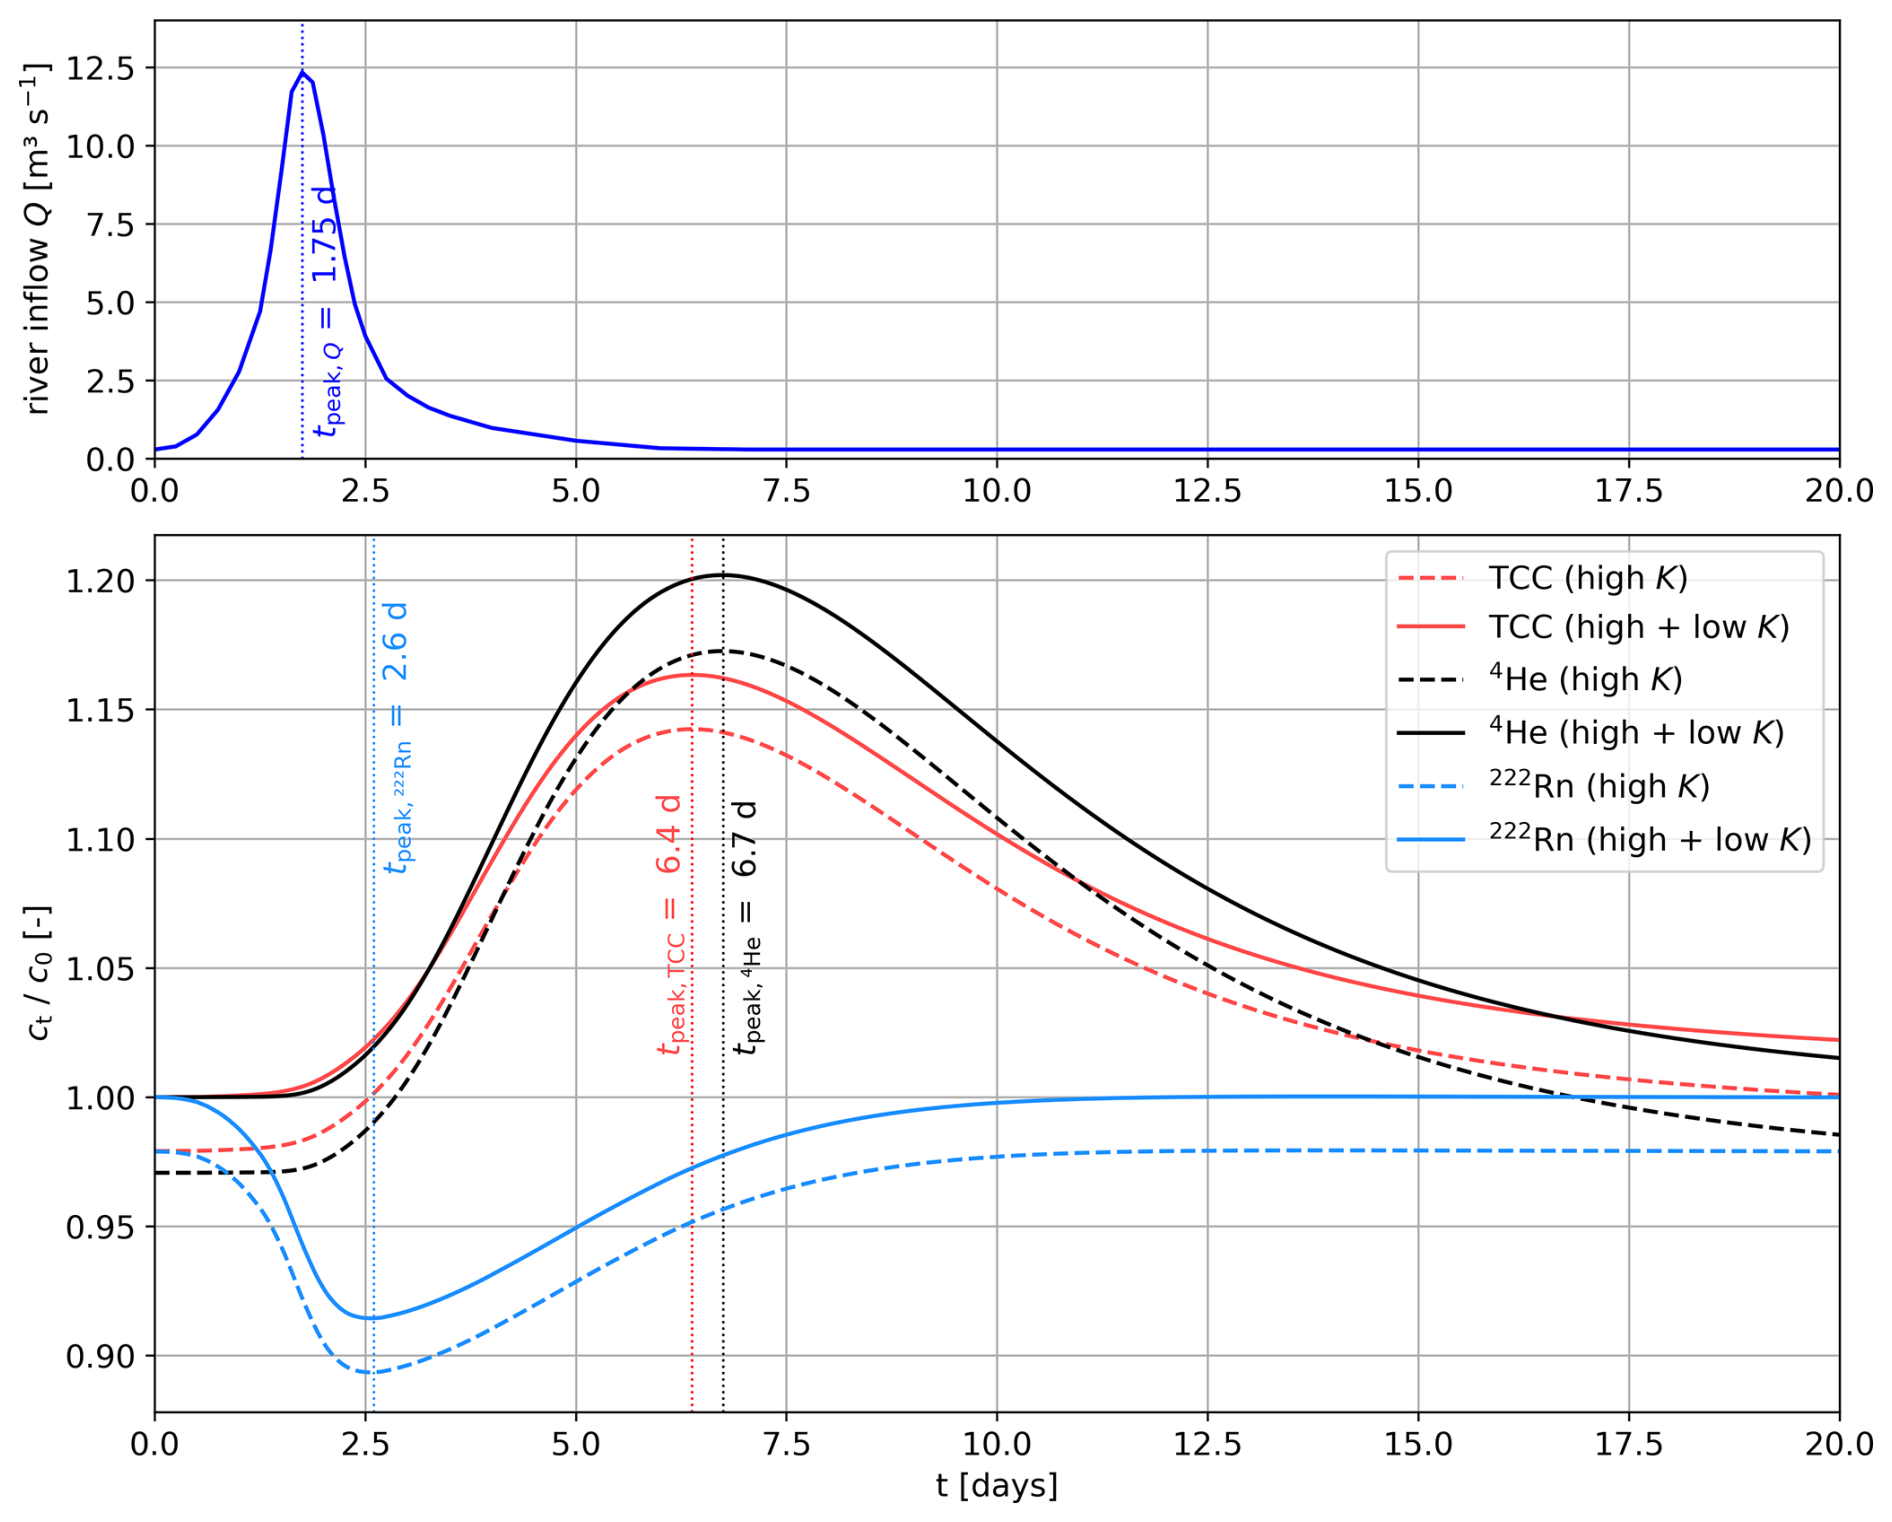
Figure 7River discharge during the 20 d flood event and simulated concentrations of TCC (liquid), 4He, and 222Rn (all normalized by the initial concentrations c0) in the high- and low-permeability regions at the observation point x = 275 m, y = 250 m.
Over a simulation period of 20 d, a discharge event, peaking at 1.75 d and with a maximum inflow rate of 12.3 m3 s−1, is simulated. The time-varying-flux BC is illustrated in Fig. 7. Microbial concentrations in river water generally rise during flood events (Ferguson et al., 2003). Therefore, the TCC concentration of the inflowing river water increases proportionally to the discharge up to double the initial TCC concentration (600 000 cells mL−1 during the maximum inflow rate at a simulation time of 1.75 d). As a comparison for the reactive microbial transport, an equivalent peak of the conservative tracer 4He is simulated (8.6 × 10⁻⁸ during the discharge peak), mimicking an artificial gas injection tracer test, as, for example, conducted by Blanc et al. (2024).
4.2.2 Results
The initial total flux concentrations of the situation prior to the arrival of the flood are illustrated in Fig. 6. The distribution of the conservative mixing tracer 4He indicates that, between river and abstraction wells, the groundwater consists of 100 % river water that infiltrated within the model domain. On the side of the wells facing away from the river, however, regional groundwater dominates. The 222Rn activity concentration increases gradually from the river to the abstraction wells, showing increasing residence times of the freshly infiltrated river water in the aquifer. At the abstraction wells, the 222Rn activity is already close to the steady-state equilibrium. The highest microbial cell counts in the liquid phase and attached to the solid phase occur within the 0.5 m thick riverbed. With increasing travel distance in the subsurface, the liquid-phase cell concentration decreases significantly due to straining, attachment, and inactivation of the microbes. At the abstraction wells, the total cell count is 20 % lower than in the river water. Due to the decreasing TCC in the liquid phase and inactivation of microbes on the grain surfaces, the total solid-phase concentration of the microbes also decreases with distance to the river.
The simulated total concentration time series in the liquid phase during the flood event at the near-river observation point are depicted in Fig. 7. For comparison, the TCC, 4He, and 222Rn concentrations are normalized by their initial concentrations.
During the flood event, the TCC and 4He concentrations in the inflowing river water increased proportionally to the discharge up to twice the inflow concentrations, causing a clear breakthrough at the piezometer of both TCC and 4He. The maximum concentration occurs 4.65 d (TCC) or 4.95 d (4He) after the discharge peak in the river. Due to size exclusion, microbial transport predominantly occurs in the high-permeability pore space, resulting in the microbial peak arriving 0.3 d before the one of the (conservatively treated) solute tracer 4He. Due to attachment and inactivation of the microbes, the concentration peak of the normalized TCC is smaller than the one of the conservative 4He. The longer tailing of the microbial peak compared to 4He is caused by initial attachment followed by a slow detachment (i.e., release) of microbes from the solid phase back into the liquid phase. The temporary decrease in the 222Rn activity indicates that, in reaction to the flood, the groundwater at the observation point became younger. As opposed to the microbial and 4He breakthrough curves, which reflect reactive advective–dispersive solute and colloid transport from the river to the piezometer, the change in the 222Rn activity at the piezometer can be attributed to a shifting flow pattern. The maximum variation in the 222Rn activity therefore occurs nearly immediately after the increase in discharge in the river – hence, 4 d before the breakthrough of the microbes and 4He.
In summary, the illustrative simulations demonstrate the suitability of the dual-permeability, two-site kinetic deposition flow and transport formulation in HGS to co-simulate reactive microbial and solute transport at the wellfield scale. The simulated concentrations show faster transport of microbes due to size exclusion compared to the slower bulk transport of solutes like 4He, which is a known phenomenon. The combined impact of attachment, detachment, and inactivation processes on the microbial concentration could, in turn, be pointed out by comparing the shape of the microbial breakthrough curve to the one of the conservatively transported 4He. Moreover, the parallel simulation of 222Rn production and decay in the dual-permeability subsurface allowed us to include a natural tracer for the characterization of residence times of freshly infiltrated river water in bank filtration contexts. Ultimately, the illustrative example demonstrates the potential of the newly developed tool to simulate the simultaneous transport of multiple different environmental tracers and microbes in an integrated surface–subsurface hydrological model.
Having implemented and verified the dual-permeability approach with two-site kinetic deposition mode, HydroGeoSphere is the first ISSHM that is able to simulate water flow, heat, and reactive solute and colloid transport in parallel and throughout the surface and subsurface domains.
Transforming the subsurface into a dual-permeability system doubles the number of subsurface nodes, which makes the simulation computationally more expensive. Currently, the increased computational demand might still limit the application of the tool to wellfield-, reach-, and small-catchment-scale studies. However, computational power increases continuously and rapidly, and cloud computing, which is, commercially, now widely accessible and highly scalable, reduces simulation times significantly (Kurtz et al., 2017).
The dual-permeability, two-site kinetic deposition implementation is highly flexible for reactive solute and microbial transport, but it also requires defining additional flow and transport parameters. Such a complex model inevitably requires multiple and diverse types of observations, most importantly multi-tracer data, in order to allow for a robust calibration of the different parameters, which is necessary for any surface water–groundwater or larger-scale groundwater model (Schilling et al., 2019). In contrast to the original development of the dual-permeability model describing anomalous flow and transport in fractured rocks with distinct head and flow differences between the two domains (Gerke and Van Genuchten, 1993), the application of the dual-permeability approach for microbial transport in a porous-media subsurface shows minimal head differences between the two regions. Consequently, concentration data need to inform us about the fractions of the two regions and the ratio of the two hydraulic conductivities. This means that concentration data of conservative solutes and colloids, namely microbes, undergoing size exclusion in the low-permeability, small-pore region are required. The specific combination of environmental gas and microbial data – as, for example, presented in the illustrative riverbank filtration example – is a particularly promising data set to calibrate such models. Environmental (noble) gases can be analysed continuously in situ (Brennwald et al., 2016), and they have been shown to improve ISSHM calibration significantly (Schilling et al., 2022, 2017). In addition, online flow cytometry (FCM) now allows us to monitor microbial dynamics in riverbank filtration settings on site, continuously, and in near-real time (Besmer et al., 2016). Beyond direct cell counting, microbial clusters can be distinguished, such as high- (HNA) and low-nucleic-acid-content (LNA) microbes, which are often referred to as larger and smaller procaryotes and are a typically observed cytometric pattern in aquatic systems (Wang et al., 2009). As the developed tool enables us to co-simulate the transport of environmental gases and reactive microbes, the ISSHM can be calibrated against both types of tracer data simultaneously, and the identifiability of model parameters, as well as the data worth of each tracer type with regard to reducing the uncertainty of model parameters and model predictions, can be evaluated. This combination will be of huge relevance for the identification of the transport mechanisms of pathogens in riverbank filtration settings and in the subsurface in general and will enable more targeted field campaigns for the robust delineation of WHPA.
The microbial diversity in the aquatic environment is enormous. For simplicity and for the purpose of illustration of the capability of the developed model, we represented the entire microbial community in the illustrative riverbank filtration example by the total cell count. While, for the study of microbial processes, this reduction in complexity is certainly an oversimplification, the colloid transport formulation in HGS enables multispecies transport. This capability could thus be harnessed to subdivide the microbial community into the typical flow-cytometry derived HNA and LNA groups or to simulate the transport behaviour of specific waterborne pathogens, for example. The downside of increasing the number of microbial groups is the increasing computational requirements. Hence, the type of microbes or microbial groups to be simulated should be chosen wisely. On the other hand, the more the different microbial clusters or groups are discriminated, the more information may be derived about attachment, detachment, and inactivation rates from a well-calibrated model and, thus, the more filtration efficiency of the subsurface for specific microbial groups can be quantified.
The development of this integrated hydrological–microbial simulation tool is an important step towards improving our understanding of microbial transport processes in riverbank filtration settings and quantifying them. Beyond this, it can become a valuable tool for drinking-water management, e.g., to design WHPA and to evaluate the risk of drinking-water contamination by pathogens under environmental stress factors such as extreme weather situations, flood events, or revitalization of rivers.
The dual-permeability model with two-site kinetic deposition mode for the simulation of reactive microbial transport in river–groundwater systems was implemented in the ISSHM HydroGeoSphere (available from revision no. 2699 onwards). The model formulation allows us to simulate preferential microbial transport in the high-permeability subsurface region and slower solute bulk transport in both the high- and low-permeability regions in parallel under consideration of both surface and subsurface fluxes in a fully integrated manner. The implementation was verified successfully against an analytical solution for modified colloid transport in dual-permeability media. As demonstrated by the illustrative examples, the method is well suited to studying microbial transport across the river–aquifer interface and to co-simulating reactive microbial transport in riverbank filtration settings combined with environmental gas tracer transport. With the development of this tool, it is now possible to calibrate an ISSHM against online microbial and environmental gas monitoring data and, by these means, to quantify the transport and removal processes of microbes in the subsurface, which is crucial to improve drinking-water management at riverbank filtration sites and to protect drinking water against contamination of pathogens. The new model might prove to become an important decision support tool for real-time operational wellfield management.
All model input files required to run the verification and illustrative examples are available for download from HydroShare under https://doi.org/10.4211/hs.84911fe3496f44eebbce512a6e8d0db3 (Currle et al., 2025). To run the models, HydroGeoSphere revision no. 2699 (or onwards) and a valid licence are necessary. A trial version of HydroGeoSphere can be obtained from https://www.aquanty.com (last access: 6 August 2025).
FC: conceptualization, methodology, validation, investigation, visualization, writing (original draft, review and editing). RT: software, validation, writing (review and editing). OSS: conceptualization, methodology, validation, investigation, writing (review and editing), supervision, project administration, funding acquisition.
The contact author has declared that none of the authors has any competing interests.
Publisher's note: Copernicus Publications remains neutral with regard to jurisdictional claims made in the text, published maps, institutional affiliations, or any other geographical representation in this paper. While Copernicus Publications makes every effort to include appropriate place names, the final responsibility lies with the authors. Views expressed in the text are those of the authors and do not necessarily reflect the views of the publisher.
The authors thank the editor Heng Dai and the three anonymous reviewers for their helpful feedback, which has contributed to improving the manuscript.
This research has been supported by the Schweizerischer Nationalfonds zur Förderung der Wissenschaftlichen Forschung (SNSF grant no. 214048) and the Sentinelle Nord (Internship Scholarship Program for International Students).
This paper was edited by Heng Dai and reviewed by three anonymous referees.
Abdul, A. S.: Experimental and numerical studies of the effect of the capillary fringe on streamflow generation, PhD thesis, University of Waterloo, Waterloo, Ontario, Canada, 1985.
Aeschbach-Hertig, W. and Solomon, D. K.: Noble Gas Thermometry in Groundwater Hydrology, in: The Noble Gases as Geochemical Tracers, edited by: Burnard, P., Springer Berlin Heidelberg, Berlin, Heidelberg, https://doi.org/10.1007/978-3-642-28836-4_5, 81–122, 2013.
Aquanty Inc.: HydroGeoSphere Theory Manual, HGS version 2674, Aquanty Inc., Waterloo, Ontario, Canada, 2024.
Beisman, J. J., Maxwell, R. M., Navarre-Sitchler, A. K., Steefel, C. I., and Molins, S.: ParCrunchFlow: an efficient, parallel reactive transport simulation tool for physically and chemically heterogeneous saturated subsurface environments, Computational Geosciences, 19, 403–422, https://doi.org/10.1007/s10596-015-9475-x, 2015.
Besmer, M. D., Epting, J., Page, R. M., Sigrist, J. A., Huggenberger, P., and Hammes, F.: Online flow cytometry reveals microbial dynamics influenced by concurrent natural and operational events in groundwater used for drinking water treatment, Scientific Reports, 6, 38462, https://doi.org/10.1038/srep38462, 2016.
Beyerle, U., Aeschbach-Hertig, W., Hofer, M., Imboden, D. M., Baur, H., and Kipfer, R.: Infiltration of river water to a shallow aquifer investigated with e, noble gases and CFCs, J. Hydrol., 220, 169–185, https://doi.org/10.1016/S0022-1694(99)00069-4, 1999.
Bixio, A., Gambolati, G., Paniconi, C., Putti, M., Shestopalov, V., Bublias, V., Bohuslavsky, A., Kasteltseva, N., and Rudenko, Y.: Modeling groundwater-surface water interactions including effects of morphogenetic depressions in the Chernobyl exclusion zone, Environmental Geology, 42, 162–177, https://doi.org/10.1007/s00254-001-0486-7, 2002.
Blanc, T., Peel, M., Brennwald, M. S., Kipfer, R., and Brunner, P.: Efficient injection of gas tracers into rivers: A tool to study Surface water–Groundwater interactions, Water Res., 254, 121375, https://doi.org/10.1016/j.watres.2024.121375, 2024.
Blanford, W. J., Brusseau, M. L., Jim Yeh, T. C., Gerba, C. P., and Harvey, R.: Influence of water chemistry and travel distance on bacteriophage PRD-1 transport in a sandy aquifer, Water Res., 39, 2345–2357, https://doi.org/10.1016/j.watres.2005.04.009, 2005.
Bradford, S. A. and Harvey, R. W.: Future research needs involving pathogens in groundwater, Hydrogeology Journal, 25, 931, https://doi.org/10.1007/s10040-016-1501-0, 2017.
Bradford, S. A., Simunek, J., Bettahar, M., van Genuchten, M. T., and Yates, S. R.: Modeling Colloid Attachment, Straining, and Exclusion in Saturated Porous Media, Environ. Sci. Technol., 37, 2242–2250, https://doi.org/10.1021/es025899u, 2003.
Bradford, S. A., Torkzaban, S., Leij, F., Šimùnek, J., and van Genuchten, M. T.: Modeling the coupled effects of pore space geometry and velocity on colloid transport and retention, Water Resour. Res., 45, https://doi.org/10.1029/2008WR007096, 2009.
Bradford, S. A., Wang, Y., Kim, H., Torkzaban, S., and Šimùnek, J.: Modeling Microorganism Transport and Survival in the Subsurface, Journal of Environmental Quality, 43, 421–440, https://doi.org/10.2134/jeq2013.05.0212, 2014.
Bradford, S. A., Leij, F. J., Schijven, J., and Torkzaban, S.: Critical Role of Preferential Flow in Field-Scale Pathogen Transport and Retention, Vadose Zone Journal, 16, 1–13, https://doi.org/10.2136/vzj2016.12.0127, 2017.
Brand, P. and Wülser, R.: Online-Messung mikrobiolgischer Parameter – Überwachung von Fluss und Grundwasser mittels online-Analyseverfahren, Aqua & Gas, 6, 22–28, 2018.
Brennwald, M. S., Schmidt, M., Oser, J., and Kipfer, R.: A Portable and Autonomous Mass Spectrometric System for On-Site Environmental Gas Analysis, Environ. Sci. Technol., 50, 13455–13463, https://doi.org/10.1021/acs.est.6b03669, 2016.
Brooks, L. E. and Field, K. G.: Bayesian meta-analysis to synthesize decay rate constant estimates for common fecal indicator bacteria, Water Res., 104, 262–271, https://doi.org/10.1016/j.watres.2016.08.005, 2016.
Brunner, P. and Simmons, C. T.: HydroGeoSphere: A Fully Integrated, Physically Based Hydrological Model, Groundwater, 50, https://doi.org/10.1111/j.1745-6584.2011.00882.x, 2012.
Brunner, P., Therrien, R., Renard, P., Simmons, C. T., and Franssen, H.-J. H.: Advances in understanding river-groundwater interactions, Rev. Geophys., 55, 818–854, https://doi.org/10.1002/2017RG000556, 2017.
Camporese, M., Paniconi, C., Putti, M., and Orlandini, S.: Surface-subsurface flow modeling with path-based runoff routing, boundary condition-based coupling, and assimilation of multisource observation data, Water Resour. Res., 46, https://doi.org/10.1029/2008WR007536, 2010.
Cecil, L. D. and Green, J. R.: Radon-222, in: Environmental Tracers in Subsurface Hydrology, edited by: Cook, P. G. and Herczeg, A. L., Springer, Boston, MA, https://doi.org/10.1007/978-1-4615-4557-6_6, 175–194, 2000.
Cook, P. and Herczeg, A.: Environmental Tracers in Subsurface Hydrology, Springer, 529 pp., https://doi.org/10.1007/978-1-4615-4557-6, 2000.
Currle, F., Therrien, R., and Schilling, O. S.: Supporting Information datasets for article: “Explicit simulation of reactive microbial transport with a dual-permeability, two-site kinetic deposition formulation using the integrated surface-subsurface hydrological model HydroGeoSphere”, HydroShare [data set], https://doi.org/10.4211/hs.84911fe3496f44eebbce512a6e8d0db3, 2025.
Dann, R., Close, M., Flintoft, M., Hector, R., Barlow, H., Thomas, S., and Francis, G.: Characterization and Estimation of Hydraulic Properties in an Alluvial Gravel Vadose Zone, Vadose Zone Journal, 8, 651–663, https://doi.org/10.2136/vzj2008.0174, 2009.
De Maet, T., Cornaton, F., and Hanert, E.: A scalable coupled surface–subsurface flow model, Computers & Fluids, 116, 74–87, https://doi.org/10.1016/j.compfluid.2015.03.028, 2015.
Delottier, H., Peel, M., Musy, S., Schilling, O. S., Purtschert, R., and Brunner, P.: Explicit simulation of environmental gas tracers with integrated surface and subsurface hydrological models, Frontiers in Water, 4, https://doi.org/10.3389/frwa.2022.980030, 2022.
Delottier, H., Doherty, J., and Brunner, P.: Data space inversion for efficient uncertainty quantification using an integrated surface and sub-surface hydrologic model, Geosci. Model Dev., 16, 4213–4231, https://doi.org/10.5194/gmd-16-4213-2023, 2023.
Delottier, H., Schilling, O. S., and Therrien, R.: Assessing the impact of surface water and groundwater interactions for regional-scale simulations of water table elevation, J. Hydrol., 639, 131641, https://doi.org/10.1016/j.jhydrol.2024.131641, 2024.
Derx, J., Blaschke, A. P., Farnleitner, A. H., Pang, L., Blöschl, G., and Schijven, J. F.: Effects of fluctuations in river water level on virus removal by bank filtration and aquifer passage — A scenario analysis, Journal of Contaminant Hydrology, 147, 34–44, https://doi.org/10.1016/j.jconhyd.2013.01.001, 2013.
Dong, H., Onstott, T. C., DeFlaun, M. F., Fuller, M. E., Scheibe, T. D., Streger, S. H., Rothmel, R. K., and Mailloux, B. J.: Relative Dominance of Physical versus Chemical Effects on the Transport of Adhesion-Deficient Bacteria in Intact Cores from South Oyster, Virginia, Environ. Sci. Technol., 36, 891–900, https://doi.org/10.1021/es010144t, 2002.
Ferguson, C., Husman, A. M. d. R., Altavilla, N., Deere, D., and Ashbolt, N.: Fate and Transport of Surface Water Pathogens in Watersheds, Critical Reviews in Environmental Science and Technology, 33, 299–361, https://doi.org/10.1080/10643380390814497, 2003.
Flynn, R. M., Hacini, Y., Schnegg, P.-A., Costa, R., and Diomande, K. A.: Use of Tracer Tests and Geophysical Logging to Understand Solute and Micro-organism Tracer Responses in Monitoring Wells with Long Screen Intervals in a Gravel Aquifer, Beitraege zur Hydrogeologie, 55, 5–20, 2006.
Gerke, H. H. and van Genuchten, M. T.: A dual-porosity model for simulating the preferential movement of water and solutes in structured porous media, Water Resour. Res., 29, 305–319, https://doi.org/10.1029/92WR02339, 1993.
Gutiérrez-Jurado, K. Y., Partington, D., Batelaan, O., Cook, P., and Shanafield, M.: What Triggers Streamflow for Intermittent Rivers and Ephemeral Streams in Low-Gradient Catchments in Mediterranean Climates, Water Resour. Res., 55, 9926–9946, https://doi.org/10.1029/2019WR025041, 2019.
Hoehn, E. and Von Gunten, H. R.: Radon in groundwater: A tool to assess infiltration from surface waters to aquifers, Water Resour. Res., 25, 1795–1803, https://doi.org/10.1029/WR025i008p01795, 1989.
Hollender, J., Rothardt, J., Radny, D., Loos, M., Epting, J., Huggenberger, P., Borer, P., and Singer, H.: Comprehensive micropollutant screening using LC-HRMS/MS at three riverbank filtration sites to assess natural attenuation and potential implications for human health, Water Research X, 1, 100007, https://doi.org/10.1016/j.wroa.2018.100007, 2018.
Hornstra, L. M., Schijven, J. F., Waade, A., Prat, G. S., Smits, F. J. C., Cirkel, G., Stuyfzand, P. J., and Medema, G. J.: Transport of bacteriophage MS2 and PRD1 in saturated dune sand under suboxic conditions, Water Res., 139, 158–167, https://doi.org/10.1016/j.watres.2018.03.054, 2018.
Hunt, R. J. and Johnson, W. P.: Pathogen transport in groundwater systems: contrasts with traditional solute transport, Hydrogeology Journal, 25, 921–930, https://doi.org/10.1007/s10040-016-1502-z, 2017.
HydroAlgorithmics Pty Ltd.: AlgoMesh2 User Guide [code], HydroAlgorithmics Pty Ltd, 2020.
Jones, J. P., Sudicky, E. A., Brookfield, A. E., and Park, Y. J.: An assessment of the tracer-based approach to quantifying groundwater contributions to streamflow, Water Resour. Res., 42, https://doi.org/10.1029/2005WR004130, 2006.
Kipfer, R., Aeschbach-Hertig, W., Peeters, F., and Stute, M.: Noble Gases in Lakes and Ground Waters, Reviews in Mineralogy and Geochemistry, 47, 615–700, https://doi.org/10.2138/rmg.2002.47.14, 2002.
Kirchner, J. W.: A double paradox in catchment hydrology and geochemistry, Hydrol. Process., 17, 871–874, https://doi.org/10.1002/hyp.5108, 2003.
Knabe, D., Guadagnini, A., Riva, M., and Engelhardt, I.: Uncertainty Analysis and Identification of Key Parameters Controlling Bacteria Transport Within a Riverbank Filtration Scenario, Water Resour. Res., 57, e2020WR027911, https://doi.org/10.1029/2020WR027911, 2021.
Kollet, S., Sulis, M., Maxwell, R. M., Paniconi, C., Putti, M., Bertoldi, G., Coon, E. T., Cordano, E., Endrizzi, S., Kikinzon, E., Mouche, E., Mügler, C., Park, Y.-J., Refsgaard, J. C., Stisen, S., and Sudicky, E.: The integrated hydrologic model intercomparison project, IH-MIP2: A second set of benchmark results to diagnose integrated hydrology and feedbacks, Water Resour. Res., 53, 867–890, https://doi.org/10.1002/2016WR019191, 2017.
Kötzsch, S. and Sinreich, M.: Zellzahlen zum Grundwasser: Bestimmung mittels Durchflusszytometrie: Wasserqualität, Aqua & Gas, 94, 14–21, 2014.
Kurtz, W., Lapin, A., Schilling, O. S., Tang, Q., Schiller, E., Braun, T., Hunkeler, D., Vereecken, H., Sudicky, E., Kropf, P., Hendricks Franssen, H.-J., and Brunner, P.: Integrating hydrological modelling, data assimilation and cloud computing for real-time management of water resources, Environ. Model. Software, 93, 418–435, https://doi.org/10.1016/j.envsoft.2017.03.011, 2017.
Kvitsand, H. M. L., Ilyas, A., and Østerhus, S. W.: Rapid bacteriophage MS2 transport in an oxic sandy aquifer in cold climate: Field experiments and modeling, Water Resour. Res., 51, 9725–9745, https://doi.org/10.1002/2015WR017863, 2015.
Leij, F. J. and Bradford, S. A.: Colloid transport in dual-permeability media, Journal of Contaminant Hydrology, 150, 65–76, https://doi.org/10.1016/j.jconhyd.2013.03.010, 2013.
Li, X., Scheibe, T. D., and Johnson, W. P.: Apparent Decreases in Colloid Deposition Rate Coefficients with Distance of Transport under Unfavorable Deposition Conditions: A General Phenomenon, Environ. Sci. Technol., 38, 5616–5625, https://doi.org/10.1021/es049154v, 2004.
Li, X., Zhang, P., Lin, C. L., and Johnson, W. P.: Role of Hydrodynamic Drag on Microsphere Deposition and Re-entrainment in Porous Media under Unfavorable Conditions, Environ. Sci. Technol., 39, 4012–4020, https://doi.org/10.1021/es048814t, 2005.
Loveland, J. P., Ryan, J. N., Amy, G. L., and Harvey, R. W.: The reversibility of virus attachment to mineral surfaces, Colloids Surf. Physicochem. Eng. Aspects, 107, 205–221, https://doi.org/10.1016/0927-7757(95)03373-4, 1996.
Mattle, N., Kinzelbach, W., Beyerle, U., Huggenberger, P., and Loosli, H. H.: Exploring an aquifer system by integrating hydraulic, hydrogeologic and environmental tracer data in a three-dimensional hydrodynamic transport model, J. Hydrol., 242, 183–196, https://doi.org/10.1016/S0022-1694(00)00394-2, 2001.
Maxwell, R. M., Putti, M., Meyerhoff, S., Delfs, J.-O., Ferguson, I. M., Ivanov, V., Kim, J., Kolditz, O., Kollet, S. J., Kumar, M., Lopez, S., Niu, J., Paniconi, C., Park, Y.-J., Phanikumar, M. S., Shen, C., Sudicky, E. A., and Sulis, M.: Surface-subsurface model intercomparison: A first set of benchmark results to diagnose integrated hydrology and feedbacks, Water Resour. Res., 50, 1531–1549, https://doi.org/10.1002/2013WR013725, 2014.
Maxwell, R. M., Kollet, S. J., Concon, L. E., Smith, S. G., Woodward, C. S., Falgout, R. D., Ferguson, I. M., Engdahl, N., Hokkanen, J., Artavanis, G., West, B., Yang, C., Hector, B., Gilbert, J., Bearup, L., Jefferson, J., Baldwin, C., Bosl, W. J., Hornung, R., Ashby, S., and Kulkarni, K. B.: ParFlow Documentation, International Ground Water Modeling Center Report GWMI, Integrated GroundWater Modeling Center, 2024.
Molnar, I. L., Johnson, W. P., Gerhard, J. I., Willson, C. S., and O'Carroll, D. M.: Predicting colloid transport through saturated porous media: A critical review, Water Resour. Res., 51, 6804–6845, https://doi.org/10.1002/2015WR017318, 2015.
Molson, J. W. and Frind, E. O.: On the use of mean groundwater age, life expectancy and capture probability for defining aquifer vulnerability and time-of-travel zones for source water protection, Journal of Contaminant Hydrology, 127, 76–87, https://doi.org/10.1016/j.jconhyd.2011.06.001, 2012.
Oudega, T. J., Lindner, G., Derx, J., Farnleitner, A. H., Sommer, R., Blaschke, A. P., and Stevenson, M. E.: Upscaling Transport of Bacillus subtilis Endospores and Coliphage phiX174 in Heterogeneous Porous Media from the Column to the Field Scale, Environ. Sci. Technol., 55, 11060–11069, https://doi.org/10.1021/acs.est.1c01892, 2021.
Paradis, D., Martel, R., Karanta, G., Lefebvre, R., Michaud, Y., Therrien, R., and Nastev, M.: Comparative Study of Methods for WHPA Delineation, Groundwater, 45, 158–167, https://doi.org/10.1111/j.1745-6584.2006.00271.x, 2007.
Partington, D., Brunner, P., Simmons, C. T., Therrien, R., Werner, A. D., Dandy, G. C., and Maier, H. R.: A hydraulic mixing-cell method to quantify the groundwater component of streamflow within spatially distributed fully integrated surface water–groundwater flow models, Environ. Model. Software, 26, 886–898, https://doi.org/10.1016/j.envsoft.2011.02.007, 2011.
Partington, D., Therrien, R., Simmons, C. T., and Brunner, P.: Blueprint for a coupled model of sedimentology, hydrology, and hydrogeology in streambeds, Rev. Geophys., 55, 287–309, https://doi.org/10.1002/2016RG000530, 2017.
Peel, M., Kipfer, R., Hunkeler, D., and Brunner, P.: Variable 222Rn emanation rates in an alluvial aquifer: Limits on using 222Rn as a tracer of surface water–groundwater interactions, Chemical Geology, 599, 120829, https://doi.org/10.1016/j.chemgeo.2022.120829, 2022.
Peel, M., Delottier, H., Kipfer, R., Hunkeler, D., and Brunner, P.: Exploring the reliability of 222Rn as a tracer of groundwater age in alluvial aquifers: Insights from the explicit simulation of variable 222Rn production, Water Res., 235, 119880, https://doi.org/10.1016/j.watres.2023.119880, 2023.
Popp, A. L., Pardo-Álvarez, Á., Schilling, O. S., Scheidegger, A., Musy, S., Peel, M., Brunner, P., Purtschert, R., Hunkeler, D., and Kipfer, R.: A Framework for Untangling Transient Groundwater Mixing and Travel Times, Water Resour. Res., 57, e2020WR028362, https://doi.org/10.1029/2020WR028362, 2021.
Ray, C.: Riverbank Filtration: Understanding Contaminant Biogeochemistry and Pathogen Removal, Springer, https://doi.org/10.1007/978-94-010-0479-4, 2002.
Ryan, J. N., Elimelech, M., Ard, R. A., Harvey, R. W., and Johnson, P. R.: Bacteriophage PRD1 and Silica Colloid Transport and Recovery in an Iron Oxide-Coated Sand Aquifer, Environ. Sci. Technol., 33, 63–73, https://doi.org/10.1021/es980350+, 1999.
Sasidharan, S.: Fate, transport and retention of viruses, bacteria and nanoparticles in saturated porous media, Thesis submitted for the degree of PhD, Flinders University of South Australia, Adelaide, Australia, 2016.
Sasidharan, S., Bradford, S. A., Šimùnek, J., and Torkzaban, S.: Minimizing Virus Transport in Porous Media by Optimizing Solid Phase Inactivation, Journal of Environmental Quality, 47, 1058–1067, https://doi.org/10.2134/jeq2018.01.0027, 2018.
Schijven, J. F. and Hassanizadeh, S. M.: Removal of Viruses by Soil Passage: Overview of Modeling, Processes, and Parameters, Critical Reviews in Environmental Science and Technology, 30, 49–127, https://doi.org/10.1080/10643380091184174, 2000.
Schijven, J. F. and Šimùnek, J.: Kinetic modeling of virus transport at the field scale, Journal of Contaminant Hydrology, 55, 113–135, https://doi.org/10.1016/S0169-7722(01)00188-7, 2002.
Schijven, J. F., Medema, G., Vogelaar, A. J., and Hassanizadeh, S. M.: Removal of microorganisms by deep well injection, Journal of Contaminant Hydrology, 44, 301–327, https://doi.org/10.1016/S0169-7722(00)00098-X, 2000.
Schilling, O. S., Gerber, C., Partington, D. J., Purtschert, R., Brennwald, M. S., Kipfer, R., Hunkeler, D., and Brunner, P.: Advancing Physically-Based Flow Simulations of Alluvial Systems Through Atmospheric Noble Gases and the Novel 37Ar Tracer Method, Water Resour. Res., 53, 10465–10490, https://doi.org/10.1002/2017WR020754, 2017.
Schilling, O. S., Cook, P. G., and Brunner, P.: Beyond Classical Observations in Hydrogeology: The Advantages of Including Exchange Flux, Temperature, Tracer Concentration, Residence Time, and Soil Moisture Observations in Groundwater Model Calibration, Rev. Geophys., 57, 146–182, https://doi.org/10.1029/2018RG000619, 2019.
Schilling, O. S., Cook, P. G., Grierson, P. F., Dogramaci, S., and Simmons, C. T.: Controls on Interactions Between Surface Water, Groundwater, and Riverine Vegetation Along Intermittent Rivers and Ephemeral Streams in Arid Regions, Water Resour. Res., 57, e2020WR028429, https://doi.org/10.1029/2020WR028429, 2021.
Schilling, O. S., Partington, D. J., Doherty, J., Kipfer, R., Hunkeler, D., and Brunner, P.: Buried Paleo-Channel Detection With a Groundwater Model, Tracer-Based Observations, and Spatially Varying, Preferred Anisotropy Pilot Point Calibration, Geophys. Res. Lett., 49, e2022GL098944, https://doi.org/10.1029/2022GL098944, 2022.
Šimùnek, J. and van Genuchten, M. T.: Modeling Nonequilibrium Flow and Transport Processes Using HYDRUS, Vadose Zone Journal, 7, 782–797, https://doi.org/10.2136/vzj2007.0074, 2008.
Šimùnek, J., Jacques, D., Langergraber, G., Bradford, S., Šejna, M., and Van Genuchten, M.: Numerical Modeling of Contaminant Transport Using HYDRUS and its Specialized Modules, Journal of the Indian Institute of Science, 92, 265–284, 2013.
Šimùnek, J., van Genuchten, M. T., and Šejna, M.: Recent Developments and Applications of the HYDRUS Computer Software Packages, Vadose Zone Journal, 15, vzj2016.2004.0033, https://doi.org/10.2136/vzj2016.04.0033, 2016.
Tang, Q., Kurtz, W., Schilling, O. S., Brunner, P., Vereecken, H., and Hendricks Franssen, H. J.: The influence of riverbed heterogeneity patterns on river-aquifer exchange fluxes under different connection regimes, J. Hydrol., 554, 383–396, https://doi.org/10.1016/j.jhydrol.2017.09.031, 2017.
Tang, Q., Delottier, H., Kurtz, W., Nerger, L., Schilling, O. S., and Brunner, P.: HGS-PDAF (version 1.0): a modular data assimilation framework for an integrated surface and subsurface hydrological model, Geosci. Model Dev., 17, 3559–3578, https://doi.org/10.5194/gmd-17-3559-2024, 2024.
Therrien, R. and Sudicky, E. A.: Three-dimensional analysis of variably-saturated flow and solute transport in discretely-fractured porous media, Journal of Contaminant Hydrology, 23, 1–44, https://doi.org/10.1016/0169-7722(95)00088-7, 1996.
Thomas, N. W., Arenas, A. A., Schilling, K. E., and Weber, L. J.: Numerical investigation of the spatial scale and time dependency of tile drainage contribution to stream flow, J. Hydrol., 538, 651–666, https://doi.org/10.1016/j.jhydrol.2016.04.055, 2016.
Tufenkji, N.: Modeling microbial transport in porous media: Traditional approaches and recent developments, Adv. Water Resour., 30, 1455–1469, https://doi.org/10.1016/j.advwatres.2006.05.014, 2007.
Tufenkji, N. and Elimelech, M.: Deviation from the Classical Colloid Filtration Theory in the Presence of Repulsive DLVO Interactions, Langmuir, 20, 10818–10828, https://doi.org/10.1021/la0486638, 2004.
Tufenkji, N. and Elimelech, M.: Breakdown of Colloid Filtration Theory: Role of the Secondary Energy Minimum and Surface Charge Heterogeneities, Langmuir, 21, 841–852, https://doi.org/10.1021/la048102g, 2005.
Tufenkji, N., Ryan, J. N., and Elimelech, M.: The promise of bank filtration, Environ. Sci. Technol., 36, 422a–428a, https://doi.org/10.1021/es022441j, 2002.
Vogt, T., Hoehn, E., Schneider, P., Freund, A., Schirmer, M., and Cirpka, O. A.: Fluctuations of electrical conductivity as a natural tracer for bank filtration in a losing stream, Adv. Water Resour., 33, 1296–1308, https://doi.org/10.1016/j.advwatres.2010.02.007, 2010.
Wang, Y., Hammes, F., Boon, N., Chami, M., and Egli, T.: Isolation and characterization of low nucleic acid (LNA)-content bacteria, ISME J., 3, 889–902, https://doi.org/10.1038/ismej.2009.46, 2009.
Weill, S., Mouche, E., and Patin, J.: A generalized Richards equation for surface/subsurface flow modelling, J. Hydrol., 366, 9–20, https://doi.org/10.1016/j.jhydrol.2008.12.007, 2009.
Weiss, W. J., Bouwer, E. J., Aboytes, R., LeChevallier, M. W., O'Melia, C. R., Le, B. T., and Schwab, K. J.: Riverbank filtration for control of microorganisms: Results from field monitoring, Water Res., 39, 1990–2001, https://doi.org/10.1016/j.watres.2005.03.018, 2005.
Yao, K.-M., Habibian, M. T., and O'Melia, C. R.: Water and waste water filtration. Concepts and applications, Environ. Sci. Technol., 5, 1105–1112, 1971.
Zhang, P., Johnson, W. P., Scheibe, T. D., Choi, K. H., Dobbs, F. C., and Mailloux, B. J.: Extended tailing of bacteria following breakthrough at the Narrow Channel Focus Area, Oyster, Virginia, Water Resour. Res., 37, 2687–2698, https://doi.org/10.1029/2000WR000151, 2001.
Zhang, W., Li, S., Wang, S., Lei, L., Yu, X., and Ma, T.: Transport of Escherichia coli phage through saturated porous media considering managed aquifer recharge, Environmental Science and Pollution Research, 25, 6497–6513, https://doi.org/10.1007/s11356-017-0876-3, 2018.