the Creative Commons Attribution 4.0 License.
the Creative Commons Attribution 4.0 License.
Technical note: A fast and reproducible autosampler for direct vapor equilibration isotope measurements
Jonas Pyschik
Stefan Seeger
Barbara Herbstritt
Markus Weiler
To investigate water movement in environmental systems, stable isotope (2H and 18O) ratios of water are commonly used tracers. Analyzing the isotopic ratios of water in or adsorbed to substances like soil or plant tissue necessitates the extraction or equilibration of water prior to analysis. One such method, direct vapor equilibration, is popular due to its cost-effectiveness and straightforward sample processing. However, sample analysis requires significant manual labor, thereby limiting the number of samples that can be analyzed. This limitation is compounded by the fact that stored samples undergo evaporative isotopic changes over time. Moreover, manual measurements require many laborious procedural steps that can easily compromise reproducibility. The operator has to subjectively decide if the measurements are stable and then record the analyzer readings. To address these challenges, we have developed a system that automates the analysis process. Our autosampler for vapor samples, named VapAuSa, features a modular design that allows for up to 350 ports for direct vapor equilibration samples. These ports sequentially connect the prepared samples to a laser isotope analyzer, enabling continuous automated measurements. Within the accompanying software, measurement criteria can be specified, facilitating reproducible analysis. The developed system was tested by co-measuring 90 soil samples and 21 liquid water samples with known δ values. VapAuSa measurements have a negligible measurement bias ( ‰ for both δ2H and δ18O) and similar measurement repeatability compared to manual analysis of identical samples ( ‰ and 0.58 ‰ for VapAuSa measurements vs. ‰ and ‰ for manual analysis). However, the increased sample throughput minimizes storage-induced isotopic changes. Moreover, VapAuSa triples sample throughput per week while also reducing the direct labor time to just 10 % of that required for manual processing.
- Article
(7969 KB) - Full-text XML
-
Supplement
(306 KB) - BibTeX
- EndNote
Stable water isotopes (δ18O and δ2H) have found widespread application as tracers in Earth and environmental system sciences. They are applied to elucidate the storage and redistribution processes of water in various hydrological and hydrogeological compartments. In soils, stable water isotope analysis has revealed different flow process along hillslopes, like lateral flow, preferential flow and mixing (Garvelmann et al., 2012; Thomas et al., 2013; Peralta-Tapia et al., 2015). They have also been used to estimate soil properties by inversely modeling soil water isotope profiles and have been found to better represent the soil properties compared with traditional pedotransfer functions (Sprenger et al., 2016). In addition, the tracking of vertical infiltration using soil isotope profiles has allowed for the quantification of groundwater recharge rates (Filippini et al., 2015; Chesnaux and Stumpp, 2018; Boumaiza et al., 2020). Analyzing the ratios of stable water isotopes in groundwater has revealed hydrogeological differences and solute transport mechanisms (Hendry and Wassenaar, 2009; Hendry et al., 2011a; Hendry and Wassenaar, 2011; Stumpp and Hendry, 2012). Moreover, the use of stable water isotopes in plants has shed light on plant water uptake, water transit times and water partitioning, thereby providing valuable insights into which sources of water plants utilize for various purposes (Bertrand et al., 2014; Smith et al., 2020; Kuhlemann et al., 2021).
To measure the stable water isotope ratios of water bound to substances or tissues, such as soil, sediment or plant material, an extraction or equilibration to vapor is needed. One such method is direct vapor equilibration laser spectroscopy (DVE-LS) (Wassenaar et al., 2008). In DVE-LS, the water vapor of a sample is measured and recalculated to its liquid isotope ratios using calibration standards. The process works as follows:
-
The sample (e.g., soil or plant) is placed in an inflatable, sealable and gas-diffusion-tight bag (Pratt et al., 2016). Many different bag materials have been used, but most are insufficient due to diffusive losses. These losses can be minimized with aluminum-laminated bags (Gralher et al., 2021). Regarding the identical treatment of calibration standards (Werner and Brand, 2001), liquid water of known isotopic composition is also filled into identical bags.
-
The sample and calibration standard bags are inflated with dry air and sealed. Then, a silicone blot is added to each bag as a septum, which is needed for airtight measurements later.
-
Samples are then stored under constant climatic conditions (ideally in an air-conditioned room, where they are later analyzed) so that the liquid and gas phases within the bags can reach isotopic equilibrium (Wassenaar et al., 2008). The equilibration time varies between studies; however, for aluminum-laminated bags, 48 h is optimal for soil samples (Gralher et al., 2021).
-
After equilibration, the vapor in the bag's headspace is analyzed using off-axis integrated cavity output spectroscopy (OA-ICOS) or cavity ring-down spectroscopy (CRDS). To facilitate this analysis, a cannula connected to the analyzer's inlet port is inserted into the silicone septum of the bag. Maintaining thermal stability is critical during both equilibration and analysis, as the fractionation of stable water isotopes is highly temperature dependent.
-
After analysis, the measurements are normalized to the Vienna Standard Mean Ocean Water–Standard Light Antarctic Precipitation (VSMOW-SLAP) scale using the co-measured calibration standards (Craig, 1961; Pratt et al., 2016).
Advantages of DVE-LS compared with other extraction methods include low technical effort and minimal material requirements, making it a cost-effective option (Millar et al., 2018). Additionally, only a small sample volume is necessary, allowing for high-spatiotemporal-resolution sampling (Wassenaar et al., 2008; Garvelmann et al., 2012). Furthermore, minimal handling is required, reducing the risk of sample damage (Wassenaar et al., 2008). Due to these favorable attributes, DVE-LS finds application in various contexts. For instance, all findings presented in the references in the preceding text were obtained via the application of DVE-LS. The wide application of DVE-LS has led to numerous methodological improvements, most focused around container material, equilibration time (Gralher et al., 2021), the correction of variations in the carrier gases (Gralher et al., 2016, 2018) or co-extracted substances that interfere with the laser spectrometer analysis (Hendry et al., 2011b).
However, the method still lacks automation in the analysis process. Manual measurement of each sample is time-consuming, imposing limitations on high-number sampling, as sample storage can alter the isotopic values due to evaporation and diffusion (Gralher et al., 2021). Moreover, the current DVE-LS analysis routine lacks reproducibility. There is no standardization for analysis time and measurement stability criteria, leading to potential variations in results among different labs and operators analyzing the same sample (Millar et al., 2022; Ceperley et al., 2024). To address these challenges and enhance both the speed and objectivity of the analysis, we introduce our fully automated vapor sampler system, named VapAuSa. This innovative system enables high-throughput sample processing with significantly reduced manual labor, compared with the prevailing procedure.
This section provides a summary of the sampler design. More in-depth information, such as the list of materials, technical drawings, circuit diagram, the code and manuals necessary for building the VapAuSa, can be found in the Supplement and at https://gitlab.rz.uni-freiburg.de/hydrology/vapausa (last access: 22 January 2025).
2.1 Hardware
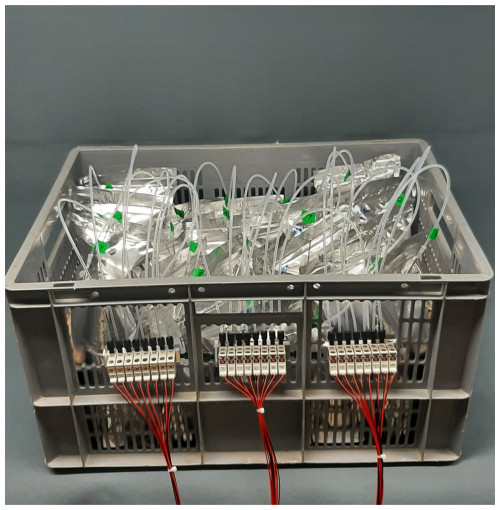
The VapAuSa features a modular design comprising stand-alone boxes holding the sample bags that can be combined into larger sample set-ups (Fig. 2). We have designed a circuit board that can be used to build either of these two configurations, depending on the electronic components installed (Fig. 3). Each box is equipped with 24 ports; of these, 23 are designated for sample bags, while 1 is reserved for flushing the system with ambient air to prevent moisture buildup and, thus, memory effects. The ports consist of valves (Model E3O10A-1W024, Clippard) that regulate vapor flow to the cavity of the ring-down isotope analyzer (in our case, a L2130-i, Picarro Inc.). The valves are attached to aluminum valve blocks, organized into groups of eight and interconnected by in. PTFE tubing (Fig. 1). The 23 sample bags are connected with cannulas (2.1 mm diameter × 80 mm length, Sterican, B. Braun) to the valves through in. PTFE tubing. The tubes are secured by superglue (LOCTITE 406 and 770, Henkel Adhesives) into the cannula and linked to the valve block via flangeless fittings (XP-301X, IDEX) (see Fig. 1). We experimented with using in. tubes and a gas-drying cartridge at the flushing valve, but this did not yield improved measurements.
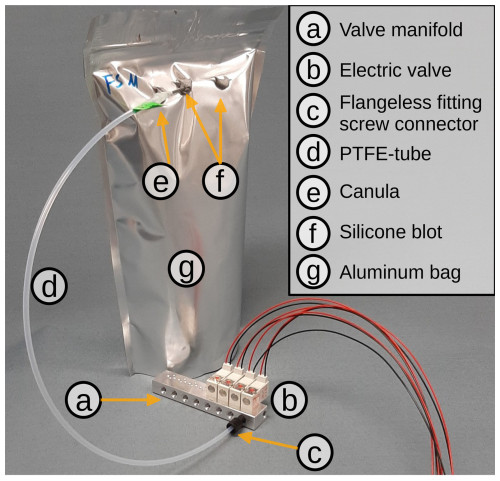
Figure 1Basic set-up of the VapAuSa: a cannula (e) is superglued onto a PTFE tube (d), which is connected to a valve manifold (a) via a flangeless fitting connector (XP-301X, IDEX) (c). In this example image, only four of the eight positions on the valve manifold are equipped with electric valves (E3O10A-1W024, Clippard) (b). The cannula is inserted into the aluminum-laminated bag (g) via a silicone blot (f), which acts as a seal after the bag has been pierced by the cannula.
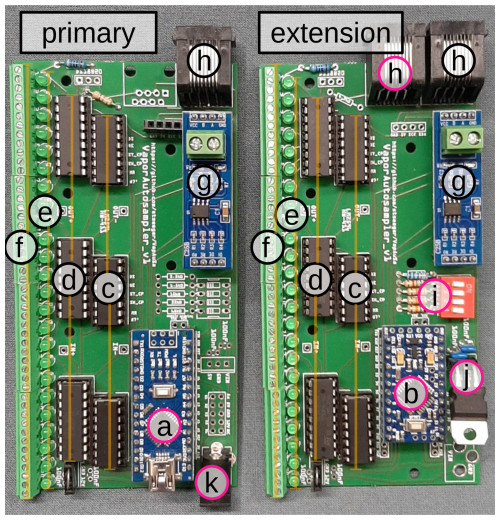
Figure 3The VapAuSa primary module (left panel) and an extension module (right panel). The two modules are based on identical circuit boards, but differences in equipped components (pink circles) lead to the two alternative kinds of modules used in the VapAuSa system. The letters in the figure refer to the following components: (a) Arduino Nano, (b) Arduino Pro Mini, (c) shift register, (d) ULN2803 transistor array, (e) status LEDs, (f) screw terminals, (g) RS485 MAX458 communication module, (h) ethernet port, (i) address selection DIP switch, (j) 5 V voltage regulator and (k) 12VDC power jack.
2.2 Circuit board, electronic components and firmware
The first box of each VapAuSa is controlled by the primary module, while all subsequent boxes are controlled by extension modules. We have designed a circuit board that can be used to build either of these two configurations, depending on the electronic components installed. The primary and extension modules share most parts but are equipped with different types of microcontrollers and connectors. This distinction arises because only the primary module can be directly connected to the power supply and to the Picarro. Each extension module is equipped with a dual in-line package (DIP) switch that can be used to assign a unique address between 1 and 16 (while the primary module is assigned address 0). In total, this allows for up to 17 boxes in one VapAuSa, which is then capable of accommodating 391 samples simultaneously. The primary module and all extension modules can be daisy-chained one after another, with communication among them facilitated by an RS485 bus system. The communication and power supply for all extensions are achieved using off-the-shelf ethernet cables. A detailed parts list for the required electronic components to equip the circuit boards, the circuit board schematics (created with https://doi.org/10.1145/1517664.1517735, Knörig et al., 2009), and the firmware for the microcontrollers of the primary board and the extensions can be found at https://gitlab.rz.uni-freiburg.de/hydrology/vapausa (last access: 22 January 2025).
2.3 Software
The software used for the VapAuSa is based on software that was developed for in situ stable water isotope sampling (Seeger and Weiler, 2021). It was designed to operate directly on a Piccaro stable water isotope analyzer (model L2120-i, L2130-i or L2140-i) and consists of a collection of modular Python 3 (Python Software Foundation, 2022) scripts whose purpose is to fulfill two main tasks:
- a.
Monitoring the measurements. By frequently reading out and parsing the instrument's log files, the software is aware of the currently measured values of sample gas volumetric vapor content (H2O), δ18O and δ2H (see (4) in Fig. 4). Through a configuration file, the user can define stability criteria, specifying trends and standard deviations of the mentioned measurement parameters over a user-defined time span ((5) in Fig. 4). This establishes an objective metric for the automated detection of stable plateaus during measurements. This module can operate independently and is potentially suitable for manual DVE-LS measurements, as it provides instant one-click summary statistics for user-selectable time spans. In contrast, the standard Picarro analyzer graphical user interface (GUI) often requires tedious zooming in and out to achieve the same purpose.
- b.
Controlling the valves and sampling. Using another configuration file, the user can assign custom names (sample IDs) to specific valve slots. Each valve slot is uniquely addressed by a combination of “boxID” and “slotID” (e.g.,
2#5addresses the fifth valve slot of the second extension box). The user has the flexibility to set a maximum sampling time for each valve and determine whether sampling may conclude before that time if all stability criteria are met. Additionally, the user can establish a custom sequence for all defined valve slots, enabling repeated measurements from specific slots (e.g., standards) within a single sequence. During an active sequence, each measurement phase is preceded by a flushing phase, during which the valve block of the currently active slot is flushed with ambient air until a defined H2O concentration (in parts per million in the analysis chamber) is undershot or a maximum flush time has been reached. Upon running the main script, a GUI visualizes the recent measurements ((4) in Fig. 4). This GUI also allows the user to manually open certain valves by clicking on the corresponding buttons ((1) in Fig. 4). The GUI automatically starts the predefined sequence ((3) in Fig. 4) and generates a log file that documents each valve switch and the reason why it occurred (timeout, fulfillment of all stability criteria or manual click). By combining the analyzer log file with the valve log file, it is possible to automatically aggregate and process the relevant parts of the analyzer's measurements. The software identifies a connected VapAuSa primary module by scanning all available serial COM ports and then sends the appropriatevalve boxID#slotIDcommands to the primary module (firmware described in Sect. 2.2) in response to user inputs or progression through the predefined sequence. An example call of thevalvecommand might bevalve 2#5, which means that the fifth valve of the second extension box should be opened. The receiving primary module would relay this command to all connected extensions. Subsequently, all boxes that are not the second extension would close all of their valves and the second extension would open its fifth valve.
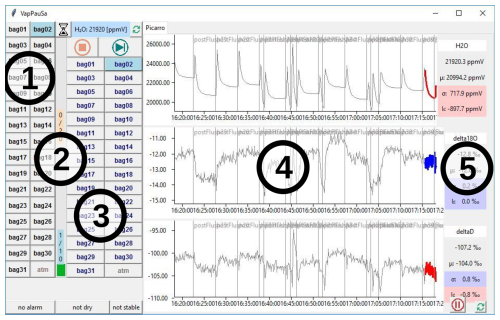
Figure 4A screenshot of the VapAuSa GUI showing the following: (1) buttons for all valves defined in the configuration file; (2) flush and measurement progress bars for the currently active valve; (3) buttons for the valve sequence; (4) recent measurement values for H2O, δ18O and δ2H; (5) fulfillment of stability criteria (red denotes not fulfilled and blue denotes fulfilled) for H2O, δ18O and δ2H.
3.1 Soil water test
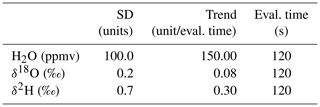
To evaluate the effectiveness of the VapAuSa for soil samples, we performed a comparative study involving both manual and autosampler measurements of identical soil-sampling bags. We drilled 11 soil cores to refusal depth using an electrical auger (HM1810, Makita), resulting in a total of 90 soil samples from different depths. These samples (two to four tablespoons) were then placed into aluminum-laminated plastic bags (CB400-420BRZ, 500 mL, WEBER Packaging GmbH) and initially sealed with a ziplock. Afterwards, the bags were inflated with dry air, heat-sealed, and equipped with two silicone blots to ensure that each measurement started with a “fresh” septum. The prepared bags were then stored in a climate-controlled analysis room maintained at 20 °C ± 1 °C for 48 h. All measurements were performed on cavity ring-down spectrometers (L2120-i and L2130-i, Picarro Inc.). The bags were punctured with a cannula and connected to the analyzers. Standards with known isotopic ratios were co-measured to calibrate the results. Additionally, the concentration of H2O in the analysis chamber was corrected to account for fractionation caused by temperature changes. To achieve this, a linear regression was performed between the H2O concentration (in parts per million) of the standards and the corresponding differences in isotope values. Using this regression, each measurement was adjusted to a standardized H2O concentration of 25 000 ppm, ensuring consistency across the data. To compare the measurement methods, 12 bags were measured manually first and then by the autosampler, whereas the remaining bags were measured by the autosampler first and then manually. The VapAuSa was programmed to activate valves for 10 min each, with 5 min of system flushing between samples. Stability criteria were defined as shown in Table 1; these criteria represent the threshold values after which the VapAuSa switches to the next sample. To assess the measurements, we calculated the difference for each bag by subtracting the calibrated δ values measured by VapAuSa from the calibrated δ values measured manually.
3.2 Liquid water test
As the real isotopic ratios of soil water are currently impossible to determine (Koeniger et al., 2011; Orlowski et al., 2013, 2016; Gaj et al., 2016), we assessed the measurement repeatability and bias of the VapAuSa by measuring different liquid DVE-LS samples. The test samples were created according to the protocol suggested by Wassenaar et al. (2008) and Gralher et al. (2021). Seven samples (10 mL each) of three isotopically distinct water sources were filled into 1 L aluminum-laminated plastic bags. Subsequently, we inflated the bags with dry air, heat-sealed them and equipped them with silicone septa. Then, the bags were placed in a climate-controlled room (20 °C ± 1 °C) for 48 h. Following this period, we randomly distributed the samples in the VapAuSa to minimize possible memory effects. To connect the bags to the isotope analyzer (cavity ring-down, L2130-i, Picarro Inc.), we inserted the cannulas into the septa, puncturing the bags and enabling vapor flow to the analyzer. The VapAuSa was programmed in an identical manner to the programming used for the soil water tests with the stability criteria shown in Table 1. To test a wide isotopic range, we selected water samples with three distinct compositions: relatively high δ values (seawater: ‰ and ‰), medium δ values (tap water of Freiburg: ‰ and 0.26 ‰) and low δ values (snowmelt water: ‰ and ‰). These reference isotope ratios were derived by measuring subsamples on a liquid isotope analyzer (L2130-i with an attached vaporizer unit A0211, Picarro Inc.) and are considered to be the samples' “true” values throughout the analysis. After the samples were analyzed on the VapAuSa, we calibrated the results to these liquid measurements.
To quantify the deviations of the VapAuSa measurements, the results (δ values from the VapAuSa) were subtracted from the respective liquid analyzer results (δ values from liquid). Measurement bias was then calculated as the mean deviation of all samples. We determined the measurement repeatability as 1 standard deviation (1σ) for each of the three water sample groups. We also assessed the VapAuSa's performance by comparing the measurement variability in 230 manual measurements from identical water sources. Here, we again calculated the deviations as the manual measurements (δ values from hand measurements) subtracted from the respective liquid analyzer results (δ values from liquid).
3.3 Results
3.3.1 Soil samples
The distribution of the soil water measurements showed good overall agreement. Both manual and automatic measurements had similar means and standard deviations, indicating consistent results. Additionally, both boxplots intercept zero, ruling out systematic measurement errors. This suggests that no bias is attributable to the VapAuSa (Fig. 5). Although the standard deviation is relatively high, it is similar across the measurements and suggests that the variance is likely due to the bags being measured twice, a theme that will later be discussed. Specifically, bags sampled first by the autosampler and then manually had a lower standard deviation (0.96 in δ18O and 6.25 in δ2H) compared with those that initially underwent manual measurement (1.44 in δ18O and 9.14 in δ2H). Additionally, the coefficient of determination varied depending on the initial measuring device: when the soil water was measured by hand first and then by the autosampler, the R2 for the evaluated linear relationship between the autosampler and hand measurements was low (0.31); however, if the autosampler measurements occurred first, the R2 increased to 0.71 (Fig. 6).
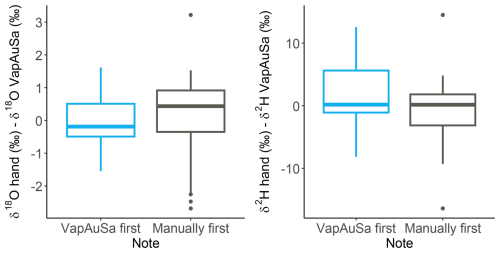
Figure 5Differences between samples measured manually and with the VapAuSa, depending on which measurement method was used first.
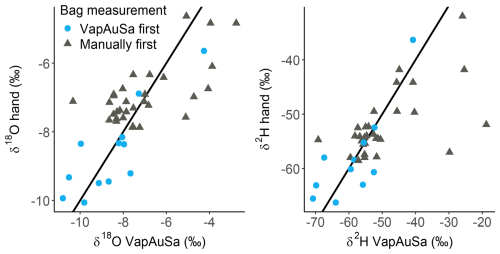
Figure 6Relation of VapAuSa soil water measurements to manual measurements. A total of 12 samples were measured by the autosampler first, whereas the rest underwent manual measurement first. The line represents a 1:1 relationship.
There is a clear divergence of the R2 from soil bags initially measured manually versus those initially measured with the autosampler. The soil samples that were measured first by the autosampler were often measured directly afterwards manually, whereas the samples that were first measured manually were placed in the autosampler and measured up to 6 h later (due to their positioning in the system). There is always a risk that the seal might not be tight once a bag is punctured and the cannula is pulled out, potentially leading to higher uncertainty for the bags initially measured by hand due to the extended time allowed for leakage through the pinched septum. As the uncertainties among bags initially measured manually and those initially measured by the autosampler are similar, this suggests that the largest uncertainty is induced by measuring the bags twice. If the measurement precision of the VapAuSa had decreased, this would have manifest as a consistent bias, either always increasing or decreasing the δ values.
3.3.2 Water samples
The measurement bias (mean difference between the VapAuSa measurement and the liquid value) was extremely low: ‰ for δ18O and ‰ for δ2H. Average repeatability across all samples was ±0.58 ‰ for δ18O and ±4 ‰ for δ2H. However, across the different water sources, the VapAuSa showed different repeatabilities. The largest repeatability range was measured for the low-δ-value water, with ±0.82 ‰ for δ18O and ±7.0 ‰ for δ2H. The instrument performed best for the isotopic range of the medium and high δ values, with similar deviations of around ±0.47 ‰ for δ18O and ±3.2 ‰ for δ2H (Fig. 7).
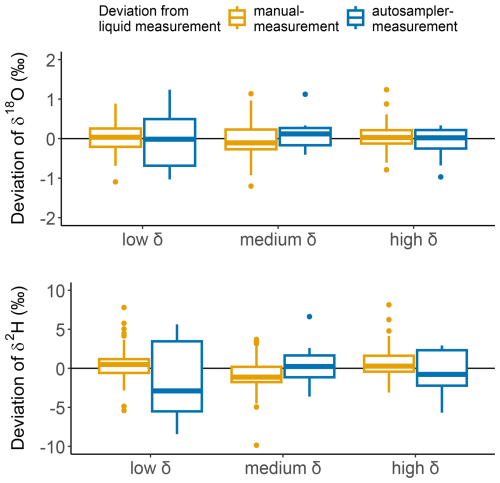
Figure 7Deviation of VapAuSa and manual measurements from liquid measurements of three water samples with different isotope ratios.
Also, 60 % of the measurements stabilized before the evaluation time threshold. While we programmed the VapAuSa to analyze each sample for 10 min, most measurements met the stability criteria (Table 1) within 8 min. This reduction in overall runtime from 5 to 4 h was observed across 21 sample measurements. The manual analysis showed a measurement repeatability (1σ) of ±0.37 ‰ for δ18O and ±5.7 ‰ for δ2H, being in a similar range as those of the VapAuSa (results are shown in Fig. 7). The increased uncertainty in the VapAuSa in the isotopically low range is also visible in the manual measurements. While the manual repeatability range is 50 % lower for δ18O than that of the VapAuSa, it is 130 % higher for δ2H.
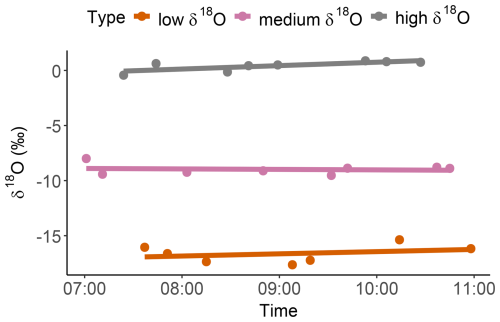
As observed with the twice-measured soil samples, pinched bags can alter their isotopic ratios. Therefore, it is crucial to evaluate the effect of the duration that a sample remains in the autosampler, from the time that it is placed and pinched by the cannula to the time of measurement. In the liquid water test, the time between pinching and measurement extended up to 4 h. When analyzing the drift over time, the slopes for each bag measurement varied (Fig. 8). The slopes of the water source with lower and higher δ values indicated an enrichment in heavier isotopes at rates of 0.31 ‰ h−1 and 0.20 ‰ h−1, respectively, while the medium-δ-value water source showed depletion at a rate of −0.04 ‰ h−1. The slope for the high δ value is the only one that is statistically significant at p<0.05, while the slopes of the medium- and low-δ water sources are not statistically significant. Therefore, no overall trend could be identified, suggesting that the drift is of minor importance to the measurement accuracy. However, this effect can always be analyzed and corrected for with the co-measured calibration standards.
4.1 Accuracy
Oven-dried soils spiked with water with known isotopic values are often used to examine extraction and equilibration performance (West et al., 2006; Wassenaar et al., 2008; Volkmann and Weiler, 2014). Accuracies reported for DVE-LS vary between 0.7 ‰–1.0 ‰ for δ2H and 0.2 ‰–0.3 ‰ for δ18O (Wassenaar et al., 2008; Volkmann and Weiler, 2014). However, the soil texture can alter the extracted isotopic compositions. While the δ values of extracted water from sandy soils are often close to the known isotope ratios, a high clay content changes the isotopic composition (Koeniger et al., 2011; Orlowski et al., 2013, 2016; Gaj et al., 2016). This clay-induced error depletes isotopic values in DVE-LS (Orlowski et al., 2016). As a true accuracy assessment using spiked soil samples is currently impossible, we chose to evaluate the usability of VapAuSa for soil samples by comparing hand and autosampler measurements of natural soil samples.
In order to exclude soils as a source of uncertainty in testing the VapAuSa system measurement accuracies (both measurement repeatability and bias), we chose a water-to-water equilibration of known liquid samples. This approach has not been previously applied to DVE-LS, making its classification challenging. However, water-to-water extraction has been assessed in the context of cryogenic vacuum distillation, which can serve as a benchmark. In such assessments, water-to-water extraction exhibited a measurement repeatability of 0.2 ‰ for δ18O and 0.8 ‰ for δ2H (Orlowski et al., 2016). In comparison, the DVE-LS autosampler and the manual measurements both demonstrated lower accuracy. However, the VapAuSa offers the advantages of higher sample throughput and reduced manual labor compared with the cryogenic method.
Because of the larger repeatability range, the applicability of the VapAuSa depends on the δ-value ranges of the water source ratio differences of interest. This issue has been previously discussed in the context of the uncertainty introduced by cryogenic extraction (Allen and Kirchner, 2022). The conclusion was that two sources can only be differentiated in a mixing model if the δ-value span between them is substantially larger than the uncertainty added by cryogenic extraction. This principle also applies to the VapAuSa. When the δ-value range of the end-members is small, another extraction method with lower uncertainties should be chosen. However, if the δ-value range is substantially larger than the repeatability uncertainty, VapAuSa is a good choice because it increases sample throughput.
4.2 Storage time
Sample storage leads to evaporation- and diffusion-induced isotopic drifts, which occur over time with every DVE-LS container material. Even aluminum-laminated bags sealed by their ziplock (as they would be during storage) have an isotopic drift of 0.042 ‰ d−1 for δ18O at room temperature (Gralher et al., 2021). To minimize these shifts, one should analyze the samples as quickly as possible and keep the samples cooled. Manual DVE-LS sample analysis is limited to about 180 samples per week. However, VapAuSa can analyze up to 120 samples per day, thus enabling up to 500 sample measurements per week. Relating the throughput to storage drifts, analyzing 400 DVE-LS samples (2 weeks of manual analysis vs. 3.5 d VapAuSa analysis) adds about 0.6 ‰ of storage-induced uncertainty to manual δ18O analysis; however, it only adds about 0.17 ‰ of storage-induced uncertainty to VapAuSa δ18O measurements. Therefore, with larger sample volumes, the measurement uncertainty in VapAuSa may be lower than manual analysis due to shorter storage times.
4.3 Reproducibility
By defining (and documenting!) stability criteria, measurements are less dependent on user-specific skills and preferences regarding the detection of a “stable” measurement. The subjective influence of the operator diminishes even further, as the system treats all samples equally, without fatigue after several hours of measurements. Moreover, the monitoring part of the VapAuSa GUI can be used separately and does not require any other hardware (in addition to the isotopic analyzer itself). We think that it might even help to improve manual DVE-LS measurements, as it provides instant one-click summary statistics for freely defined time spans. Meanwhile, the standard Picarro analyzer GUI requires tedious zooming in and out for that purpose. Furthermore, the ability to define objective stability criteria should also help to reduce the a subjective component of manual DVE-LS measurements.
4.4 Do not buy cheap
To gain the mentioned VapAuSa benefits, we want to stress the importance of using appropriate, vapor-resistant and vapor-impermeable materials. Even a tiny amount of ambient air continuously leaking into the system can cause major errors with water vapor analysis. Our first prototype was built using valves designed for liquids, with the connection between the valve and cannula only plugged into each other and secured with PARAFILM (PARAFILM® M). While this system was developed for a fraction of the cost of our current set-up, it eventually developed a leak. This led to ambient air mixing with the sample vapor, causing incorrect measurements. Therefore, it is important to use adequate materials like gas-rated valves and to secure all connections using either screw fittings or superglue. Only these measures can ensure reliable measurements.
The VapAuSa is a helpful system for all disciplines applying DVE-LS. While the VapAuSa comes with certain measurement uncertainties, its measurements are less prone to manual measurement errors, are less labor-intensive and have an increased throughput. In cases where the source δ-value range is larger than the VapAuSa uncertainty, the larger sample throughput can be a great benefit. To date, we have tested the system with liquid and soil samples only; however, investigating plant samples (which have an even shorter maximum storage time) would be an interesting next step. Generally we think the VapAuSa is a valuable addition to the tool sets of isotope geoscientists, enabling high-number sampling and high-number measurement, which are required to advance our understanding of environmental systems.
The data needed to reproduce the paper results are contained within the Supplement.
All of the scripts that compose the VapAuSa-GUI can be found at https://gitlab.rz.uni-freiburg.de/hydrology/vapausa (Seeger and Pyschik, 2024).
The supplement related to this article is available online at: https://doi.org/10.5194/hess-29-525-2025-supplement.
JP, StS and MW designed the experiment. StS developed the circuit boards and firmware for the autosampler as well as the VapAuSa software. JP conducted the experiments and the data analysis and wrote the first draft of the manuscript. BH analyzed the standard samples. StS, BH and MW contributed to writing the final manuscript.
At least one of the (co-)authors is a member of the editorial board of Hydrology and Earth System Sciences. The peer-review process was guided by an independent editor, and the authors also have no other competing interests to declare.
Publisher’s note: Copernicus Publications remains neutral with regard to jurisdictional claims made in the text, published maps, institutional affiliations, or any other geographical representation in this paper. While Copernicus Publications makes every effort to include appropriate place names, the final responsibility lies with the authors.
This research has been supported by the Deutsche Forschungsgemeinschaft (grant no. 453746323).
This open-access publication was funded by the University of Freiburg.
This paper was edited by Nunzio Romano and reviewed by four anonymous referees.
Allen, S. T. and Kirchner, J. W.: Potential Effects of Cryogenic Extraction Biases on Plant Water Source Partitioning Inferred from Xylem-water Isotope Ratios, Hydrol. Process., 36, e14483, https://doi.org/10.1002/hyp.14483, 2022. a
Bertrand, G., Masini, J., Goldscheider, N., Meeks, J., Lavastre, V., Celle-Jeanton, H., Gobat, J.-M., and Hunkeler, D.: Determination of Spatiotemporal Variability of Tree Water Uptake Using Stable Isotopes (δ18O, δ2H) in an Alluvial System Supplied by a High-Altitude Watershed, Pfyn Forest, Switzerland, Ecohydrology, 7, 319–333, https://doi.org/10.1002/eco.1347, 2014. a
Boumaiza, L., Chesnaux, R., Walter, J., and Stumpp, C.: Assessing Groundwater Recharge and Transpiration in a Humid Northern Region Dominated by Snowmelt Using Vadose-Zone Depth Profiles, Hydrogeol. J., 28, 2315–2329, https://doi.org/10.1007/s10040-020-02204-z, 2020. a
Ceperley, N., Gimeno, T. E., Jacobs, S. R., Beyer, M., Dubbert, M., Fischer, B., Geris, J., Holko, L., Kübert, A., Le Gall, S., Lehmann, M. M., Llorens, P., Millar, C., Penna, D., Prieto, I., Radolinski, J., Scandellari, F., Stockinger, M., Stumpp, C., Tetzlaff, D., Van Meerveld, I., Werner, C., Yildiz, O., Zuecco, G., Barbeta, A., Orlowski, N., and Rothfuss, Y.: Toward a Common Methodological Framework for the Sampling, Extraction, and Isotopic Analysis of Water in the Critical Zone to Study Vegetation Water Use, WIREs Water, 11, e1727, https://doi.org/10.1002/wat2.1727, 2024. a
Chesnaux, R. and Stumpp, C.: Advantages and Challenges of Using Soil Water Isotopes to Assess Groundwater Recharge Dominated by Snowmelt at a Field Study Located in Canada, Hydrolog. Sci. J., 63, 679–695, https://doi.org/10.1080/02626667.2018.1442577, 2018. a
Craig, H.: Isotopic Variations in Meteoric Waters, Science, 133, 1702–1703, https://doi.org/10.1126/science.133.3465.1702, 1961. a
Filippini, M., Stumpp, C., Nijenhuis, I., Richnow, H. H., and Gargini, A.: Evaluation of Aquifer Recharge and Vulnerability in an Alluvial Lowland Using Environmental Tracers, J. Hydrol., 529, 1657–1668, https://doi.org/10.1016/j.jhydrol.2015.07.055, 2015. a
Gaj, M., Kaufhold, S., Königer, P., Beyer, M., Weiler, M., and Himmelsbach, T.: Mineral Mediated Isotope Fractionation of Soil Water, Rapid Commun. Mass Spectrom., 31, 269–280, https://doi.org/10.1002/rcm.7787, 2016. a, b
Garvelmann, J., Külls, C., and Weiler, M.: A Porewater-Based Stable Isotope Approach for the Investigation of Subsurface Hydrological Processes, Hydrol. Earth Syst. Sci., 16, 631–640, https://doi.org/10.5194/hess-16-631-2012, 2012. a, b
Gralher, B., Herbstritt, B., Weiler, M., Wassenaar, L. I., and Stumpp, C.: Correcting Laser-Based Water Stable Isotope Readings Biased by Carrier Gas Changes, Environ. Sci. Technol., 50, 7074–7081, https://doi.org/10.1021/acs.est.6b01124, 2016. a
Gralher, B., Herbstritt, B., Weiler, M., Wassenaar, L. I., and Stumpp, C.: Correcting for Biogenic Gas Matrix Effects on Laser-Based Pore Water-Vapor Stable Isotope Measurements, Vadose Zone J., 17, 1–10, https://doi.org/10.2136/vzj2017.08.0157, 2018. a
Gralher, B., Herbstritt, B., and Weiler, M.: Technical Note: Unresolved Aspects of the Direct Vapor Equilibration Method for Stable Isotope Analysis (δ18O, δ2H) of Matrix-Bound Water: Unifying Protocols through Empirical and Mathematical Scrutiny, Hydrol. Earth Syst. Sci., 25, 5219–5235, https://doi.org/10.5194/hess-25-5219-2021, 2021. a, b, c, d, e, f
Hendry, M. J. and Wassenaar, L.: Inferring Heterogeneity in Aquitards Using High-Resolution δD and δ18O Profiles, Groundwater, 47, 639–645, https://doi.org/10.1111/j.1745-6584.2009.00564.x, 2009. a
Hendry, M. J. and Wassenaar, L. I.: Millennial-Scale Diffusive Migration of Solutes in Thick Clay-Rich Aquitards: Evidence from Multiple Environmental Tracers, Hydrogeol. J., 19, 259–270, https://doi.org/10.1007/s10040-010-0647-4, 2011. a
Hendry, M. J., Barbour, S. L., Zettl, J., Chostner, V., and Wassenaar, L. I.: Controls on the Long-Term Downward Transport of δ2H of Water in a Regionally Extensive, Two-Layered Aquitard System, Water Resour. Res., 47, W06505, https://doi.org/10.1029/2010WR010044, 2011a. a
Hendry, M. J., Richman, B., and Wassenaar, L.: Correcting for Methane Interferences on δ2H and δ18O Measurements in Pore Water Using H2O(Liquid)–H2O(Vapor) Equilibration Laser Spectroscopy, Anal. Chem., 83, 5789–5796, https://doi.org/10.1021/ac201341p, 2011b. a
Knörig, A., Wettach, R., and Cohen, J.: Fritzing: a tool for advancing electronic prototyping for designers, Association for Computing Machinery, New York, NY, USA, ISBN 9781605584935, https://doi.org/10.1145/1517664.1517735, 2009. a
Koeniger, P., Marshall, J. D., Link, T., and Mulch, A.: An Inexpensive, Fast, and Reliable Method for Vacuum Extraction of Soil and Plant Water for Stable Isotope Analyses by Mass Spectrometry, Rapid Commun. Mass Spectrom., 25, 3041–3048, https://doi.org/10.1002/rcm.5198, 2011. a, b
Kuhlemann, L.-M., Tetzlaff, D., Smith, A., Kleinschmit, B., and Soulsby, C.: Using soil water isotopes to infer the influence of contrasting urban green space on ecohydrological partitioning, Hydrol. Earth Syst. Sci., 25, 927–943, https://doi.org/10.5194/hess-25-927-2021, 2021. a
Millar, C., Pratt, D., Schneider, D. J., and McDonnell, J. J.: A Comparison of Extraction Systems for Plant Water Stable Isotope Analysis, Rapid Commun. Mass Spectrom., 32, 1031–1044, https://doi.org/10.1002/rcm.8136, 2018. a
Millar, C., Janzen, K., Nehemy, M. F., Koehler, G., Hervé-Fernández, P., Wang, H., Orlowski, N., Barbeta, A., and McDonnell, J. J.: On the Urgent Need for Standardization in Isotope-Based Ecohydrological Investigations, Hydrol. Process., 36, e14698, https://doi.org/10.1002/hyp.14698, 2022. a
Orlowski, N., Frede, H.-G., Brüggemann, N., and Breuer, L.: Validation and Application of a Cryogenic Vacuum Extraction System for Soil and Plant Water Extraction for Isotope Analysis, J. Sens. Sens. Syst., 2, 179–193, https://doi.org/10.5194/jsss-2-179-2013, 2013. a, b
Orlowski, N., Pratt, D. L., and McDonnell, J. J.: Intercomparison of Soil Pore Water Extraction Methods for Stable Isotope Analysis, Hydrol. Process., 30, 3434–3449, https://doi.org/10.1002/hyp.10870, 2016. a, b, c, d
Peralta-Tapia, A., Sponseller, R. A., Tetzlaff, D., Soulsby, C., and Laudon, H.: Connecting Precipitation Inputs and Soil Flow Pathways to Stream Water in Contrasting Boreal Catchments, Hydrol. Process., 29, 3546–3555, https://doi.org/10.1002/hyp.10300, 2015. a
Pratt, D. L., Lu, M., Lee Barbour, S., and Jim Hendry, M.: An Evaluation of Materials and Methods for Vapour Measurement of the Isotopic Composition of Pore Water in Deep, Unsaturated Zones, Isotop. Environ. Health Stud., 52, 529–543, https://doi.org/10.1080/10256016.2016.1151423, 2016. a, b
Python Software Foundation: Python 3 Documentation, https://docs.python.org/3/ (last access: 22 January 2025), 2022. a
Seeger, S. and Pyschik, J.: VapAuSa [Software], GitLab [code], https://gitlab.rz.uni-freiburg.de/hydrology/vapausa (last access: 22 January 2025), 2024. a
Seeger, S. and Weiler, M.: Temporal dynamics of tree xylem water isotopes: in situ monitoring and modeling, Biogeosciences, 18, 4603–4627, https://doi.org/10.5194/bg-18-4603-2021, 2021. a
Smith, A., Tetzlaff, D., Kleine, L., Maneta, M. P., and Soulsby, C.: Isotope-Aided Modelling of Ecohydrologic Fluxes and Water Ages under Mixed Land Use in Central Europe: The 2018 Drought and Its Recovery, Hydrol. Process., 34, 3406–3425, https://doi.org/10.1002/hyp.13838, 2020. a
Sprenger, M., Leistert, H., Gimbel, K., and Weiler, M.: Illuminating Hydrological Processes at the Soil-Vegetation-Atmosphere Interface with Water Stable Isotopes: Review of Water Stable Isotopes, Rev. Geophys., 54, 674–704, https://doi.org/10.1002/2015RG000515, 2016. a
Stumpp, C. and Hendry, M. J.: Spatial and Temporal Dynamics of Water Flow and Solute Transport in a Heterogeneous Glacial till: The Application of High-Resolution Profiles of δ18O and δ2H in Pore Waters, J. Hydrol., 438–439, 203–214, https://doi.org/10.1016/j.jhydrol.2012.03.024, 2012. a
Thomas, E. M., Lin, H., Duffy, C. J., Sullivan, P. L., Holmes, G. H., Brantley, S. L., and Jin, L.: Spatiotemporal Patterns of Water Stable Isotope Compositions at the Shale Hills Critical Zone Observatory: Linkages to Subsurface Hydrologic Processes, Vadose Zone J., 12, vzj2013.01.0029, https://doi.org/10.2136/vzj2013.01.0029, 2013. a
Volkmann, T. H. M. and Weiler, M.: Continual in Situ Monitoring of Pore Water Stable Isotopes in the Subsurface, Hydrol. Earth Syst. Sci., 18, 1819–1833, https://doi.org/10.5194/hess-18-1819-2014, 2014. a, b
Wassenaar, L., Hendry, M., Chostner, V., and Lis, G.: High Resolution Pore Water δ2H and δ18O Measurements by H2O(Liquid)-H2O(Vapor) Equilibration Laser Spectroscopy, Environ. Sci. Technol., 42, 9262–9267, https://doi.org/10.1021/es802065s, 2008. a, b, c, d, e, f, g
Werner, R. A. and Brand, W. A.: Referencing Strategies and Techniques in Stable Isotope Ratio Analysis, Rapid Commun. Mass Spectrom., 15, 501–519, https://doi.org/10.1002/rcm.258, 2001. a
West, A. G., Patrickson, S. J., and Ehleringer, J. R.: Water Extraction Times for Plant and Soil Materials Used in Stable Isotope Analysis, Rapid Commun. Mass Spectrom., 20, 1317–1321, https://doi.org/10.1002/rcm.2456, 2006. a


