the Creative Commons Attribution 4.0 License.
the Creative Commons Attribution 4.0 License.
 | 02 Oct 2025
Diurnal variability of global precipitation: insights from hourly satellite and reanalysis datasets
Yannis Markonis
Francesco Marra
Efthymios I. Nikolopoulos
Simon Michael Papalexiou
Vincenzo Levizzani
Accurate estimation of precipitation at the global scale is of utmost importance. Even though satellite and reanalysis products are capable of providing high-spatiotemporal-resolution estimations at the global level, they are associated with significant uncertainties that vary with regional characteristics and scales. The uncertainties among precipitation estimates, in general, are much higher at the sub-daily scale compared to daily, monthly, and annual scales. Therefore, evaluating these sub-daily estimations is of specific importance. In this context, this study explores the diurnal cycle of precipitation using all the currently available space-borne and reanalysis-based precipitation products with at least hourly resolution at the quasi-global scale (60° N–60° S), i.e. Integrated Multi-satellitE Retrievals for GPM (IMERG), Global Satellite Mapping of Precipitation (GSMaP), Climate Prediction Center Morphing (CMORPH), Precipitation Estimation from Remotely Sensed Information Using Artificial Neural Networks (PERSIANN), and ECMWF Reanalysis v5 (ERA5). The diurnal variability of precipitation is estimated using three parameters, namely, precipitation amount, frequency, and intensity, all remapped at a common resolution of 0.25° and 1 h. All the estimates represent the spatiotemporal variation across the globe well. Nevertheless, considerable uncertainties exist in the estimates regarding the peak precipitation hour, as well as the diurnal mean precipitation amount, frequency, and intensity. In terms of diurnal mean precipitation, PERSIANN shows the lowest estimates compared to the other datasets, with the largest difference observed over the ocean rather than over land. As for diurnal frequency, ERA5 exhibits the highest disparity among the estimates, with a frequency twice as high as that of the other estimates. Furthermore, ERA5 shows an early diurnal peak and highest variability compared to the other datasets. Among the satellite estimates, IMERG, GSMaP, and CMORPH exhibit a similar pattern, with a late-afternoon peak over land and an early-morning peak over the ocean. Overall, it emphasizes the need to integrate diverse datasets and exercise caution when relying solely on individual precipitation products to ensure a thorough understanding and precise analysis of global precipitation patterns.
- Article
(13288 KB) - Full-text XML
-
Supplement
(13701 KB) - BibTeX
- EndNote


Precipitation is probably one of the most complex variables to estimate, given its high spatiotemporal variability in both space and time. This variability occurs in a continuum of timescales, ranging from inter-annual to seasonal and sub-seasonal (Hayden et al., 2023). In addition, the sub-daily-scale variation, although on a longer scale driven by solar radiation, is highly regional (Yang and Smith, 2006). Thus, the accurate estimation of precipitation at the global level, and especially over the global ocean, is an ongoing challenge. The diurnal variation in global precipitation is of particular interest, considering its role in the global water cycle and climate system. Given the limitations of global climate models in accurately representing the diurnal cycle of precipitation (Tao et al., 2024; Trenberth et al., 2017), it is essential to have a robust reference to understand the processes responsible for this and to improve them. Satellite precipitation data offer a promising alternative that can serve this purpose. Therefore, understanding the precipitation characteristics across a range of scales from sub-daily (diurnal) to inter-annual variation at the global level not only improves our understanding of the water cycle and climate system but also helps the climate models to better represent small-scale processes (Watters et al., 2021; Dai and Trenberth, 2004).
Global satellite precipitation products provide a unique advantage for the estimation of the diurnal cycle, given their fine spatial–temporal resolution, near-global coverage, and access to remote areas (Levizzani et al., 2020a, b). Therefore, high-resolution multi-satellite estimates such as the Tropical Rainfall Measuring Mission (TRMM) (Yang and Smith, 2006) and the IMERG (Huffman et al., 2015) have extensively been used in the estimation of the diurnal variability at both regional (e.g. Hayden et al., 2023; Tan et al., 2019; O and Kirstetter, 2018; Dezfuli et al., 2017) and global (e.g. Watters et al., 2021; Watters and Battaglia, 2019) scales. For instance, Tan et al. (2019) recently evaluated the IMERG versions in terms of diurnal variation over the different regions of the globe. They found that IMERG V06 exhibits an improved ability to capture the diurnal variability than V05. In addition, it has also been reported that IMERG represents the regional diurnal variability in a variety of climatic regions well, such as over Africa (Dezfuli et al., 2017), Brazil (Afonso et al., 2020), China (Li et al., 2018), and the contiguous United States (CONUS) (O and Kirstetter, 2018). Furthermore, O and Kirstetter (2018) revealed the potential of IMERG as an alternative to ground measures over CONUS, even at a sub-daily scale. However, they also highlighted the fact that there are some region-specific biases to be considered. At the global scale, IMERG has shown promising results in capturing the key features of the diurnal cycle (Watters and Battaglia, 2019) and has been utilized as a reference to evaluate the ability of reanalysis and model datasets to represent diurnal variability (Watters et al., 2021).
Similarly, a substantial number of regional studies have inter-compared and evaluated various other satellite products in terms of sub-daily scale at different regions of the world (e.g. Roca et al., 2021; Pfeifroth et al., 2016; Sapiano and Arkin, 2009; Janowiak et al., 2005). For instance, Afonso et al. (2020) evaluated the diurnal cycle of satellite estimates (IMERG, GSMaP, and CMORPH) over Brazil, finding improved performance in regions with deep clouds from local thermal heating compared to those dominated by shallow clouds. In addition, Ramadhan et al. (2023) noted that GSMaP products effectively capture the diurnal cycle of precipitation over the Indonesian Maritime Continent, although significant differences emerged in regions with more than one peak. Shawky et al. (2019) examined sub-daily (3, 6, and 18 h) GSMaP and IMERG precipitation estimates in the arid region of Oman, concluding that GSMaP outperformed IMERG overall, despite issues identified with light and extreme precipitation events. Recently, the GSMaP products have also been evaluated at an hourly scale by Lv et al. (2024) over mainland China, and this revealed the significant improvement of the gauge-corrected versions compared to the near-real-time products. Furthermore, Haile et al. (2013) assessed CMORPH and TRMM datasets against gauge observations for the diurnal cycle of precipitation over the Nile River basin, noting over-detection over lake surfaces and underestimation over mountaintops. Similarly, Zhang et al. (2021) revealed the comparatively better performance of CMORPH followed by TRMM and PERSIANN over the Three Gorges Reservoir area in China at 6 and 12 h scales. All three estimates are in close agreement with the observations in terms of the diurnal cycle, though PERSIANN exhibits some biases. Moreover, Roca et al. (2021) provided an overview of the uncertainties at the hourly scale among the satellite estimates at their native resolution across specific regions of the world.
In addition to satellite products, reanalysis datasets, such as the ECMWF Reanalysis v5 (ERA5) (Hersbach et al., 2020), also have the capability of representing the diurnal cycle of precipitation at the global level. Indeed, the application of reanalysis datasets in studying the diurnal cycle of precipitation has extensively increased over the years (Chen et al., 2014; Jiang et al., 2021; Qin et al., 2021). Several attempts have been made to evaluate the performance of ERA5 at various spatial–temporal scales (Nogueira, 2020; Beck et al., 2019). For instance, Beck et al. (2019) report that ERA5 has shown better performance than IMERG in precipitation estimation in complex regions (mountainous terrains); however, the opposite is true in regions characterized with short-lived convective systems. Conversely, Sharifi et al. (2019) reported that IMERG outperforms the ERA5 at the complex terrain on the daily and monthly scale over Austria. Studies have also attempted to evaluate the ERA5 at a sub-daily scale (Kumar et al., 2021; Hong et al., 2021; Tang et al., 2020), and most of them find ERA5 has difficulties in estimation of diurnal cycle of precipitation when compared to IMERG.
Despite the increasing number of sub-daily-scale precipitation studies at the regional scale, such studies are rarely available at the global level. Moreover, to our knowledge, there have not been many studies that evaluated the various satellite estimates in terms of their diurnal variation and their performance at sub-daily scales globally (Dai et al., 2007). Here, we address this gap. We compare five state-of-the-art precipitation estimates, IMERG, GSMaP, PERSIANN, CMORPH, and ERA5, at their hourly scales. This study represents the first comprehensive analysis of the global diurnal cycle, leveraging an ensemble of current satellite estimates compiled from 2 decades of datasets. This will enable us to examine the region-specific strength and limitation of the precipitation estimates.
The paper is organized as follows. Section 2 introduces the five datasets used in the analysis as well as the methodological approaches employed. Then, in Sect. 3, we present the findings of the analysis, starting with the spatial mean precipitation across the globe and their zonal distribution and following with the diurnal cycle and its variation across the globe and among the datasets. In Sect. 4, we focus on the underlying mechanisms responsible for the observed results, along with some limitations and future perspectives. Finally, we conclude this study, highlighting what we have learned from this intercomparison, in Sect. 5.
2.1 Satellite-based datasets
The Global Precipitation Measurement (GPM) mission is a constellation of international satellites that aims to provide high-quality precipitation observations with quasi-global coverage (Huffman et al., 2015). IMERG is a unique algorithm that merges and inter-calibrates precipitation estimates from a range of sources, such as passive microwave (PMW), infrared (IR), and gauges in order to produce 0.1°×0.1° and 30 min precipitation products (Huffman et al., 2020). Unlike the near-real-time products, IMERG Final run (IMERG-F) incorporates ground gauge correction from Global Precipitation Climatology Centre (GPCC) estimates. IMERG-F products are mainly intended for research purposes and are available after 3.5 months of observation. A substantial number of studies have validated the IMERG performance in a range of climatic conditions, and it performed extremely well in a wide range of applications (Pradhan et al., 2022). Further, more details regarding the IMERG precipitation estimation algorithms and their technical details can be found in Huffman et al. (2015). The IMERG V07B Final Run Half Hourly product used in this study was accessed from https://gpm1.gesdisc.eosdis.nasa.gov/data/GPM_L3/ (last access: 2 January 2025).
GSMaP is a gridded multi-satellite precipitation product developed jointly by the Japan Aerospace Exploration Agency (JAXA) and Japan Science and Technology Agency (JSTA) (Kubota et al., 2020; Mega et al., 2019). GSMaP merges precipitation estimates from a range of several low-earth-orbit (LEO) passive microwaves and geostationary IR precipitation sensors. Like IMERG, GSMaP also provides precipitation in near-real time, as well as gauge-corrected final products. Nonetheless, unlike IMERG, GSMaP uses the Climate Prediction Centre (CPC) unified global daily gauge precipitation for gauge correction. Moreover, validation studies have reported consistent performance of GSMaP with observations (Zhou et al., 2020; Lu and Yong, 2018), and relatively better than IMERG at least in a few cases (Li et al., 2021; Ning et al., 2017; Salles et al., 2019). In the present study, we have used the GSMaP gauge-corrected V08 product, available at hourly and 0.1°×0.1° resolutions. The GSMaP estimates are obtained from the JAXA G-Portal (https://earth.jaxa.jp/gpr/, last access: 2 February 2024).
CMORPH products utilize passive microwave estimates from low-earth-orbiting satellites to generate high-quality global precipitation estimates (Joyce et al., 2004; Joyce and Xie, 2011). Given the low-sampling nature of microwave estimates, CMORPH incorporates geostationary infrared (IR) image-derived information to propagate precipitation systems (i.e. CPC Morphing technique) in instances where microwave data are unavailable. Additionally, CMORPH integrates CPC daily precipitation estimates over land and Global Precipitation Climatology Project (GPCP) pentads merged analysis over the ocean for bias correction (Xie et al., 2017). Although CMORPH offers very high spatial resolution, specifically 0.07277° latitude/longitude, this study utilizes the CMORPH bias-corrected Version 1 (V.1) product with a spatial resolution of 0.25°×0.25° and hourly temporal resolution, as accessed from https://www.ncei.noaa.gov/data/cmorph-high-resolution-global-precipitation-estimates/access/hourly/ (last access: 2 February 2024).
PERSIANN primarily relies on the geostationary infrared cloud images to estimate precipitation at 0.25°×0.25° spatial resolution and hourly temporal scales (Hsu et al., 1997; Sorooshian et al., 2000). As its name suggests PERSIANN uses artificial neural networks to estimate precipitation based on the cloud top temperature from the geostationary satellite-derived infrared images (Nguyen et al., 2019). It is important to note that PERSIANN does not directly incorporate passive microwave (PMW) estimates as input; instead, it uses LEO satellites to continually adjust the parameters of the model. The PERSIANN products used in the current study are obtained from the CHRS Data Portal at https://chrsdata.eng.uci.edu (last access: 2 February 2024).
2.2 Reanalysis estimates: ERA5
ERA5 is the latest fifth-generation global atmospheric reanalysis product developed by the European Centre for Medium-Range Weather Forecasts (ECMWF) using the 4D-Var data assimilation techniques in cycle 41r2 (Hersbach et al., 2020; Jiang et al., 2021). Recently, ERA5 replaced its predecessor, i.e. the ERA-Interim reanalysis product. Compared to ERA-Interim, ERA5 has been updated with a more advanced data assimilation system and physical model, and more importantly, the spatial resolution is reduced to 31 km. In addition, ERA5 datasets are now available at an hourly scale and have extended to 1950. Compared to other global reanalysis products, ERA5 has better agreement with the observational precipitation (Keller and Wahl, 2021; McClean et al., 2023) and reported substantial improvement compared to the ERA-Interim (Wang et al., 2019).
2.3 Methodology
The methodological approach includes an inter-comparison of sub-daily-scale precipitation derived from multiple sources of precipitation datasets (Table 1). The multi-source precipitation datasets from the state-of-the-art satellite and reanalysis products at their original resolution (i.e. 30 min or hourly) are collected covering the global land and ocean between 60° N and −60° S. Considering the different temporal coverage of each dataset, a common overlapping period from 2001–2020 is selected as the analysis period. Moreover, given the different spatial and temporal resolutions of the datasets, to have a consistent and fair analysis, all the estimates are converted into a common spatial and temporal resolution of 0.25°×0.25° and hourly scale. For datasets such as IMERG and GSMaP, which have resolutions finer than 0.25° (e.g. 0.1°×0.1° native resolution), a multi-step conversion process is employed. Initially, these datasets are upscaled to the closest target resolution (i.e. 0.2°×0.2°) by means of simple averaging. Subsequently, they are further refined to the desired 0.25°×0.25° resolution through the nearest-neighbour interpolation technique (Thiessen, 1911; Berndt and Haberlandt, 2018).
Huffman et al. (2015)Mega et al. (2019)Hersbach et al. (2020)Hsu et al. (1997)Joyce et al. (2004)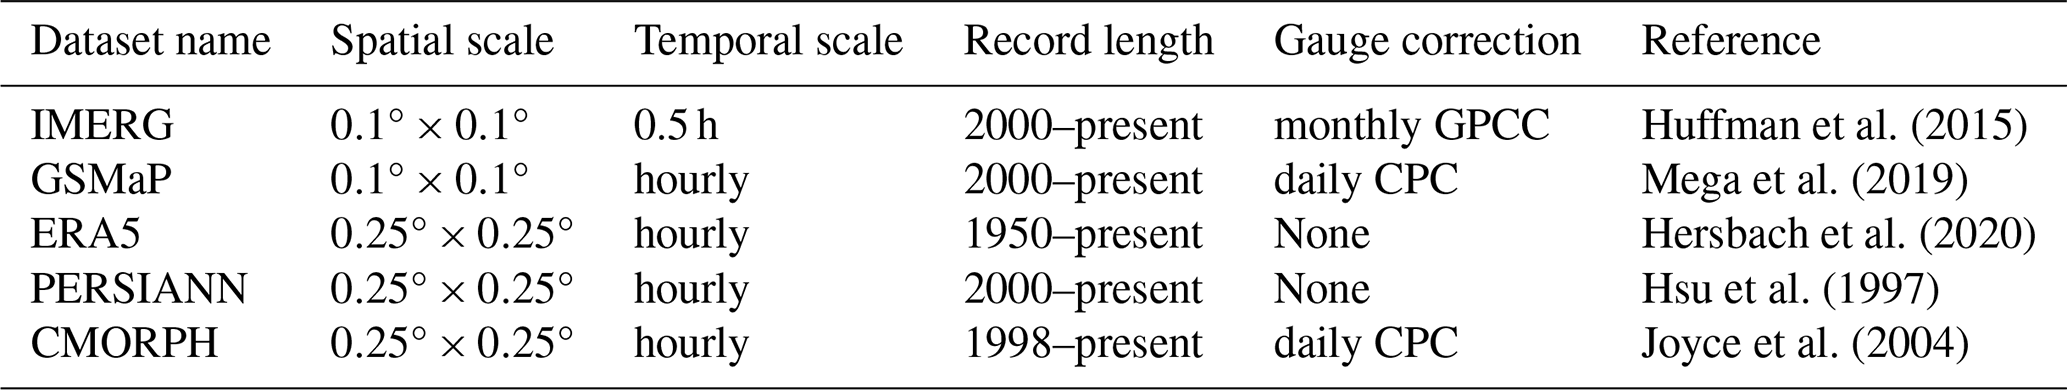
The sub-daily-scale evaluation among the estimates is based on the diurnal cycle. According to Watters et al. (2021), the first- and second-order harmonics are often not efficient in capturing the diurnal variability. Therefore, in this study, we are not fitting any harmonic function or empirical orthogonal function to estimate diurnal parameters. Instead, the diurnal variability of global precipitation is evaluated focusing on three parameters key to our understanding of precipitation, namely, the precipitation amount, the frequency of wet time intervals, and the average intensity of the wet time intervals (Marzuki et al., 2021). The mean precipitation amount is estimated by accumulating all the hourly precipitation divided by the total available hours for each grid. For frequency, the total number of precipitating hours (precipitation >0.1 mm h−1) is divided by the total available hours (both dry and wet). Finally, the intensity is estimated with the total precipitation divided by the precipitating hours (precipitation >0.1 mm h−1). As mentioned above, all these metrics are estimated for each grid.
In this study, we defined a wet hour, or rainy hour, as one with precipitation equal to or greater than 0.1 mm h−1. This threshold is commonly employed in similar analyses and has been widely utilized in previous research (Dai et al., 2007; Xiao et al., 2018). It is well known that the frequency and intensity of precipitation events are highly sensitive to the selected thresholds. Therefore, to explore the impact of different threshold levels on frequency and intensity, we conducted additional analyses using alternative thresholds, specifically 0.2 and 0.5 mm h−1 (Figs. S4–S6 in the Supplement). While the overarching findings of our study were not influenced (the diurnal pattern remains similar) by the specific threshold chosen, this investigation provided valuable insights into how varying threshold criteria can affect the results.
The mean precipitation amount for each latitude (ϕ) and longitude (λ) at the universal coordinated time (UTC) time hour (tUTC) is estimated using the following equation (Eq. 1):
Here, Pi represents the ith precipitation estimate of the study period, and N represents the total number of precipitation estimates for a given latitude, longitude, and hour (including no precipitation events).
The UTC hour of each precipitation dataset is converted to local solar time (LST) using the following equation (Eq. 2):
Given that the analysis is conducted at the level of each grid, we acquire unique diurnal patterns for each grid. However, visualizing these patterns on a global scale becomes unfeasible due to the sheer volume of data. To address this challenge, we employ the K-means clustering algorithm. This method enables us to group similar diurnal patterns together, providing a more condensed representation of global diurnal precipitation variability. In this study, we utilized the hourly mean precipitation amount as the variable for clustering to identify pixels with similar diurnal cycles. Prior to performing the K-means clustering, the mean precipitation data undergo normalization to ensures that the K-means clustering process is not influenced by variations in precipitation levels across different regions. This normalization process involves scaling the precipitation values by their mean and standard deviation at each grid point. The K-means clustering was applied separately for each dataset to ensure that the clustering reflects the unique diurnal cycle characteristics of each product, and no single dataset influenced the clustering of others. To determine the optimal number of clusters, the process was iterated from K=1 to K=15. Ultimately, k=4 was selected as the appropriate number of clusters because the reduction in the within-cluster sum of squares (WSS) for additional clusters was below 7 % (as determined by the Elbow method; see Fig. S7 in the Supplement). Another main reason for limiting the number of clusters to four was to ensure distinct, well-separated clusters that are visually differentiable and easily identifiable. Increasing the number of clusters beyond four typically resulted in similar shapes with minimal differences, making them challenging for intercomparison across datasets (see Fig. S8 in the Supplement). Subsequently, four clusters are extracted from each dataset to depict global diurnal precipitation variability. Finally, each cluster is named according to its peak hour of local solar time.
3.1 Spatial distribution of mean hourly precipitation properties
In order to investigate the differences and similarities among precipitation products, first, we examined the spatial distribution of mean hourly precipitation amount, frequency, and intensity at 0.25°×0.25° resolutions for the period of 2001–2020. The distribution of hourly mean precipitation exhibits a consistent spatial pattern among the estimates across the globe (Fig. 1, and differences from the ensemble can be seen in Fig. S1 in the Supplement). In particular, visually, all of them depict similar spatial patterns characterized by high precipitation across the Intertropical Convergence Zone (ITCZ) and South Pacific Convergence Zone (SPCZ) belt and low precipitation over the dry regions in the sub-tropical high and across the Sahara desert. As mean hourly precipitation is directly related to the total precipitation amounts, it is not surprising to have similar pattern across the datasets. However, regional differences in the dry regions (e.g. southern Pacific Ocean, Southern Atlantic Ocean, and southern Indian Ocean near Australia) can be observed between the PERSIANN and all other products. Unlike other data products, PERSIANN exhibits more widespread dry regions, while the opposite is true for ERA5. Given the known limitations of infrared (IR)-based estimates in accurately detecting precipitation from warm clouds (Behrangi et al., 2012), the underestimation of precipitation by PERSIANN over tropical oceans, where warm rainfall is prevalent, could be attributed to this factor. Likewise, the presence of a wet bias in climate model simulations has been observed across different regions (Ou et al., 2023), which may account for the widespread occurrence of wet conditions in ERA5.
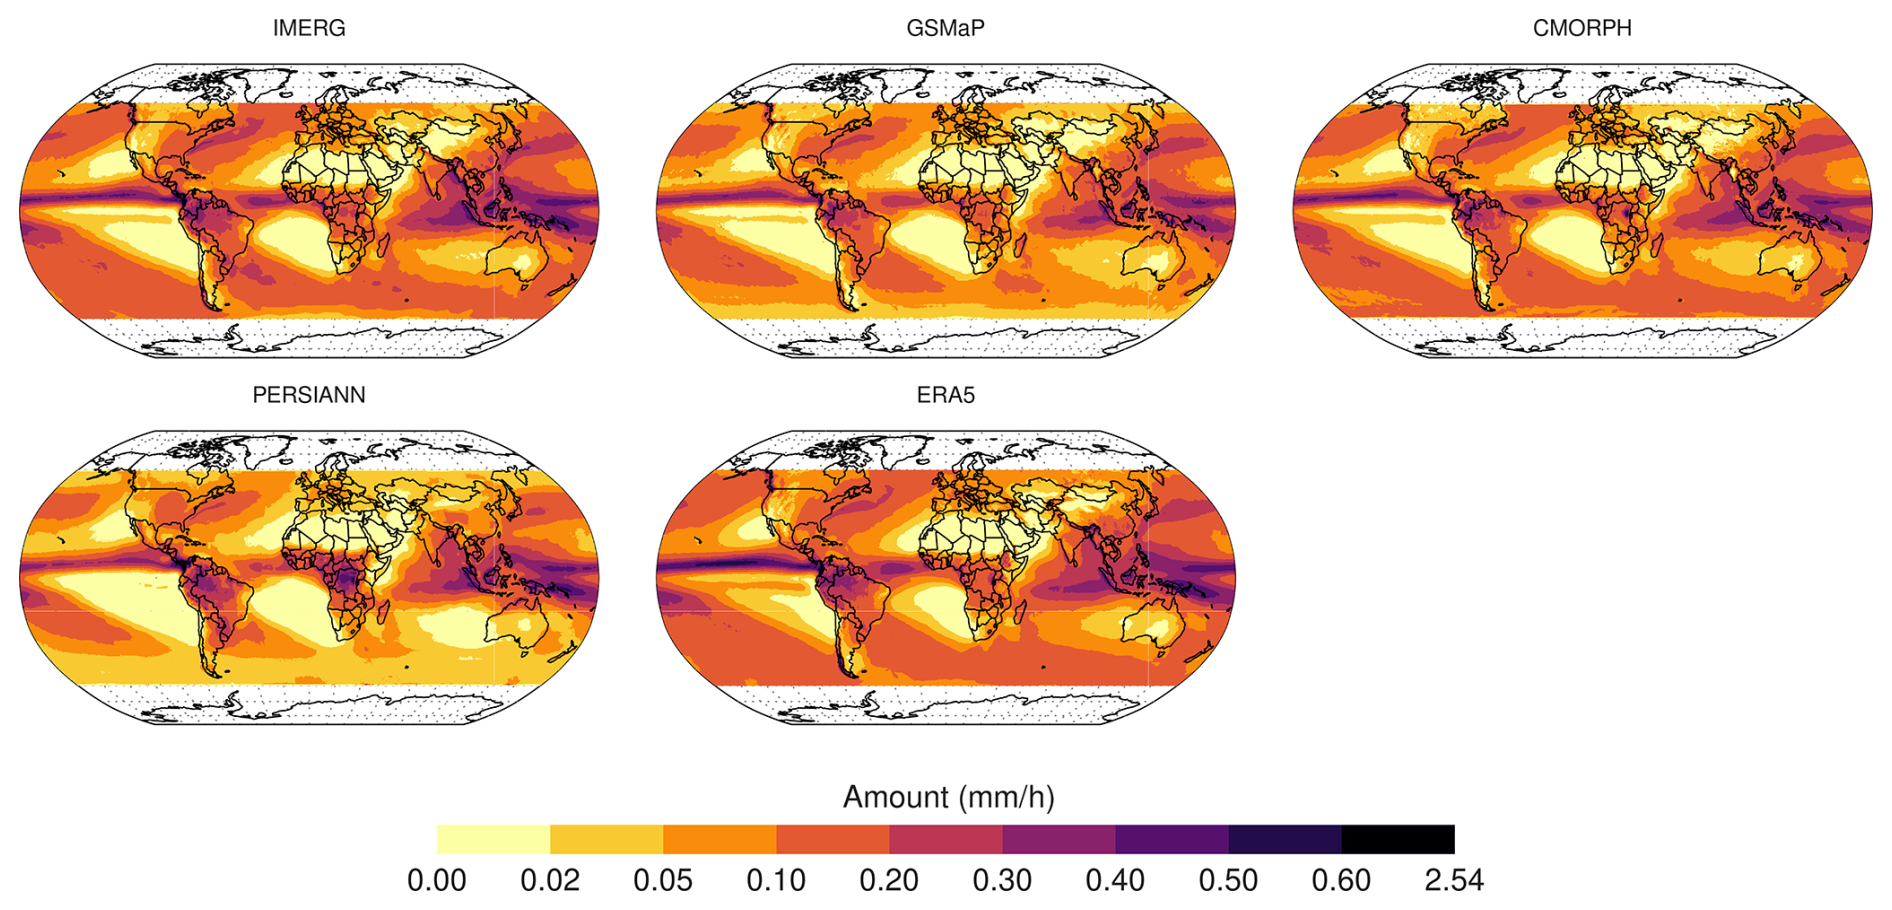
Figure 1Spatial distribution of global mean (2001–2020) hourly precipitation amount (mm h−1).
In terms of the spatial distribution of hourly precipitation frequency, there is a generally similar pattern among the estimates (Fig. 2), and it resembles those of mean precipitation amounts (Fig. 1). Nonetheless, ERA5 appears markedly different from the remote sensing data products, showing substantially high frequencies across the globe. In particular, across the tropical belts and, more precisely, over the ocean, ERA5 shows substantially higher precipitation frequency (40 %–90 %) than the rest of the estimates. Similar to the mean precipitation amount, the frequency of hourly precipitation appears to be quite low in PERSIANN, particularly over dry regions such as the sub-tropical high and the Sahara regions of the African continent. Additionally, compared to the IMERG and GSMaP, CMORPH also exhibits relatively lower frequencies across the globe.
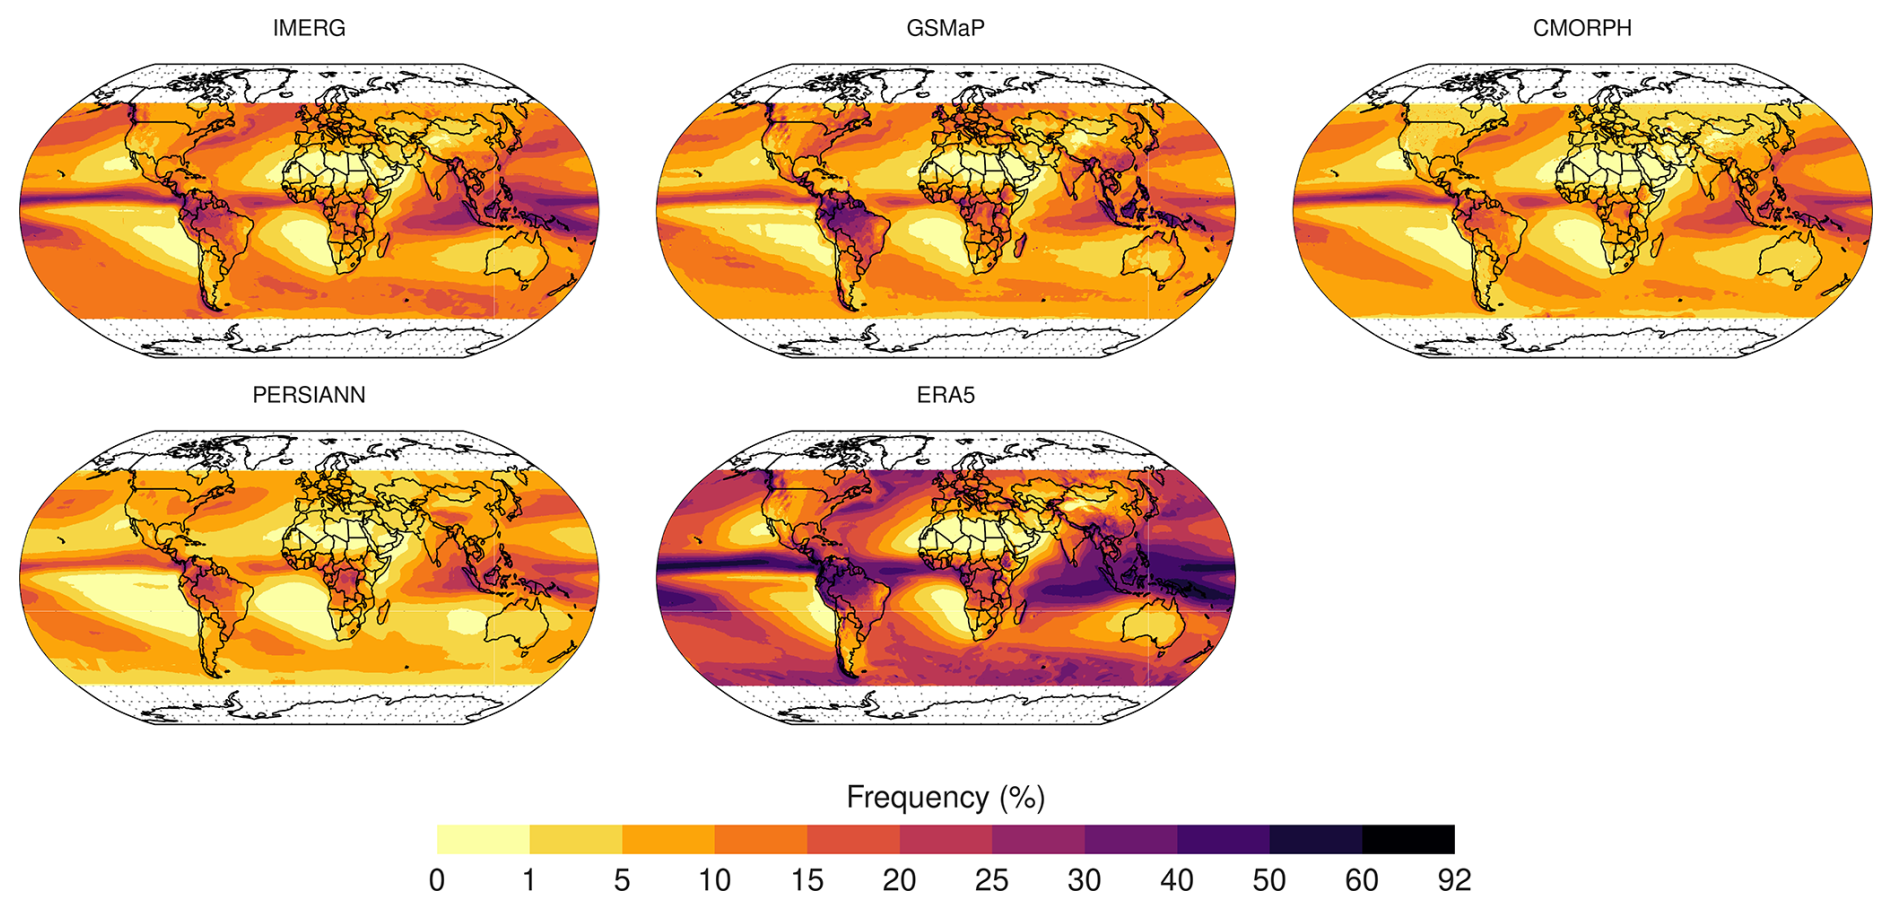
Figure 2Same as Fig. 1 but for precipitation frequency (%).
Unlike the mean precipitation amount and frequency, the spatial pattern of mean precipitation intensity is not very homogeneous among the datasets (Fig. 3). The mean intensity of precipitation seems comparatively very low in the ERA5 estimates compared to the rest of the datasets. This confirms that reanalyses tend to exhibit a high-frequency, low-intensity issue, a concern that has been extensively reported over the years (e.g. Watters et al., 2021; Qin et al., 2021). In terms of satellite estimates, there is relatively good agreement between the IMERG and CMORPH throughout the globe, compared to the GSMaP and PERSIANN. In fact, surprisingly the mean intensity of precipitation for GSMaP also appears to be relatively low, especially over global land. Moreover, it can also be noted that CMORPH exhibits relatively higher intensities, which could be attributed to the relatively lower fraction of light precipitation events in the CMORPH.
Figure 3Same as Fig. 2 but for precipitation intensity (mm h−1).
To further explore and compare the various estimates, the latitudinal average of the mean precipitation amount, frequency, and intensities are also examined (Fig. 4a–c). In terms of hourly mean latitudinal precipitation, all the products agree and exhibit a similar pattern with a peak at the ITCZ, followed by a minimum in sub-tropical belts and so on (Fig. 4a). At the ITCZ, and between 0 and 10° N, in particular, all datasets accurately depict the peak. However, ERA5 (0.33 mm h−1) and IMERG (0.28 mm h−1) show close estimates, which are distinguished from the ones of the other products (values around 0.25 mm h−1). Moreover, all the datasets have similar values from 35° N to −20° S. At higher latitudes, the differences among the estimates increase with latitude. Furthermore, compared to the Northern Hemisphere, the variability among the datasets is notably higher in the Southern Hemisphere (−20 to −60° S). This could be related to the lower availability of ground observations that are used to calibrate and adjust satellite products. Additionally, while ERA5 exhibits the highest mean precipitation amounts with a peak at the ITCZ, IMERG surpasses ERA5 in extra-tropical belts (−20° S to 20° N) in the Southern Hemisphere. Conversely, in the Northern Hemisphere, ERA5 retains the highest mean precipitation amounts. GSMaP aligns closely with CMORPH and PERSIANN, in contrast to IMERG (Fig. 4a). In the Southern Hemisphere, GSMaP has shown a sharp decline from −30 until −60° S, which could be attributed to the underestimation of heavy precipitation events over the ocean. GSMaP's tendency to underestimate both the amount and frequency of heavy precipitation has also been reported in previous studies (Weng et al., 2023; Ning et al., 2017).
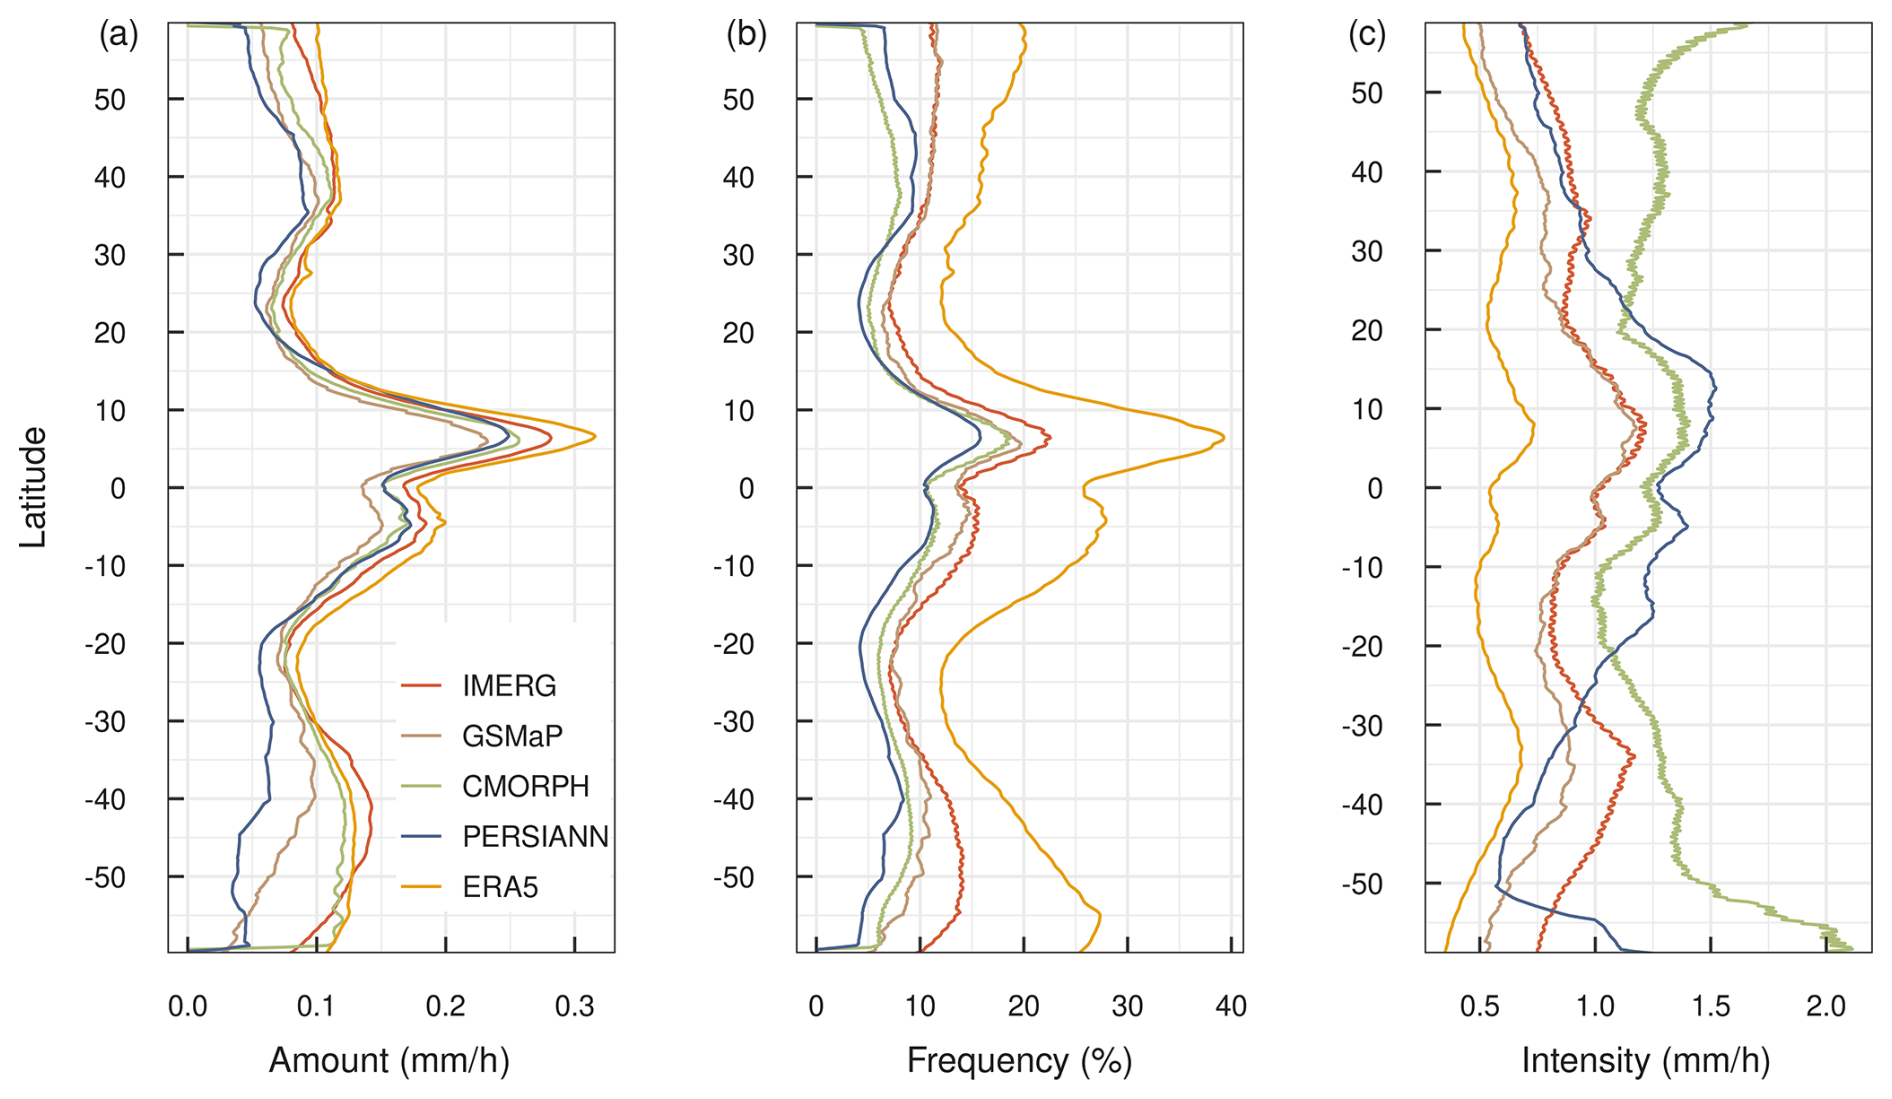
Figure 4Latitudinal average of mean hourly precipitation (a) amount (mm h−1), (b) frequency (%), and (c) intensity (mm h−1).
In terms of frequency, ERA5 exhibits a spatial pattern similar to other datasets throughout the latitudes (Fig. 4b). However, its frequency estimation is often significantly higher across all latitude zones. At the ITCZ belt, where the peak frequency occurs, ERA5 has a frequency reaching up to 40 %, which is almost double that of the rest of the products (<20 %). Furthermore, among the latitudinal zones, 10–35° is the only region in both the hemispheres where the difference between ERA5 and the rest of the datasets is relatively minimal. When it comes to the remote sensing estimates, IMERG and GSMaP have very close agreement throughout the latitudinal zones, though some differences appear between ITCZ belts (−20° S to 20° N). Notably, from −40° S onward, the difference between IMERG and GSMaP keeps increasing with the latitude. GSMaP exhibits a sharp decline in a manner similar to the mean precipitation amount (Fig. 4a). Although the PERSIANN and CMORPH are in close agreement throughout the latitudinal zones, PERSIANN remained lowest among the estimates, particularly in the Southern Hemisphere.
As a consequence of the high frequency, the intensity of ERA5 remains the minimum among the datasets throughout the latitudinal zones (Fig. 4c). In fact, the highest uncertainties among the estimates are observed in terms of representing the precipitation intensity. Again, compared to the Northern Hemisphere, the discrepancies are highest over the Southern Hemisphere, with the highest occurring towards the higher latitudes. PERSIANN shows the highest intensity over the ITCZ belts (−20° S to 20° N), with values up to 1.5 mm h−1, followed by CMORPH, IMERG, and GSMaP. However, from the extra-tropical regions, especially from 20° N/S onwards, CMORPH shows the highest intensity with an increasing trend with the latitudes, which is quite the opposite of the rest of the products. Despite having low frequencies, both PERSIANN and CMORPH show high intensity, probably due to the missing light precipitations.
Overall, all the datasets effectively capture the spatial variability and distribution of mean precipitation, frequency, and intensity. However, the zonal plots reveal significant differences among them, especially towards the high latitudes. In fact, the challenge of precipitation retrievals toward high latitudes has been reported in previous studies as well (Protat et al., 2019; Grecu et al., 2016; Skofronick-Jackson et al., 2017). ERA5 exhibits the highest frequency and lowest intensity, while CMORPH depicts the highest intensity. The remaining datasets fall in between, contributing to the observed variations.
3.2 Diurnal variation
3.2.1 Diurnal mean
The diurnal variation of mean precipitation amount among the datasets is quite similar in shape (Fig. 5a). In other words, all the products agreed well in terms of producing specific features of the diurnal variation over the globe: an afternoon peak over the land and an early-morning peak over the ocean. In addition, a bimodal peak with peaks in the early morning (from the ocean) and afternoon (from land) can be observed at the global level. These diurnal results are consistent with previous studies (Dai et al., 2007; Watters et al., 2021). However, significant differences exist among the estimates as well. At the global level, IMERG and ERA5 look quite close to each other with the highest values, whereas GSMaP and PERSIANN have the lowest and CMORPH is in between. Over the ocean, the behaviour of the products is also quite similar to the global level, except for one difference: the early-morning peak. This also indicates that the ocean diurnal cycle dominates at the global level, which is expected as the ocean receives the lion's share of global precipitation compared to land.
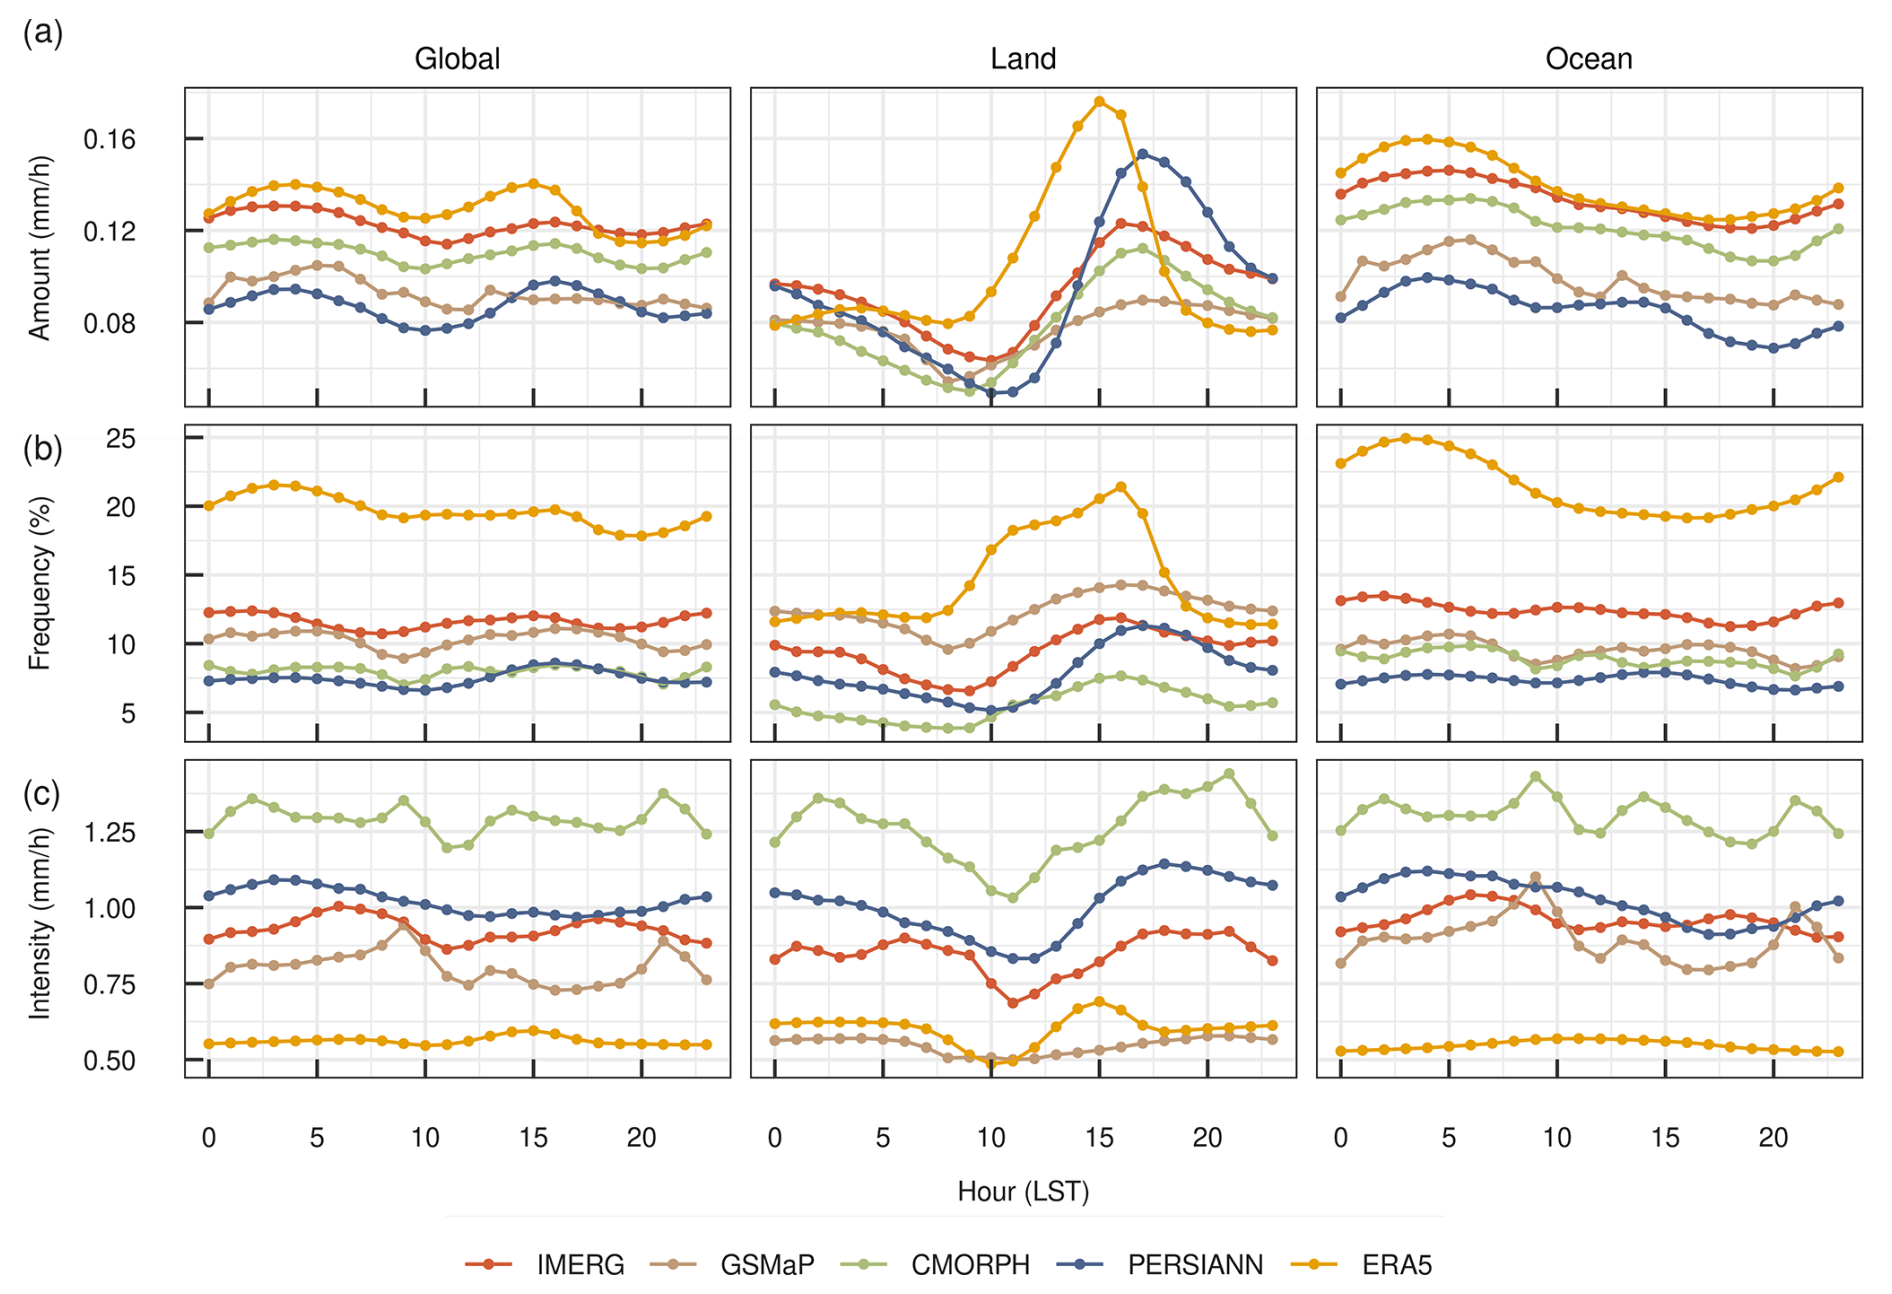
Figure 5Diurnal variation of precipitation (a) amount (mm h−1), (b) frequency (%), and (c) intensity (mm h−1), of each dataset for 2001–2020.
Over the land, all the products well reproduce the afternoon peak, a common feature of the diurnal cycle. This is consistent with other studies over the years. ERA5 shows the peak a little earlier, around 15:00 LST over land, compared to the other estimates which are mostly between 16:00 and 18:00 LST. The earlier peak from the ERA5 reanalysis and other model-generated precipitation is, in fact, not uncommon (Hayden et al., 2023). Additionally, ERA5 also shows the highest peak with a mean precipitation of around 0.18 mm h−1, followed by PERSIANN (0.15 mm h−1), IMERG (0.12 mm h−1), CMORPH (0.11 mm h−1), and GSMaP (<0.1 mm h−1). While ERA5 shows the peak and diurnal cycle slightly earlier than other datasets, the uncertainty among them is greater between 11:00 and 18:00 LST, whereas it is minimal during other times, such as early morning and night. This highlights the different performance of retrieval algorithms, temporal sampling, and model simulations at observing or reproducing convective precipitation.
3.2.2 Diurnal frequency
The diurnal variation in precipitation frequency across the datasets looks quite different compared to the mean precipitation amount (Fig. 5b). As expected, ERA5 displays considerable deviation from the other datasets, irrespective of the region (i.e. globe, land, ocean). Despite the significant overestimation, ERA5 exhibits a peak during the afternoon around 16:00 LST, aligning with the peak observed in other satellite precipitation datasets over land. At the global level, and over the ocean, the variation in diurnal frequency is not particularly pronounced across the satellite datasets. However, over the ocean, ERA5 shows a distinct peak in frequency early in the morning (between 03:00 and 04:00 LST), with its diurnal variation being more predominant than that of the other datasets. All the other estimates show little variation (a flatter shape) with multiple peaks throughout the 24 h period. Conversely, over land, the peak of diurnal frequency is between 15:00 and 16:00 LST. Regarding amplitude, while all datasets show similar peaks in the afternoon, substantial disparities among them are apparent. ERA5 exhibits relatively high discrepancies (exceeding 20 %) during the daytime from late morning (08:00 LST) until late evening (19:00 LST). In terms of the satellite products, their agreement varies with the region. At a global level, IMERG and GSMaP appear similar, as do CMORPH and PERSIANN. Over land, notably, GSMaP is comparatively high, followed by IMERG, PERSIANN, and CMORPH.
3.2.3 Diurnal intensity
Unlike the diurnal mean precipitation amount and frequency, the diurnal intensity is not so pronounced, and thus, it does not exhibit a clear diurnal variation or pattern (Fig. 5c). Peaks are not distinctly evident globally and over the ocean. However, over land, a bimodal peak can be seen, with an early-morning peak between 00:00–05:00 LST and a late-afternoon peak at 15:00–21:00 LST.
In terms of different precipitation products, it is evident that CMORPH exhibits the highest intensity (exceeding 1.25 mm h−1) regardless of whether it is over land, over ocean, or globally throughout the 24 h period. PERSIANN ranks second in terms of the highest intensity across global, land, and ocean regions. As expected, ERA5 exhibits the minimum intensity throughout the day, with a very weak diurnal variation over the ocean and globe compared to land. Despite having a similar pattern, GSMaP does not follow IMERG and has the lowest precipitation intensity over land, even lower than ERA5. GSMaP consistently has the lowest intensity after ERA5, whether over global, land, or ocean regions. It also has the largest discrepancy with the other datasets, particularly over land. This behaviour of GSMaP over land is notable, considering both IMERG and GSMaP use a similar constellation of satellite estimates. Nevertheless, it should also be noted that both datasets use different gauge corrections over land. IMERG applies GPCC corrections on a monthly scale, while GSMaP utilizes CPC corrections on a daily scale. GPCC accesses from a time-varying collection over 86 000 stations (Sun et al., 2018; Schneider et al., 2014), whereas CPC uses data from 30 000 stations over the globe (Xie et al., 2010). Although there is some overlap among the data sources, both datasets (i.e. GPCC and CPC) exhibit differences due to their underlying quality control measures, interpolation techniques, and other factors. Moreover, beyond gauge corrections, differences between IMERG and GSMaP in their precipitation retrieval algorithms, sampling frequency, and other aspects could also contribute to the observed discrepancies. Among these factors, gauge correction is likely a major reason, as the differences are more pronounced over land than over the ocean. Similar performance of GSMaP has also been reported over China (Weng et al., 2023), where it failed to detect precipitation events during the wet season and underestimated both the frequency and magnitude of precipitation extremes.
3.3 Peak hour of diurnal mean precipitation amount, frequency, and intensity
To further investigate the timing of maximum precipitation properties (i.e. amount, frequency, and intensity) and their variations across different climates and topographic regions, the peak hours are also examined (Figs. 6–8). The peak hour denotes the hour at which the maximum precipitation properties occur at each grid. Regarding the peak hour of precipitation amount, the continental/land regions are mostly dominated by the evening peak hours (15:00–18:00 LST), compared to the early-morning peak hours over the ocean (02:00–06:00 LST) (Fig. 6). However, there are regions, particularly over land, where a slightly inhomogeneous distribution of peak precipitation hours is observed. This inhomogeneous distribution is mainly seen in dry regions such as Africa, Australia, and the Middle East. Topographic barriers appear to have an impact on the timing of peak precipitation hours. In regions upwind of high-elevation mountain chains such as the Himalayas and Andes, peak hours tend to occur in the early morning, in contrast to the early-afternoon peak hours observed in the surrounding land (Fig. S9 in the Supplement). This phenomenon is likely due to orographic precipitation. In China, similar results were observed; convective systems in eastern Asia typically develop in the foothills of the Tibetan Plateau at midnight and propagate eastwards during late night to early morning (Chen et al., 2017).
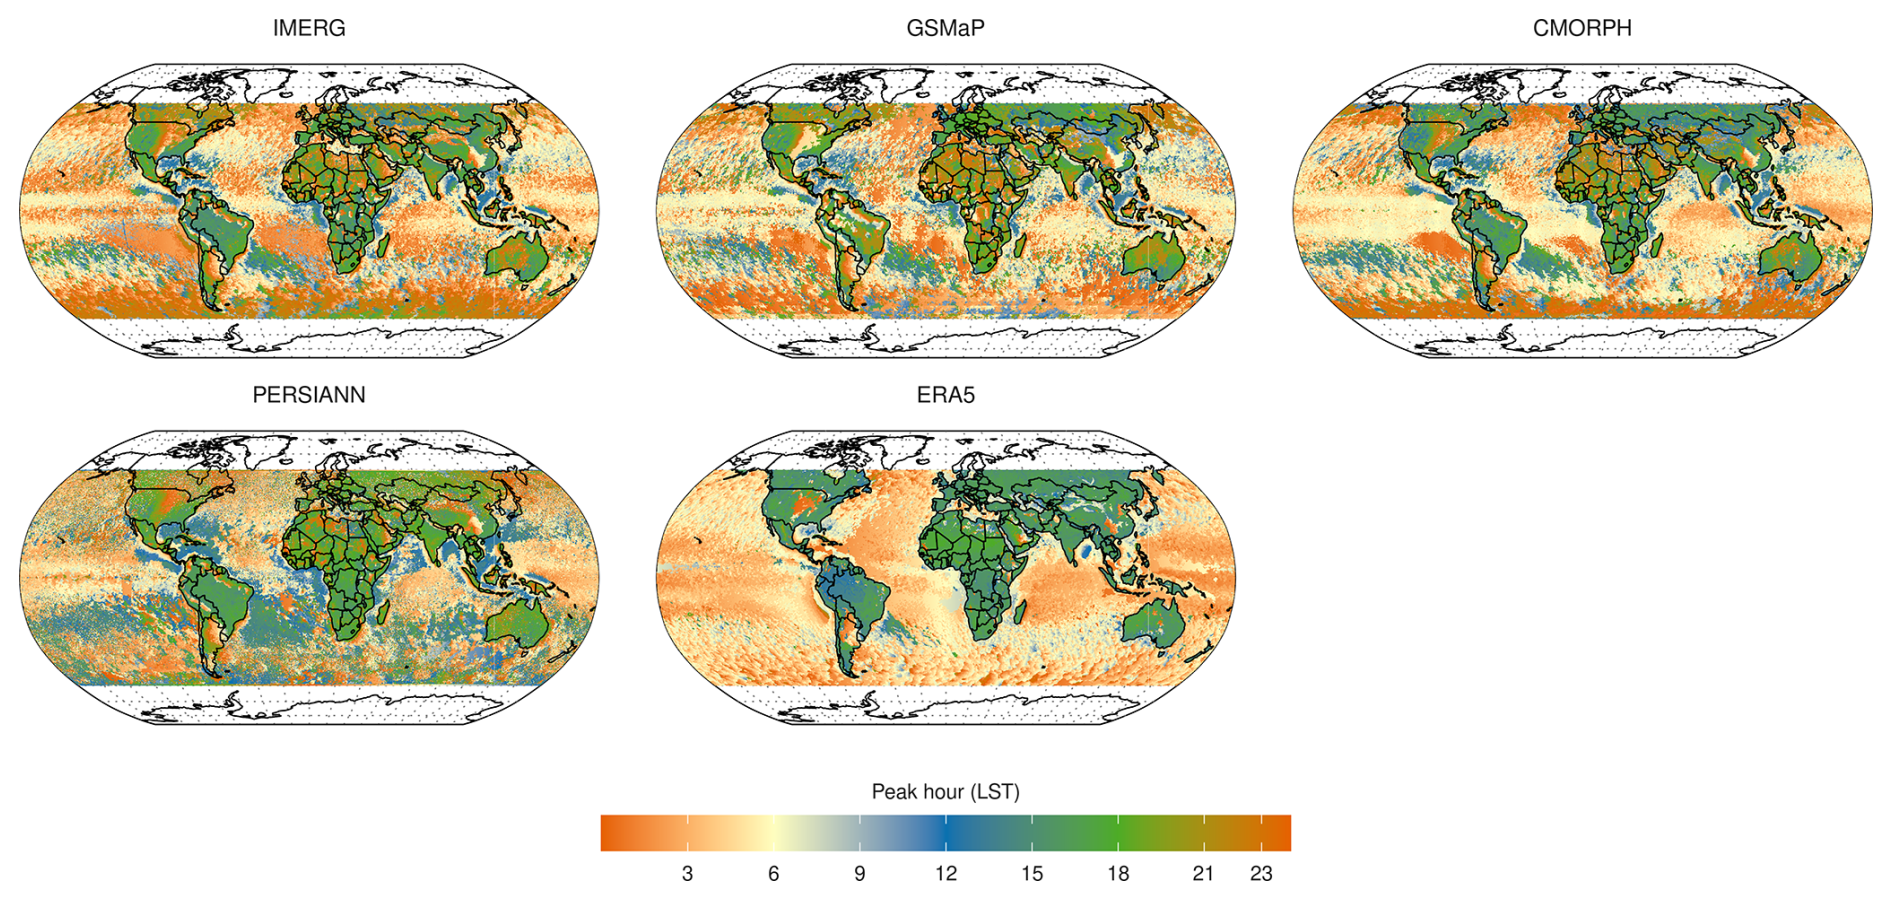
Figure 6Peak hour of mean precipitation for each dataset during 2001–2020.
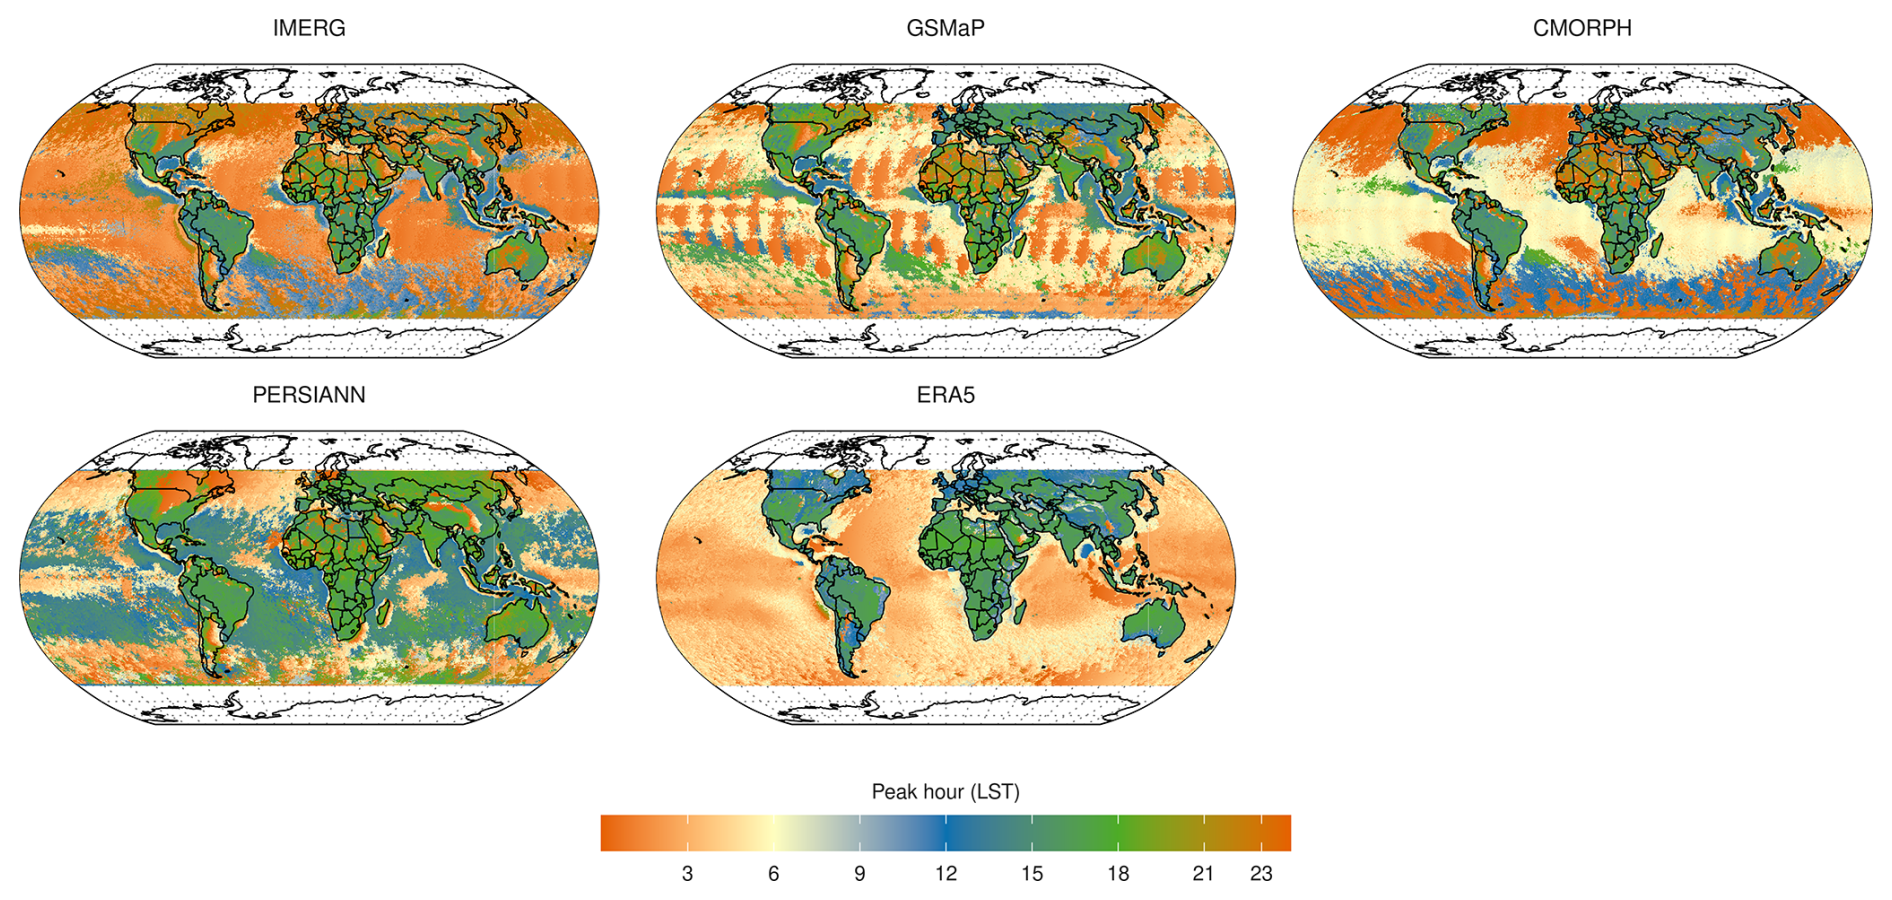
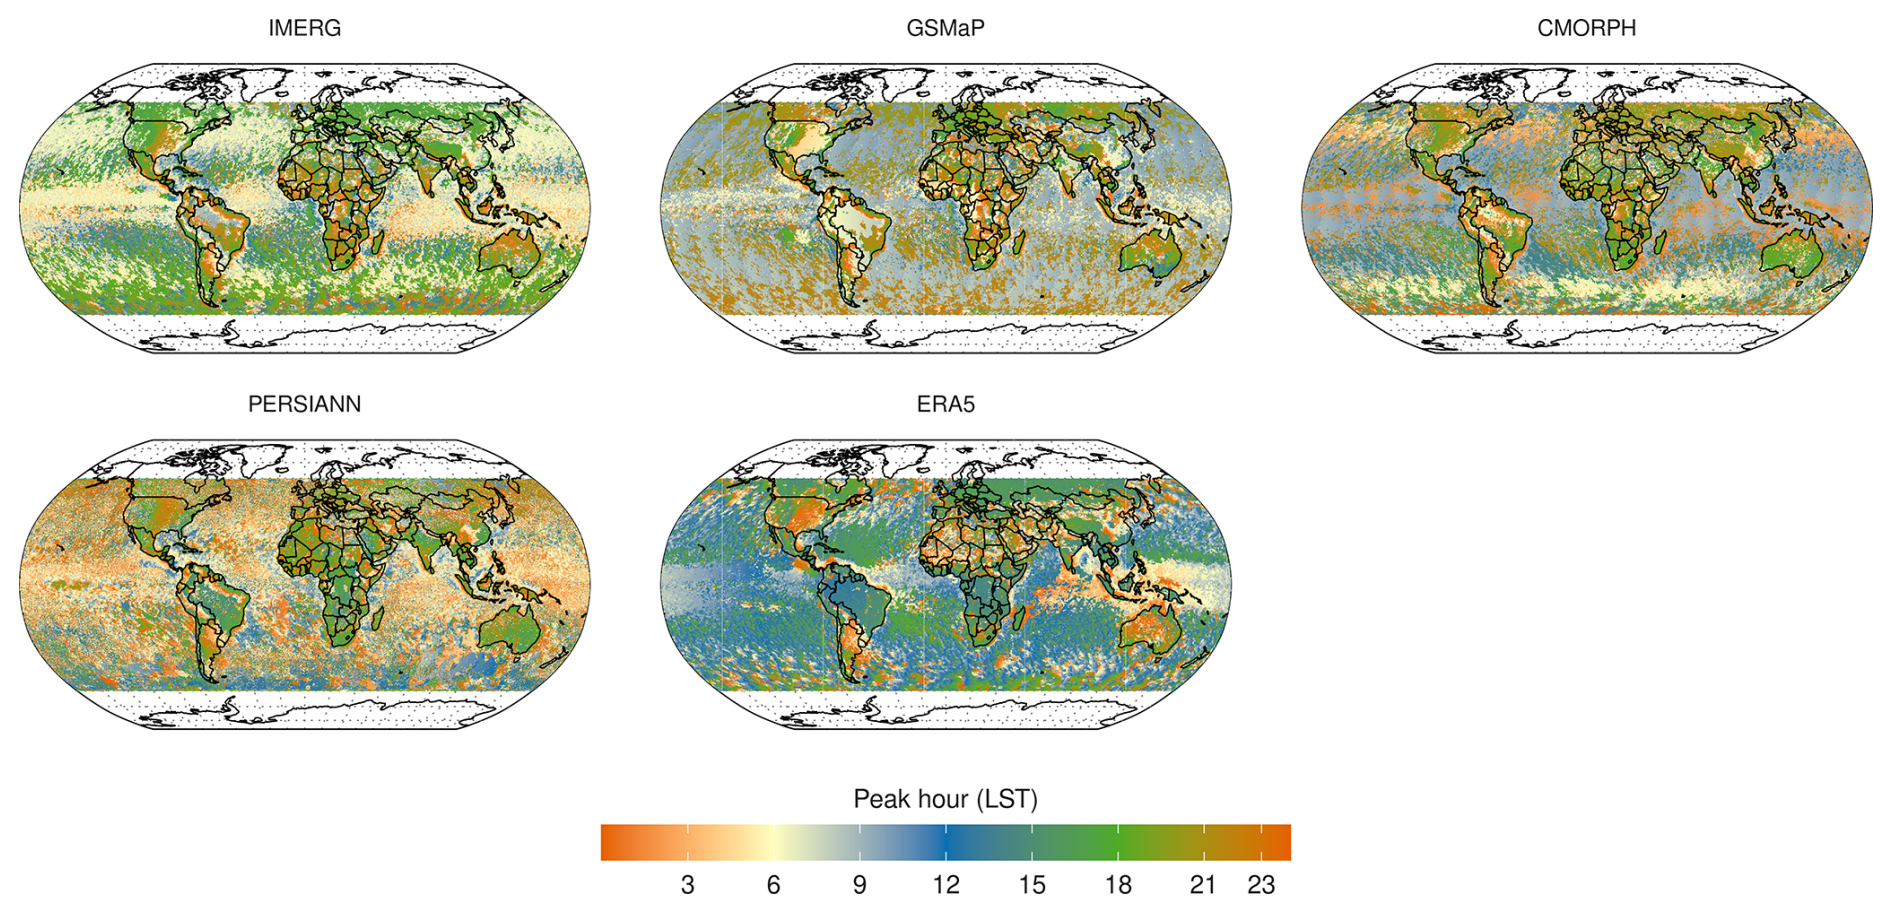
Figure 8Peak hour of precipitation intensity for each dataset during 2001–2020.
The oceanic regions are mainly characterized by midnight to early-morning peak hours (00:00–06:00 LST). In fact, the high-precipitation regions are mainly dominated by early-morning peak hours, approximately between 03:00–07:00 LST, while the dry regions, such as the Atlantic and Pacific warm pools, are a bit earlier, between 01:00 to 03:00 LST. It is even earlier, around 22:00 to 01:00 LST, towards the high latitudes (pole wards). In particular, this pattern is more pronounced over the Southern Hemisphere, as clearly observed in IMERG and CMORPH datasets, although not as distinctly captured by GSMaP.
In the coastal regions near the land, precipitation peaks in between, i.e. 06:00–12:00 LST, and as it progresses towards the land, the peak hours keep increasing and reach the typical late-afternoon/early-evening peaks (15:00–18:00 LST). The exact opposite pattern is observed towards the ocean with precipitation peak in the early morning (03:00–06:00 LST), although regional differences exist among the estimates (e.g. over the Southern Ocean). Similar results were also observed in previous studies, such as by Hayden et al. (2023) and Bai and Schumacher (2022) over the maritime continents.
The diurnal variation in precipitation is primarily driven by the difference in diurnal temperature variation between land and ocean, owing to the ocean's higher heat capacity compared to land. In general, the afternoon peak in precipitation over land is mainly attributed to daytime solar heating, which destabilizes the atmosphere and triggers convection (Yang and Smith, 2006). In contrast, cloud top nighttime radiative cooling and the resulting thermal instability of the atmosphere cause nocturnal or early-morning precipitation peaks over the ocean (Yang and Smith, 2006). Coastal regions, which experience precipitation peaks between those of land and ocean, are influenced by land–sea breeze interactions. Additionally, other mechanisms such as regional topography (e.g. mountains and valleys), latitudinal differences in solar heating, and complex local atmospheric circulations, either individually or in combination, further complicate and influence the diurnal variation of precipitation in specific regions (Wang et al., 2023; Marra et al., 2022; Ruiz-Hernández et al., 2021)
In terms of agreement among different datasets, most of them portray similar spatial patterns, although some noticeable differences exist among them. In particular, ERA5 differs slightly from the rest of the datasets, with an early-peak hour over both the land and oceanic regions. PERSIANN is quite different from the other estimates, which is expected as it is based on different sensors and retrieval principle. IMERG and CMORPH show a high degree of similarity, particularly over land, while GSMaP exhibits noticeable differences, which, of course, vary across continents (e.g. the Great Plains of the USA, the Amazon region, and northern Africa). In particular, IMERG and CMORPH agree well, in that not only do they produce peaks in the early-morning hours over the ocean and in the late afternoon over land, but they are also consistent in depicting the small regional differences. For instance, both IMERG and CMORPH agree on the occurrence of midnight peak hours in the high-latitude Southern Ocean and various dry regions, such as the sub-tropical region of the southern Atlantic and Pacific, as well as over Africa and the Middle East. This agreement could be due to the fact that both IMERG and CMORPH have relied on microwave estimates, and, more importantly, the CMORPH algorithm is partially incorporated in the IMERG.
Over land, similar to the peak hour of mean precipitation amount, precipitation frequency peaks during the afternoon between 14:00–18:00 LST (Fig. 7). However, over the ocean, depending on the region, it varies with time and datasets. The discrepancies among the estimates are larger over the ocean than over land. For instance, as observed by IMERG, sub-tropical dry regions such as the Pacific and Atlantic warm pool zones show nighttime frequency peaks around 02:00–03:00 LST, while in the high-precipitation ITCZ belts, peaks occur during the day (11:00–12:00 LST). In the high-latitude zones (40–60°), the Northern Hemisphere experiences midnight peaks (22:00–01:00 LST), whereas the Southern Hemisphere peaks during midday (10:00–12:00 LST). All these differences in peak hour over the ocean by IMERG are not consistent with other datasets. However, IMERG and CMORPH agree over the high-latitude northern oceans (>40° N) with nocturnal peaks during 21:00–02:00 LST. Nonetheless, discrepancies arise on the southern oceans, as IMERG shows late-morning/midday (09:00–12:00 LST), while CMORPH is nocturnal with few midday peaks. In fact, GSMaP also depicts a similar pattern; however, it is observed in the early morning (03:00–06:00 LST), and the nocturnal peaks are restricted to the high latitudes (>50° N).
In terms of different datasets, similar to the peak hour of mean precipitation amount, all the remote sensing estimates are consistent in reproducing the nocturnal peaks (21:00–01:00 LST) over the Great Plains in the United States, southern Brazil, central and northern Africa, eastern China, and parts of Australia. These region-specific features, however, are not produced by ERA5, and overall, it does not show the spatial variability in peak hour frequency. Instead, ERA5 exhibits a more uniform pattern with peak frequency hours predominantly varying between 00:00 and 06:00 LST, showing little distinction as to whether they occur in the polar oceans or in the tropical regions.
Unlike the peak hour of mean precipitation amount and frequency, the peak hour of intensity exhibits significant heterogeneity over both land and ocean (Fig. 8). The difference in peak hours of intensity between land and ocean is not very pronounced. Over land, the peak hour of intensity occurs either during the late night/early morning (02:00–06:00 LST) or late afternoon between 15:00–18:00 LST, depending on the region and the dataset. This observation highlights that although the mean and frequency of peak hours predominantly occur during the late afternoon over land, high-intensity precipitation mainly occurs during late nights or early mornings, though some regions also exhibit late-afternoon peaks as well. Despite all the satellite estimates being consistent in depicting the regional pattern, slight differences exist among them. When compared to IMERG, CMORPH exhibits a similar pattern, whereas GSMaP exhibits a slight delay. In PERSIANN and ERA5, the peak hours are further delayed, and hence the majority of the land regions depict the peak hours during the late afternoon between 15:00–18:00 LST. Especially in regions such as northern South America (Brazil), southern Africa, and Canada and Russia in the Northern Hemisphere, ERA5 depicts afternoon peaks. In contrast, satellite estimates depict a mix of peak hours ranging from late night/early morning to a few afternoon peak hours. Unlike the peak hour of mean and frequency, ERA5 is consistent with satellite estimates, producing regional differences in peak hour intensity in regions such as the Great Plains of the USA, the southern region of South America (Peru), central regions of Africa, and parts of Australia.
Over the ocean, all satellite estimates indicate an early- to late-morning peak between 03:00–09:00 LST, although some heterogeneity exists in CMORPH and GSMaP. In ERA5, however, the peak extends from late morning to early afternoon, covering the period from 09:00–15:00 LST. IMERG exhibits an early-morning peak between 03:00–06:00 LST throughout most of the tropical oceans and the majority of the Northern Hemisphere. Towards the poles and in most of the Southern Hemisphere, it shows late-evening peaks between 06:00–08:00 LST. Despite a similar pattern between IMERG and GSMaP, GSMaP exhibits the peak hour slightly later, occurring between 07:00–09:00 LST and 19:00–21:00 LST. CMORPH, on the other hand, shows peak hours falling between the range of IMERG and CMORPH. Regarding PERSIANN, it exhibits peak hours even earlier than the other satellite estimates, with the majority of the ocean showing peaks between 03:00–05:00 LST. Among the datasets, ERA5 shows the greatest deviation, with most oceanic regions exhibiting peaks in the late morning to early afternoon (09:00–15:00 LST). The only exception is in the Indian Ocean and western Pacific regions, where ERA5 shows early-morning peaks between 06:00–09:00 LST, which is consistent with the other datasets. These results are not surprising, given the significant differences among the datasets, as illustrated in Fig. 5c.
3.4 Spatial distribution of diurnal characteristics
Although it is observed how diurnal precipitation varies between datasets in terms of land, ocean, and globe, it does not provide information on how these shapes change at each grid level. To accomplish this, the K-means clustering algorithm is employed (Fig. 9). The clusters are named according to their respective peak hour of local solar time: afternoon peak (red), early-morning peak (green), late-morning peak (blue), midnight peak (yellow), and early-afternoon peak (brown).
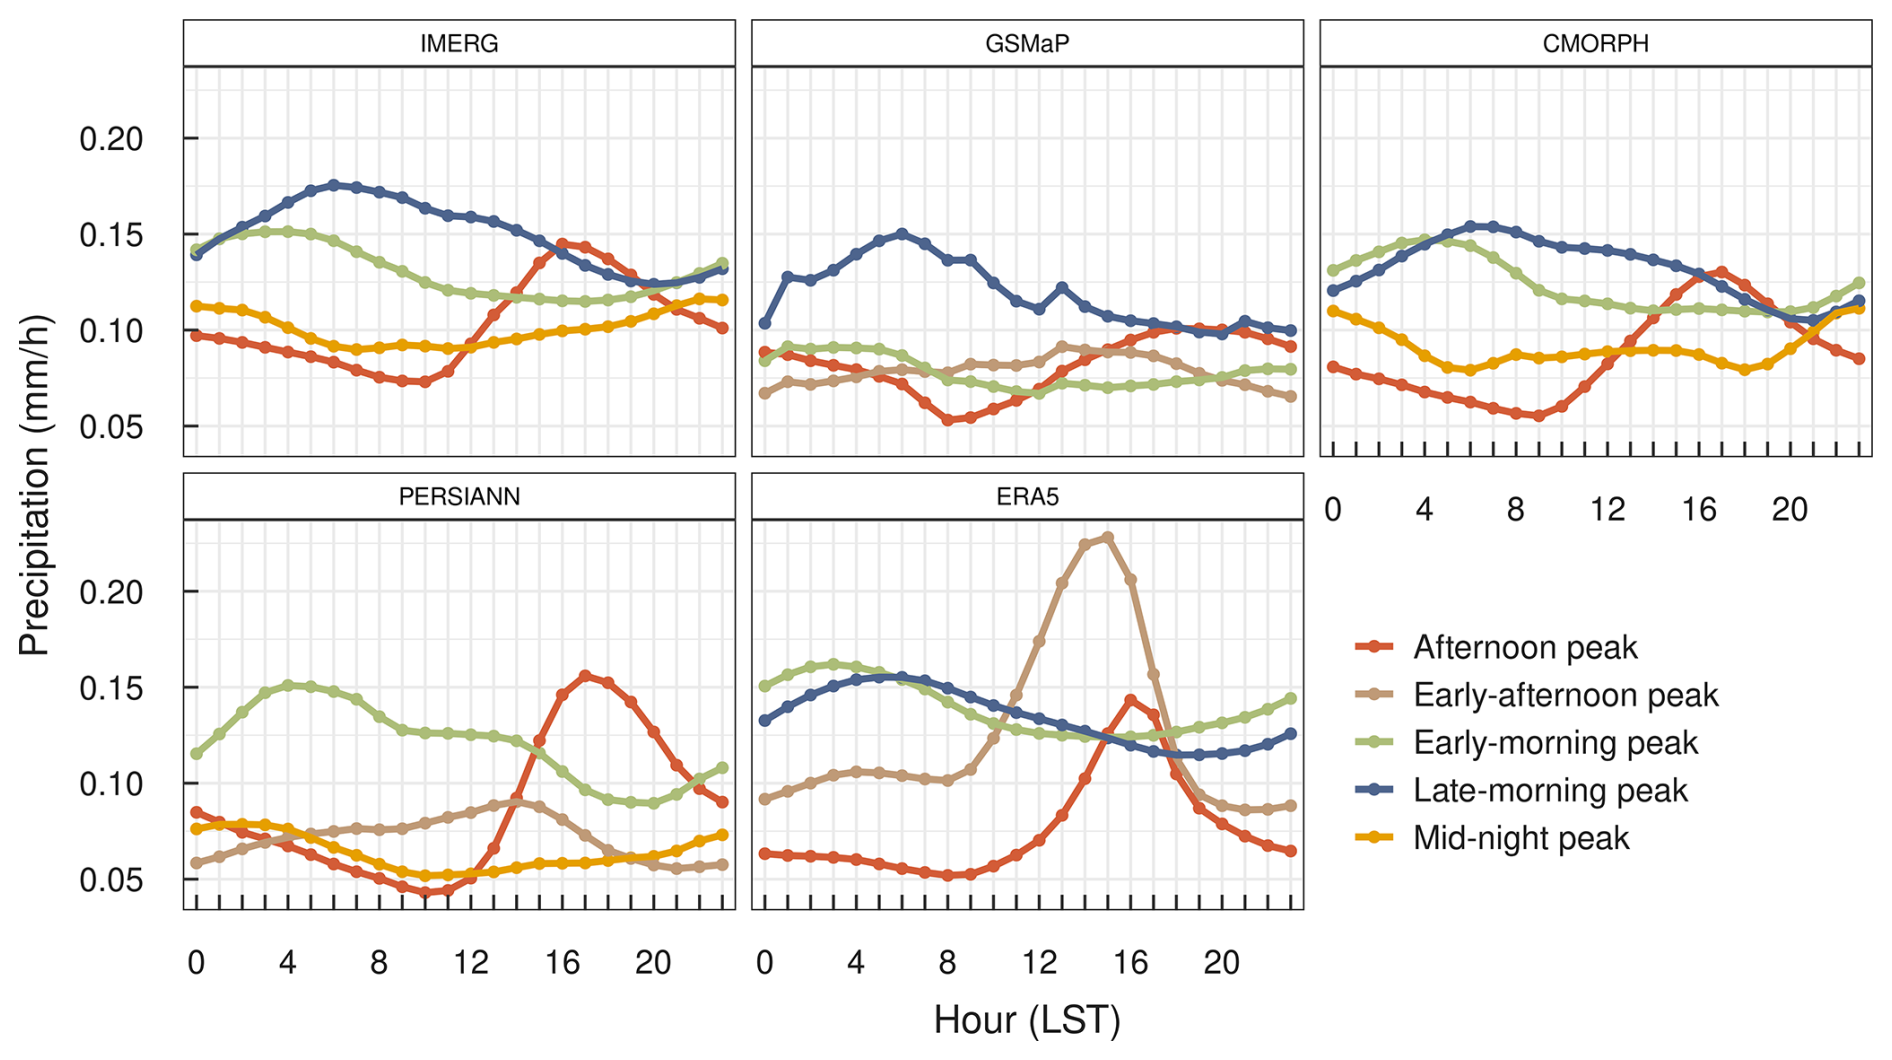
Figure 9K-means clustering (k=4) produced distinct clusters, illustrating the diurnal variation shapes of mean hourly precipitation.
Unsurprisingly, both IMERG and CMORPH produce similar clusters, while GSMaP and PERSIANN fall in between. ERA5 seems to represent a distinct climatology. All datasets share an afternoon peak hour cluster, with a maximum between 15:00–17:00 LST and a minimum between 09:00–10:00 LST, although there are noticeable differences in magnitude. In contrast, the early-morning peak, at 08:00–10:00 LST, is another cluster that can be seen in all the products. The early-afternoon peak, observed over the GSMaP, PERSIANN, and ERA5 with peaks between 14:00–15:00 LST, has quite different amplitudes among the estimates. ERA5 shows the highest amplitude (>0.20 mm h−1), whereas it remains <0.10 mm h−1 in GSMaP and PERSIANN. The peak in the late morning, which closely resembles the early-morning peaks, is delayed by 1 h and is present in all estimates except for PERSIANN. Conversely, the peak at midnight has been observed in all estimates except for ERA5 and GSMaP, which peak between 23:00–02:00 LST. In addition, GSMaP and ERA5 show notable differences from the other datasets. In particular, ERA5 only has two different types of clusters: early-morning peak hour (green) and early-afternoon peak hour (brown). The remaining two clusters in ERA5, late-morning peak hour (blue) and afternoon peak hour (red), closely resemble the green and brown clusters, with only a slight temporal delay.
The spatial distribution of the clusters reveals that afternoon peaks are more frequent over land, while early- and late-morning peaks occur over the ocean, which is consistent across all datasets (Fig. 10). The midnight peak is observed in high latitudes, the oceans of the Southern Hemisphere, as well as over some land regions (i.e. the Great Plains of the USA, northern Africa, the Middle East, parts of north and eastern China, and Australia). Such regional discrepancies are captured and remain consistent in IMERG, CMORPH, and PERSIANN. In contrast, neither GSMaP nor ERA5 exhibits the midnight peaks. Instead, it is slightly delayed, and these regions are occupied by the early- and late-morning peaks in GSMaP and ERA5. Conversely, the early- and late-morning peaks in ERA5 are not as pronounced as in GSMaP, especially in Africa. Over the ocean, IMERG and CMORPH show more or less a similar pattern, with early-morning peaks in most regions, late-morning peaks in coastal regions, and nocturnal peaks towards high latitudes. For PERSIANN, the nocturnal peaks are more pronounced than for its counterparts IMERG and CMORPH. As far as GSMaP and ERA5 are concerned, both do not show the diversity observed in the remote sensing datasets, especially in ERA5. A recent study by Chen et al. (2024) reported similar results, although they used a hierarchical variant of the K-means algorithm and restricted their analysis to a single dataset, IMERG V06. While their study explored a larger number of clusters, our results are broadly consistent, with both studies identifying afternoon peaks over land, early-morning peaks over the ocean, and intermittent patterns in regions with complex topography and along coastal areas.
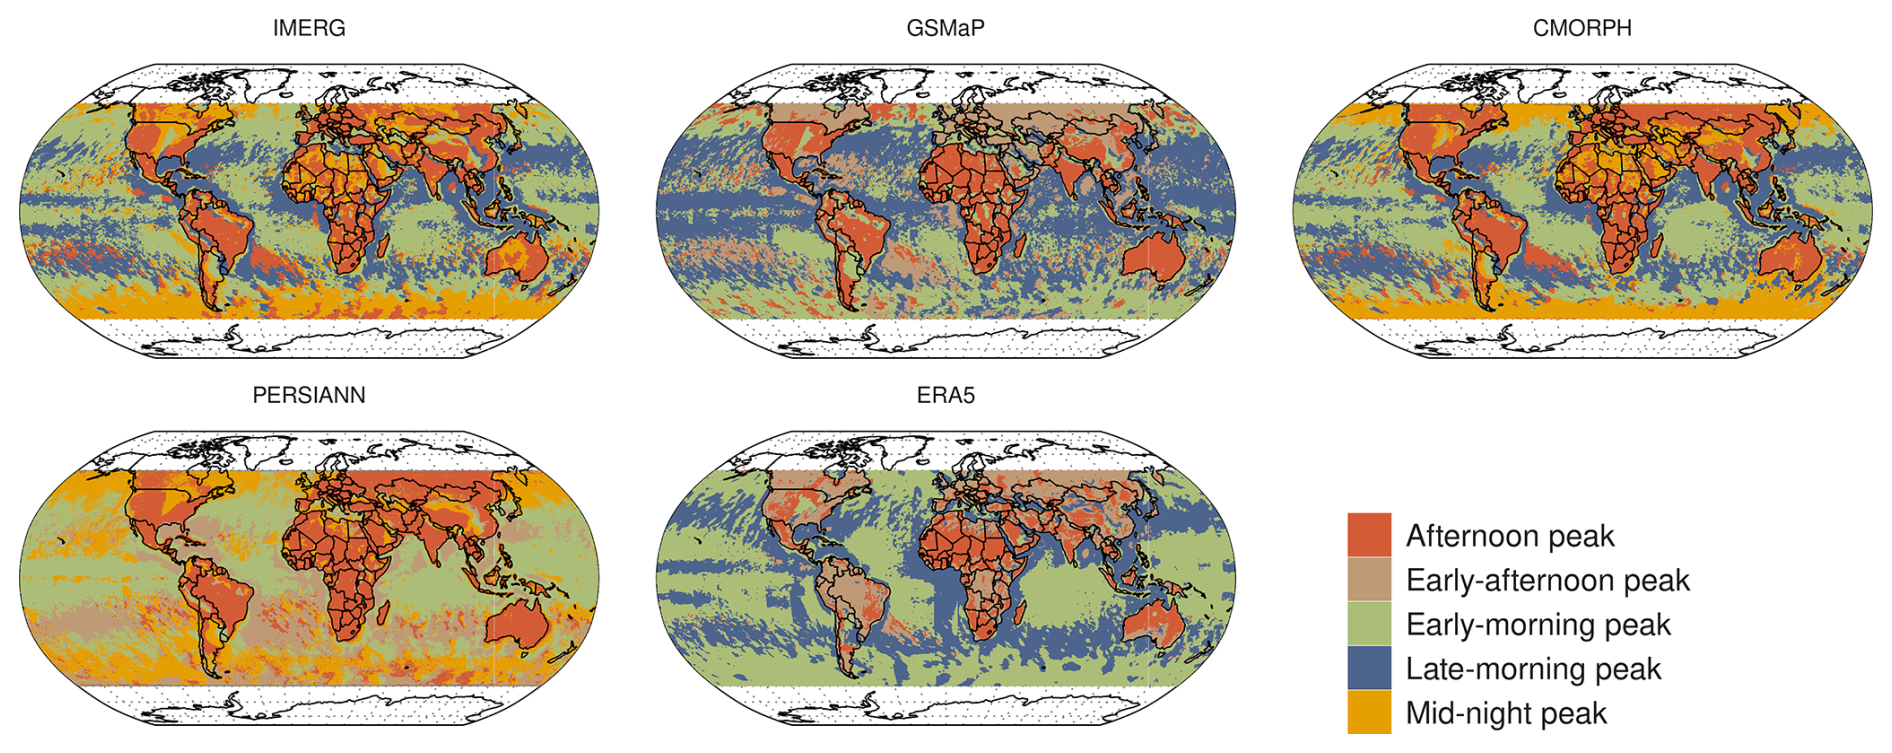
Figure 10Spatial distribution of K-means clustering (k=4) produced distinct clusters illustrating the diurnal variation shapes of mean hourly precipitation.
Our findings demonstrate that all the datasets agree in producing the broad spatial pattern and represent the major global precipitation features (e.g. high-precipitation ITCZ, SPCZ, and low-precipitation dry regions) across the globe. Nonetheless, regional inconsistencies do exist among them. This regional disagreement can be observed already through the latitudinal zonal precipitation. Additionally, the precipitation estimates among the products have shown some uncertainties in the dry regions such as the Sahara region, northern Africa, Asia, and the low-precipitation regions of the Atlantic and Pacific Ocean. Consistent with other studies (Sun et al., 2018; Cattani et al., 2016; Dinku et al., 2011), our findings highlight higher discrepancies among precipitation estimates for drier regions compared to humid regions. The lack of efficient ground observations over these dry and sparsely populated regions could contribute to the large observed uncertainties.
Another important aspect is the high uncertainty among the datasets over the Southern Hemisphere, especially within the latitudinal range of 30–60° S. Even though similar concerns have previously been reported, in particular over the Southern Ocean (Duque et al., 2023; Siems et al., 2022; Watters and Battaglia, 2021; Behrangi and Song, 2020), the exact reason for such behaviour is yet to be known. A fundamental challenge in this perspective is the lack of long-term, high-quality ground truth over the Southern Ocean (Siems et al., 2022). Furthermore, as reported by Behrangi and Song (2020), the Southern Ocean exhibits the highest precipitation frequency (40 %) in terms of zonal averages, and most of the precipitation occurs in the form of light precipitation. As the accurate detection of light precipitation is a persistent problem among the satellite and reanalysis datasets, this could be another probable reason for such discrepancies among them. Additionally, due to fundamental disparities in landmass distribution between the hemispheres, the Southern Ocean experiences distinct influences from atmospheric and oceanic circulation. This results in the formation of unique cloud and precipitation systems, contributing to variations in the intensity and frequency of precipitation when compared to the Northern Hemisphere (Siems et al., 2022). The large inconsistencies among the products over these regions highlight the need for further studies exploring the physical mechanism behind such behaviours.
As previously stated, ERA5, being a reanalysis product, exhibits a slight deviation in behaviour compared to satellite estimates, featuring high frequency and low intensity. To further confirm that ERA5's overestimation of frequency is mainly contributed by the light precipitation events, we conducted our analyses using different thresholds for the definition of wet time intervals (0.2 and 0.5 mm h−1). The results (Fig. S2 in the Supplement) illustrate that as the precipitation threshold increases, the overestimation of the ERA5 frequency gradually decreases, and the variation between datasets decreases, confirming the challenge of ERA5 in estimating light precipitation events. Indeed, the “drizzle problem”, characterized by excessively frequent low-intensity precipitation, is a prevalent pattern consistently observed in model simulations (Dai and Trenberth, 2004). It is mainly attributed to poor representation of convection and model characterizations (e.g. moist convection, planetary boundary layer schemes in atmospheric models) (Watters et al., 2021). In particular, for ERA5, these high-frequency and low-intensity behaviours have already been reported across the regions, i.e, eastern China (Qin et al., 2021), the Tibetan Plateau (Hu and Yuan, 2021; Chen et al., 2013), eastern Himalaya (Kumar et al., 2021), Alpine basins over Italy (Shrestha et al., 2023), Africa (Terblanche et al., 2022), Southern Ocean (Duque et al., 2023), among others. Most of the above studies further reported that although ERA5 overestimates the frequency due to its low intensity, it is in better agreement with the total amount of precipitation. In fact, Duque et al. (2023) also found that despite the high-frequency and low-intensity issues, ERA5 has a better estimate of total precipitation than IMERG over the southern oceanic region. This is probably related to a compensation of the underestimated high intensities (Qin et al., 2021).
Compared to other estimates, GSMaP shows the lowest mean precipitation over land, especially during peak hours between 14:00 and 19:00 LST (Fig. 5a). The underestimation of precipitation by GSMaP-MVK compared to the reference datasets is also found in India (−20 %) (Prakash et al., 2016). Similar results for GSMaP-MVK V-04 and V05 are also observed over China at the daily scale (Qin et al., 2014; Chen et al., 2015). GSMaP also appears to overestimate frequency, particularly over land (Fig. 5a), mainly due to the prevalence of light precipitation events (Fig. S2). This is consistent with Qin et al. (2014), who found an overestimation of 20 %–50 % of light precipitation events over China. Despite the overestimation of frequency, the underestimation of mean precipitation amount and intensity (Fig. 5c) suggests that GSMaP either misses the detection of heavy precipitation events or inadequately estimates their magnitude. Compared to CMORPH and IMERG, GSMaP was also found to perform worse against gauge data over Bangladesh (Roy and Banu, 2021). Additionally, the same authors note that GSMaP does not show any precipitation amounts greater than 20 mm, although some regions experience such events.
In contrast, the superior performance of GSMaP-V07 (gauge-corrected) compared to IMERG-F-V06 (underestimation) is also reported over Luzon compared to the reference datasets (Lee and Huang, 2023). The GSMaP products are also found to be satisfactory in diurnal cycle estimation over the Indonesian Maritime Continents (Ramadhan et al., 2023). On the other hand, Hsu et al. (2021) found that IMERG-E (V06) is better than GSMaP (V07) near-real-time products in estimating the diurnal cycle of precipitation over Taiwan. Given the contradictory findings that vary by region, product version, and evaluation scale (sub-daily/daily/monthly), it is challenging to conclude whether IMERG overestimates the precipitation features or GSMaP underestimates them.
The early-peak hours of the diurnal cycle by ERA5 are also consistently reported by previous studies (Hayden et al., 2023; Chen et al., 2023; Watters et al., 2021). The early-peak bias in ERA5 could be mainly attributed to an ineffective representation of the convection in the parameterization schemes (Chen et al., 2023). In particular, the premature convection in the tropics could be the probable reason (Watters et al., 2021). In contrast, the peak of mean precipitation amount in PERSIANN (16:00 LST) shows a slight delay compared to the IMERG (15:00 LST) over land (Fig. 5a), which is consistent with the results by Pfeifroth et al. (2016), who reported a 2 h delay by PERSIANN over western Africa. They attributed the delay to the infrared-based estimation of precipitation by PERSIANN. The convective clouds in tropical regions primarily precipitate during their early development stages, with less precipitation occurring later when a high, cold ice shield persists. Infrared estimates, relying on cloud top temperature, may tend to overestimate precipitation during the later stages of the convective cloud life cycle.
In addition, PERSIANN tends to overestimate precipitation amounts from the afternoon onwards (15:00–21:00 LST), particularly over land, while it remains the lowest over the ocean (Fig. 5a). Similar results are also observed by Choumbou et al. (2021) over Central Africa, where they find that PERSIANN overestimates the mean precipitation amount over the Sahel, Cameroon highlands, and Congo basin but underestimates over the Atlantic Ocean compared to TRMM. In fact, the PERSIANN overestimation of precipitation over Africa can also be observed in Fig. S3 in the Supplement (sharp peak between 10–15° N over land during JJA). This is consistent with the finding of Pfeifroth et al. (2016) over western Africa, especially over the Niamey mesosite, where PERSIANN estimates more than twice the precipitation amount compared to the reference. Unlike PERSIANN, CMORPH has overall consistent performance with IMERG, likely due to the incorporation of similar PMW estimates. Moreover, CMORPH also provides a realistic estimation of the diurnal cycle of precipitation in various regions of the world, e.g. China (Chen et al., 2018), Africa (Pfeifroth et al., 2016), South America (Giles et al., 2020), North America, and global levels (Janowiak et al., 2005; Tang et al., 2021).
Furthermore, similar to the previous studies, our results also report some unique diurnal regional features across the globe. For example, one such instance is the eastward shift of the diurnal peak over the central United States (Tan et al., 2019). All the estimates depict the nocturnal peaks across the Great Plains, a unique feature of the US diurnal cycle. Nevertheless, unlike the IMERG, GSMaP, CMORPH and, to some extent, PERSIANN, the changes in peak hours by ERA5 exhibit minimal spatial variation (Fig. 6). Another example can be seen in the Amazon region, where ERA5 does not exhibit spatial variation in the peak hour of precipitation amount but instead shows a widespread noon peak hour between 11:00–12:00 LST (Fig. 6). In contrast, the remaining satellite estimates show substantial spatial variation in the peak hour across the Amazon basin, which is especially more pronounced in GSMaP. These results are consistent with those observed by Hayden et al. (2023) and Tai et al. (2021) for ERA5 over the Amazon region. They further attributed that in ERA5, the precipitation pattern was mainly influenced by the solar cycle rather than finer-scale phenomena (e.g. cold pools), which occur at resolutions finer than those of the model.
Moreover, while all the results are presented in comparison with IMERG, it is important to note that this does not imply that IMERG is considered an accurate reference. Although studies have shown that IMERG can be considered a reference for the evaluation of other diurnal precipitation estimates globally (O and Kirstetter, 2018; Watters et al., 2021; Tang et al., 2021), it is not error-free and still exhibits considerable discrepancies in certain regions (O and Kirstetter, 2018). Nonetheless, the results of O and Kirstetter (2018) are based on IMERG V04, whereas the IMERG version V06 has shown significant improvements over the earlier ones, i.e. IMERG V06 has a very short lag (average +0.59 h) over the eastern United States (Tan et al., 2019).
This study compared four state-of-the-art satellite products and one reanalysis precipitation data product at the sub-daily scale. In particular, it compared the diurnal variation of precipitation estimates in terms of mean precipitation amount, frequency, and intensity at the global level. The main findings of the analysis are as follows:
-
Overall, all products are more consistent in producing spatial patterns of mean hourly precipitation amount than frequency and intensity.
-
The discrepancies among the datasets are most pronounced at high latitudes (30 to 60° N/S) compared to the tropical regions (0 to 30° N/S). The agreement among the estimates is higher in the Northern Hemisphere than in the Southern Hemisphere. In particular, the discrepancies are larger at the latitudes between 35 and 60° S, which could be mainly due to the prevalence of oceans in the Southern Hemisphere.
-
ERA5 significantly overestimates the precipitation frequency and is characterized by very low intensity compared to the rest of the precipitation products. GSMaP also depicts very low precipitation intensity, which is more pronounced over land than the ocean.
-
All datasets effectively capture the major diurnal features: an afternoon peak over land and an early-morning peak over the ocean. In terms of inter-product comparison, ERA5 detects the peak slightly earlier, around 15:00 LST over land, compared to the other datasets, which peak at 16:00 LST. Moreover, ERA5 tends to overestimate the amount of precipitation compared to IMERG and PERSIANN estimates, while CMORPH and GSMaP consistently show lower values.
-
In terms of diurnal frequency, ERA5 precipitation frequency is significantly higher than the rest of the estimates, regardless of whether it is over land, over the ocean, or at the global level. However, compared to the land, the high frequencies seem way more dominant over the ocean.
-
Different from precipitation mean and frequency, precipitation intensity exhibits a weaker diurnal cycle. ERA5 displays the lowest precipitation intensity among the estimates, while CMORPH exhibits the highest. Surprisingly, GSMaP also shows the lowest intensity among the datasets, even lower than ERA5 over land.
-
All the estimates have smaller discrepancies in the peak hour of mean precipitation amount than in the peak hour of frequency and intensity. The highest discrepancies among the datasets of peak hours are observed mainly over the Southern Ocean.
-
The K-means clustering results also depict that all the estimates are consistent in reproducing the early-morning peak over the ocean and the afternoon peak over land. Moreover, the IMERG and CMORPH estimates exhibit a high degree of agreement in terms of diurnal shapes, producing similar patterns. However, the remaining products show variations in their diurnal shapes.
Our study comes with certain limitations that pave the way for future research. The analysis is carried out at the 0.25°×0.25° resolution, and hence some uncertainties could be associated with the re-gridding, especially for IMERG and GSMaP, which are available at the original resolution of 0.1°×0.1°. Therefore, future studies could consider the IMERG and GSMaP products and evaluate their diurnal variation at their original resolutions. Future studies could also consider the duration of precipitation to gain more comprehensive insights into how the different precipitation durations have distinct diurnal variations and the mechanism behind each precipitation structure. In addition, the diurnal variation of different precipitation intensities will provide further insights.
One potential direction for future research involves examining the effects of major changes introduced in the recent IMERGV07 version compared to its predecessor (V06). In addition, considering the application-oriented importance of near-real-time satellite datasets, such as IMERG-Early, Late runs, and GSMaP near-real-time version (GSMaP-NRT), assessing their capability and identifying uncertainties in their representation of the diurnal cycle can offer additional perspectives, particularly for regions where these datasets could be potentially applied. Furthermore, a notable limitation of our current analysis is the strict filtering criteria applied, leading to the exclusion of various precipitation datasets available at very high spatial and temporal resolutions but limited to land (e.g. ERA5land). Therefore, forthcoming research endeavours could incorporate these high-resolution products to provide more detailed insights into the uncertainties associated with estimating diurnal precipitation.
Overall, the study provides an overview of the agreement and disagreement among the precipitation products at a sub-daily scale on a global level, rather than making claims about the superiority of any one product. The results indicate that all the satellite estimates exhibit a high degree of consistency in certain aspects such as reproducing the overall diurnal pattern and peak hour of maximum precipitation throughout the globe. The unique regional features produced (e.g. nocturnal peaks across the Great Plain, Amazon region, Tibetan Plateau), especially by the PERSIANN and CMORPH, indicate that these products can also be adapted to better understand the diurnal cycle of global precipitation. The ERA5 reanalysis estimates, although it produces the diurnal pattern consistent with the remote sensing estimates, show pronounced regional differences, and thus care should be taken. Moreover, our results help to identify regions suitable for employing any of the aforementioned products with minimal impact on outcomes, alongside areas necessitating cautious consideration when applying such datasets. Therefore, this study highlights the importance of integration of multiple sources of datasets and caution in relying on individual precipitation products for a comprehensive understanding and accurate analysis of global precipitation dynamics. In addition, this is the first study to present the diurnal cycle on a global scale, using an ensemble of satellite estimates and reanalysis products covering 2 decades of data. Moreover, this could be considered a global-scale reference for quantifying uncertainties in the representation of the diurnal precipitation from the global precipitation datasets.
The data compiled herein and the R code for the figures are publicly available at https://doi.org/10.5281/zenodo.11398184 (Kumar Pradhan, 2024).
The supplement related to this article is available online at https://doi.org/10.5194/hess-29-4929-2025-supplement.
RKP: conceptualization, formal analysis, investigation, writing (original draft). YM: conceptualization, supervision, writing (review and editing). FM: conceptualization, supervision, writing (review and editing). EIN: writing (review and editing). SMP: writing (review and editing). VL: writing (review and editing).
The contact author has declared that none of the authors has any competing interests.
Publisher's note: Copernicus Publications remains neutral with regard to jurisdictional claims made in the text, published maps, institutional affiliations, or any other geographical representation in this paper. While Copernicus Publications makes every effort to include appropriate place names, the final responsibility lies with the authors.
Rajani Kumar Pradhan was supported by the Internal Grant Agency (project no. 2023B0028), Czech University of Life Sciences Prague. Yannis Markonis and Rajani Kumar Pradhan were supported by the project “Investigation of Terrestrial HydrologicAl Cycle Acceleration (ITHACA)”, funded by the Czech Science Foundation (grant 22-33266M).
This research has been supported by the Česká Zemědělská Univerzita v Praze (grant nos. 2023B0028 and 22-33266M).
This paper was edited by Alexander Gruber and reviewed by Ehsan Sharifi and Martina Kauzlaric.
Afonso, J. M. d. S., Vila, D. A., Gan, M. A., Quispe, D. P., Barreto, N. d. J. d. C., Huamán Chinchay, J. H., and Palharini, R. S. A.: Precipitation Diurnal Cycle Assessment of Satellite-Based Estimates over Brazil, Remote Sens., 12, 2339, https://doi.org/10.3390/rs12142339, 2020. a, b
Bai, H. and Schumacher, C.: Topographic Influences on Diurnally Driven MJO Rainfall Over the Maritime Continent, J. Geophys. Res.-Atmos., 127, e2021JD035905, https://doi.org/10.1029/2021JD035905, 2022. a
Beck, H. E., Pan, M., Roy, T., Weedon, G. P., Pappenberger, F., van Dijk, A. I. J. M., Huffman, G. J., Adler, R. F., and Wood, E. F.: Daily evaluation of 26 precipitation datasets using Stage-IV gauge-radar data for the CONUS, Hydrol. Earth Syst. Sci., 23, 207–224, https://doi.org/10.5194/hess-23-207-2019, 2019. a, b
Behrangi, A. and Song, Y.: A new estimate for oceanic precipitation amount and distribution using complementary precipitation observations from space and comparison with GPCP, Environ. Res. Lett., 15, 124042, https://doi.org/10.1088/1748-9326/abc6d1, 2020. a, b
Behrangi, A., Lebsock, M., Wong, S., and Lambrigtsen, B.: On the quantification of oceanic rainfall using spaceborne sensors, J. Geophys. Res.-Atmos., 117, https://doi.org/10.1029/2012JD017979, 2012. a
Berndt, C. and Haberlandt, U.: Spatial interpolation of climate variables in Northern Germany – Influence of temporal resolution and network density, J. Hydrol.: Regional Studies, 15, 184–202, https://doi.org/10.1016/j.ejrh.2018.02.002, 2018. a
Cattani, E., Merino, A., and Levizzani, V.: Evaluation of monthly satellite-derived precipitation products over East Africa, J. Hydrometeorol., 17, 2555–2573, 2016. a
Chen, G., Iwasaki, T., Qin, H., and Sha, W.: Evaluation of the Warm-Season Diurnal Variability over East Asia in Recent Reanalyses JRA-55, ERA-Interim, NCEP CFSR, and NASA MERRA, J. Climate, 27, 5517–5537, https://doi.org/10.1175/JCLI-D-14-00005.1, 2014. a
Chen, G., Sha, W., Iwasaki, T., and Wen, Z.: Diurnal Cycle of a Heavy Rainfall Corridor over East Asia, Mon. Weather Rev., 145, 3365–3389, https://doi.org/10.1175/MWR-D-16-0423.1, 2017. a
Chen, G., Lan, R., Zeng, W., Pan, H., and Li, W.: Diurnal Variations of Rainfall in Surface and Satellite Observations at the Monsoon Coast (South China), J. Climate, 31, 1703–1724, https://doi.org/10.1175/JCLI-D-17-0373.1, 2018. a
Chen, P., Chen, A., Yin, S., Li, Y., and Liu, J.: Clustering the Diurnal Cycle of Precipitation Using Global Satellite Data, Geophys. Res. Lett., 51, e2024GL111513, https://doi.org/10.1029/2024GL111513, 2024. a
Chen, T., Li, J., Zhang, Y., Chen, H., Li, P., and Che, H.: Evaluation of Hourly Precipitation Characteristics from a Global Reanalysis and Variable-Resolution Global Model over the Tibetan Plateau by Using a Satellite-Gauge Merged Rainfall Product, Remote Sens., 15, 1013, https://doi.org/10.3390/rs15041013, 2023. a, b
Chen, Y., Ebert, E. E., Walsh, K. J., and Davidson, N. E.: Evaluation of TMPA 3B42 daily precipitation estimates of tropical cyclone rainfall over Australia, J. Geophys. Res.-Atmos., 118, 11–966, 2013. a
Chen, Z., Qin, Y., Shen, Y., and Zhang, S.: Evaluation of Global Satellite Mapping of Precipitation Project Daily Precipitation Estimates over the Chinese Mainland, Adv. Meteorol., 2016, e9365294, https://doi.org/10.1155/2016/9365294, 2015. a
Choumbou, P. C., Komkoua Mbienda, A. J., Guenang, G. M., Monkam, D., and Mkankam Kamga, F.: Investigating the diurnal cycle of precipitation over Central Africa, Meteorological Applications, 28, e2014, https://doi.org/10.1002/met.2014, 2021. a
Dai, A. and Trenberth, K. E.: The Diurnal Cycle and Its Depiction in the Community Climate System Model, J. Climate, 17, 930–951, https://doi.org/10.1175/1520-0442(2004)017<0930:TDCAID>2.0.CO;2, 2004. a, b
Dai, A., Lin, X., and Hsu, K.-L.: The frequency, intensity, and diurnal cycle of precipitation in surface and satellite observations over low- and mid-latitudes, Clim. Dynam., 29, 727–744, https://doi.org/10.1007/s00382-007-0260-y, 2007. a, b, c
Dezfuli, A. K., Ichoku, C. M., Huffman, G. J., Mohr, K. I., Selker, J. S., van de Giesen, N., Hochreutener, R., and Annor, F. O.: Validation of IMERG Precipitation in Africa, J. Hydrometeorol., 18, 2817–2825, https://doi.org/10.1175/JHM-D-17-0139.1, 2017. a, b
Dinku, T., Ceccato, P., and Connor, S. J.: Challenges of satellite rainfall estimation over mountainous and arid parts of east Africa, International Journal of Remote Sens., 32, 5965–5979, 2011. a
Duque, E. M., Huang, Y., May, P. T., and Siems, S. T.: An Evaluation of IMERG and ERA5 Quantitative Precipitation Estimates over the Southern Ocean Using Shipborne Observations, J. Appl. Meteorol. Climatol., 62, 1479–1495, https://doi.org/10.1175/JAMC-D-23-0039.1, 2023. a, b, c
Giles, J. A., Ruscica, R. C., and Menéndez, C. G.: The diurnal cycle of precipitation over South America represented by five gridded datasets, Int. J. Climatol., 40, 668–686, https://doi.org/10.1002/joc.6229, 2020. a
Grecu, M., Olson, W. S., Munchak, S. J., Ringerud, S., Liao, L., Haddad, Z., Kelley, B. L., and McLaughlin, S. F.: The GPM Combined Algorithm, J. Atmos. Ocean. Tech., 33, 2225–2245, https://doi.org/10.1175/JTECH-D-16-0019.1, 2016. a
Haile, A. T., Habib, E., Elsaadani, M., and Rientjes, T.: Inter-comparison of satellite rainfall products for representing rainfall diurnal cycle over the Nile basin, International J. Appl. Earth Obs., 21, 230–240, https://doi.org/10.1016/j.jag.2012.08.012, 2013. a
Hayden, L., Tan, J., Bolvin, D., and Huffman, G.: Variations in the Diurnal Cycle of Precipitation and its Changes with Distance from Shore Over Two Contrasting Regions as Observed by IMERG, ERA5, and Spaceborne Ku Radar, J. Hydrometeorol., https://doi.org/10.1175/JHM-D-22-0154.1, 2023. a, b, c, d, e, f
Hersbach, H., Bell, B., Berrisford, P., Hirahara, S., Horányi, A., Muñoz-Sabater, J., Nicolas, J., Peubey, C., Radu, R., Schepers, D., Simmons, A., Soci, C., Abdalla, S., Abellan, X., Balsamo, G., Bechtold, P., Biavati, G., Bidlot, J., Bonavita, M., De Chiara, G., Dahlgren, P., Dee, D., Diamantakis, M., Dragani, R., Flemming, J., Forbes, R., Fuentes, M., Geer, A., Haimberger, L., Healy, S., Hogan, R. J., Hólm, E., Janisková, M., Keeley, S., Laloyaux, P., Lopez, P., Lupu, C., Radnoti, G., de Rosnay, P., Rozum, I., Vamborg, F., Villaume, S., and Thépaut, J.-N.: The ERA5 global reanalysis, Q. J. Roy. Meteor. Soc., 146, 1999–2049, https://doi.org/10.1002/qj.3803, 2020. a, b, c
Hong, T., Li, H., and Chen, M.: Comprehensive Evaluations on the Error Characteristics of the State-of-the-Art Gridded Precipitation Products Over Jiangxi Province in 2019, Earth and Space Science, 8, e2021EA001787, https://doi.org/10.1029/2021EA001787, 2021. a
Hsu, J., Huang, W.-R., and Liu, P.-Y.: Performance assessment of GPM-based near-real-time satellite products in depicting diurnal precipitation variation over Taiwan, J. Hydrol.: Regional Studies, 38, 100957, https://doi.org/10.1016/j.ejrh.2021.100957, 2021. a
Hsu, K.-L., Gao, X., Sorooshian, S., and Gupta, H. V.: Precipitation Estimation from Remotely Sensed Information Using Artificial Neural Networks, J. Appl. Meteorol. Climatol., 36, 1176–1190, https://doi.org/10.1175/1520-0450(1997)036<1176:PEFRSI>2.0.CO;2, 1997. a, b
Hu, X. and Yuan, W.: Evaluation of ERA5 precipitation over the eastern periphery of the Tibetan plateau from the perspective of regional rainfall events, Int. J. Climatol., 41, 2625–2637, https://doi.org/10.1002/joc.6980, 2021. a
Huffman, G. J., Bolvin, D. T., Braithwaite, D., Hsu, K., Joyce, R., Kidd, C., Nelkin, E. J., and Xie, P.: NASA Global Precipitation Measurement (GPM) Integrated Multi-satellitE Retrievals for GPM (IMERG), Algorithm theoretical basis document (ATBD) version 4, https://gpm.nasa.gov/sites/default/files/document_files/IMERG_ATBD_V4.5.pdf (last access: 2 February 2024), 2015. a, b, c, d
Huffman, G. J., Bolvin, D. T., Braithwaite, D., Hsu, K.-L., Joyce, R. J., Kidd, C., Nelkin, E. J., Sorooshian, S., Stocker, E. F., Tan, J., Wolff, D. B., and Xie, P.: Integrated Multi-satellite Retrievals for the Global Precipitation Measurement (GPM) Mission (IMERG), in: Satellite Precipitation Measurement: Volume 1, edited by: Levizzani, V., Kidd, C., Kirschbaum, D. B., Kummerow, C. D., Nakamura, K., and Turk, F. J., Springer International Publishing, Cham, 343–353, https://doi.org/10.1007/978-3-030-24568-9_19, 2020. a
Janowiak, J. E., Kousky, V. E., and Joyce, R. J.: Diurnal cycle of precipitation determined from the CMORPH high spatial and temporal resolution global precipitation analyses, J. Geophys. Res.-Atmos., 110, https://doi.org/10.1029/2005JD006156, 2005. a, b
Jiang, Q., Li, W., Fan, Z., He, X., Sun, W., Chen, S., Wen, J., Gao, J., and Wang, J.: Evaluation of the ERA5 reanalysis precipitation dataset over Chinese Mainland, J. Hydrol., 595, 125660, https://doi.org/10.1016/j.jhydrol.2020.125660, 2021. a, b
Joyce, R. J. and Xie, P.: Kalman Filter–Based CMORPH, J. Hydrometeorol., 12, 1547–1563, https://doi.org/10.1175/JHM-D-11-022.1, 2011. a
Joyce, R. J., Janowiak, J. E., Arkin, P. A., and Xie, P.: CMORPH: A Method that Produces Global Precipitation Estimates from Passive Microwave and Infrared Data at High Spatial and Temporal Resolution, J. Hydrometeorol., 5, 487–503, https://doi.org/10.1175/1525-7541(2004)005<0487:CAMTPG>2.0.CO;2, 2004. a, b
Keller, J. D. and Wahl, S.: Representation of Climate in Reanalyses: An Intercomparison for Europe and North America, J. Climate, 34, 1667–1684, https://doi.org/10.1175/JCLI-D-20-0609.1, 2021. a
Kubota, T., Aonashi, K., Ushio, T., Shige, S., Takayabu, Y. N., Kachi, M., Arai, Y., Tashima, T., Masaki, T., Kawamoto, N., Mega, T., Yamamoto, M. K., Hamada, A., Yamaji, M., Liu, G., and Oki, R.: Global Satellite Mapping of Precipitation (GSMaP) Products in the GPM Era, in: Satellite Precipitation Measurement, vol. 67, edited by: Levizzani, V., Kidd, C., Kirschbaum, D. B., Kummerow, C. D., Nakamura, K., and Turk, F. J., Springer International Publishing, Cham, 355–373, https://doi.org/10.1007/978-3-030-24568-9_20, 2020. a
Kumar, M., Hodnebrog, Ø., Sophie Daloz, A., Sen, S., Badiger, S., and Krishnaswamy, J.: Measuring precipitation in Eastern Himalaya: Ground validation of eleven satellite, model and gauge interpolated gridded products, J. Hydrol., 599, 126252, https://doi.org/10.1016/j.jhydrol.2021.126252, 2021. a, b
Kumar Pradhan, R.: HESS_paper_data, Zenodo [data set], https://doi.org/10.5281/zenodo.11398184, 2024. a
Lee, C.-A. and Huang, W.-R.: Advantages of GSMaP Data for Multi-Timescale Precipitation Estimation in Luzon, Earth and Space Science, 10, e2023EA002980, https://doi.org/10.1029/2023EA002980, 2023. a
Levizzani, V., Kidd, C., Kirschbaum, D. B., Kummerow, C. D., Nakamura, K., and Turk, F. J. (Eds.): Satellite Precipitation Measurement: Volume 1, vol. 67 of Advances in Global Change Research, Springer International Publishing, Cham, https://doi.org/10.1007/978-3-030-24568-9, 2020a. a
Levizzani, V., Kidd, C., Kirschbaum, D. B., Kummerow, C. D., Nakamura, K., and Turk, F. J. (Eds.): Satellite Precipitation Measurement: Volume 2, vol. 69 of Advances in Global Change Research, Springer International Publishing, Cham, https://doi.org/10.1007/978-3-030-35798-6, 2020b. a
Li, R., Wang, K., and Qi, D.: Validating the Integrated Multisatellite Retrievals for Global Precipitation Measurement in Terms of Diurnal Variability With Hourly Gauge Observations Collected at 50 000 Stations in China, J. Geophys. Res.-Atmos., 123, https://doi.org/10.1029/2018JD028991, 2018. a
Li, X., Chen, S., Liang, Z., Huang, C., Li, Z., and Hu, B.: Performance Assessment of GSMaP and GPM IMERG Products during Typhoon Mangkhut, Atmosphere, 12, 134, https://doi.org/10.3390/atmos12020134, 2021. a
Lu, D. and Yong, B.: Evaluation and Hydrological Utility of the Latest GPM IMERG V5 and GSMaP V7 Precipitation Products over the Tibetan Plateau, Remote Sens., 10, 2022, https://doi.org/10.3390/rs10122022, 2018. a
Lv, X., Guo, H., Tian, Y., Meng, X., Bao, A., and De Maeyer, P.: Evaluation of GSMaP Version 8 Precipitation Products on an Hourly Timescale over Mainland China, Remote Sens., 16, 210, https://doi.org/10.3390/rs16010210, 2024. a
Marra, F., Armon, M., and Morin, E.: Coastal and orographic effects on extreme precipitation revealed by weather radar observations, Hydrol. Earth Syst. Sci., 26, 1439–1458, https://doi.org/10.5194/hess-26-1439-2022, 2022. a
Marzuki, M., Suryanti, K., Yusnaini, H., Tangang, F., Muharsyah, R., Vonnisa, M., and Devianto, D.: Diurnal variation of precipitation from the perspectives of precipitation amount, intensity and duration over Sumatra from rain gauge observations, Int. J. Climatol., 41, 4386–4397, https://doi.org/10.1002/joc.7078, 2021. a
McClean, F., Dawson, R., and Kilsby, C.: Intercomparison of global reanalysis precipitation for flood risk modelling, Hydrol. Earth Syst. Sci., 27, 331–347, https://doi.org/10.5194/hess-27-331-2023, 2023. a
Mega, T., Ushio, T., Takahiro, M., Kubota, T., Kachi, M., and Oki, R.: Gauge-Adjusted Global Satellite Mapping of Precipitation, IEEE Transactions on Geoscience and Remote Sens., 57, 1928–1935, https://doi.org/10.1109/TGRS.2018.2870199, 2019. a, b
Nguyen, P., Shearer, E. J., Tran, H., Ombadi, M., Hayatbini, N., Palacios, T., Huynh, P., Braithwaite, D., Updegraff, G., Hsu, K., Kuligowski, B., Logan, W. S., and Sorooshian, S.: The CHRS Data Portal, an easily accessible public repository for PERSIANN global satellite precipitation data, Scientific Data, 6, 180296, https://doi.org/10.1038/sdata.2018.296, 2019. a
Ning, S., Song, F., Udmale, P., Jin, J., Thapa, B. R., and Ishidaira, H.: Error Analysis and Evaluation of the Latest GSMap and IMERG Precipitation Products over Eastern China, Adv. Meteorol., 2017, e1803492, https://doi.org/10.1155/2017/1803492, 2017. a, b
Nogueira, M.: Inter-comparison of ERA-5, ERA-interim and GPCP rainfall over the last 40 years: Process-based analysis of systematic and random differences, J. Hydrol., 583, 124632, https://doi.org/10.1016/j.jhydrol.2020.124632, 2020. a
O, S. and Kirstetter, P.-E.: Evaluation of diurnal variation of GPM IMERG-derived summer precipitation over the contiguous US using MRMS data, Q. J. Roy. Meteor. Soc., 144, 270–281, https://doi.org/10.1002/qj.3218, 2018. a, b, c, d, e, f
Ou, T., Chen, D., Tang, J., Lin, C., Wang, X., Kukulies, J., and Lai, H.-W.: Wet bias of summer precipitation in the northwestern Tibetan Plateau in ERA5 is linked to overestimated lower-level southerly wind over the plateau, Clim. Dynam., 61, 2139–2153, https://doi.org/10.1007/s00382-023-06672-3, 2023. a
Pfeifroth, U., Trentmann, J., Fink, A. H., and Ahrens, B.: Evaluating Satellite-Based Diurnal Cycles of Precipitation in the African Tropics, J. Appl. Meteorol. Climatol., 55, 23–39, https://doi.org/10.1175/JAMC-D-15-0065.1, 2016. a, b, c, d
Pradhan, R. K., Markonis, Y., Godoy, M. R. V., Villalba-Pradas, A., Andreadis, K. M., Nikolopoulos, E. I., Papalexiou, S. M., Rahim, A., Tapiador, F. J., and Hanel, M.: Review of GPM IMERG performance: A global perspective, Remote Sens. Environ., 268, 112754, https://doi.org/10.1016/j.rse.2021.112754, 2022. a
Prakash, S., Mitra, A. K., Rajagopal, E. N., and Pai, D. S.: Assessment of TRMM-based TMPA-3B42 and GSMaP precipitation products over India for the peak southwest monsoon season, Int. J. Climatol., 36, 1614–1631, https://doi.org/10.1002/joc.4446, 2016. a
Protat, A., Klepp, C., Louf, V., Petersen, W. A., Alexander, S. P., Barros, A., Leinonen, J., and Mace, G. G.: The Latitudinal Variability of Oceanic Rainfall Properties and Its Implication for Satellite Retrievals: 1. Drop Size Distribution Properties, J. Geophys. Res.-Atmos., 124, 13291–13311, https://doi.org/10.1029/2019JD031010, 2019. a
Qin, S., Wang, K., Wu, G., and Ma, Z.: Variability of hourly precipitation during the warm season over eastern China using gauge observations and ERA5, Atmospheric Research, 264, 105872, https://doi.org/10.1016/j.atmosres.2021.105872, 2021. a, b, c, d
Qin, Y., Chen, Z., Shen, Y., Zhang, S., and Shi, R.: Evaluation of Satellite Rainfall Estimates over the Chinese Mainland, Remote Sens., 6, 11649–11672, https://doi.org/10.3390/rs61111649, 2014. a, b
Ramadhan, R., Marzuki, M., Yusnaini, H., Muharsyah, R., Tangang, F., Vonnisa, M., and Harmadi, H.: A Preliminary Assessment of the GSMaP Version 08 Products over Indonesian Maritime Continent against Gauge Data, Remote Sens., 15, 1115, https://doi.org/10.3390/rs15041115, 2023. a, b
Roca, R., Haddad, Z. S., Akimoto, F. F., Lisa, A., Behrangi, A., George, H., Kato, S., Kirstetter, P.-E., Kubota, T., Kummerow, C., Tristan, L., Levizzani, V., Maggioni, V., Massari, C., Masunaga, H., Schröder, M., Tapiador, F. J., Turk, F. J., and Utsumi, N.: The Joint IPWG/GEWEX Precipitation Assessment, https://doi.org/10.13021/GEWEX.PRECIP, 2021. a, b
Roy, D. and Banu, S.: Comparison of Satellite Derived Rainfall Estimations: CMORPH, IMERG and GSMaP with Observed Precipitation, American J. Climate Change, 10, 407–421, https://doi.org/10.4236/ajcc.2021.104021, 2021. a
Ruiz-Hernández, J.-C., Condom, T., Ribstein, P., Le Moine, N., Espinoza, J.-C., Junquas, C., Villacís, M., Vera, A., Muñoz, T., Maisincho, L., Campozano, L., Rabatel, A., and Sicart, J.-E.: Spatial variability of diurnal to seasonal cycles of precipitation from a high-altitude equatorial Andean valley to the Amazon Basin, J. Hydrol.: Regional Studies, 38, 100924, https://doi.org/10.1016/j.ejrh.2021.100924, 2021. a
Salles, L., Satgé, F., Roig, H., Almeida, T., Olivetti, D., and Ferreira, W.: Seasonal Effect on Spatial and Temporal Consistency of the New GPM-Based IMERG-v5 and GSMaP-v7 Satellite Precipitation Estimates in Brazil's Central Plateau Region, Water, 11, 668, https://doi.org/10.3390/w11040668, 2019. a
Sapiano, M. R. P. and Arkin, P. A.: An Intercomparison and Validation of High-Resolution Satellite Precipitation Estimates with 3-Hourly Gauge Data, J. Hydrometeorol., 10, 149–166, https://doi.org/10.1175/2008JHM1052.1, 2009. a
Schneider, U., Becker, A., Finger, P., Meyer-Christoffer, A., Ziese, M., and Rudolf, B.: GPCC's new land surface precipitation climatology based on quality-controlled in situ data and its role in quantifying the global water cycle, Theoretical and Applied Climatology, 115, 15–40, https://doi.org/10.1007/s00704-013-0860-x, 2014. a
Sharifi, E., Eitzinger, J., and Dorigo, W.: Performance of the State-Of-The-Art Gridded Precipitation Products over Mountainous Terrain: A Regional Study over Austria, Remote Sens., 11, 2018, https://doi.org/10.3390/rs11172018, 2019. a
Shawky, M., Moussa, A., Hassan, Q. K., and El-Sheimy, N.: Performance Assessment of Sub-Daily and Daily Precipitation Estimates Derived from GPM and GSMaP Products over an Arid Environment, Remote Sens., 11, 2840, https://doi.org/10.3390/rs11232840, 2019. a
Shrestha, S., Zaramella, M., Callegari, M., Greifeneder, F., and Borga, M.: Scale Dependence of Errors in Snow Water Equivalent Simulations Using ERA5 Reanalysis over Alpine Basins, Climate, 11, 154, https://doi.org/10.3390/cli11070154, 2023. a
Siems, S. T., Huang, Y., and Manton, M. J.: Southern Ocean precipitation: Toward a process-level understanding, WIREs Climate Change, 13, e800, https://doi.org/10.1002/wcc.800, 2022. a, b, c
Skofronick-Jackson, G., Petersen, W. A., Berg, W., Kidd, C., Stocker, E. F., Kirschbaum, D. B., Kakar, R., Braun, S. A., Huffman, G. J., Iguchi, T., Kirstetter, P. E., Kummerow, C., Meneghini, R., Oki, R., Olson, W. S., Takayabu, Y. N., Furukawa, K., and Wilheit, T.: The Global Precipitation Measurement (GPM) Mission for Science and Society, B. Am. Meteorol. Soc., 98, 1679–1695, https://doi.org/10.1175/BAMS-D-15-00306.1, 2017. a
Sorooshian, S., Hsu, K.-L., Gao, X., Gupta, H. V., Imam, B., and Braithwaite, D.: Evaluation of PERSIANN System Satellite-Based Estimates of Tropical Rainfall, B. Am. Meteorol. Soc., 81, 2035–2046, https://doi.org/10.1175/1520-0477(2000)081<2035:EOPSSE>2.3.CO;2, 2000. a
Sun, Q., Miao, C., Duan, Q., Ashouri, H., Sorooshian, S., and Hsu, K.-L.: A Review of Global Precipitation Data Sets: Data Sources, Estimation, and Intercomparisons, Rev. Geophys., 56, 79–107, https://doi.org/10.1002/2017RG000574, 2018. a, b
Tai, S.-L., Feng, Z., Ma, P.-L., Schumacher, C., and Fast, J. D.: Representations of Precipitation Diurnal Cycle in the Amazon as Simulated by Observationally Constrained Cloud-System Resolving and Global Climate Models, J. Adv. Model. Earth Sy., 13, e2021MS002586, https://doi.org/10.1029/2021MS002586, 2021. a
Tan, J., Huffman, G. J., Bolvin, D. T., and Nelkin, E. J.: Diurnal Cycle of IMERG V06 Precipitation, Geophys. Res. Lett., 46, 13584–13592, https://doi.org/10.1029/2019GL085395, 2019. a, b, c, d
Tang, G., Clark, M. P., Papalexiou, S. M., Ma, Z., and Hong, Y.: Have satellite precipitation products improved over last two decades? A comprehensive comparison of GPM IMERG with nine satellite and reanalysis datasets, Remote Sens. Environ., 240, 111697, https://doi.org/10.1016/j.rse.2020.111697, 2020. a
Tang, S., Gleckler, P., Xie, S., Lee, J., Ahn, M.-S., Covey, C., and Zhang, C.: Evaluating the Diurnal and Semidiurnal Cycle of Precipitation in CMIP6 Models Using Satellite- and Ground-Based Observations, J. Climate, 34, 3189–3210, https://doi.org/10.1175/JCLI-D-20-0639.1, 2021. a, b
Tao, C., Xie, S., Ma, H.-Y., Bechtold, P., Cui, Z., Vaillancourt, P. A., Van Weverberg, K., Wang, Y.-C., Wong, M., Yang, J., Zhang, G. J., Choi, I.-J., Tang, S., Wei, J., Wu, W.-Y., Zhang, M., Neelin, J. D., and Zeng, X.: Diurnal cycle of precipitation over the tropics and central United States: intercomparison of general circulation models, Q. J. Roy. Meteor. Soc., 150, 911–936, https://doi.org/10.1002/qj.4629, 2024. a
Terblanche, D., Lynch, A., Chen, Z., and Sinclair, S.: ERA5-Derived Precipitation: Insights from Historical Rainfall Networks in Southern Africa, J. Appl. Meteorol. Climatol., 61, 1473–1484, https://doi.org/10.1175/JAMC-D-21-0096.1, 2022. a
Thiessen, A. H.: Precipitation Averages for Large Areas, Mon. Weather Rev., 39, 1082–1089, https://doi.org/10.1175/1520-0493(1911)39<1082b:PAFLA>2.0.CO;2, 1911. a
Trenberth, K. E., Zhang, Y., and Gehne, M.: Intermittency in Precipitation: Duration, Frequency, Intensity, and Amounts Using Hourly Data, J. Hydrometeorol., 18, 1393–1412, https://doi.org/10.1175/JHM-D-16-0263.1, 2017. a
Wang, C., Graham, R. M., Wang, K., Gerland, S., and Granskog, M. A.: Comparison of ERA5 and ERA-Interim near-surface air temperature, snowfall and precipitation over Arctic sea ice: effects on sea ice thermodynamics and evolution, The Cryosphere, 13, 1661–1679, https://doi.org/10.5194/tc-13-1661-2019, 2019. a
Wang, J., Yuan, H., Wang, X., Cui, C., and Wang, X.: Impact of Thermally Forced Circulations on the Diurnal Cycle of Summer Precipitation Over the Southeastern Tibetan Plateau, Geophys. Res. Lett., 50, e2022GL100951, https://doi.org/10.1029/2022GL100951, 2023. a
Watters, D. and Battaglia, A.: The Summertime Diurnal Cycle of Precipitation Derived from IMERG, Remote Sens., 11, 1781, https://doi.org/10.3390/rs11151781, 2019. a, b
Watters, D. and Battaglia, A.: The NASA-JAXA Global Precipitation Measurement mission – part II: New frontiers in precipitation science, Weather, 76, 52–56, https://doi.org/10.1002/wea.3869, 2021. a
Watters, D., Battaglia, A., and Allan, R.: The Diurnal Cycle of Precipitation According to Multiple Decades of Global Satellite Observations, Three CMIP6 Models, and the ECMWF Reanalysis, J. Climate, https://doi.org/10.1175/JCLI-D-20-0966.1, 2021. a, b, c, d, e, f, g, h, i, j
Weng, P., Tian, Y., Jiang, Y., Chen, D., and Kang, J.: Assessment of GPM IMERG and GSMaP daily precipitation products and their utility in droughts and floods monitoring across Xijiang River Basin, Atmospheric Research, 286, 106673, https://doi.org/10.1016/j.atmosres.2023.106673, 2023. a, b
Xiao, C., Yuan, W., and Yu, R.: Diurnal cycle of rainfall in amount, frequency, intensity, duration, and the seasonality over the UK, Int. J. Climatol., 38, 4967–4978, https://doi.org/10.1002/joc.5790, 2018. a
Xie, P., Chen, M., and Shi, W.: CPC unified gauge-based analysis of global daily precipitation (2010–90annual_24hydro), https://ams.confex.com/ams/90annual/techprogram/paper_163676.htm (last access: 2 February 2024), 2010. a
Xie, P., Joyce, R., Wu, S., Yoo, S.-H., Yarosh, Y., Sun, F., and Lin, R.: Reprocessed, Bias-Corrected CMORPH Global High-Resolution Precipitation Estimates from 1998, J. Hydrometeorol., 18, 1617–1641, https://doi.org/10.1175/JHM-D-16-0168.1, 2017. a
Yang, S. and Smith, E. A.: Mechanisms for Diurnal Variability of Global Tropical Rainfall Observed from TRMM, J. Climate, 19, 5190–5226, https://doi.org/10.1175/JCLI3883.1, 2006. a, b, c, d
Zhang, T., Yang, Y., Dong, Z., and Gui, S.: A Multiscale Assessment of Three Satellite Precipitation Products (TRMM, CMORPH, and PERSIANN) in the Three Gorges Reservoir Area in China, Adv. Meteorol., 2021, e9979216, https://doi.org/10.1155/2021/9979216, 2021. a
Zhou, Z., Guo, B., Xing, W., Zhou, J., Xu, F., and Xu, Y.: Comprehensive evaluation of latest GPM era IMERG and GSMaP precipitation products over mainland China, Atmospheric Research, 246, 105132, https://doi.org/10.1016/j.atmosres.2020.105132, 2020. a