the Creative Commons Attribution 4.0 License.
the Creative Commons Attribution 4.0 License.
 | 01 Oct 2025
Multi-scale water balance analysis of a thawing boreal peatland complex near the southern permafrost limit in northwestern Canada
Alexandre Lhosmot
Gabriel Hould Gosselin
Manuel Helbig
Julien Fouché
Youngryel Ryu
Matteo Detto
Ryan Connon
William Quinton
Tim Moore
Oliver Sonnentag
Permafrost thaw profoundly changes landscapes in the Arctic-boreal region, affecting ecosystem composition, structure, function and services and their hydrological controls. The water balance provides insights into water movement and distribution within a specific area and thus helps understand how different components of the hydrological cycle interact with each other. However, the water balances of small- (<101 km2) and meso-scale basins (101–103 km2) in thawing landscapes remain poorly understood. Here, we conducted an observational study in three small-scale basins (0.1–0.3 km2) of a thawing boreal peatland complex. The three small-scale basins were situated in the headwater portion of Scotty Creek, a meso-scale low-relief basin (drainage area estimated to range between 130–202 km2) near the southern permafrost limit in the Taiga Plains ecozone in northwestern Canada. By measuring water losses (discharge and evapotranspiration [ET]), inputs (rainfall [R] and snow water equivalent [SWE]) and storage change (ΔS), and by calculating runoff (Q), we (1) aimed to quantify the growing season water balances (May–September, 2014–2016) of the three small-scale headwater sub-basins. After (2) comparing monthly sub-basin and corresponding basin water losses through ET and Q, we aimed to (3) assess the long-term (1996–2022) annual basin water balances using publicly available observations of discharge (and thus calculated Q), R and SWE in combination with simulated ET. (1) Growing season water balance residuals (RES) for the sub-basins ranged from −81 to +122 mm. The monthly growing season water balance for the sub-basin for which all water balance components throughout the 3 year study period were recorded exhibited large positive RES for May (+117 to +176 mm), since it included late-winter SWE routinely estimated in late March right before snowmelt. In contrast, lower monthly and negative RES were obtained for June–September (−41 to 0 mm). For two sub-basins, we provide two different drainage area estimates, highlighting the challenges associated with automated terrain analysis using digital elevation models (DEMs) in low-relief landscapes. Drainage areas were similar for one sub-basin, but they exhibited a fivefold difference for the other. This discrepancy was attributed to the high degree of landscape heterogeneity and resulting hydrological connectivity, with implications for Q calculations and RES. (2) Spring freshet contributed 41 % to 100 % (sub-basins) and 50 % to 79 % (basin) of the April–September Q. Spring freshet peaks were comparable, except for the driest year (2014), when the basin Q was more than 10 times lower than in the sub-basins. At both scales, ET was the dominant source of water loss, more than twice Q. (3) Over the long term (1996–2022), the increase in the basin runoff ratio (the ratio of runoff to precipitation) from 1996 to 2012 (0.1 to 0.5) has been attributed to the increased connectivity of wetlands to the drainage network due to permafrost thaw. However, the smaller mean and more variable runoff ratio from 2013 to 2022 may be due to wetland drying and/or changes in precipitation patterns. Overall, we demonstrate how the hydrological responses of rapidly thawing boreal peatland complexes – at both the sub-basin and basin scales – are shaped by complex factors that extend beyond year-to-year changes in precipitation and ET. Long-term hydrological monitoring is crucial to identify and understand potential threshold effects (e.g. changes in land cover and hydrological connectivity) and ecohydrological feedbacks affecting the local (e.g. subsistence activities), regional (e.g. water storage) and global ecosystem services (e.g. carbon storage) provided by thawing boreal peatland complexes.
- Article
(3615 KB) - Full-text XML
-
Supplement
(2165 KB) - BibTeX
- EndNote


A large portion of the Arctic-boreal region is characterised by permafrost (perennially frozen ground). Understanding the interactions between permafrost-thaw-induced landscape changes and hydrological processes is critical for predicting changes in ecosystem composition, structure, function and services in response to climate change (Walvoord and Kurylyk, 2016). Permafrost coverage varies widely across the Arctic-boreal region and increases with latitude and/or altitude (Gruber, 2012). The maximum thickness of the seasonally thawed and hydrologically active layer above the permafrost generally decreases from the southern permafrost limit northwards (Ran et al., 2022). Active layer thickness, which is partly controlled by local climate, ecosystem characteristics and ground properties (e.g. porosity, water content) ranges approximately from more than 1 m (∼60° N) to less than 0.5 m (∼70° N) across Canada (Ran et al., 2022). Higher water content, by simultaneously increasing the latent heat of fusion during thaw and enhancing thermal conductivity, has an opposite effect on active layer thickness. The latent heat of fusion exerts a stronger control on active layer thickness, leading to a thinner active layer (Clayton et al., 2021). For example, in saturated peat deposits with a porosity of about 80 % at 61° N latitude, active layer thickness did not exceed 0.8 m (Connon et al., 2018).
In recent decades, the Arctic-boreal region has experienced a rapid increase in air temperature, up to four times greater than that seen on a global scale (Rantanen et al., 2022). This atmospheric warming has led to accelerated permafrost thaw (Biskaborn et al., 2019; Smith et al., 2022). Additional factors, including natural (e.g. wildfires) and anthropogenic disturbances (e.g. extractive activities; Foster et al., 2022; Klotz et al., 2023), were shown to increase ground heat flux, accelerating permafrost warming and thaw (Gibson et al., 2018; Li et al., 2021). Recent scientific advances have provided insights into the multifaceted and interdependent ecological, hydrological, atmospheric, and biogeochemical consequences of permafrost thaw (e.g. Burd et al., 2018; Carpino et al., 2021; Gordon et al., 2016; Quinton et al., 2019; St. Jacques and Sauchyn, 2009; Torre Jorgenson et al., 2013). In addition, permafrost thaw presents a substantial socio-environmental challenge in the 21st century (Pi et al., 2021; King et al., 2018). For example, accelerated permafrost thaw threatens local communities, infrastructure, and Indigenous livelihoods and cultural practices across the northern circumpolar permafrost region (Gibson et al., 2021; Langer et al., 2023).
From the hydrological and biogeochemical perspectives, permafrost thaw has the potential to cause changes in land cover and hydrological connectivity, and thus in how water and matter moves across and through the changing landscapes of the Arctic-boreal region (Box et al., 2019; Walvoord and Kurylyk, 2016; Wright et al., 2022). For example, thaw-induced changes in land cover and hydrological connectivity can potentially affect the composition and export of both particulate and dissolved organic carbon (Burd et al., 2018; Vonk et al., 2015), mercury methylation (Gordon et al., 2016) and sulfide oxidation and weathering (Kemeny et al., 2023). Additional complexity is added through changes in precipitation regimes, projected to shift from snow- to rainfall-dominated at least in parts of the Arctic-boreal region (He and Pomeroy, 2023; Thackeray et al., 2022). A better hydrological understanding of thawing landscapes in the Arctic-boreal region is crucial to predict the permafrost–carbon feedback strength at the global scale (Ramage et al., 2024; Schuur et al., 2022; Treat et al., 2024).
In the Taiga Plains ecozone of northwestern Canada, permafrost coverage increases from south to north, ranging from isolated (<10 % in areal extent), through sporadic (10 %–<50 %) and discontinuous (50 %–<90 %), to continuous (90 %–100 %) (Ecosystem Classification Group, 2007; Wright et al., 2022). There, a large portion of the low-relief landscape comprises boreal peatland complexes, including permafrost peat plateaus dominated by black spruce (Picea mariana) and permafrost-free, treeless wetlands resulting from surface subsidence due to ground ice melt (i.e. thermokarst; Wright et al., 2022). Such thermokarst wetlands form depressions and receive water from surrounding permafrost peat plateaus. Some thermokarst wetlands are connected to the drainage network and basin outlet through channel fens. Since the 1970s, the faster thaw rate of ground ice-rich permafrost has resulted in the expansion of thermokarst wetlands at the expense of permafrost peat plateaus, especially near the southern permafrost limit in the southern Taiga Plains (Chasmer and Hopkinson, 2017; Wright et al., 2022). There, permafrost thaw was found to be an equal driver of boreal forest loss as wildfire (Helbig et al., 2016a). For example, from 1970 to 2010, permafrost peat plateaus transformed into thermokarst wetlands at rates ranging from 6.9 % to 11.6 % across 10 sites, each covering 10 km2 and spanning from 59°58′ N to 61°18′ N (Carpino et al., 2018). This prominent thaw-induced land cover change has increased hydrological connectivity across boreal peatland complexes (Connon et al., 2014, 2015; Quinton et al., 2019) and modified the water balances of small- and meso-scale basins, with areas of <101 km2 and 101–103 km2, respectively (Carey et al., 2010; Uhlenbrook et al., 2004).
Understanding the water balances of small- and meso-scale basins is essential for assessing hydrological responses at broader, regional scales (Evenson et al., 2018; Zhang et al., 2018). In the southern Taiga Plains and in other boreal regions in Canada, several studies have focused specifically on evapotranspiration (ET; Helbig et al., 2016b; Isabelle et al., 2018; Warren et al., 2018) or runoff (Q; Connon et al., 2014; Mack et al., 2021; St. Jacques and Sauchyn, 2009). In some studies, Q or water storage changes (ΔS) were obtained as water balance residuals (RES), or ET was estimated using a hydro-chemical method or an empirical equation (Barr et al., 2012; Bolton et al., 2004; Carey et al., 2010; Hayashi et al., 2004). However, studies that investigate the full water balance of small- to meso-scale basins in thawing boreal peatland complexes, with all water balance components measured, are lacking.
Here, we provide a multi-scale water balance analysis using field observations made in three small-scale basins of a thawing boreal peatland complex in the headwater portion of Scotty Creek, a meso-scale, low-relief basin near the southern permafrost limit in the Taiga Plains. The goal was to constrain the headwater sub-basin water balances in a basin context. Specifically, our three objectives were to
-
estimate daily sub-basin water losses (runoff and evapotranspiration), inputs (rainfall and snow water equivalent) and storage change to quantify sub-basin water balances over three growing seasons (May–September, 2014–2016),
-
examine sub-basin hydrological responses in a basin context by comparing monthly sub-basin and corresponding basin water losses through evapotranspiration and runoff, and
-
assess the long-term (1996–2022) annual basin water balance in relation to changes in land cover and hydrological connectivity.
2.1 Study site
Our study site is located within the headwater portion of the Scotty Creek basin (61°18′ N, 121°18′ W), which has been estimated to cover 130 km2 (this study) to 202 km2 (Water Survey of Canada, https://wateroffice.ec.gc.ca, last access: 31 May 2024). The basin lies approximately 50 km south of Fort Simpson, NT, in the sporadic permafrost zone of the southern Taiga Plains (Fig. 1a and b). The continental, subarctic climate of the Fort Simpson region is characterised by long, cold winters and short, dry summers. The climate normals (1981–2010), mean annual air temperature (Tair) and mean annual total precipitation (P), are −2.8 °C and 388 mm, respectively, of which 40 % falls as snow (data from the Fort Simpson Climate station, WMO ID: 71365, were gap-filled with data from the Fort Simpson A station, WMO ID: 71946, Environment and Climate Change Canada, https://climate.weather.gc.ca, last access: 31 May 2024). No significant difference in the snow water equivalent (SWE) between Fort Simpson and observations made in the headwater portion of Scotty Creek were found, suggesting that the Fort Simpson station is a good proxy for SWE at Scotty Creek (Connon et al., 2021). The snow-covered season usually begins in mid- to late October and lasts until mid- to late April or early May. The snow-covered season duration has shortened by 35 d between 1998 and 2014 (Chasmer and Hopkinson, 2017). It is estimated that the permafrost loss rate across the basin has increased from 0.19 % yr−1 (1970–2000) to 0.58 % yr−1 (2000–2015) since the 1970s (Chasmer and Hopkinson, 2017).
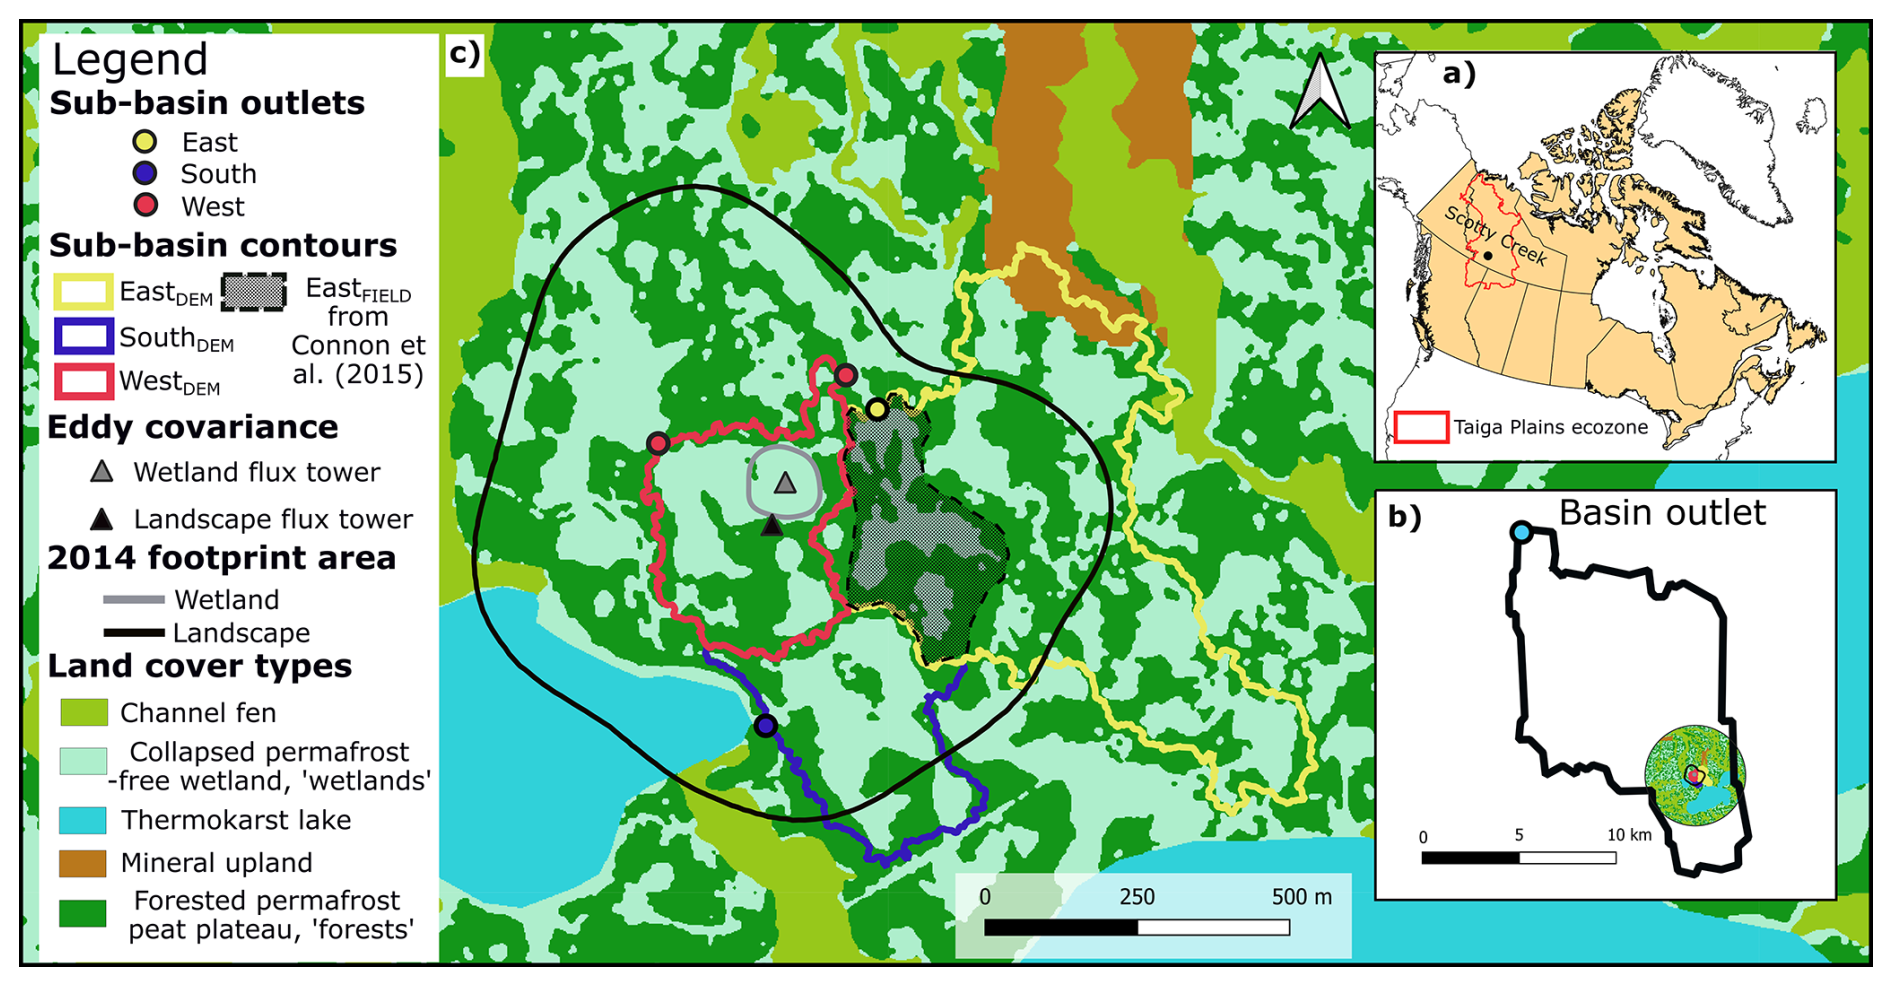
Figure 1(a) Scotty Creek basin location within the southern Taiga Plains ecozone. (b) Study site location within the headwater portion of the Scotty Creek basin. (c) Landscape (i.e. boreal peatland complex) and wetland (i.e. collapsed permafrost-free wetland) eddy covariance towers: 2014 flux footprint climatology (90 % contribution) (Helbig et al., 2016b). Contours of the three small-scale basins, i.e. the West, East, and South sub-basins, derived from automated terrain analysis using a digital elevation model (DEM; WestDEM, EastDEM and SouthDEM) and of the East sub-basin derived from field observations (EastFIELD, Connon et al., 2015). The land cover map is from Chasmer et al. (2014). The two outlets, South1 and South2, were located approximately 10 m apart, appearing as a single point.
Underlain by various glacial tills, silts, and clays deposited during the last glacial retreat (Aylesworth and Kettles, 2000), the relatively flat (mean slope: 0.3 %; Quinton et al., 2003) study site is dominated by low-lying peatland ecosystems, which are interspersed with well-drained mineral uplands. The forested mineral uplands are covered by trembling aspen (Populus tremuloides) and white spruce (Picea glauca). The low-lying peatland ecosystems include spatially extensive forested permafrost peat plateaus (“forests”), and permafrost-free thermokarst wetlands (“wetlands”) and lakes (Fig. 1c). Separated from the forests by narrow (a few metres), actively thawing forest–wetland transitions, the topographically lowered (0.5–1 m) wetlands and lakes receive some lateral inflow from the surrounding forests. The wetlands occur mainly as saturated treeless collapse features. Channel fens (a few 10s m in width) connect some of the wetlands to the drainage network and thus route water to the Scotty Creek basin outlet (Quinton et al., 2019; Fig. 1b).
The forest overstorey is dominated by black spruce (Picea mariana) interspersed with tamarack (Larix laricina). The forest understorey and ground cover is dominated by birch shrubs (Betula spp.), bog Labrador tea (Rhododendron groenlandicum), bog rosemary (Andromeda polifolia), reindeer lichen (Cladina spp.), feather moss (Pleurozium schreberi) and Sphagnum spp., respectively (Garon-Labrecque et al., 2016). Abiotic conditions (e.g. soil water content and temperature) change abruptly within a few metres across the transition from “drier and cooler” forests to “wetter and warmer” wetlands (Baltzer et al., 2014; Helbig et al., 2016b, 2017a, 2017b). Wetland vegetation in the collapse mostly includes Sphagnum spp. and ericaceous shrubs such as leatherleaf (Chamaedaphne calyculata) and pod-grass (Scheuchzeria palustris) in the wettest sections. The channel fens are dominated by herbaceous species, including scattered tamarack and glandular birch (Betula glandulosa), abundant seaside arrowgrass (Triglochin maritima) and bog buckbean (Menyanthes trifoliata), and some dense patches of Cyperaceae species. Channel ground cover is dominated by woolly feathermoss (Tomenthypnum nitens) and ribbed bog moss (Aulacomnium palustre).
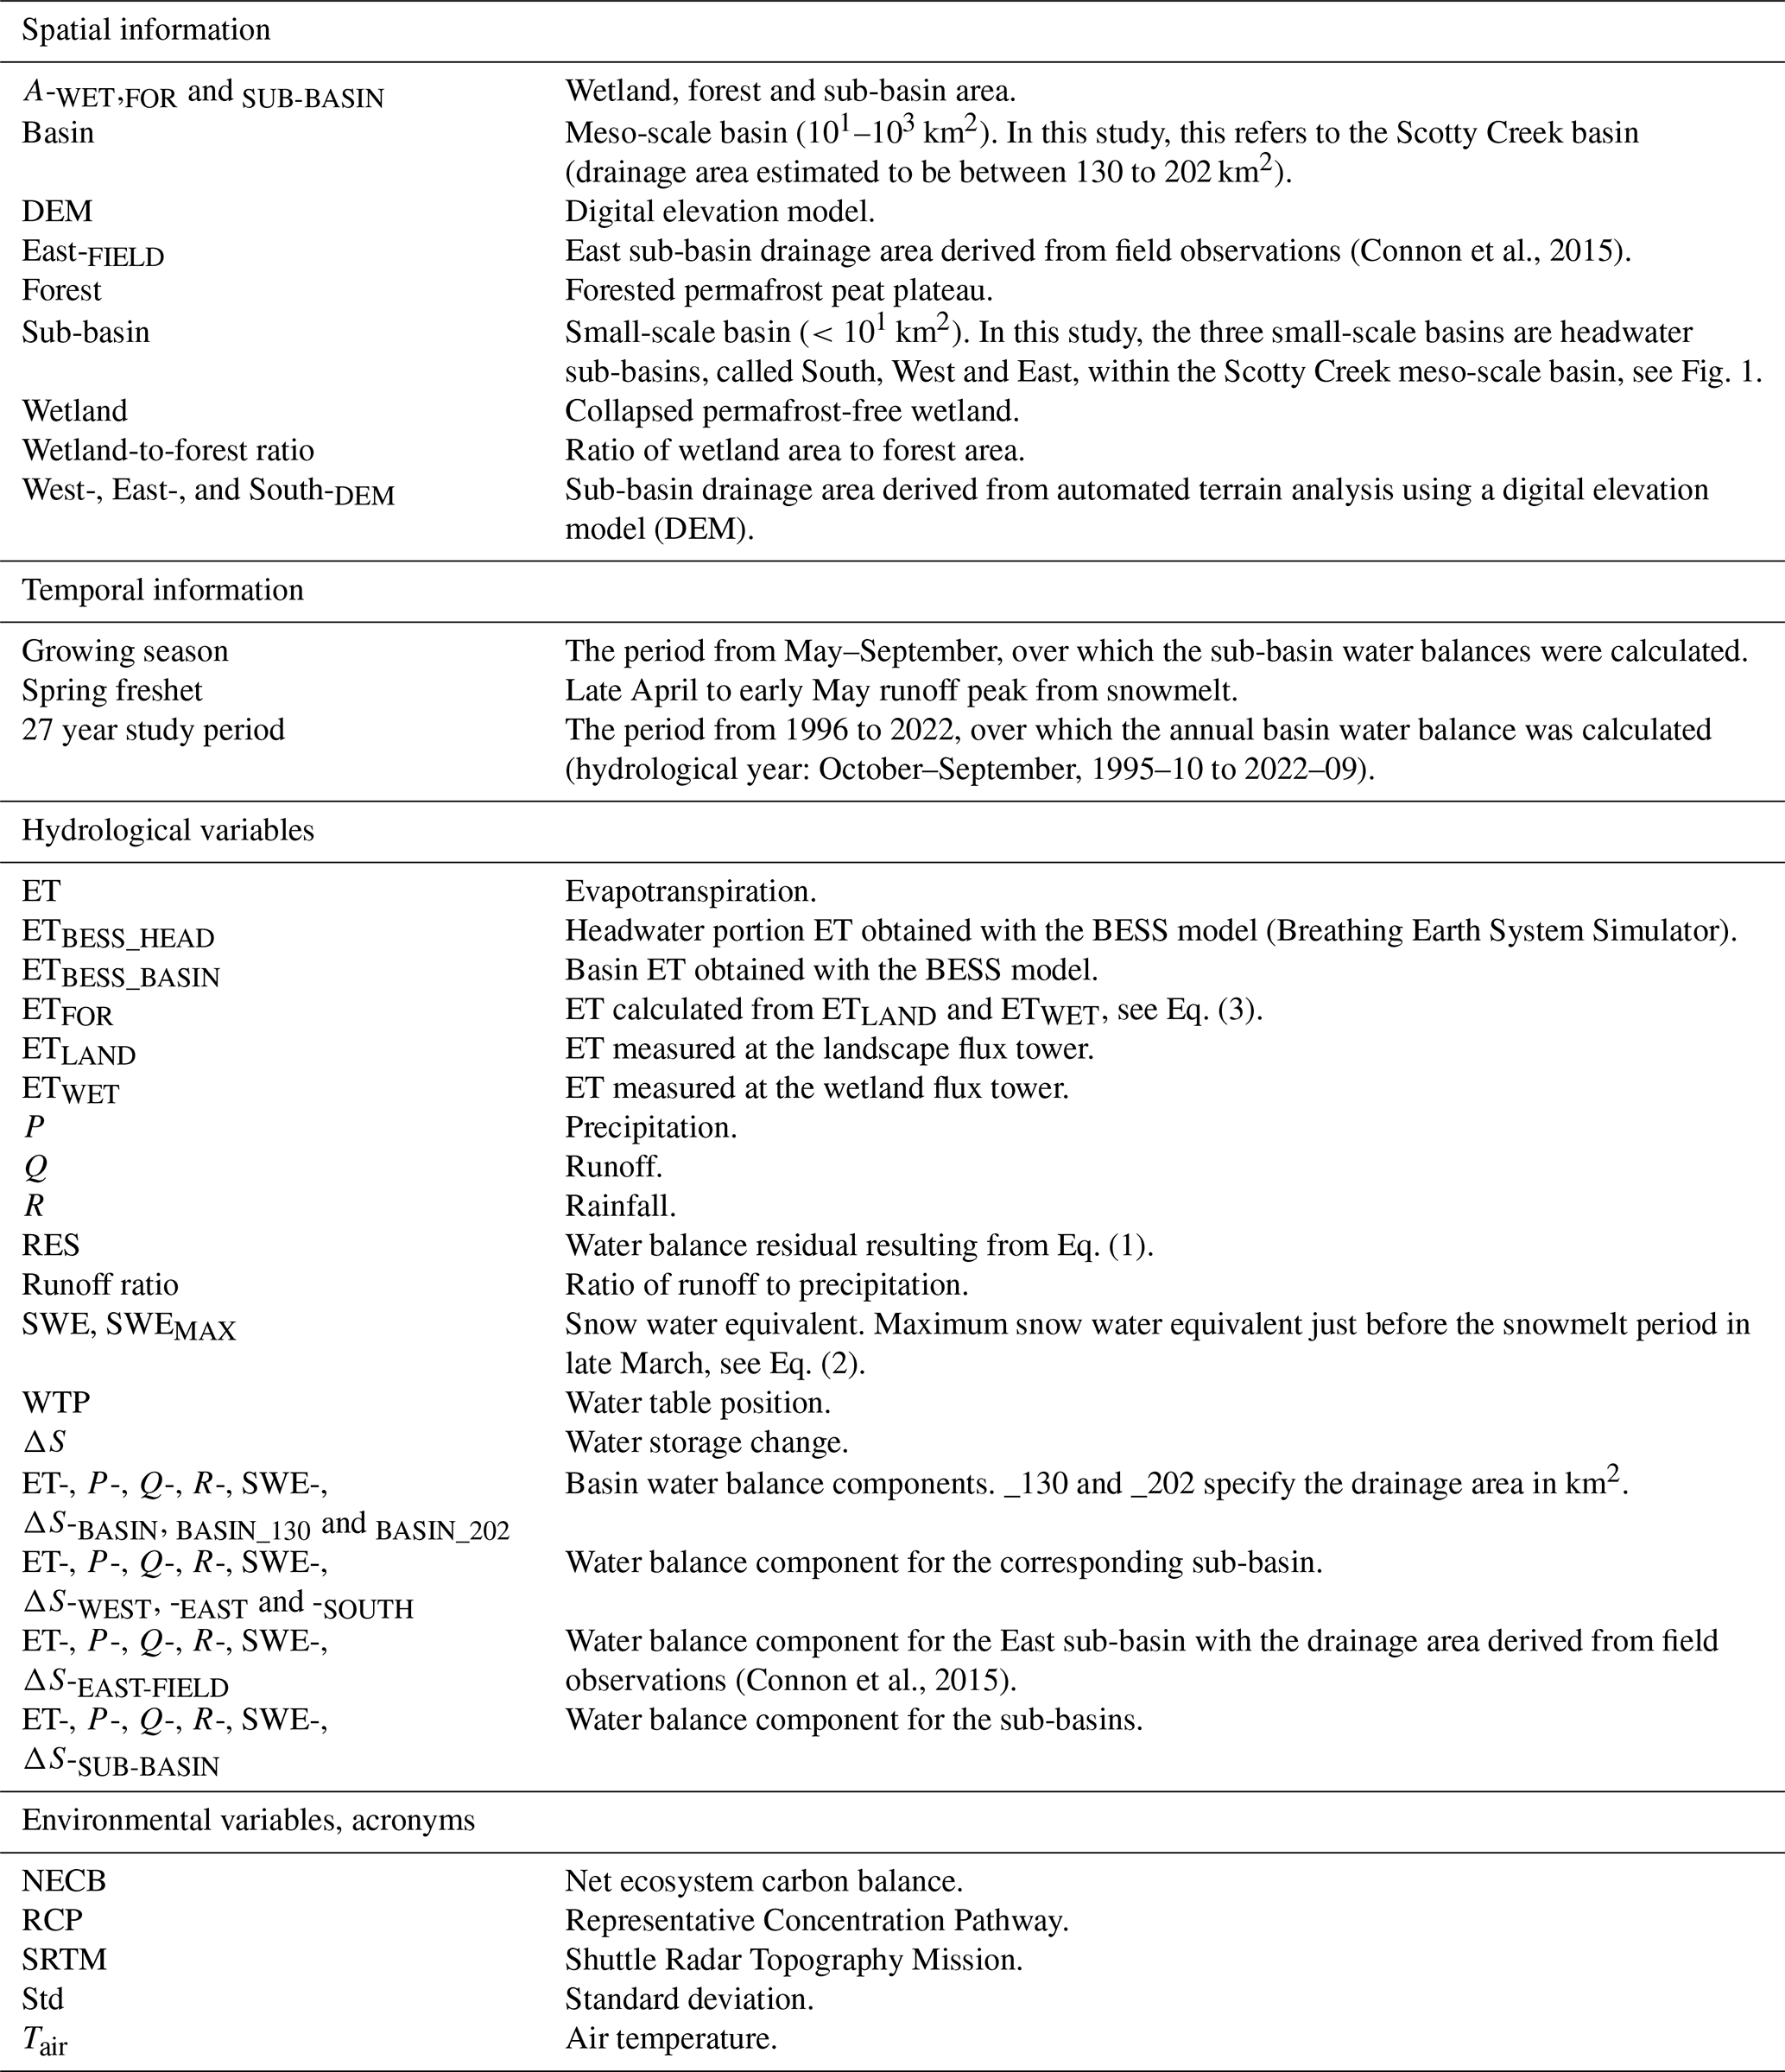
Peat thickness across the headwater portion of Scotty Creek is generally >3 m, and the mean (± one standard deviation [std]) organic carbon (C) stock was estimated as 167 ± 11 kg C m−2 (n=3; Pelletier et al., 2017). Forest permafrost thickness is <10 m (McClymont et al., 2013; Quinton et al., 2009), with a maximum active layer thickness in late August/early September of <1 m (Devoie et al., 2021). The mid to late growing season (June to late August/early September) wetland water table position (WTP) usually ranges between 0.1 and 0.2 m below the ground surface, respectively (Helbig et al., 2016b). Table A1 shows a list of all the variables and expressions used in this study, alongside the corresponding abbreviations and acronyms.
2.2 Sub-basin water balance: eddy covariance and supporting measurements
Boreal peatland complex (ETLAND; 2014–2016) and wetland evapotranspiration (ETWET; 2014–2016) were obtained from “nested” turbulent energy flux measurements using the eddy covariance technique (Baldocchi, 2014). Identical eddy covariance instrumentation was mounted at the top of a 15 m “landscape flux tower” (AmeriFlux-ID: CA-SCC) and at 1.9 m on a nearby (100 m) 2 m “wetland flux tower” (AmeriFlux-ID: CA-SCB; Fig. 1c). The instrumentation on each tower included a three-dimensional sonic anemometer (CSAT3A; Campbell Scientific Inc., Logan, UT) and an open-path carbon dioxide (CO2)/water vapour (H2O(g)) infrared gas analyser (EC150; Campbell Scientific Inc.) to measure high-frequency fluctuations (10 Hz) in vertical wind velocity and sonic temperature, and CO2 and H2O(g) molar densities, respectively. Due to instrument failure in the landscape flux tower, CO2 and H2O(g) molar densities were measured with an enclosed CO2/H2O(g) infrared gas analyser (LI7200; LI-COR Biosciences Inc., Lincoln, NE) between March and August 2015. Further details on the instrumentation set-up; the calibration and maintenance procedures; the data acquisition, processing and quality control; and the flux footprints calculation for the landscape and wetland flux towers are provided in Helbig et al. (2016b).
Supporting measurements on or near the landscape and wetland flux towers included incoming and outgoing short- and long-wave radiation (CNR4; Kipp & Zonen B.V., Delft, the Netherlands), rainfall (TR-525USW; Texas Instruments Inc., Dallas, TX), Tair and relative humidity (HC2-S3; Rotronic AG, Basserdorf, Switzerland), soil temperature and moisture along vertical profiles, and relative wetland WTP (OTT PLS; OTT Hydromet GmbH, Kempten, Germany; Levelogger Gold F15/M5, Solinst Canada Ltd., Georgetown, ON; HOBO U20 Water Level Data Logger, Onset Computer Corporation, Bourne, MA). Wetland volumetric water content at 5 cm depth was measured with water content reflectometers (CS616; Campbell Scientific Inc.) at a wetland location in each of the three sub-basins. The different low-frequency ancillary data streams were stored as 30 min block averages in an external storage device connected to additional data loggers (CR1000, CR3000; Campbell Scientific Inc.). Forest and wetland SWE were obtained from snow depth (metal ruler) and density measurements (Eastern Snow Conference [30 cm2 cross-sectional area] snow tube or snow sampler) along several representative forest and wetland transects during late March (i.e. late winter) snow surveys in 2014–2016 (Connon et al., 2015, 2021).
2.3 Sub-basin boundary delineation
The headwater portion of the Scotty Creek basin was studied based on three small-scale basins (“sub-basins”): West (two outlets, West1 and West2), East (one outlet) and South (two outlets, South1 and South2), together draining approximately 48 % of the landscape flux tower footprint area (Fig. 1c). The wetland flux tower footprint area was located within the West sub-basin. Delineating low-relief basin boundaries and thus drainage areas using automated terrain analysis remains challenging, and estimates tend to vary depending on the level of topographic detail in the digital elevation model (DEM) and the algorithm used (Al-Muqdadi and Merkel, 2011; Datta et al., 2022; Keys and Baade, 2019; Moges et al., 2023). In boreal peatland complexes, differences between “potential” and “effective” drainage areas may arise due to the presence of isolated wetlands disconnected from the drainage network and the basin outlet (Connon et al., 2015). We delineated the boundaries of potential drainage areas for the sub-basin outlets using a LiDAR-derived 1 m DEM using terrain analysis techniques implemented in the ArcGIS Hydrology toolset from the Spatial Analyst toolbox (version 10.2; Environmental Systems Research Institute, 2014; Chasmer et al., 2014). Considering the low-relief landscape, we verified the resulting sub-basin boundaries' plausibility (WestDEM, EastDEM and SouthDEM) through visual interpretation of 2010 WorldView-2 imagery (Chasmer et al., 2014). Questionable boundary sections were surveyed using a differential global positioning system (Leica SR530; Leica Geosystems, St. Gallen, Switzerland) in post-processing kinematic mode (centimetre accuracy). Based on a decision-tree land cover classification (Chasmer et al., 2014), WestDEM, EastDEM and SouthDEM were dominated by forests (including forest–wetland transitions) and wetlands (combined >95 %). The resulting drainage areas and wetland-to-forest ratios are 0.105 km2 (WestDEM), 0.328 km2 (EastDEM) and 0.099 km2 (SouthDEM), and 1.06 (WestDEM), 0.84 (EastDEM) and 1.24 (SouthDEM), respectively (Fig. 1c).
Focusing on the hydrological connections between individual wetlands and the sub-basin outlets, the boundaries of the effective drainage areas for the West and East sub-basins were delineated previously (WestFIELD and EastFIELD; Connon et al., 2015). These delineations were based on visual inspection of the same DEM and the 2010 WorldView-2 imagery used in the potential drainage area delineation described in the previous paragraph followed by extensive field observations. Permafrost ridges acting as barriers to water flow, and permafrost-free hydrological connections to channels around and between wetlands and the sub-basin outlets, were identified using a frost probe. All wetlands in the West sub-basin were hydrologically well-connected to the drainage network, resulting in similar drainage area estimates for WestFIELD (0.090 km2) and WestDEM (0.105 km2). In the East sub-basin, several isolated wetlands were not connected to the drainage network, resulting in a fivefold smaller drainage area estimate for EastFIELD (0.068 km2) compared to EastDEM (0.328 km2). We used both drainage area estimates for the East sub-basin, EastDEM and EastFIELD, to calculate sub-basin Q. The South sub-basin contained one individual wetland directly connected to the two outlets (Fig. 1c); thus, we expect the difference between effective and potential drainage area to be negligible (SouthFIELD≈SouthDEM).
2.4 Sub-basin water balance: discharge measurements
We estimated daily discharge (L d−1) as open water flow at five narrow (1–8 m in width) stream channel locations (= sub-basin outlets) in the vicinity of the landscape and wetland flux towers using rectangular cutthroat flumes (Fig. S1 in the Supplement). The flumes were constructed following open-source design plans (Siddiqui et al., 1996; Skogerboe et al., 1972) and were installed 0.8 m above the channel bottom on wooden damming structures to divert the flow of water through the flumes. At each flume, WTP was measured every 5 min and averaged and recorded every 30 min from April to late August/early September in 2014–2016 using vented pressure transducers (DCX-38 VG; Keller AG, Winterthur, Switzerland). Twelve rating curves to convert WTP to half-hour discharge estimates were obtained from manual discharge and WTP measurements made during and shortly after snowmelt in late April to early May (spring freshet) and late May (baseflow) in 2014–2016, respectively. For the West sub-basin, we used one rating curve per year for each of the two outlets (West1 and West2), thus using six rating curves in total. For the South sub-basin, we used one rating curve per year at the South1 outlet (thus using three rating curves in total) and a single rating curve at the South2 outlet, created in 2015 and used for all 3 years. The East sub-basin consisted of one outlet, which was monitored in 2014 and 2015, with one rating curve per year (no data was available for 2016).
Gaps in the half-hour discharge time series were filled in two steps. First, the half-hour WTP recorded at nearby upstream wetland locations within the respective sub-basin (Haynes et al., 2018) were used to construct monthly and growing season (May–September) proxy rating curves, based on non-gap-filled half-hour discharge for each flume in 2014–2016. At the West sub-basin, 79 % of the discharge data were gap-filled using the wetland WTP method. The mean coefficient of determination, R2, (± std) of the monthly linear relationships between the wetland and outlet WTP, calculated for the months with available data between May and September over the 3 years, was 0.70 ± 0.33 (n=8). In contrast, discharge gap-filled using the wetland WTP method accounted for only 3 % and 14 % of the discharge data for the East and South sub-basins, respectively. These monthly rating curves were then used to gap-fill the half-hour discharge time series. Growing season rating curves were used in case of insufficiently strong monthly proxy rating curves. Second, any remaining gaps (0 %, 9 % and 19 % of the data for the West, East and South sub-basins, respectively) due to missing upstream relative wetland WTP were gap-filled using linear regression analysis based on a mean 2014–2016 growing season proxy rating curve. Gap-filled half-hour discharge was summed to obtain daily discharge for the three sub-basins, which was converted to daily sub-basin runoff (QWEST, QEAST-FIELD, QEAST and QSOUTH; mm d−1) using the corresponding effective (EastFIELD only) and potential drainage areas (WestDEM, EastDEM and SouthDEM).
2.5 Basin water balance: data sets
We obtained several data sets for Scotty Creek spanning 27 hydrological years (October–September 1996–2022). Instantaneous discharge for the Scotty Creek basin outlet (Fig. 1b) along the Liard Highway (61°24′ N, 121°26′ W) is publicly available (Scotty Creek at Highway No. 7, 10ED009; Water Survey of Canada, wateroffice.ec.gc.ca). Daily P (mm d−1; R and SWE) are publicly available for the nearest weather station in Fort Simpson (Fort Simpson Climate station, WMO ID: 71365; Fort Simpson A station, WMO ID: 71946, see above). We obtained daily ET (mm d−1) for Scotty Creek (21 hydrological years: October–September 2001–2022) from the Breathing Earth System Simulator (BESS; Jiang and Ryu, 2016), a global biophysical model using seven atmosphere and land products from the Moderate Resolution Imaging Spectroradiometer (MODIS) instrument at a spatial resolution of 0.05° (Fig. S2 in the Supplement). We used the mean daily ET for the 2002–2022 period as the daily ET for the 1996–2001 period, i.e. the pre-MODIS era.
We delineated a drainage area for the Scotty Creek basin outlet from the publicly available 90 m DEM of the Shuttle Radar Topography Mission (SRTM, hole-filled SRTM for the globe version 4; Jarvis et al., 2008) using automated terrain analysis implemented in the ArcGIS Hydrology toolset from the Spatial Analyst toolbox (Environmental Systems Research Institute [esri], 2014). The terrain analysis derived potential drainage area was 130 km2, which is smaller than previously published drainage area estimates for the Scotty Creek basin outlet: 134 km2 (Burd et al., 2018), 139 km2 (Chasmer and Hopkinson, 2017), 150 km2 (Quinton et al., 2004), 152 km2 (Connon et al., 2014) and 202 km2 (Water Survey of Canada). For reproducibility and methodological consistency with the sub-basin drainage areas, the BESS model estimates of ET were averaged across Scotty Creek using the terrain derived drainage area (130 km2, this study). All data sets were temporally aggregated to monthly and annual (hydrological year: October–September) runoff (QBASIN), precipitation (PBASIN), SWE and rainfall (SWEBASIN, RBASIN) and evapotranspiration (ETBASIN). We used the lower (130 km2 (this study) and upper basin drainage area estimates (202 km2, Water Survey of Canada) to calculate QBASIN (QBASIN_130 and QBASIN_202, respectively).
2.6 Multi-scale water balance analysis
We calculated monthly (mm month−1; West sub-basin), growing season (mm per growing season; West, East and South sub-basins denoted as “WEST”, “EAST” and “SOUTH” subscripts) and annual (hydrological year: October–September, mm yr−1; Scotty Creek basin denoted as “BASIN” subscript) water balances as:
where ΔS is water storage change, rainfall (R) plus snow water equivalent (SWE) is total precipitation (P), and ET is evapotranspiration. Groundwater discharge from permafrost thaw was expected to be negligible (Connon et al., 2014; Quinton et al., 2019).
For simplicity, we loosely defined the growing season as the May–September period when actual measurements for all water balance components (Eq. 1) for the complete months were available. For example, the wetland WTP measurements start in May, because before then, the wells were frozen. Water table position was used to calculate ΔSSUB-BASIN, as we assumed that Q occurs from forests to the topographically lower wetlands (Wright et al., 2022). Therefore, we calculated ΔSSUB-BASIN for the West, East, and South sub-basins from the wetland ΔS, scaled by the sub-basin specific wetland area coverage (AWET). ΔSWET was calculated based on saturated and unsaturated peat layers using WTP variation, volumetric water content at 5 cm depth and peat porosity values at 3 cm (=0.92) and 15 cm (=0.86) from Isabelle et al. (2018).
Precipitation (PSUB-BASIN), including R and SWE in late March just before the start of snowmelt (i.e. SWEMAX), was obtained from rain gauge measurements () and calculated as a weighted mean for each sub-basin (SWEMAX_SUB-BASIN) according to sub-basin-specific cover areas (i.e. wetland [AWET] and forest areal coverage [AFOR]) and associated measured SWE from late-winter snow surveys (i.e. forest [SWEMAX_FOR] and wetland SWE [SWEMAX_WET]), respectively:
where ASUB-BASIN denotes the sub-basin area. We added SWESUB-BASIN to R in May, as we assumed that the main contribution of snow to the PSUB-BASIN, and thus to the growing season and annual water balances, occurred primarily through complete snowpack melting.
Mean energy balance closure fractions at the landscape and wetland flux towers were 0.70 (0.67, 0.72 and 0.72 from 2014 to 2016) and 0.67 (0.65, 0.69 and 0.68 from 2014 to 2016), respectively. To account for sensible (H; W m−2) and latent heat underestimation (LE; W m−2), we applied the closure fraction correction by preserving the Bowen ratio (H LE−1) to obtain the corrected LE (i.e. ET) (Barr et al., 2012; Isabelle et al., 2020). The closure fraction correction was calculated using 30 min average fluxes for the months of July–September, when the most complete energy flux data were available. Mean growing season forest and wetland flux footprint area contributions to ETLAND (corresponding to ETWEST) measured at the landscape flux tower were approximately 50 % each (Helbig et al., 2017a, 2016b; Warren et al., 2018; Fig. 1c). In contrast, the mean growing season footprint for ETWET consisted solely of wetland surrounding the tower (Helbig et al., 2016b; Warren et al., 2018). For the South and East sub-basins, we calculated forest ET (ETFOR, Eq. 3) using ETLAND and ETWET as:
Evapotranspiration for the South and East sub-basins was calculated as weighted means as for SWESUB-BASIN (Eq. 2). Sub-basin runoff (QSUB-BASIN) was obtained from daily discharge measurements and the corresponding sub-basin areas.
Annual basin water balances (mm yr−1, Eq. 1) were calculated using temporally aggregated precipitation (PBASIN) and rain (RBASIN) measurements from Fort Simpson (Fort Simpson Climate station, WMO ID: 71365; Fort Simpson A station, WMO ID: 71946), with snow water equivalent (SWEBASIN) simply calculated as PBASIN minus RBASIN, and ET estimates from the BESS model (ETBESS_BASIN). The ΔSBASIN was calculated as the difference between the water inputs (PBASIN) and outputs (QBASIN and ETBESS_BASIN) of Eq. (1). A positive value indicated an increase in the water stored in the basin, and vice versa.
We compared growing season monthly QSUB-BASIN and ETSUB-BASIN, both calculated as the means of the corresponding West, East and South sub-basin estimates, with QBASIN and ETBESS_BASIN, respectively, using ordinary least squares (OLS) regression analysis. The QBASIN and QSUB-BASIN used for this comparison were obtained from the drainage area derived from the automated terrain analysis of a DEM in this study. Similarly, we compared monthly ETLAND with headwater ET estimates from the BESS model (ETBESS_HEAD) using OLS regression analysis. The OLS regressions uncertainty was estimated using bootstrapping with 1000 iterations. The ET headwater estimates from the BESS model were calculated as the mean of four pixels, i.e. the pixel containing the landscape flux tower and three adjacent pixels representing the Scotty Creek headwater portion (Fig. S2). We examined the annual (hydrological year: October–September) hydrological balance components, i.e. QBASIN, PBASIN, RBASIN and SWEBASIN time series (1996–2022), and calculated the annual ratio of runoff to precipitation (the runoff ratio).
3.1 Meteorological conditions
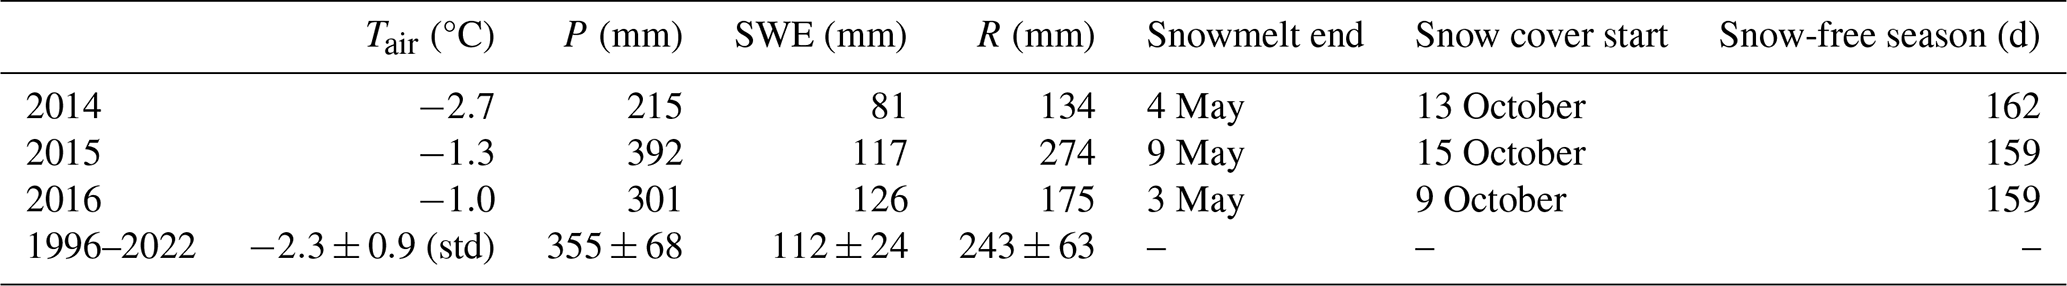
The annual mean Tair of the Fort Simpson region over the 3 year study period fell in the range of (2014) the 27 year mean (1996–2022, Table 1), or was higher (2015, 2016) than it. The first year of the 3 year study period (2014) was much drier, with less snow and rainfall compared to both the other 2 years and the 27 year study period. The annual total P in 2016 and 2015 was lower and higher than the 27 year mean, respectively, but within one std. The start and end of the snow cover period were consistent throughout the 3 year study period.
Table 1Annual mean air temperature (Tair), total precipitation (P), snow water equivalent (SWE) and rain (R) at Fort Simpson (data from the Fort Simpson climate station, WMO ID: 71365, were gap-filled with data from the Fort Simpson A station, WMO ID: 71946, Environment and Climate Change Canada, https://climate.weather.gc.ca, last access: 31 May 2024), dates of snowmelt end and start of a spatially continuous snow cover and snow-free season length at Scotty Creek.
3.2 Sub-basin growing season water balances
The hydrographs of the West, East and South sub-basins were dominated by the spring freshet, caused by the rapid melting of the snowpack starting in late April (Fig. 2a–c). Each year, the peak in QSUB-BASIN occurred within 2–4 d after the start of snowmelt. For each sub-basin, the spring freshet (April–May) Q was the lowest in 2014 (15, 44, 27 and 130 mm for the West, South, EastDEM and EastFIELD sub-basins, respectively) and the highest in 2016 (83 and 104 mm for the West and South sub-basins, respectively), with intermediate values in 2015 (54 and 77 mm for the West and South sub-basins, respectively). A maximum in daily Q of 12 mm d−1 was observed in the South sub-basin (highest wetland-to-forest ratio) in 2016, coinciding with a heavy rainfall event (>30 mm d−1) 10 d before the start of snowmelt (Fig. 2c). The spring freshet accounted for 99 % and 100 %, 73 % and 87 %, and 83 % and 89 % of Q over the April–September period in 2014, 2015 and 2016, for the West and South sub-basins, respectively. In contrast, the spring freshet for the East sub-basin accounted for 41 % and 47 % of Q over the April–September period in 2014 and 2015, respectively. Once the spring freshet ceased, only the East sub-basin sustained continuous Q throughout the remainder of the growing season (baseflow) in 2014 (drier than normal conditions; Fig. 2a). All three sub-basins sustained a continuous Q after the spring freshet in 2015 (wetter than normal conditions) but not in 2016 (drier than normal conditions; data only for West and South sub-basins in 2016). All post-spring freshet variations in Q were in response to individual rainfall events, reaching amounts of up to 30 mm d−1.
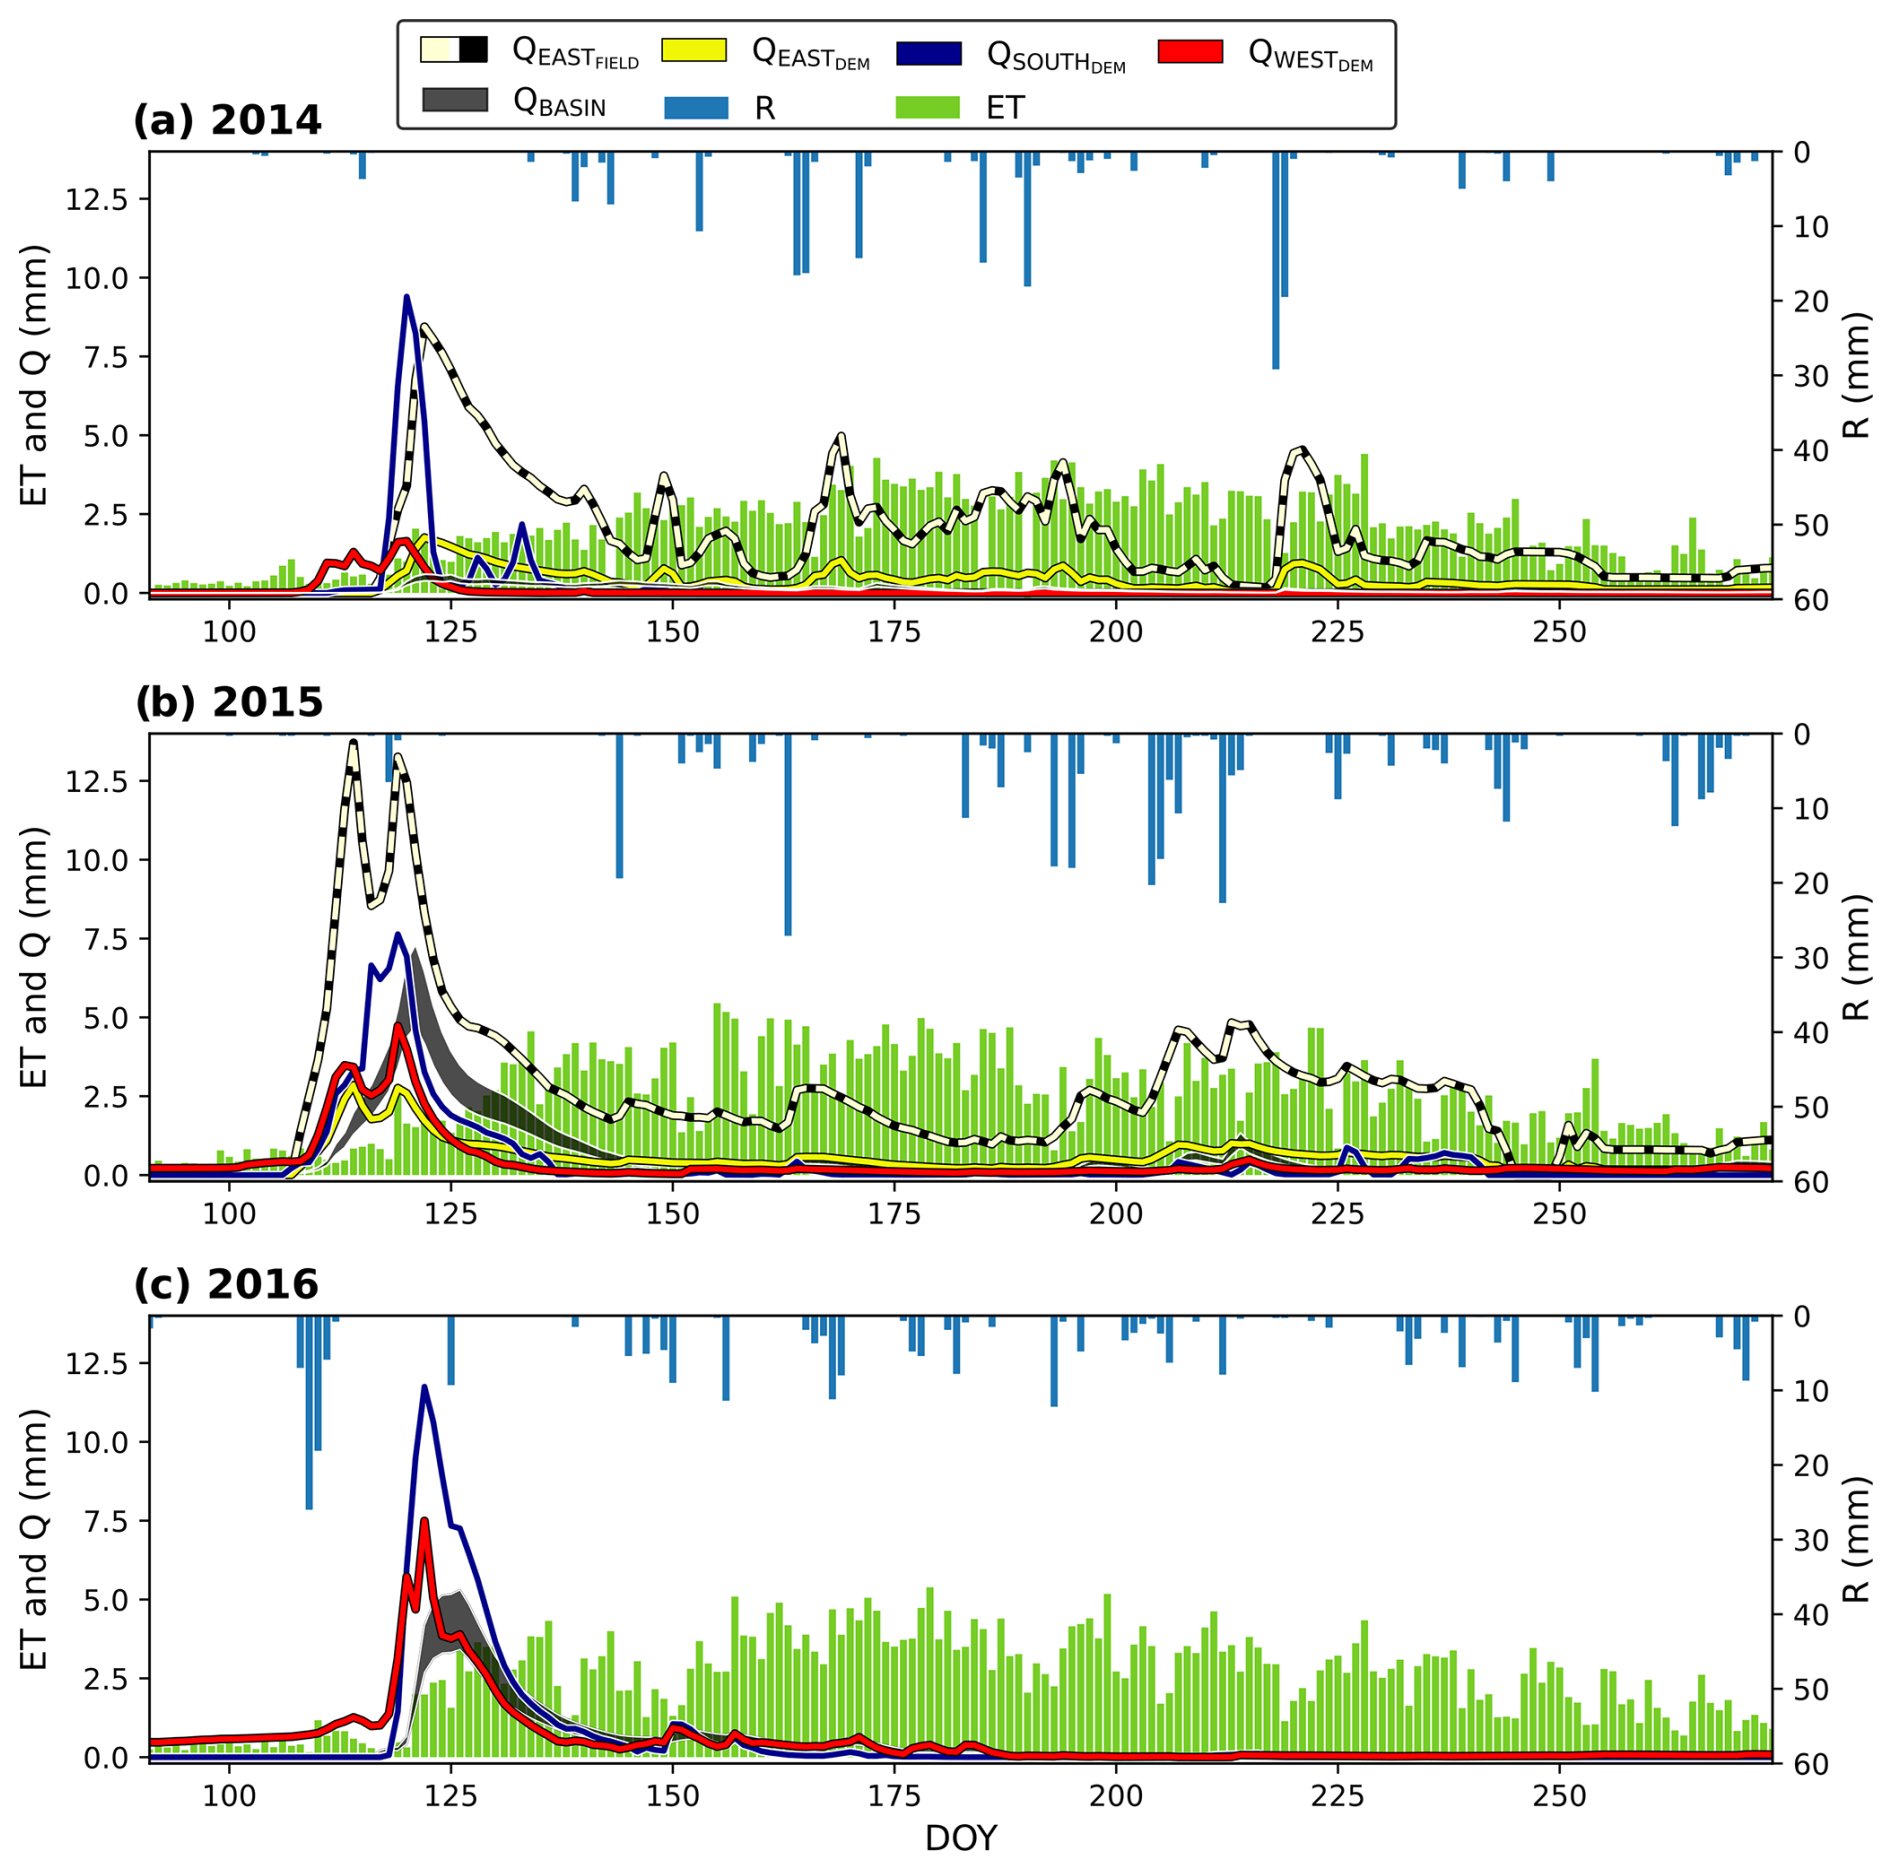
Figure 2Basin and sub-basin hydrographs in (a) 2014, (b) 2015 and (c) 2016 – daily rainfall (, mm d−1), boreal peatland complex evapotranspiration (ETLAND) approximately corresponding to ET from the West sub-basin (ETLAND≈ETWEST, mm d−1), runoff (Q, mm d−1) from the Scotty Creek basin, and Q (mm d−1) from the East, South, and West sub-basins approximately draining the landscape flux tower footprint area (Fig. 1c). EastDEM and EastFIELD drainage areas are used to compute the lower and upper Q range contours (DOY = day-of-year).
Over the 3 year study period, mean daily ETLAND was 2.9 ± 1.1 mm d−1 (ranging from 0.6 to 5.5 mm d−1) and ETWET was 3.3 ± 1.5 mm d−1 (ranging from 0.4 to 8.1 mm d−1). The daily ET of the boreal peatland complex (ETLAND≈ETWEST) increased continuously from 0.3 mm d−1 in early April to 2.5 mm d−1 in late May, coinciding with the rapid melting of the snowpack. From late May until late September, daily ET ranged between 2.0 and 4.0 mm d−1 for most of the time (Fig. 2a–c). At 366 mm, total ET in April–September was the lowest in 2014 (mean Tair was 11.1 °C). In contrast, total ET and mean Tair from April–September were similar in 2015 and 2016 (447 and 458 mm, and 11.5 and 11.6 °C, respectively). Comparatively, total QWEST was 15, 75 and 101 mm for the April–September period in 2014, 2015 and 2016, respectively. Thus, total ETWEST was approximately 24, 6 and 5 times greater than total QWEST in 2014, 2015 and 2016, respectively.
Differences in growing season (May–September) water input (PSUB-BASIN) and combined losses (ETSUB-BASIN and QSUB-BASIN) ranged between −211 mm (net loss: 2016, South sub-basin) and +21 mm (net gain: 2015, West sub-basin), resulting in ΔSSUB-BASIN of similar magnitudes (ranging from −250 mm [2016, South] to +3 mm [2015, East]) across sub-basins and years (Fig. 3a–c; Table S1 in the Supplement). However, the difference between water input and combined losses for the EastFIELD sub-basin was −354 and −311 mm, in 2014 and 2015, respectively (Fig. 3b).
Considering the variations in ΔSSUB-BASIN, growing season water balance residuals, RESWEST and RESSOUTH (Eq. 1), were positive for the West (+114, +122 and +34 mm in 2014, 2015 and 2016, respectively) and South sub-basin (+38 mm in 2016) (Fig. 3, Table S1). In contrast, growing season water balance residuals for the East sub-basin, RESEAST and RESEAST-FIELD, were negative in 2014 (−81 and −287 mm, respectively) and 2015 (−30 and −285 mm, respectively). In the West sub-basin, all the water balance components were recorded over the 3 year study period, enabling us to calculate the monthly water balance during the growing season.
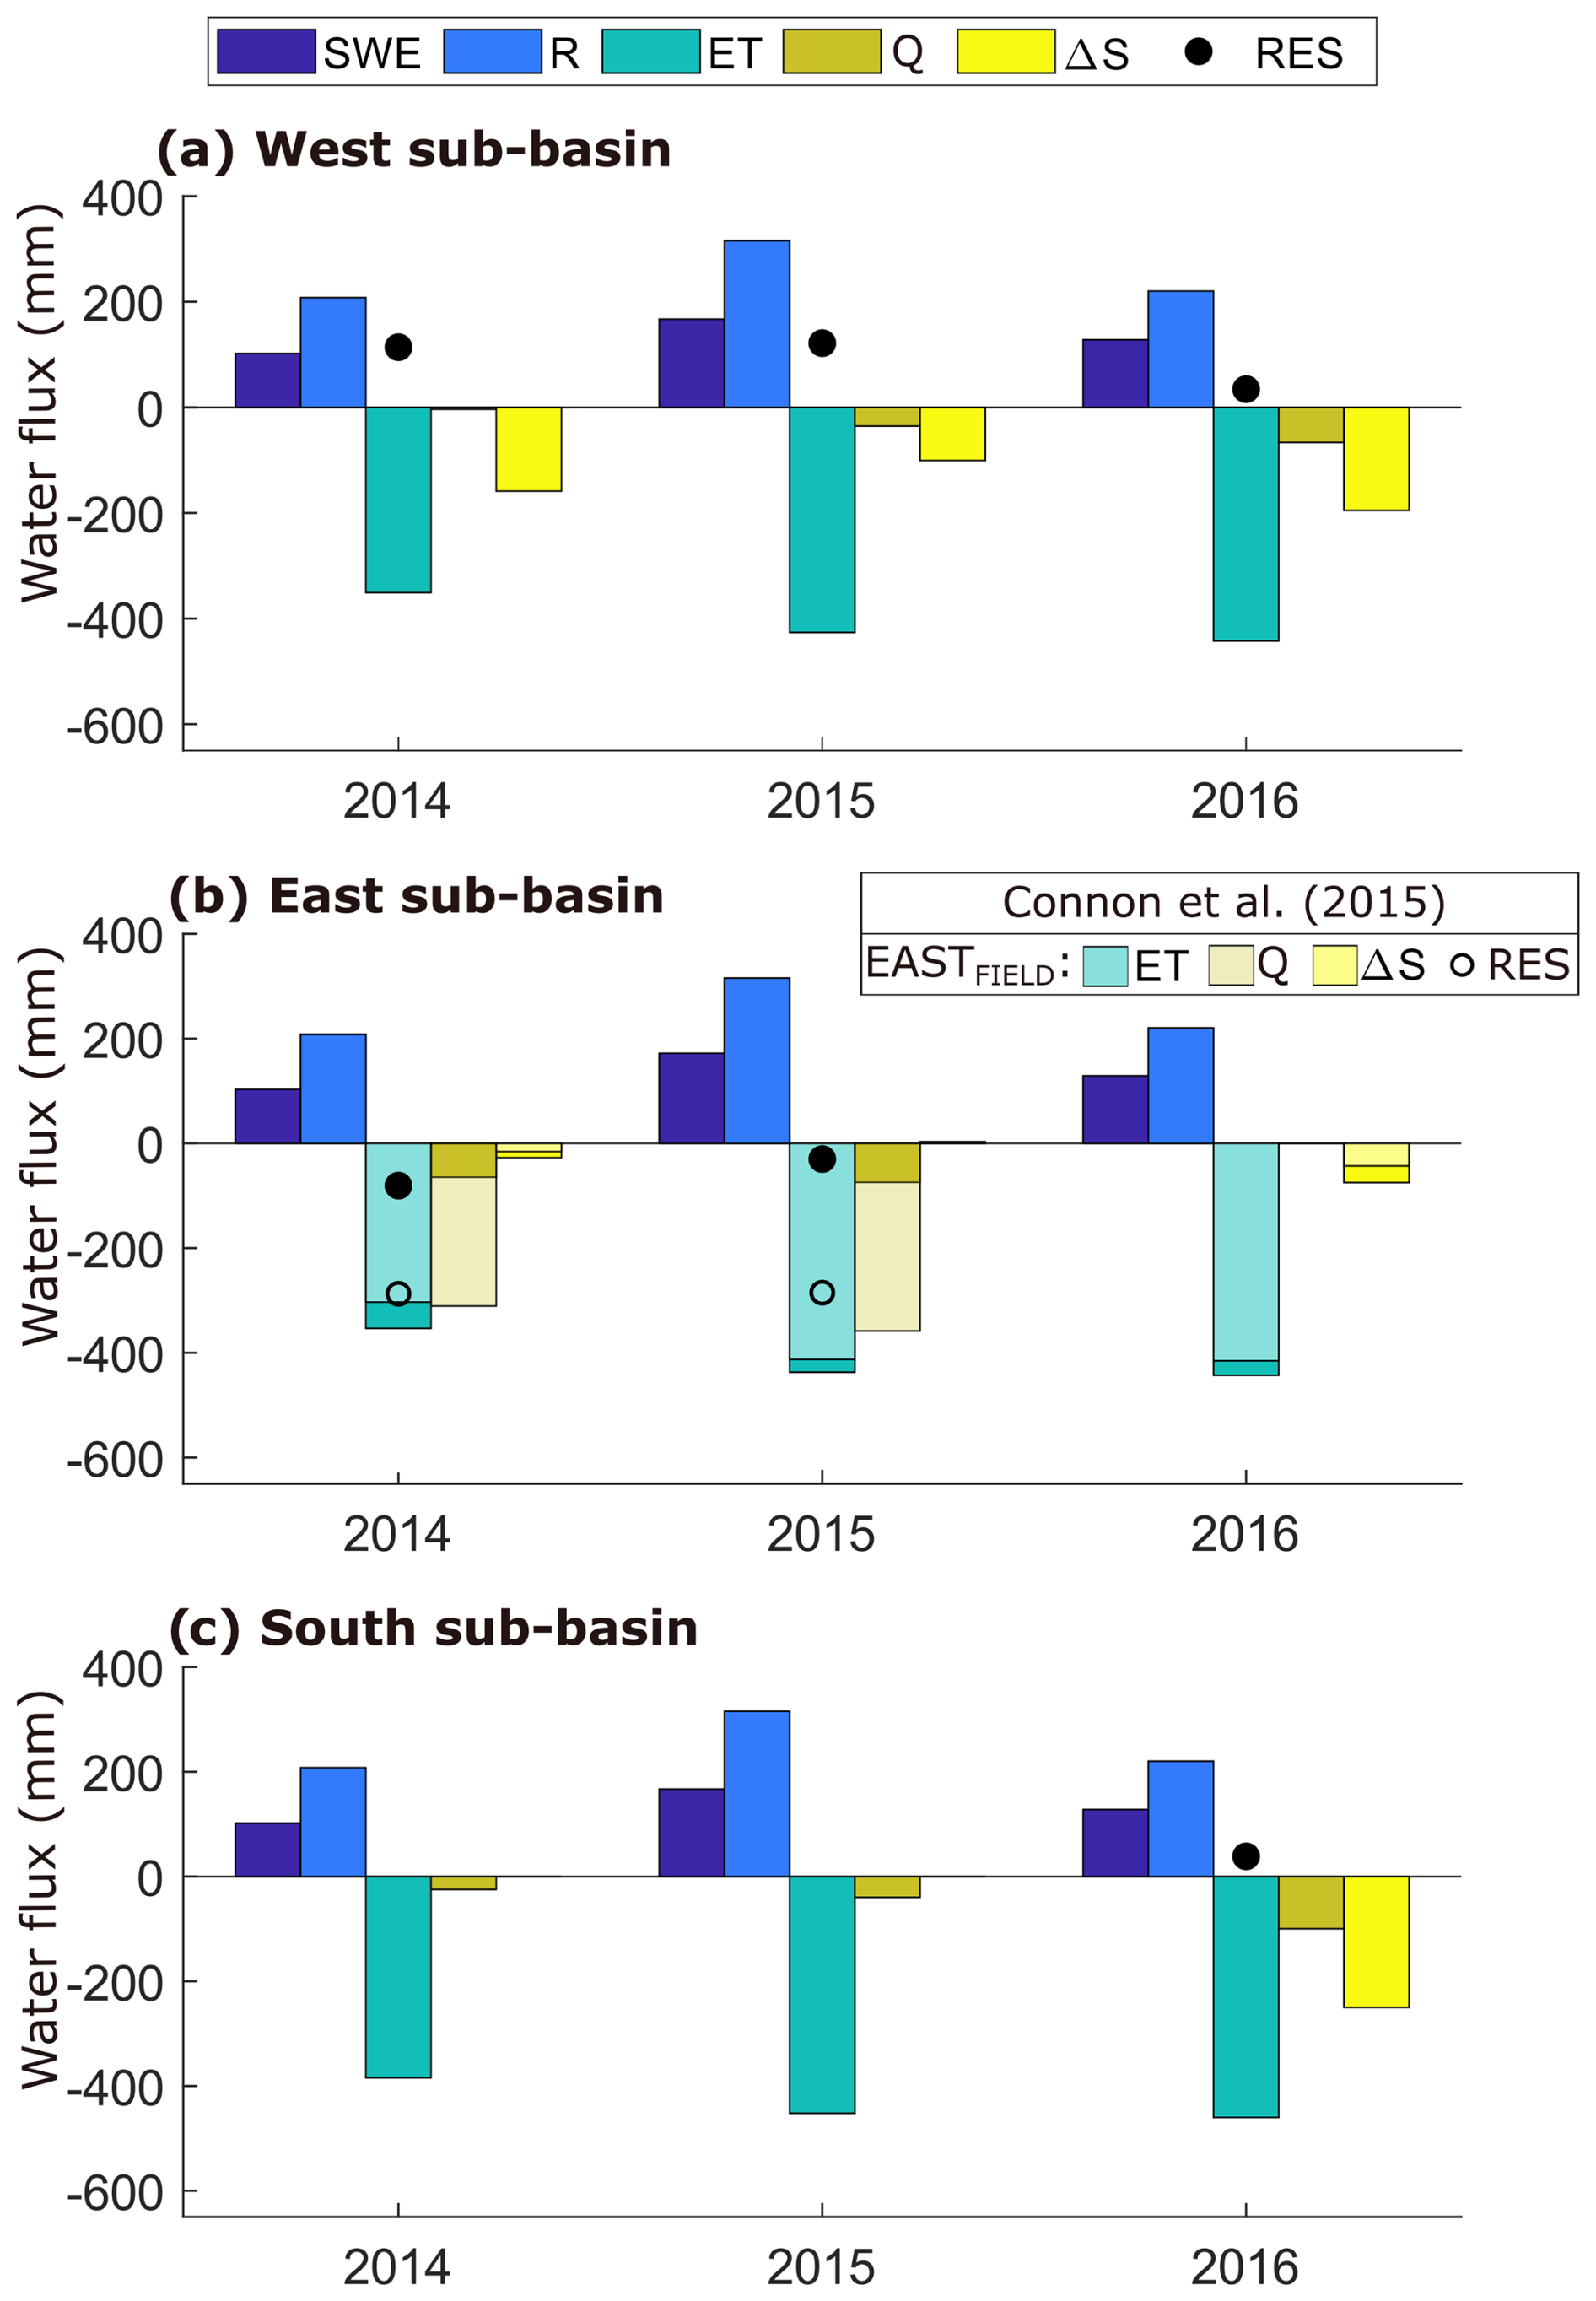
Figure 3Growing season (May–September, 2014–2016) water balances (mm per growing season) for the (a) West, (b) East and (c) South sub-basins: rainfall (), snow water equivalent (SWEEAST, SWESOUTH and SWEWEST), evapotranspiration (ETEAST, ETSOUTH and ETLAND≈ETWEST), runoff derived from the terrain analysis drainage area (QEAST, QSOUTH and QWEST) and water storage change (ΔSEAST, ΔSSOUTH and ΔSWEST). The black dot symbol indicates the water balance residual (RESEAST, RESSOUTH and RESWEST) resulting from Eq. (1). (b) For the East sub-basin, ETEAST-FIELD, QEAST-FIELD and ΔSEAST-FIELD are estimated from the effective drainage area derived from field observations (EASTFIELD, Connon et al., 2015). SWEEAST-FIELD is comparable to SWEEAST. The white dot indicates RESEAST-FIELD. Wetland water table position and discharge data to calculate ΔSSOUTH and QEAST are not available for 2014 and 2015 (not measured), and 2016 (instrument failure), respectively.
3.3 Sub-basin monthly growing season water balance – West sub-basin
The negative ΔSWEST in May indicates a large reduction in the water stored in the West sub-basin, even though the total water input (RWEST plus SWEWEST) exceeded losses by 20 % (2016) to 50 % (2014 and 2015) (ETWEST plus QWEST, Fig. 4a–c, Table S2 in the Supplement). This discrepancy is reflected in the large positive monthly water balance residuals (RESWEST) in May each year (149, 176 and 117 mm in 2014, 2015 and 2016, respectively), reaching almost twice the magnitude of ΔSWEST in 2014 and 2015 (Fig. 4a and b). In contrast, monthly RESWEST from June–September in all 3 years were an order of magnitude lower than those in May (from −41 to 0 mm with a mean of −14 mm, Table S3 in the Supplement). In the 3 year study period, ETWEST was similar during the early- to mid-growing season (June–August: mean monthly ± 9 mm). Mean monthly ETWEST during the late growing season (September) was 45 ± 8 mm. For the June–September period, the 2014 total RWEST (188 mm) was lower than the total ETWEST (291 mm), and ΔSWEST was −69 mm. Similarly, in 2016, ETWEST (361 mm) largely exceeded RWEST (185 mm), and ΔSWEST was −110 mm. In contrast, during the June–September period in 2015, RWEST (291 mm) was closer to ETWEST (336 mm), and ΔSWEST was −10 mm.
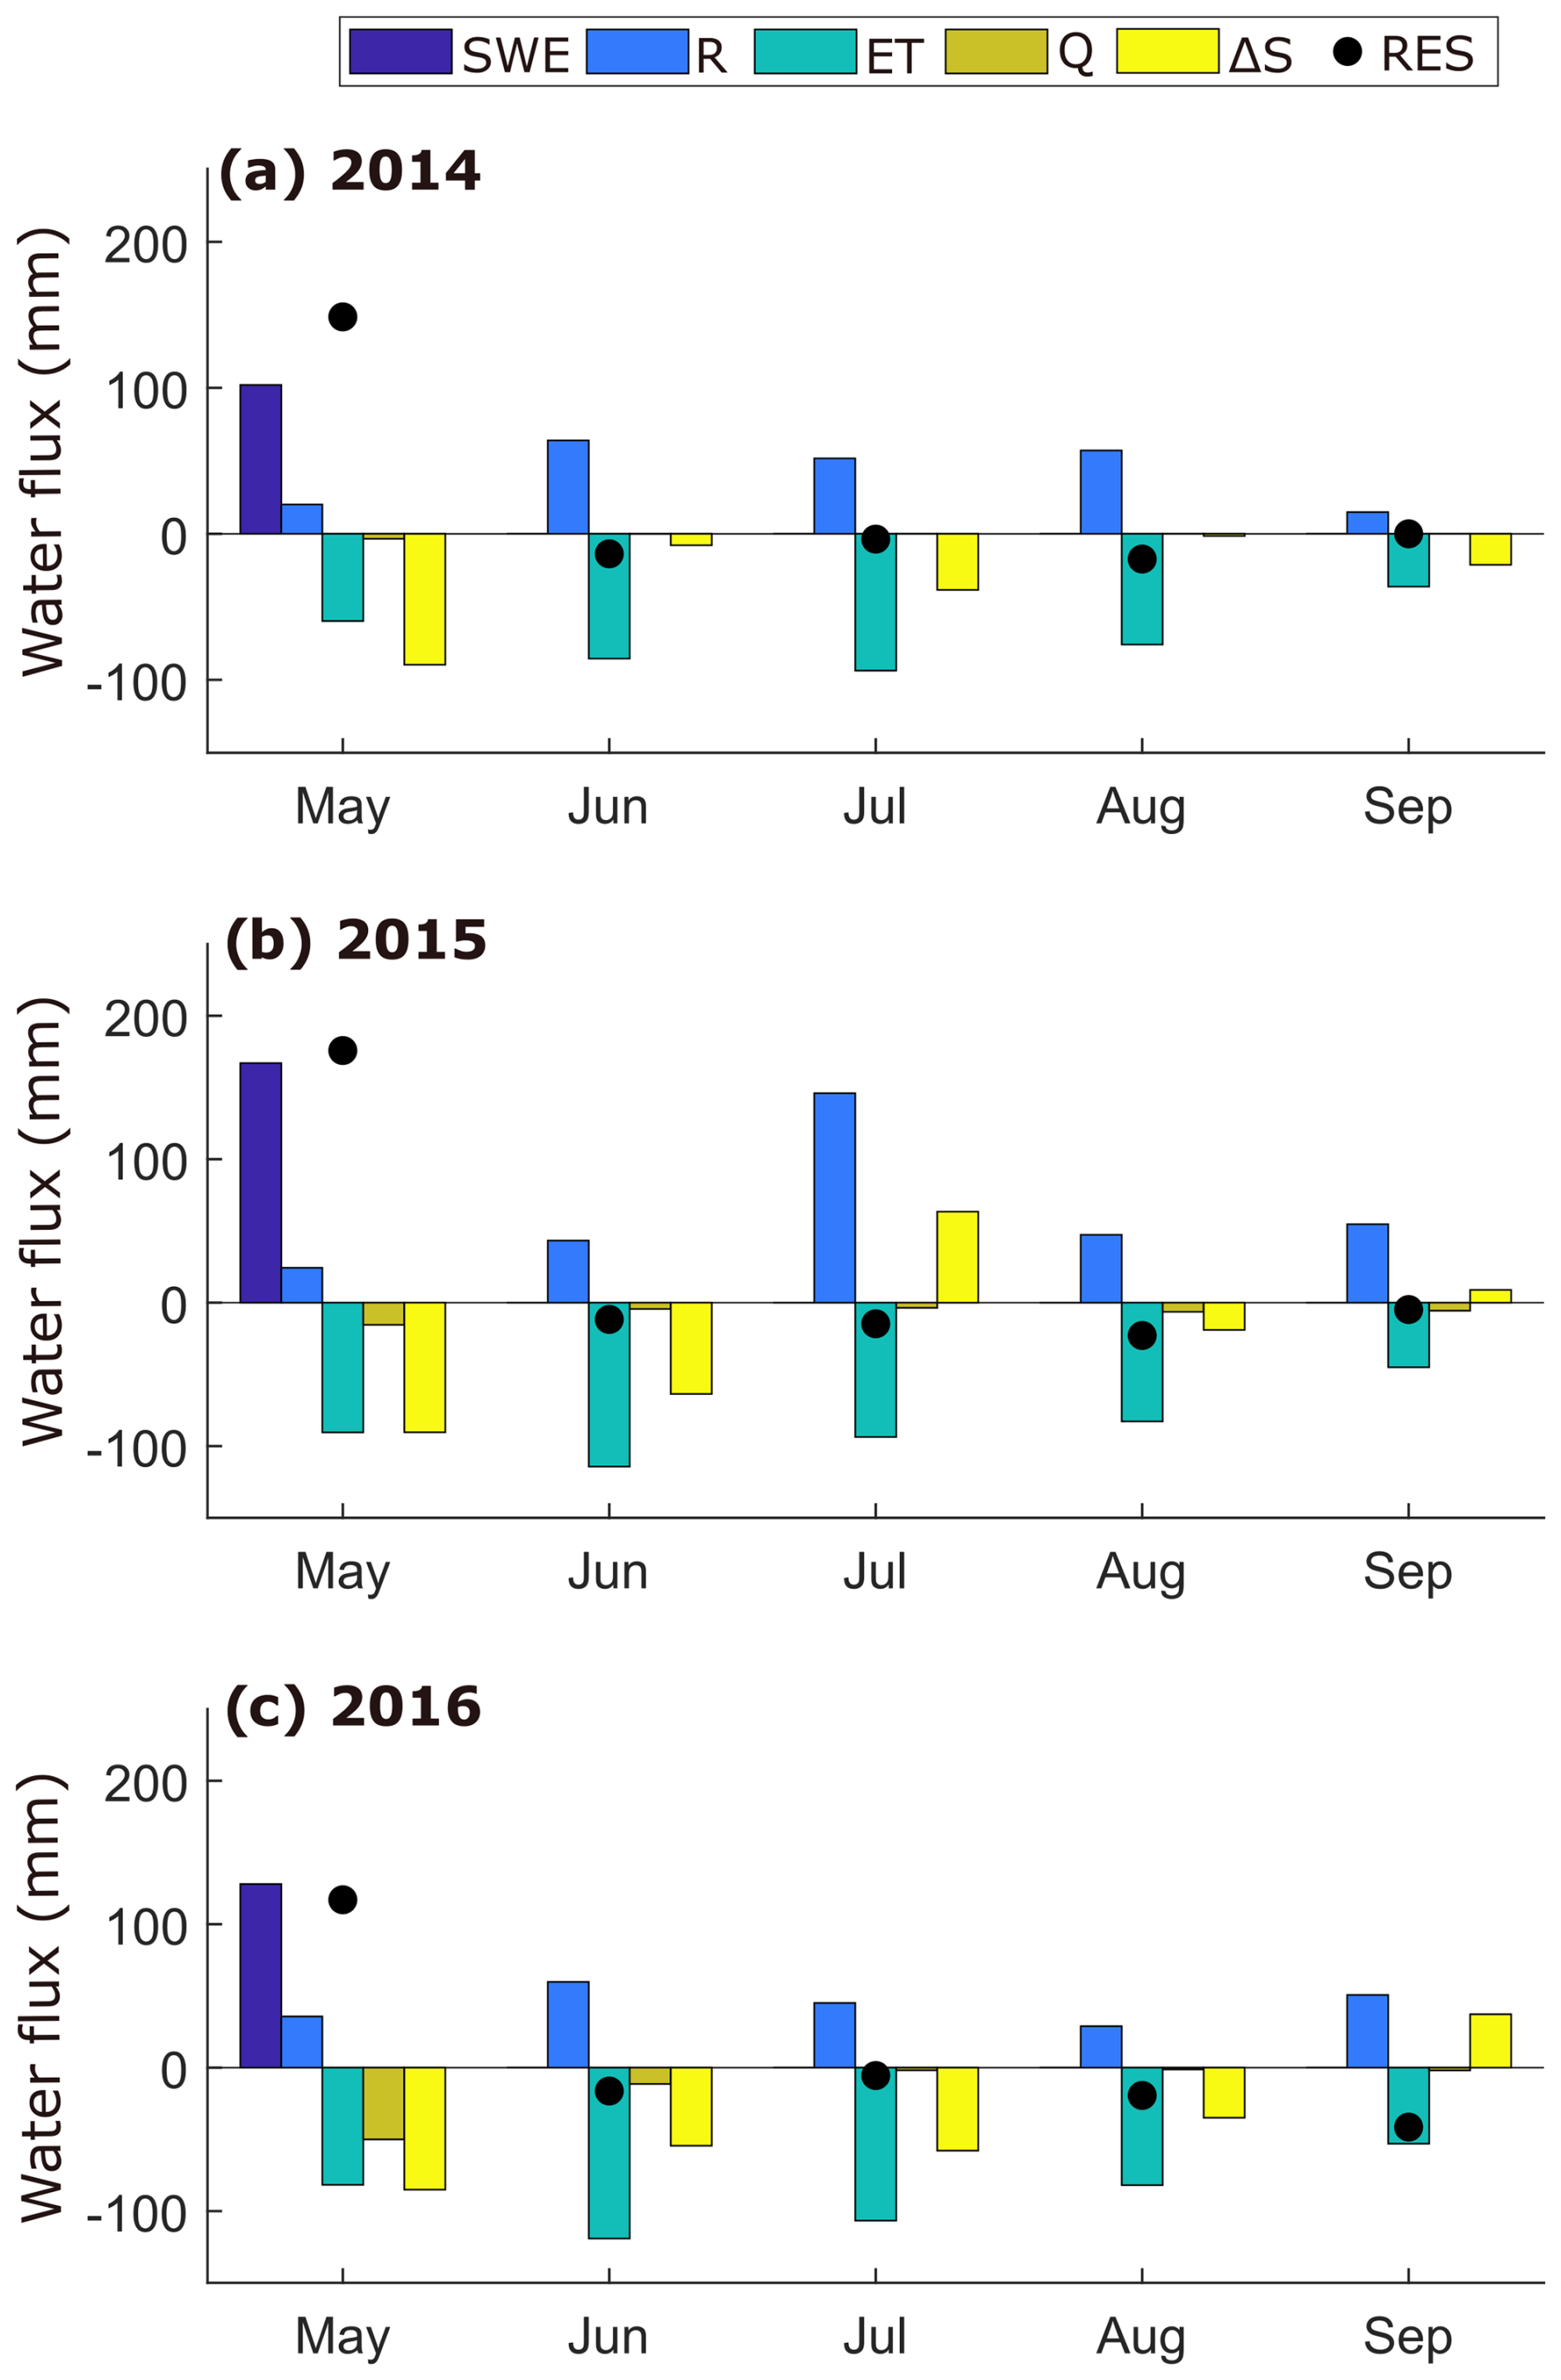
Figure 4Growing season monthly (May–September, 2014–2016) water balances (mm month−1) for the West sub-basin: rainfall (RWEST), snow water equivalent (SWEWEST), evapotranspiration (ETLAND) approximately corresponding to evapotranspiration from the West sub-basin (ETLAND≈ETWEST), runoff (QWEST) and water storage change (ΔSWEST). The black dot symbol indicates the monthly water balance residual (RESWEST) resulting from Eq. (1).
3.4 Comparison between sub-basin and basin evapotranspiration and runoff
Comparable spring freshet peaks were observed between the basin and sub-basins, except for the driest year (2014), when Q in the basin hydrograph (<0.6 mm) was substantially lower than in the sub-basin hydrographs (from 1.6 to 9.4 mm, Fig. 2). At the basin scale, the spring freshet contributions (April–May) to Q varied between 50 % and 79 % over the April–September period in 2014 to 2016, i.e. in the range observed for the three sub-basins (from 41 % to 100 %). Monthly Q between the sub-basins (using the drainage area obtained with terrain analysis techniques) and the basin were comparable (Fig. 5a). The greatest absolute difference was twofold in May (from 1.6 to 2.3; Fig. 5a). Total ET from the BESS model over the April–September period ranged from 237 to 252 mm for both the basin and its headwater portion, while the values measured from the landscape flux tower ranged from 366 mm (2014) to 458 mm (2016). Consequently, the comparison of monthly ET shows underestimation of the modelled ET (BESS) at both the basin and headwater scales compared to the ET obtained from flux tower measurements (Fig. 5b and c). Higher growing season water losses (ΔSSUB-BASIN) in 2014 and 2016 observed for the sub-basins (Fig. 3) are consistent with the annual (hydrological year: October–September period) basin response, i.e. ΔSBASIN (Fig. 6a).
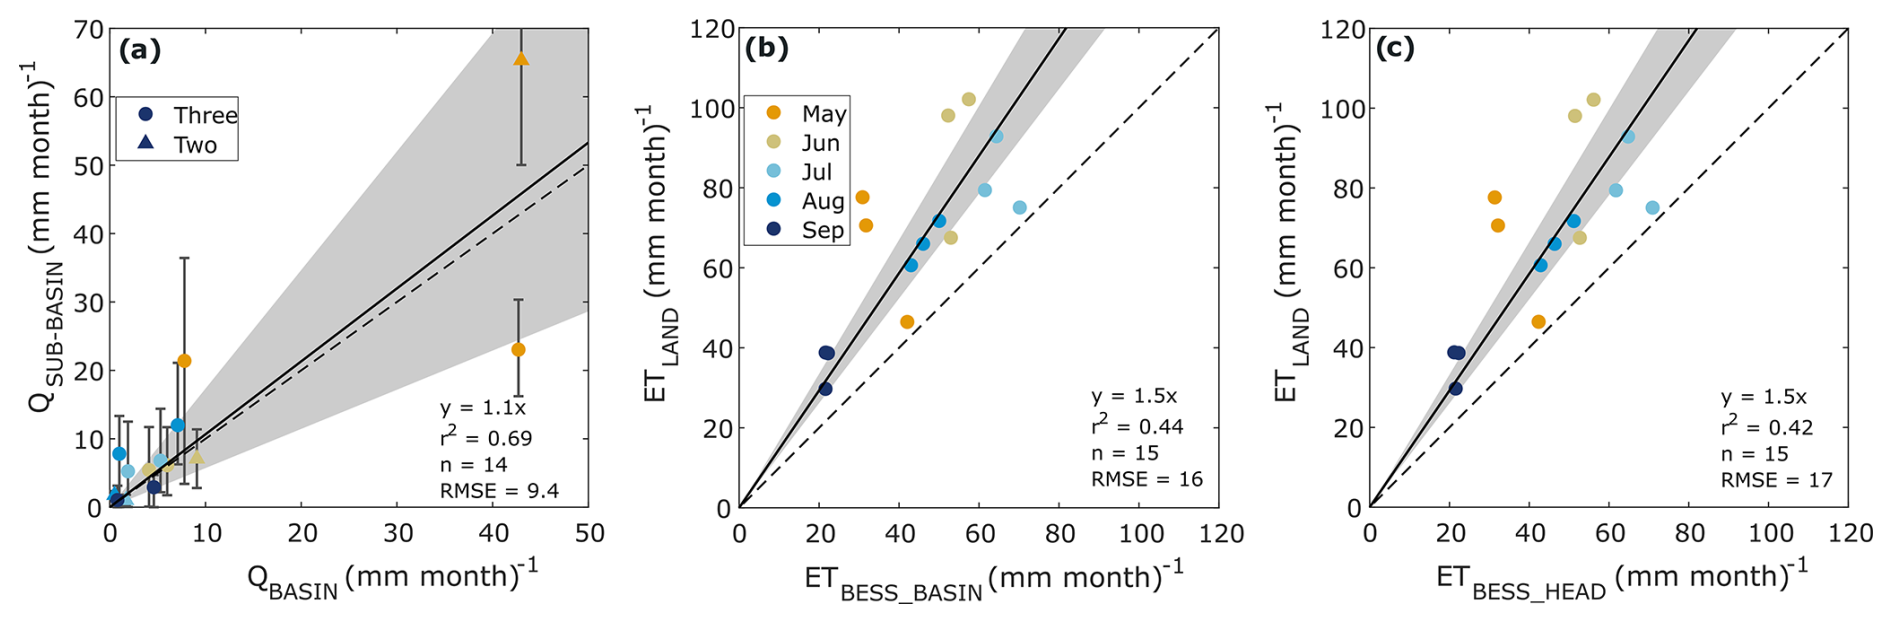
Figure 5Monthly comparisons of growing season (May–September 2014–2016, mm month−1) water losses (evapotranspiration [ET] and runoff [Q]) between the Scotty Creek basin (x axis) and the sub-basins (y axis). (a) QBASIN and average (vertical error bar corresponding to minimum and maximum) Q estimates for the East, South and West sub-basins (QSUB-BASIN). Estimates of Q are obtained for the drainage area derived from automated terrain analysis using a digital elevation model. The symbol shapes (i.e. dot or triangle) indicate the number of months available to calculate mean sub-basin Q. No discharge data to calculate QSUB-BASIN are available in September 2016. (b) Basin and (c) headwater ET estimates obtained with the BESS model (ETBESS_BASIN and ETBESS_HEAD, respectively) compared with corresponding (y axis) landscape flux tower estimates of ET (ETLAND). For (a)–(c), the continuous black line is the ordinary least square (OLS) regression. The OLS regression uncertainty (grey coloured band) is estimated using bootstrapping with 1000 iterations. The stippled black line is the 1:1-line.
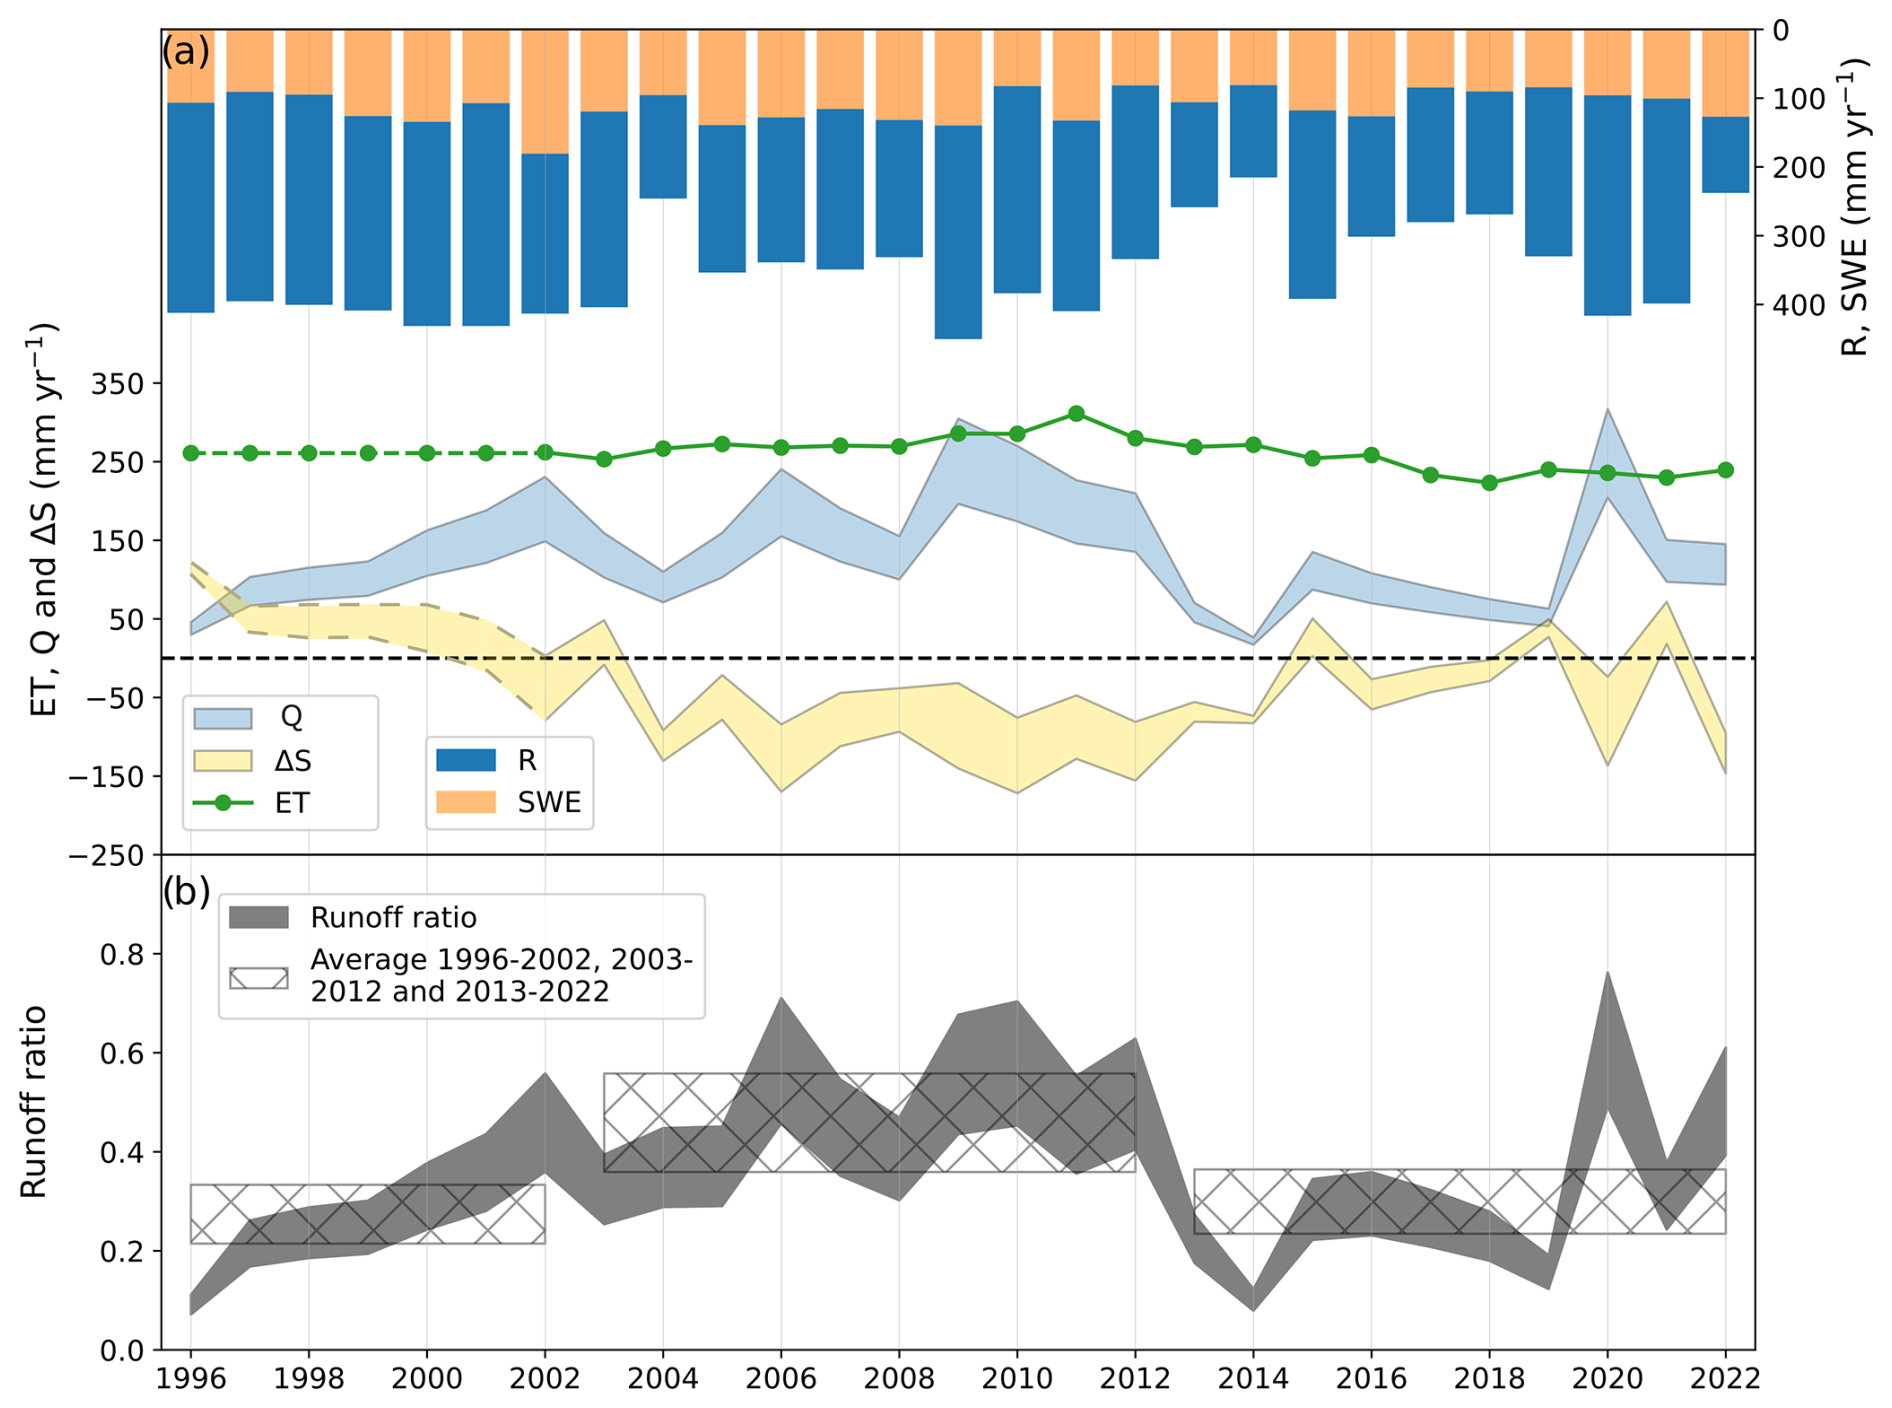
Figure 6(a) Annual (hydrological year: October–September, 1996–2022) water balances (mm yr−1) for the Scotty Creek basin obtained from daily precipitation (PBASIN) and rainfall measurements (RBASIN) resulting in snow water equivalent (), daily runoff (QBASIN) and evapotranspiration (ET) estimates from the BESS model (ETBESS_BASIN). ET for the 1996–2001 period (dashed green line) corresponds to the 2002–2022 average period. Basin scale water storage change (ΔSBASIN) is the difference between incoming and outgoing water fluxes. (b) Annual ratio of runoff to precipitation (i.e. the runoff ratio). The hashed area corresponds to the mean runoff ratio over the temporal period considered (1996–2002; 2003–2012; 2013–2022). For panels (a) and (b), the range of values for QBASIN, ΔSBASIN and the runoff ratio corresponds to the lowest and highest basin drainage area estimates, i.e. 130 and 202 km2.
3.5 Basin annual water balance
Over the 27 year (1996–2022) study period, annual water inputs were dominated by R, ranging from 111 to 324 mm (mean ± std, 243 ± 63 mm), while SWEBASIN ranged from 81 to 181 mm (mean ± std, 112 ± 24 mm, Fig. 6a, Table S3). For water losses, annual ET estimated with the BESS model ranged from 223 to 311 mm (mean ± std, 261 ± 22 mm) over the 2002–2022 period (Fig. 6a). In comparison, annual QBASIN_130 and QBASIN_202 ranged from 26 to 317 mm (mean ± std=164 ± 81 mm) and from 17 to 204 mm (mean ± std=105 ± 52 mm) for the 2002–2022 period, respectively. Thus, annual ET was between 2.2 and 3.5 times higher than annual Q, given the range of drainage area estimates.
ETBESS_BASIN and SWEBASIN were relatively stable over time (261 ± 22 mm and 112 ± 24 mm, respectively, Fig. 6a). ΔSBASIN, RBASIN and QBASIN experienced higher between-year variability from 1996 to 2022 ( ± 75 mm, ± 63 mm; R=243 ± 63 mm; QBASIN_130=155 ± 76 mm; QBASIN_202=100 ± 49 mm) than ETBESS_BASIN and SWEBASIN.
ΔSBASIN_202 and ΔSBASIN_130 ranged from −172 to 105 mm and from −95 to 121 mm, respectively. ΔSBASIN decreased from ∼120 to 0 mm over 1996 to 2001, while Q increased from ∼30 to ∼140 mm. ΔSBASIN was negative (∼100 mm) over the 2004–2014 period. Then, ΔSBASIN was either positive or negative from 2015 to 2022 for both drainage area estimates (Fig. 6a).
The annual ratio of runoff to precipitation (i.e. the runoff ratio, Fig. 6b) ranged from 0.1 to 0.5 (runoff ratio_202) and from 0.1 to 0.8 (runoff ratio_130). The runoff ratio strongly increased from 1996 to 2002 (from ∼0.1 to 0.4–0.6 the runoff ratio_202 and runoff ratio_130 average were 0.2 and 0.3, respectively) followed by a period of higher and more stable values until 2012 (runoff ratio_202 and runoff ratio_130 average for 2003–2012 are 0.4 and 0.6, respectively). For the 2013–2022 period, the runoff ratio was more variable, but on average, lower (runoff ratio_202=0.2 and runoff ratio_130=0.4) than for the 2003–2012 period.
4.1 Growing season water balance components in three small-scale basins of a boreal peatland complex: Objective 1
From mid-May until the end of September, the growing season water balances were dominated by water input and loss through rainfall and ET, respectively. Growing season daily ET ranged among values commonly observed elsewhere across the boreal biome, with higher wetland than forest ET (Arain et al., 2003; Isabelle et al., 2018; Nakai et al., 2013; Volik et al., 2021; Wu et al., 2010). For example, higher wetland (2.9 ± 1 mm d−1) than forest ET (1.7 ± 0.6 mm d−1) at Scotty Creek was reported for June–mid July 2013 (Warren et al., 2018), with transpiration from black spruce and tamarack accounting for only approximately 6 % to 12 % of forest ET (Perron et al., 2023).
The spring freshet contribution to growing season water losses was the lowest for the East sub-basin. Despite the uncertainty in the East sub-basin drainage area, the range of the wetland-to-forest ratio for the East sub-basin (0.34 to 0.84) was lower than for the two other sub-basins (South: 1.24 and West: 1.06). The larger forested portion in the East sub-basin compared to the other two sub-basins could lead to more post-spring freshet runoff, as the gradually deepening frost table can promote subsurface runoff (Sjöberg et al., 2021). In contrast, during the mid-growing season, wetlands can act as “gatekeepers”, reducing hydrological connectivity (Connon et al., 2015; Phillips et al., 2011). Land cover control over runoff dynamics has also been observed in other permafrost-affected basins, including a mountainous permafrost landscape where differences in vegetation types were shown to affect the rainfall–runoff relationship (Genxu et al., 2012).
Regarding monthly water balances, the high residuals observed in May for all 3 years (Fig. 4a–c) might be explained by the inclusion of snowmelt input through SWE that month. Due to limited data availability, SWEMAX, estimated in late March just before the onset of snowmelt, served as a proxy for snowmelt input in the May water balance, highlighting the difficulty of appropriately accounting for the spring freshet in growing season water balance observations. To shed light on this challenge, we estimated the amount of snowmelt at the end of April using a simple temperature index model (Fig. S3 in the Supplement). The estimated snowmelt amounts (median [25th–75th percentiles] from 10 000 Monte Carlo simulations) at the end of April were 105 [78–136] mm in 2014, 187 [138–238] mm in 2015, and 125 [92–159] mm in 2016. These ranges correspond closely to the SWEMAX measured each year (102, 167 and 128 mm in 2014, 2015 and 2016, respectively), suggesting that only a small portion of SWEMAX contributed to the May water balance. This would reduce the high residuals in the May water balance in the West sub-basin, estimated as +149 (2014), +176 (2015) and +117 mm (2016).
Despite the observational challenges, particular attention should be paid to this snowmelt period, which is profoundly influenced by climate warming. Firstly, the spring freshet in recent years has been shown to occur earlier in the Arctic-boreal region compared to previous decades (Chasmer and Hopkinson, 2017; Mack et al., 2021; Pohl et al., 2007; Woo et al., 2008). At Scotty Creek, an earlier snowmelt of 16 d was observed during the 2000–2009 period compared to the 1970–1979 period (Chasmer and Hopkinson, 2017). The Scotty Creek basin hydrograph analysis consistently reveals an earlier increase in discharge (∼15 d) during the 2009–2022 period compared to the 1995–2008 period (Fig. S4 in the Supplement). Secondly, earlier snowmelt leads to a longer snowmelt period, as projected for the Liard River watershed, resulting in a more gradual snowmelt (Woo et al., 2008). However, an increase in wetland extent due to forested peat plateau collapse can contribute to shorter snowmelt period since snow melts faster in wetlands than in forest stands (Connon et al., 2021; Quinton et al., 2019). Shorter snowmelt periods can result in higher spring freshet peaks, as observed at Scotty Creek and the adjacent Jean Marie River meso-scale basin (Connon et al., 2021).
Except for May, the remainder of the growing season showed reasonably well closed monthly water balances with low residuals (Fig. 4), suggesting that obtaining water storage from measured wetland WTP and water content appears to be appropriate in low-relief landscapes such as the thawing boreal peatland complex in this study. To better understand the hydrological response of small- and meso-scale basins, we compared the hydrographs and monthly average runoff and ET estimates of the three headwater sub-basins, with corresponding estimates obtained at the basin scale, as described in the following section.
4.2 Small-scale basin evapotranspiration and runoff from a boreal peatland complex in a meso-scale basin context: Objective 2
The annual basin water balance (Fig. 6) had higher water losses in 2014 and 2016 than in 2015 (Fig. 3), similar to the growing season sub-basin water balances. Using independent data sets (i.e. sub-basin measurements and publicly available and modelled data for the basin), we observed that ET is the dominant annual water loss at both the sub-basin and basin scales, averaging more than twice the runoff. The hydrographs at both scales were comparable, i.e. they were dominated by the spring freshet peak, typical for regions with a subarctic nival regime (Gandois et al., 2021; Woo et al., 2008). However, an exception occurred during the driest year (2014), when the peak in basin runoff peak was more than 10 times lower than that for the sub-basins (Fig. 2). This difference might be partially explained by the higher proportional coverage of wetlands in the headwater sub-basins (∼40 %) compared to the entire basin (∼20 %) and the high coverage of mineral uplands in the basin (∼40 %; Chasmer et al., 2014). More water is expected to be stored in saturated wetlands than in mineral uplands (McCarter et al., 2020; Price, 1987), which may help sustain a higher runoff ratio during years with low late-winter SWE, as observed in 2014. The higher degree of saturation in wetlands compared to mineral uplands can favour surface runoff over water infiltration during the spring freshet, as observed in small-scale basins in Sweden (Jutebring Sterte et al., 2018, 2021). Dry conditions in 2013 (annual total P=259 mm, Fig. 6) may have further exacerbated the drying of mineral uplands compared to wetlands, thereby enhancing infiltration at the basin scale during the 2014 snowmelt.
For the concurrent monitoring period at both scales (2014–2016), sub-basin runoff agreed well with basin runoff (Fig. 5a). May showed the greatest difference, with values differing by a factor of two, highlighting difficulties in adequately measuring discharge during the spring freshet. Runoff discrepancies between the sub-basin and basin scales may also be partly attributed to time lag effects, e.g. the spring freshet peak was delayed (∼2–4 d) between the headwater sub-basin and the basin outlets (Fig. 2). Thus, a certain portion of headwater sub-basin runoff in late April might have been accounted for in May at the basin scale. Additionally, the observed runoff difference in May may partly reflect differences in snow depth and melt dynamics between the basin scale (130 and 202 km2) and the finer sub-basin scale (<1 km2), as snowpacks are often heterogeneous in forests and tend to melt more rapidly in wetlands (Connon et al., 2021; Nousu et al., 2024).
Our results show that modelled ET obtained with the BESS model at the basin scale underestimated (annually ∼100 mm) observed ET (Fig. 5b). Given that wetland ET is higher than forest ET (Helbig et al., 2016b), the underestimation of ET might be related to land cover heterogeneity at the basin scale. The northern, i.e. downstream, portion of the basin is dominated by mineral uplands with better drainage and is mainly covered by deciduous or mixed forest stands (Chasmer et al., 2014). ET estimations from a chemical method at the Scotty Creek basin scale consistently ranged from 280 to 300 mm yr−1 for the 1999–2002 period (Hayashi et al., 2004). However, the modelled ET was lower than the observed ET at the sub-basin scale, probably underestimating the contribution of wetlands (Fig. 5c). Although this difference may stem from the tendency of the BESS model to underestimate the spatial variability of ET in wetland-rich landscapes such as boreal peatland complexes near the southern permafrost limit, we cannot disentangle the extent to which it reflects a general underestimation of ET versus a specific underestimation in wetlands.
4.3 Annual basin water balance in relation to changes in land cover and hydrological connectivity: Objective 3
Understanding the long-term runoff dynamics of thawing boreal peatland complexes remains challenging due to strong ecohydrological feedbacks (Shirley et al., 2022; Song et al., 2024; Walvoord and Kurylyk, 2016). Variability in precipitation regimes may have influenced runoff ratio dynamics, as suggested by the peak in the runoff ratio in 2020 (0.5–0.8), the rainiest year in the 1996–2022 period (Fig. 6b). Under wet conditions, ephemerally connected wetlands can increase the effective drainage area (Connon et al., 2015), whereas during dry periods, some wetlands become hydrologically disconnected, thereby reducing the runoff ratio. The lower runoff ratio in summer compared to the spring freshet is consistent with intensified wetland drying during the summer months (Figs. S5 and S6 in the Supplement).
The weak correlation between current-year effective precipitation (precipitation minus ET) and runoff (R2=0.2, Fig. S7 in the Supplement) suggests that other processes such as rapid changes in land cover and hydrological connectivity may have played a more dominant role in controlling runoff. Additionally, the cross-correlation analysis showed that current-year effective precipitation provides the best linear correlation with runoff, while antecedent wetness offers no explanatory power (Fig. S8 in the Supplement).
From a landscape perspective, in the headwater portion of the Scotty Creek basin, Haynes et al. (2022) estimated a 1.4 % forest loss between 2010 and 2018. Rapid permafrost thaw and the connection of wetlands to the drainage network are expected to increase hydrological connectivity, leading to an increase in permanent and transient runoff (Connon et al., 2014, 2015; Haynes et al., 2018). However, despite these changes, the average runoff ratio over the 2013–2022 period was lower than during the 2003–2012 period (Fig. 6b). Meanwhile, the drying of hydrologically connected wetlands has been reported at Scotty Creek between 2010 and 2018 (Haynes et al., 2018), which facilitated the development of individual hummock landforms, indicative of drier near-surface peat layers (Haynes et al., 2022). Wetland drying limits the saturation of permeable near-surface peat layers, which can coincide with a decrease in drainage efficiency. For example, the high hydraulic conductivity of the near-surface peat layer promotes more effective drainage compared to deeper peat layers (Ingram, 1978; Morris et al., 2011; Quinton et al., 2008). Vegetation succession occurring within approximately a decade following wetland initiation can lead to vertical peat accumulation above the water table. This elevation of the peat surface can contribute to reduced saturation in near-surface peat layers by hydrologically decoupling them from the saturated underlying peat (Errington et al., 2024). Therefore, the decrease in runoff ratio observed after 2012 can be attributed to reduced drainage efficiency resulting from wetland drying.
Our analysis indicates that the competing influences of wetland expansion (which increases hydrological connectivity) and wetland drying (which reduces hydrological connectivity) are key drivers of long-term runoff variability in boreal peatland complexes near the southern permafrost limit. Accordingly, sustained long-term hydrological monitoring is essential to disentangle the impacts of precipitation and land cover changes on the runoff ratio within such rapidly changing landscapes. A sub-basin-scale modelling study suggests that replacing 50 % of forested peat plateaus with wetlands leads to a reduced runoff ratio following wetland drainage. This change was attributed to increased surface storage capacity, reduced runoff efficiency, and higher landscape evapotranspiration, assuming no increase in precipitation (Stone et al., 2019).
In the boreal biome, wetlands exhibit higher mid-day ET than adjacent forests during the growing season (Helbig et al., 2020b). Projections for the 21st century indicate that wetland ET will exceed forest ET by more than 20 % across approximately one-third of the boreal biome under the Representative Concentration Pathway (RCP) 4.5 scenario and up to two-thirds under the RCP 8.5 scenario (Helbig et al., 2020a). While wetland expansion at the expense of forested peat plateaus increases ET, it may significantly influence both the water balance and the regional climate (Helbig et al., 2016b). These findings highlight the continued need for long-term measured and modelled ET comparisons, as ET is likely to play a crucial role in shaping the future water balance of boreal peatland complexes near the southern permafrost limit.
4.4 Effective versus potential drainage area: implications for water balance studies
Defining basin and sub-basin boundaries and drainage areas in low-relief landscapes such as vast swaths of the Taiga Plains using automated terrain analysis is challenging and estimates tend to vary, at least partly, depending on the DEM used (Al-Muqdadi and Merkel, 2011; Datta et al., 2022; Keys and Baade, 2019; Moges et al., 2023). Although difficult to apply across large regions, field observations are crucial in low-relief landscapes for accurately defining the effective drainage area (Connon et al., 2015). Our comparison of effective and potential drainage areas – based on field observations and automated terrain analysis of a DEM- showed that both estimates are consistent for the sub-basin almost entirely composed of connected wetlands (factor 1.2, West sub-basin, Fig. 1c). However, the two drainage areas exhibit important differences for the sub-basin with a high proportion of isolated wetlands (East sub-basin). There, the potential drainage area is five times higher than the effective drainage area. Field observations may lead to a more precise delineation of the effective drainage area contributing to the drainage network (Connon et al., 2015). However, regarding the growing season water balance for the East sub-basin (Fig. 3b), the water balance residual is 3.5 to 9.5 higher using the effective drainage area. In this case, the automated terrain analysis derived drainage area is more adequate to close the water balance. Subsurface water flows can occur at greater depths in permafrost-free basins (Sjöberg et al., 2021). Unobserved subsurface flows, such as through taliks, defined as perennially thawed ground below the active layer (Devoie et al., 2019), potentially lead to an underestimation of the effective drainage areas from field observations.
At the basin scale, automated terrain analysis produces different drainage areas (Burd et al., 2018; Chasmer and Hopkinson, 2017; Connon et al., 2014; Quinton et al., 2004; Water Survey of Canada), with the two most distinct estimates being used in this study (i.e. 130 and 202 km2). The increase in wetlands hydrologically connected to the effective drainage area due to permafrost thaw is expected to be captured by the substantial increase in the runoff ratio from 1996 to 2012 (Fig. 5). Delineating drainage areas at the sub-basin and basin scales remains a challenge, with proportionally larger errors in smaller areas such as the East, West and South sub-basins. Thus, minor differences in landscape heterogeneity (e.g. the hydrological connectivity of wetlands to the drainage network) may lead to large variations in the drainage area. Given the rapid permafrost thaw and associated land cover changes occurring near the southern permafrost limit (Quinton et al., 2019), improving the constraints on the hydrological connectivity of small low-relief (sub-)basins is essential for accurately quantifying and modelling water and carbon losses (Gao et al., 2018; Wei et al., 2024).
4.5 Constraining the water balance in thawing boreal peatland complexes: broader implications and perspectives
Non-linear hydrological responses, such as changes in the runoff ratio, ET and water table position, to variations in precipitation and hydrological connectivity driven by permafrost thaw are linked to shifts in soil physical properties, microbial communities and vegetation composition and structure. These interconnected changes collectively influence ecosystem services at multiple scales, including the local (e.g. subsistence activities), regional (e.g. water storage) and global levels (e.g. carbon storage as reflected in the net ecosystem carbon balance [NECB]; Camill et al., 2001; Chapin et al., 2006; Ernakovich et al., 2022; Jones et al., 2022; Li et al., 2023; Shirley et al., 2022). Assessing whether thawing boreal peatland complexes act as a net source or sink of carbon (NECB), once both vertical and lateral fluxes are considered, is therefore an important avenue of research (Song et al., 2024). For example, a recent review showed that the dissolved organic carbon concentration can be elevated in sporadic and discontinuous permafrost areas and tend to increase with permafrost thaw (Heffernan et al., 2024). Thus, understanding the mechanisms driving runoff, such as the spring freshet, is essential for quantifying lateral carbon exports to NECB (Chapin et al., 2006; Gandois et al., 2021; Laudon et al., 2004).
Long-term hydrological monitoring is also essential for understanding how gradual changes (e.g. vegetation shift or increasing Tair) are interlinked with more frequent and intense pulse disturbance events (e.g. weather extremes, abrupt permafrost thaw or wildfires) (Li et al., 2023). Wildfires have been shown to accelerate permafrost thaw (Gibson et al., 2018), posing an increasing threat to ecosystem services. The year 2023 set a record for surface burned across Canada (MacCarthy et al., 2024; Wang et al., 2024). As water table position and moisture can constitute an indicator of fire risk, understanding the water balance dynamics of peatland-dominated basins may help in managing fire risk (Kartiwa et al., 2023; Mortelmans et al., 2024). In October 2022, the Scotty Creek basin was impacted by a late-season wildfire. While the wetland flux tower and several cutthroat flumes remained intact (Fig. S1), the landscape flux tower was destroyed and rebuilt in March 2023. Our work, which contributes to understanding the hydrological response of a rapidly thawing boreal peatland complex, can serve as a baseline for understanding the combined effects of permafrost thaw accelerated by wildfire.
This study contributes to a better understanding of the hydrological response of small-scale basins (here: “sub-basins”) within the headwater portion of a meso-scale basin (here: “basin”) in the Taiga Plains in northwestern Canada. We provide insights into how the hydrological responses of rapidly thawing boreal peatland complexes – at both the sub-basin and basin scales – are shaped by complex factors (e.g. changes in land cover and hydrological connectivity) that extend beyond year-to-year changes in precipitation and ET. Specifically, we find that:
-
determining runoff in low-relief landscapes such as thawing boreal peatland complexes is challenging because
- –
sub-basin and basin boundaries and the resulting drainage areas must be approached with caution, since permafrost ridges act as barriers isolating wetlands from the effective drainage network, and
- –
of difficulties in integrating spring freshet runoff into the growing season water balance.
- –
-
the small-scale headwater portion is representative of the corresponding meso-scale basin. At both scales, our analysis shows that
-
ET is the dominant water loss, on average more than double that of runoff,
-
the temporal dynamics of the growing season (sub-basin) and annual water balance components (basin) are similar,
-
spring freshet peaks are similar, except for the driest year, when the basin runoff is more than 10 times lower than the sub-basin runoff, and
-
spring freshet contributions to runoff in the April–September period are similar.
-
-
long-term changes in the basin-scale runoff ratio cannot be explained by precipitation and ET alone. The increase in the runoff ratio from 1996 to 2012 likely reflects enhanced hydrological connectivity and wetland drainage. In contrast, the shift to a lower mean runoff ratio from 2013 to 2022 may be attributed to wetland drying following loss of connection to the drainage network. We propose that wetland drying, observed at the headwater sub-basin scale, accounts for the declining runoff ratio at the basin scale. At the same time, new isolated wetlands are forming, and additional wetlands may be becoming connected to the drainage system. Thus, the observed changes in runoff ratio likely reflect the competing influences of wetland drying and the emergence of new hydrological connections.
Table A1List of all the variables and expressions used in this study (left column), alongside the corresponding abbreviations (right column).
Additional data are provided to this work as Supplement. Further information can be supplied on request to the corresponding author.
The supplement related to this article is available online at https://doi.org/10.5194/hess-29-4871-2025-supplement.
AL: formal analysis; writing – original draft; writing – review and editing GHG: formal analysis; data curation; methodology; writing – original draft; writing – review and editing MH: data curation; writing – review and editing JF: writing – review and editing YR: data curation; writing – review and editing MD: writing – review and editing RC: data collection and instrumentation; formal analysis; writing – review and editing WQ: formal analysis; writing – review and editing TM: writing – review and editing OS: conceptualisation; formal analysis; data curation; funding acquisition; methodology; supervision; writing – original draft; writing – review and editing.
The contact author has declared that none of the authors has any competing interests.
Publisher's note: Copernicus Publications remains neutral with regard to jurisdictional claims made in the text, published maps, institutional affiliations, or any other geographical representation in this paper. While Copernicus Publications makes every effort to include appropriate place names, the final responsibility lies with the authors.
We gratefully acknowledge the support of the Dehcho First Nations, particularly the Liidlii Kue First Nation, for their support of our research activities on their traditional land. The authors thank Jessica Hanisch for her involvement in the initial data collection. Finally, we gratefully acknowledge the two anonymous reviewers for their valuable comments, which greatly improved the manuscript.
Oliver Sonnentag acknowledges support through TED Audacious for Permafrost Pathways, the Canada Research Chair (grant no. CRC-2018-279 00259), NSERC Discovery Grants (grant no. DGPIN-280 2018-05743) and FQRNT Projet de Recherche en Équipe programs (grant no. RQ000082) and the Global Water Futures project Northern Water Futures. This work also benefited from ArcticNet funding for the Dehcho Collaborative on Permafrost (DCoP). This research is part of Can-Peat: Canadian peatlands as nature-based climate solutions (https://uwaterloo.ca/can-peat, last access: 31 May 2024). This project was undertaken with the financial support of the Government of Canada, Ce projet a été réalisé avec l'appui financier du gouvernement du Canada.
This paper was edited by Alberto Guadagnini and reviewed by two anonymous referees.
Al-Muqdadi, S. W. and Merkel, B. J.: Automated watershed evaluation of flat terrain, J. Water Resour. Prot., 3, 892–903, https://doi.org/10.4236/jwarp.2011.312099, 2011.
Arain, M. A., Black, T. A., Barr, A. G., Griffis, T. J., Morgenstern, K., and Nesic, Z.: Year-round observations of the energy and water vapour fluxes above a boreal black spruce forest, Hydrol. Process., 17, 3581–3600, https://doi.org/10.1002/hyp.1348, 2003.
Aylesworth, J. and Kettles, I.: Distribution of fen and bog in the Mackenzie valley, 60° N–60° N, Geological Survey of Canada, Bulletin 547, 49–55, 2000.
Baldocchi, D.: Measuring fluxes of trace gases and energy between ecosystems and the atmosphere – the state and future of the eddy covariance method, Glob. Change Biol., 20, 3600–3609, https://doi.org/10.1111/gcb.12649, 2014.
Baltzer, J. L., Veness, T., Chasmer, L. E., Sniderhan, A. E., and Quinton, W. L.: Forests on thawing permafrost: fragmentation, edge effects, and net forest loss, Glob. Change Biol., 20, 824–834, https://doi.org/10.1111/gcb.12349, 2014.
Barr, A. G., Van Der Kamp, G., Black, T. A., McCaughey, J. H., and Nesic, Z.: Energy balance closure at the BERMS flux towers in relation to the water balance of the White Gull Creek watershed 1999–2009, Agr. Forest Meteorol., 153, 3–13, https://doi.org/10.1016/j.agrformet.2011.05.017, 2012.
Biskaborn, B. K., Smith, S. L., Noetzli, J., Matthes, H., Vieira, G., Streletskiy, D. A., Schoeneich, P., Romanovsky, V. E., Lewkowicz, A. G., Abramov, A., Allard, M., Boike, J., Cable, W. L., Christiansen, H. H., Delaloye, R., Diekmann, B., Drozdov, D., Etzelmüller, B., Grosse, G., Guglielmin, M., Ingeman-Nielsen, T., Isaksen, K., Ishikawa, M., Johansson, M., Johannsson, H., Joo, A., Kaverin, D., Kholodov, A., Konstantinov, P., Kröger, T., Lambiel, C., Lanckman, J.-P., Luo, D., Malkova, G., Meiklejohn, I., Moskalenko, N., Oliva, M., Phillips, M., Ramos, M., Sannel, A. B. K., Sergeev, D., Seybold, C., Skryabin, P., Vasiliev, A., Wu, Q., Yoshikawa, K., Zheleznyak, M., and Lantuit, H.: Permafrost is warming at a global scale, Nat. Commun., 10, 264, https://doi.org/10.1038/s41467-018-08240-4, 2019.
Bolton, W. R., Hinzman, L., and Yoshikawa, K.: Water balance dynamics of three small catchments in a Sub-Arctic boreal forest, IAHS-AISH P., 290, 213–223, 2004.
Box, J. E., Colgan, W. T., Christensen, T. R., Schmidt, N. M., Lund, M., Parmentier, F.-J. W., Brown, R., Bhatt, U. S., Euskirchen, E. S., Romanovsky, V. E., Walsh, J. E., Overland, J. E., Wang, M., Corell, R. W., Meier, W. N., Wouters, B., Mernild, S., Mård, J., Pawlak, J., and Olsen, M. S.: Key indicators of Arctic climate change: 1971–2017, Environ. Res. Lett., 14, 045010, https://doi.org/10.1088/1748-9326/aafc1b, 2019.
Burd, K., Tank, S. E., Dion, N., Quinton, W. L., Spence, C., Tanentzap, A. J., and Olefeldt, D.: Seasonal shifts in export of DOC and nutrients from burned and unburned peatland-rich catchments, Northwest Territories, Canada, Hydrol. Earth Syst. Sci., 22, 4455–4472, https://doi.org/10.5194/hess-22-4455-2018, 2018.
Camill, P., Lynch, J. A., Clark, J. S., Adams, J. B., and Jordan, B.: Changes in biomass, aboveground net primary production, and peat accumulation following permafrost thaw in the boreal peatlands of Manitoba, Canada, Ecosystems, 4, 461–478, https://doi.org/10.1007/s10021-001-0022-3, 2001.
Carey, S. K., Tetzlaff, D., Seibert, J., Soulsby, C., Buttle, J., Laudon, H., McDonnell, J., McGuire, K., Caissie, D., Shanley, J., Kennedy, M., Devito, K., and Pomeroy, J. W.: Inter-comparison of hydro-climatic regimes across northern catchments: synchronicity, resistance and resilience, Hydrol. Process., 24, 3591–3602, https://doi.org/10.1002/hyp.7880, 2010.
Carpino, O., Berg, A. A., Quinton, W. L., and Adams, J. R.: Climate change and permafrost thaw-induced boreal forest loss in northwestern Canada, Environ. Res. Lett., 13, 084018, https://doi.org/10.1088/1748-9326/aad74e, 2018.
Carpino, O., Haynes, K., Connon, R., Craig, J., Devoie, É., and Quinton, W.: Long-term climate-influenced land cover change in discontinuous permafrost peatland complexes, Hydrol. Earth Syst. Sci., 25, 3301–3317, https://doi.org/10.5194/hess-25-3301-2021, 2021.
Chapin, F. S., Woodwell, G. M., Randerson, J. T., Rastetter, E. B., Lovett, G. M., Baldocchi, D. D., Clark, D. A., Harmon, M. E., Schimel, D. S., Valentini, R., Wirth, C., Aber, J. D., Cole, J. J., Goulden, M. L., Harden, J. W., Heimann, M., Howarth, R. W., Matson, P. A., McGuire, A. D., Melillo, J. M., Mooney, H. A., Neff, J. C., Houghton, R. A., Pace, M. L., Ryan, M. G., Running, S. W., Sala, O. E., Schlesinger, W. H., and Schulze, E.-D.: Reconciling carbon-cycle concepts, terminology, and methods, Ecosystems, 9, 1041–1050, https://doi.org/10.1007/s10021-005-0105-7, 2006.
Chasmer, L. and Hopkinson, C.: Threshold loss of discontinuous permafrost and landscape evolution, Glob. Change Biol., 23, 2672–2686, https://doi.org/10.1111/gcb.13537, 2017.
Chasmer, L., Hopkinson, C., Veness, T., Quinton, W., and Baltzer, J.: A decision-tree classification for low-lying complex land cover types within the zone of discontinuous permafrost, Remote Sens. Environ., 143, 73–84, https://doi.org/10.1016/j.rse.2013.12.016, 2014.
Clayton, L. K., Schaefer, K., Battaglia, M. J., Bourgeau-Chavez, L., Chen, J., Chen, R. H., Chen, A., Bakian-Dogaheh, K., Grelik, S., Jafarov, E., Liu, L., Michaelides, R. J., Moghaddam, M., Parsekian, A. D., Rocha, A. V., Schaefer, S. R., Sullivan, T., Tabatabaeenejad, A., Wang, K., Wilson, C. J., Zebker, H. A., Zhang, T., and Zhao, Y.: Active layer thickness as a function of soil water content, Environ. Res. Lett., 16, 055028, https://doi.org/10.1088/1748-9326/abfa4c, 2021.
Connon, R., Devoie, É., Hayashi, M., Veness, T., and Quinton, W.: The influence of shallow taliks on permafrost thaw and active layer dynamics in subarctic Canada, J. Geophys. Res.-Earth, 123, 281–297, https://doi.org/10.1002/2017JF004469, 2018.
Connon, R. F., Quinton, W. L., Craig, J. R., and Hayashi, M.: Changing hydrologic connectivity due to permafrost thaw in the lower Liard River valley, NWT, Canada, Hydrol. Process., 28, 4163–4178, https://doi.org/10.1002/hyp.10206, 2014.
Connon, R. F., Quinton, W. L., Craig, J. R., Hanisch, J., and Sonnentag, O.: The hydrology of interconnected bog complexes in discontinuous permafrost terrains: Hydrology of Interconnected Bogs in Discontinuous Permafrost, Hydrol. Process., 29, 3831–3847, https://doi.org/10.1002/hyp.10604, 2015.
Connon, R. F., Chasmer, L., Haughton, E., Helbig, M., Hopkinson, C., Sonnentag, O., and Quinton, W. L.: The implications of permafrost thaw and land cover change on snow water equivalent accumulation, melt and runoff in discontinuous permafrost peatlands, Hydrol. Process., 35, e14363, https://doi.org/10.1002/hyp.14363, 2021.
Datta, S., Karmakar, S., Mezbahuddin, S., Hossain, M. M., Chaudhary, B. S., Hoque, Md. E., Abdullah Al Mamun, M. M., and Baul, T. K.: The limits of watershed delineation: implications of different DEMs, DEM resolutions, and area threshold values, Hydrol. Res., 53, 1047–1062, https://doi.org/10.2166/nh.2022.126, 2022.
Devoie, É. G., Craig, J. R., Connon, R. F., and Quinton, W. L.: Taliks: A tipping point in discontinuous permafrost degradation in peatlands, Water Resour. Res., 55, 9838–9857, https://doi.org/10.1029/2018WR024488, 2019.
Devoie, É. G., Craig, J. R., Dominico, M., Carpino, O., Connon, R. F., Rudy, A. C. A., and Quinton, W. L.: Mechanisms of discontinuous permafrost thaw in peatlands, J. Geophys. Res.-Earth, 126, e2021JF006204, https://doi.org/10.1029/2021JF006204, 2021.
Ecosystem Classification Group: Ecological regions of the Northwest Territories – Taiga Plains, Department of Environment and Natural Resources, Government of the Northwest Territories, Yellowknife, NT, Canada, 2007.
Environmental Systems Research Institute (ESRI): ArcGIS Desktop Version 10.2, 2014.
Ernakovich, J. G., Barbato, R. A., Rich, V. I., Schädel, C., Hewitt, R. E., Doherty, S. J., Whalen, E. D., Abbott, B. W., Barta, J., Biasi, C., Chabot, C. L., Hultman, J., Knoblauch, C., Vetter, M. C. Y. L., Leewis, M., Liebner, S., Mackelprang, R., Onstott, T. C., Richter, A., Schütte, U. M. E., Siljanen, H. M. P., Taş, N., Timling, I., Vishnivetskaya, T. A., Waldrop, M. P., and Winkel, M.: Microbiome assembly in thawing permafrost and its feedbacks to climate, Glob. Change Biol., 28, 5007–5026, https://doi.org/10.1111/gcb.16231, 2022.
Errington, R. C., Macdonald, S. E., and Bhatti, J. S.: Rate of permafrost thaw and associated plant community dynamics in peatlands of northwestern Canada, J. Ecol., 1365-2745.14339, https://doi.org/10.1111/1365-2745.14339, 2024.
Evenson, G. R., Jones, C. N., McLaughlin, D. L., Golden, H. E., Lane, C. R., DeVries, B., Alexander, L. C., Lang, M. W., McCarty, G. W., and Sharifi, A.: A watershed-scale model for depressional wetland-rich landscapes, J. Hydrol. X, 1, 100002, https://doi.org/10.1016/j.hydroa.2018.10.002, 2018.
Foster, A. C., Wang, J. A., Frost, G. V., Davidson, S. J., Hoy, E., Turner, K. W., Sonnentag, O., Epstein, H., Berner, L. T., Armstrong, A. H., Kang, M., Rogers, B. M., Campbell, E., Miner, K. R., Orndahl, K. M., Bourgeau-Chavez, L. L., Lutz, D. A., French, N., Chen, D., Du, J., Shestakova, T. A., Shuman, J. K., Tape, K., Virkkala, A.-M., Potter, C., and Goetz, S.: Disturbances in North American boreal forest and Arctic tundra: impacts, interactions, and responses, Environ. Res. Lett., 17, 113001, https://doi.org/10.1088/1748-9326/ac98d7, 2022.
Gandois, L., Tananaev, N. I., Prokushkin, A., Solnyshkin, I., and Teisserenc, R.: Seasonality of DOC export from a russian subarctic catchment underlain by discontinuous permafrost, highlighted by high-frequency monitoring, J. Geophys. Res.-Biogeo., 126, https://doi.org/10.1029/2020JG006152, 2021.
Gao, H., Sabo, J. L., Chen, X., Liu, Z., Yang, Z., Ren, Z., and Liu, M.: Landscape heterogeneity and hydrological processes: a review of landscape-based hydrological models, Landscape Ecol., 33, 1461–1480, https://doi.org/10.1007/s10980-018-0690-4, 2018.
Garon-Labrecque, M.-È., Léveillé-Bourret, É., Higgins, K., and Sonnentag, O.: Additions to the boreal flora of the Northwest Territories with a preliminary vascular flora of Scotty Creek, Can. Field Nat., 129, 349, https://doi.org/10.22621/cfn.v129i4.1757, 2016.
Genxu, W., Guangsheng, L., and Chunjie, L.: Effects of changes in alpine grassland vegetation cover on hillslope hydrological processes in a permafrost watershed, J. Hydrol., 444–445, 22–33, https://doi.org/10.1016/j.jhydrol.2012.03.033, 2012.
Gibson, C. M., Chasmer, L. E., Thompson, D. K., Quinton, W. L., Flannigan, M. D., and Olefeldt, D.: Wildfire as a major driver of recent permafrost thaw in boreal peatlands, Nat. Commun., 9, 3041, https://doi.org/10.1038/s41467-018-05457-1, 2018.
Gibson, C. M., Brinkman, T., Cold, H., Brown, D., and Turetsky, M.: Identifying increasing risks of hazards for northern land-users caused by permafrost thaw: integrating scientific and community-based research approaches, Environ. Res. Lett., 16, 064047, https://doi.org/10.1088/1748-9326/abfc79, 2021.
Gordon, J., Quinton, W., Branfireun, B. A., and Olefeldt, D.: Mercury and methylmercury biogeochemistry in a thawing permafrost wetland complex, Northwest Territories, Canada: Northwest Territories, Canada, Hydrol. Process., 30, 3627–3638, https://doi.org/10.1002/hyp.10911, 2016.
Gruber, S.: Derivation and analysis of a high-resolution estimate of global permafrost zonation, The Cryosphere, 6, 221–233, https://doi.org/10.5194/tc-6-221-2012, 2012.
Hayashi, M., Quinton, W. L., Pietroniro, A., and Gibson, J. J.: Hydrologic functions of wetlands in a discontinuous permafrost basin indicated by isotopic and chemical signatures, J. Hydrol., 296, 81–97, https://doi.org/10.1016/j.jhydrol.2004.03.020, 2004.
Haynes, K. M., Connon, R. F., and Quinton, W. L.: Permafrost thaw induced drying of wetlands at Scotty Creek, NWT, Canada, Environ. Res. Lett., 13, 114001, https://doi.org/10.1088/1748-9326/aae46c, 2018.
Haynes, K. M., Frederick, I., Disher, B., Carpino, O., and Quinton, W. L.: Long-term trends in wetland event response with permafrost thaw-induced landscape transition and hummock development, Ecohydrology, 16, e2515, https://doi.org/10.1002/eco.2515, 2022.
He, Z. and Pomeroy, J. W.: Assessing hydrological sensitivity to future climate change over the Canadian southern boreal forest, J. Hydrol., 624, 129897, https://doi.org/10.1016/j.jhydrol.2023.129897, 2023.
Heffernan, L., Kothawala, D. N., and Tranvik, L. J.: Review article: Terrestrial dissolved organic carbon in northern permafrost, The Cryosphere, 18, 1443–1465, https://doi.org/10.5194/tc-18-1443-2024, 2024.
Helbig, M., Pappas, C., and Sonnentag, O.: Permafrost thaw and wildfire: Equally important drivers of boreal tree cover changes in the Taiga Plains, Canada, Geophys. Res. Lett., 43, 1598–1606, https://doi.org/10.1002/2015GL067193, 2016a.
Helbig, M., Wischnewski, K., Kljun, N., Chasmer, L. E., Quinton, W. L., Detto, M., and Sonnentag, O.: Regional atmospheric cooling and wetting effect of permafrost thaw-induced boreal forest loss, Glob. Change Biol., 22, 4048–4066, https://doi.org/10.1111/gcb.13348, 2016b.
Helbig, M., Chasmer, L. E., Kljun, N., Quinton, W. L., Treat, C. C., and Sonnentag, O.: The positive net radiative greenhouse gas forcing of increasing methane emissions from a thawing boreal forest-wetland landscape, Glob. Change Biol., 23, 2413–2427, https://doi.org/10.1111/gcb.13520, 2017a.
Helbig, M., Quinton, W. L., and Sonnentag, O.: Warmer spring conditions increase annual methane emissions from a boreal peat landscape with sporadic permafrost, Environ. Res. Lett., 12, 115009, https://doi.org/10.1088/1748-9326/aa8c85, 2017b.
Helbig, M., Waddington, J. M., Alekseychik, P., Amiro, B., Aurela, M., Barr, A. G., Black, T. A., Carey, S. K., Chen, J., Chi, J., Desai, A. R., Dunn, A., Euskirchen, E. S., Flanagan, L. B., Friborg, T., Garneau, M., Grelle, A., Harder, S., Heliasz, M., Humphreys, E. R., Ikawa, H., Isabelle, P.-E., Iwata, H., Jassal, R., Korkiakoski, M., Kurbatova, J., Kutzbach, L., Lapshina, E., Lindroth, A., Löfvenius, M. O., Lohila, A., Mammarella, I., Marsh, P., Moore, P. A., Maximov, T., Nadeau, D. F., Nicholls, E. M., Nilsson, M. B., Ohta, T., Peichl, M., Petrone, R. M., Prokushkin, A., Quinton, W. L., Roulet, N., Runkle, B. R. K., Sonnentag, O., Strachan, I. B., Taillardat, P., Tuittila, E.-S., Tuovinen, J.-P., Turner, J., Ueyama, M., Varlagin, A., Vesala, T., Wilmking, M., Zyrianov, V., and Schulze, C.: The biophysical climate mitigation potential of boreal peatlands during the growing season, Environ. Res. Lett., 15, 104004, https://doi.org/10.1088/1748-9326/abab34, 2020a.
Helbig, M., Waddington, J. M., Alekseychik, P., Amiro, B. D., Aurela, M., Barr, A. G., Black, T. A., Blanken, P. D., Carey, S. K., Chen, J., Chi, J., Desai, A. R., Dunn, A., Euskirchen, E. S., Flanagan, L. B., Forbrich, I., Friborg, T., Grelle, A., Harder, S., Heliasz, M., Humphreys, E. R., Ikawa, H., Isabelle, P.-E., Iwata, H., Jassal, R., Korkiakoski, M., Kurbatova, J., Kutzbach, L., Lindroth, A., Löfvenius, M. O., Lohila, A., Mammarella, I., Marsh, P., Maximov, T., Melton, J. R., Moore, P. A., Nadeau, D. F., Nicholls, E. M., Nilsson, M. B., Ohta, T., Peichl, M., Petrone, R. M., Petrov, R., Prokushkin, A., Quinton, W. L., Reed, D. E., Roulet, N. T., Runkle, B. R. K., Sonnentag, O., Strachan, I. B., Taillardat, P., Tuittila, E.-S., Tuovinen, J.-P., Turner, J., Ueyama, M., Varlagin, A., Wilmking, M., Wofsy, S. C., and Zyrianov, V.: Increasing contribution of peatlands to boreal evapotranspiration in a warming climate, Nat. Clim. Change, 10, 555–560, https://doi.org/10.1038/s41558-020-0763-7, 2020b.
Ingram, H. A. P.: Soil layers in mires: function and terminology, J. Soil Sci., 29, 224–227, https://doi.org/10.1111/j.1365-2389.1978.tb02053.x, 1978.
Isabelle, P.-E., Nadeau, D. F., Rousseau, A. N., and Anctil, F.: Water budget, performance of evapotranspiration formulations, and their impact on hydrological modeling of a small boreal peatland-dominated watershed, Can. J. Earth Sci., 55, 206–220, https://doi.org/10.1139/cjes-2017-0046, 2018.
Isabelle, P.-E., Nadeau, D. F., Anctil, F., Rousseau, A. N., Jutras, S., and Music, B.: Impacts of high precipitation on the energy and water budgets of a humid boreal forest, Agr. Forest Meteorol., 280, 107813, https://doi.org/10.1016/j.agrformet.2019.107813, 2020.
Jarvis, A., Reuter, H. I., Nelson, A., and Asensio, E.: Hole-filled SRTM for the globe Version 4, available from the CGIAR-CSI SRTM 90 m Database, http://srtm.csi.cgiar.org (last access: 31 May 2024), 2008.
Jiang, C. and Ryu, Y.: Multi-scale evaluation of global gross primary productivity and evapotranspiration products derived from Breathing Earth System Simulator (BESS), Remote Sens. Environ., 186, 528–547, https://doi.org/10.1016/j.rse.2016.08.030, 2016.
Jones, M. W., Abatzoglou, J. T., Veraverbeke, S., Andela, N., Lasslop, G., Forkel, M., Smith, A. J. P., Burton, C., Betts, R. A., Van Der Werf, G. R., Sitch, S., Canadell, J. G., Santín, C., Kolden, C., Doerr, S. H., and Le Quéré, C.: Global and regional trends and drivers of fire under climate change, Rev. Geophys., 60, e2020RG000726, https://doi.org/10.1029/2020RG000726, 2022.
Jutebring Sterte, E., Johansson, E., Sjöberg, Y., Huseby Karlsen, R., and Laudon, H.: Groundwater-surface water interactions across scales in a boreal landscape investigated using a numerical modelling approach, J. Hydrol., 560, 184–201, https://doi.org/10.1016/j.jhydrol.2018.03.011, 2018.
Jutebring Sterte, E., Lidman, F., Lindborg, E., Sjöberg, Y., and Laudon, H.: How catchment characteristics influence hydrological pathways and travel times in a boreal landscape, Hydrol. Earth Syst. Sci., 25, 2133–2158, https://doi.org/10.5194/hess-25-2133-2021, 2021.
Kartiwa, B., Adi, S. H., Sosiawan, H., Heryani, N., Rejekiningrum, P., Dariah, A., Maswar, Suratman, Lenin, I., and Widiyono, W.: Water level and soil moisture monitoring for peatland fire risk indicator, IOP C. Ser. Earth Env., 1201, 012066, https://doi.org/10.1088/1755-1315/1201/1/012066, 2023.
Kemeny, P. C., Li, G. K., Douglas, M., Berelson, W., Chadwick, A. J., Dalleska, N. F., Lamb, M. P., Larsen, W., Magyar, J. S., Rollins, N. E., Rowland, J., Smith, M. I., Torres, M. A., Webb, S. M., Fischer, W. W., and West, A. J.: Arctic permafrost thawing enhances sulfide oxidation, Global Biogeochem. Cy., 37, e2022GB007644, https://doi.org/10.1029/2022GB007644, 2023.
Keys, L. and Baade, J.: Uncertainty in catchment delineations as a result of digital elevation model choice, Hydrology, 6, 13, https://doi.org/10.3390/hydrology6010013, 2019.
King, M., Altdorff, D., Li, P., Galagedara, L., Holden, J., and Unc, A.: Northward shift of the agricultural climate zone under 21st-century global climate change, Sci. Rep.-UK, 8, 7904, https://doi.org/10.1038/s41598-018-26321-8, 2018.
Klotz, L. A., Sonnentag, O., Wang, Z., Wang, J. A., and Kang, M.: Oil and natural gas wells across the NASA ABoVE domain: fugitive methane emissions and broader environmental impacts, Environ. Res. Lett., 18, 035008, https://doi.org/10.1088/1748-9326/acbe52, 2023.
Langer, M., von Deimling, T. S., Westermann, S., Rolph, R., Rutte, R., Antonova, S., Rachold, V., Schultz, M., Oehme, A., and Grosse, G.: Thawing permafrost poses environmental threat to thousands of sites with legacy industrial contamination, Nat. Commun., 14, 1721, https://doi.org/10.1038/s41467-023-37276-4, 2023.
Laudon, H., Köhler, S., and Buffam, I.: Seasonal TOC export from seven boreal catchments in northern Sweden, Aquat. Sci.-Res. Boundaries, 66, 223–230, https://doi.org/10.1007/s00027-004-0700-2, 2004.
Li, W., Yan, D., Weng, B., and Zhu, L.: Research progress on hydrological effects of permafrost degradation in the Northern Hemisphere, Geoderma, 438, 116629, https://doi.org/10.1016/j.geoderma.2023.116629, 2023.
Li, X.-Y., Jin, H.-J., Wang, H.-W., Marchenko, S. S., Shan, W., Luo, D.-L., He, R.-X., Spektor, V., Huang, Y.-D., Li, X.-Y., and Jia, N.: Influences of forest fires on the permafrost environment: A review, Adv. Clim. Change Res., 12, 48–65, https://doi.org/10.1016/j.accre.2021.01.001, 2021.
MacCarthy, J., Tyukavina, A., Weisse, M. J., Harris, N., and Glen, E.: Extreme wildfires in Canada and their contribution to global loss in tree cover and carbon emissions in 2023, Glob. Change Biol., 30, e17392, https://doi.org/10.1111/gcb.17392, 2024.
Mack, M., Connon, R., Makarieva, O., McLaughlin, J., Nesterova, N., and Quinton, W.: Heterogenous runoff trends in peatland-dominated basins throughout the circumpolar North, Environ. Res. Commun., 3, 075006, https://doi.org/10.1088/2515-7620/ac11ed, 2021.
McCarter, C. P. R., Rezanezhad, F., Quinton, W. L., Gharedaghloo, B., Lennartz, B., Price, J., Connon, R., and Van Cappellen, P.: Pore-scale controls on hydrological and geochemical processes in peat: Implications on interacting processes, Earth-Sci. Rev., 207, 103227, https://doi.org/10.1016/j.earscirev.2020.103227, 2020.
McClymont, A. F., Hayashi, M., Bentley, L. R., and Christensen, B. S.: Geophysical imaging and thermal modeling of subsurface morphology and thaw evolution of discontinuous permafrost, J. Geophys. Res.-Earth, 118, 1826–1837, https://doi.org/10.1002/jgrf.20114, 2013.
Moges, D. M., Virro, H., Kmoch, A., Cibin, R., Rohith, A. N., Martínez-Salvador, A., Conesa-García, C., and Uuemaa, E.: How does the choice of DEMs affect catchment hydrological modeling?, Sci. Total Environ., 892, 164627, https://doi.org/10.1016/j.scitotenv.2023.164627, 2023.
Morris, P. J., Waddington, J. M., Benscoter, B. W., and Turetsky, M. R.: Conceptual frameworks in peatland ecohydrology: looking beyond the two-layered (acrotelm-catotelm) model, Ecohydrology, 4, 1–11, https://doi.org/10.1002/eco.191, 2011.
Mortelmans, J., Felsberg, A., De Lannoy, G. J. M., Veraverbeke, S., Field, R. D., Andela, N., and Bechtold, M.: Improving the fire weather index system for peatlands using peat-specific hydrological input data, Nat. Hazards Earth Syst. Sci., 24, 445–464, https://doi.org/10.5194/nhess-24-445-2024, 2024.
Nakai, T., Kim, Y., Busey, R. C., Suzuki, R., Nagai, S., Kobayashi, H., Park, H., Sugiura, K., and Ito, A.: Characteristics of evapotranspiration from a permafrost black spruce forest in interior Alaska, Polar Sci., 7, 136–148, https://doi.org/10.1016/j.polar.2013.03.003, 2013.
Nousu, J.-P., Lafaysse, M., Mazzotti, G., Ala-aho, P., Marttila, H., Cluzet, B., Aurela, M., Lohila, A., Kolari, P., Boone, A., Fructus, M., and Launiainen, S.: Modeling snowpack dynamics and surface energy budget in boreal and subarctic peatlands and forests, The Cryosphere, 18, 231–263, https://doi.org/10.5194/tc-18-231-2024, 2024.
Pelletier, N., Talbot, J., Olefeldt, D., Turetsky, M., Blodau, C., Sonnentag, O., and Quinton, W. L.: Influence of Holocene permafrost aggradation and thaw on the paleoecology and carbon storage of a peatland complex in northwestern Canada, The Holocene, 27, 1391–1405, https://doi.org/10.1177/0959683617693899, 2017.
Perron, N., Baltzer, J. L., and Sonnentag, O.: Spatial and temporal variation in forest transpiration across a forested boreal peatland complex, Hydrol. Process., 37, e14815, https://doi.org/10.1002/hyp.14815, 2023.
Phillips, R. W., Spence, C., and Pomeroy, J. W.: Connectivity and runoff dynamics in heterogeneous basins, Hydrol. Process., 25, 3061–3075, https://doi.org/10.1002/hyp.8123, 2011.
Pi, K., Bieroza, M., Brouchkov, A., Chen, W., Dufour, L. J. P., Gongalsky, K. B., Herrmann, A. M., Krab, E. J., Landesman, C., Laverman, A. M., Mazei, N., Mazei, Y., Öquist, M. G., Peichl, M., Pozdniakov, S., Rezanezhad, F., Roose-Amsaleg, C., Shatilovich, A., Shi, A., Smeaton, C. M., Tong, L., Tsyganov, A. N., and Van Cappellen, P.: The cold region Critical Zone in transition: Responses to climate warming and land use change, Annu. Rev. Env. Resour., 46, 111–134, https://doi.org/10.1146/annurev-environ-012220-125703, 2021.
Pohl, S., Marsh, P., and Bonsal, B. R.: Modeling the impact of climate change on runoff and annual water balance of an Arctic headwater basin, ARCTIC, 60, 173–186, https://doi.org/10.14430/arctic242, 2007.
Price, J. S.: The influence of wetland and mineral terrain types on snowmelt runoff in the subarctic, Can. Water Resour. J., 12, 43–52, https://doi.org/10.4296/cwrj1202043, 1987.
Quinton, W., Berg, A., Braverman, M., Carpino, O., Chasmer, L., Connon, R., Craig, J., Devoie, É., Hayashi, M., Haynes, K., Olefeldt, D., Pietroniro, A., Rezanezhad, F., Schincariol, R., and Sonnentag, O.: A synthesis of three decades of hydrological research at Scotty Creek, NWT, Canada, Hydrol. Earth Syst. Sci., 23, 2015–2039, https://doi.org/10.5194/hess-23-2015-2019, 2019.
Quinton, W. L., Hayashi, M., and Pietroniro, A.: Connectivity and storage functions of channel fens and flat bogs in northern basins, Hydrol. Process., 17, 3665–3684, https://doi.org/10.1002/hyp.1369, 2003.
Quinton, W. L., Hayashi, M., Blais, K. E., Wright, N., and Peitroniro, A.: The water balance of wetland-dominated permafrost basins, IAHS-AISH P., 290, 186–194, 2004.
Quinton, W. L., Hayashi, M., and Carey, S. K.: Peat hydraulic conductivity in cold regions and its relation to pore size and geometry, Hydrol. Process., 22, 2829–2837, https://doi.org/10.1002/hyp.7027, 2008.
Quinton, W. L., Hayashi, M., and Chasmer, L. E.: Peatland hydrology of discontinuous permafrost in the Northwest Territories: Overview and synthesis, Can. Water Resour. J., 34, 311–328, https://doi.org/10.4296/cwrj3404311, 2009.
Ramage, J., Kuhn, M., Virkkala, A., Voigt, C., Marushchak, M. E., Bastos, A., Biasi, C., Canadell, J. G., Ciais, P., López-Blanco, E., Natali, S. M., Olefeldt, D., Potter, S., Poulter, B., Rogers, B. M., Schuur, E. A. G., Treat, C., Turetsky, M. R., Watts, J., and Hugelius, G.: The net GHG balance and budget of the permafrost region (2000–2020) from ecosystem flux upscaling, Global Biogeochem. Cy., 38, e2023GB007953, https://doi.org/10.1029/2023GB007953, 2024.
Ran, Y., Li, X., Cheng, G., Che, J., Aalto, J., Karjalainen, O., Hjort, J., Luoto, M., Jin, H., Obu, J., Hori, M., Yu, Q., and Chang, X.: New high-resolution estimates of the permafrost thermal state and hydrothermal conditions over the Northern Hemisphere, Earth Syst. Sci. Data, 14, 865–884, https://doi.org/10.5194/essd-14-865-2022, 2022.
Rantanen, M., Karpechko, A. Yu., Lipponen, A., Nordling, K., Hyvärinen, O., Ruosteenoja, K., Vihma, T., and Laaksonen, A.: The Arctic has warmed nearly four times faster than the globe since 1979, Commun. Earth Environ., 3, 168, https://doi.org/10.1038/s43247-022-00498-3, 2022.
Schuur, E. A. G., Abbott, B. W., Commane, R., Ernakovich, J., Euskirchen, E., Hugelius, G., Grosse, G., Jones, M., Koven, C., Leshyk, V., Lawrence, D., Loranty, M. M., Mauritz, M., Olefeldt, D., Natali, S., Rodenhizer, H., Salmon, V., Schädel, C., Strauss, J., Treat, C., and Turetsky, M.: Permafrost and climate change: carbon cycle feedbacks from the warming arctic, Annu. Rev. Env. Resour., 47, 343–371, https://doi.org/10.1146/annurev-environ-012220-011847, 2022.
Shirley, I. A., Mekonnen, Z. A., Wainwright, H., Romanovsky, V. E., Grant, R. F., Hubbard, S. S., Riley, W. J., and Dafflon, B.: Near-surface hydrology and soil properties drive heterogeneity in permafrost distribution, vegetation dynamics, and Carbon Cycling in a Sub-Arctic Watershed, J. Geophys. Res.-Biogeo., 127, e2022JG006864, https://doi.org/10.1029/2022JG006864, 2022.
Siddiqui, R., Lashari, B., and Skogerboe, G. V.: Converting a fabricated cutthroat flume into a discharge measuring instrument, Pakistan National Program iv, International Irrigation Management Institute (IIMI), Hyderabad, Pakistan, 61p., https://cgspace.cgiar.org/items/717f3491-062c-41d0-bea8-4aee966cefc1 (last access: 29 September 2025), 1996.
Sjöberg, Y., Jan, A., Painter, S. L., Coon, E. T., Carey, M. P., O'Donnell, J. A., and Koch, J. C.: Permafrost promotes shallow groundwater flow and warmer headwater streams, Water Resour. Res., 57, e2020WR027463, https://doi.org/10.1029/2020WR027463, 2021.
Skogerboe, G. V., Gaylord, V., ASCE, M., Bennett, R. S., Walker, W. R., and ASCE, A. M.: Generalized discharge relations for cutthroad flumes, J. Irr. Drain. Div.-ASCE, 98, 569–583, 1972.
Smith, S. L., O'Neill, H. B., Isaksen, K., Noetzli, J., and Romanovsky, V. E.: The changing thermal state of permafrost, Nat. Rev. Earth Environ., 3, 10–23, https://doi.org/10.1038/s43017-021-00240-1, 2022.
Song, C., Rousseau, A. N., Song, Y., Ou, Y., Chen, N., Wang, X., Sun, L., Guo, Y., Zhang, H., Zhang, Z., and Xin, Z.: Research progress and perspectives on ecological processes and carbon feedback in permafrost wetlands under changing climate conditions, Fundam. Res., S2667325824002073, https://doi.org/10.1016/j.fmre.2024.05.002, 2024.
St. Jacques, J.-M. and Sauchyn, D. J.: Increasing winter baseflow and mean annual streamflow from possible permafrost thawing in the Northwest Territories, Canada, Geophys. Res. Lett., 36, L01401, https://doi.org/10.1029/2008GL035822, 2009.
Stone, L. E., Fang, X., Haynes, K. M., Helbig, M., Pomeroy, J. W., Sonnentag, O., and Quinton, W. L.: Modelling the effects of permafrost loss on discharge from a wetland-dominated, discontinuous permafrost basin, Hydrol. Process., 33, 2607–2626, https://doi.org/10.1002/hyp.13546, 2019.
Thackeray, C. W., Hall, A., Norris, J., and Chen, D.: Constraining the increased frequency of global precipitation extremes under warming, Nat. Clim. Change, 12, 441–448, https://doi.org/10.1038/s41558-022-01329-1, 2022.
Torre Jorgenson, M., Harden, J., Kanevskiy, M., O'Donnell, J., Wickland, K., Ewing, S., Manies, K., Zhuang, Q., Shur, Y., Striegl, R., and Koch, J.: Reorganization of vegetation, hydrology and soil carbon after permafrost degradation across heterogeneous boreal landscapes, Environ. Res. Lett., 8, 035017, https://doi.org/10.1088/1748-9326/8/3/035017, 2013.
Treat, C. C., Virkkala, A., Burke, E., Bruhwiler, L., Chatterjee, A., Fisher, J. B., Hashemi, J., Parmentier, F. W., Rogers, B. M., Westermann, S., Watts, J. D., Blanc-Betes, E., Fuchs, M., Kruse, S., Malhotra, A., Miner, K., Strauss, J., Armstrong, A., Epstein, H. E., Gay, B., Goeckede, M., Kalhori, A., Kou, D., Miller, C. E., Natali, S. M., Oh, Y., Shakil, S., Sonnentag, O., Varner, R. K., Zolkos, S., Schuur, E. A. G., and Hugelius, G.: Permafrost carbon: Progress on understanding stocks and fluxes across northern terrestrial ecosystems, J. Geophys. Res.-Biogeo., 129, e2023JG007638, https://doi.org/10.1029/2023JG007638, 2024.
Uhlenbrook, S., Roser, S., and Tilch, N.: Hydrological process representation at the meso-scale: the potential of a distributed, conceptual catchment model, J. Hydrol., 291, 278–296, https://doi.org/10.1016/j.jhydrol.2003.12.038, 2004.
Volik, O., Kessel, E., Green, A., Petrone, R., and Price, J.: Growing season evapotranspiration in boreal fens in the Athabasca Oil Sands Region: Variability and environmental controls, Hydrol. Process., 35, e14020, https://doi.org/10.1002/hyp.14020, 2021.
Vonk, J. E., Tank, S. E., Bowden, W. B., Laurion, I., Vincent, W. F., Alekseychik, P., Amyot, M., Billet, M. F., Canário, J., Cory, R. M., Deshpande, B. N., Helbig, M., Jammet, M., Karlsson, J., Larouche, J., MacMillan, G., Rautio, M., Walter Anthony, K. M., and Wickland, K. P.: Reviews and syntheses: Effects of permafrost thaw on Arctic aquatic ecosystems, Biogeosciences, 12, 7129–7167, https://doi.org/10.5194/bg-12-7129-2015, 2015.
Walvoord, M. A. and Kurylyk, B. L.: Hydrologic impacts of thawing permafrost – A review, Vadose Zone J., 15, 1–20, https://doi.org/10.2136/vzj2016.01.0010, 2016.
Wang, Z., Wang, Z., Zou, Z., Chen, X., Wu, H., Wang, W., Su, H., Li, F., Xu, W., Liu, Z., and Zhu, J.: Severe global environmental issues caused by Canada's record-breaking Wildfires in 2023, Adv. Atmos. Sci., 41, 565–571, https://doi.org/10.1007/s00376-023-3241-0, 2024.
Warren, R. K., Pappas, C., Helbig, M., Chasmer, L. E., Berg, A. A., Baltzer, J. L., Quinton, W. L., and Sonnentag, O.: Minor contribution of overstorey transpiration to landscape evapotranspiration in boreal permafrost peatlands: Contribution of overstory transpiration in a boreal permafrost peatland, Ecohydrology, 11, e1975, https://doi.org/10.1002/eco.1975, 2018.
Wei, X., Hayes, D. J., Butman, D. E., Qi, J., Ricciuto, D. M., and Yang, X.: Modeling exports of dissolved organic carbon from landscapes: a review of challenges and opportunities, Environ. Res. Lett., 19, 053001, https://doi.org/10.1088/1748-9326/ad3cf8, 2024.
Woo, M., Thorne, R., Szeto, K., and Yang, D.: Streamflow hydrology in the boreal region under the influences of climate and human interference, Philos. T. Roy. Soc. B, 363, 2249–2258, https://doi.org/10.1098/rstb.2007.2197, 2008.
Wright, S. N., Thompson, L. M., Olefeldt, D., Connon, R. F., Carpino, O. A., Beel, C. R., and Quinton, W. L.: Thaw-induced impacts on land and water in discontinuous permafrost: A review of the Taiga Plains and Taiga Shield, northwestern Canada, Earth-Sci. Rev., 232, 104104, https://doi.org/10.1016/j.earscirev.2022.104104, 2022.
Wu, J., Kutzbach, L., Jager, D., Wille, C., and Wilmking, M.: Evapotranspiration dynamics in a boreal peatland and its impact on the water and energy balance, J. Geophys. Res., 115, G04038, https://doi.org/10.1029/2009JG001075, 2010.
Zhang, Y., Li, W., Sun, G., Miao, G., Noormets, A., Emanuel, R., and King, J. S.: Understanding coastal wetland hydrology with a new regional-scale, process-based hydrological model, Hydrol. Process., 32, 3158–3173, https://doi.org/10.1002/hyp.13247, 2018.