the Creative Commons Attribution 4.0 License.
the Creative Commons Attribution 4.0 License.
 | 30 Sep 2025
Evaluation of remote-sensing- and reanalysis-based precipitation products for agro-hydrological studies in the semi-arid tropics of Tamil Nadu
Aatralarasi Saravanan
Daniel Karthe
Selvaprakash Ramalingam
Niels Schütze
This study provides a comprehensive evaluation of eight high-spatial-resolution gridded precipitation products in semi-arid regions of Tamil Nadu, India, focusing specifically on Coimbatore, Madurai, Tiruchirappalli, and Tuticorin, where both irrigated and rainfed agriculture is prevalent. The study regions lack sufficiently long-term and spatially representative observed precipitation data, which are essential for agro-hydrological studies and better understanding and managing the nexus between food production and water and soil management. Hence, the present study evaluates the accuracy of five remote-sensing-based precipitation products, namely the Tropical Rainfall Measuring Mission (TRMM), the Precipitation Estimation from Remotely Sensed Information using Artificial Neural Networks – Climate Data Record (PERSIANN CDR), the CPC MORPHing technique (CMORPH), the Integrated Multi-Satellite Retrievals for Global Precipitation Measurement (GPM-IMERG), and the Multi-Source Weighted-Ensemble Precipitation (MSWEP), and three reanalysis-based precipitation products, namely the National Centers for Environmental Prediction Reanalysis 2 (NCEP2), the European Centre for Medium-Range Weather Forecasts (ECMWF) Reanalysis version 5 Land (ERA5-Land), and the Modern-Era Retrospective analysis for Research and Applications version 2 (MERRA2), against the station data. Linearly interpolated precipitation products were statistically evaluated at two spatial (grid and district-wise) and three temporal (daily, monthly, and yearly) resolutions for the period 2003–2014. Based on overall statistical metrics, ERA5-Land was the best-performing precipitation product in Coimbatore, Madurai, and Tiruchirappalli, with MSWEP following closely behind. In Tuticorin, however, MSWEP outperformed the others. On the other hand, MERRA2 and NCEP2 performed the worst in all the study regions, as indicated by their higher root mean square error (RMSE) and lower correlation values. Except in Coimbatore, most of the precipitation products underestimated the monthly monsoon precipitation, which highlights the need for a better algorithm for capturing convective precipitation events. Moreover, the percent mean absolute error (%MAE) was higher in non-monsoon months, indicating that product-based agro-hydrological modelling, like irrigation scheduling for water-scarce periods, may be less reliable. The ability of the precipitation products to capture extreme-precipitation intensity differed from the overall statistical metrics, where MSWEP performed the best in Coimbatore and Madurai, PERSIANN CDR in Tiruchirappalli, and ERA5-Land in Tuticorin. This study offers crucial guidance for managing water resources in agricultural areas, especially in regions with scarce precipitation data, by helping to select suitable precipitation products and bias correction methods for agro-hydrological research.
- Article
(11999 KB) - Full-text XML
-
Supplement
(1303 KB) - BibTeX
- EndNote


Tamil Nadu, an agriculturally important state in India, is endowed with only 3 % of the country's water resources. Of this limited supply, more than 95 % of surface water and 80 % of groundwater are already allocated for various uses, including human and animal consumption, irrigation, and industrial activities (TN-ENVIS, 2023). The state, which is in the rain shadow region of the Western Ghats, receives an average annual precipitation of about 925 mm. Agriculture relies heavily on precipitation and provides a livelihood to nearly 40 % of the people (Government of Tamil Nadu, 2022a). The gross sown area is 5.94×10⁶ ha, while the net sown area is 4.73×10⁶ ha. The total irrigated area in the state is 3×10⁶ ha; hence, around 50 % of the gross sown area depends on precipitation as its primary water resource. In recent years, the state's agriculture sector has grown around 3 % annually, while its overall economy has risen by 6 %–9 % (Government of Tamil Nadu, 2022b). The decreased performance of the agricultural sector is collectively attributed to multiple factors, like water shortages during critical stages of crop irrigation, a low level of crop diversification, increasing climate change threats, the rigid mindset of farmers in refusing to accept improved technologies, weak market development, and high rates of post-harvest losses (Arjune and Kumar, 2023; Balaganesh et al., 2020; Gardas et al., 2018; Malaiarasan et al., 2021). Compared to other factors, climate change has differential impacts on the region's monsoons (Lal, 2003). Climate change has led to a noticeable rise in the intensity of rainfall in the months of August, October, and November, along with greater variation. For the agricultural sector, the most important implication of climate warming is an increase in irrigation water requirement, which is estimated to range between 0.6 %–3.7 % for temperature increases between 0.5–3.0 °C (Surendran et al., 2021). In addition to irrigated crops, climate-resilient rainfed crops, which include cotton, pearl millet, and sorghum, are expected to produce less harvest by 2030 in all of Tamil Nadu's agroclimatic zones. Significant reductions are expected in the northeastern zone (6.07 %), the Cauvery Delta zone (3.55 %), and the southern zone (3.54 %) (Arumugam et al., 2013). Furthermore, there has been an increase in the frequency of extreme hydrological events in the semi-arid region of the state, including the floods in Chennai in 2015 and 2022 and the hydrological droughts in 2018 caused by the failure of the northeastern monsoon. Moreover, the floods that occurred in the Tuticorin district during December 2023 show that the state's extreme hydrological events are spreading to newer regions (Radhakrishnan et al., 2024; Lalmuanzuala et al., 2023; Paramasivam, 2023). The IPCC's Sixth Assessment Report projects an increase in heavy-precipitation events linked to tropical cyclones and worsening drought in certain regions; hence hydrological modelling will play a critical role in early warning systems. This modelling lays the foundation for the development of suitable environmental policies, which are essential given the state's current inconsistencies in warming, climate change, and rainfall impacts (IPCC, 2023).
Establishing dense meteorological observatories and disseminating the state of weather variables at frequent intervals are essential for adapting to the regional and local consequences of climate change (Wilby and Yu, 2013). Developing countries like India are more vulnerable in this regard due to inadequate ground weather stations and, thus, a lower adaptation capacity. The distribution of rain gauges in one of the largest countries, India, is inadequate to accurately predict and assess various rain-induced events/processes, like droughts, flash floods, and their implications, such as dam failures (Singh et al., 2018). Despite the accurate measurement of rainfall by rain gauges, their heterogeneous distribution over land and relatively sparse measurements over large oceans limit their use. Moreover, gauge data are available as point observations with potentially limited spatial representativeness; inconsistencies exist between other data products, which are largely due to a limited number of ground stations, merging and interpolation methods, limited time resolution, and limited documentation quality (Huffman et al., 2009; Nikulin et al., 2012; Sylla et al., 2013). The gaps and inhomogeneities in precipitation time series collected by the rain gauges during the time of severe-weather conditions also make it difficult to force hydrological models that require a continuous time series of precipitation data.
An alternate solution is multi-source merged precipitation products in general, including ground-based weather radars, meteorological satellites, and reanalysis products. These provide a comprehensive map of rainfall at homogeneous spatial and temporal resolutions (Tapiador et al., 2012; Kucera et al., 2013). Several satellite-based rainfall estimates have been developed over the last decade (Sapiano and Arkin, 2009; Zambrano-Bigiarini et al., 2017). For India, a list of precipitation products is available that can be used for climate change impact studies, such as the Global Precipitation Climatology Project (GPCP) from the National Centers for Environmental Information of the National Oceanic and Atmospheric Administration (NOAA) (Adler et al., 2003), the CPC Merged Analysis of Precipitation (CMAP) from the National Center for Atmospheric Research (NCAR) (Xie et al., 2007), and the Tropical Rainfall Measuring Mission (TRMM) (Huffman et al., 2007). In addition, the Global Satellite Mapping of Precipitation (GSMaP) (Ushio et al., 2009), the Precipitation Estimation from Remotely Sensed Information using Artificial Neural Networks – Climate Data Record (PERSIANN CDR) (Ashouri et al., 2015), the Precipitation Estimation from Remotely Sensed Information using Artificial Neural Networks – Cloud Classification System (PERSIANN CCS) (Sorooshian et al., 2000), the CPC MORPHing technique (CMORPH) (Joyce et al., 2004), the Integrated Multi-Satellite Retrievals for Global Precipitation Measurement (GPM-IMERG) (Hou et al., 2014), and the Multi-Source Weighted-Ensemble Precipitation (MSWEP) (Beck et al., 2017) are also available at varying spatial and temporal resolutions for longer periods.
As another source of climate information, climate-model-derived reanalysis data are suitable for assessing climate variability and change. Global reanalysis-based climate products include the National Centers for Environmental Prediction Reanalysis 2 (NCEP2) (Kanamitsu et al., 2002), the European Centre for Medium-Range Weather Forecasts (ECMWF) Reanalysis version 5 Land (ERA5-Land), the 20th Century Reanalysis version 2 (20CRv2) (Compo et al., 2011), the Climate Forecast System Reanalysis (CFSR) (Saha et al., 2010), the Japanese 55-year Reanalysis (JRA-55) (Ebita et al., 2011), and the Modern-Era Retrospective analysis for Research and Applications version 2 (MERRA2) (Gelaro et al., 2017).
Precipitation products from non-station sources must be assessed against ground station data before being imported into the agro-hydrological models. The differential statistical assessment of the product at multiple spatial and temporal scales will highlight the accuracy of the precipitation product, quantify bias, and lead to choosing the appropriate bias correction methods before forcing them into a hydrological model. Further, previous studies have shown the differential performance of precipitation products in capturing extreme-precipitation events and their spatial variability. Hence, assessing these unique criteria is important to reduce the input uncertainty in hydrological modelling. Moreover, the precipitation data must be available for extended periods (at least 10 years) to study the impact of climate change on the hydrological cycle. The best-performing precipitation products, when fed into agro-hydrological models like AquaCrop, the Soil and Water Assessment Tool (SWAT; Neitsch et al., 2002), MODFLOW (McDonald and Harbaugh, 1984), Water Evaluation and Planning (WEAP), and the Revised Universal Soil Loss Equation (RUSLE; Renard et al., 1997), can provide accurate projections with lower uncertainty. Thorough assessment of various precipitation products requires both dense station data availability and continuous time series of precipitation data for longer periods of time. Such assessment studies are not available for Tamil Nadu, particularly for the semi-arid regions on a daily timescale, which is crucial for comprehending hydrological variability in the context of climate change.
However, a limited number of studies at daily intervals are available based on the river basin spatial scale (Yaswanth et al., 2023; Kolluru et al., 2020). Further, Singh et al. (2018) analysed only heavy-rainfall occurrences in peninsular India during the 2015 winter monsoon, taking the grid-level spatial scale into consideration. Other investigations were carried out at either weekly or monthly scales (Dubey et al., 2021; Singh et al., 2019).
Thus, the purpose of this study is to compare and assess the available precipitation products for Coimbatore, Madurai, Tiruchirappalli, and Tuticorin at the highest possible spatial and temporal (daily, monthly, and yearly) resolutions against station data, using the most widely used and recognised statistical and graphical evaluation methods. The results of our study will help to overcome the data scarcity in the study area with regard to the spatial and temporal resolution gaps of daily, monthly, and annual precipitation data products that can be used for hydrologic and environmental change and impact studies at a regional scale.
2.1 Study regions
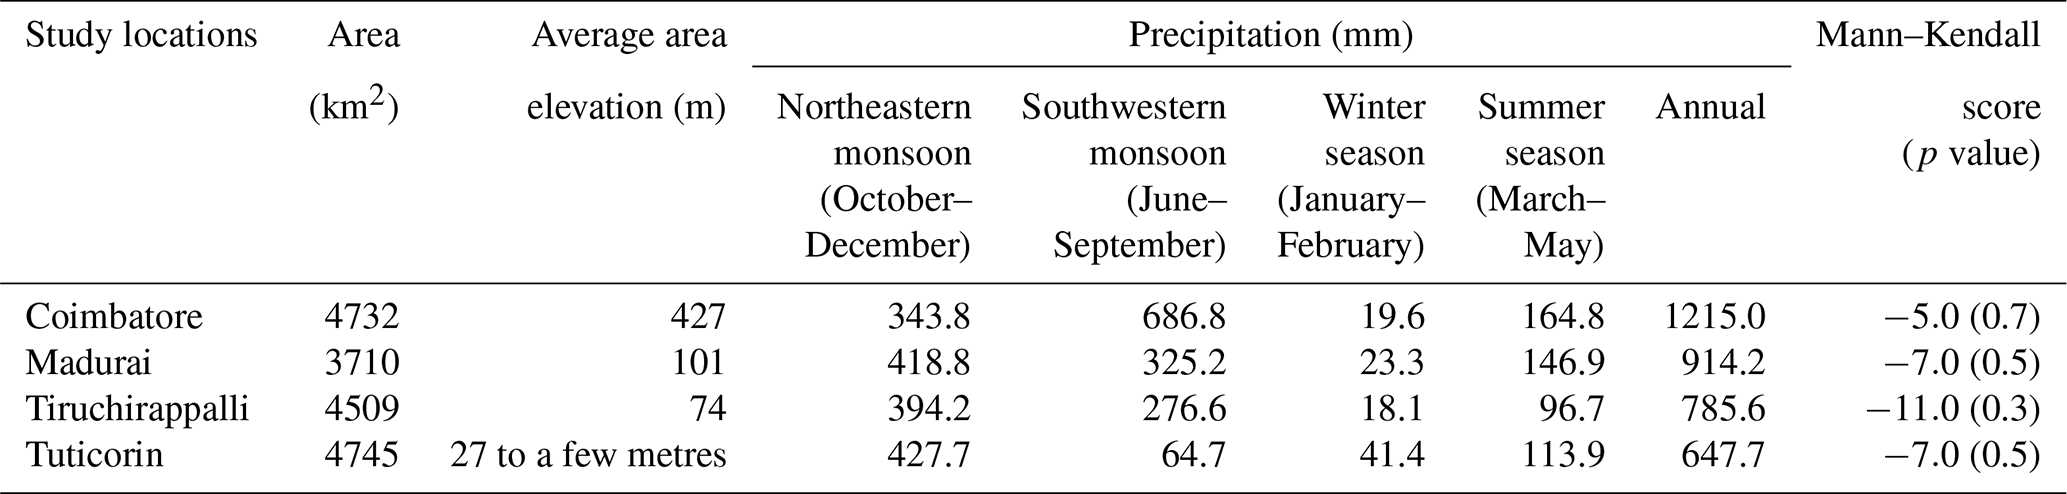
The study's main objective is to assess precipitation data sources for semi-arid regions of Tamil Nadu (SAT), specifically Coimbatore, Madurai, Tiruchirappalli, and Tuticorin, on a daily, monthly, and yearly basis. The study regions are representative of the following agroclimatic zones and are known to contribute significantly to the state's agricultural output: the Cauvery Delta zone (Tiruchirappalli), the western zone (Coimbatore), and the southern zone (Madurai, Tuticorin) (Rajkumar et al., 2020; Chandrasekar et al., 2009). The state of Tamil Nadu receives precipitation during the northeastern monsoon (44 %), southwestern monsoon (41.27 %), hot-weather season (11.41 %), and winter season (2.7 %) (Dhar et al., 1981; Lakshmi et al., 2021). The study region's precipitation pattern had inter-annual variability, and the results of the Mann–Kendall test produced non-significant p values, indicating no trend in the long term (Table 1). Land surface heterogeneity, intricate topography, and their interactions with global climatic forcing systems are some of the local elements contributing to the inter-annual variability in the precipitation pattern in these locations. Similarly, weather and climate variability, both geographical and temporal, and tendencies toward rising temperatures and falling precipitation are experienced throughout the study's investigated locations. Additionally, research indicates that the rainfall window for the southwestern monsoon is becoming shorter, while the northeastern monsoon crops are vulnerable to flooding during their early stages (Varadan et al., 2017). Climate change has already started to change rainfall patterns in a way that is unfavourable for most agricultural crops, so measures for sustainable adaptation and mitigation are needed. These strategies rely on comprehensive hydrological and climatic models and the corresponding data inputs.
2.2 Datasets
2.2.1 Ground stations
The points in Fig. 1 are the geographical locations of the available ground station data. In most regions of India, the density and availability of field-based meteorological stations are limited, and their accessibility is restricted for many reasons. Hence, the selection of ground station data was based on the availability, quality, and density of field-based meteorological stations from 2003–2014. The daily data were provided by the Public Works Department (PWD) of Tamil Nadu, which collects and maintains meteorological data for the entire state. Additionally, each selected study region has a state-owned agricultural university with many crop-specific research institutes, including the Wheat Research Station in Coimbatore, located at a higher altitude. These institutes provide both agrometeorological and hydrometeorological data, enabling coverage even in mountainous regions. The stations were aligned into (an almost) regular grid by the state authorities/institutions, which makes the districts selected “ideal” study areas for this evaluation study. The data were carefully and extensively checked for their quality, and data for 2005 and 2010 were eliminated due to the large number of missing inputs. Instead of filling the gaps with uncertain results using imputation methods, we decided to skip these years. Finally, datasets used for validation included 17 stations in Coimbatore, 12 in Madurai, 16 in Tuticorin, and 15 in Tiruchirappalli (Table S1a in the Supplement).
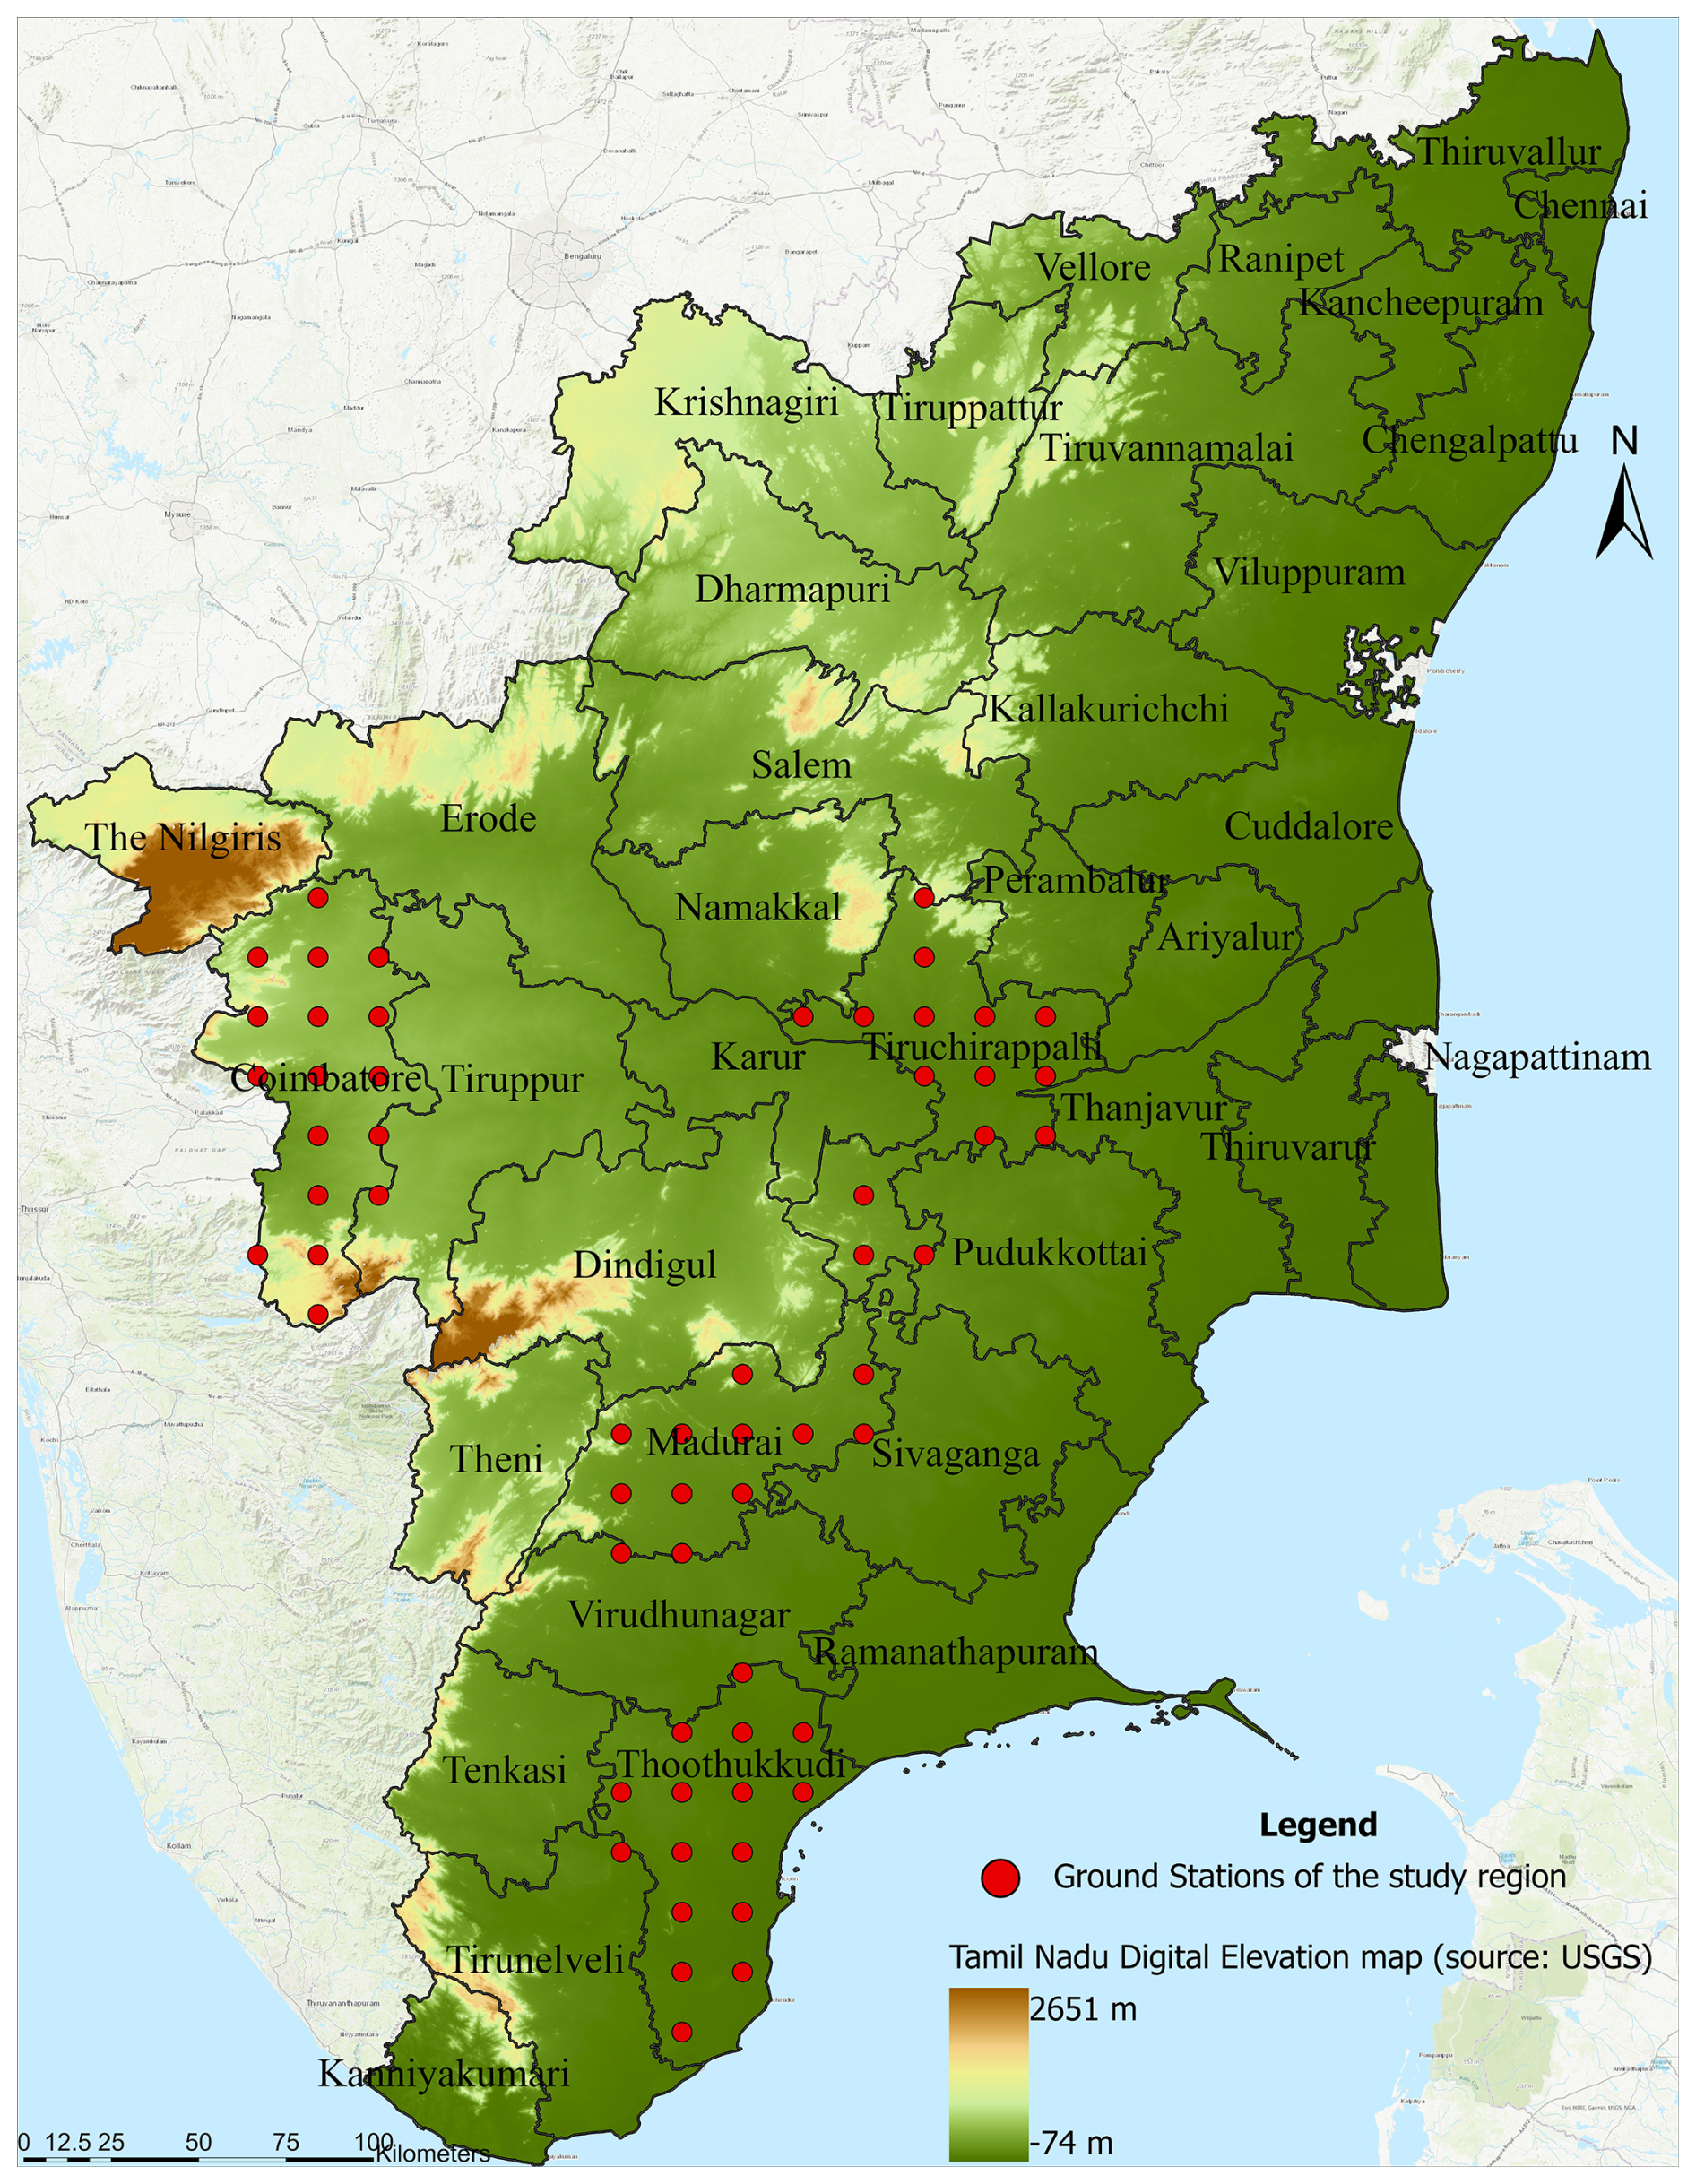
Figure 1Map of Tamil Nadu and study regions (Coimbatore, Madurai, Tiruchirappalli, Tuticorin) with ground stations. The stations were aligned into (an almost) regular grid by the state authorities/institutions for the study period (2003–2014), which makes the districts selected “ideal” study areas for this evaluation study.
2.2.2 Satellite- and reanalysis-based precipitation products
Among the several global satellite- and reanalysis-based precipitation datasets, those with the longest time period coverage and the highest spatial resolution were chosen. We selected products with spatial resolutions between 0.1° and 0.25°. While reanalysis products typically have coarser resolutions, we included MERRA2 and NCEP2 in our study due to their unique advantages. Both products provide global coverage on a daily timescale and incorporate significant advancements, such as the inclusion of cloud-top cooling (NCEP2, Kanamitsu et al., 2002) and atmospheric aerosols (MERRA2, Bosilovich et al., 2015). Daily temporal-scale precipitation products were selected because ground station data were only available on a daily basis, even though several precipitation products were available at half-hourly and sub-daily temporal scales. We selected five satellite-based and three reanalysis-based rainfall estimates using the aforementioned standards (Table 2). The five satellite-based precipitation estimates are TRMM 3B42 (Huffman et al., 2007), PERSIANN CDR (Ashouri et al., 2015), CMORPH (Joyce et al., 2004), GPM-IMERG (Hou et al., 2014), and MSWEP (Beck et al., 2017). In addition, the reanalysis products considered are MERRA2 (Reichle et al., 2017), NCEP2, and ERA5-Land. Reanalysis products like 20CRv2, CFSR, and JRA-55 are not considered in this study due to their limited spatial and temporal resolutions.
Launched in late 1997, the TRMM products are among the satellite precipitation products that have been used extensively because of their acceptable accuracy (Huffman et al., 2007; Sahoo et al., 2015). The mission uses five instruments: a precipitation radar (PR), a TRMM microwave imager (TMI), a visible infrared scanner (VIRS), the Clouds and the Earth's Radiant Energy System (CERES), and a lightning imaging sensor (LSI). The TRMM 3B42 product, which is available at 0.25° spatial resolution and daily temporal resolutions, is used in this study (Huffman et al., 2023).
PERSIANN CDR is a satellite-based precipitation estimation product that provides more than 3 decades (from 1983 to present) of daily precipitation estimates at 0.25°×0.25° spatial resolution for the 60° S–60° N geographical extent. PERSIANN CDR utilises the archive of infrared brightness temperature from the gridded satellite dataset (GridSat-B1) as input to the artificial neural network (ANN)-based PERSIANN algorithm that converts the input infrared data in degrees Kelvin into rain rate (RR) data in mm h−1.
CMORPH was generated on an 8 km×8 km grid over the global domain (60° S–60° N) in 30 min intervals from 1 January 1998 to the present. In the first step, high-resolution global satellite precipitation estimates from passive microwave (PMW) measurements along the cloud motion vectors (the raw CMORPH) were integrated. In the second step, bias in the raw CMORPH was removed through probability density function (PDF) matching against the CPC daily gauge analysis over land and through adjustment against the pentad GPCP merged analysis over ocean (Xie et al., 2003).
The GPM Core Observatory satellite, launched on 27 February 2014, operates in low-Earth orbit, carrying a passive multi-channel conical-scanning microwave radiometer called the GPM microwave imager (GMI), which can measure light to heavy precipitation, and an active dual-frequency precipitation radar (DPR), which can measure precipitation characteristics in the atmospheric column in three dimensions (Smith et al., 2007). In this study, the Level 3 IMERG Final Run product, which includes research-quality gridded global multi-satellite precipitation estimates, was used.
MSWEP version 2 is the first fully global precipitation dataset with a 0.1° resolution derived by optimally merging a range of gauge, satellite, and reanalysis estimates (Beck et al., 2017). Its previous version was released in May 2016. MSWEP v2 merges the highest-quality precipitation information from multiple sources, thereby taking advantage of the complementary strengths of gauge-, satellite-, and reanalysis-based data to provide reliable precipitation estimates over the entire globe. It is a global precipitation dataset with 0.1° spatial resolution and has been available from 1979 to the present. In this study, MSWEP version 2 with no gauge data is used.
NCEP2 was developed from NCEP1, which covered the period from 1948 onwards (Kalnay et al., 2018), and is based on the T62 operational NCEP model, in which the physical parameterisation was run on a 192×94 Gaussian grid (1.92°×1.875°). The NCEP2 reanalysis (Kanamitsu et al., 2002) is run at the same resolution (T62) as NCEP1, covering the period from 1979 onwards. An important improvement is the updated precipitation parameterisations and more realistic cloud-top cooling. The products are available in a 1.875°×1.875° grid with a 6 h temporal resolution.
MERRA2 is a NASA atmospheric reanalysis that began in 1980. MERRA2 replaced the original MERRA dataset to leverage advances in assimilation systems, allowing integration of modern hyperspectral radiance, microwave observations, and GPS-radio occultation data (Bosilovich et al., 2015, 2016). The current version's advantages over the previous one include enhanced use of satellite observations, assimilation of aerosol information (MERRAero), use of NASA's ozone profile observations, and advances in both the GEOS model and the GSI assimilation system (Wu et al., 2002).
ERA5-Land is a reanalysis-based product that covers the period from January 1950 to 2–3 months before the present. ERA5 was produced using 4D-Var data assimilation and model forecasts in CY41R2 of the ECMWF Integrated Forecasting System (IFS). H-TESSEL is the land surface model that is the basis of ERA5-Land. The data are available on a regular latitude–longitude grid of 0.1°×0.1°. In particular, ERA5-Land runs at enhanced resolution (9 km vs. 31 km in ERA5). The temporal frequency of the output is hourly, and the fields are masked for all oceans, making them lighter to handle (Muñoz-Sabater et al., 2021).
Table 2An overview of precipitation products used in the study.
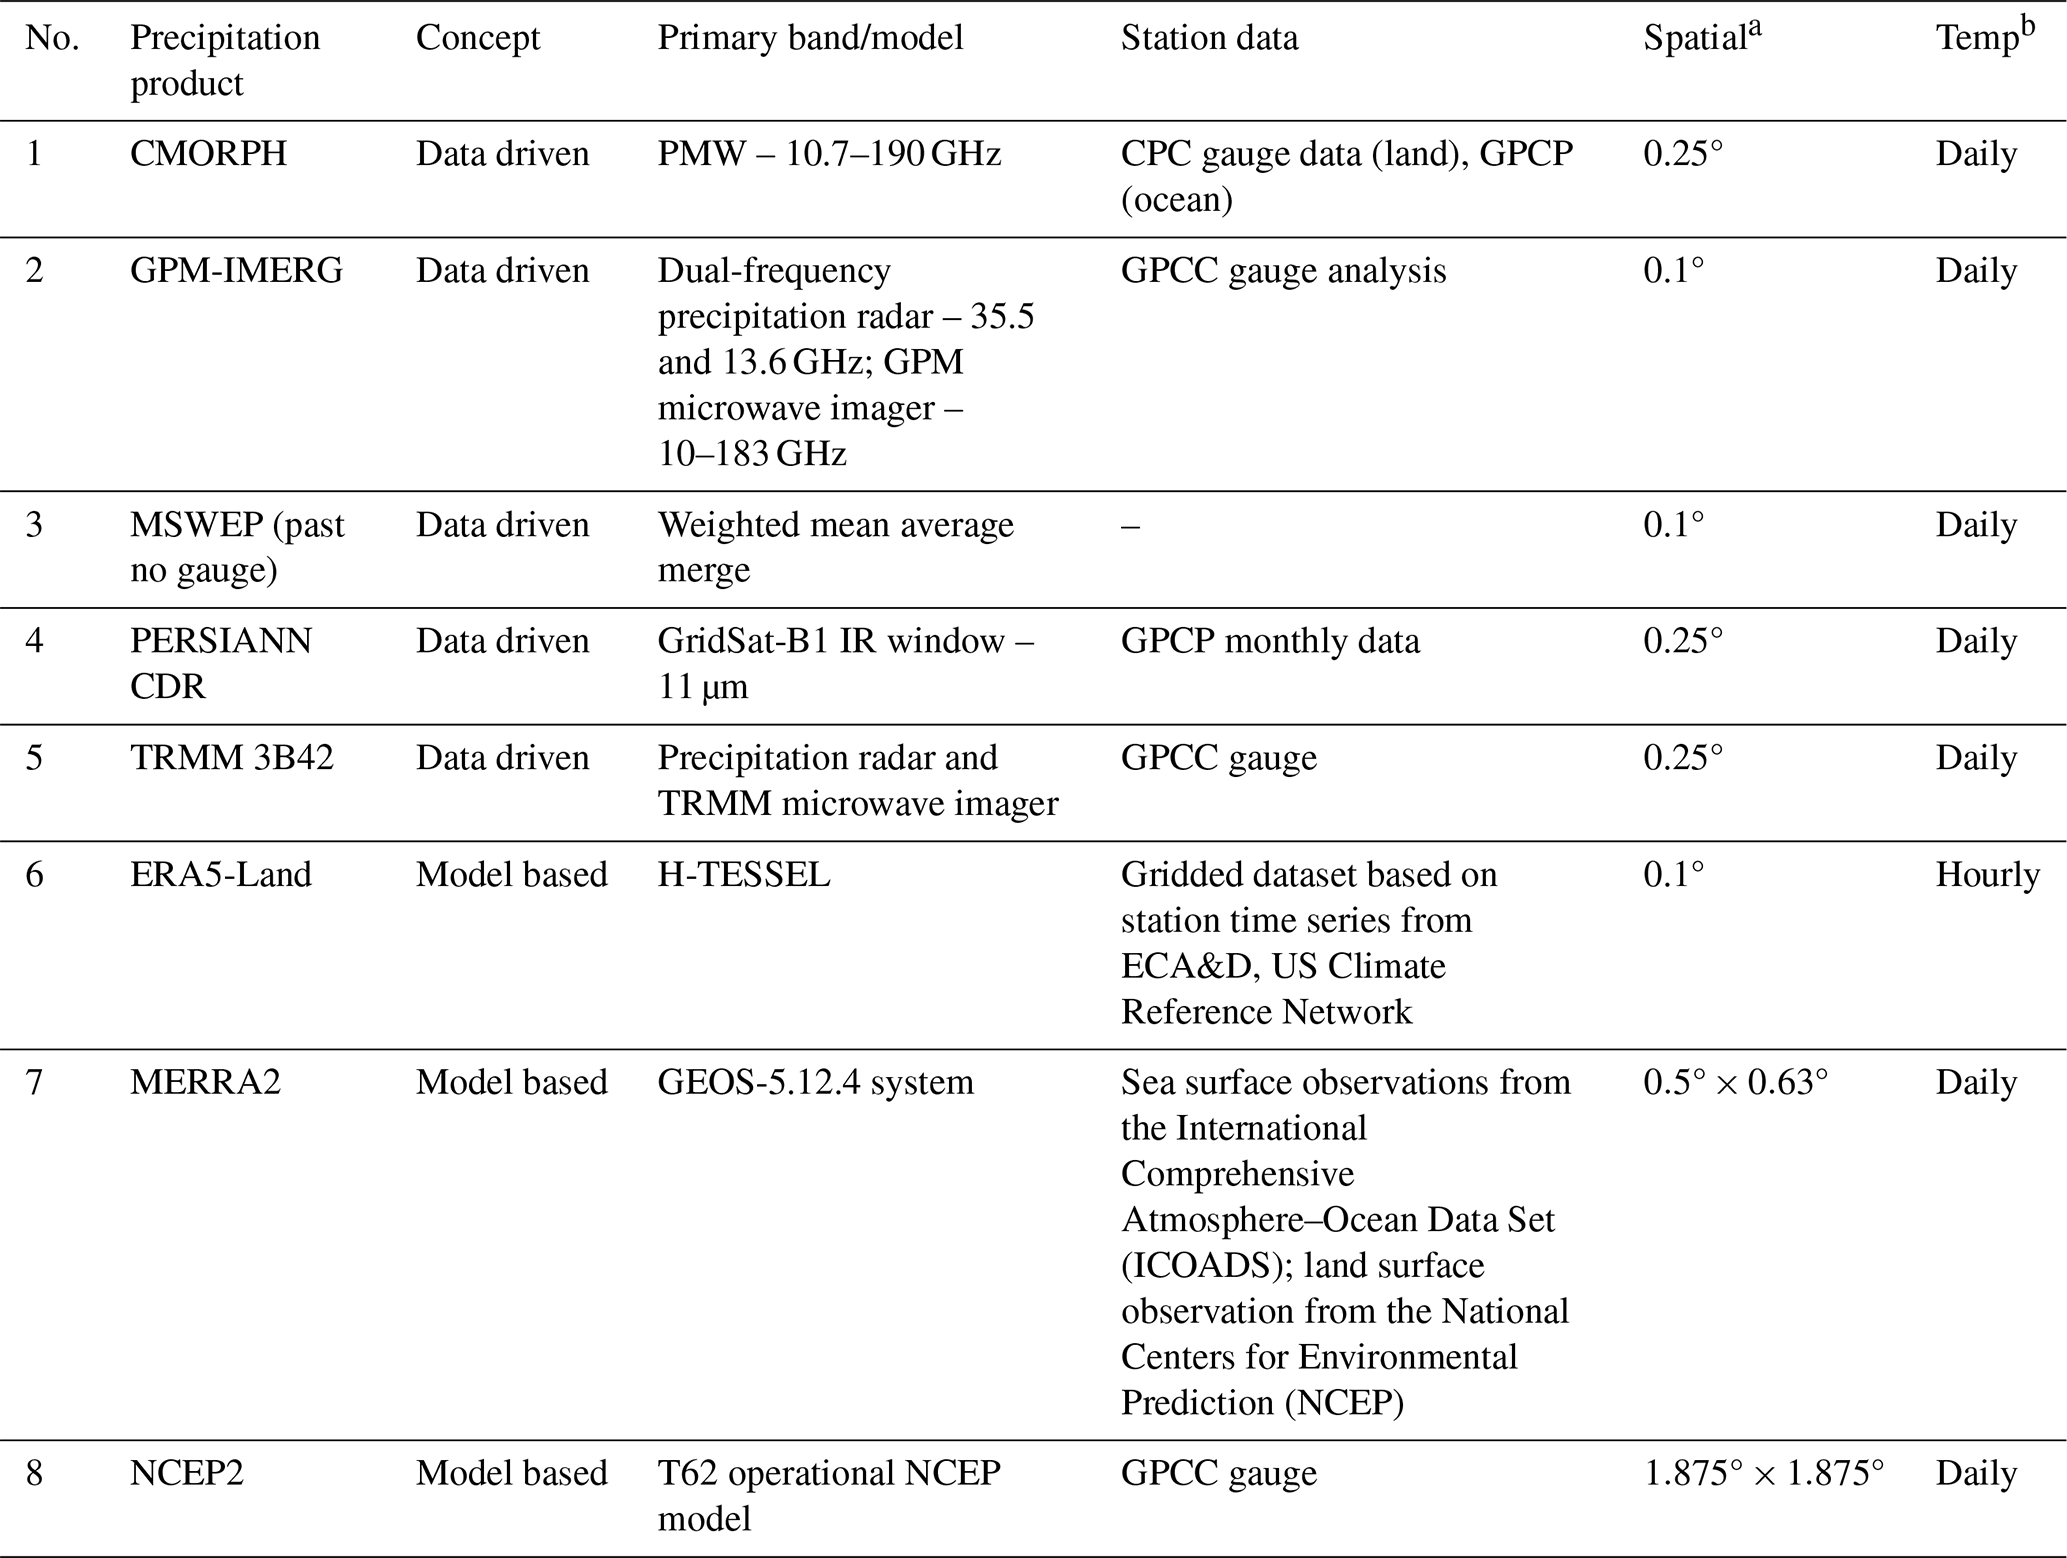
a Spatial resolution given in latitude × longitude. b Temporal resolution of the product used in this study.
2.3 Comparison of ground data with satellite and observational reanalysis-based data
The most commonly used method to compare ground observations with other data products, such as satellite-based precipitation estimates and reanalysis products, is point (station)-to-pixel comparison. It can be challenging to acquire reasonable agreement when comparing daily rainfall, particularly in a very complex topography, on a point-to-pixel basis (Gebrechorkos et al., 2018). The study used 10 years of precipitation data for evaluation of the products. We followed the most common practice of interpolating the point-based rain gauge data to 0.1° spatial resolution using a linear method, as it is relatively easy to implement and a popular application in evaluation studies (Duan et al., 2016; Liu et al., 2015; Shukla et al., 2019). Since the real stations are arranged in an almost regular grid, we can expect low interpolation errors. This is also shown by the results of leave-one-out cross-validation (LOOCV) analysis (Table S1b). The interpolated 0.1° station dataset was used as ground truth to evaluate all the other precipitation products. Using the linear method, the satellite and reanalysis rainfall products with coarse spatial resolution were downscaled to 0.1°. The precipitation products were downscaled to a higher resolution with the aim of capturing spatial rainfall variability, which is better exhibited at 0.1° as compared to their original coarse resolution.
We evaluated the performance of selected precipitation products at three temporal resolutions (daily, monthly, and yearly). For each temporal resolution, evaluations were conducted at two spatial scales: the grid scale and the district scale.
2.3.1 Evaluation at grid scale
The interpolated station dataset was used as ground truth to evaluate all the other downscaled precipitation products at 0.1° spatial scales. The evaluation was considered for grids with at least one rain gauge in the corresponding grid or in the surrounding grids.
2.3.2 Evaluation at district scale
The gridded precipitation from the grids considered at the grid-scale evaluation was averaged to estimate the district precipitation amount. This way, district-level precipitation was estimated for the station data and the precipitation products. The developed district-level data were then evaluated, keeping the station value as ground truth for the precipitation products.
The study region receives abundant precipitation during the monsoon months, which is significantly higher than during the rest of the year; hence we evaluated the performance of the products during the monsoon and non-monsoon seasons. The northeastern monsoon is the primary source of precipitation in the region, and it occurs from October–December (Table 1). Therefore, average precipitation values of October–December were used to calculate monsoon month precipitation. The average precipitation for the rest of the year, i.e. from January–September, was taken for non-monsoon months.
2.4 Evaluation metrics
Evaluations were primarily based on widely used statistical indices, such as the Pearson correlation coefficient (CC), mean absolute error (MAE), root mean square error (RMSE), bias (systematic error), relative bias (Rbias), and index of agreement (IA). CC (Eq. 1) is applied to evaluate the agreement of individual precipitation products (P) to station data (O). A value of 1 shows a perfect fit between the products and station data.
In Eq. (1), Pi is the value of the precipitation product at each time step (i), and is the mean value of the precipitation product over the entire time step. Similarly, Oi represents the precipitation value recorded at the ground station at time step (i), and is the mean of the ground-station-recorded precipitation. Each product's average differences and systemic bias are given as bias (Eq. 2) and Rbias (Eq. 3). Based on the underestimation or overestimation of the product, bias and Rbias can be positive or negative.
The MAE and RMSE (Eqs. 4 and 5) are well-known and accepted indicators of goodness of fit, which shows the difference between ground observations and precipitation products under study (Legates and McCabe, 1999).
The IA (Willmott, 1981) is another widely used indicator of goodness of fit between station data and different products. Equation (6) describes the number of precipitation products that is error-free as compared to the station data.
Additional analyses were conducted at the district spatial scale, which includes intensity–duration–frequency (IDF) curve analysis at a daily timescale, seasonal evaluation at a monthly timescale, and Taylor-plot-based multimodel comparison at a yearly timescale. IDF curve analysis was done using the Gumbel distribution methodology. It is the most widely used distribution for IDF analysis owing to its suitability for modelling maxima. Frequency precipitation (PT in millimetres, Eq. 7) for each duration with a specific return period T (in years) is given by the following equation:
where K is the Gumbel frequency factor (Eq. 8), Pave is the average of the maximum precipitation corresponding to a specific duration, and S is the standard deviation of the precipitation data (Eq. 9). Then, the precipitation intensity, It (mm h−1) for return period T, is obtained using Eq. (10).
Here Td is the duration in hours.
At the monthly timescale, percent mean absolute error (%MAE) (Eq. 11) was computed as the ratio of MAE to the mean precipitation from corresponding station data. Hence, it enables intercomparison of the precipitation products, considering the precipitation's monthly variation (Duan et al., 2016).
In addition to the above statistical methods, the Taylor diagram (Taylor, 2001) was used to summarise the statistical relationship between ground station data and precipitation products at yearly timescale evaluations. This diagram explains the relationship between the two fields using correlation coefficient (R), standard deviation (σ), and centred root mean square (RMS) difference (E′). A single point on the diagram displays three statistical values (E′, R, and σ), and their relationship is given by Eq. (12). Percent bias, either in a positive or a negative way, is indicated by the upward or downward notation of the product.
Here and are the variances of the satellite/reanalysis and station data, and R is the correlation coefficient between the two products. The distance between the reference point (station data) is given in the diagram as the centred RMS difference of the two fields (E′ 2, Eq. 13). A satellite/reanalysis product with no error would show a perfect correlation to the station data.
Here f is the model (e.g. satellite or reanalysis) data, and r is the reference (station data) data, whereas σf and σr are the standard deviations of the model and reference fields (Eqs. 14 and 15).
3.1 Evaluation of precipitation products at the daily timescale
3.1.1 Grid scale
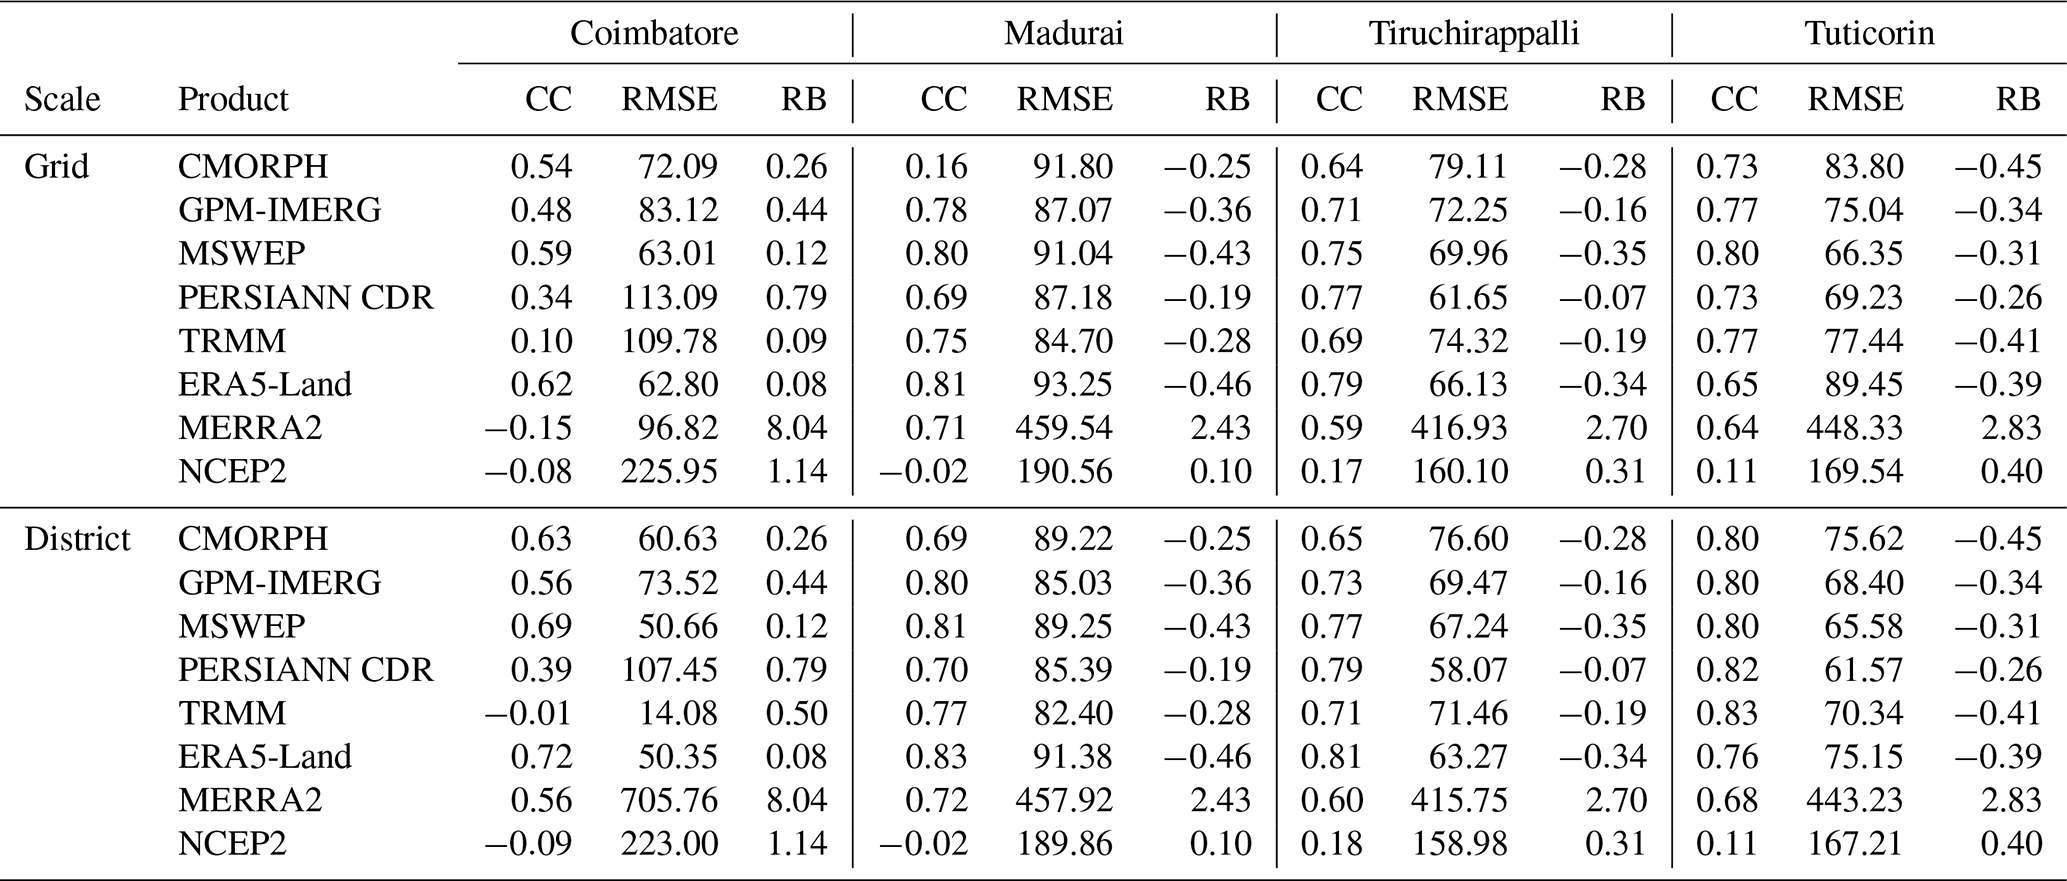
The statistical metrics for daily precipitation are summarised in Tables 3 and S2 in the Supplement. For the Coimbatore study region at grid scale, ERA5-Land had the highest correlation value (CC=0.366), followed by MSWEP. The lowest CC value of 0.052 was observed for the NCEP2 product. All products overestimated rainfall, with bias and Rbias values ranging from 0.197 to 18.293 and 0.087 to 8.036, respectively. MSWEP recorded the lowest RMSE, indicating the product's fit with the station data compared to the other products. Interestingly, ERA5-Land was observed to have both the lowest MAE and the highest IA. In Madurai, correlation trends were similar to those in Coimbatore. ERA5-Land, followed by MSWEP, had the highest correlation coefficient, while NCEP2 had the lowest correlation. ERA5-Land was observed to have the lowest MAE and RMSE values of 3.859 and 7.511 mm d−1. Five precipitation products underestimated rainfall, with bias and Rbias values ranging from −2.039 to −1.123 and −0.456 to −0.253, respectively. On the other hand, NCEP2 and MERRA2 overestimated precipitation, with the former having comparatively higher values of bias and Rbias (10.875 and 2.434). Regarding IA, ERA5-Land and NCEP2 recorded the highest and lowest values.
Table 3Daily precipitation characteristics of Coimbatore, Madurai, Tiruchirappalli, and Tuticorin.
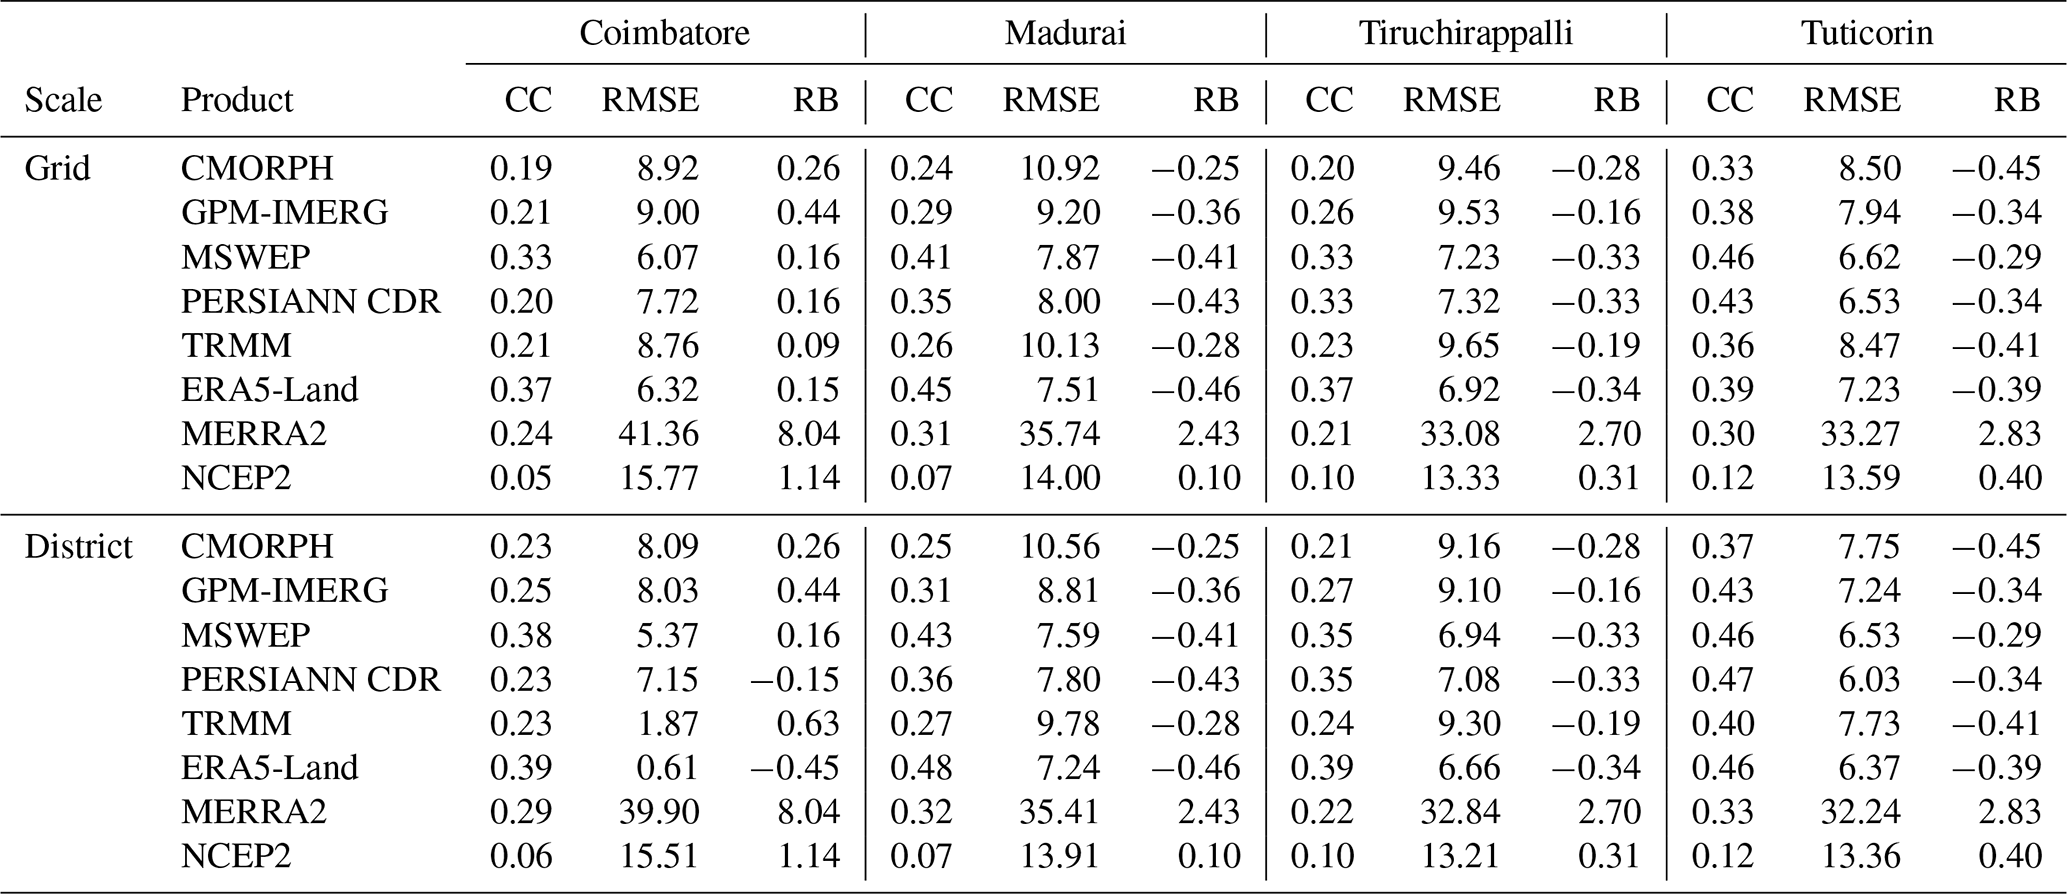
In Tiruchirappalli, correlation and IA had similar trends with respect to Coimbatore and Madurai. Table 3 shows that the correlation value ranged from 0.096 (NCEP2) to 0.371 (ERA5-Land). In terms of error, MERRA2 was observed to have the highest MAE (11.186 mm d−1) and RMSE (33.08 mm d−1). On the other hand, ERA5-Land had the lowest MAE (3.237 mm d−1), and MSWEP had the lowest RMSE (7.229 mm d−1). Five products underestimated precipitation, with bias and Rbias ranging from −1.187 to −0.549 and −0.342 to −0.158, respectively. Furthermore, NCEP2 and MERRA2 overestimated precipitation, with values ranging above zero. ERA5-Land, followed by PERSIANN CDR, had the highest IA, while MERRA2 had the lowest value. In Tuticorin, MSWEP had the highest correlation ( while NCEP2 had the lowest ( MAE values ranged from 3.225–11.888 mm d−1, with the lowest value recorded by MSWEP and the highest recorded by MERRA2. Similar trends were observed for RMSE, with values ranging from 6.623–33.268 mm d−1. CMORPH, GPM-IMERG, MSWEP, PERSIANN CDR, TRMM, and ERA5-Land underestimated precipitation, with negative bias and Rbias values. MERRA2 and NCEP2 overestimated rainfall, with positive bias and Rbias values.
The performance of IDF curves generated using remote-sensing- and reanalysis-based precipitation products was evaluated by comparing them with the estimated IDF curves using station data. The comparison demonstrates that precipitation intensity decreases with duration. In the Coimbatore district, MSWEP and PERSIANN CDR had the closest precipitation intensity estimation with respect to the station data, as shown in Fig. 2a. The intensity of precipitation produced by station data was 16.056 and 1.929 mm h−1 for a 1 and 24 h duration, respectively. PERSIANN CDR produced 15.952 and 1.917 mm h−1 for a 1 and 24 h duration, respectively. ERA5-Land highly underestimated precipitation intensity, while GPM-IMERG, CMORPH, TRMM, NCEP2, and MERRA2 overestimated precipitation. For the Madurai district, PERSIANN CDR, ERA5-Land, and MSWEP underestimated precipitation intensity, while GPM-IMERG produced the closest estimate. The station data precipitation intensity was 26.033 and 3.128 mm h−1 for a 1 and 24 h duration, respectively. GPM-IMERG produced 25.93 and 3.117 mm h−1 for a 1 and 24 h duration, respectively. From Fig. 2b, it is also observed that TRMM, CMORPH, NCEP2, and MERRA2 overestimated precipitation intensity. In the Tiruchirappalli district, all the precipitation products overestimated precipitation intensity in comparison to the station data (Fig. 2c). PERSIANN CDR produced the closest precipitation intensity estimation, with slight overestimation. In the Tuticorin district, PERSIANN CDR underestimated precipitation intensity, and ERA5-Land produced the closest estimate with respect to the station data. The station data precipitation intensity was 20.406 and 2.452 mm h−1 for a 1 and 24 h duration, respectively. ERA5-Land produced 20.269 and 2.436 mm h−1 for a 1 and 24 h duration, respectively. The remaining precipitation products overestimated the intensity at different time periods, with the highest overestimation produced by MERRA2 (Fig. 2d).
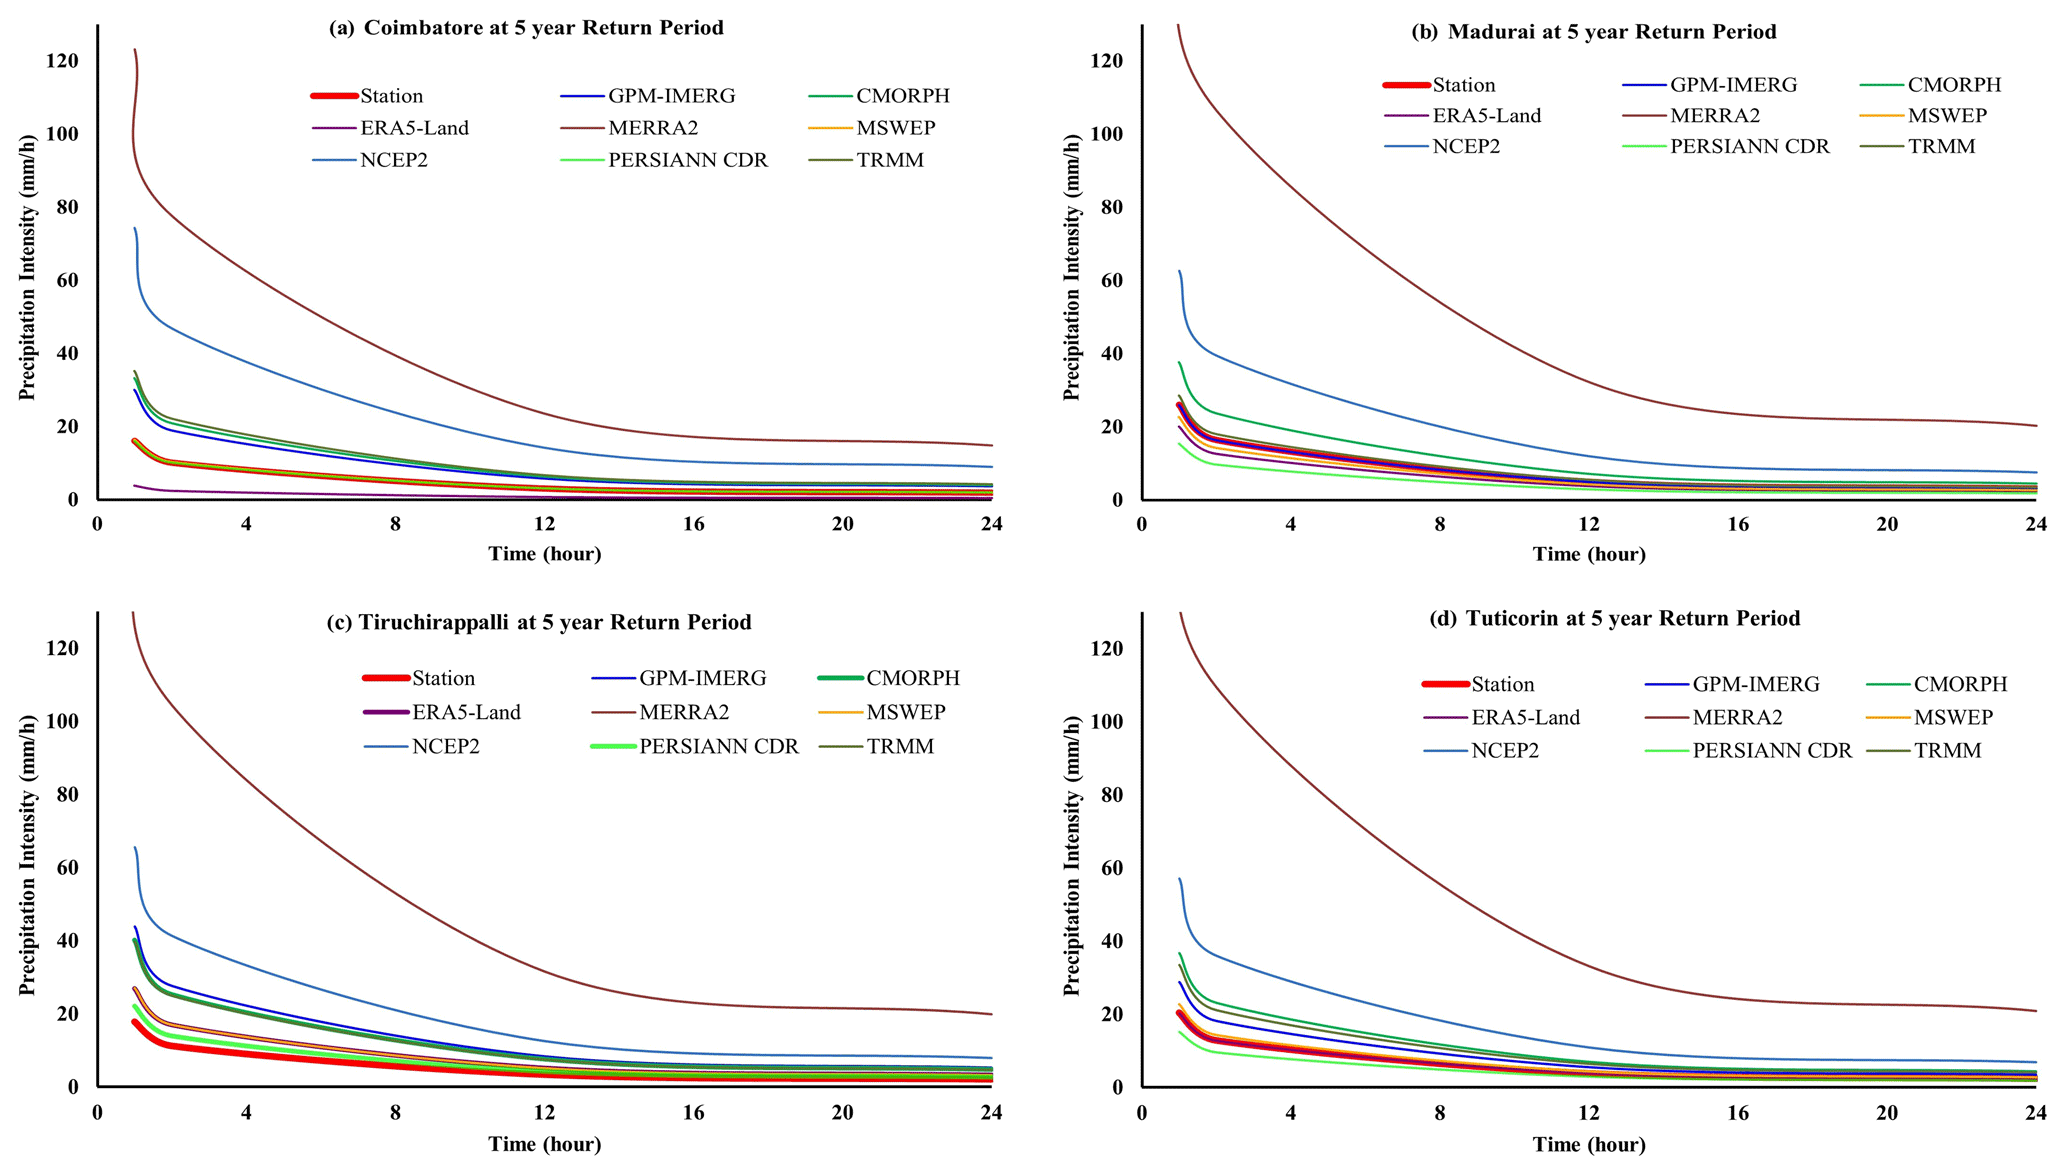
Figure 2Intensity–duration–frequency (IDF) curves based on daily extreme-precipitation (maximum) values for the study regions at a 5-year return period.
The range of precipitation frequencies at continuous intensity intervals (1–2, 2–5, 5–10, 10–20, 20–50, and ) was evaluated for the eight gridded precipitation products against the station data (Fig. S3 in the Supplement). Since the 0–1 mm d−1 frequency class accounts for more than 60 % of the daily grid-scale precipitation, it was investigated separately using Fig. S2 in the Supplement. At the grid scale in Coimbatore, more than 65 % of daily precipitation from the interpolated rain gauge falls in the intensity of 0–1 mm d−1. At this intensity range, GPM-IMERG (66 %) had very close interpolation to the station data, followed by ERA5-Land (61 %). From the occurrence frequency of precipitation at a different intensity, as shown in Fig. S3a, the CMORPH, GPM-IMERG, and TRMM products followed the station data trend, underestimating precipitation in the 1–20 mm d−1 range and thereafter overestimating it.
For the Madurai district, at grid scale, the frequency plot of 0–1 mm d−1 is shown in Fig. S2b. The PERSIANN CDR product provided a close estimate to the station data in the range of 0–1 mm d−1. By observing the precipitation occurrence frequency at higher ranges (i.e. from 5–50 mm d−1), CMORPH, GPM-IMERG, TRMM, and ERA5-Land consistently produced underestimated values, as signified by the negative bias value in Table 3. ERA5-Land and MSWEP were observed to have a similar trend to the gridded station data from 1–10 mm d−1; thereafter, it diverged. Although NCEP2 overestimated precipitation in the 2–10 mm d−1 range, it was found to capture gridded station data frequency at the remaining intensity levels (Fig. S3b). Among the products, MERRA2 had the highest overestimation frequency percentage, which is highly substantiated by the positive bias and Rbias values in Table 3.
In Tiruchirappalli, at grid scale, nearly 60 % of the interpolated ground station precipitation falls in the range of 0–1 mm d−1 (Fig. S2c). In the frequency range from 1–50 mm d−1, MSWEP was observed to have close agreement with the station data from 1–5 mm d−1, followed by NCEP2 and PERSIANN CDR from 5–20 mm d−1, TRMM and GPM-IMERG from 20–50 mm d−1, and ERA5-Land at a range greater than 50 mm d−1 (Fig. S3c). Further, Fig. S2d shows the grid-scale precipitation data of Tuticorin at 0–1 mm d−1 intensity range. It is observed that more than 55 % of the interpolated ground station precipitation falls in the 0–1 mm d−1 range, which was captured closely by NCEP2 and PERSIANN CDR. In the precipitation range of 0–1 mm d−1, NCEP2, followed by PERSIANN CDR, provided frequency estimates closer to the interpolated ground station data. Further, MSWEP is followed by ERA5-Land at a precipitation range of 1–2 mm d−1, NCEP2 is followed by MSWEP at 2–5 mm d−1, NCEP2 is at 5–20 mm d−1, TRMM is at 20–50 mm d−1, and PERSIANN CDR is above 50 mm d−1 (Fig. S3d).
3.1.2 District scale
The statistical evaluations perform better at the district scale and typically reflect the grid-scale trend. In Coimbatore, ERA5-Land recorded the lowest RMSE with 0.614 mm d−1 as compared to MSWEP at the grid scale. Moreover, PERSIANN CDR was observed to have the lowest bias and Rbias and the highest IA. In Madurai, the statistical metrics at the district level followed the grid-scale trend. In Tiruchirappalli, ERA5-Land recorded the lowest RMSE with 6.663 mm d−1, and other metrics followed the grid-scale trend. In Tuticorin, PERSIANN CDR was observed to have the highest correlation coefficient of 0.466 and the lowest RMSE of 6.025 mm d−1.
3.2 Evaluation of precipitation products at the monthly timescale
3.2.1 Grid scale
Compared to the estimations at the daily timescale, the monthly time frame exhibited a considerably lower error and stronger correlations with the station data. This could be because statistical metrics take less variability into account when analysing data with a lower temporal resolution. At the grid scale in Coimbatore, ERA5-Land had the highest correlation coefficient, followed by MSWEP (Tables 4 and S3 in the Supplement). The precipitation products NCEP2 and MERR2 were observed to have a correlation with the station data, indicating poor representation at this spatial scale. Further, ERA5-Land was observed to have the lowest MAE and RMSE, with values of 43.632 and 62.799 mm month−1, respectively. All the products were observed to overestimate the monthly grid-scale rainfall, with MERRA2 having the highest bias and Rbias values. On the other hand, TRMM and ERA5-Land were observed to have the lowest bias value and Rbias values of 0.197 and 0.079, respectively. Further, MSWEP had the highest IA, and NCEP2 had the lowest. In the Madurai region, the performance of the precipitation products at the grid scale was observed to be highly varied, as shown in Table 4. ERA5-Land recorded the highest correlation coefficient of 0.814, followed by MSWEP (CC=0.8). TRMM was observed to record the lowest MAE and RMSE. Further, five products underestimated precipitation, with negative bias and Rbias values. NCEP2 and MERRA2 overestimated precipitation at the monthly grid scale, with positive bias and Rbias values. NCEP2 was observed to have the lowest bias, whereas MERRA had the highest. Further, NCEP2 had the lowest IA, and TRMM had the highest.
In Tiruchirappalli, ERA5-Land had the highest correlation coefficient (CC=0.791), followed by PERSIANN CDR (r=0.770). In addition, as observed in Table 4, PERSIANN CDR recorded the lowest MAE, RMSE, bias, Rbias, and IA. Five products underestimated monthly grid-scale precipitation at Tiruchirappalli, while two overestimated it. In Tuticorin, MSWEP was observed to have the highest correlation coefficient (CC=0.796) and IA (0.862). Further, MSWEP recorded the lowest MAE and RMSE of 47.07 and 66.35 mm month−1. Among the products, PERSIANN CDR was found to have the lowest bias and Rbias values of −29.843 and −0.265, respectively (Table 4).
Table 4Monthly precipitation characteristics of Coimbatore, Madurai, Tiruchirappalli, and Tuticorin.
3.2.2 District scale
All the precipitation products overestimated rainfall at the district scale in Coimbatore, similar to their performance at the grid scale. ERA5-Land recorded the highest CC and IA in the Coimbatore district. In contrast to grid-scale performance, TRMM produced the lowest MAE (35.842 mm month−1) and RMSE (50.348 mm month−1), followed by ERA5-Land (Tables 4 and S3). District-scale performance of precipitation products at Madurai and Tiruchirappalli mostly depicted similar trends to those observed at the grid scale (Table 4). MAE trends at the district scale differed from those of grid-scale performance in Madurai. TRMM (62.883 mm month−1) and MERRA2 (333.675 mm month−1) recorded the lowest and highest MAE in Madurai. In Tuticorin, TRMM recorded the highest CC, followed by GPM-IMERG (Tables 4 and S3). In terms of error, PERSIANN CDR was found to have the lowest MAE (44.033 mm month−1) and RMSE (61.570 mm month−1). The performance of bias, Rbias, and IA followed a similar trend to that observed at the grid scale.
Further, we also investigated the seasonal trend using %MAE during the monsoon (October–December) and non-monsoon months (January–November) of the study period. Figure 3a shows that ERA5-Land, followed by CMORPH and GPM-IMERG, closely depicts the station's monsoon precipitation in Coimbatore. On the other hand, all the products overestimated precipitation for the non-monsoon month, with CMORPH having the closest fit. From Fig. 3b, monsoon months have a lower %MAE compared to non-monsoon months. CMORPH, followed by PERSIANN CDR, recorded the lowest %MAE during the monsoon and non-monsoon months in Coimbatore. In Madurai, most of the products underestimated the monsoon month precipitation, while MERRA2 overestimated it (Fig. 3c). During non-monsoon months, PERSIANN CDR had the closest agreement with the station precipitation data. Figure 3d shows that ERA5-Land and MERRA2 had the lowest monsoon month %MAE. On the other hand, CMORPH, followed by MSWEP, had the lowest %MAE during non-monsoon months in Madurai. In Tiruchirappalli, all products except MERRA2 underestimated the monsoon month precipitation. Figure 3e shows that GPM-IMERG produced the closest value with respect to the station data. Further, CMORPH, followed by PERSIANN CDR, provided the closest estimates to the station data during the non-monsoon months. ERA5-Land recorded the lowest %MAE during both periods, as shown in Fig. 3f. Like Madurai and Tiruchirappalli, monsoon month precipitation was underestimated by most of the products in Tuticorin (Fig. 3g). MSWEP and PERSIANN CDR estimated the closest value with respect to the station data during the monsoon and non-monsoon months, respectively. Further, ERA5-Land and PERSIANN CDR estimated the lowest %MAE during the monsoon and non-monsoon months, respectively (Fig. 3h).
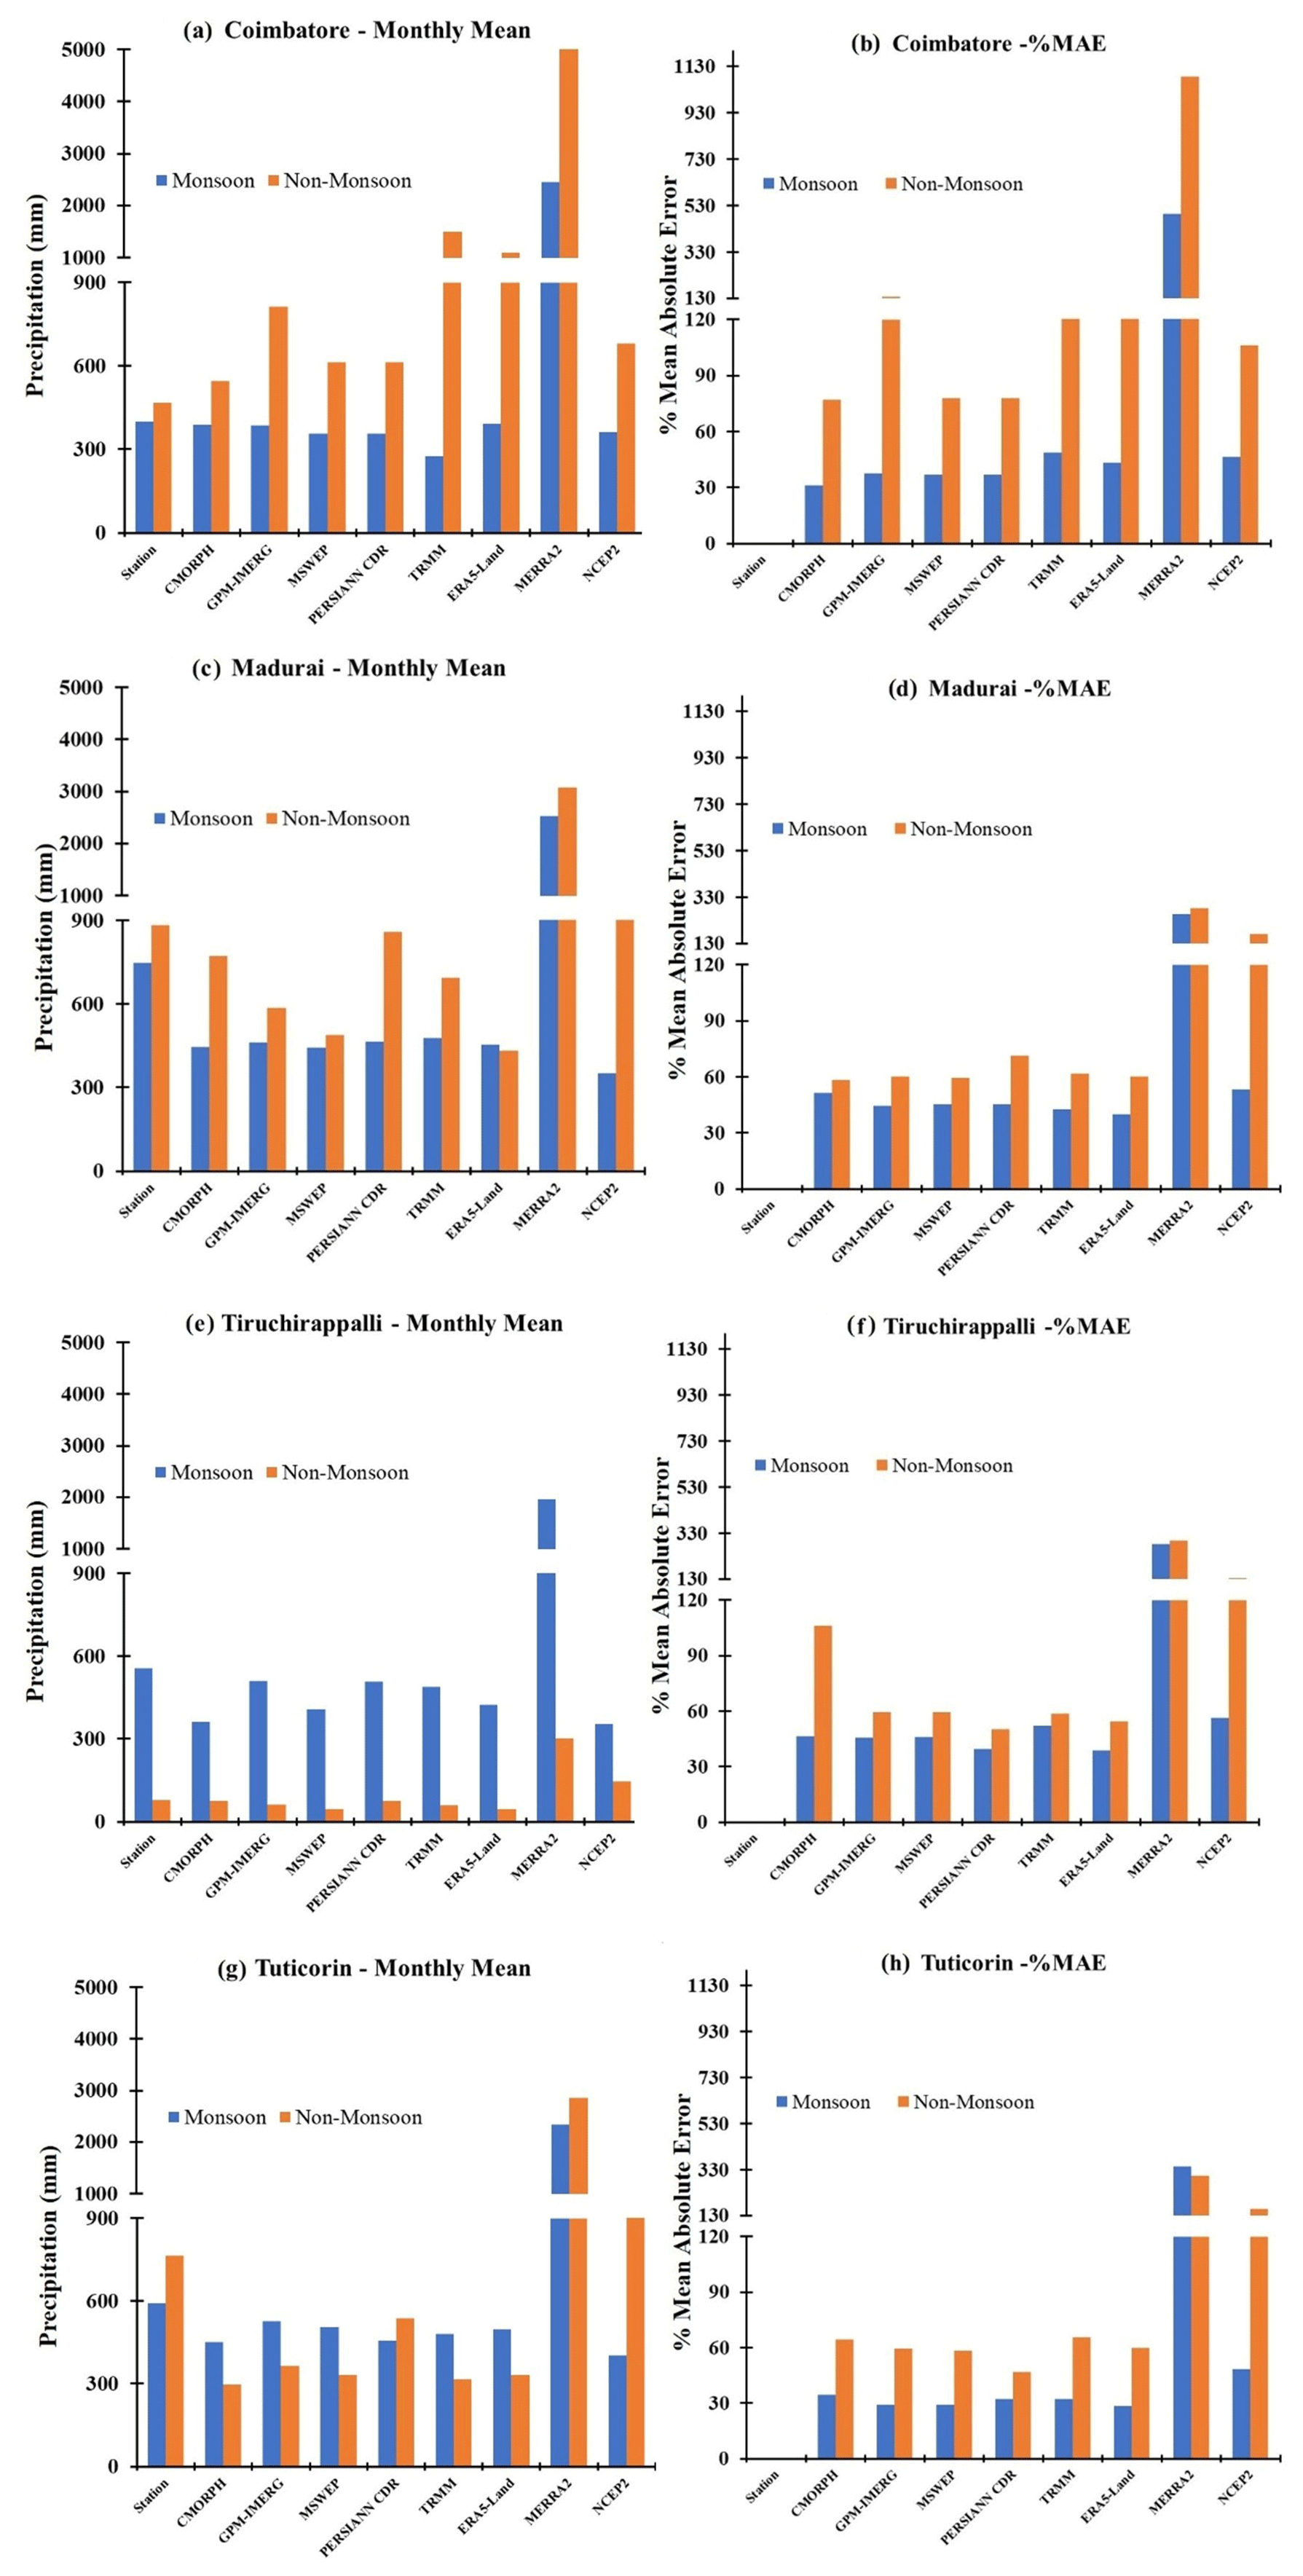
Figure 3Monthly mean and %MAE of different precipitation products with respect to station data in Coimbatore (a, b), Madurai (c, d), Tiruchirappalli (e, f), and Tuticorin (g, h).
3.3 Evaluation of precipitation products at the annual timescale
3.3.1 Grid scale
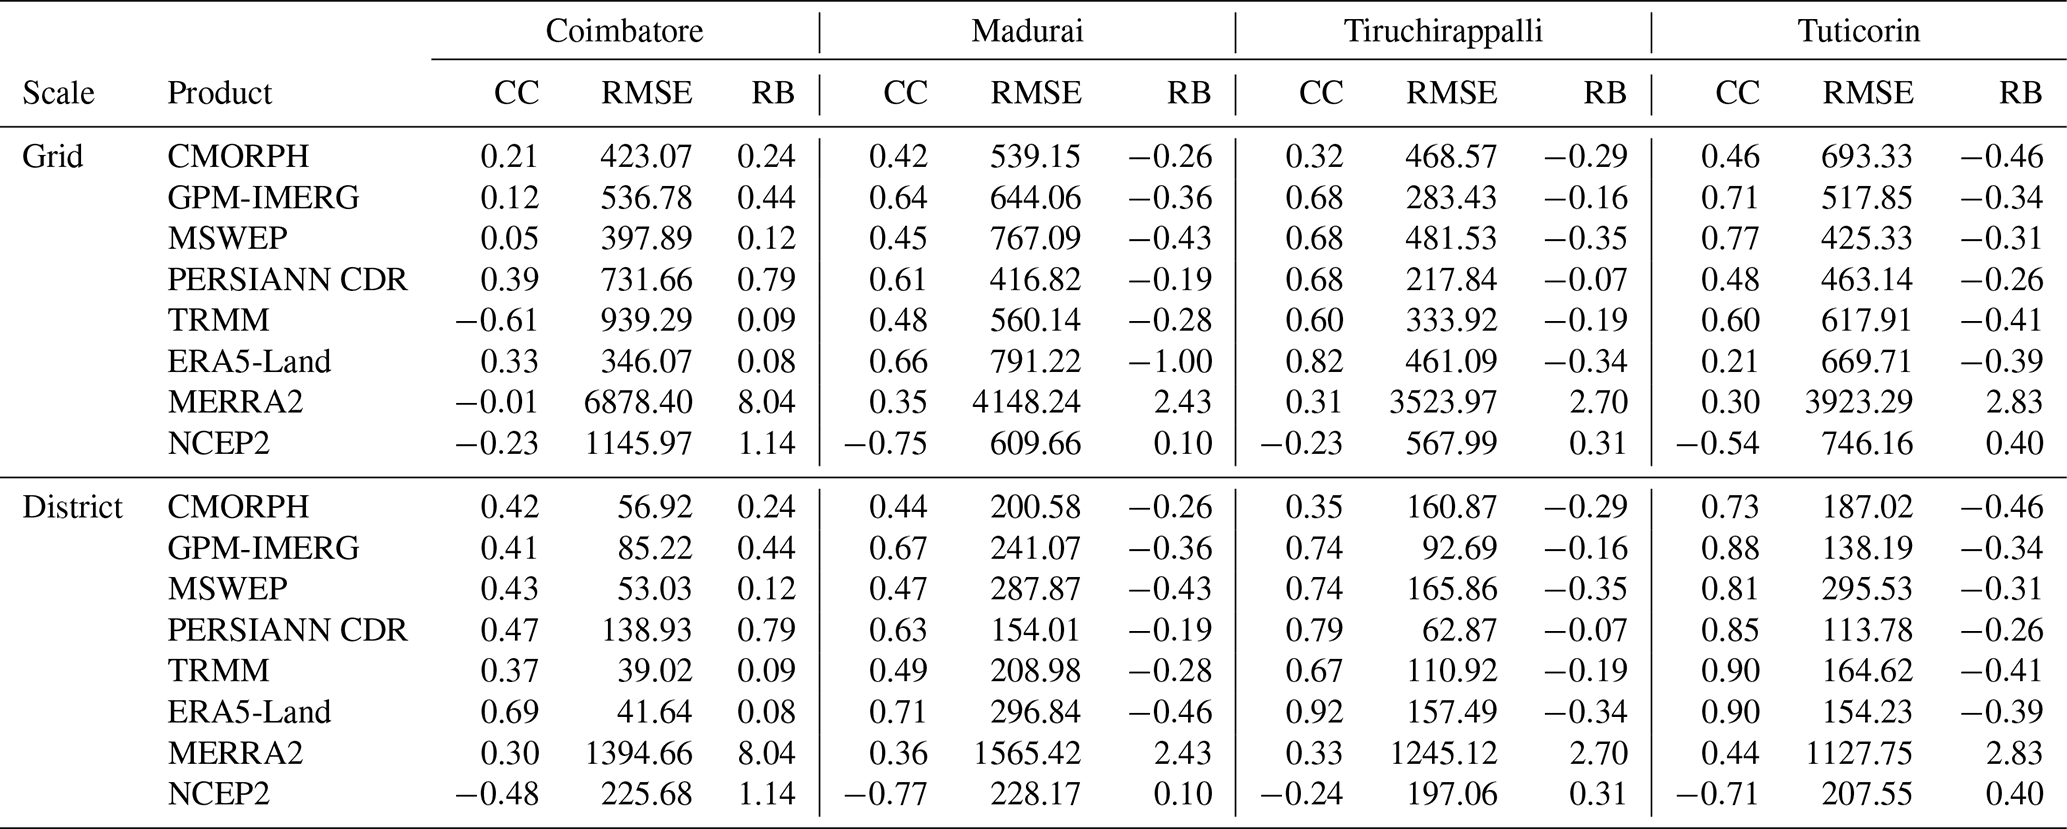
Grid-scale daily precipitation was summed as the annual precipitation and was statistically evaluated against the station data. PERSIANN CDR recorded the highest CC in Coimbatore, while ERA5-Land had the best metrics regarding MAE, RMSE, and IA. All the products overestimated precipitation, with the highest overestimation caused by ERA5-Land (Tables 5 and S4 in the Supplement). In Madurai and Tiruchirappalli (Table 5), PERSIANN CDR was found to have the lowest MAE and RMSE and the highest IA. On the other hand, ERA5-Land had the highest CC. Except for NCEP2 and MERRA2, all the products underestimated precipitation. In Tuticorin, MSWEP was found to have the highest CC and IA and lowest RMSE (Tables 5 and S4). PERSIANN CDR recorded the lowest MAE, bias, and Rbias.
Table 5Yearly precipitation characteristics of Coimbatore, Madurai, Tiruchirappalli, and Tuticorin.
The yearly precipitation was further evaluated with Taylor plots, which enable the comparison of multiple models with reference to the station value in a single plot. In general, precipitation products show overestimation in Coimbatore and underestimation in the remaining study regions, as substantiated by their bias value in Tables 5 and S4. In addition, NCEP2 and MERRA2 could not be included in the same plot as the other products due to their higher standard deviation values. By examining the scatter of the product's RMS at the grid spatial scale, PERSIANN CDR had the closest relationship to the station data in Coimbatore, ERA5-Land in Madurai and Tiruchirappalli, and MSWEP in Tuticorin (Fig. 4). Similar trends were observed at the district scale, except in Tuticorin, where ERA5-Land was closer to the station data (Fig. S4 in the Supplement). From the combined Taylor plot at the annual scale, it is observed that ERA5-Land's performance in Tiruchirappalli is the closest to the observations. The RMS spread of GPM-IMERG, ERA5-Land, and PERSIANN CDR is similar in Madurai. Partial clustering of PERSIANN CDR with GPM is observed in Tiruchirappalli. Most of the precipitation products' RMS deviates from the observed data for the Coimbatore region (Fig. S5a in the Supplement). For the combined Taylor plot in monsoon months, GPM-IMERG of Madurai is the closest to the station RMS, as shown in Fig. S5b. Unlike annual and non-monsoon plots, NCEP2 was observed to be included in the monsoon Taylor plot. The performance of precipitation products, like TRMM and PERSIANN CDR of Madurai and Tuticorin, is clustered around the similar RMS value. During non-monsoon months, ERA5-Land in Tiruchirappalli is closer to the standard deviation of the station. The deviation of precipitation products from the station standard deviation is greater in Coimbatore for non-monsoon months. Clustering of multiple precipitation products for Tuticorin is observed, indicating their similarity in performance (Fig. S5c).
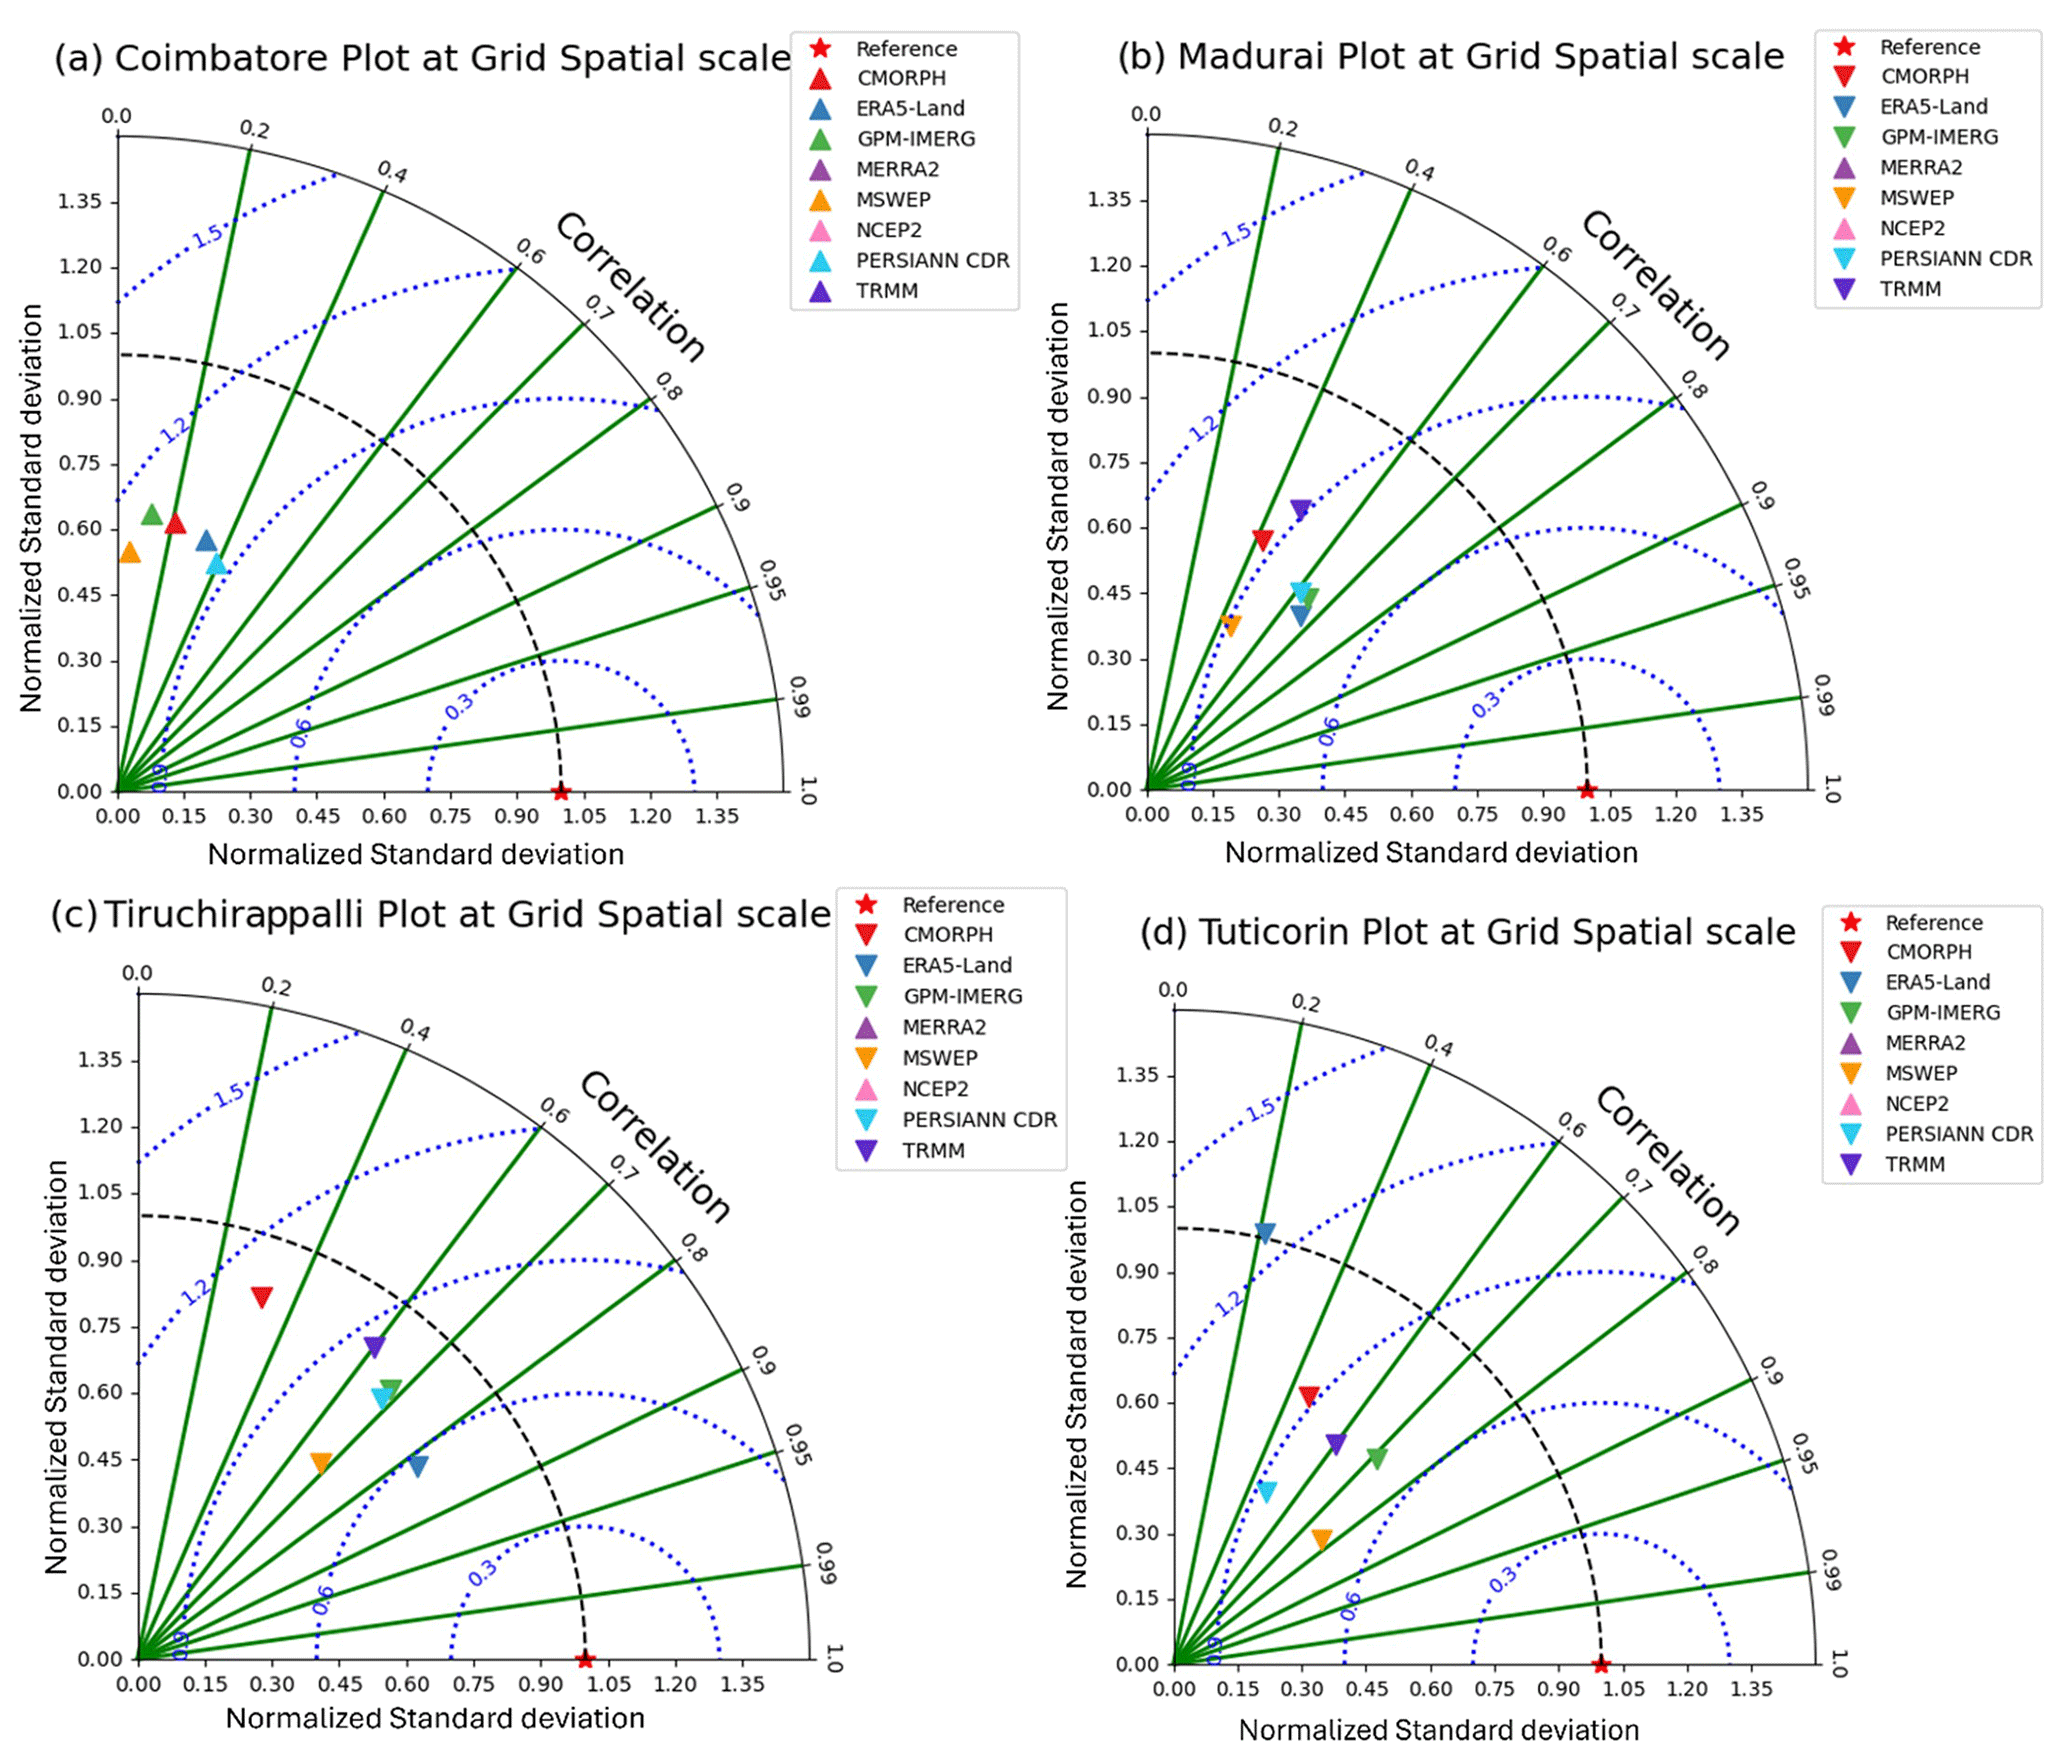
Figure 4Taylor diagram depicting the agreement between station data and precipitation products at a yearly grid scale for (a) Coimbatore, (b) Madurai, (c) Tiruchirappalli, and (d) Tuticorin.
Geospatial maps of annual rainfall were plotted using inverse distance weighting (IDW) of the grid-scale values using ArcGIS Pro software. The accuracy of the different precipitation products in terms of capturing variability can be assessed through these plots. In the station data spatial map, the distribution of ground station points and their respective linearly interpolated grids are plotted to understand the precipitation variation across the grids. The red dots represent the locations of ground stations from which precipitation data were collected for the period 2003–2014. The black stars indicate the linearly interpolated 0.1° grids. For the evaluation, only grids surrounded by at least one rain gauge were considered (Figs. 5a, 6a, 7a, and 8a). The station values from Coimbatore showed large variability from south to north (Fig. 5a). The annual precipitation varied from 400 mm in the southern region to 1200 mm in the northern region. Moreover, a few pockets in the northern region received precipitation higher than 1200 mm. CMORPH and, to some extent, GPM-IMERG represented precipitation in the northern region (Fig. 5b and c). All the products overestimated precipitation in the southern region. Based on the correlation values and RMSE given in Table 5, along with Fig. 5, it can be concluded that ERA5-Land produces a close estimate of the station data. In Coimbatore, CMORPH and GPM-IMERG closely depicted the station precipitation pattern in the northern regions. On the other hand, ERA5-Land produced the closest estimate in the southern portion.
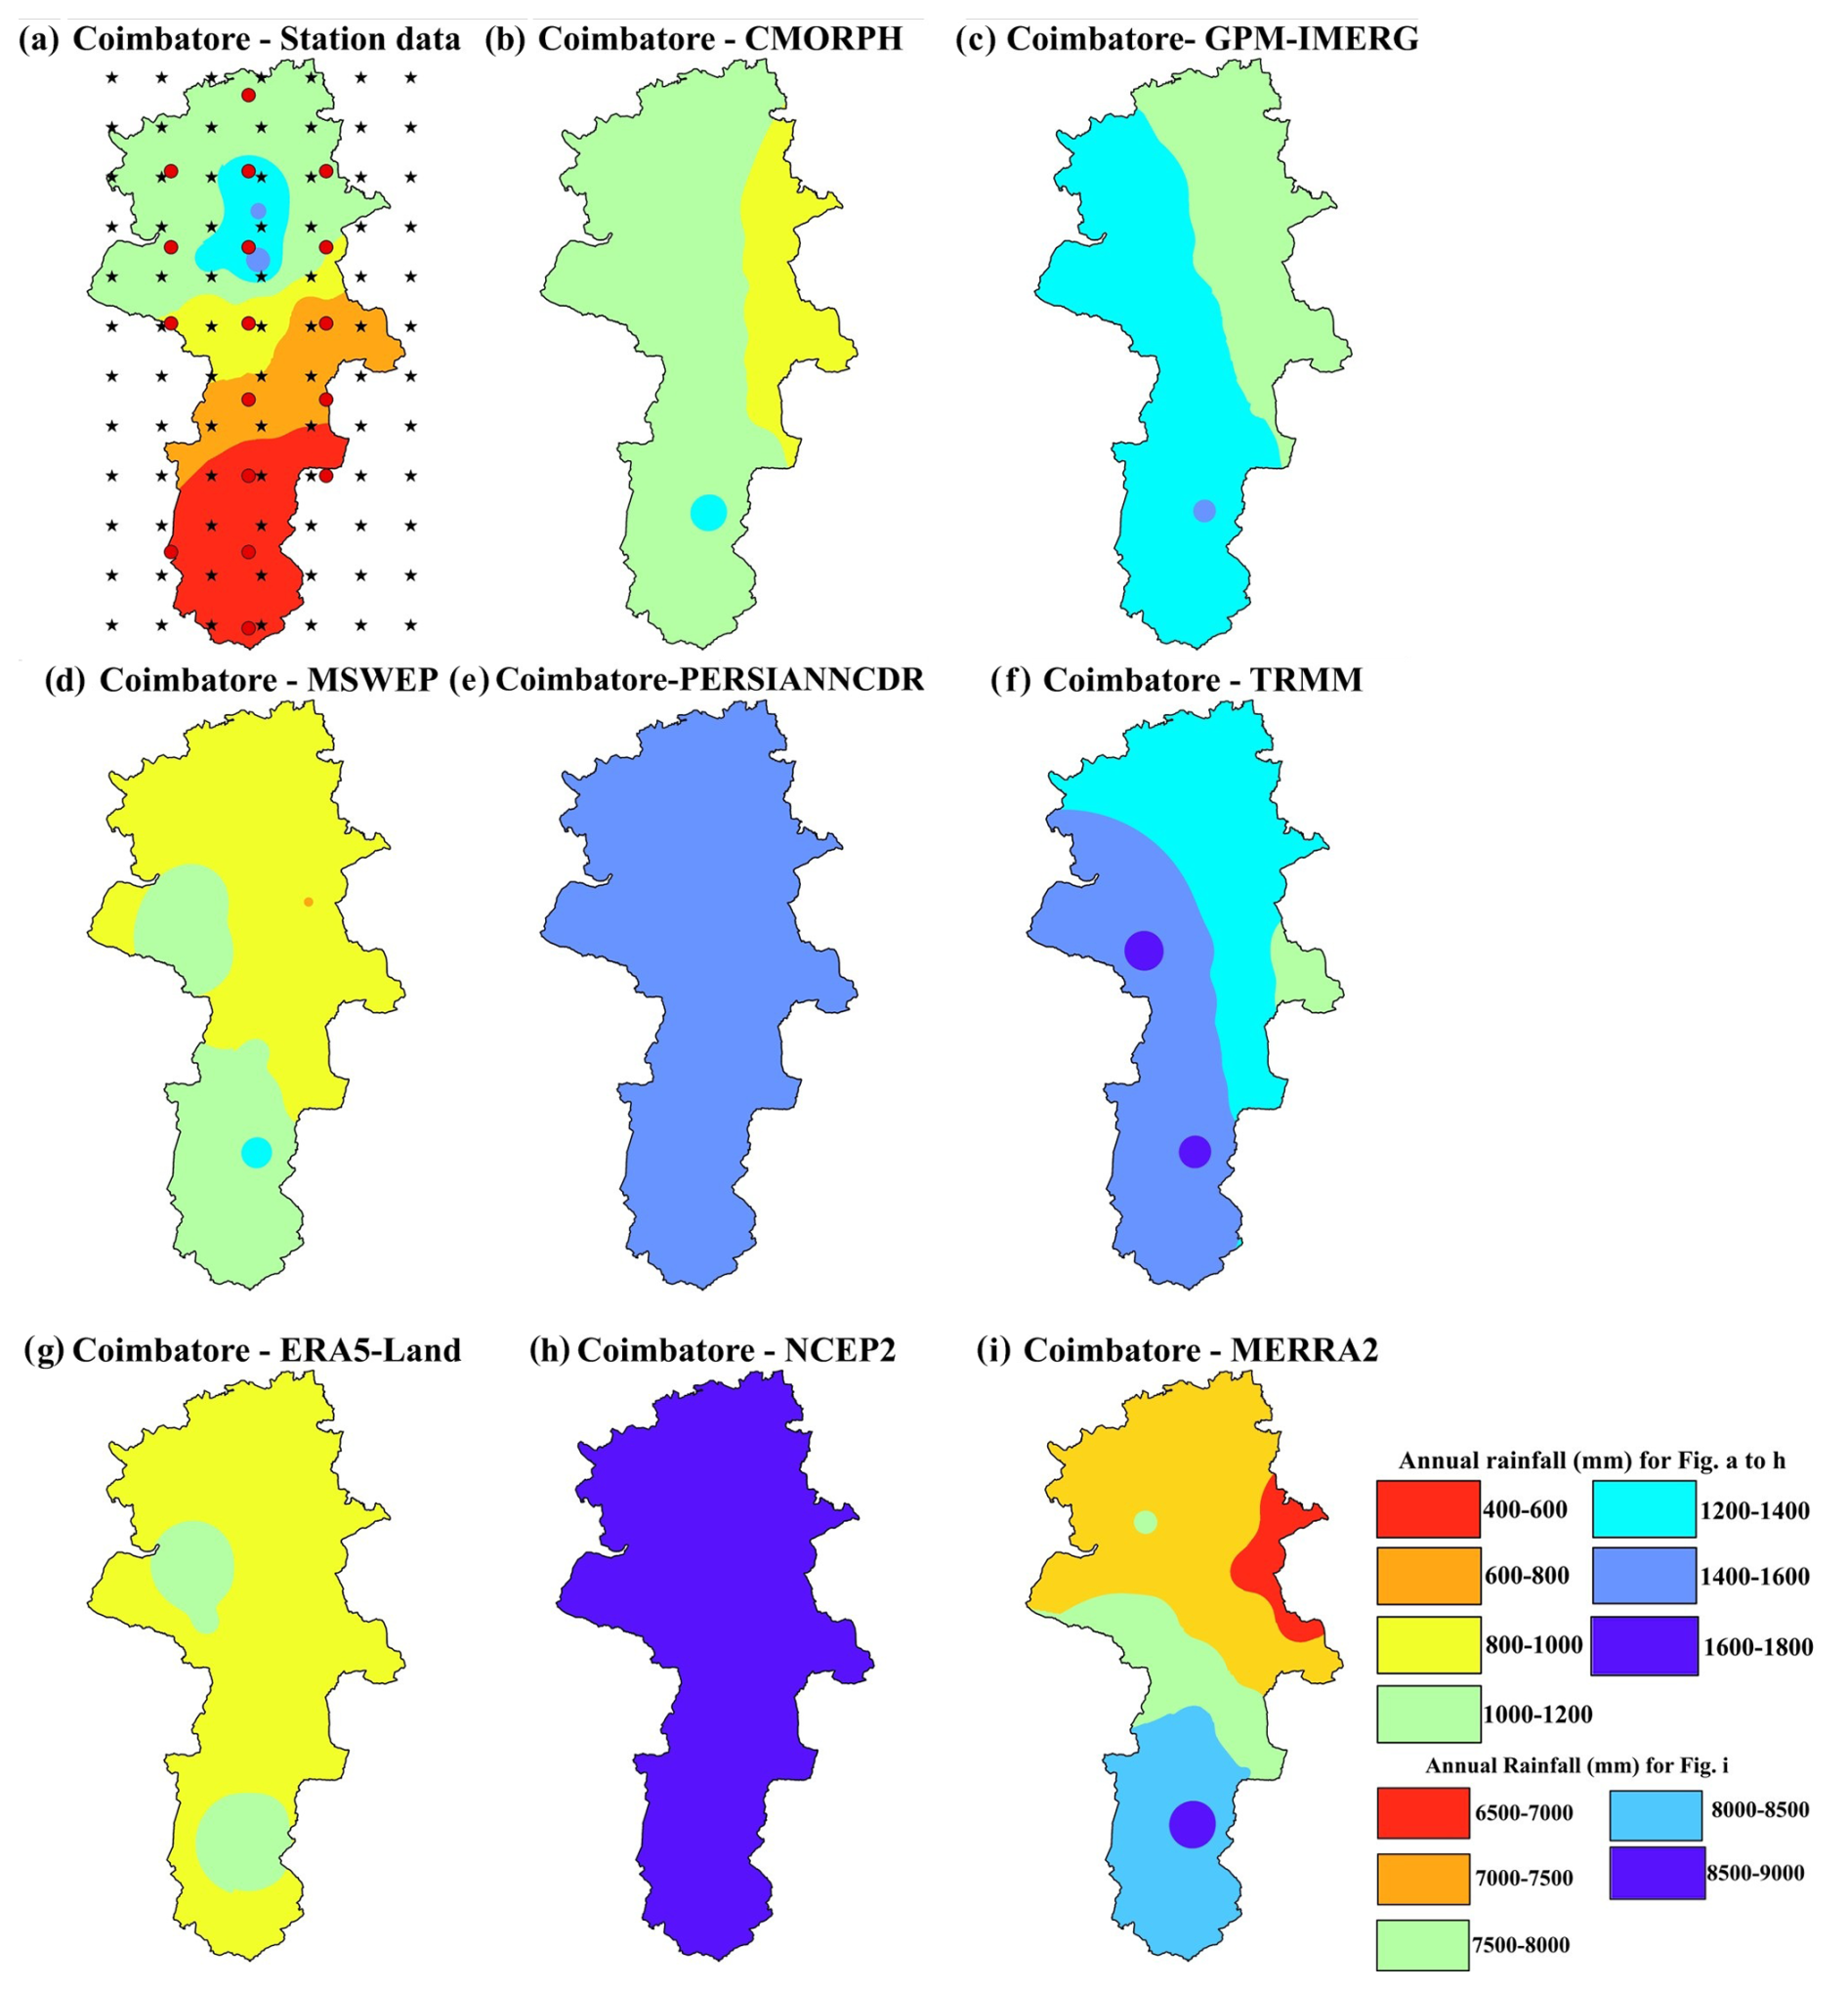
Figure 5Mean annual precipitation for the station data and different precipitation products in Coimbatore. In the station data spatial map, the distribution of ground station points and their respective linearly interpolated grids are plotted to understand the precipitation variation across the grids. The red dots represent the locations of ground stations from which precipitation data were collected for the period 2003–2014. The black stars indicate the linearly interpolated 0.1° grids. For the evaluation, only grids surrounded by at least one rain gauge were considered.
The Madurai district mostly had an even distribution of precipitation within 1600–1800 mm (Fig. 6a). In contrast to the results of the statistical evaluation (Table 5), NCEP2 had the closest estimates (Fig. 6h). Except for MERRA2, all the products highly underestimated precipitation (Fig. 6). Annual precipitation in the Tiruchirappalli district falls in the range of 1100–1300 mm, with the eastern portion having 1300–1500 mm (Fig. 7a). Although PERSIANN CDR did not capture the variability in the eastern region, it produced the closest estimate (Fig. 7e). Most of the precipitation products underestimated precipitation, as expected from the negative RB values in Table 5, and did not capture its regional variability (Fig. 7). In Tuticorin, high precipitation variability is observed from the station data. The southern and, to some extent, eastern portions received precipitation in the 1400–1600 mm range, with some portions even exceeding 1600 mm. The remaining portions mostly had precipitation in the 1200–1400 mm range, and part of the western portion had 1000–1200 mm (Fig. 8a). Except for MERRA2 and NCEP2, all products underestimated precipitation (Fig. 8). Among the products, MSWEP and GPM produced the closest estimates compared to the station data, which is also evident from the higher CC values in Table 5.
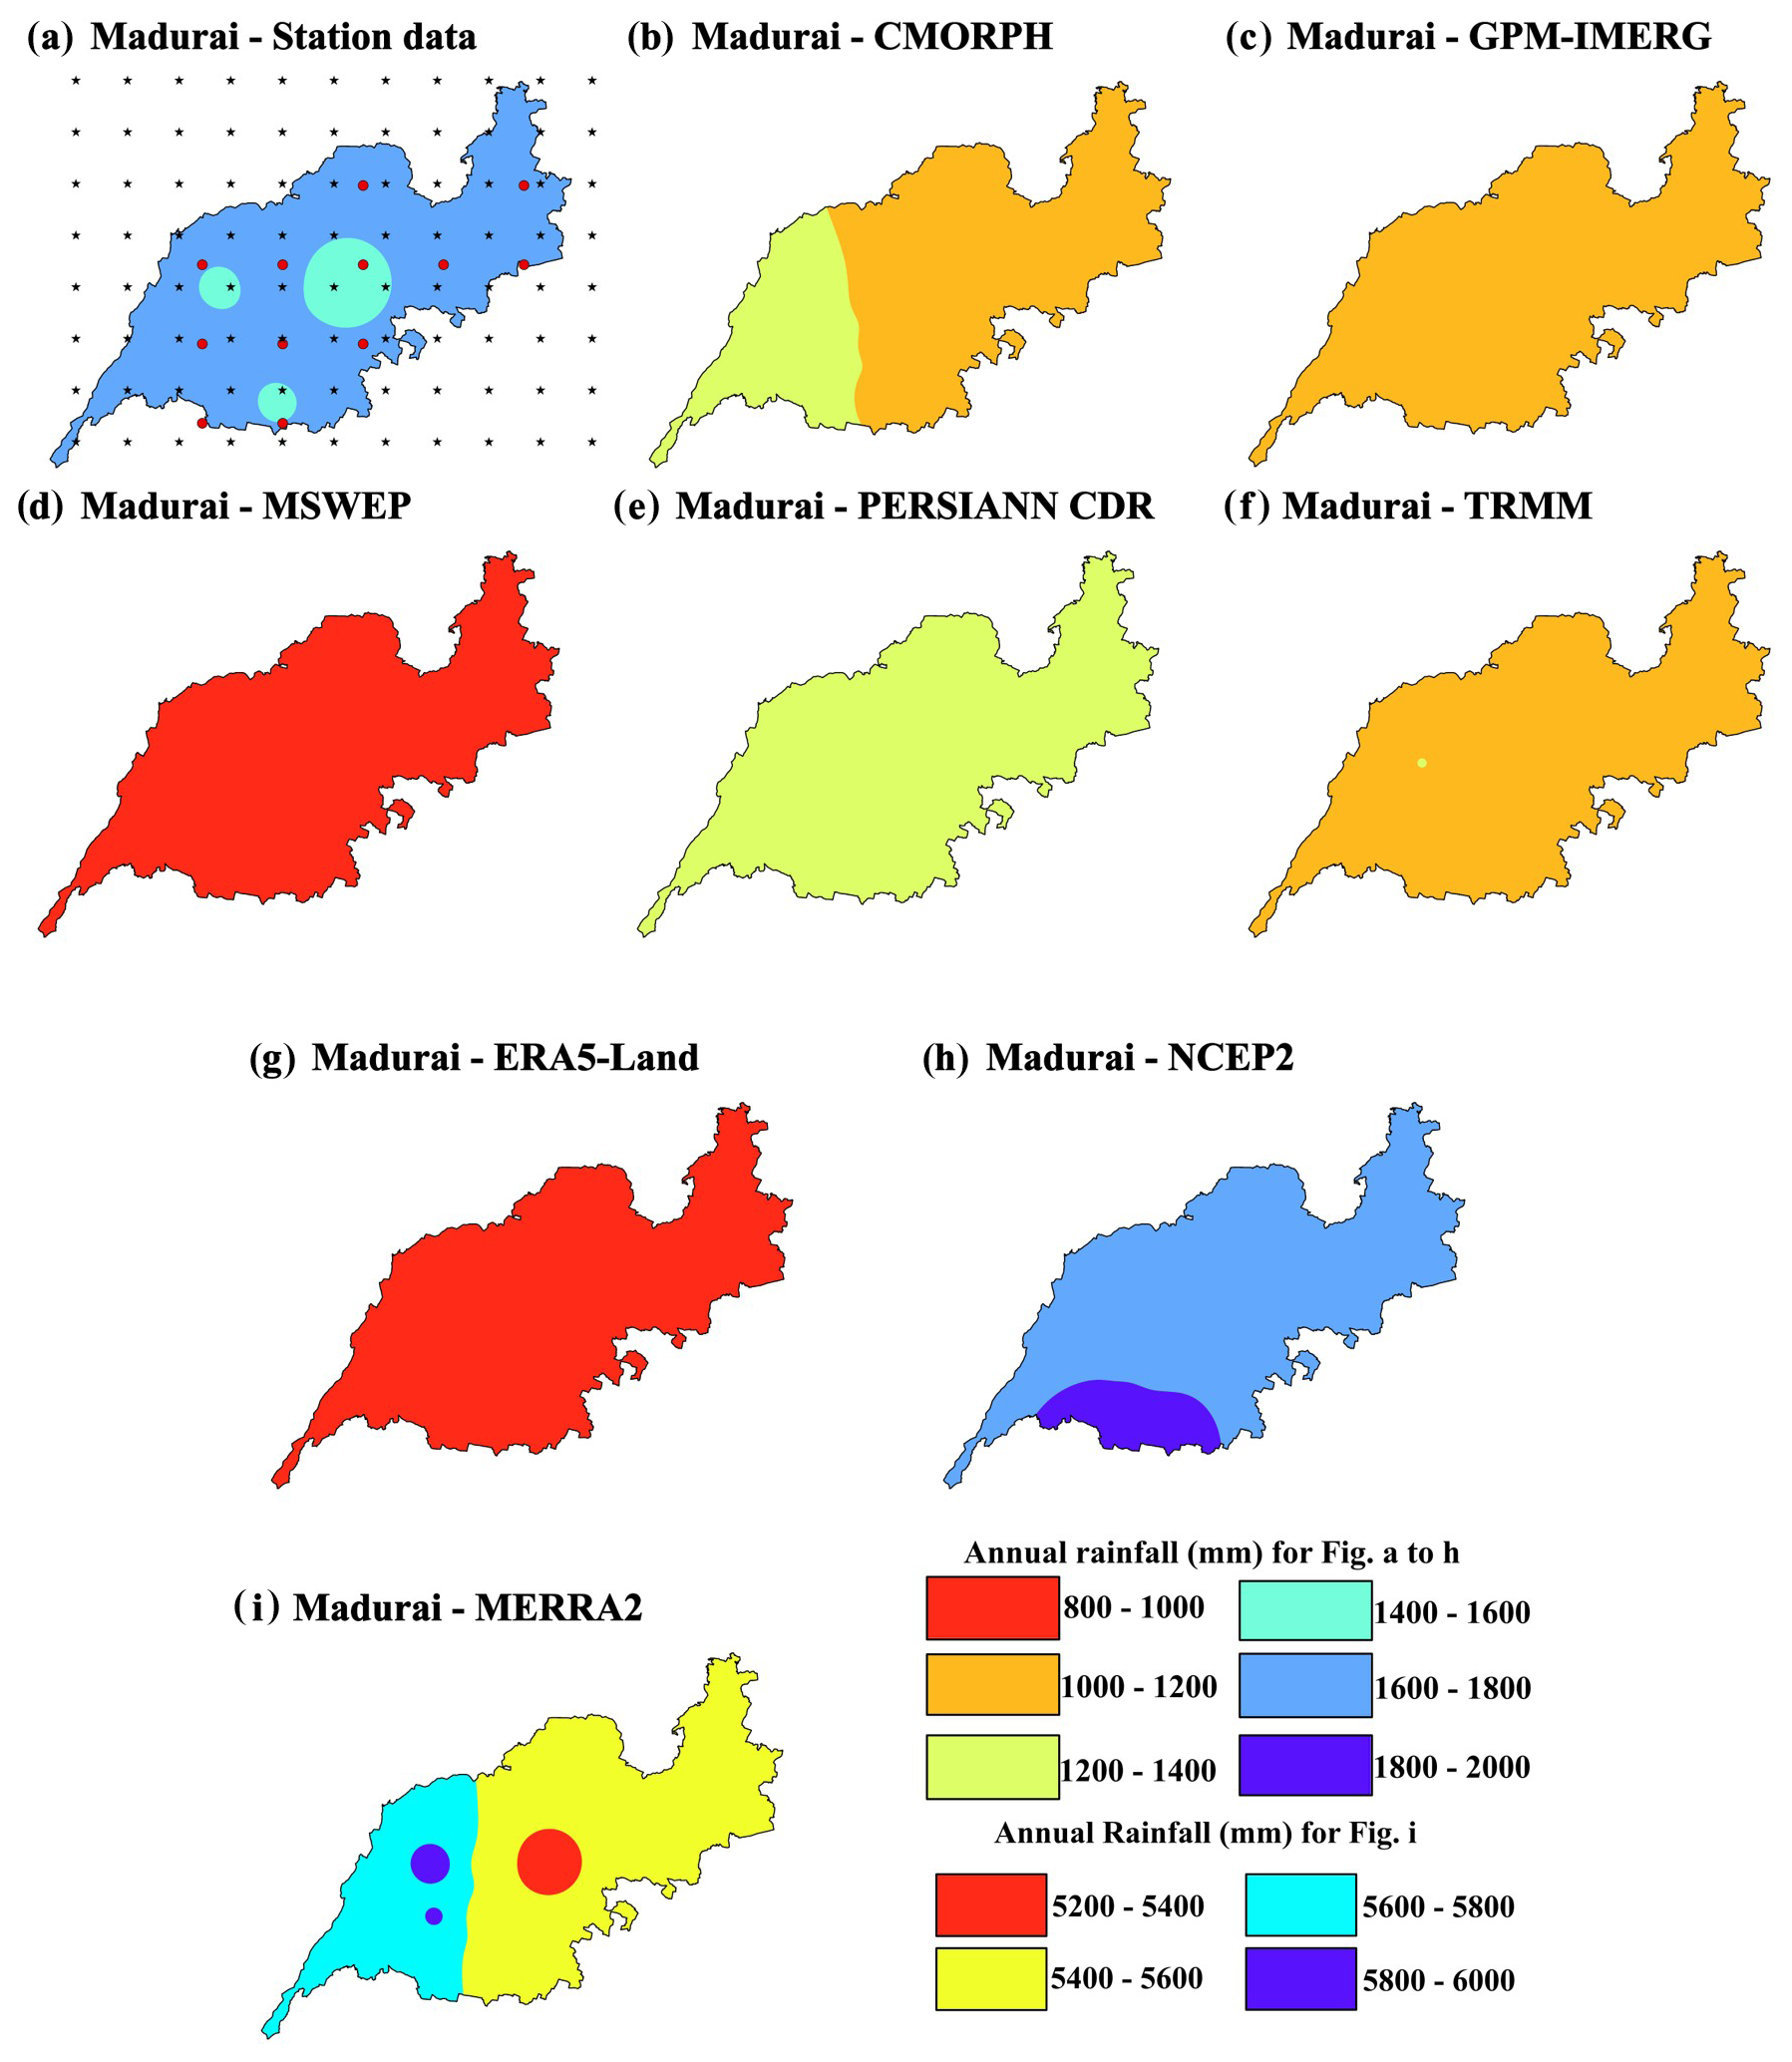
Figure 6Mean annual precipitation for the station data and different precipitation products in Madurai. In the station data spatial map, the distribution of ground station points and their respective linearly interpolated grids are plotted to understand the precipitation variation across the grids. The red dots represent the locations of ground stations from which precipitation data were collected for the period 2003–2014. The black stars indicate the linearly interpolated 0.1° grids. For the evaluation, only grids surrounded by at least one rain gauge were considered.
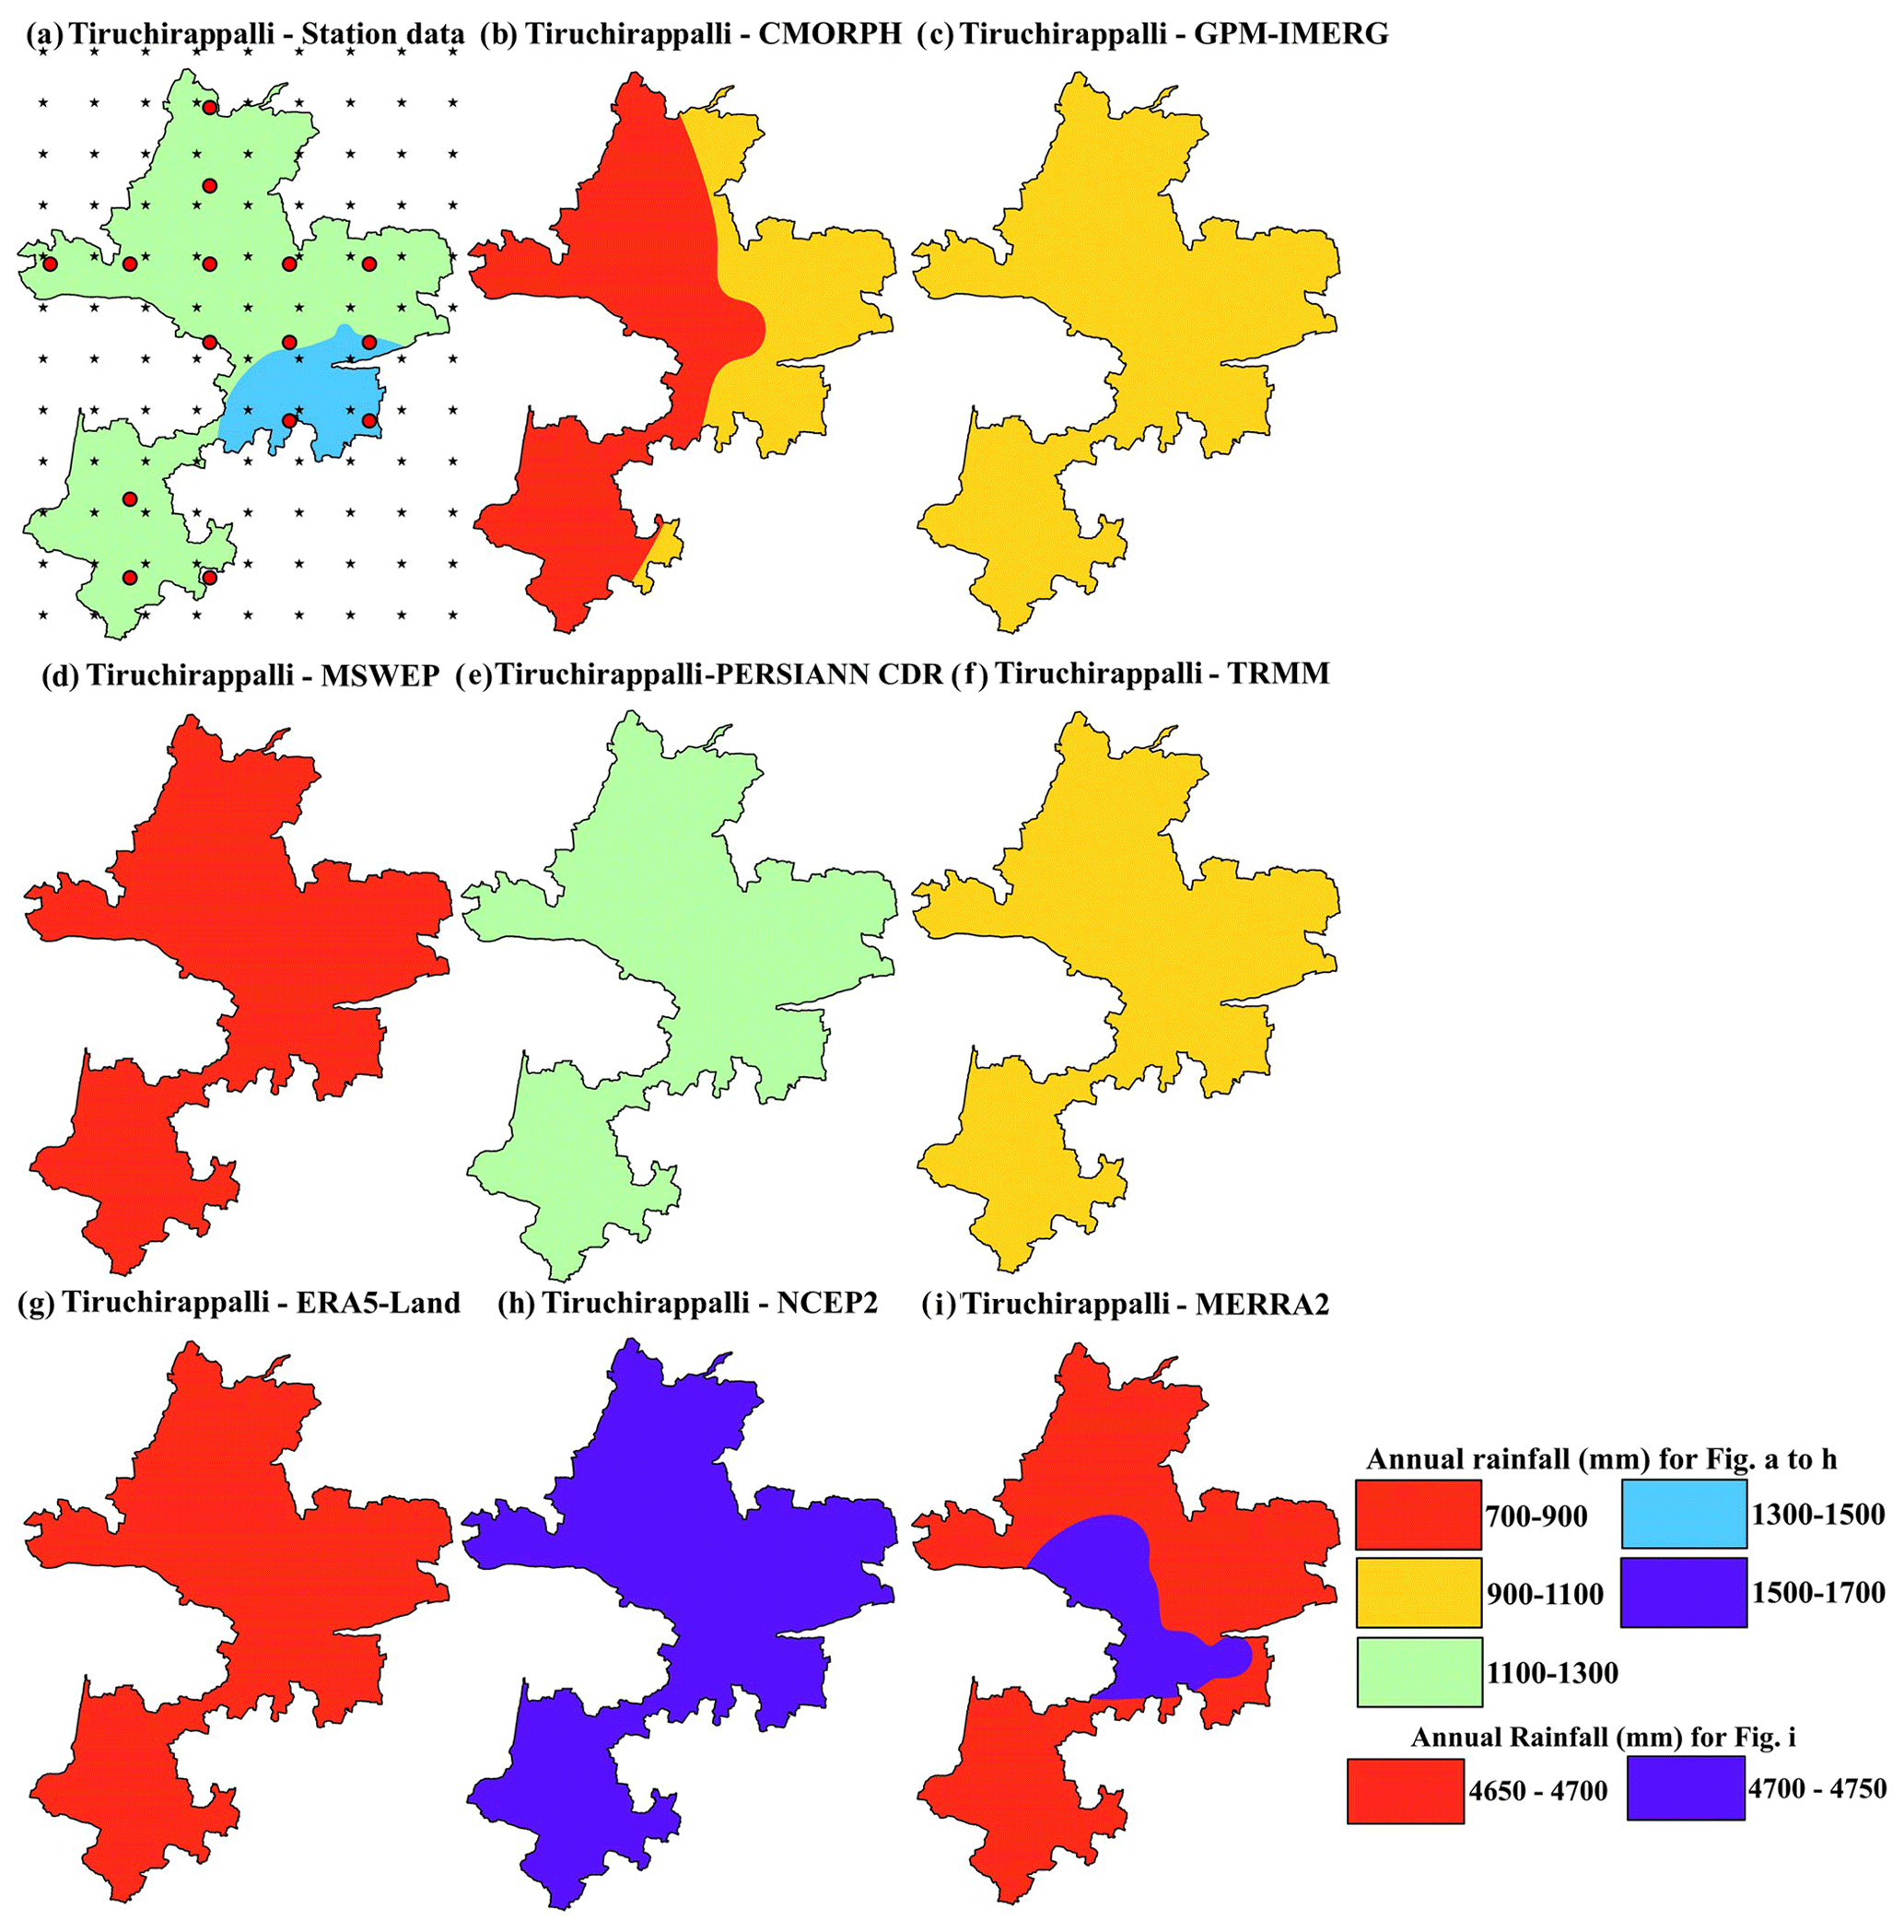
Figure 7Mean annual precipitation for the station data and different precipitation products in Tiruchirappalli. In the station data spatial map, the distribution of ground station points and their respective linearly interpolated grids are plotted to understand the precipitation variation across the grids. The red dots represent the locations of ground stations from which precipitation data were collected for the period 2003–2014. The black stars indicate the linearly interpolated 0.1° grids. For the evaluation, only grids surrounded by at least one rain gauge were considered.
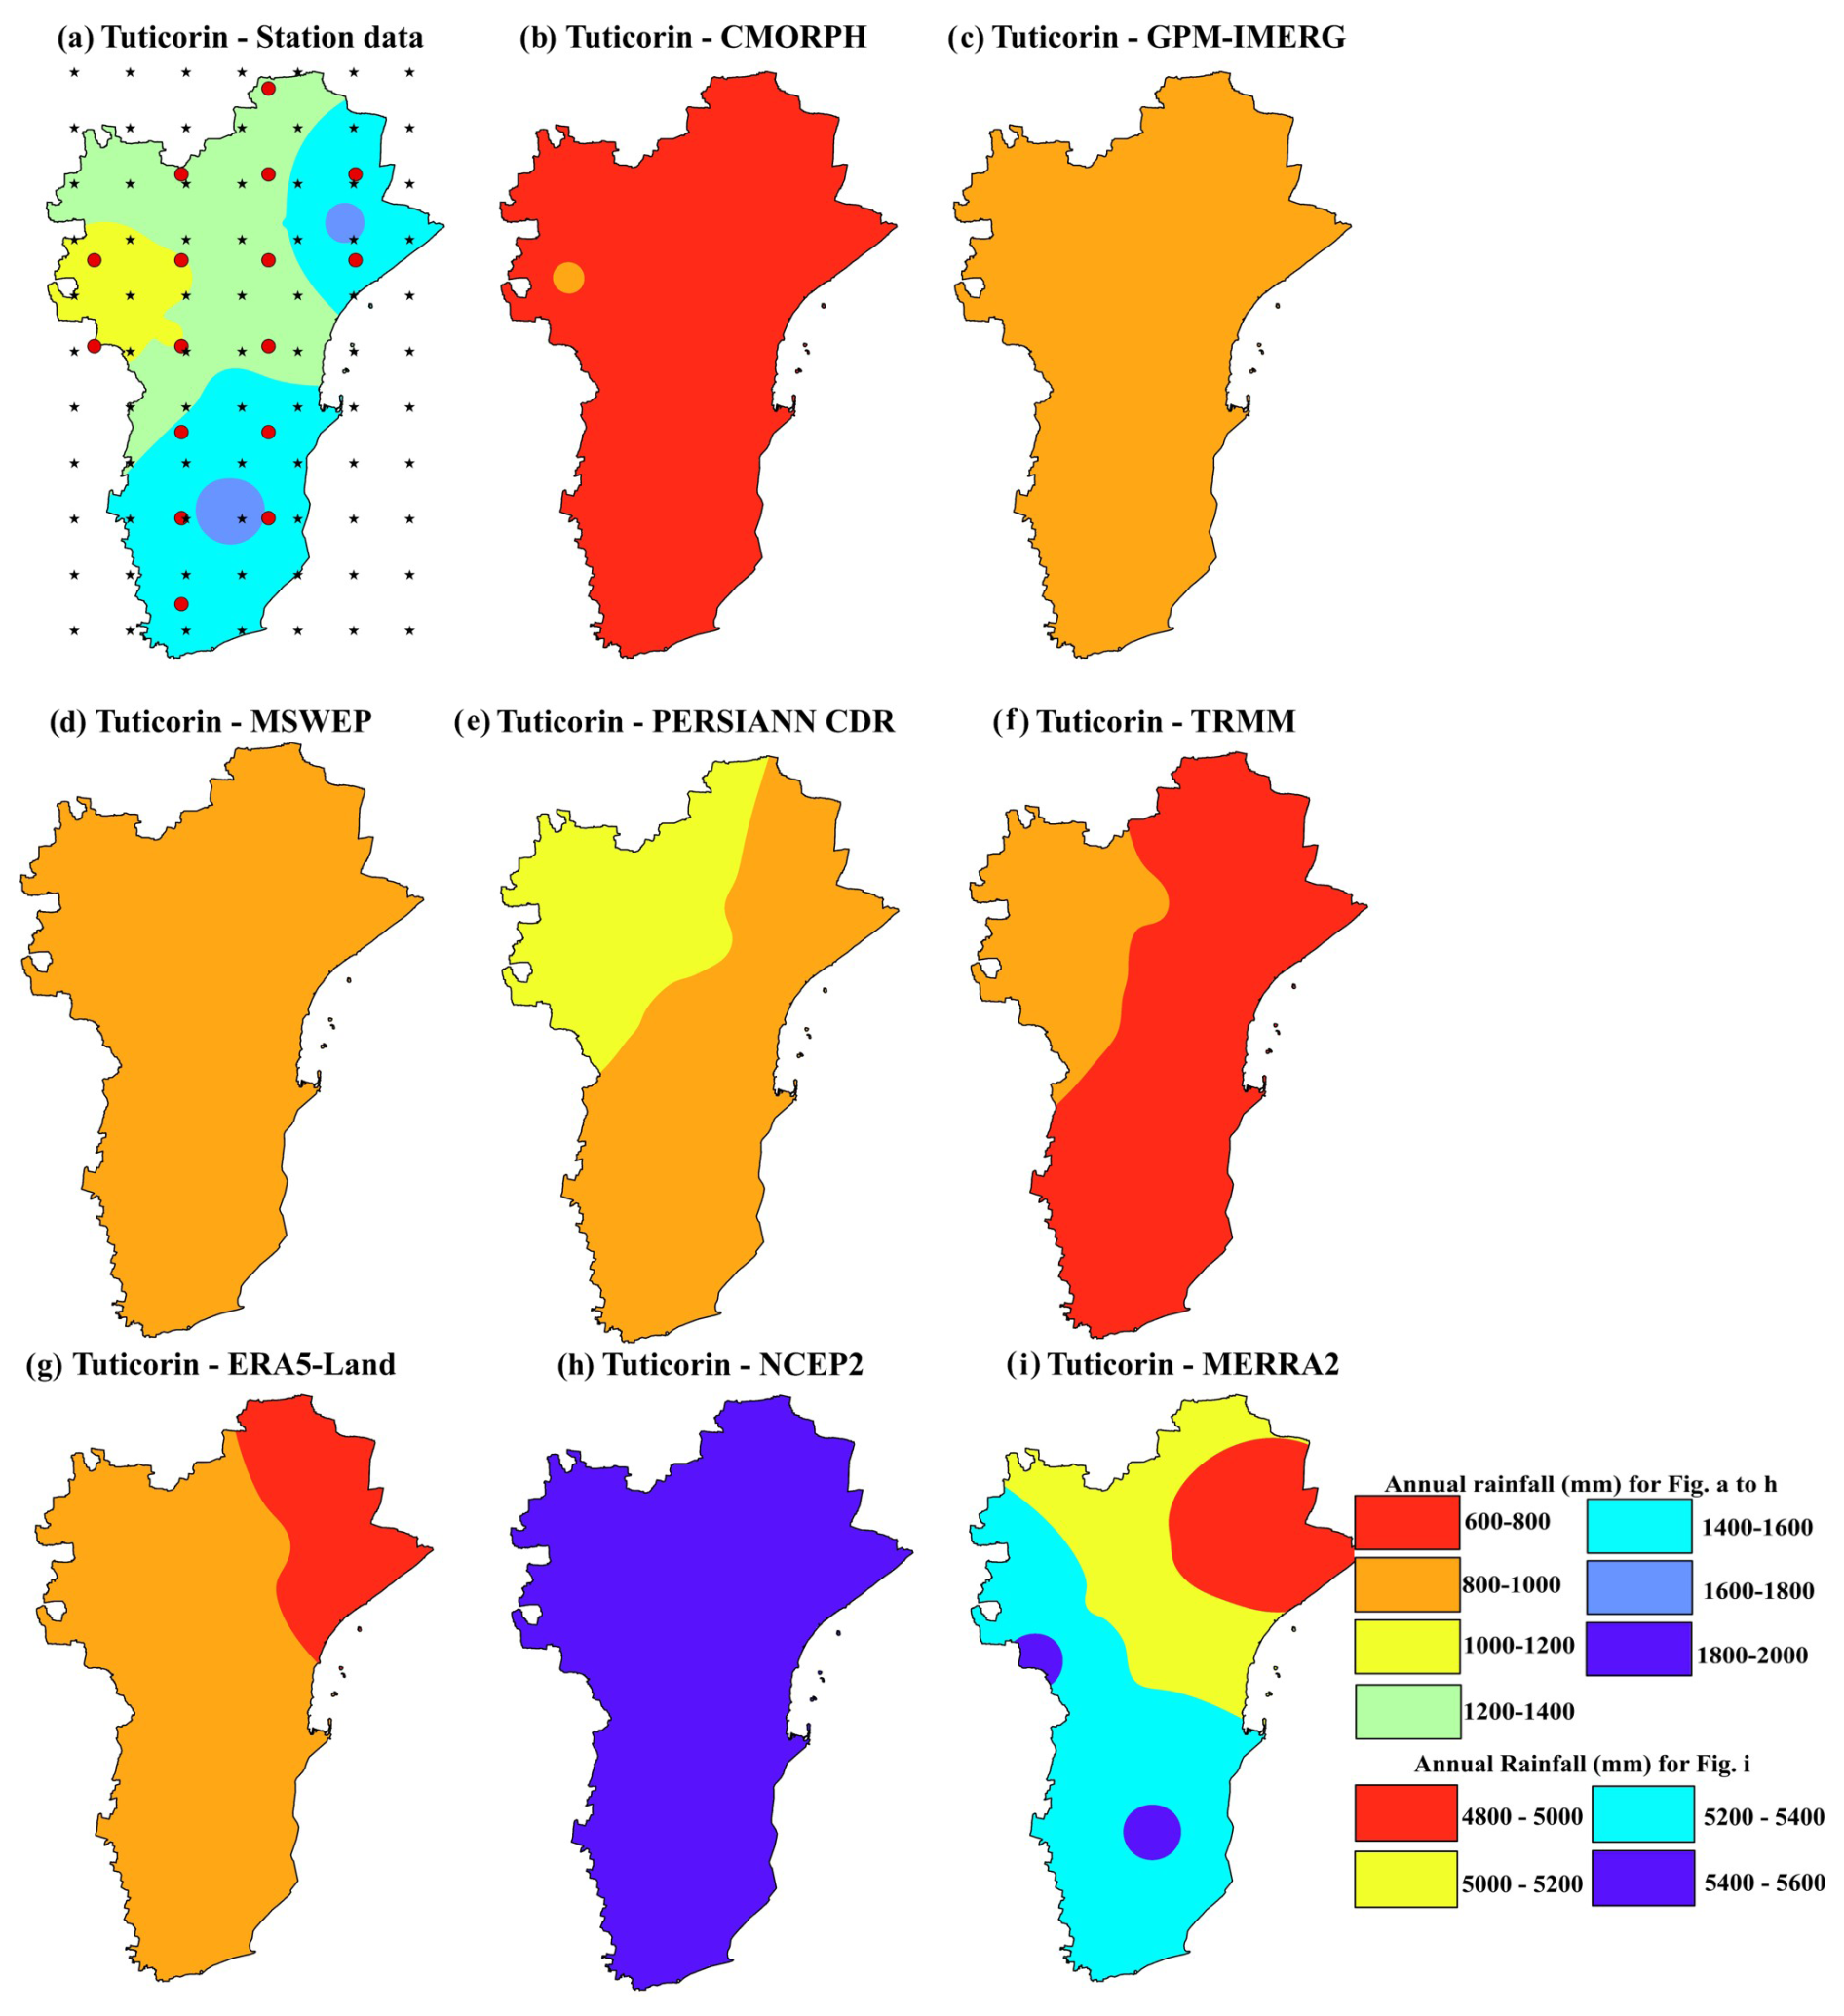
Figure 8Mean annual precipitation for the station data and different precipitation products in Tuticorin. In the station data spatial map, the distribution of ground station points and their respective linearly interpolated grids are plotted to understand the precipitation variation across the grids. The red dots represent the locations of ground stations from which precipitation data were collected for the period 2003–2014. The black stars indicate the linearly interpolated 0.1° grids. For the evaluation, only grids surrounded by at least one rain gauge were considered.
3.3.2 District scale
On a district scale, similar results were observed for Coimbatore, Madurai, and Tiruchirappalli. In contrast to the grid-scale performance, at the Tuticorin district scale, TRMM and ERA5-Land recorded the highest CC, while PERSIANN CDR was found to have the lowest RMSE (Tables 5 and S4).
Comparing all the statistical metrics, ERA5-Land, followed by MSWEP, is the best precipitation product in Coimbatore, Madurai, and Tiruchirappalli. ERA5-Land is attributed as the best-performing product because of its higher CC combined with lower RMSE. In a similar study on the Godavari River basin, which covers the neighbouring states, Reddy and Saravanan (2023) found that MSWEP performed better than other products during the monsoon and pre-monsoon seasons. ERA5-Land performs better than the other products as it was developed based on a replay of the land components with the H-TESSEL model. ERA5-Land is the land portion of ERA5 reanalysis data, which provides more accurate land parameters and better characterises land status with its advanced 0.1° resolution (Muñoz-Sabater et al., 2021). Further, PERSIANN CDR had lower MAE and RMSE in the three regions but substantially lower CC and IA. When the remaining precipitation products – GPM and TRMM – are considered, it is shown that GPM has a stronger correlation with less error than TRMM. GPM-IMERG has high-frequency channels contributed by GMI (the GPM microwave imager), namely 166 and 183 GHz. Thus, GPM-IMERG provides significantly improved spatial resolution in covering moderate to heavy precipitation compared to TRMM (Beria et al., 2017; Shen et al., 2022). In accordance with our findings, Venkadesh et al. (2021) also reported that GPM, TRMM, and PERSIANN CDR produced a higher monthly correlation coefficient in comparison with the station data in Tamil Nadu. The study also reported that PERSIANN CDR produced the lowest RMSE in December. Of all the precipitation products examined in this study, only CMORPH exhibited good performance in Coimbatore during the monsoon season.
The precipitation product's performance in Tuticorin differed from that in the other research regions since it is a low-lying area with less precipitation (Tables 1 and 2). MSWEP performed the best in Tuticorin, followed by PERSIANN CDR. The MSWEP product consistently exhibited good performance for daily rainfall over the Indian subcontinent, as shown by a similar analysis conducted by Nair and Indu (2017). This indicates that the product performed best even without station-data-based bias correction (Table 2). MSWEP takes advantage of the complementary strengths of gauge-, satellite-, and reanalysis-based data to provide reliable precipitation estimates. Further, using cumulative distribution functions and precipitation frequency corrections in the present version overcomes the previous limitations.
In all four study locations, MERRA2 and NCEP2 had the highest MAE and RMSE. They performed the worst by overestimating precipitation in all studied regions, regardless of the spatial and temporal scale of evaluation. This could result from the original product's coarser spatial resolution compared to that of other products (Table 2). Similar overestimations were also reported by Gupta et al. (2024) during the summer month precipitation in Tamil Nadu and Andhra Pradesh.
The performance of precipitation products in representing extreme-precipitation events varied from their overall performance. In all study regions except Tiruchirappalli, ERA5-Land underestimated the intensity of extreme rainfall. It struggles to detect precipitation intensity of more than 1 mm h−1 in Coimbatore and more than 5 mm h−1 in Madurai, as observed in Fig. 2. This underestimation might be due to the inability of the product to capture lightning-associated heavy rainfall, which was reported in ERA5 by Kumar et al. (2024). Overall, MSWEP provided the most accurate estimates that were closest to the station data in most study regions. The study by Yaswanth et al. (2023) also pointed out that satellite-based precipitation products had a negative bias in capturing peak discharge, particularly in the Adyar River basin of Tamil Nadu. Furthermore, GPM-IMERG, which closely captured station data in Madurai, was observed by Singh et al. (2018) to produce accurate estimates of heavy rainfall at the grid level in peninsular India during the 2015 winter monsoon.
The monsoon month precipitation in all locations except Coimbatore was notably underestimated by the precipitation products. Table 2 indicates that most algorithms used by the products combine high-temporal-frequency visible/infrared (V/IR) estimations with high-spatial-resolution passive microwave (MW) estimations. To address sampling issues caused by low orbits of current microwave sensors, passive microwave observations and infrared geostationary measurements are integrated. The continuous measurement provided by the infrared images effectively tracks system evolution, while the microwave rain retrieval serves as a reference (Sorooshian et al., 2002; Tapiador et al., 2004). The study areas, located in tropical zones, are prone to convection-driven precipitation. In these regions, convection events can result in rain rates exceeding 50 mm h−1, lasting anywhere from less than 30 min to up to 6 h (Prigent, 2010). Despite the V/IR–MW integration being designed to capture light rainfall, it still leads to significant underestimations of precipitation in these areas. Coimbatore, however, being at a relatively higher altitude, is also subject to orographic precipitation (Table 1 and Fig. 1), leading to comparatively better performance of the precipitation products.
Moreover, based on the annual spatial plots, it is evident that the precipitation products could not accurately represent the spatial variability and generally underestimated the amount of precipitation. This aligns with similar observations in eastern China, where satellite-based precipitation products also underestimated precipitation and failed to capture the variability in the complex terrain and rainy areas of the south (Shaowei et al., 2022).
This study offers essential input for agro-hydrological modelling in the study region, addressing gaps left by previous research. Beyond the standard statistical metrics, the study incorporates additional criteria for evaluating precipitation products. In the context of climate change and the associated rise in flood occurrences, intensity–duration–frequency (IDF) analysis is essential for selecting appropriate products for flood modelling. Frequency plot analysis was performed to assess the differential capabilities of various products in capturing both low- and high-intensity precipitation on a daily scale. Comparing the mean monthly values for monsoon and non-monsoon seasons will aid future studies in selecting the most suitable precipitation product for each season. Additionally, district-scale spatial plots on a yearly scale provide insights into the variability in precipitation across different parts of the districts, as recorded by ground station data, and evaluate the products' accuracy in capturing this variability.
In addition to directly integrating precipitation products for agro-hydrological modelling, many studies also make use of pre-compiled datasets. For example, in regions with limited ground stations, numerous agrometeorological studies rely on NASA POWER for hydrometeorological modelling, yield predictions, and other analyses. As NASA POWER is based on MERRA2 datasets, it is important to note that using it without bias correction can lead to significant errors, as the product tends to overestimate, as evident from the analysis of the study. Therefore, the findings of this study can help in selecting appropriate precipitation products and pre-compiled precipitation datasets, identifying biases at different timescales, and choosing the right bias correction methods. The main limitations of this study include the lack of access to station-based precipitation datasets after 2014 and the unavailability of hourly precipitation datasets for sub-daily analysis. Future studies could also examine the impact of different bias correction methods on enhancing the performance of various precipitation products.
In this study, the performance of multiple satellite-based (CMORPH, GPM-IMERG, MSWEP, PERSIANN CDR, and TRMM) and reanalysis-based (ERA5-Land, MERRA2, and NCEP2) precipitation products was statistically evaluated against station data for the period 2003–2014. The evaluations were conducted at two spatial (grid and district) and three temporal (daily, monthly, and yearly) scales. In addition to the statistical analysis, the frequency of extreme-precipitation events on a daily scale, monsoon and non-monsoon season precipitation variability on a monthly scale, and spatial precipitation variability on a yearly scale were also analysed. ERA5-Land performed the best in Coimbatore, Madurai, and Tiruchirappalli, whereas MSWEP performed well at Tuticorin. The accuracy of precipitation products was better at monthly and yearly scales as compared to the daily scale. Further, the increase in the spatial scale from grid to district did not strongly affect the performance of precipitation products. The ability of precipitation products to capture extreme-rainfall intensity is different from that of the statistical metrics. ERA5-Land underestimated the extreme-rainfall intensity in all the study regions except Tiruchirappalli. MSWEP captured the closest rainfall intensity in Coimbatore and Madurai, PERSIANN CDR in Tiruchirappalli, and ERA5-Land in Tuticorin. Most products underestimated the mean monthly precipitation in both monsoon and non-monsoon months. Additionally, the %MAE was higher in non-monsoon months, indicating that these product-based projections for water-scarce periods may be less reliable. The present precipitation algorithm is unable to capture convective-based low-precipitation events in the study regions (Madurai, Tiruchirappalli, and Tuticorin), leading to underestimation. Hence, algorithm improvisation or prior bias corrections are needed before considering the evaluated products for future modelling studies.
The evaluation's findings can assist in selecting a precipitation product for non-gauged areas in agro-hydrological modelling. The study results can be useful for districts falling within the same agroclimatic regions. The state of Tamil Nadu is divided into seven agroclimatic zones. The present study includes three important agricultural zones. The study results can be transferred to areas in similar agroclimatic zones. This includes other districts within the same agroclimatic zones in Tamil Nadu, for which less ground station data are available. The findings of this study are designed to support field-level experimentation and also provide a proof of concept for modellers developing climate data products, with the potential for extrapolation to other regions with similar agroclimatic conditions. Additional accuracy and the selection of a better product for future analysis can be obtained from the event-level assessment of extreme-precipitation events, monsoon precipitation, and non-monsoon precipitation. Precipitation is the major source of soil moisture, which in turn drives food production. Accurately identifying precipitation is one of the underlying the nexus between food production (agriculture), water management, and soil management. Hence, this study has significant implications for managing the nexus between food production and water and soil management in agricultural regions.
In this study, publicly available daily precipitation data are retrieved from multiple climate data sources, as provided below. Satellite-based precipitation products used in this study are CMORPH (National Centre for Environmental Information, 2023), GPM-IMERG (National Aeronautics and Space Administration, 2024), TRMM (National Aeronautics and Space Administration, 2023), PERSIANN CDR (CHRS Data Portal, 2024), MSWEP (GloH2O, 2023), ERA5-Land (Climate Data Store, 2023), MERRA2 (Global Modeling and Assimilation Office library, 2023), and NCEP2 (NOAA Physical Science Laboratory, 2024).
The supplement related to this article is available online at https://doi.org/10.5194/hess-29-4847-2025-supplement.
AS, DK, and NiS designed the research. AS performed the data analysis and prepared the paper with substantial contributions from DK, NiS, and SR.
The contact author has declared that none of the authors has any competing interests.
Publisher's note: Copernicus Publications remains neutral with regard to jurisdictional claims made in the text, published maps, institutional affiliations, or any other geographical representation in this paper. While Copernicus Publications makes every effort to include appropriate place names, the final responsibility lies with the authors.
The authors would like to thank the Tamil Nadu Public Works Department (PWD) for providing ground station precipitation data. We express our deepest gratitude to Deutscher Akademischer Austauschdienst (DAAD) for awarding the doctoral scholarship. We also acknowledge funding by the Open Access Publishing Fund of the Technische Universität Dresden. We thank the three anonymous reviewers and the handling editor for thorough and helpful feedback.
This research has been supported by the Deutscher Akademischer Austauschdienst (grant-no. 91860251).
This paper was edited by Marnik Vanclooster and reviewed by three anonymous referees.
Adler, R. F., Huffman, G. J., Chang, A., Ferraro, R., Xie, P. P., Janowiak, J., Rudolf, B., Schneider, U., Curtis, S., Bolvin, D., Gruber, A., Susskind, J., Arkin, P., and Nelkin, E.: The version-2 global precipitation climatology project (GPCP) monthly precipitation analysis (1979–present), J. Hydrometeorol., 4, 1147–1167, 2003.
Arjune, S. and Kumar, V. S.: Precision Agriculture: Influencing factors and challenges faced by farmers in delta districts of Tamil Nadu, in: 2022 OPJU International Technology Conference on Emerging Technologies for Sustainable Development (OTCON), 1–6, IEEE, Raigarh, Chhattisgarh, India, 8–10 February 2023, https://doi.org/10.1109/OTCON56053.2023.10113906, 2023.
Arumugam, S., Ashok, K. R., Kulshreshtha, S. N., Vellangany, I., and Govindasamy, R.: Yield variability in rainfed crops as influenced by climate variables: A micro level investigation into agro-climatic zones of Tamil Nadu, India, Int. J. Clim. Chang. Str., 7, 442–459, 2013.
Ashouri, H., Hsu, K. L., Sorooshian, S., Braithwaite, D. K., Knapp, K. R., Cecil, L. D., Nelson, B. R., and Prat, O. P.: PERSIANN-CDR Daily Precipitation Climate Data Record from Multisatellite Observations for Hydrological and Climate Studies, B. Am. Meteorol. Soc., 96 , 69–71, 2015.
Balaganesh, G., Malhotra, R., Sendhil, R., Sirohi, S., Maiti, S., Ponnusamy, K., and Sharma, A. K.: Development of composite vulnerability index and district level mapping of climate change induced drought in Tamil Nadu, India, Ecol. Indic., 113, 106197, https://doi.org/10.1016/j.ecolind.2020.106197, 2020.
Beck, H. E., van Dijk, A. I. J. M., Levizzani, V., Schellekens, J., Miralles, D. G., Martens, B., and de Roo, A.: MSWEP: 3 hourly 0.25° global gridded precipitation (1979–2015) by merging gauge, satellite, and reanalysis data, Hydrol. Earth Syst. Sci., 21, 589–615, https://doi.org/10.5194/hess-21-589-2017, 2017.
Beria, H., Nanda, T., Singh Bisht, D., and Chatterjee, C.: Does the GPM mission improve the systematic error component in satellite rainfall estimates over TRMM? An evaluation at a pan-India scale, Hydrol. Earth Syst. Sci., 21, 6117–6134, https://doi.org/10.5194/hess-21-6117-2017, 2017.
Bosilovich, M. G., Lucchesi, R., and Suarez, M.: MERRA-2: File specification, GMAO Office Note No. 9 (Version 1.0), Microsoft Word – GMAO-OfficeNote-09-V1-M2FileSpec-Final.docx, 2015.
Bosilovich, M. G., Lucchesi, R., and Suarez, M.: MERRA-2: File specification, NASA GMAO Office Note 9 (version 1.1), 75 pp., https://gmao.gsfc.nasa.gov/pubs/docs/Bosilovich785.pdf (last access: 10 January 2024), 2016.
Chandrasekar, K., Sesha Sai, M. V., Roy, P. S., Jayaraman, V., and Krishnamoorthy, R.: Identification of Agricultural Drought Vulnerable Areas of Tamil Nadu, India using GIS-based Multi-Criteria Analysis, Asian Journal of Environment and Disaster Management, 1, 40–61, 2009.
CHRS Data Portal: https://www.ncei.noaa.gov/data/precipitation-persiann/access/, last access: 10 December 2024.
Climate Data Store: https://cds.climate.copernicus.eu/datasets/derived-era5-land-daily-statistics, last access: 18 December 2023.
Compo, G. P., Whitaker, J. S., Sardeshmukh, P. D., Matsui, N., Allan, R. J., Yin, X., Gleason, B. E., Vose, R. S., Rutledge, G., Bessemoulin, P., Bronnimann, S., Brunet, M., Crouthamel. R. I., Grant, A. N., Groisman, P. Y., Jones, P. D., Kruk, M. C., Kruger, A. C., Marshall, G. J., Maugeri, M., Mok. H. Y., Nordli, O., Ross, T. F., Trigo, R. M., Wang, X. L., Woodruff, S. D., and Worley, S. J.: The Twentieth Century Reanalysis Project, Q. J. Roy. Meteor. Soc., 137, 1–28, 2011.
Dhar, O. N., Rakhecha, P. R., and Mandal, B. N.: Some facts about Indian rainfall – A brief appraisal from hydrological considerations, Indian. J. Power River Val. Dev., 31, 117–125, 1981.
Duan, Z., Liu, J., Tuo, Y., Chiogna, G., and Disse, M.: Evaluation of eight high spatial resolution gridded precipitation products in Adige Basin (Italy) at multiple temporal and spatial scales, Sci. Total Environ., 573, 1536–1553, https://doi.org/10.1016/j.scitotenv.2016.08.213, 2016.
Dubey, S., Gupta, H., Goyal, M. K., and Joshi, N.: Evaluation of precipitation datasets available on Google earth engine over India, Int. J. Climatol., 41, 4844–4863, 2021.
Ebita, A., Kobayashi, S., Ota, Y., Moriya, M., Kumabe, R., Onogi, K., Harada, Y., Yasui, S., Miyaoka, K., Takahashi, K., Kamahori, H., Kobayashi, C., Endo, H., Soma, M., Oikawa, Y., and Ishimizu, T.: The Japanese 55 year reanalysis “JRA-55”: an interim report, Sola, 7, 149–152, 2011.
Gardas, B. B., Raut, R. D., and Narkhede, B.: Evaluating critical causal factors for post harvest losses (PHL) in the fruit and vegetables supply chain in India using the DEMATEL approach, J. Clean. Prod., 199, 47–61, 2018.
Gebrechorkos, S. H., Hülsmann, S., and Bernhofer, C.: Evaluation of multiple climate data sources for managing environmental resources in East Africa, Hydrol. Earth Syst. Sci., 22, 4547–4564, https://doi.org/10.5194/hess-22-4547-2018, 2018.
Gelaro, R., McCarty, W., Suárez, M. J., Todling, R., Molod, A., Takacs, L., Randles, C. A., Darmenov, A., Bosilovich, M., Reichle, R., Wargan, K., Coy, L., Cullather, R., Draper, C., Akella, S., Buchard, V., Conaty, A., da Silva, A., Gu, W., Kim, G.-K., Koster, R., Lucchesi, R., Merkova, D., Nielsen, J. E., Partyka, G., Pawson, S., Putman, W., Rienecker, M., Schubert, S. D., Sienkiewicz, M., and Zhao, B.: The modern-era retrospective analysis for research and applications, version 2 (MERRA-2), J. Climate, 14, 5419–5454, https://doi.org/10.1175/JCLI-D-16-0758.1, 2017.
Government of Tamil Nadu: Statistical Handbook 2020–2021: Sub chapter: Rainfall, Department of Economics and Statistics of the Tamil Nadu Planning, Development and Special Initiatives Department, https://www.tn.gov.in/deptst/climateandrainfall.pdf (last access: 23 March 2024), 2022a.
Government of Tamil Nadu: Statistical Handbook 2020–2021: Sub chapter: Irrigation, Department of Economics and Statistics of the Tamil Nadu Planning, Development and Special Initiatives Department, https://www.tn.gov.in/deptst/irrigation.pdf (last access: 23 March 2024), 2022b.
Global Modeling and Assimilation Office library: https://disc.gsfc.nasa.gov/datasets?page=1&subject=Precipitation&source=Models%20MERRA-2&project=MERRA-2&temporalResolution=1%20day&spatialResolution=0.5%20%C2%B0%20x%200.625%20%C2%B0, last access: 22 December 2023.
GloH2O: https://www.gloh2o.org/mswep/, last access: 19 December 2023.
Gupta, A., Jain, M. K., Pandey, R. P., Gupta, V., and Saha, A.: Evaluation of global precipitation products for meteorological drought assessment with respect to IMD station datasets over India, Atmos. Res., 297, 107104, https://doi.org/10.1016/j.atmosres.2023.107104, 2024.
Hou, A. Y., Kakar, R. K., Neeck, S., Azarbarzin, A. A., Kummerow, C. D., Kojima, M., Oki, R., Nakamura, K., and Iguchi, T.,: The Global Precipitation Measurement Mission, B. Am. Meteorol. Soc., 95, 701–722, 2014.
Huffman, G. J. and Pendergrass, A.: The Climate Data Guide: TRMM: Tropical Rainfall Measuring Mission, edited by: National Center for Atmospheric Research Staff, https://climatedataguide.ucar.edu/climate-data/trmm-tropical-rainfall-measuring-mission (last access: 1 January 2024), 2023.
Huffman, G. J., Adler, R. F., Bolvin, D. T., Gu, G., Nelkin, E. J., Bowman, K. P., Hong, Y., Stocker, E. F., and Wolff, D. B.: The TRMM Multisatellite Precipitation Analysis (TMPA): Quasi-Global, Multiyear, Combined-Sensor Precipitation Estimates at Fine Scales, J. Hydrometeorol., 8, 38–55, 2007.
Huffman, G. J., Adler, R. F., Bolvin, D. T., and Gu, G.: Improving the global precipitation record: GPCP Version 2.1, Geophys. Res. Lett., 36, L17808, https://doi.org/10.1029/2009GL040000, 2009.
IPCC: Summary for Policymakers, in: Climate Change 2023: Synthesis Report. Contribution of Working Groups I, II and III to the Sixth Assessment Report of the Intergovernmental Panel on Climate Change, edited by: Core Writing Team, Lee, H., and Romero, J., IPCC, Geneva, Switzerland, 1–34, https://doi.org/10.59327/IPCC/AR6-9789291691647, 2023.
Joyce, R. J., Janowiak, J. E., Arkin, P. A., and Xie, P.: CMORPH: A method that produces global precipitation estimates from passive microwave and infrared data at high spatial and temporal resolution, J. Hydrometeorol., 5, 487–503, 2004.
Kalnay, E., Kanamitsu, M., Kistler, R., Collins, W., Deaven, D., Gandin, L., Iredell, M., Saha, S., White, G., and Woollen, J.: The NCEP/NCAR 40 year reanalysis project, in: Renewable energy, edited by: Sorenson, B., Routledge, Vol1_146-Vol1_194, https://doi.org/10.1175/1520-0477(1996)077%3C0437:TNYRP%3E2.0.CO;2, 2018.
Kanamitsu, M., Ebisuzaki, W., Woollen, J., Yang, S.-K., Hnilo, J. J., Fiorino, M., and Potter, G. L.: NCEP–DOE AMIP–II Reanalysis (R-2), B. Am. Meteorol. Soc., 83, 1631–1644, 2002.
Kolluru, V., Kolluru, S., and Konkathi, P: Evaluation and integration of reanalysis rainfall products under contrasting climatic conditions in India, Atmos. Res., 246, 105121, https://doi.org/10.1016/j.atmosres.2020.105121, 2020.
Kucera, P. A., Ebert, E. E., Turk, F. J., Levizzani, V., Kirschbaum. D., Tapiador. F. J., Loew. A., and Borsche, M.: Precipitation from space: advancing Earth system science, B. Am. Meteorol. Soc., 94, 365–375, https://doi.org/10.1175/BAMS-D-11-00171.1, 2013.
Kumar, P., Srivastava, S. S., Jivani, N., Varma, A. K., Yokoyama, C., and Kubota, T.: Long-term assessment of ERA5 reanalysis rainfall for lightning events over India observed by Tropical Rainfall Measurement Mission Lightning Imaging Sensor, Q. J. Roy. Meteor. Soc., 150, 2472–2488, 2024.
Lakshmi, S., Nivethaa, E. A. K., Ahamed Ibrahim, S. N., Ramachandran, A., and Palanivelu, K.: Prediction of Future Extremes during Northeast monsoon in the Coastal District of Tamil Nadu state in India based on ENSO, Pure Appl. Geophys., 178, 3207–3228, 2021.
Lal, M.: Global Climate Change – India's Monsoon and its variability, Journal of Environmental Studies and Policy, 6, 1–34, 2003.
Lalmuanzuala, B., Sathyamoorthy, N., Kokilavani, S., Jagadeeswaran, R., and Kannan, B.: Drought analysis in southern region of Tamil Nadu using meteorological and remote sensing indices, MAUSAM, 74, 973–988, 2023.
Legates, D. R. and McCabe, G. J.: Evaluating the use of “goodness-of-fit” Measures in hydrologic and hydroclimatic model validation, Water Resour. Res., 35, 233–241, https://doi.org/10.1029/1998WR900018, 1999.
Liu, J., Duan, Z., Jiang, J., and Zhu, A. X.: Evaluation of three satellite precipitation products TRMM 3B42, CMORPH, and PERSIANN over a subtropical watershed in China, Adv. Meteorol., 151239, https://doi.org/10.1155/2015/151239, 2015.
Malaiarasan, U., Paramasivam, R., and Felix, K. T.: Crop diversification: determinants and effects under paddy-dominated cropping system, Paddy Water Environ., 19, 417–432, 2021.
McDonald, M. G. and Harbaugh, A. W.: A modular three-dimensional finite-difference ground-water flow model, U. S. Geological Survey Open-File Report, 83–875, 528 p., https://doi.org/10.3133/twri06A1, 1984.
Muñoz-Sabater, J., Dutra, E., Agustí-Panareda, A., Albergel, C., Arduini, G., Balsamo, G., Boussetta, S., Choulga, M., Harrigan, S., Hersbach, H., Martens, B., Miralles, D. G., Piles, M., Rodríguez-Fernández, N. J., Zsoter, E., Buontempo, C., and Thépaut, J.-N.: ERA5-Land: a state-of-the-art global reanalysis dataset for land applications, Earth Syst. Sci. Data, 13, 4349–4383, https://doi.org/10.5194/essd-13-4349-2021, 2021.
Nair, A. S. and Indu, J.: Performance assessment of multi-source weighted-ensemble precipitation (MSWEP) product over India, Climate, 5, 2, https://doi.org/10.3390/cli5010002, 2017.
National Aeronautics and Space Administration: https://disc.gsfc.nasa.gov/datasets?keywords=TRMM_3B42_Daily_7&page=1, last access: 15 December 2023.
National Aeronautics and Space Administration: https://disc.gsfc.nasa.gov/datasets/GPM_3IMERGDF_07/summary?keywords=%22IMERG%20final%22, last access: 5 January 2024.
National Centre for Environmental Information: https://www.ncei.noaa.gov/data/cmorph-high-resolution-global-precipitation-estimates/access/daily/0.25deg/, last access: 20 December 2023.
Neitsch, S. L., Arnold, J. G., and Srinivasan, R.: Pesticides fate and transport predicted by the soil and water assessment tool (SWAT). Atrazine, Metolachlor and Trifluralin in the Sugar Creek Watershed: BRC Report, 3, https://swat.tamu.edu/media/1335/sugarcreekin.pdf (last access: 10 February 2023), 2002.
Nikulin, G., Jones, C., Giorgi, F., Asrar, G., Buechner, M., Cerezo-Mota, R., Christensen, O. B., Deque, M., Fernandez, J., Haensler, A., van Meijgaard, E., Samuelsson, P., Sylla, M. B., and Sushama, L.: Precipitation Climatology in an Ensemble of CORDEX-Africa Regional Climate Simulations, J. Climate, 25, 6057–6078, https://doi.org/10.1175/JCLI-D-11-00375.1, 2012.
NOAA Physical Science Laboratory: https://www.psl.noaa.gov/data/gridded/data.ncep.reanalysis2.html, NCEP/DOE Reanalysis II: NOAA Physical Sciences Laboratory NCEP/DOE Reanalysis II, last access: 1 December 2024.
Paramasivam, P.: Hundreds stranded as parts of India's Tamil Nadu flooded after heavy rain, Reuters, 2023.
Prigent, C.: Precipitation retrieval from space: An overview, CR Geoscience, 342, 380–389, 2010.
Radhakrishnan, S., Duraisamy Rajasekaran, S. K., Sujatha, E. R., and Neelakantan, T. R.: A Comparative Study on 2015 and 2023 Chennai Flooding: A Multifactorial Perspective, Water, 16, 2477, https://doi.org/10.3390/w16172477, 2024.
Rajkumar, R., Kumaran, M. M., Prasath, M. R. K., and Senthilshanmugavelayuthm, S. P.: Agro-Climatic Zonation for Tamil Nadu Using GIS and AHP Techniques, IOP Conf. Ser.-Mat. Sci., 1006, 012015, https://doi.org/10.1088/1757-899X/1006/1/012015, 2020.
Reddy, N. M. and Saravanan, S.: Evaluation of the accuracy of seven gridded satellite precipitation products over the Godavari River basin, India, Int. J. Environ. Sci. Te., 20, 10179–10204, https://doi.org/10.1007/s13762-022-04524-x, 2023.
Reichle, R. H., Draper, C. S., Liu, Q., Girotto, M., Mahanama, S. P., Koster, R. D., and De Lannoy, G. J.: Assessment of MERRA-2 land surface hydrology estimates, J. Climate, 30, 2937–2960, 2017.
Renard, K. G., Foster, G. R., and Weesies, G. A.: Predicting soil erosion by water: a guide to conservation planning with the Revised Universal Soil Loss Equatio (RUSLE), USDA agricultural handbook No. 703, US Department of Agriculture, Agriculture Handbook No.703USDA, USDA, Washington DC, 404 pp., ISBN 0-16-048938-5 , 1997.
Saha, S., Moorthi, S., Pan, H. L., Wu, X., Wang, J., Nadiga, S., Tripp, P., Kistler, R., Woollen, J., Behringer, D., and Liu, H.: The NCEP climate forecast system reanalysis, B. Am. Meteorol. Soc., 91, 1015–1057, https://doi.org/10.1175/2010BAMS3001.1, 2010.
Sahoo, A. K., Sheffield, J., Pan, M., and Wood, E. F.: Evaluation of the tropical rainfall measuring mission multi-satellite precipitation analysis (TMPA) for assessment of large-scale meteorological drought, Remote Sens. Environ., 159, 181–193, 2015.
Sapiano, M. R. P. and Arkin, P. A.: An Intercomparison and Validation of High-Resolution Satellite Precipitation Estimates with 3-Hourly Gauge Data, J. Hydrometeorol., 10, 149–166, https://doi.org/10.1175/2008JHM1052.1, 2009.
Shaowei, N., Jie, W., Juliang, J., Xiaoyan, X., Yuliang, Z., Fan, S., and Linlin, Z.: Comprehensive evaluation of satellite-derived precipitation products considering spatial distribution differences of daily precipitation over eastern China, J. Hydrol.: Regional Studies, 44, 101242, https://doi.org/10.1016/j.ejrh.2022.101242, 2022.
Shen, Z., Yong, B., Yi, L., Wu, H., and Xu, H.: From TRMM to GPM, how do improvements of post/near-real-time satellite precipitation estimates manifest?, Atmos. Res., 268, 106029, https://doi.org/10.1016/j.atmosres.2022.106029, 2022.
Shukla, A. K., Ojha, C. S. P., Singh, R. P., Pal, L., and Fu, D.: Evaluation of TRMM precipitation dataset over Himalayan Catchment: the upper Ganga Basin, India, Water (Switzerland), 11, 613, 1–25, https://doi.org/10.3390/w11030613, 2019.
Singh, A. K., Singh, V., Singh, K. K., Tripathi, J. N., Kumar, A., Soni, A. K., Sateesh, M., and Khadke, C.: A case study: Heavy rainfall event comparison between daily satellite rainfall estimation products with IMD gridded rainfall over peninsular India during 2015 winter monsoon, J. Indian Soc. Remote, 46, 927–935, 2018.
Singh, A. K., Tripathi, J. N., Singh, K. K., Singh, V., and Sateesh, M.: Comparison of different satellite-derived rainfall products with IMD gridded data over Indian meteorological subdivisions during Indian Summer Monsoon (ISM) 2016 at weekly temporal resolution, J. Hydrol., 575, 1371–1379, 2019.
Smith, E. A., Asrar, G., Furuhama, Y., Ginati, A., Mugnai, A., Nakamura, K., Adler, R. F., Chou, M.-D., Desbois, M., and Durning, J. F.: International global precipitation measurement (GPM) program and mission: An overview, Measuring 920 precipitation from space: EURAINSAT and the future, 611–653, 2007.
Sorooshian, S., Hsu, K., Gao, X., Gupta, H. V., Imam, B., and Braithwaite, D.: Evaluation of PERSIANN system satellite-based estimates of tropical rainfall, B. Am. Meteorol. Soc., 81, 2035–2046, https://doi.org/10.1175/1520-0477(2000)081<2035:EOPSSE>2.3.CO;2, 2000.
Sorooshian, S., Gao, X., Hsu, K., Maddox, R. A., Hong, Y., Gupta, H. V., and Imam, B.: Diurnal variability of tropical rainfall retrieved from combined GOES and TRMM satellite information, J. Climate, 15, 983–1001, 2002.
Surendran, U., Raja, P., Jayakumar, M., and Subramoniam, S. R.: Use of efficient water saving techniques for production of rice in India under climate change scenario: A critical review, J. Clean. Prod., 309, 127272, https://doi.org/10.1016/j.jclepro.2021.127272, 2021.
Sylla, M. B., Giorgi, F., Coppola, E., and Mariotti, L.: Uncertainties in daily rainfall over Africa: assessment of gridded observation products and evaluation of a regional climate model simulation, Int. J. Climatol., 33, 1805–1817, https://doi.org/10.1002/joc.3551, 2013.
Tapiador, F. J., Kidd, C., Levizzani, V., and Marzano, F. S.: A neural networks-based fusion technique to estimate half-hourly rainfall estimates at 0.18 resolution from satellite passive microwave and infrared data, J. Appl. Meteorol., 43, 576–594, 2004.
Tapiador, F. J., Turk, F. J., Petersen, W., Hou, A. Y., Garcia-Ortega, E., and Machado, L. A. T.: Global precipitation measurement: methods, datasets and applications, Atmos. Res., 104, 70–97, 2012.
Taylor, K. E.: Summarizing multiple aspects of model performance in a single diagram, J. Geophys. Res.-Atmos., 106, 7183–7192, https://doi.org/10.1029/2000JD900719, 2001.
TN-ENVIS: Tamil Nadu – Status of Environment and Related Issues, http://tnenvis.nic.in/Database/TN-ENVIS_791.aspx (last access: 5 May 2024), 2023.
Ushio, T., Sasashige, K., Kubota, T., Shige, S., Okamoto, K., Aonashi, K., Inoue, T., Takahashi, N., Iguchi, T., and Kachi, M.: A Kalman filter approach to the Global Satellite Mapping of Precipitation (GSMaP) from combined passive microwave and infrared radiometric data, J. Meteor. Soc. Japan, 87, 137–151, 2009.
Varadan, R. J., Kumar, P., Jha, G. K., Pal, S., and Singh, R.: An exploratory study on occurrence and impact of climate change on agriculture in Tamil Nadu, India., Theor. Appl. Climatol., 127, 993–1010, 2017.
Venkadesh, S., Pazhanivelan, S., and Mrunalini, K.: Performance of satellite-based precipitation products using dense network of rain-gauge observations in Tamil Nadu, SKUAST Journal of Research, 23, 53–59, 2021.
Wilby, R. L. and Yu, D.: Rainfall and temperature estimation for a data sparse region, Hydrol. Earth Syst. Sci., 17, 3937–3955, https://doi.org/10.5194/hess-17-3937-2013, 2013.
Willmott, C. J.: On the Validation of Models, Phys. Geogr., 2, 184–194, 1981.
Wu, W.-S., Purser, R. J., and Parrish, D. F.: Three-dimensional variational analysis with spatially inhomogeneous co-variances, Mon. Weather Rev., 130, 2905–2916, https://doi.org/10.1175/1520-0493(2002)130<2905:TDVAWS>2.0.CO;2, 2002.
Xie, P., Janowiak, J. E., Arkin, P. A., Adler, R., Gruber, A., Ferraro, R., Huffman, G. J., and Curtis, S.: GPCP pentad precipitation analyses: An experimental dataset based on gauge observations and satellite estimates, J. Climate, 16, 2197–2214, 2003.
Xie, P., Arkin, P. A., and Janowiak, J. E.: CMAP: The CPC Merged Analysis of Precipitation. In: Levizzani, V., Bauer, P., and Turk, F. J. (eds.): Measuring Precipitation From Space, in: Advances in Global Change Research, vol. 28. Springer, Dordrecht, https://doi.org/10.1007/978-1-4020-5835-6_25, 2007.
Yaswanth, P., Kannan, B. A. M., Bindhu, V. M., Balaji, C., and Narasimhan, B.: Evaluation of Remote Sensing Rainfall Products, Bias Correction and Temporal Disaggregation Approaches, for Improved Accuracy in Hydrologic Simulations, Water Resour. Manag., 37, 3069–3092, https://doi.org/10.1007/s11269-023-03486-0, 2023.
Zambrano-Bigiarini, M., Nauditt, A., Birkel, C., Verbist, K., and Ribbe, L.: Temporal and spatial evaluation of satellite-based rainfall estimates across the complex topographical and climatic gradients of Chile, Hydrol. Earth Syst. Sci., 21, 1295–1320, https://doi.org/10.5194/hess-21-1295-2017, 2017.