the Creative Commons Attribution 4.0 License.
the Creative Commons Attribution 4.0 License.
 | 12 Sep 2025
Technical note: Operational calibration and performance improvement for a 1D hydrodynamic model in a data-scarce coastal area
Francisco Rodrigues do Amaral
Benoît Camenen
Tin Nguyen Trung
Tran Anh Tu
Thierry Pellarin
Nicolas Gratiot
In this study, we address the challenges posed by data scarcity in hydrodynamic modeling in one of the most vulnerable coastal zones in the world – the Saigon–Dongnai tidal river system in southern Vietnam. We investigate calibration strategies for a 1D hydrodynamic model using minimal in situ data obtained from an existing local monitoring program, which provides 48 h of measurements per month. Calibration using both directly measured water levels and discharge data derived from vertical velocity profiles yields the most accurate discharge estimates, with relative root mean square errors (rRMSEs) ranging from −75 % to −78 % in the Saigon River and from 23 % to 29 % in the Dongnai River, depending on tidal asymmetry. To further improve discharge estimation from the 1D model, we explore the coupling of a modified Manning–Strickler (MS) equation. Calibration results reveal distinct spatial variations in friction coefficients along the river system, highlighting the importance of localized adjustments. Incorporating this calibration technique significantly enhances model performance, reducing the discharge rRMSEs by 27 % to 44 % in the Saigon River and by 11 % to 29 % in the Dongnai River, depending on tidal asymmetry. The study underscores the complexities of calibrating hydrodynamic models in data-scarce regions, with recommendations for future modeling endeavors including incorporating more accurate upstream boundary conditions. The long time series of estimated water level and discharge provided by this study have practical implications for water resource management and decision-making in data-scarce estuarine systems and are provided open-access for operational use.
- Article
(3991 KB) - Full-text XML
- BibTeX
- EndNote


Tidal rivers represent intricate systems bridging continental surfaces and the ocean, where water levels and river discharge are profoundly affected by tidal movements. Consequently, the interplay between flooding and tidal constraints on water levels becomes pivotal, particularly in the context of flood protection, pollution management, and climate change adaptation characteristic of these areas. The complex back-and-forth advection coupled with dispersion makes it challenging to predict the propagation of sediment particles or pollutants in such environments.
The Saigon and Dongnai rivers in Vietnam serve as a notable case of a tidal river system characterized by a flat watershed and, for the Saigon branch, the marginal significance of its net flow compared to tidal influence (Camenen et al., 2021). This river system flows through Ho Chi Minh City (HCMC), one of the most vulnerable megacities globally in terms of climate change impacts (Lossouarn et al., 2016). Research has shown the critical need to understand its hydrodynamics for assessing flood risks (Vachaud et al., 2019), managing saline intrusion (Ngo et al., 2015; Nguyen et al., 2018), and mitigating pollution (Babut et al., 2019; van Emmerik et al., 2019) and eutrophication (Nguyen et al., 2022).
The limited availability of data for evaluating flow and tidal variations in this region negatively impacts the management of these rivers and their source reservoirs. In April 2024, an intense drought swept through southern Vietnam, with temperatures soaring to nearly 40 °C, as reported by several news outlets (Orie, 2024; FranceInfo, 2024). This heat wave significantly impacted irrigation activities and fish populations in the Dongnai region, exemplifying the vulnerability of human activities to climate change in such areas. Furthermore, it underscored the importance of modeling efforts for this hydro-system and the necessity of providing free and open-access time series data of hydraulic variables. Therefore, numerical modeling emerges as a strategic tool for elucidating the behavior of such complex tidal river systems.
The current body of literature contains a few examples of hydrological and hydraulic modeling efforts in the region. For instance, Camenen et al. (2021) estimated the discharge of the Saigon River using two water level measurement points and a modified Manning–Strickler equation. However, their methodology allows discharge estimation at only one point in the river corresponding to the locations of river discharge measurements. As a result, their approach is limited to one specific location in the Saigon branch. In contrast, our study employs a 1D model that captures the full spatial extent of the Saigon–Dongnai system, providing a more comprehensive representation of its hydrodynamics. Similarly, Khoi et al. (2022) employed the Soil and Water Assessment Tool (SWAT) model to study the impact of climate change on the Saigon River's discharge. Their model calibration and validation relied on daily discharge data from 1981 to 2000 at four points along the river. Since the study focused on climate impact, the calibration was not as precise as it could have been; the primary requirement was a reference discharge to compare against future discharge estimates, thereby assessing the impact of climate change. This highlights the scarcity of recent, accurate, and high-temporal-resolution discharge data for this system. This is partly due to the fact that traditional river discharge monitoring methods are labor-intensive, require minimum water depths, or necessitate prolonged measurement periods, making them costly and time-consuming (Eltner et al., 2020). Indeed, river discharge measurements have significantly declined over the past 30 years, even in developed countries (Zakharova et al., 2020).
In complex, tide-dominated river networks, selecting an appropriate modeling approach depends on the primary objective and data availability. While 2D models are often preferred for floodplain inundation and urban flood mapping, they require high-resolution topography, detailed bathymetric data, and extensive calibration datasets, which are often unavailable in poorly gauged river systems. In contrast, 1D hydrodynamic models remain a computationally efficient and practical alternative when the main goal is to estimate discharge and water levels within the channel network. In many cases, flow largely remains confined to the riverbed, and a well-calibrated 1D model can provide accurate results with significantly lower computational demands. However, we acknowledge that when overbank flow, floodplain interactions, or urban drainage processes become dominant, a coupled 1D–2D or full 2D approach may be more appropriate. Our study provides a clear example of a sufficient 1D model and how targeted calibration can compensate for data limitations, making it a valuable tool for tide-influenced, data-scarce regions.
Hydraulic data availability varies significantly among rivers, even in regions with relatively good data coverage, and data are particularly scarce in tropical areas (Wood et al., 2023; Scheiber et al., 2023). These limitations can be partially mitigated using model-generated data (Xu et al., 2022; Heinrich et al., 2023). However, model calibration and validation require in situ data, which are often lacking. The primary obstacle to modeling efforts for the Ho Chi Minh City region is the very limited amount of data for calibration and validation. Despite this, Scheiber et al. (2023) managed to set up an urban flood model for HCMC using only open-access satellite data and monthly mean river discharge from reservoir operations. Nonetheless, the model introduced significant uncertainties and limitations inherent to satellite data, aiming to provide preliminary flood maps rather than deterministic conclusions.
This paper aims to (i) develop and validate a calibration methodology for improving 1D hydrodynamic modeling with minimal in situ data by coupling a simple flow law and (ii) illustrate the utility of a low-cost modeling effort to understand flow dynamics in a poorly gauged tidal river network. Leveraging a 1D hydrodynamic model developed at INRAE (French Research Institute for Agriculture, Food, and Environment) Lyon previously validated on other tidal river systems like the Adour River (Camenen et al., 2022) or the lower Seine River (Mendez Rios et al., 2023), the study explores three calibration strategies for the Saigon–Dongnai system using scarce in situ measurements sourced from an already existing local measurement protocol. The calibration approaches put forward are as follows: (i) using direct measurements of water level, (ii) using discharge data computed from vertical velocity profiles using the velocity index method, and (iii) using both sources of data. Calibration efforts focused on optimizing the Strickler coefficient, Ks, by minimizing a loss function comprising water level and discharge relative root mean square errors (rRMSEs). Validation against independent measurements was then performed. Finally, a modified Manning–Strickler (MS) law was coupled with the hydrodynamic model to improve discharge estimation.
In this study, we employ two calibration approaches to achieve the most reliable estimations of water levels and discharge in the framework of a tidal river system within a data-scarce region.
First, we evaluate three distinct calibration strategies for a 1D hydrodynamic model, each using a different combination of calibration data as detailed in Sect. 2.4. The performance of each strategy is assessed by validating model outputs against independent datasets from non-overlapping time periods.
Second, to address data limitations and enhance discharge estimation, we integrate a modified MS law with the 1D model. This coupling is achieved by using the energy slope computed by the model as input to the MS law. The MS law undergoes a secondary calibration phase using the same discharge data as the 1D model, after which the discharge outputs are validated against an independent dataset from non-overlapping periods.
2.1 Case study: the Saigon–Dongnai system
The Saigon–Dongnai system, situated in southern Vietnam (Fig. 1), comprises two main rivers: the Dongnai River and the Saigon River. The Dongnai River originates in central Vietnam and flows southward through to the Tri An reservoir, while the Saigon River originates in southeastern Cambodia and flows through to the Dau Tieng reservoir. Downstream of the Dau Tieng reservoir, the Saigon River traverses a highly urbanized area, HCMC, which has significant impacts on water quality due to inadequate wastewater treatment (Nguyen et al., 2019). The region features predominantly flat terrain, and the river system is heavily influenced by tides (Camenen et al., 2021).
The instantaneous flow in the Saigon–Dongnai system can fluctuate between −2000 and +2500 m3 s−1, with the net discharge typically remaining below 100 m3 s−1 and occasionally reaching up to 300 m3 s−1 during the peak flow seasons. The Saigon River, crossing through HCMC, is interlinked with numerous urban canals and serves as a tributary of the Dongnai River. In contrast, the Dongnai River exhibits substantially higher net discharge values, typically 1 order of magnitude greater, with monthly averages ranging from 200 m3 s−1 during the dry season to 1200 m3 s−1 during the rainy season (see Fig. 4).
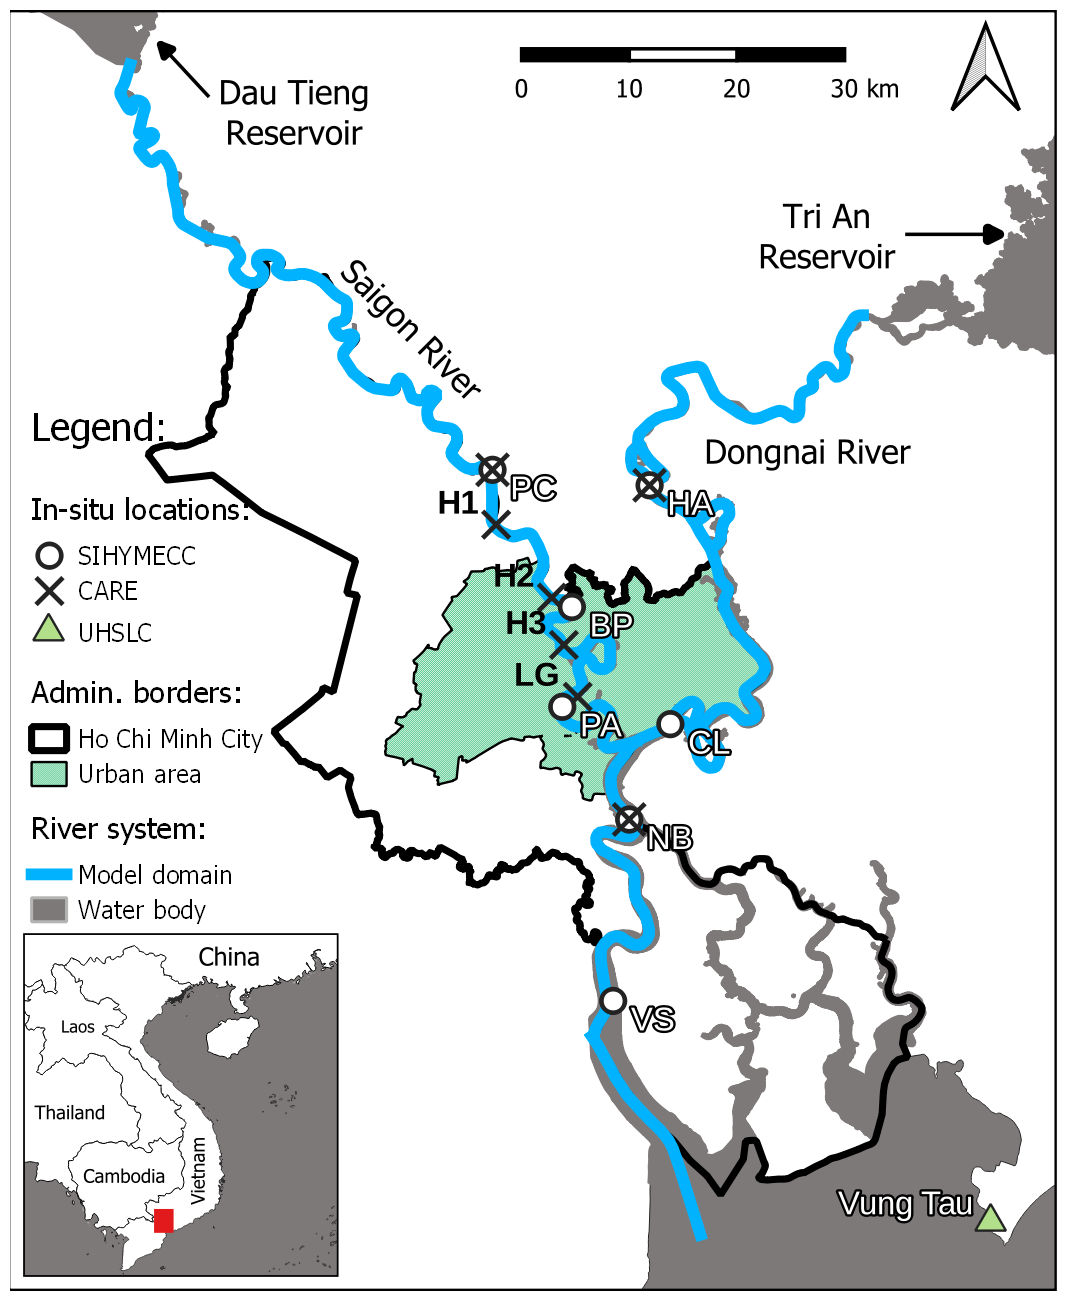
Figure 1Map of the study area. The estuary water bodies (grey) and the MAGE model domain (blue) with the Dongnai River (right) and its Saigon River branch (left) can be seen. Locations of river measurements from the Sub-Institute of Hydrometeorology and Climate Change (SIHYMECC, white dots) and the Center of Asian Research on Water (CARE, black crosses) are also shown. The Saigon River has six measurement locations, i.e., Phu Cuong (PC), Hobo 1 (H1), Hobo 2 (H2), Binh Phuoc (BP), Hobo 3 (H3), La Garden (LG), and Phu An (PA). The Dongnai River has four measurement locations, i.e., Hoa An (HA), Cat Lai (CL), Nha Be (NB), and Vam Sat (VS). The Vung Tau tidal gauge from the University of Hawaii Sea Level Center (UHSLC) is depicted as a green triangle. The Ho Chi Minh City area and the heavily populated urban center are depicted by a black line and a green polygon, respectively. The area shown in the larger map is represented by the red box in the overview map.
2.2 One-dimensional hydrodynamic modeling: MAGE (MAillé GÉnéralisé)
We employ the MAGE code that solves the Saint-Venant equations (Souhar and Faure, 2009), comprising the mass conservation equation (Eq. 1) and the momentum conservation equation (Eq. 2). These governing equations are derived from the Navier–Stokes equations for mass and momentum conservation under the assumptions of an incompressible fluid, hydrostatic pressure distribution, and small channel bottom slopes. These equations are typically expressed in terms of wetted area, which depends on water level and discharge as the primary variables. Consequently, the mass and momentum conservation equations can be formulated as follows:
where Aw represents the wet section, Q the water discharge, qlat a lateral input or output (overflow), Z the water surface elevation, Ks the Strickler coefficient, Rh the hydraulic radius, and Js a singular head loss. k is a Boolean variable such that k=1 if qlat<0 and k=0 otherwise.
Friction head losses are modeled using the classical Manning–Strickler law. MAGE employs a finite-difference method utilizing a Preissman scheme and an iterative approach (Newton–Raphson) for solving the system of nonlinear discrete equations (Eqs. 1 and 2).
The model for the Saigon–Dongnai system was constructed utilizing the MAGE code via the PamHyr interface currently written in Java and soon to be accessible as a Python interface (Rouby et al., 2024; Camenen et al., 2023). This interface offers capabilities for editing network topology, geometry (including cross sections and meshes), and hydraulic conditions (such as friction coefficients and boundary conditions); setting numerical parameters; and visualizing primary results.
The river system was built using 83 cross sections along the Saigon River and 36 cross sections along the Dongnai River (Camenen et al., 2023). The bathymetry data were extracted from bathymetry surveys conducted by the Sub-Institute of Hydrometeorology and Climate Change (SIHYMECC) in 2016 (Nguyen et al., 2021). The primary challenge encountered in this modeling work is the lack of direct measurements of water inputs, not only from the dams, but also from tributaries and irrigation canals, which are numerous and significantly influenced by tidal dynamics. These characteristics were left out of the modeling effort.
Given the geometry of our system domain (Fig. 1), the MAGE model requires three boundary conditions: (i) a discharge time series at the source of the Saigon River branch, i.e., the Dau Tieng reservoir; (ii) a discharge time series at the source of the Dongnai River branch, i.e., the Tri An reservoir; and (iii) a water level time series at the river mouth. A significant challenge in modeling arises from the lack of data for the upstream boundary conditions, as tidal influence extends to both upstream dams. As an initial approximation, we will use mean monthly discharge from the period 2012–2016 as reported by Nguyen et al. (2019). The upstream boundary conditions are presented in Fig. A1 in Appendix A. Additionally, a sensitivity analysis showed that the uncertainties in these upstream boundary conditions have a negligible impact on the instantaneous flow dynamics of the river system (Camenen et al., 2023). However, if the instantaneous discharge were to be filtered to obtain the net discharge, we would retrieve the upstream boundary condition. Hence, the model output cannot be used to access the net discharge of these rivers as this variable is an input to the model.
For the downstream boundary condition, we use data from the Vung Tau tide gauge obtained from the research quality dataset available through the Joint Archive for Sea Level of the University of Hawaii Sea Level Center (UHSLC) (Caldwell et al., 2015).
2.3 Manning–Strickler law for operational applications
The MAGE model has difficulty in accurately predicting both water level and river discharge in the Saigon branch (Camenen et al., 2023), especially within the framework of data scarcity. Hence, we opted to couple this model with a modified MS law that has demonstrated efficacy for different tidal rivers (Camenen et al., 2017), including for the Saigon River branch (Camenen et al., 2021; Rodrigues do Amaral et al., 2024a). As illustrated in Fig. 2, the energy slope output from MAGE feeds into the modified MS law. This law is formulated as follows:
with Q representing the water discharge [m3 s−1], Ks the Manning–Strickler coefficient [m s−1], and the hydraulic radius [m], where Aw denotes the wet section [m2] and Pw the wet perimeter [m]. The term sign(S) equates to the sign of the slope, S, taking on values of +1 or −1.
The energy slope, S [–], is assumed to be equal to the water slope and is derived from the water surface elevation output by MAGE around the point where discharge estimation from the MS law is desired. This equation can only yield a discharge value for a specific point in the river. This point must be a location where discharge measurements exist (Fig. 1, white dots) for calibration of the Strickler coefficient Ks. This second calibration moment is performed using the same calibration data used for the 1D model.
2.4 Modeling calibration strategy
The flowchart outlining the calibration methodology is depicted in Fig. 2. The calibration of the MAGE model uses minimal in situ measurements obtained from SIHYMECC, a local Vietnamese agency. The locations for these measurements can be found as white dots in Fig. 1. The measurement data, collected using a protocol in place for several years, include hourly river water level and velocity profiles gathered during campaigns of 48 h every month from 2016 to 2020. Water level is directly measured with a scale, while discharge is derived from water level and depth-averaged velocity using the velocity index method (Chen et al., 2012). Considering the highly dynamic tidal conditions, the error in discharge estimation is approximately 15 % with a minimum error of 150 m3 s−1 (Ruhl and Simpson, 2005).
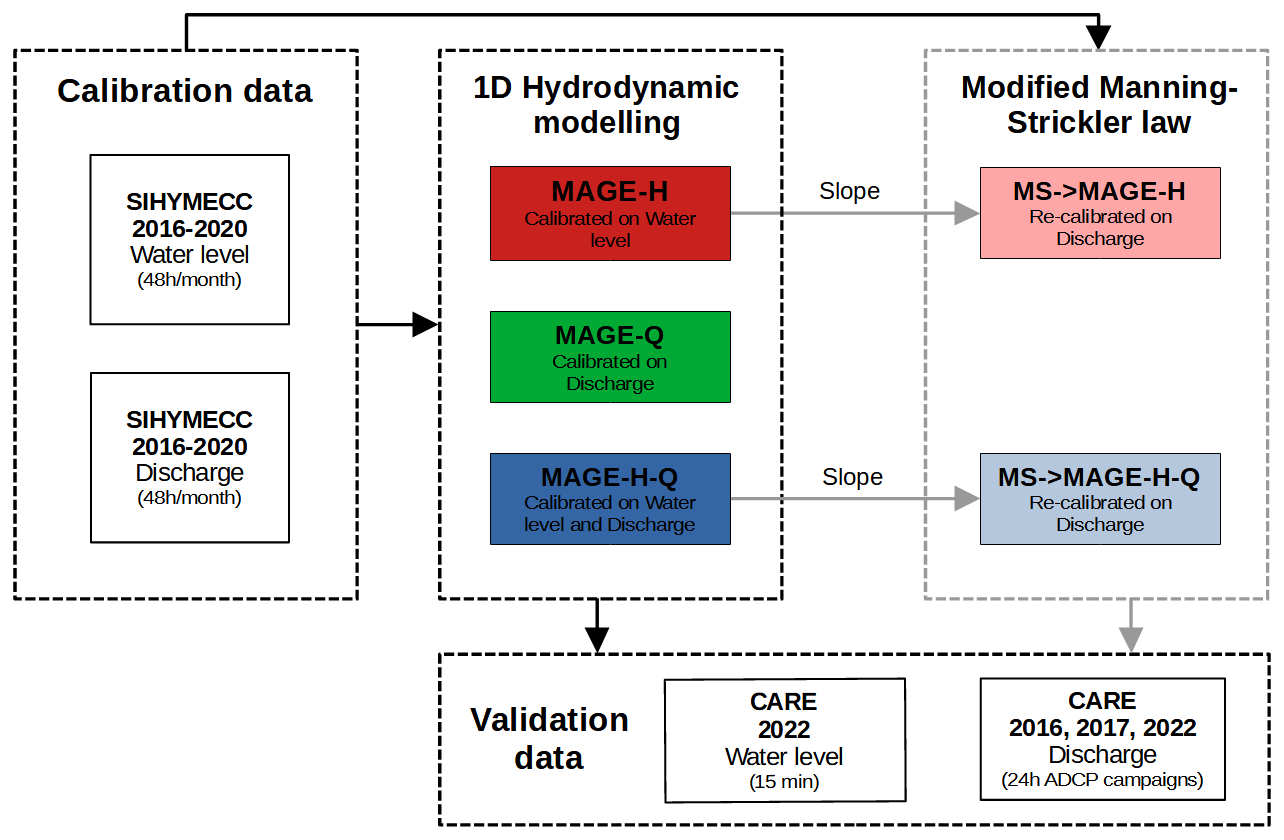
Figure 2Flowchart outlining the calibration and validation methods. The calibration data, provided by SIHYMECC, are from non-overlapping time periods from the validation data, which were supplied by CARE.
Due to the quality limitations of the discharge data available for calibration, three strategies are employed. Firstly, the MAGE model is calibrated solely using water level data, and we denote it as MAGE-H (Fig. 2, dark red). Secondly, MAGE is calibrated using discharge data only, denoted as MAGE-Q (Fig. 2, green). Finally, both water level and discharge data are used for calibration, resulting in MAGE-HQ (Fig. 2, dark blue).
In an effort to improve discharge estimation, a modified MS law is coupled with the 1D model. The modification to the classical Manning–Strickler law enables negative slope values and thus negative water discharge, as observed in tidally forced rivers (see Sect. 2.3). This coupling involves feeding slope outputs from MAGE-H and MAGE-HQ into the modified MS law, which is then recalibrated with discharge data, leading to MSMAGE-H and MSMAGE-HQ outputs (Fig. 2, light red and blue, respectively).
For the first calibration moment, the Strickler coefficients in the MAGE model are calibrated with a sequential approach, starting from downstream to upstream in accordance with tide propagation. Initially, the Dongnai River is divided into three reaches: two before its confluence with the Saigon River and one between the confluence and the Tri An reservoir. Subsequently, the Saigon River is divided into seven reaches: five within the urban center and two between the city center and the Dau Tieng reservoir. The calibration exclusively utilizes data from SIHYMECC (Fig. 2).
For each reach, a bounded Brent algorithm (Grund, 1979; Brent, 2013) is employed to minimize a loss function. This is implemented using Python's minimize_scalar function from the SciPy library (Virtanen et al., 2020). Brent's algorithm is a numerical optimization method that combines the robustness of bracketing methods with the efficiency of interpolation techniques to find the minimum of a function. It is particularly effective for univariate optimization problems where the function is continuous but not necessarily smooth or differentiable. The loss function (Eq. 4) is a weighted sum of the relative root mean square errors for water level (rRMSEH) and discharge (rRMSEQ) across all of the measurement locations. The loss function f(Ks) is formulated as follows:
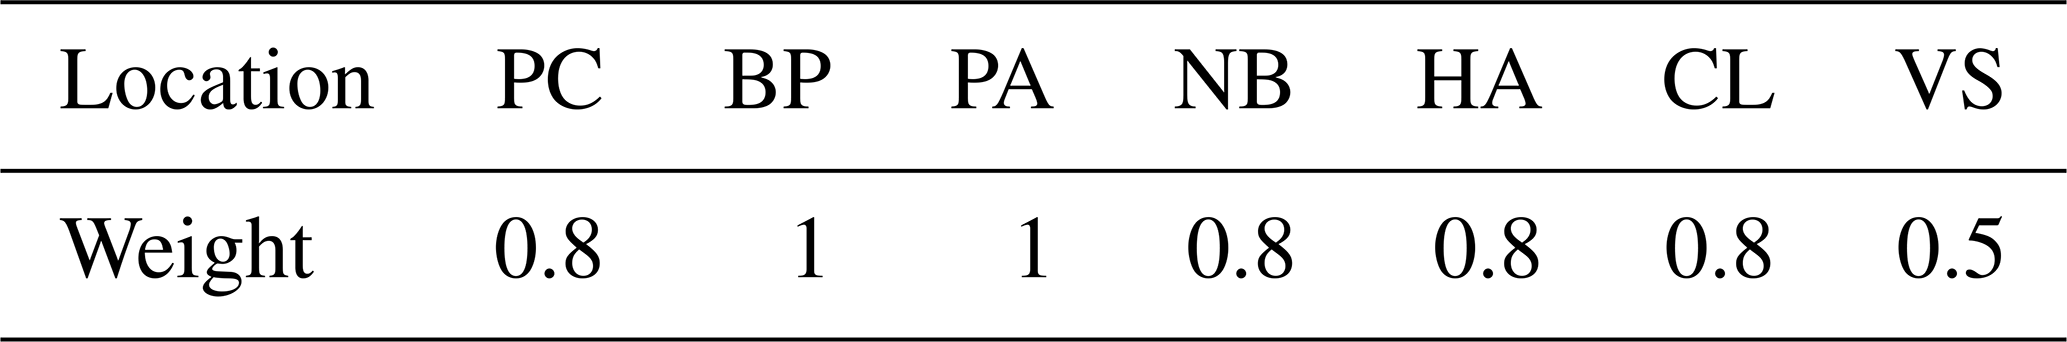
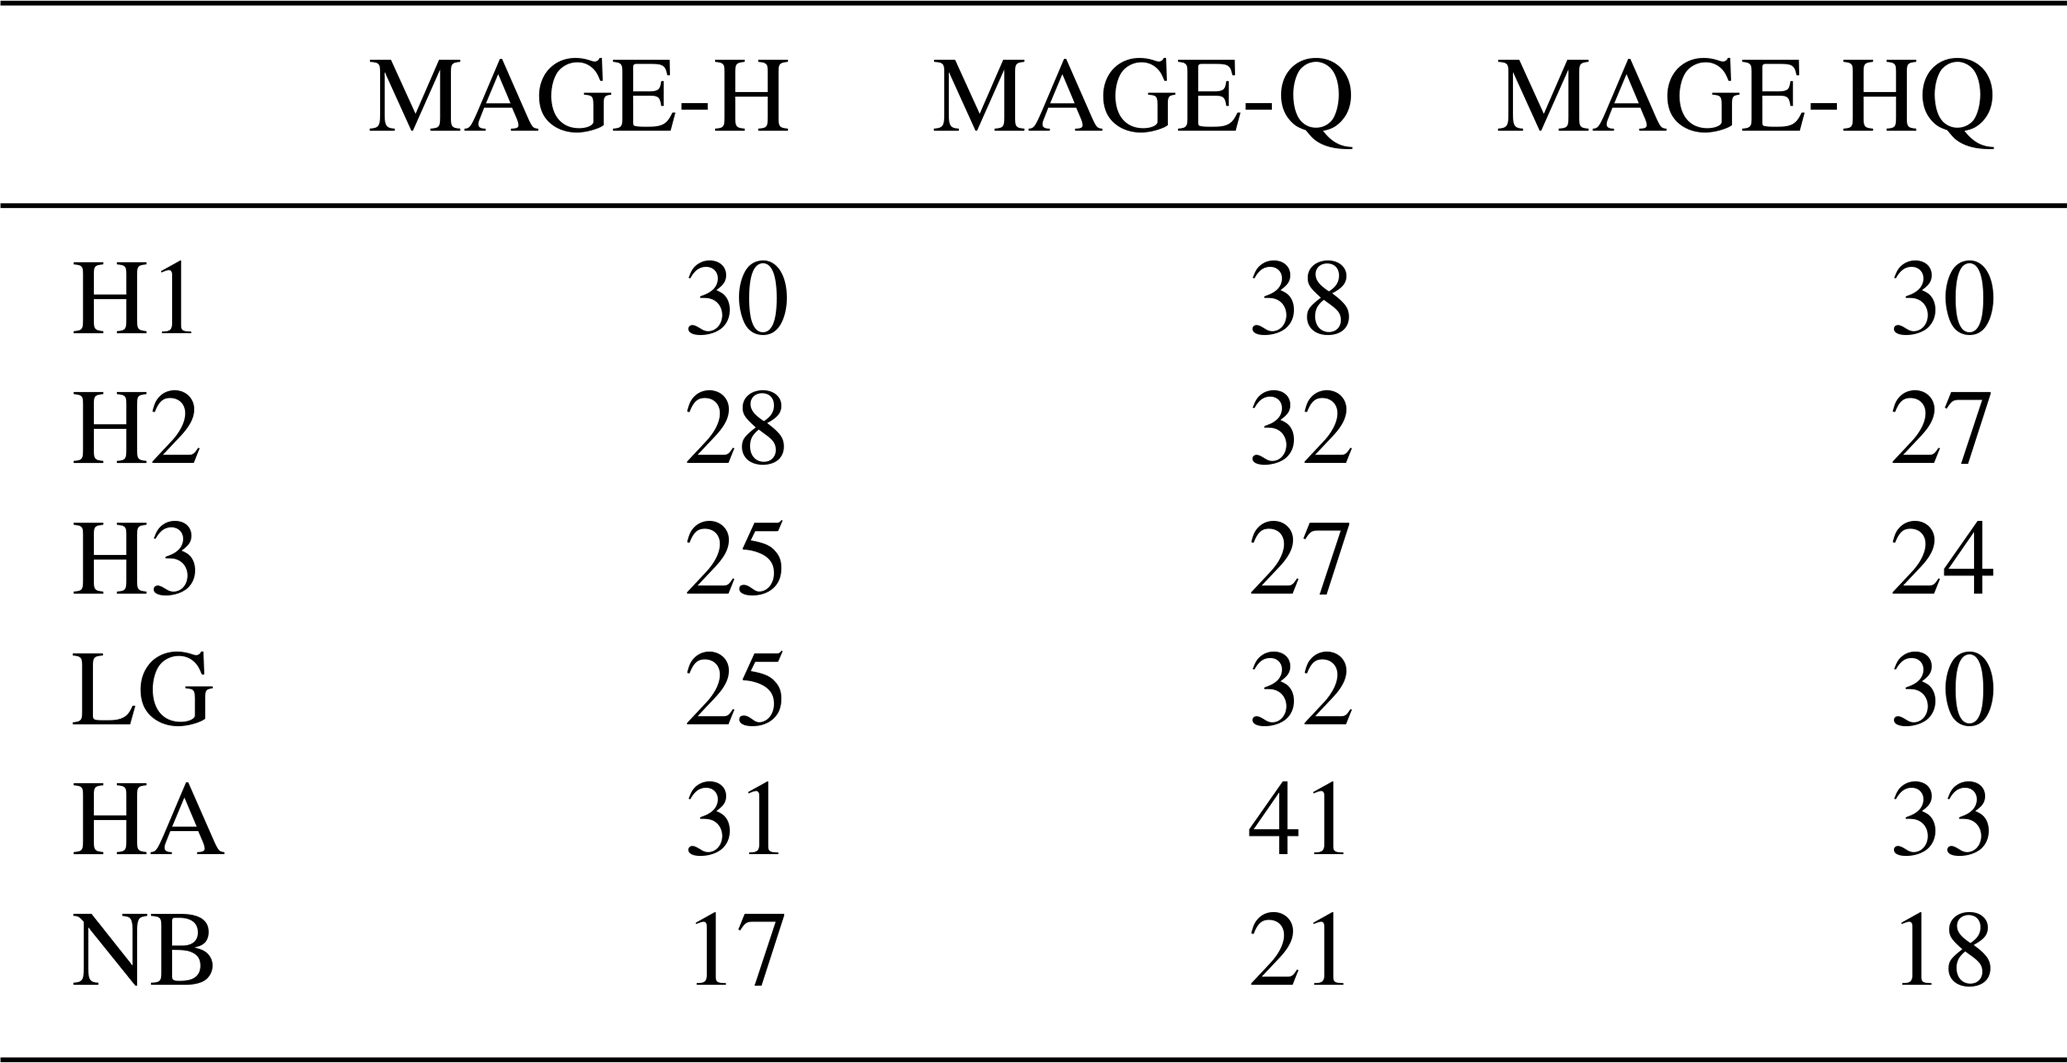
where n=7 denotes the number of SIHYMECC measurement locations, Ci represents the weight assigned to each measurement location, and rRMSE and rRMSE are the water level and discharge rRMSEs for location i. The superscript m represents each value in the time series of water level and discharge. The weights (Ci) are constant values between 0 and 1, with higher importance assigned to measurement locations near the urban city center, as detailed in Table 1. This prioritization ensures that the model performance is given more significance around HCMC, which is the focal point for flooding applications and other environmental impacts. By weighting the measurements in this manner, we aim to enhance the model's accuracy in areas that are most critical for urban planning and risk mitigation efforts.
Minimizing Eq. (4) yields the optimal Ks value for a given reach within the MAGE code.
Table 1Weights assigned to each measurement location for the calibration of the MAGE model.
For the second calibration moment, the Strickler coefficient of the MS law is calibrated against discharge data using the same algorithm as for the MAGE model. However, this calibration is performed separately for each location and focuses solely on discharge data. Therefore, the loss function to be minimized is exclusively Eq. (6). The calibration of the modified MS equation constitutes a secondary phase of calibration on discharge, as the slope input is already derived from the calibrated MAGE model. It is important to note that the discharge data used in this phase of the calibration are the same as those used for the MAGE model calibration.
The models' validation is conducted using independent data from the Center of Asian Research on Water (CARE), which includes water level measurements every 15 min from October to December 2022 (Rodrigues do Amaral et al., 2023) as well as hourly discharge measurements from four 24 h acoustic Doppler current profiler (ADCP) campaigns in 2016, 2017, and 2022 (see Fig. 1, black crosses).
For the validation, two performance metrics are employed: rRMSE and the coefficient of determination R2. These metrics are computed as follows:
where ytrue and ymodel are the measurement and model output of the variable of interest, i.e. the water level or discharge.
Three calibration strategies were tested for the MAGE model based on water level, discharge, or both parameters. For the coupled modified MS models (MSMAGE-H and MSMAGE-HQ), calibration used discharge data only. Calibration results for rRMSEs and R2 are shown in Fig. B1 (Appendix B), while validation results for rRMSEs are in Tables 3 and 2 and R2 values in Figs. C1 and C2 (Appendix C). Strickler coefficient values across the river are shown in Fig. 3.
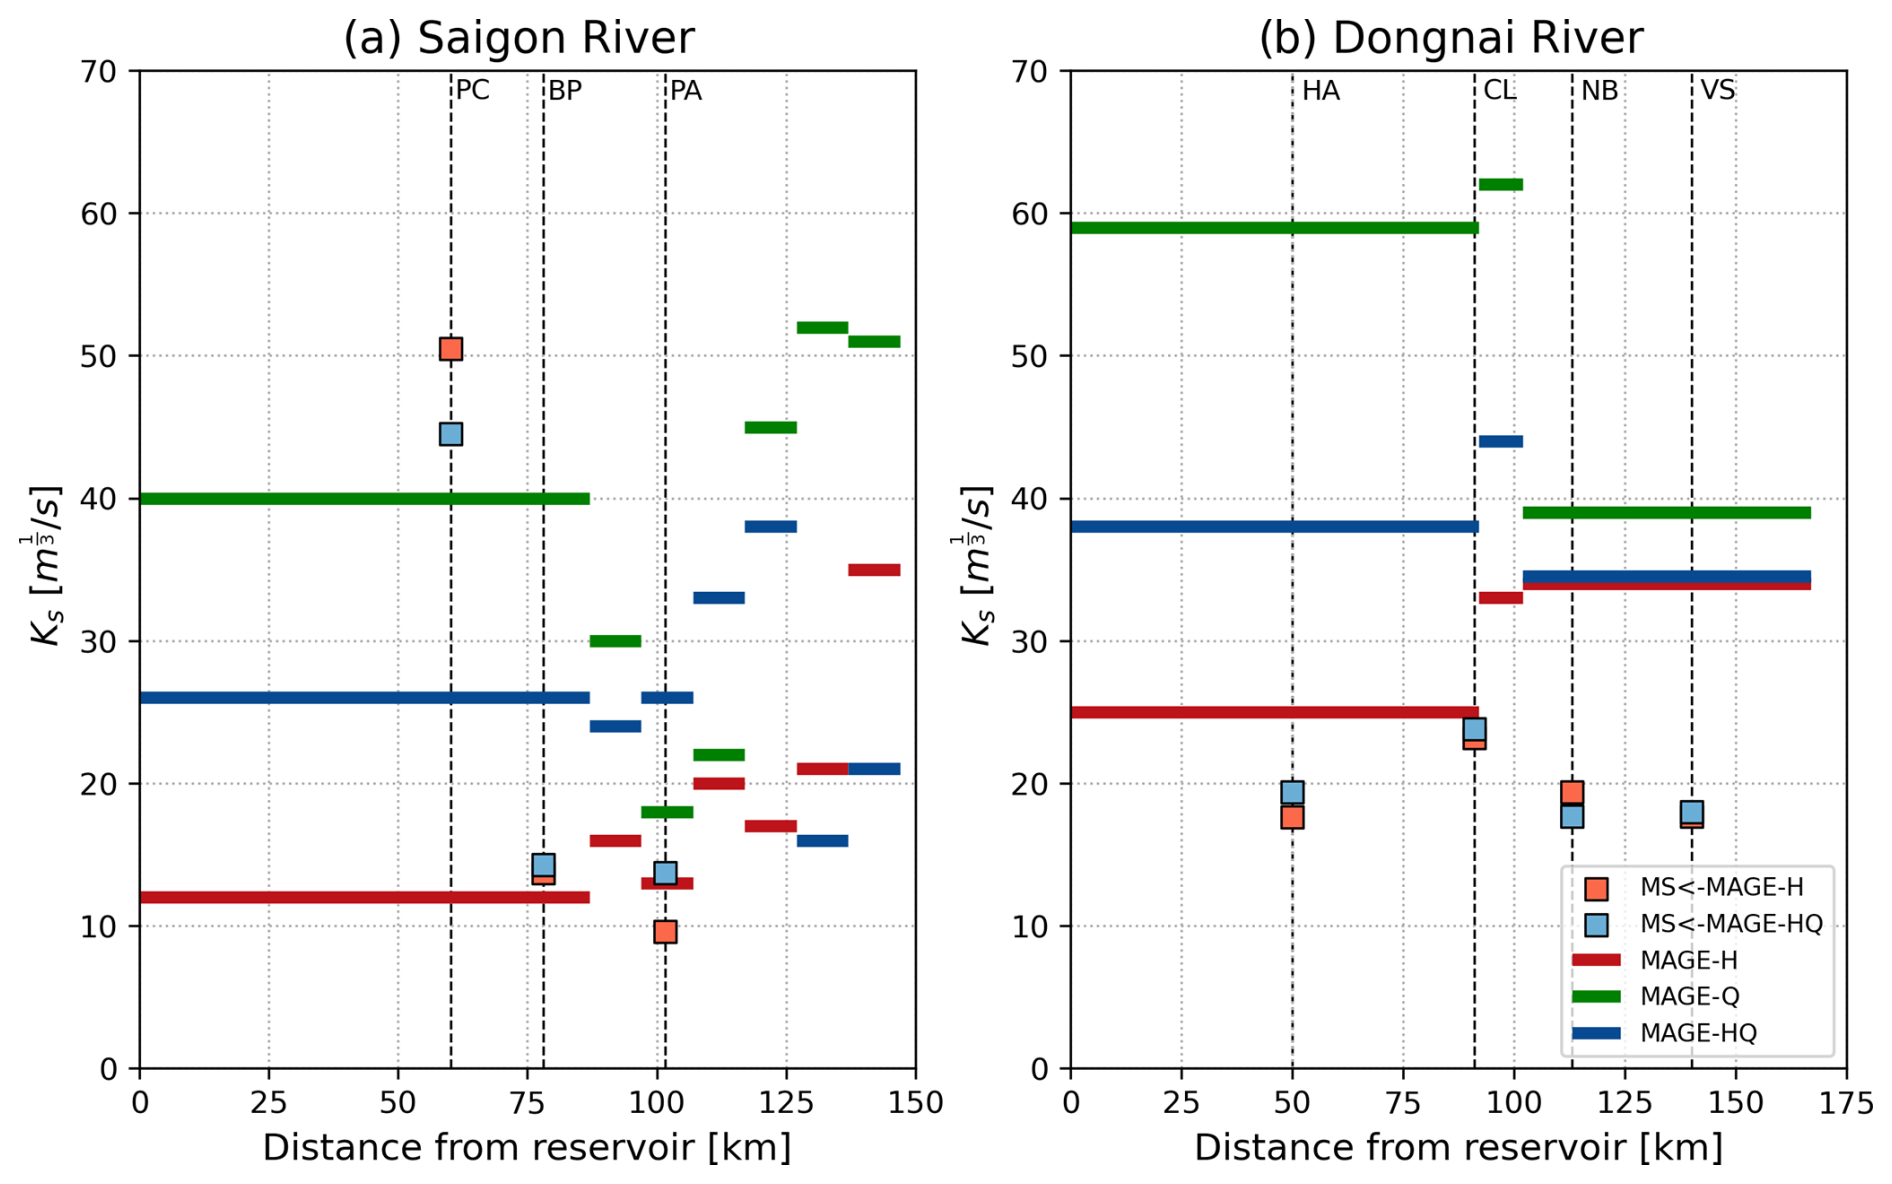
Figure 3Strickler coefficients obtained from the calibration of the MAGE model. Solid lines in red, green, and blue correspond to MAGE-H, MAGE-Q, and MAGE-HQ. The blue and orange squares correspond to MSMAGE-HQ and MSMAGE-H at the locations of the SIHYMECC measurements.
For the Saigon River, calibration using only water level measurements (MAGE-H, red in Fig. 3) shows an increasing trend in Strickler coefficients (Ks) with distance from the reservoir, with some variability near the urban center (100–150 km). When using discharge data alone (MAGE-Q, green in Fig. 3), Ks values increase further along most of the river. Including discharge data in the calibration (MAGE-HQ, blue in Fig. 3) leads to higher Ks values across the river, except near the confluence.
Figure 4 shows validation data from the ADCP campaigns compared to model output, with the data being independent of the calibration dataset (see Fig. 2). For the Saigon River, Strickler coefficients from MAGE-Q are higher than those from MAGE-HQ and MAGE-H, leading to larger discharge amplitudes (Fig. 4). The rRMSE between the ADCP data and model output improves significantly for MAGE-Q and MAGE-HQ calibrations (Table 2), indicating better model performance despite the lower quality of the discharge data. Table 2 shows that, for the Saigon River, omitting the water level data improves the rRMSE, while for the Dongnai River using discharge data yields similar a performance to water level calibration alone. MAGE-HQ outperforms MAGE-H and MAGE-Q, as discharge-only calibration leads to overestimation. However, all of the models show similar behavior for the asymmetric tide (2016 ADCP campaign, Fig. 4c), where the modified MS model provides no significant improvement. The MS coupling slightly alters the net outflow results (Fig. 4).
Table 2Validation results for rRMSEs [%] between the model discharge and ADCP campaigns. The ADCP data were not used for the calibration efforts, and thus the model output and validation data are fully independent.
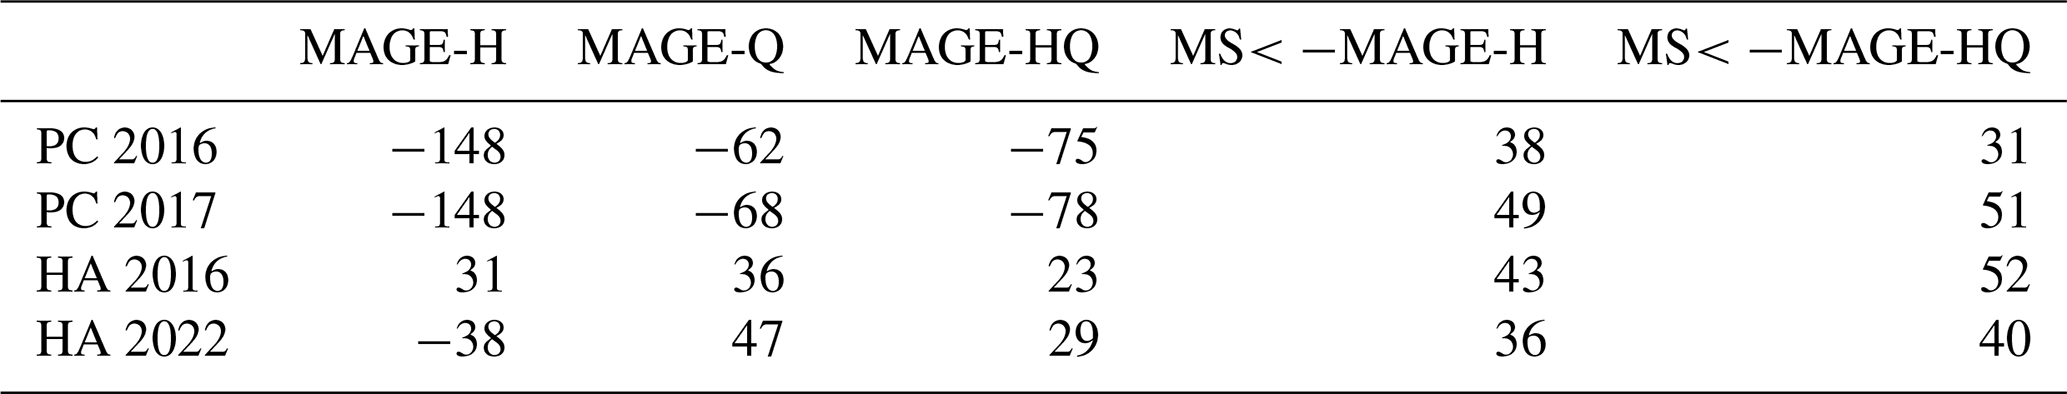
For operational discharge estimation, accuracy is crucial. Table 2 shows that coupling the modified MS equation reduces the rRMSE of the MAGE model's discharge output by 50 % during the symmetric tide (2016) and by 20 % during the asymmetric tide (2017) in the Saigon River. However, the errors remain between 31 % and 51 %, highlighting the challenges of discharge estimation in dynamic tidal rivers. For the Dongnai River, the coupling yields similar or slightly worse results than with MAGE alone.
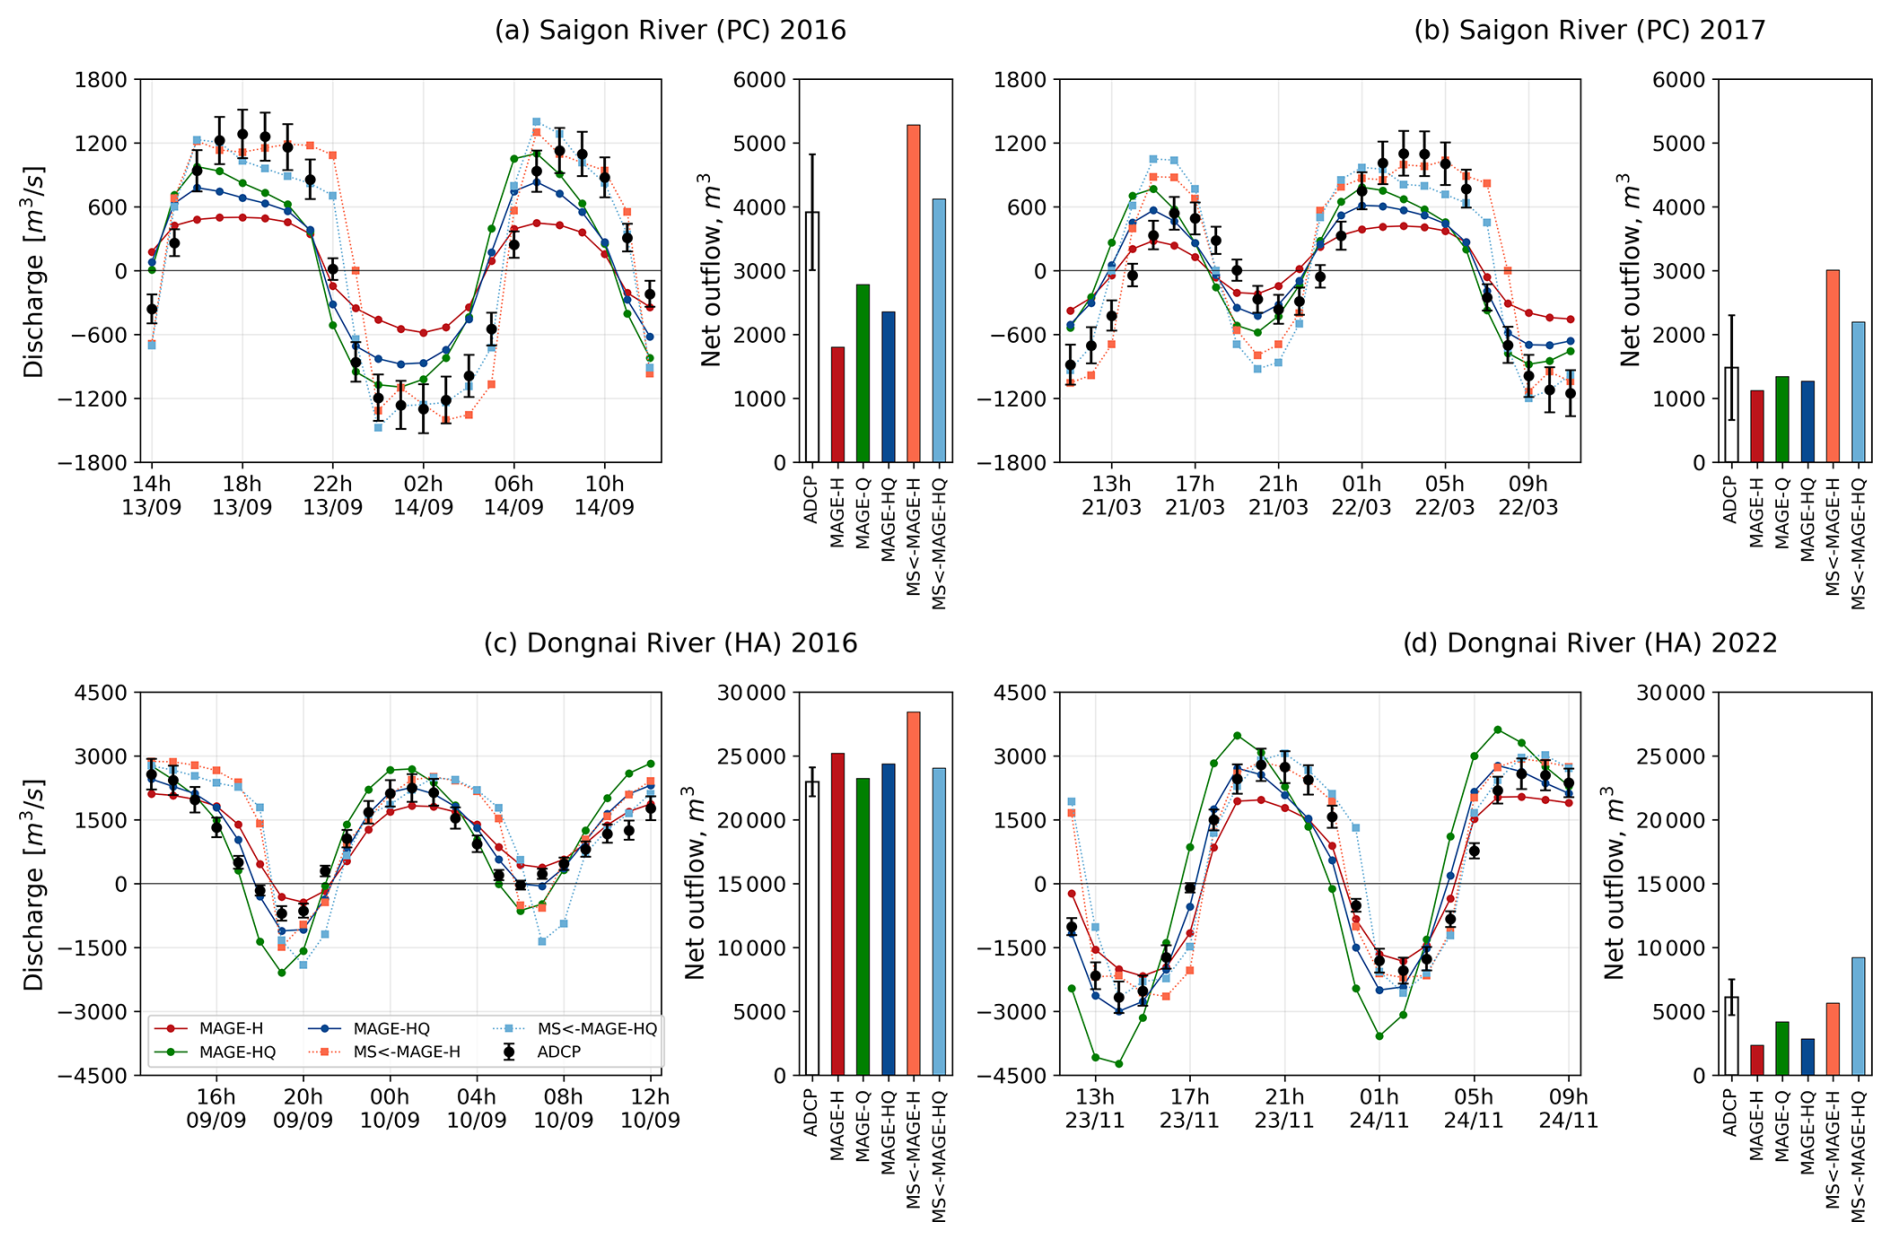
Figure 4Discharge time series and net outflow comparison between ADCP campaigns and model output. Black dots with uncertainty bars represent the ADCP measurements. Solid lines with dots represent MAGE-H, MAGE-Q, and MAGE-HQ in red, green, and blue, respectively. Dashed lines with squares represent MSMAGE-H and MSMAGE-HQ in orange and blue, respectively. Panels (a) and (b) show the campaigns of September 2016 and March 2017 at the PC location in the Saigon River during symmetric and asymmetric tides, respectively. Panels (c) and (d) show the campaigns of September 2016 and November 2022 at the HA location in the Dongnai River during asymmetric and symmetric tides, respectively.
Introducing discharge data into the calibration slightly increases water level rRMSEs at most of the stations (Table 3) but has little impact on rRMSEs between validation data and model output. The rRMSE difference between MAGE-H and MAGE-Q is consistently under 10 %, and between MAGE-H and MAGE-HQ it remains below 5 %. Regardless of the calibration approach, the model accurately captures water level dynamics, with R2 values exceeding 0.80 at all of the stations (Fig. C1 and Appendix B).
Table 3Validation results for rRMSEs [%] between model water level and water level measurements.
This study explores calibration strategies for hydrodynamic modeling of dynamic tidal rivers, specifically the Saigon and Dongnai rivers. The three MAGE model calibration approaches – based on water level, discharge, or both – provide valuable insights into model behavior under data scarcity. Additionally, coupling the modified Manning–Strickler (MS) equation with the MAGE model offers a novel method to improve discharge estimation for operational purposes, though results vary across river systems.
The model accurately simulated water levels and discharges in the Dongnai River. However, calibration in the Saigon River was more challenging due to the system's complexity, with significant tidal discharges and low net watershed inflows. Introducing discharge data from measured vertical velocity profiles improved discharge estimation. However, the effectiveness of this approach varied, as the Dongnai River showed comparable performance across calibration strategies.
Modeling challenges arise from balancing simplicity for operational use with accurately representing physical phenomena. For instance, the MAGE model fails to capture tidal wave attenuation, with minimal improvements from different calibration strategies. However, coupling the MS law with a second calibration step significantly enhances discharge accuracy, as shown by the validation efforts. Despite this, the 1D nature of the model is not the limiting factor; using a higher-dimensional model would be impractical due to the need for more data, such as velocity fields, which are scarce in regions like the one studied.
Calibration results show distinct variations in Strickler coefficient (Ks) values along the river, reflecting channel roughness. These variations depend on the calibration strategy and the implementation of modified MS coupling. A higher Ks indicates smoother channel conditions and faster flow velocities, while a lower Ks suggests rougher conditions and slower velocities. In our study, Ks values ranged from 10 (rough) to 50 m s−1 (smooth), highlighting substantial variability in channel roughness. These variations underscore the challenges of modeling tidally influenced rivers. Asymmetrical flow patterns in the Saigon and Dongnai rivers are influenced by tidal amplitudes, morphology, and coastal features, with the Ks effect on discharge varying by tidal phase and river response. This emphasizes the importance of timing in calibration and validation data collection.
While the model provides good estimates of discharge dynamics within the Saigon–Dongnai system, further refinement is needed, particularly with upstream boundary conditions and lateral inflows. Accurate upstream discharge values from the reservoirs are essential for model precision. As a 1D model, this requires net discharge as an input, preventing direct derivation of net discharge from the model's results. The lack of data on lateral inflows from irrigation and urban canals is seen as an important issue with the modeling efforts presented here. The possibility of coupling a hydrological model and incorporating lateral inflows would increase the complexity, with limited improvement in accuracy.
Recent interest in using advanced statistical and machine learning techniques to improve hydrodynamic model calibration has faced challenges in data-scarce regions, where large datasets are often unavailable. However, less data-hungry Bayesian methods offer a robust framework for parameter estimation and improvement of predictive accuracy in hydrodynamic models (Mendez Rios et al., 2023). Future research could explore the potential of these methodologies for dynamic tidal river systems, advancing predictive capabilities. Additionally, considering the impact of canal networks and coupling the model with an advection–dispersion model like AdisTS (Launay et al., 2019) could provide valuable insights into flood events and pollutant dispersion.
The methodology presented in this study extends beyond the Saigon–Dongnai system and offers a practical framework for hydrodynamic modeling in data-scarce, tide-dominated river networks worldwide. Many deltaic and estuarine regions, particularly in developing countries, face similar challenges due to limited monitoring infrastructure, making traditional data-intensive approaches impractical. Our study demonstrates that coupling a simple flow law to improve the calibration of a 1D model with minimal in situ data provides a viable alternative to more computationally demanding methods. Furthermore, the model's ability to simulate a full year in just 5 min makes it particularly suitable for long-term scenario testing, sensitivity analyses, and operational forecasting applications. Future research could explore the integration of remote sensing data or machine learning techniques to further enhance model calibration and expand its applicability to other poorly gauged, tide-influenced river networks.
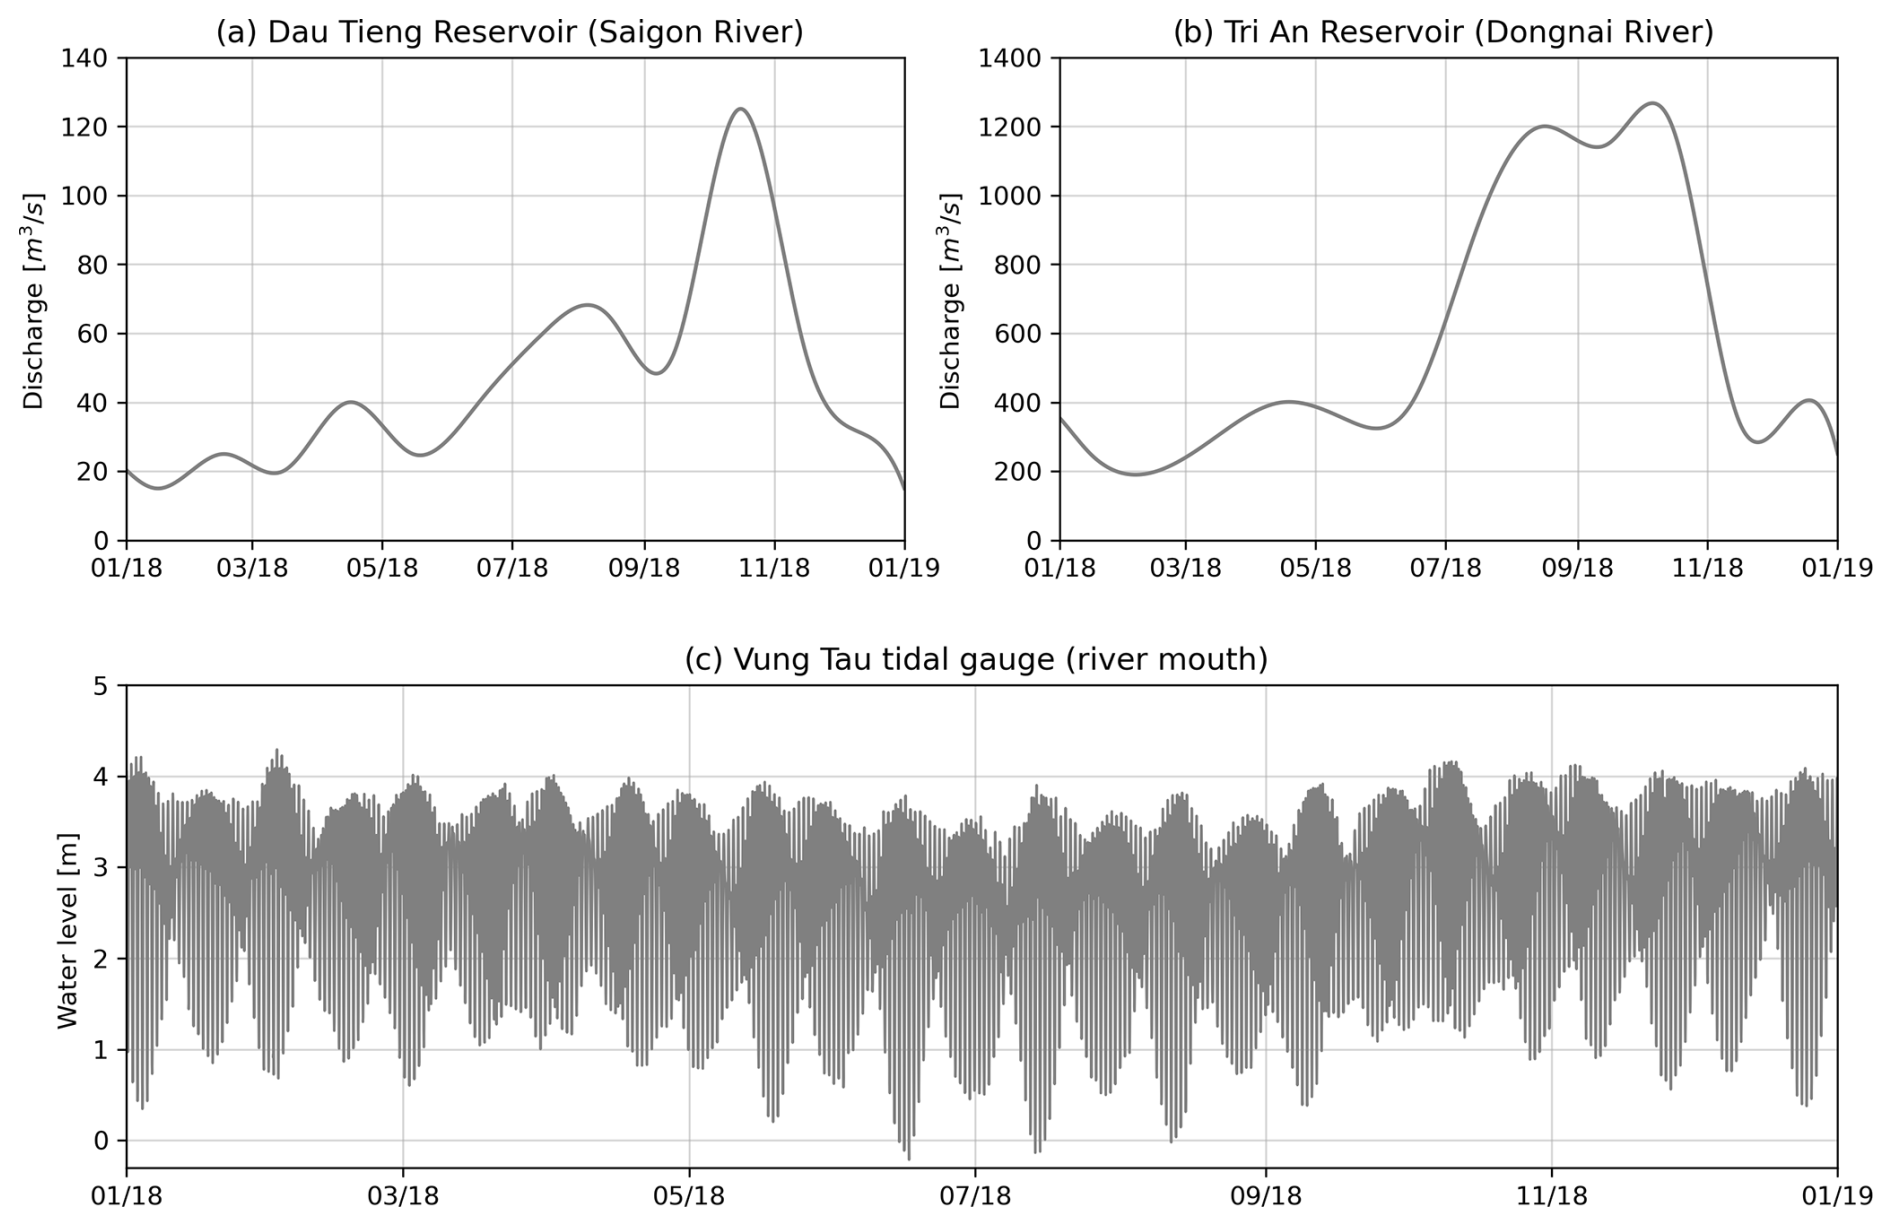
Figure A1Boundary conditions used in the MAGE model: example for the year 2018. (a) Upstream boundary condition for the Saigon River branch: discharge at the Dau Tieng reservoir. (b) Upstream boundary condition for the Dongnai River: discharge at the Tri An reservoir. (c) Downstream boundary condition at the mouth of the Dongnai River: water level at the Vung Tau tidal gauge.
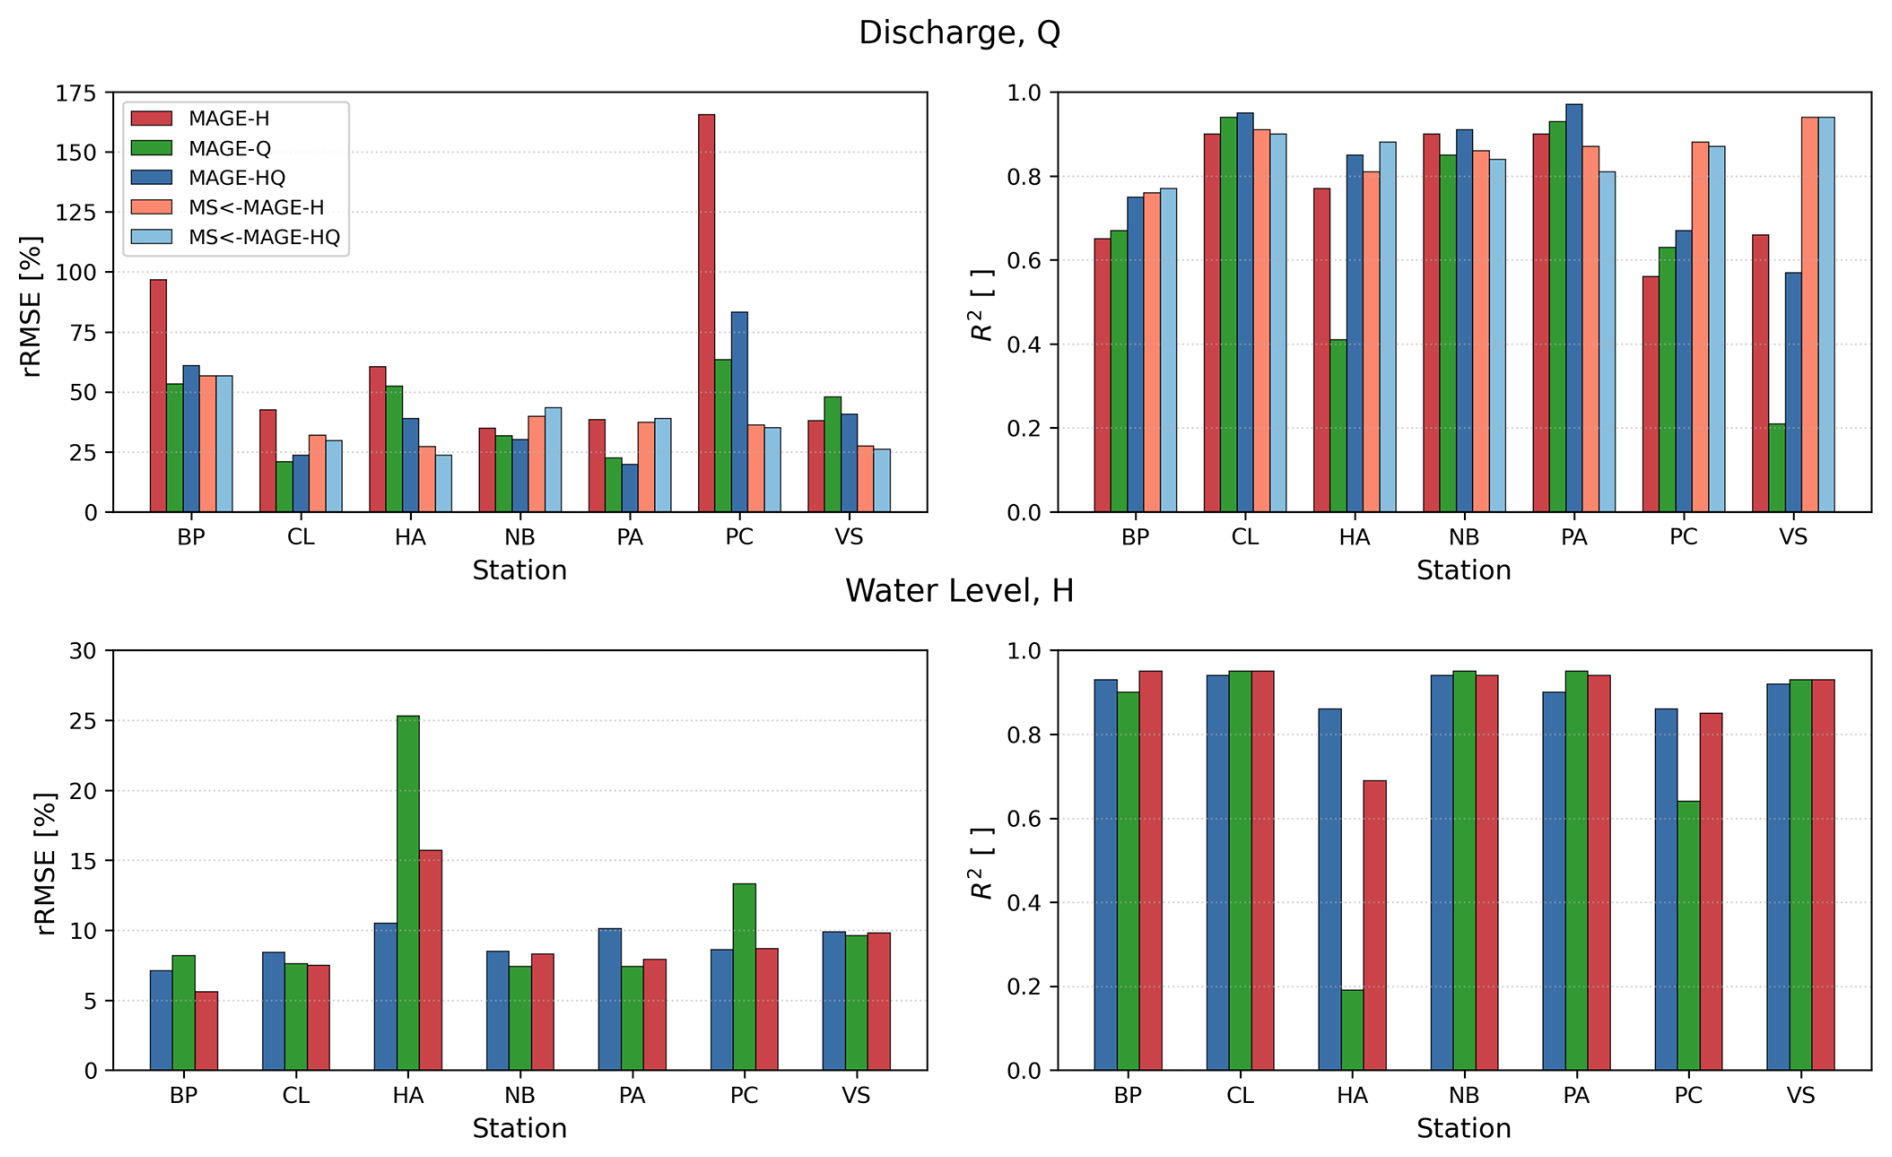
Figure B1Calibration results for the MAGE model and for the MSMAGE coupling. The rRMSE and R2 between model output and calibration data from the SIHYMECC measurement locations are shown. Dark-red, green, and dark-blue bars represent the MAGE-H, MAGE-Q, and MAGE-HQ results. Light-red and light-blue bars represent the MSMAGE-H and MSMAGE-HQ results.
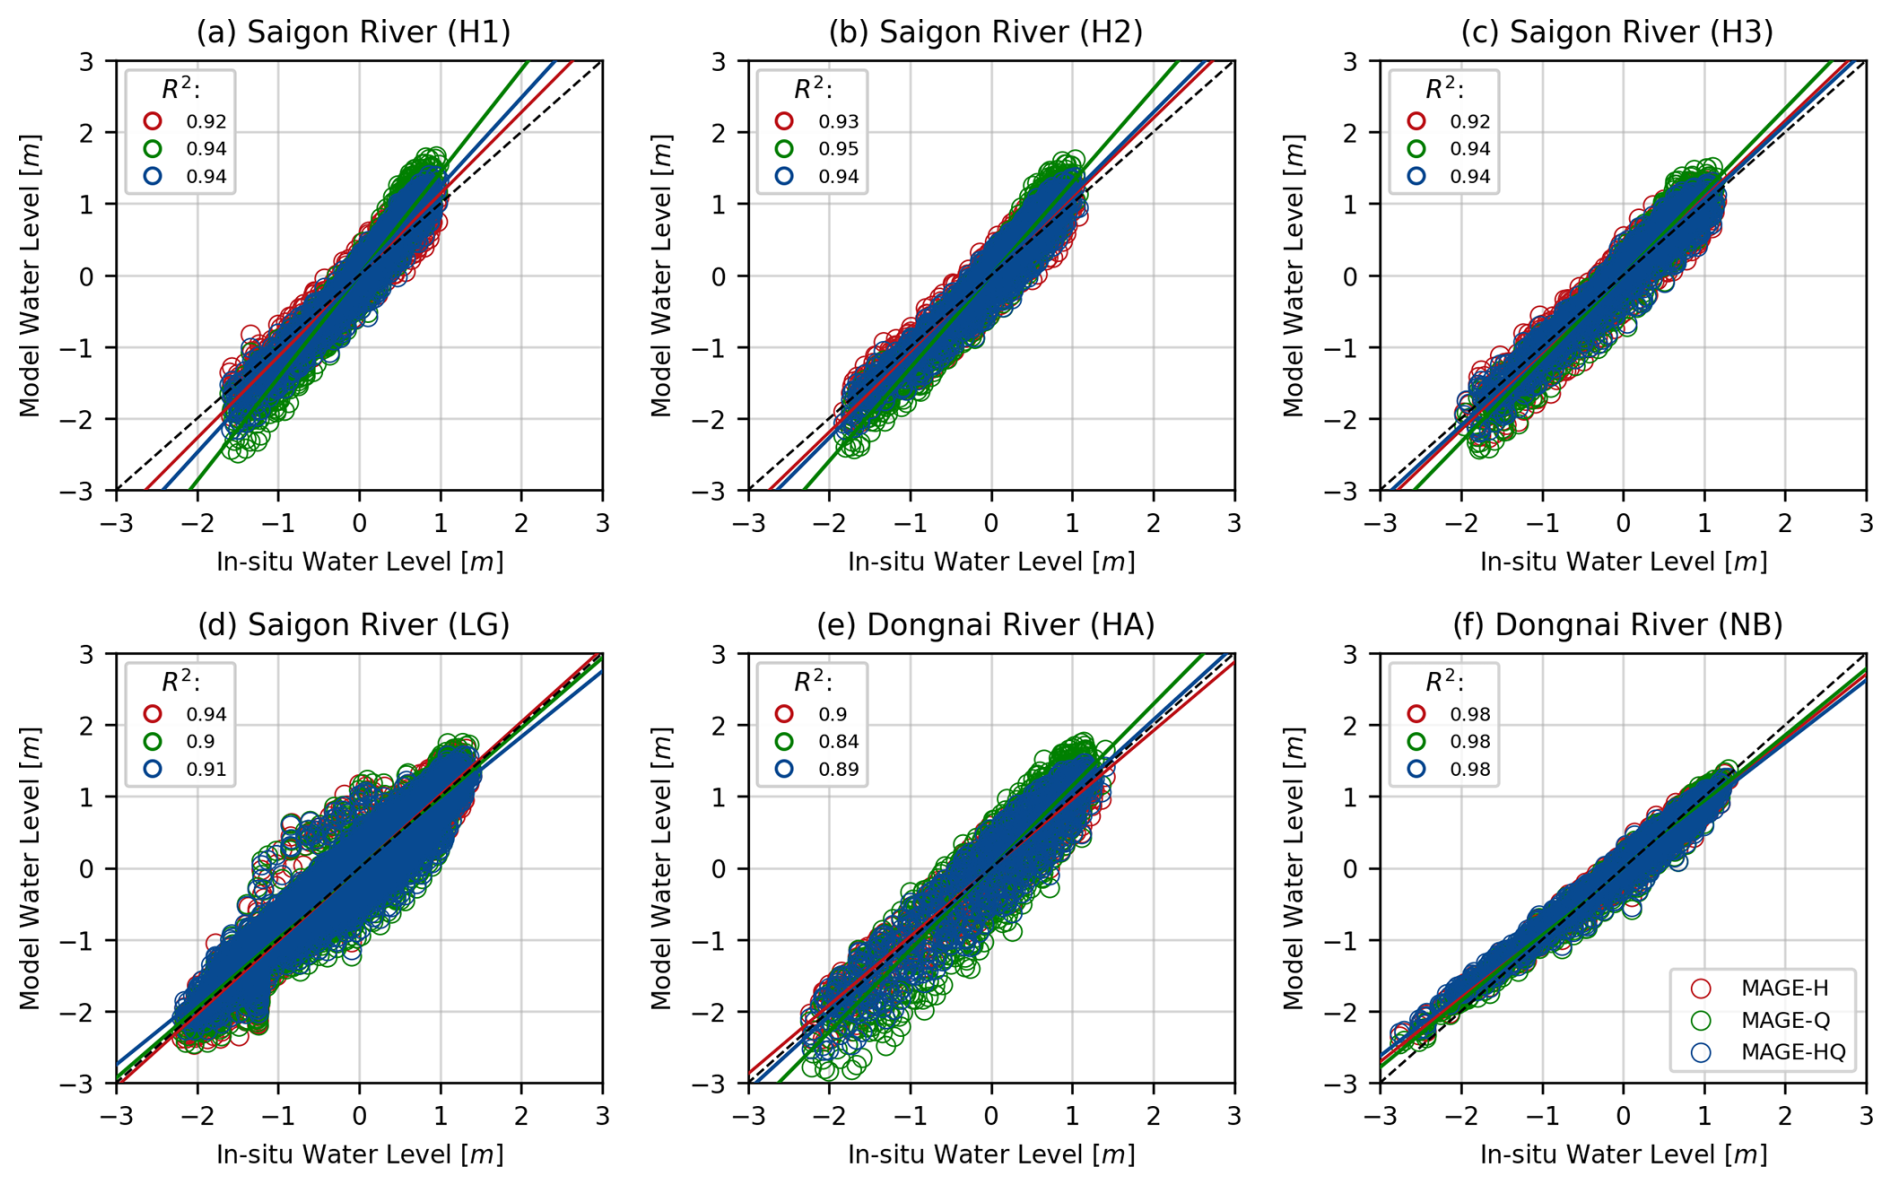
Figure C1Linear regression lines and R2 values between CARE water level measurements and model water level output. The black dashed line represents the y=x line. Red, green, and blue circles represent the MAGE-H, MAGE-Q, and MAGE-HQ results. Solid lines represent linear regressions for each model with the same color code. Panels (a) to (d) show results for the Saigon River locations H1, H2, H3, and LG. Panels (e) and (f) show results for the Dongnai River locations HA and NB, respectively.
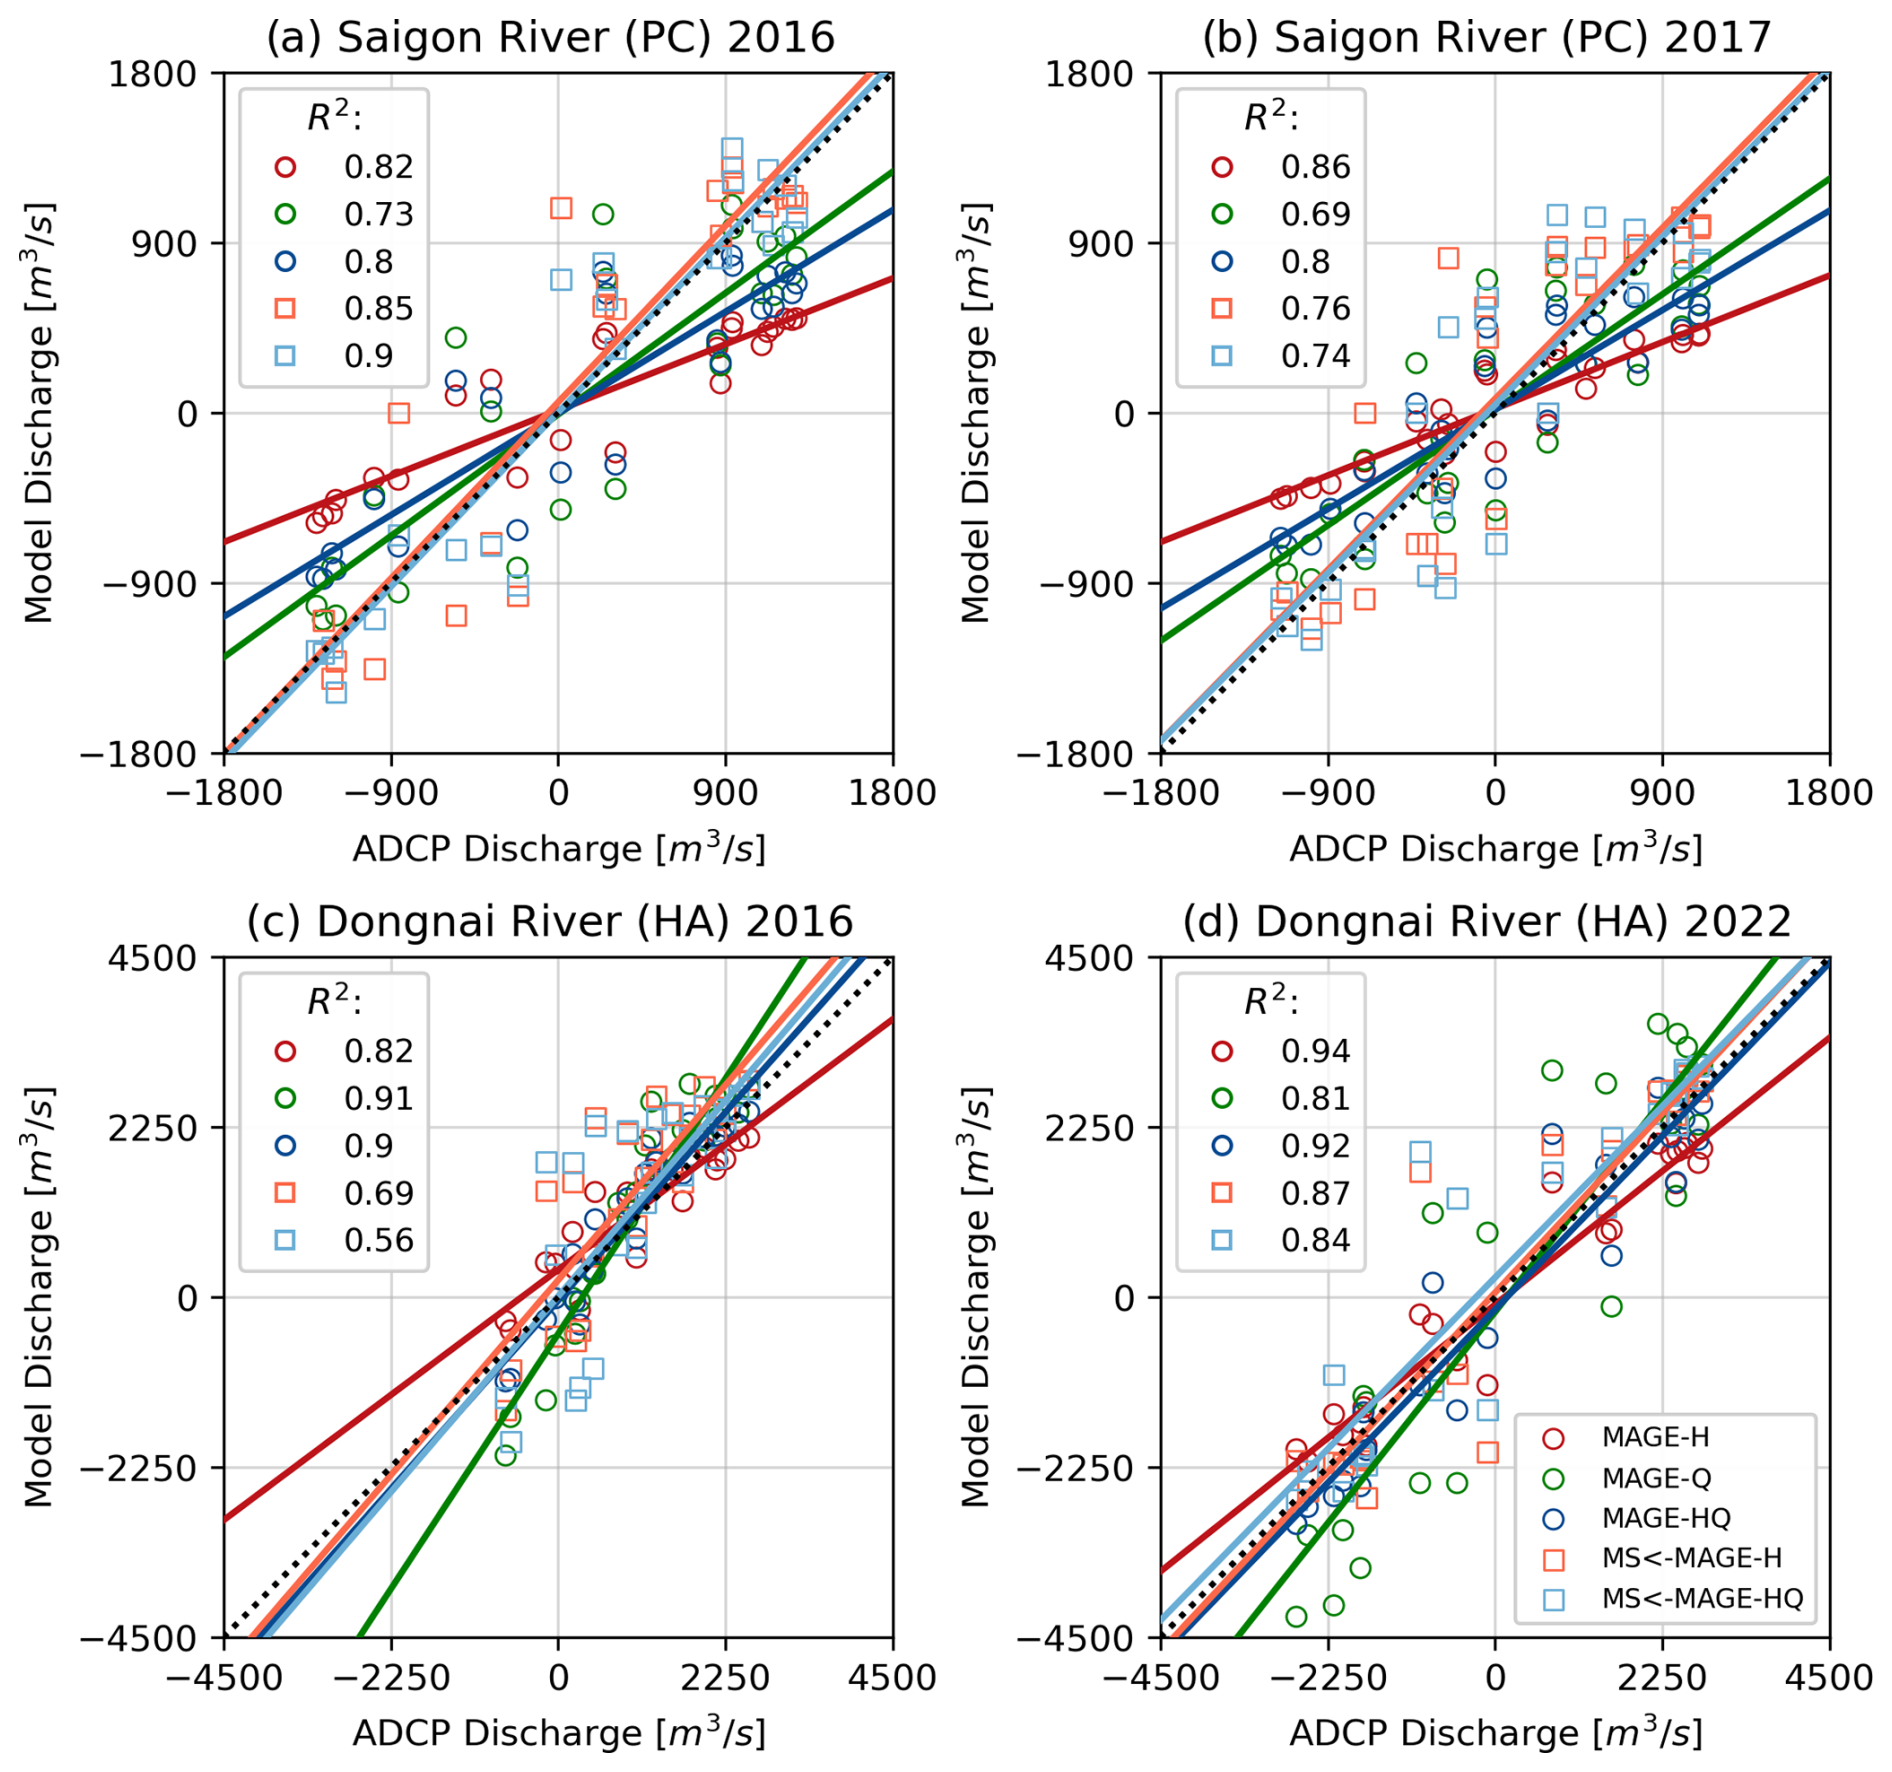
Figure C2Linear regression lines and R2 values between ADCP discharge and model discharge. The black dotted line represents the y=x line. Red, green, and blue circles represent the MAGE-H, MAGE-Q, and MAGE-HQ results and blue and orange squares the MSMAGE-H and MSMAGE-HQ results. Solid lines represent linear regressions for each model with the same color codes as the circles and squares. Panels (a) and (b) show the ADCP campaigns of September 2016 and March 2017 at the PC location in the Saigon River during symmetric and asymmetric tides, respectively. Panels (c) and (d) show the ADCP campaigns of September 2016 and November 2022 at the HA location in the Dongnai River during asymmetric and symmetric tides, respectively.
The MAGE 1D hydrodynamic model was developed by INRAE. Its source code is written in FORTRAN and can be downloaded here: https://gitlab.irstea.fr/jean-baptiste.faure/MAGE (Souhar and Faure, 2009). The data and related documentation that support the findings of this study are freely available in the DataSuds repository (IRD, France) at https://doi.org/10.23708/KLQMSR (Rodrigues Do Amaral et al., 2024b). Data reuse is granted under the CC-BY license.
Conceptualization and investigation: FRdA and BC. Data collection and curation: FRdA and TNT. Writing and editing: FRdA. Reviewing and supervision: BC, NG, TP, and TAT.
The contact author has declared that none of the authors has any competing interests.
Publisher's note: Copernicus Publications remains neutral with regard to jurisdictional claims made in the text, published maps, institutional affiliations, or any other geographical representation in this paper. While Copernicus Publications makes every effort to include appropriate place names, the final responsibility lies with the authors.
This research was conducted thanks to the technical and human support of the CARE-RESCIF initiative (http://carerescif.hcmut.edu.vn/, last access: 14 August 2025) as part of the International Joint Laboratory LECZ-CARE. We would like to thank Nguyen Truong An for providing the bathymetric data of the Saigon and Dongnai rivers. We would also like to acknowledge Jerard Jardin from the University of Hawaii Sea Level Center for his invaluable work in maintaining the Vung Tau tidal gauge.
This paper was edited by Matthew Hipsey and reviewed by two anonymous referees.
Babut, M., Mourier, B., Desmet, M., Simonnet-Laprade, C., Labadie, P., Budzinski, H., De Alencastro, L. F., Tu, T. A., Strady, E., and Gratiot, N.: Where has the pollution gone? A survey of organic contaminants in Ho Chi Minh city/Saigon River (Vietnam) bed sediments, Chemosphere, 217, 261–269, https://doi.org/10.1016/j.chemosphere.2018.11.008, 2019. a
Brent, R. P.: Algorithms for Minimization Without Derivatives, Courier Corporation, ISBN 978-0-48614368-2, https://books.google.nl/books/about/Algorithms_for_Minimization_Without_Deri.html?id=AITCAgAAQBAJ&redir_esc=y (last access: 9 September 2025), 2013. a
Caldwell, P. C., Merrifield, M. A., and Thompson, P. R.: Sea level measured by tide gauges from global oceans – the Joint Archive for Sea Level holdings (NCEI Accession 0019568), Version 5.5, NOAA National Centers for Environmental Information [data set], https://doi.org/10.7289/V5V40S7W, 2015. a
Camenen, B., Dramais, G., Le Coz, J., Ho, T. D., Gratiot, N., and Piney, S.: Estimation d'une courbe de tarage hauteur-dénivelée-débit pour une rivière influencée par la marée, Houille Blanche, 5, 16–21, https://doi.org/10.1051/lhb/2017039, 2017. a
Camenen, B., Gratiot, N., Cohard, J.-A., Gard, F., Tran, V. Q., Nguyen, A.-T., Dramais, G., van Emmerik, T., and Némery, J.: Monitoring discharge in a tidal river using water level observations: Application to the Saigon River, Vietnam, Sci. Total Environ., 761, 143195, https://doi.org/10.1016/j.scitotenv.2020.143195, 2021. a, b, c, d
Camenen, B., Faure, J.-B., Décanis, S., and Dieval, L.: A 1D Numerical Tool for Real Time Modelling of a Complex River Network, in: Advances in Hydroinformatics, Proc. 6th SimHydro conference, Sophia-Antipolis, France, 16–18 June 2021, 41–52, Springer, ISBN 978-981-19-1600-7, https://doi.org/10.1007/978-981-19-1600-7_3, 2022. a
Camenen, B., Gerarduzzi, K., Terraz, T., Rodrigues do Amaral, F., Gratiot, N., and Pellarin, T.: 1D numerical modelling of a complex tidal river: case of the River Saigon, Vietnam, in: Proc. 7th SimHydro conference, Chatou, France, 7–9 November 2023, https://doi.org/10.1007/978-981-97-4072-7_17, 2023. a, b, c, d
Chen, Y.-C., Yang, T.-M., Hsu, N.-S., and Kuo, T.-M.: Real-time discharge measurement in tidal streams by an index velocity, Environ. Monit. Assess., 184, 6423–6436, https://doi.org/10.1007/s10661-011-2430-y, 2012. a
Eltner, A., Sardemann, H., and Grundmann, J.: Technical Note: Flow velocity and discharge measurement in rivers using terrestrial and unmanned-aerial-vehicle imagery, Hydrol. Earth Syst. Sci., 24, 1429–1445, https://doi.org/10.5194/hess-24-1429-2020, 2020. a
FranceInfo: Vietnam : la canicule provoque une grave sécheresse, FranceInfo, https://www.francetvinfo.fr/meteo/canicule/vietnam-la-canicule-provoque-une-grave-secheresse_6526445.html#at_medium=5&at_campaign_group=1&at_campaign=video&at_offre=3&at_variant=V3&at_send_date=20240505&at_recipient_id=726375-1571699586-49b9ee82 (last access: 14 August 2025), 2024. a
Grund, F.: Forsythe, G. E. / Malcolm, M. A. / Moler, C. B., Computer Methods for Mathematical Computations. Englewood Cliffs, New Jersey 07632. Prentice Hall, Inc., 1977. XI, 259 S, Z. Angew. Math. Mech., 59, 141–142, https://doi.org/10.1002/zamm.19790590235, 1979. a
Heinrich, P., Hagemann, S., Weisse, R., Schrum, C., Daewel, U., and Gaslikova, L.: Compound flood events: analysing the joint occurrence of extreme river discharge events and storm surges in northern and central Europe, Nat. Hazards Earth Syst. Sci., 23, 1967–1985, https://doi.org/10.5194/nhess-23-1967-2023, 2023. a
Khoi, D. N., Sam, T. T., Chi, N. T. T., Linh, D. Q., and Nhi, P. T. T.: Impact of future climate change on river discharge and groundwater recharge: a case study of Ho Chi Minh City, Vietnam, J. Water Clim. Change, 13, 1313–1325, https://doi.org/10.2166/wcc.2022.379, 2022. a
Launay, M., Dugué, V., Faure, J.-B., Coquery, M., Camenen, B., and Le Coz, J.: Numerical modelling of the suspended particulate matter dynamics in a regulated river network, Sci. Total Environ., 665, 591–605, https://doi.org/10.1016/j.scitotenv.2019.02.015, 2019. a
Lossouarn, C., Quertamp, F., Gratiot, N., Fenghua, S., and Daigo, Y.: Water Megacities and Global Change: Portraits of 15 Emblematic Cities of the World, ISBN 978-92-3-100161-1, https://www.researchgate.net/publication/313376505_Water_Megacities_and_Global_Change_Portraits_of_15_Emblematic_Cities_of_the_World (last access: 14 August 2025), 2016. a
Mendez Rios, F., Le Coz, J., Renard, B., and Terraz, T.: Bayesian calibration of a 1D hydrodynamic model used as a rating curve in a tidal river: Application to the Lower Seine River, France, EGU General Assembly 2023, Vienna, Austria, 23–28 Apr 2023, EGU23-6587, https://doi.org/10.5194/egusphere-egu23-6587, 2023. a, b
Ngo, M. T., Lee, J. M., Lee, H. A., and Woo, N. C.: The sustainability risk of Ho Chi Minh City, Vietnam, due to saltwater intrusion, Geosci. J., 19, 547–560, https://doi.org/10.1007/s12303-014-0052-4, 2015. a
Nguyen, A. T., Némery, J., Gratiot, N., Garnier, J., Dao, T. S., Thieu, V., and Laruelle, G. G.: Biogeochemical functioning of an urbanized tropical estuary: Implementing the generic C-GEM (reactive transport) model, Sci. Total Environ., 784, 147261, https://doi.org/10.1016/j.scitotenv.2021.147261, 2021. a
Nguyen, A. T., Némery, J., Gratiot, N., Dao, T.-S., Le, T. T. M., Baduel, C., and Garnier, J.: Does eutrophication enhance greenhouse gas emissions in urbanized tropical estuaries?, Environ. Pollut., 303, 119105, https://doi.org/10.1016/j.envpol.2022.119105, 2022. a
Nguyen, P. T. B., Koedsin, W., McNeil, D., and Van, T. P. D.: Remote sensing techniques to predict salinity intrusion: application for a data-poor area of the coastal Mekong Delta, Vietnam, Int. J. Remote Sens., 39, 6676–6691, https://doi.org/10.1080/01431161.2018.1466071, 2018. a
Nguyen, T. T. N., Némery, J., Gratiot, N., Strady, E., Tran, V. Q., Nguyen, A. T., Aimé, J., and Peyne, A.: Nutrient dynamics and eutrophication assessment in the tropical river system of Saigon – Dongnai (southern Vietnam), Sci. Total Environ., 653, 370–383, https://doi.org/10.1016/j.scitotenv.2018.10.319, 2019. a, b
Orie, A.: Hundreds of thousands of fish die off in Vietnam as heatwave roasts Southeast Asia, CNN, https://edition.cnn.com/2024/05/02/climate/mass-fish-die-off-vietnam-intl-scli/index.html (last access: 14 August 2025), 2024. a
Rodrigues do Amaral, F., Trung, T. N., Pellarin, T., and Gratiot, N.: Datasets of high-resolution water level and discharge from the Saigon-Dong Nai estuary system impacted by a developing megacity, Ho Chi Minh City – Vietnam, Data in Brief, 48, 109147, https://doi.org/10.1016/j.dib.2023.109147, 2023. a
Rodrigues do Amaral, F., Pellarin, T., Tin, T. N., Tu, T. A., and Gratiot, N.: Enhancing discharge estimation from SWOT satellite data in a tropical tidal river environment, PLOS Water, 3, e0000226, https://doi.org/10.1371/journal.pwat.0000226, 2024a. a
Rodrigues Do Amaral, F., Camenen, B., Nguyen T. T., Anh Tu, T., Pellarin, T., and Gratiot, N.: Water discharge and water level output from the MAGE 1D hydrodynamic model for the Saigon and Dongnai rivers, Vietnam, 2016–2022, DataSuds, V1, UMR IGE [data set], https://doi.org/10.23708/KLQMSR, 2024b. a
Rouby, P.-A., Camenen, B., Pénard, L., Kieffer, L., and Terraz, T.: Pamhyr2: A Graphical User Interface for 1D Hydro-Sedimentary Modelling of Rivers, in: Advances in Hydroinformatics – SimHydro 2023 Volume 2, Springer, Singapore, 485–497, ISBN 978-981-97-4076-5, https://doi.org/10.1007/978-981-97-4076-5_33, 2024. a
Ruhl, C. and Simpson, M.: Computation of discharge using the index-velocity method in tidally affected areas, Scientific Investigations Report, https://www.semanticscholar.org/paper/Computation-of-discharge-using-the-index-velocity-Ruhl-Simpson/ (last access: 9 September 2025), 2005. a
Scheiber, L., Hoballah Jalloul, M., Jordan, C., Visscher, J., Nguyen, H. Q., and Schlurmann, T.: The potential of open-access data for flood estimations: uncovering inundation hotspots in Ho Chi Minh City, Vietnam, through a normalized flood severity index, Nat. Hazards Earth Syst. Sci., 23, 2313–2332, https://doi.org/10.5194/nhess-23-2313-2023, 2023. a, b
Souhar, O. and Faure, J.-B.: Approach for uncertainty propagation and design in Saint Venant equations via automatic sensitive derivatives applied to Saar river, Can. J. Civ. Eng., 36, 1144–1154, https://doi.org/10.1139/L09-057, 2009 (data available at: https://gitlab.irstea.fr/jean-baptiste.faure/MAGE, last access: 4 April 2024). a, b
Vachaud, G., Quertamp, F., Phan, T. S. H., Tran Ngoc, T. D., Nguyen, T., Luu, X. L., Nguyen, A. T., and Gratiot, N.: Flood-related risks in Ho Chi Minh City and ways of mitigation, J. Hydrol., 573, 1021–1027, https://doi.org/10.1016/j.jhydrol.2018.02.044, 2019. a
van Emmerik, T., Strady, E., Kieu-Le, T.-C., Nguyen, L., and Gratiot, N.: Seasonality of riverine macroplastic transport, Sci. Rep., 9, 13549, https://doi.org/10.1038/s41598-019-50096-1, 2019. a
Virtanen, P., Gommers, R., Oliphant, T. E., Haberland, M., Reddy, T., Cournapeau, D., Burovski, E., Peterson, P., Weckesser, W., Bright, J., van der Walt, S. J., Brett, M., Wilson, J., Millman, K. J., Mayorov, N., Nelson, A. R. J., Jones, E., Kern, R., Larson, E., Carey, C. J., Polat, İ., Feng, Y., Moore, E. W., VanderPlas, J., Laxalde, D., Perktold, J., Cimrman, R., Henriksen, I., Quintero, E. A., Harris, C. R., Archibald, A. M., Ribeiro, A. H., Pedregosa, F., van Mulbregt, P., and SciPy 1.0 Contributors: SciPy 1.0: Fundamental Algorithms for Scientific Computing in Python, Nature Methods, 17, 261–272, https://doi.org/10.1038/s41592-019-0686-2, 2020. a
Wood, M., Haigh, I. D., Le, Q. Q., Nguyen, H. N., Tran, H. B., Darby, S. E., Marsh, R., Skliris, N., Hirschi, J. J.-M., Nicholls, R. J., and Bloemendaal, N.: Climate-induced storminess forces major increases in future storm surge hazard in the South China Sea region, Nat. Hazards Earth Syst. Sci., 23, 2475–2504, https://doi.org/10.5194/nhess-23-2475-2023, 2023. a
Xu, H., Tian, Z., Sun, L., Ye, Q., Ragno, E., Bricker, J., Mao, G., Tan, J., Wang, J., Ke, Q., Wang, S., and Toumi, R.: Compound flood impact of water level and rainfall during tropical cyclone periods in a coastal city: the case of Shanghai, Nat. Hazards Earth Syst. Sci., 22, 2347–2358, https://doi.org/10.5194/nhess-22-2347-2022, 2022. a
Zakharova, E., Nielsen, K., Kamenev, G., and Kouraev, A.: River discharge estimation from radar altimetry: Assessment of satellite performance, river scales and methods, J. Hydrol., 583, 124561, https://doi.org/10.1016/j.jhydrol.2020.124561, 2020. a
- Abstract
- Introduction
- Materials and methods
- Results
- Discussion and conclusions
- Appendix A: MAGE model boundary conditions
- Appendix B: Calibration results: rRMSE and R2
- Appendix C: Validation results: R2
- Code and data availability
- Author contributions
- Competing interests
- Disclaimer
- Acknowledgements
- Review statement
- References