the Creative Commons Attribution 4.0 License.
the Creative Commons Attribution 4.0 License.
 | 09 Sep 2025
Rain-on-snow events in mountainous catchments under climate change
Ondrej Hotovy
Ondrej Nedelcev
Jan Seibert
Michal Jenicek
The frequency and intensity of rain-on-snow (RoS) events are expected to change in response to climate variations due to changes in precipitation, increases in air temperature, and subsequent changes in the snow cover. In this study, we attributed these changes to the simulated variations in RoS events using a sensitivity analysis of precipitation and air temperature and subsequent effects on RoS-related runoff responses. We selected 93 mountainous catchments located in central Europe across Czechia (60), Switzerland (26), and Germany (7) and used a conceptual hydrological model to simulate runoff components for 24 climate perturbations relative to the reference period 1980–2010. Climate change-driven RoS changes were highly variable over regions, across elevations, and within the cold season. The warmest perturbations suggested a decrease in RoS days by about 75 % for the Czech catchments. In contrast, the Swiss catchments may respond less sensitively, with the number of RoS days even increasing, specifically during winter and at higher elevations. Our results also suggested that the RoS contribution to annual runoff will be considerably reduced from the current 10 % to 2 %–4 % for the warmest perturbations in Czechia and from 18 % to 5 %–9 % in Switzerland. However, the RoS contribution to runoff may increase in winter months, especially for perturbations, leading to an increase in precipitation and demonstrating the joint importance of air temperature and precipitation for future hydrological behaviour in snow-dominated catchments.
- Article
(6663 KB) - Full-text XML
-
Supplement
(902 KB) - BibTeX
- EndNote


Rain-on-snow (RoS) events threaten society and nature in regions vulnerable to such, often extreme, hydrometeorological events. During RoS events, rain falls on snow and intensifies turbulent, latent, and sensible heat fluxes within the snowpack, substantially accelerating snowmelt (Garvelmann et al., 2014; Hotovy and Jenicek, 2020). Although most of these events do not directly lead to severe flooding, since the snowpack, particularly fresh snow, can store large amounts of rainwater (Juras et al., 2021; Wayand et al., 2015), under certain conditions, these events can also trigger excessive runoff and widespread floods (Berghuijs et al., 2019; Brunner and Fischer, 2022). Elevated runoff generated by RoS is often more intense and short-lived than the thermally driven types of snowmelt and related runoff, along with lower groundwater recharge and infiltration (Earman et al., 2006; Parajka et al., 2019). Thus, such events can affect water supplies and lead to snow drought. Moreover, RoS events affect important parameters and mechanisms within the snowpack, including changes in snowpack saturation, an increase in liquid water content, and a decrease in snow albedo, which enhances the energy absorption of the snow. These effects can persist for several days after the rainfall event and further accelerate snowmelt (Yang et al., 2023).
The occurrence and intensity of RoS events have been widely studied in recent years, particularly in the Northern Hemisphere. Although the topic is gaining scientific interest, the complex RoS processes are still on the list of unsolved problems in hydrology proposed by Blöschl et al. (2019), particularly due to their uncertain effects on runoff. The specific question of why, how, and when rain-on-snow events produce exceptional runoff posed in this study remains unclear yet relevant because of the important role of this kind of flood mechanism in many parts of the world (Mccabe et al., 2007).
The most vulnerable regions of the world experience more than 10 RoS events per year (Suriano, 2022). Recent studies have mainly addressed catchments in North America (Bieniek et al., 2018; Crawford et al., 2020; Grenfell and Putkonen, 2008; Musselman et al., 2018), where maximum daily runoff is associated with RoS events mainly (80 % of the time) between January and May (Il Jeong and Sushama, 2017). Several studies have been conducted in Siberia (Bartsch et al., 2010), Scandinavia (Mooney and Li, 2021; Pall et al., 2019; Poschlod et al., 2020), central Europe (Freudiger et al., 2014; Hotovy et al., 2023; Juras et al., 2021; Schirmer et al., 2022), high mountain Asia (Maina and Kumar, 2023; Yang et al., 2022), and in the terrestrial Arctic (Bartsch et al., 2023).
Despite the increasing scientific interest, future changes in RoS events remain uncertain (López-Moreno et al., 2021; Schirmer et al., 2022). The real impact of climate change on RoS events and related hydrologic implications remains unclear, mainly due to their complex nature (Mooney and Li, 2021; Myers et al., 2023; Sezen et al., 2020) since the overall behaviour of RoS is influenced by various climatic factors, particularly by the fluctuations in air temperature and rainfall intensity and their interactions with specific processes within the snowpack. These compounded uncertainties from rainfall estimates and snowmelt volume make predictions of future RoS changes in complex climate models highly uncertain.
The frequency and intensity of RoS occurrence are expected to change in response to climate variations, including the distribution, intensity, and phase of precipitation (Blahušiaková et al., 2020; Li et al., 2020; Musselman et al., 2018), as well as the expected increase in air temperature and consequent changes in the snow cover (Jennings et al., 2018; Sezen et al., 2020). Snow-related changes will likely become the primary driver of interannual variations in RoS events (Suriano, 2022). Many studies predict a significant decrease in snow storage amounts and duration in the future (Hale et al., 2023; Jenicek et al., 2021; Nedelcev and Jenicek, 2021; Notarnicola, 2020), which is confirmed by observed snow cover duration (Urban et al., 2023). These changes are expected to be important factors for future RoS occurrences.
Recent studies have also shown that variations in the spatial and temporal distribution of RoS can be an important differentiator for the behaviour and the occurrence of RoS. As Hotovy et al. (2023) investigated, various trends in RoS days were identified for specific months of the winter season at different elevations. The largest decrease was observed at lower elevations towards the end of winter, likely due to a shortening of the period with snow cover on the ground. Similar findings were presented by Beniston and Stoffel (2016), Li et al. (2019), López-Moreno et al. (2021), and Mooney and Li (2021). In contrast, the largest increase was found at higher elevations throughout the winter (Morán-Tejeda et al., 2016; Musselman et al., 2018; Ohba and Kawase, 2020; Sezen et al., 2020; Trubilowicz and Moore, 2017). These changes can be associated with more frequent rainfall during the cold season, triggered by increasing air temperature (Il Jeong and Sushama, 2017; Mooney and Li, 2021).
Although several studies focusing on changes in RoS related to climate change have been carried out, there is still limited knowledge of the role of different climate variables, primarily potential increases in air temperature and possible fluctuations in rainfall and snowfall frequencies, controlling the RoS behaviour and dynamics of the RoS-driven runoff responses. There is a lack of studies analysing both changes in RoS and the related runoff responses. Moreover, most European studies have had a limited focus on elevation, which significantly influences snow cover and precipitation phase and consequently affects RoS occurrence. Analysing the combined effect of an increase in temperature and changes in precipitation is crucial since some studies have shown that the snow decrease caused by the increase in temperature may be partly offset by the increase in precipitation (Jenicek et al., 2021).
In this study, we present differences between commonly analysed catchments within the Alpine region and relatively scarce low-elevation locations outside of this mountain range, representing the areas in the rain–snow transition zones where the largest changes in snow storage typically occur. Analysing runoff responses driven by extreme meteorological events within transition zones is a valuable contribution of this paper, as runoff uncertainty induced by transition elevation is more pronounced during larger precipitation events (Cui et al., 2023). The detailed temporal and spatial analyses of the effect of climate change on RoS behaviour are also limited. However, understanding these changes and drivers is crucial to future water management strategies to mitigate risks and impacts associated with RoS events. To address the above research gaps, the objectives of this study are (1) to attribute changes in selected climate variables to simulated changes in RoS events using a sensitivity analysis of precipitation and air temperature and (2) to evaluate subsequent changes in RoS-related runoff responses.
2.1 Study catchments
The study included 93 mountainous catchments in two regions within central Europe (Fig. 1). All study catchments with selected physical and climate characteristics are listed in Table S1 in the Supplement. The first regional dataset (CZ IDs) consists of 60 catchments in 6 different mountain ranges in Czechia and an additional 7 catchments in the eastern German states of Bavaria and Saxony located within the same cross-border mountain ranges. The original dataset of 40 catchments used in Hotovy et al. (2023) and Nedelcev and Jenicek (2021) was extended by 27 catchments in this study. The second regional dataset (CH IDs) includes 26 Swiss catchments in 3 parts of the Alps. For Switzerland, four catchments were added to the dataset used by Girons Lopez et al. (2020).
These mountainous catchments were selected because they are affected by snow, show near-natural runoff regimes, and have no glacierized areas. Catchment areas range from 1.8 to 478 km2. The mean catchment elevation ranges from 491 to 2434 m a.s.l. The catchments in Czechia and Germany (CZ) generally represent lower elevations than the Swiss catchments (CH). Annual mean air temperature varies from −0.9 to 8.9 °C. Annual precipitation totals range from 728 to 2187 mm. See Table S1 for more details at the catchment level.
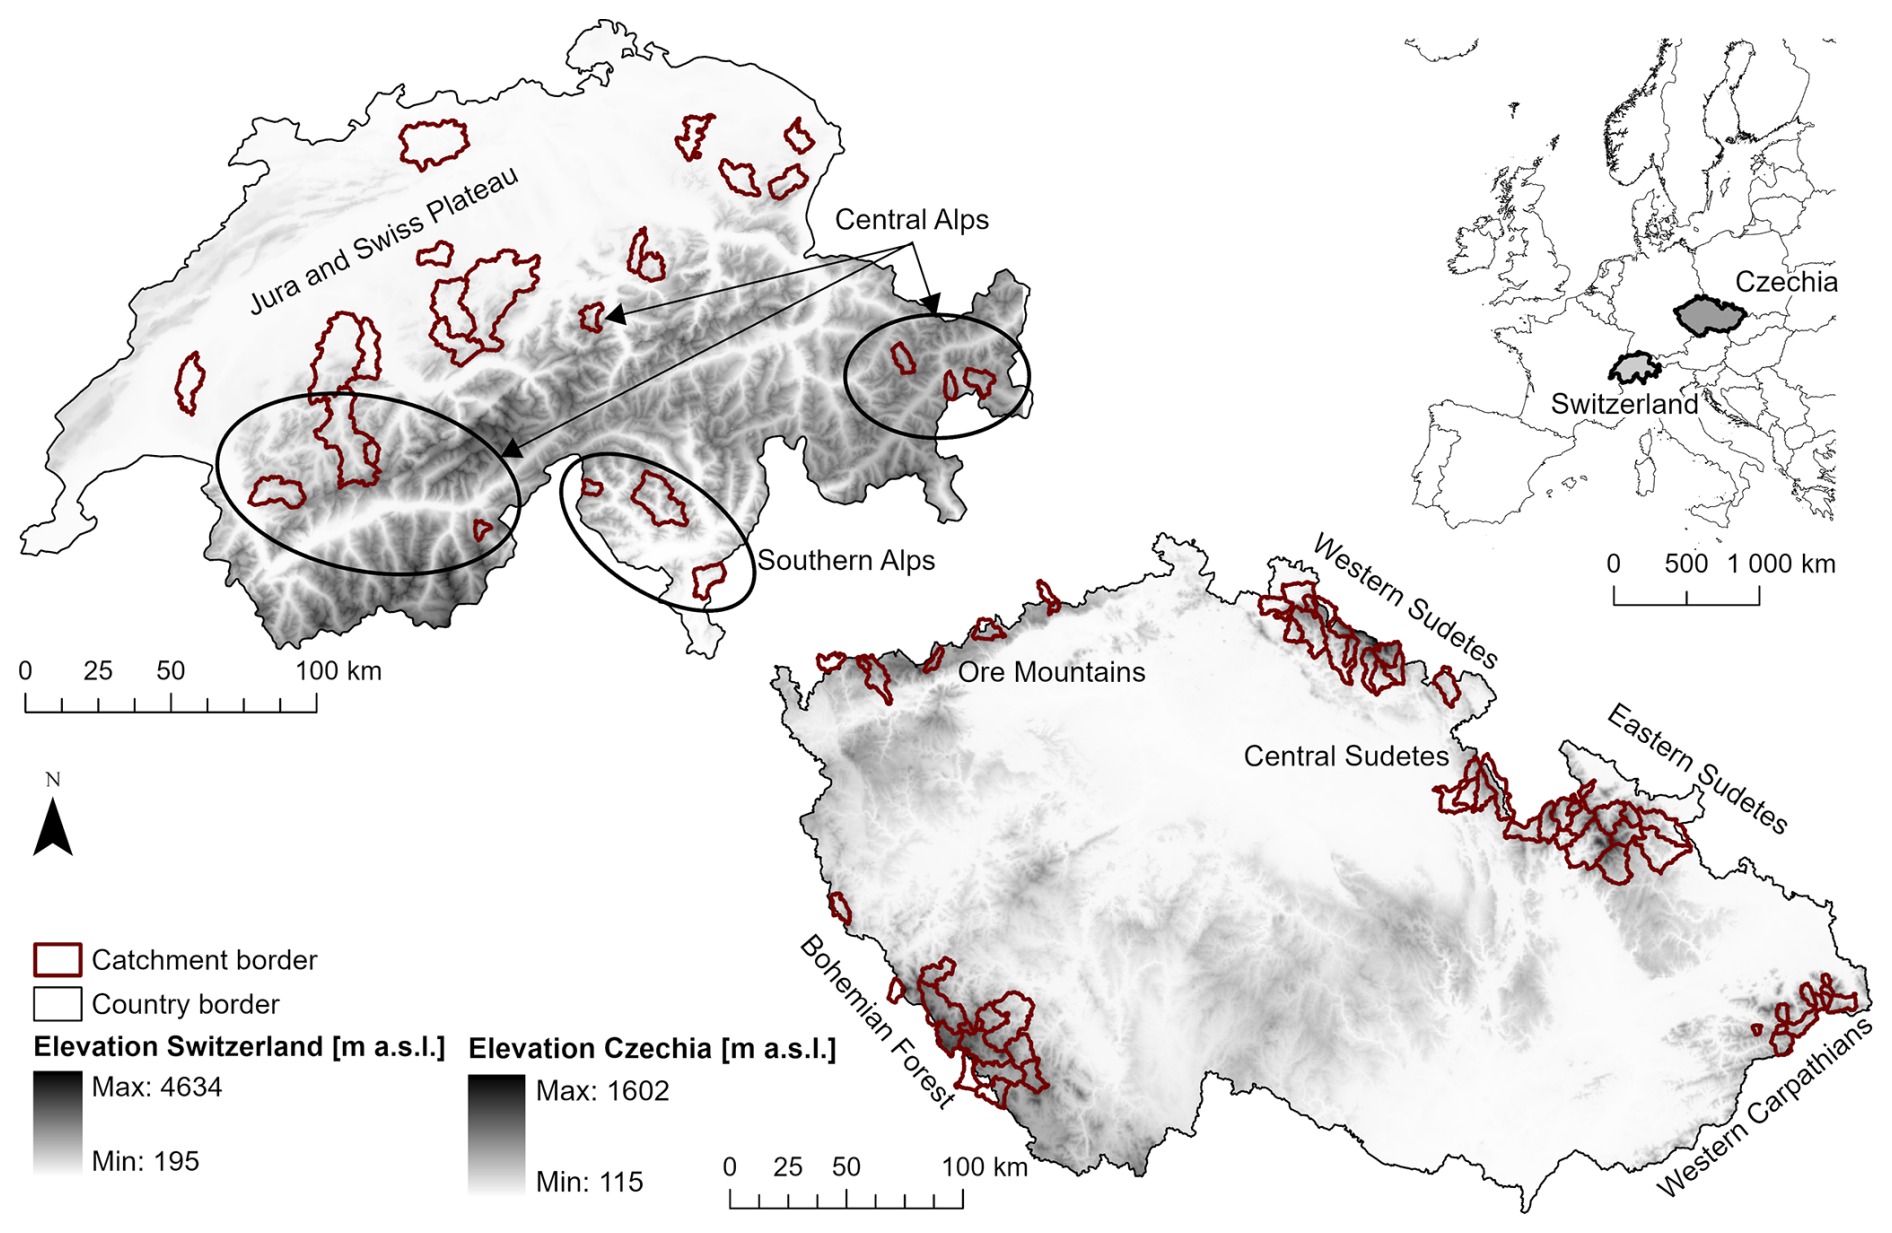
Figure 1Location of study catchments in Czechia, Germany, and Switzerland.
2.2 Data
For runoff simulations (Sect. 2.3), a time series of daily mean air temperature, precipitation sums, mean discharge, and weekly snow water equivalent (SWE) estimates were collected. Station data for the Czech catchments were available from meteorological and hydrological stations operated by the Czech Hydrometeorological Institute (CHMI). If such a station was unavailable within a given catchment area, the nearest station representing similar conditions and elevations was used (located up to 20 km from the catchment border and within the elevation range of the specific catchment). For the German catchments, datasets on temperature and precipitation from the open-source database provided by the German Weather Service (DWD) were used. Discharge data were available from the regional ministries – Landesamt für Umwelt, Landwirtschaft und Geologie (LFULG) for catchments in Saxony (IDs CZ-201, 204–206) and Gewässerkundlicher Dienst Bayern (GDB) for catchments in Bavaria (IDs CZ-101, 102, 112). Temperature and precipitation data for this dataset cover the period 1965–2019. Mean daily discharge and weekly SWE data (taken from the nearest Czech stations) were available from 1980–2014.
Data provided by the Swiss Federal Office of Meteorology and Climatology (MeteoSwiss) were used for analyses within the Swiss catchments. The MeteoSwiss gridded data product covers the entire territory of Switzerland. Data have been available since 1965 with a spatial resolution of 2 km (RhiresD product for precipitation, TabsD product for air temperature). We used these data to calculate the mean daily air temperature and precipitation for each catchment. Hydrological data used for the analyses were provided by the Swiss Federal Office for the Environment (FOEN). The mean daily SWE for each catchment was calculated based on a gridded product (1 km spatial resolution) combining snow depth station data and a snow density model (Magnusson et al., 2014; Mott et al., 2023).
2.3 HBV model
To derive individual components of the rainfall-runoff process for the reference period 1980–2010 (30 cold seasons) and to subsequently detect RoS events (Sect. 2.4), a semi-distributed bucket-type HBV model (Lindström et al., 1997; Seibert and Bergström, 2022) in its software implementation “HBV-light” (Seibert and Vis, 2012) was used in this study. The model inputs consist of catchment means of daily air temperature, daily precipitation, and monthly potential evapotranspiration (PET), which is transformed by the model to daily data using linear interpolation. The temperature-based method defined by Oudin et al. (2005) was used to calculate PET.
The model is composed of four routines, including a snow routine that simulates snow accumulation and snowmelt using a degree-day approach, taking the potential refreezing of meltwater and snow water holding capacity into account. The precipitation phase is distinguished by a single threshold temperature (TT) approach. The TT values were calibrated separately for each catchment in this study, ranging from −1.66 to 1.16 °C across the Czech catchments and from −1.92 to 1.63 °C for the Swiss catchments. For the snowmelt calculation, the most important parameter is the melt (degree-day) factor which was calibrated by the model. In addition to the snow routine, a soil moisture routine calculates groundwater recharge and actual evapotranspiration (AET) as a function of the soil moisture. Runoff from two groundwater boxes is simulated by a groundwater routine, from which baseflow is directly calculated by the model. A routing routine calculates the propagation of runoff through the catchment using a triangular function.
Each catchment was split into elevation zones of 100 m. This enables the simulation of some of the characteristics separately for these elevation zones, specifically precipitation, air temperature (using calibrated lapse rates), SWE, snowmelt, soil moisture, AET, and groundwater recharge. For details of the model structure and routines, see Seibert and Vis (2012).
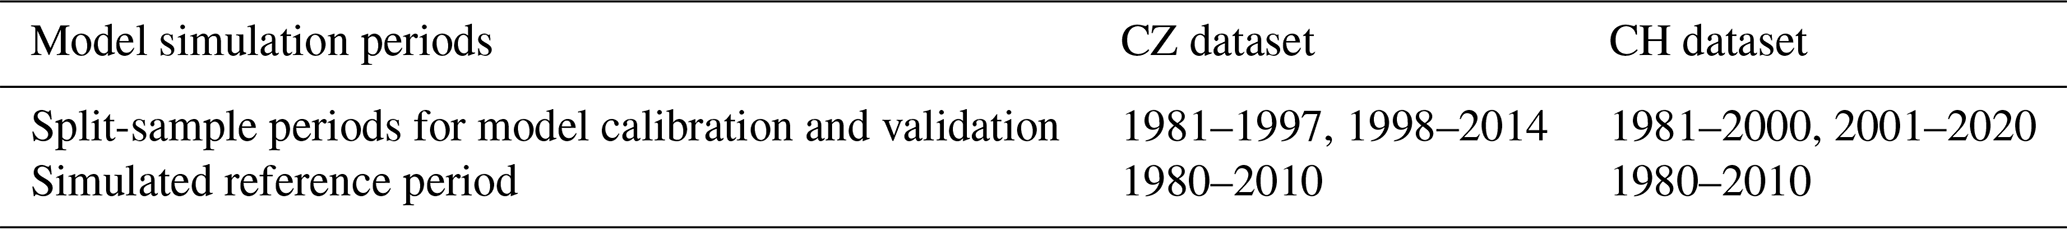
The HBV model was calibrated automatically against the observed mean daily runoff and SWE for each study catchment using a genetic algorithm in 100 independent calibration trials. Since the genetic algorithm contains stochastic elements, each calibration trial will result in different optimized parameter sets, especially if there is significant parameter uncertainty (equifinality) (Beven, 2021). Following a split-sample approach, the period was divided into calibration and validation windows for both regional datasets (Table 1). As an objective function, a weighted mean of the NSE (the Nash–Sutcliffe model efficiency coefficient) based on the logarithmic runoff series (60 %), the volume error (20 %), and the NSE based on the logarithmic SWE series (20 %) was used along with a combination of several objective criteria, which were used for the evaluation of the goodness of fit of the model.
This model setup was similar to the approach used in previous studies, e.g. Girons Lopez et al. (2020) or Seibert and Vis (2012), with various model testing studies carried out, including studies evaluating the overall model performance, e.g. Jenicek and Ledvinka (2020), Nedelcev and Jenicek (2021), or more specific studies assessing the RoS occurrence and SWE, based on model simulations (Hotovy et al., 2023). The model results were published as an open dataset (Jenicek et al., 2024).
2.4 RoS day and RoS event identification
Selection criteria were defined to identify individual RoS days, when rainfall and snow cover occur together. Thus, a RoS day was identified when the following conditions were fulfilled:
-
Precipitation occurred on days with mean temperatures above the threshold temperature TT (and, thus, being assumed to be rain), with intensities of at least 5 mm d−1 (i.e. excluding drizzle or negligible amounts). Note that the calibration of the TT parameter was a part of the general calibration process described in Sect. 2.3.
-
Simulated mean SWE for a given day reaching at least 10 mm, detecting the thick snowpack layer on the ground.
In addition to the RoS day definition mentioned above, multi-day RoS periods, referred to as RoS events here, were identified at a catchment scale to assess hydrological implications and changes in a hydrological response caused by such RoS events. In this study, RoS events were defined as multi-day events, which start from the initial RoS day (the first day when both conditions given above were met) and end day, when the first local maximum runoff was simulated. Multi-day RoS events may include both RoS days and non-RoS days since the first local maximum runoff may appear several days after initial rainfall, and some non-RoS days may occur within the defined time frame. The maximum RoS-driven response time was limited to 6 d, similar to Freudiger et al. (2014). RoS events were defined in the same way as in Hotovy et al. (2023) and were used for hydrological response analyses (Sects. 2.6 and 3.7).
2.5 Sensitivity to climatic variations
A sensitivity analysis assessed how incremental changes in climate variables affect RoS occurrence and their runoff response. In this study, we modified two main climate parameters governing snow storage and RoS events – air temperature (T) and precipitation (P) – to systematically investigate the sensitivity of catchment response. The modifications consider future changes in these climate variables projected for the central European region by climate models (Gutiérrez et al., 2021). A total of 24 combinations (climate perturbations) of increasing air temperature and precipitation change were used for simulations relative to the reference conditions (hereafter referred to as T0_P1). The referenced (current) air temperature (T0) was manually increased by 1–4 °C (T1, T2, T3, T4), and changes in precipitation from a 20 % decrease to a 20 % increase were applied (P08 = −20 %, P09 = −10 %, P11 = +10 %, P12 = +20 %). These 24 combinations cover most of the projected changes in air temperature and precipitation from less warm to warm and from dry to wet conditions. Mean air temperatures and precipitation totals for all catchments in both regions are listed in Table S1 in the Supplement. Temperature and precipitation modifications were applied to the entire daily data series.
2.6 Assessment of RoS-related variables
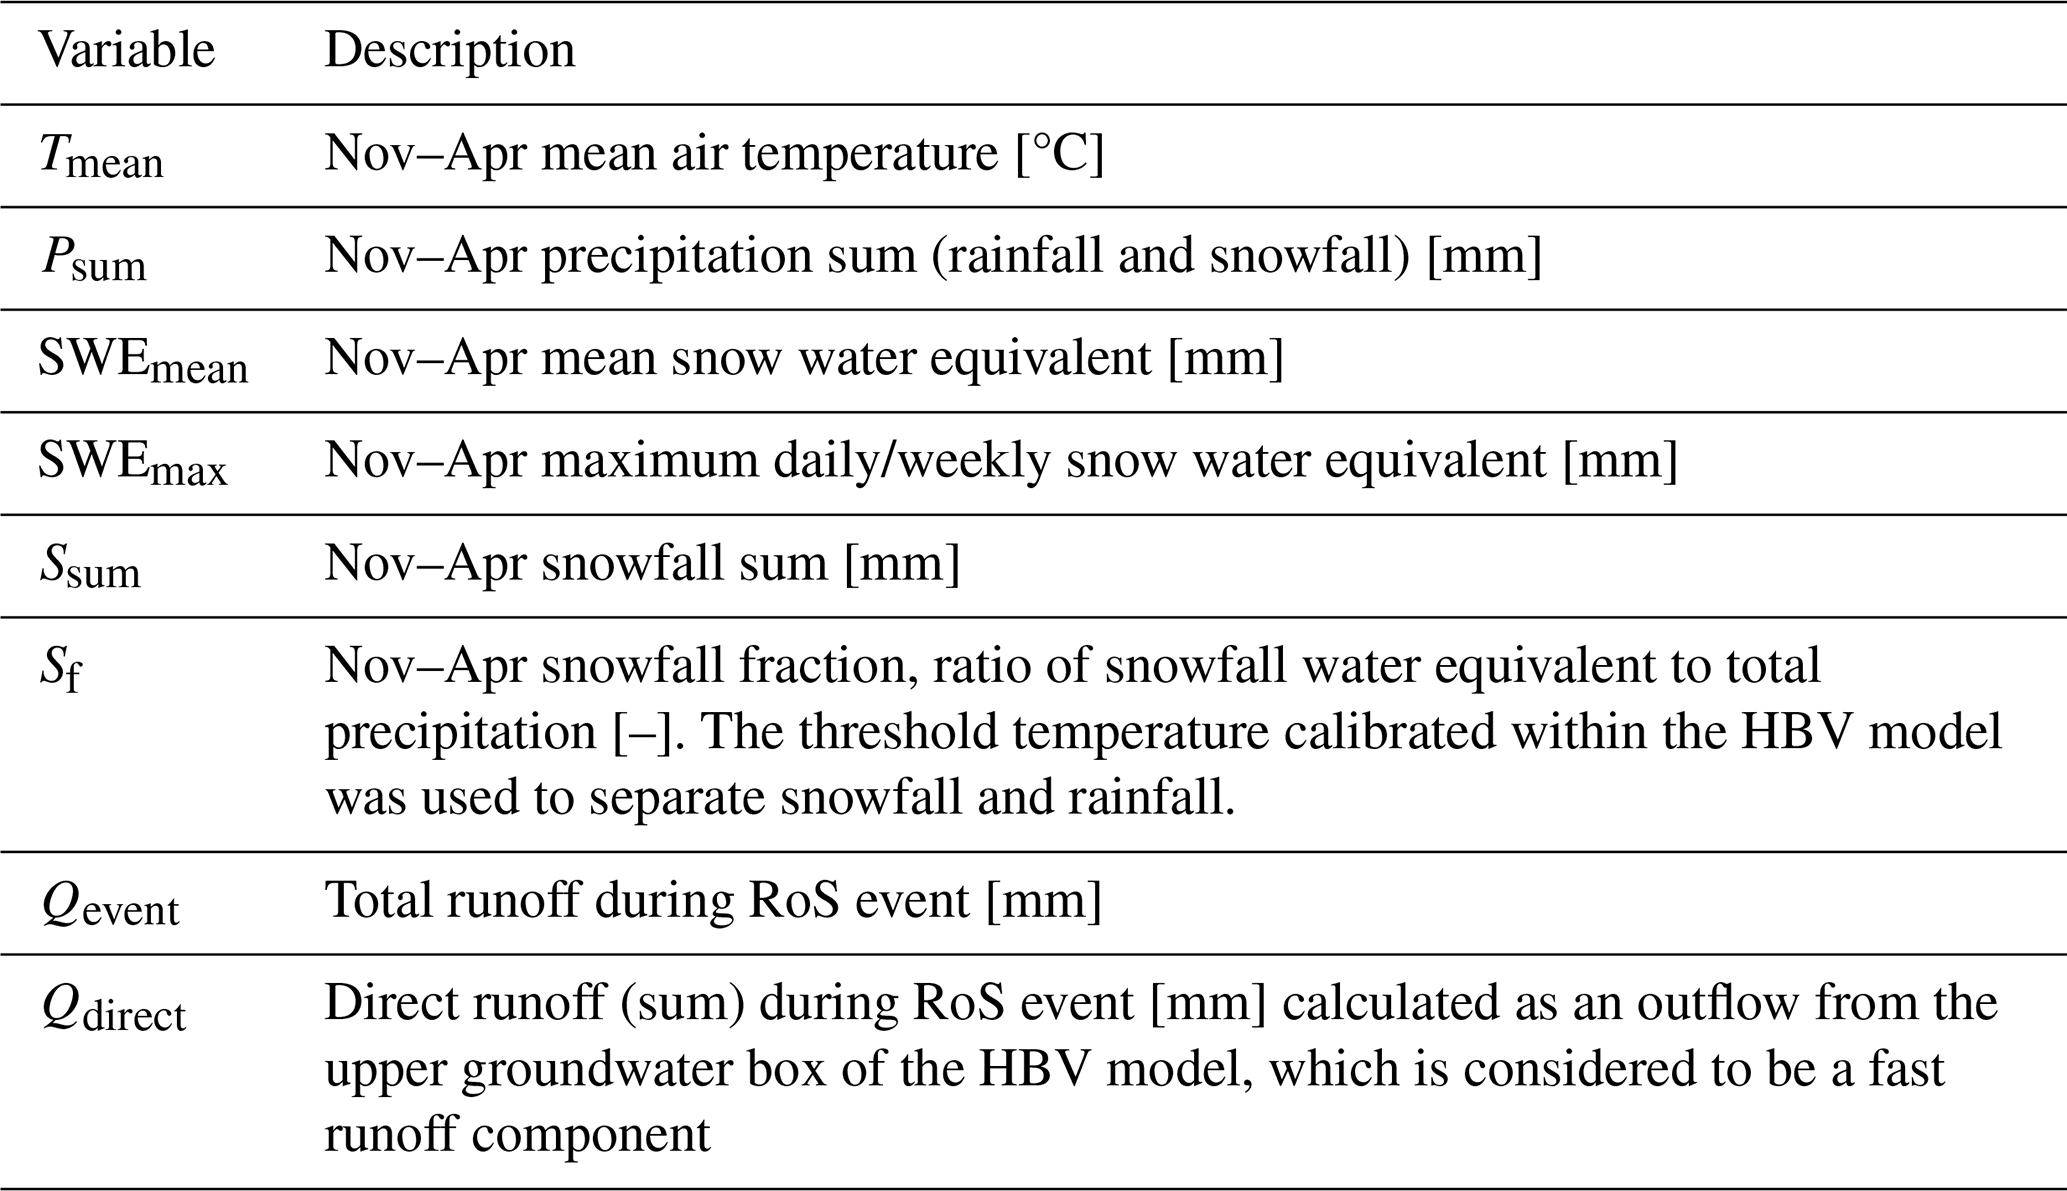
As a basis for further analyses, several hydroclimatic statistics (Table 2) were calculated from simulations for each catchment (67+26 catchments) and all 25 perturbations. These statistics included mean seasonal (November–April) air temperatures (Tmean), precipitation sums (Psum), annual mean snow water equivalents (SWEmean), annual maximum snow water equivalents (SWEmax), the annual sum of snowfall (Ssum), and annual snowfall fraction (Sf). These annual or seasonal values were then correlated with the number of RoS days. For this, Spearman's correlation coefficient was used to detect mutual correlations between variables, as the variables were not normally distributed based on the results of a Shapiro–Wilk test. Correlation analyses were performed based on all 25 perturbations, averaged per catchment, separately for each of the two main geographical regions. Table S2 in the Supplement shows modelled values of all variables for distinct perturbations.
To evaluate the RoS-related hydrological response and its changes for all climate perturbations, the total runoff (Qevent) during RoS events was calculated, and the total direct runoff (Qdirect) was calculated for each RoS event (Table 2). A fraction of the total runoff during RoS events to the total runoff was then calculated to describe the relative contribution of the RoS runoff to the total catchment runoff. Moreover, the relative changes in the total direct runoff were evaluated for individual perturbations.
Table 2List of climate and snow variables and hydrological parameters used in the analyses.
3.1 HBV model evaluation
Overall model performance was evaluated using a combination of selected goodness-of-fit criteria with different weights (Fig. 2). The median objective function value resulting from 100 parameter sets was 0.76 for model calibration for the Czech catchments and 0.83 for the Swiss catchments (values ranged from 0.56 to 0.86 and 0.70 to 0.87 respectively). Results for model validation reached 0.70 for the Czech catchments and 0.79 for the Swiss catchments (values ranged from 0.44 to 0.86 and 0.68 to 0.85 respectively). Note that a value of 1 represents a perfect fit of the model. More model testing of SWE simulations and RoS occurrence was carried out by Hotovy et al. (2023), Jenicek et al. (2021), and Nedelcev and Jenicek (2021), who all worked with a similar set of catchments in their studies. Hotovy et al. (2023) also tested the HBV model performance during RoS events. They concluded that the HBV model, despite its conceptualization of the snowmelt process, may be used for RoS analyses, specifically for assessing interannual variability and trends of RoS events.
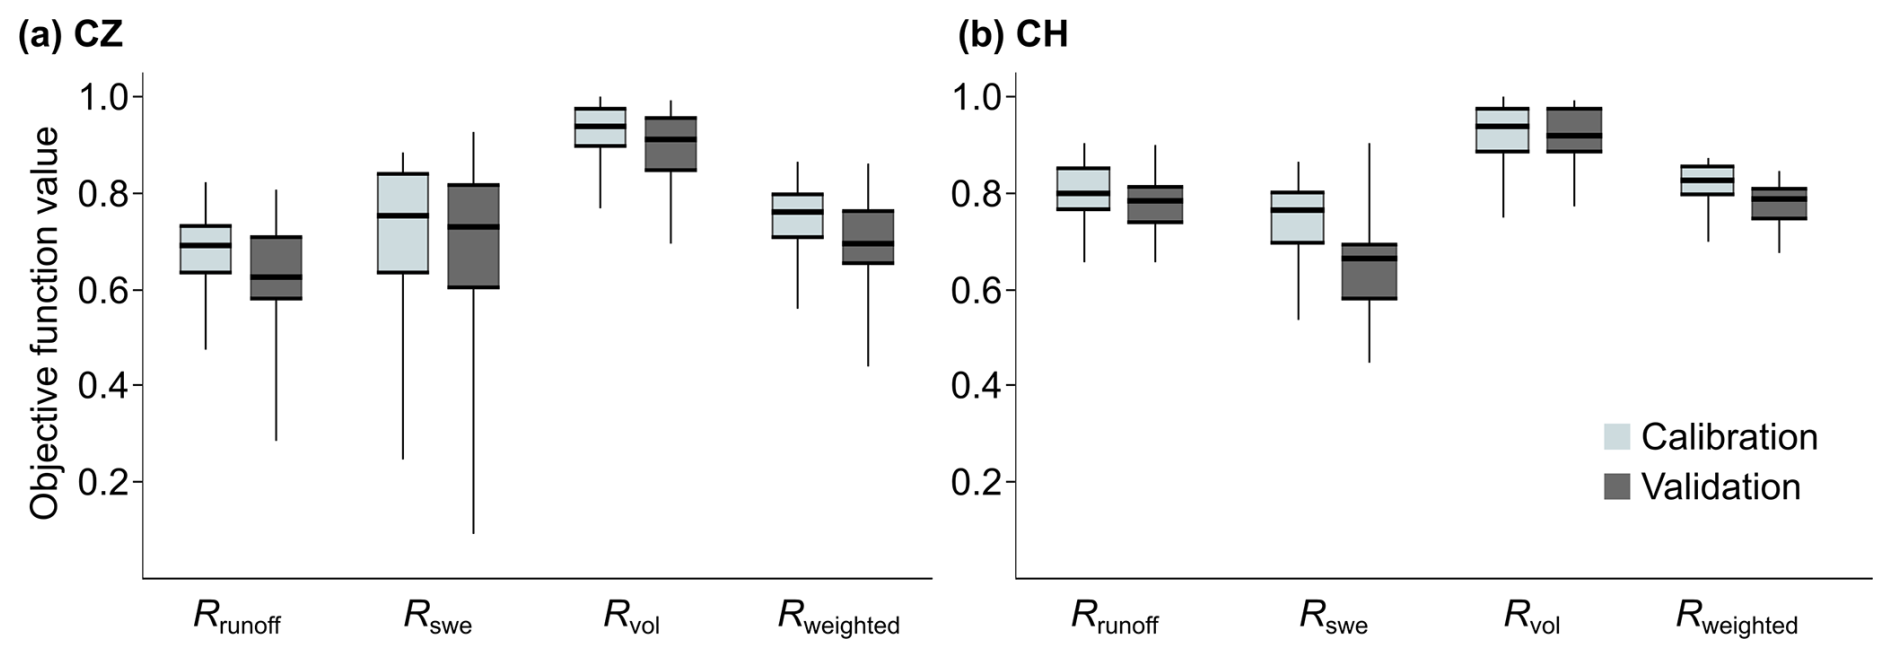
Figure 2Model performance for all 93 study catchments within both Czech (a) and Swiss (b) regions evaluated by the combination of selected objective criteria, including the logarithmic Nash–Sutcliffe efficiency for runoff (Rrunoff), Nash–Sutcliffe efficiency for SWE (Rswe), and volume error (Rvol). These criteria were weighted (Rweighted) to calculate the overall objective function of the model. Boxplots represent the variation among catchments, with the 25th and 75th percentiles within a box, the median as a thick line, and the whiskers representing maximum and minimum values.
3.2 RoS day occurrence
According to the RoS day definition given in Sect. 2.4, RoS occurrence within individual study catchments and elevations is shown in Fig. 3. The displayed values represent the annual number of RoS days during 30 cold seasons (1980–2010), corresponding to the RoS frequency under the reference conditions T0_P1. Values shown in Fig. 3 are valid for mean elevations of individual catchments.
The total number of RoS days for each catchment varied from 31 to 1554 in the entire study period. The lowest occurrence was observed at Blanice catchment (CZ-115), where only 1 RoS day occurred each season on average. In contrast, the Sitter catchment (CH-114) experienced frequent RoS with 52 d each season on average. Generally, the highest number of RoS days appeared within the elevation range of 1000–2000 m a.s.l., including high-elevation Swiss catchments. RoS days occurred less frequently at lower elevations, typically for the Czech catchments, which experienced the shorter snow season. The number of RoS days decreased at those catchments with the highest mean elevation, likely due to the lack of rainfall during the winter season (results not shown). Distinct catchments saw the average RoS occurrence at different times of the year from mid-January to mid-May, reflecting the increase in elevation.
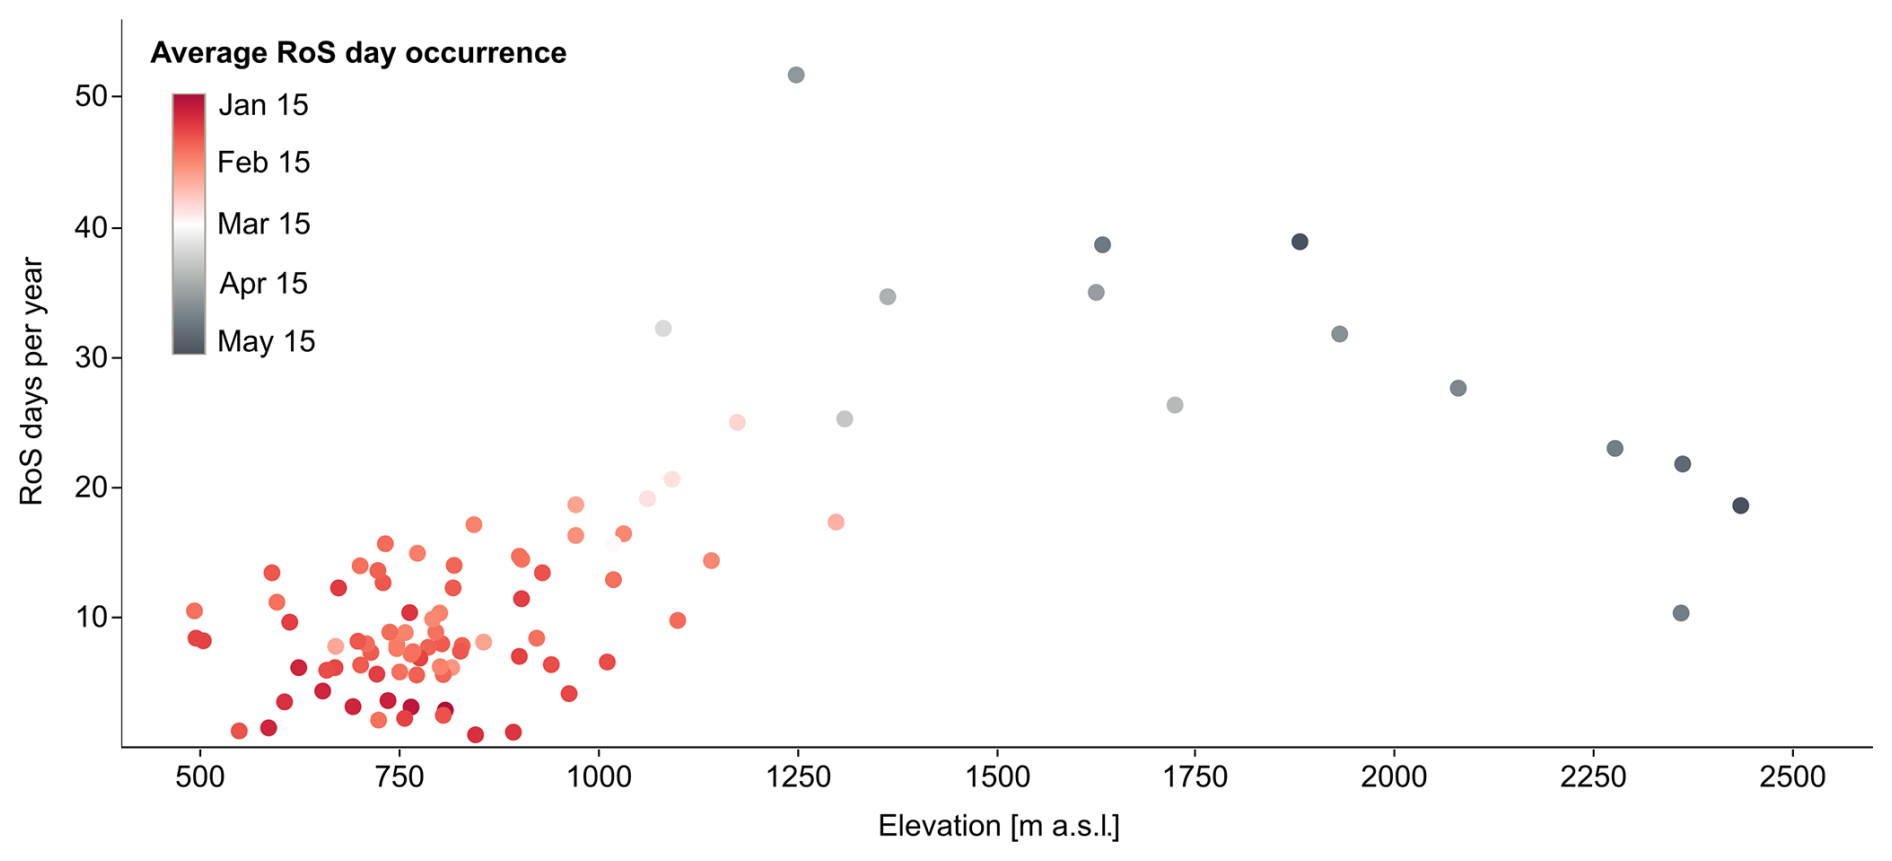
Figure 3The annual mean number of RoS days in all 93 study catchments between 1980 and 2010, corresponding to the reference conditions T0_P1. Each dot represents one catchment and is coloured according to the average RoS occurrence throughout the year. Individual catchments are characterized by mean catchment elevation (shown in Table S1).
3.3 Regional changes in RoS days for different climate perturbations
The numbers of annual RoS days were found to vary regionally and for the 25 perturbations (Fig. 4). The changes in the median values of all catchments within each region suggest that only four perturbations for the Czech dataset, and five perturbations for the Swiss dataset, will lead to an increase in the number of RoS days. The number of RoS days increased only for the perturbations with a 1 °C temperature increase combined with a precipitation increase (perturbations T0_P11, T0_P12, T1_P11, and T1_P12). In most of the perturbations, the number of RoS days is expected to decline (Fig. 4a and c), especially for perturbations with a relatively large temperature increase amplified by precipitation decrease. Perturbations with a temperature increase of 4 °C suggested a decrease in RoS days by about 75 % for the Czech catchments (Fig. 4b). For the high-elevation Swiss catchments, the number of RoS days decreased less (Fig. 4d). However, there were large variations among the individual study catchments in each region.
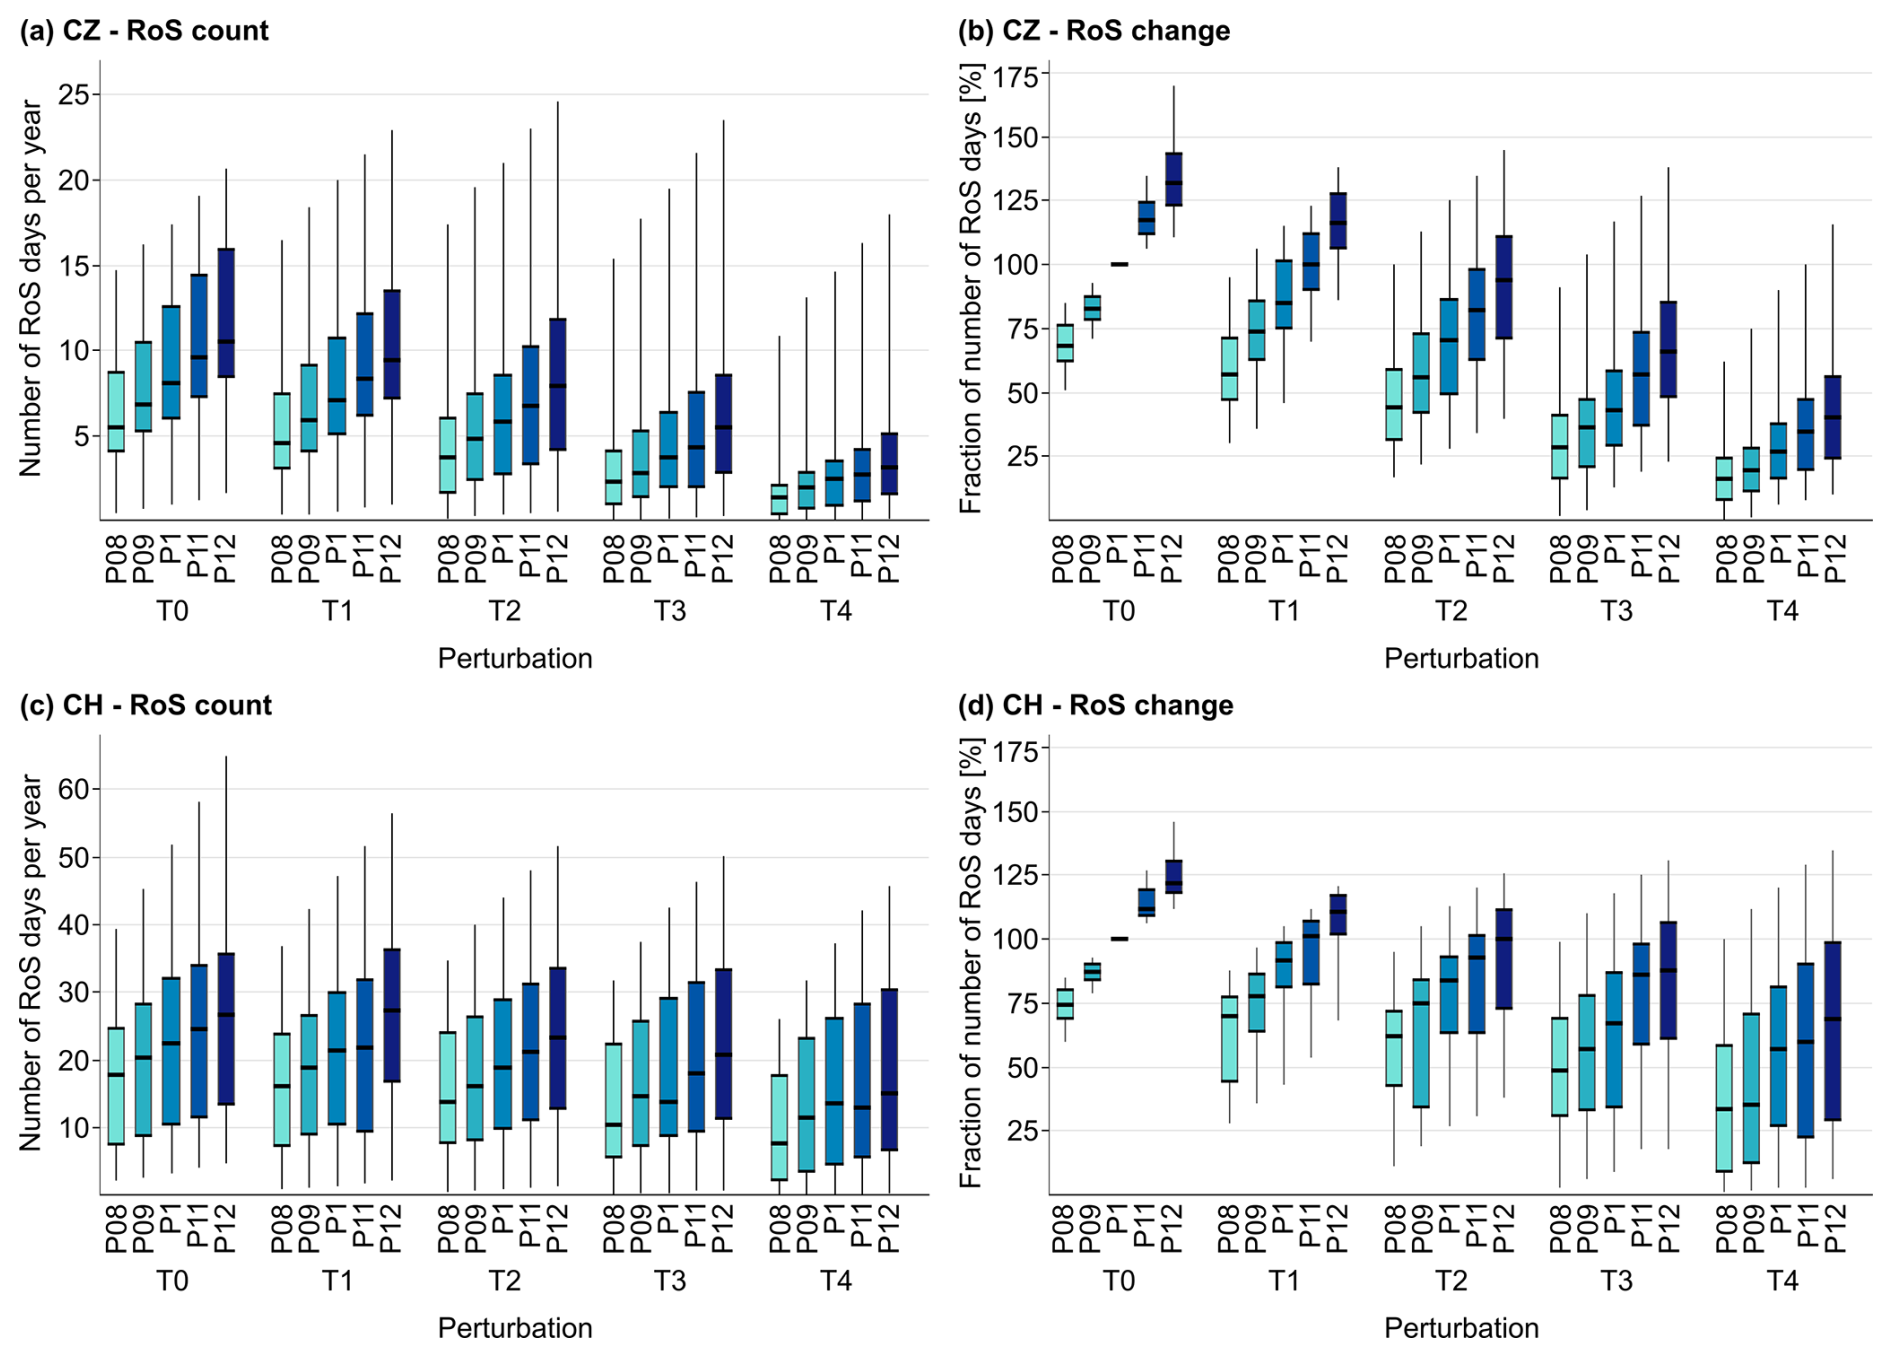
Figure 4Number of RoS days per year in both Czech (a, b) and Swiss (c, d) regions for all perturbations (a, c) and a fraction of the number of RoS days relative to reference conditions in both regions for all perturbations (b, d). Boxplots represent the variation among catchments, with the 25th and 75th percentiles represented by each box, the median as a thick line, and the whiskers showing the maximum and minimum values. Boxes are grouped and coloured according to the temperature (T) and precipitation (P) perturbations.
The above-mentioned differences and projected changes across regions are supplemented by the evaluation across individual mountain ranges (Fig. 5). Results showed that catchments are generally less sensitive to changes in precipitation compared to the increase in temperature. This was shown by perturbations assuming a temperature increase of 4 °C, where similar RoS decreases were suggested among individual mountain ranges, independent of changes in precipitation.
Overall, there were large differences between the individual mountain ranges and selected perturbations. Regionally, the catchments located in the western Sudetes will be relatively unaffected by the temperature increase by 2 °C; however, additional temperature rise (T4 perturbations) may result in sudden RoS decline, which will be more pronounced compared to the eastern Sudetes and western Carpathians. In Switzerland, the catchments in the central and southern Alps showed higher resistance to changes in air temperature and precipitation than those in the Jura and Swiss Plateau, which behave similarly to those in Czechia. In general, southern and western mountain ranges experienced larger RoS decreases in both regions.
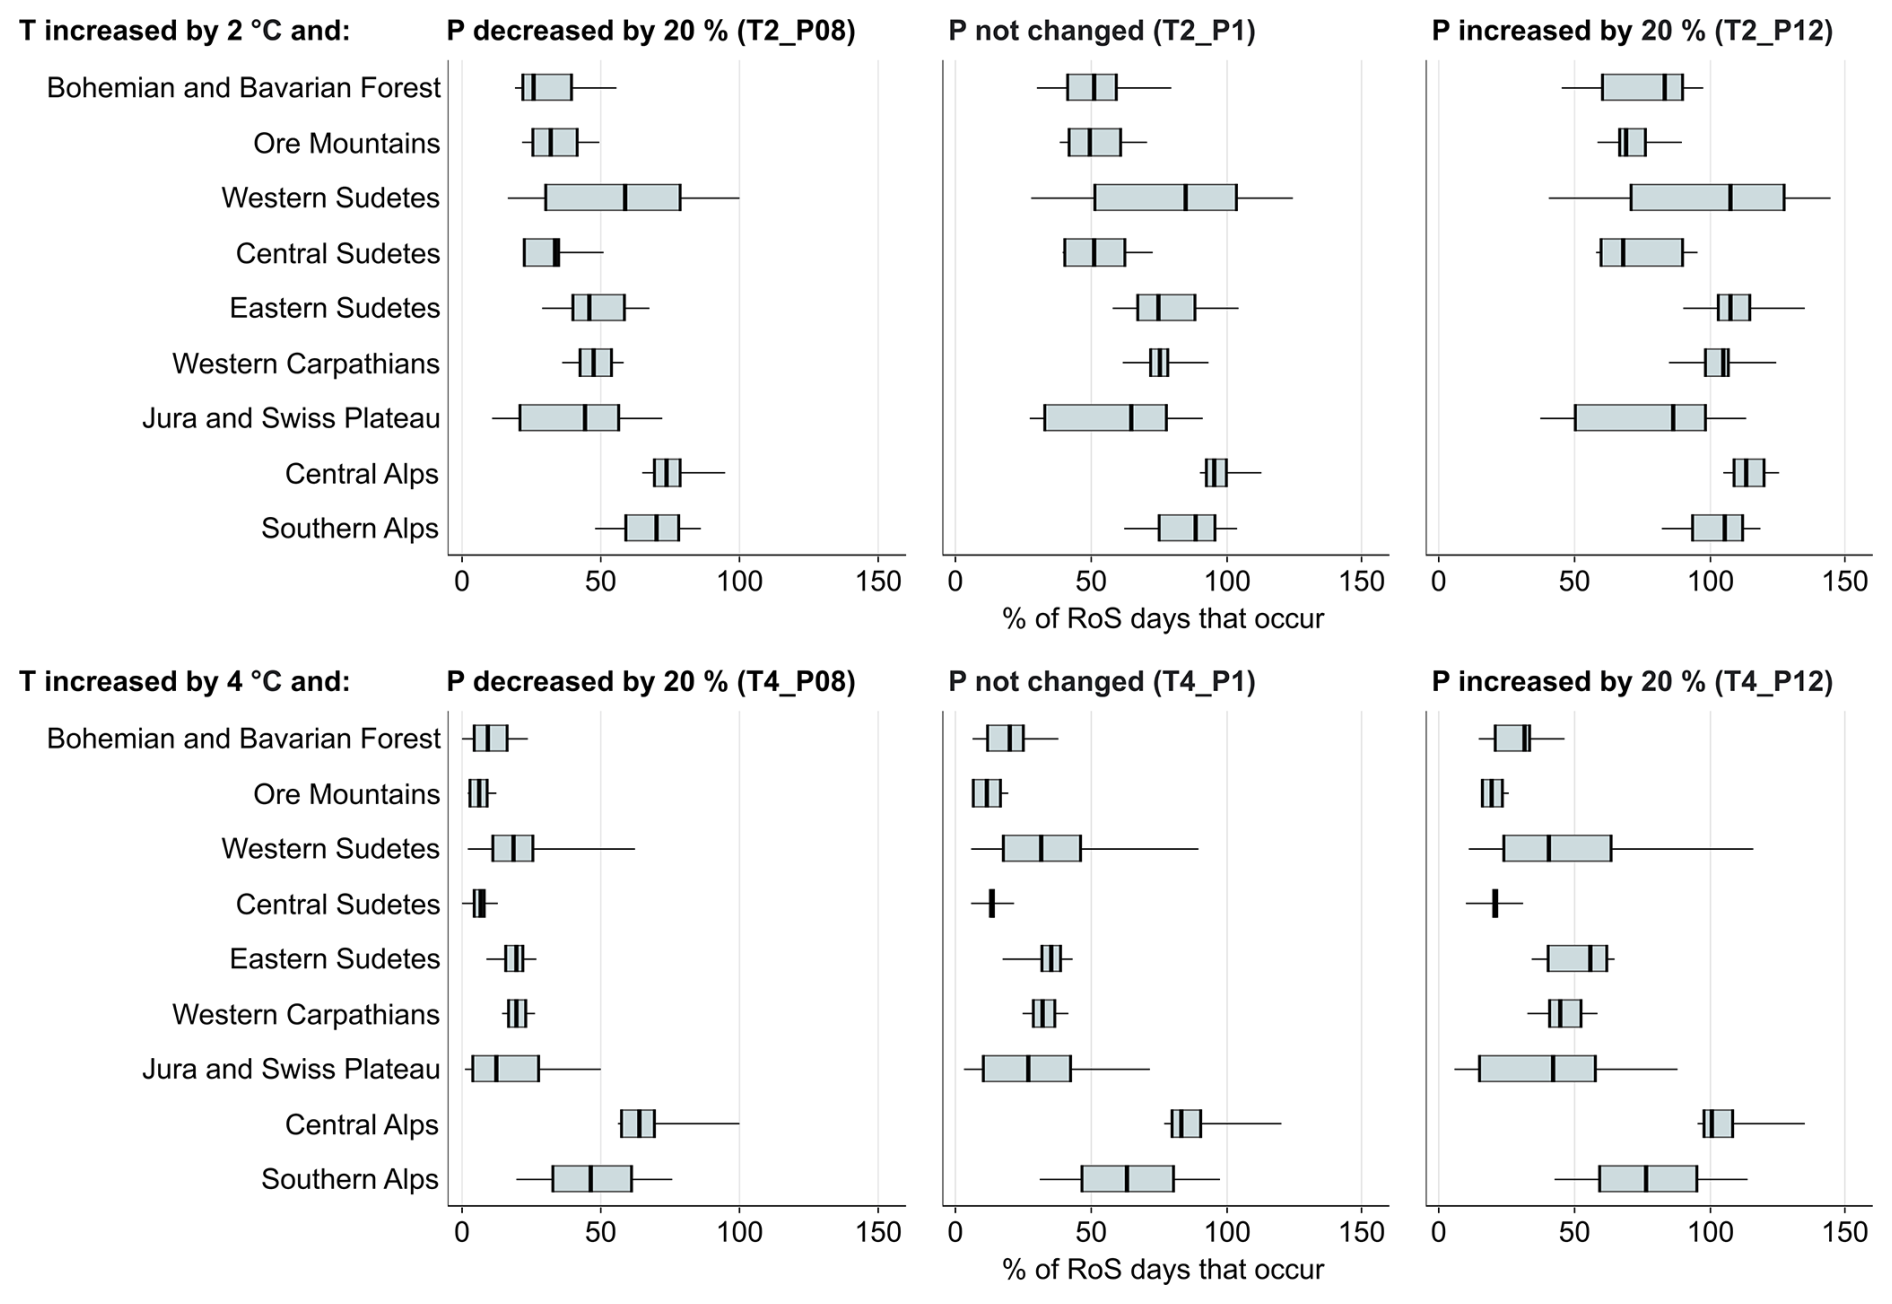
Figure 5Percent of RoS days that occur due to the temperature (T) increase and precipitation (P) changes in selected combinations compared to reference conditions T0_P1. Boxplots represent the variation among catchments located in the individual mountain ranges, with the 25th and 75th percentiles within a box, the median as a thick line, and the whiskers representing maximum and minimum values.
3.4 Seasonal RoS changes for different climate perturbations
Results showed that changes in RoS occurrence will likely differ considerably for different months of the cold season. A notable RoS increase was detected in January and February across the Swiss catchments (Fig. 6d), and this mid-winter trend was more pronounced than in Czechia. In these winter months, only two perturbations resulted in a slight RoS decrease in Switzerland. Across the Czech catchments, a RoS increase was limited only to perturbations leading to wet conditions and a moderate increase in air temperature (Fig. 6b).
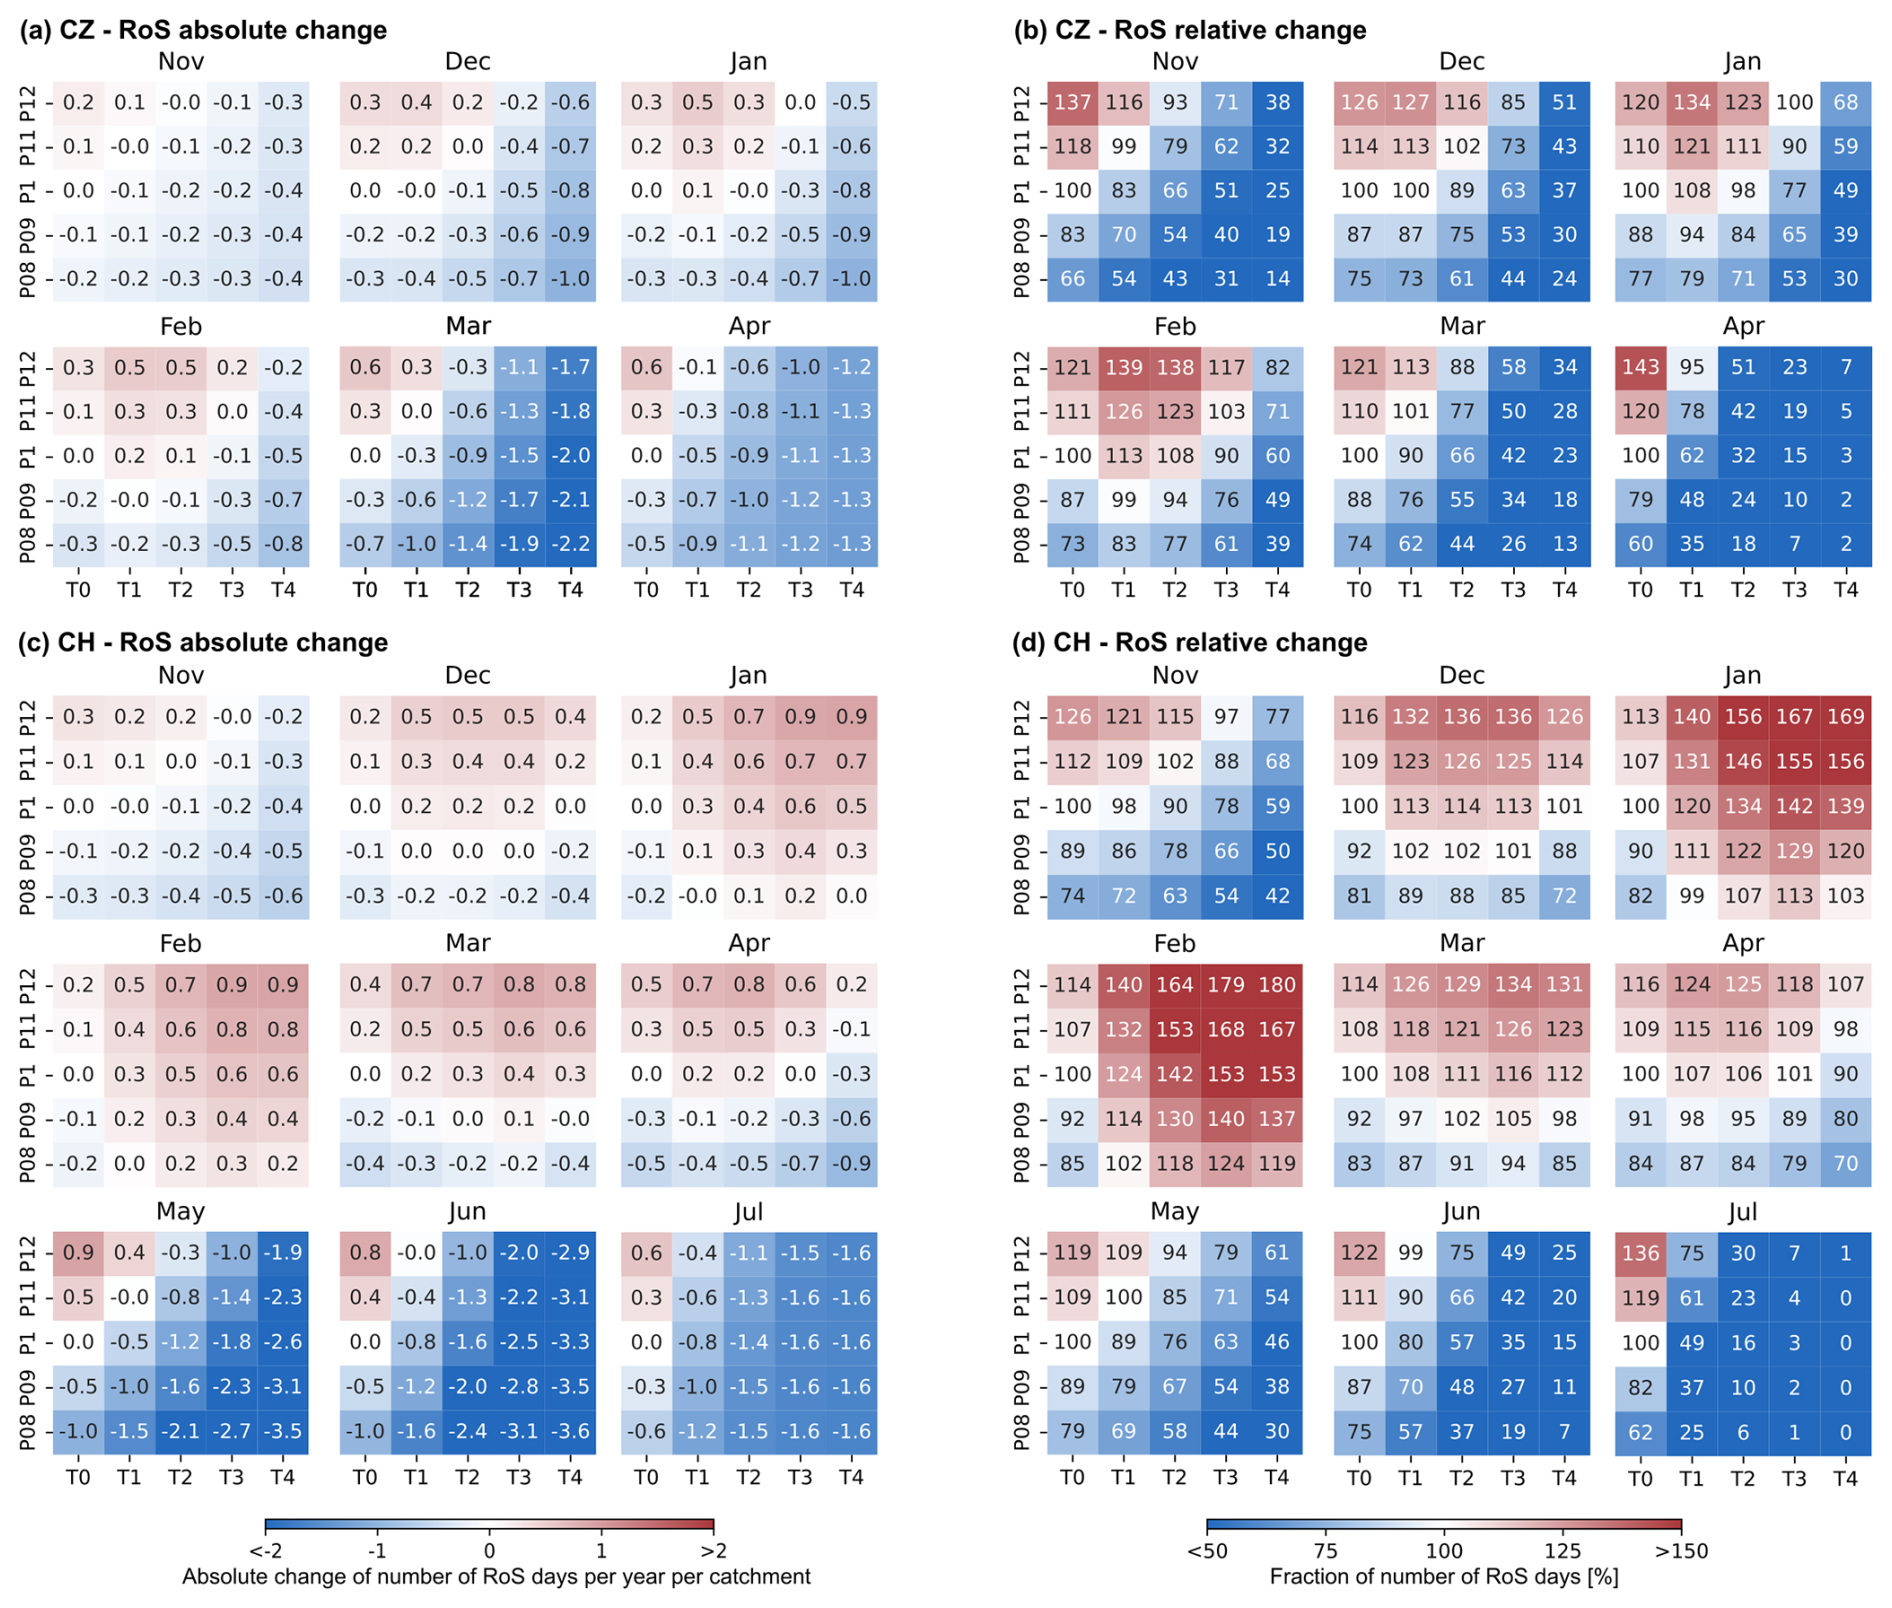
Figure 6Absolute (left column, a, c) and a fraction of the number of RoS days (right column, b, d) for all perturbations (T and P combinations) in both Czech (top row, a, b) and Swiss (bottom row, c, d) regions. Note that changes are related to reference conditions T0_P1, and selected months (May–October for CZ, August–October for CH) are not shown here due to having only a few RoS days.
Towards the end of the winter, with an earlier snowmelt period onset in Czechia, a decrease in RoS days was simulated for most perturbations (Fig. 6a and b). Perturbations leading to a temperature increase of more than 2 °C led to a slight RoS increase only for the wetter months of January or February. Only a few perturbations, representing wetter conditions and a temperature increase limited to 2 °C, predicted an increase in the number of RoS days for the Czech catchments for other months during the cold season (November, December, March, and April). A similar pattern, although for more perturbations and with a more substantial RoS increase, was simulated across the Swiss region (Fig. 6c and d). This RoS increase resulted from the compensating effect of increased precipitation for perturbations with a moderate increase in air temperature.
3.5 RoS changes across elevation zones
Elevation-based differences in the occurrence of RoS days (Fig. 3) were further analysed in more detail. We identified considerable patterns in RoS variations across elevation zones (Fig. 7), evaluating all RoS days expected to occur in the study catchments (Fig. 7a and c). The wettest perturbation with no temperature change (T0_P12) is the only perturbation that suggested a RoS increase for all elevations in both geographical regions (Fig. 7b and c). All other perturbations simulated RoS decline below 1000 m a.s.l. for both study regions, whereas the decline for the Swiss catchments is more pronounced below this elevation level. More than an 80 % decrease may occur below 600 m a.s.l. for the Czech catchments for the perturbations with the highest air temperature increase (T4). A similar relative decrease in RoS days occurs for the Swiss catchments at elevations even below 1000 m a.s.l. Another difference between the two study regions was indicated at the highest elevations in Czechia (above 1300 m a.s.l.), where the warmest and wettest perturbations suggested a RoS increase. In contrast, such an increase was not seen in the simulations for the Swiss catchments.
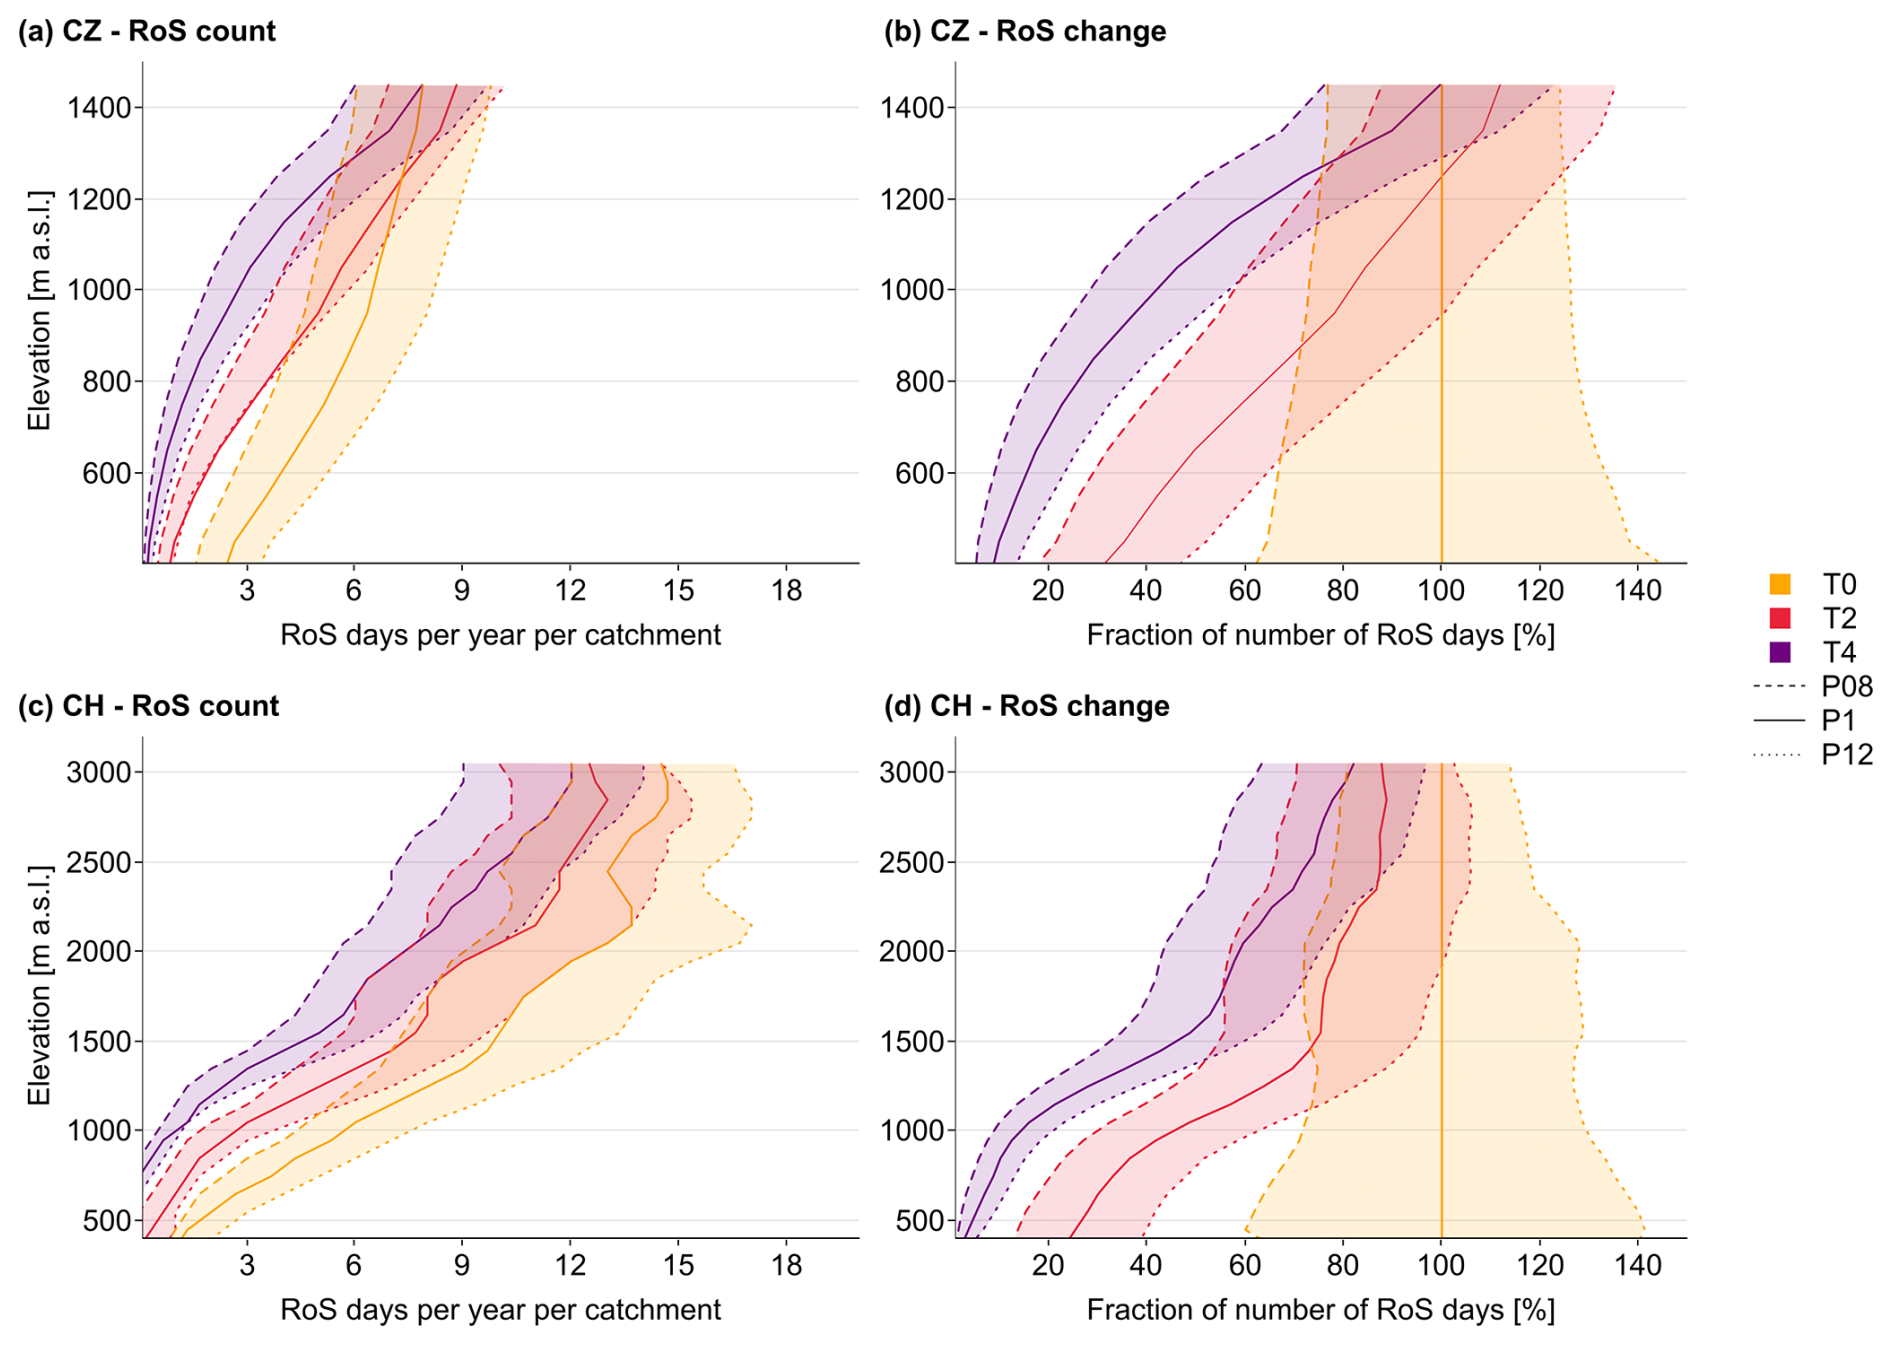
Figure 7RoS day occurrence (a, c) and a fraction of the number of RoS days for selected perturbations compared to reference conditions T0_P1 (b, d) for distinct elevation zones in both Czech (a, b) and Swiss (c, d) regions. The absolute RoS numbers were weighted by the number of catchments within the individual elevation zones. Line colours and styles represent selected temperature (T) and precipitation (P) perturbations.
3.6 Effect of seasonal characteristics on the RoS occurrence
Several climate and snow parameters defined in Sect. 2.6 were assessed for their relation with the occurrence of RoS days based on the values of Spearman's correlation coefficient (Fig. 8). Results showed some interesting differences between the main regions and individual parameters. Interestingly, a correlation between the occurrence of RoS days and air temperature (Tmean) was relatively weak (values up to −0.38) but tended to be more negative and thus stronger, with projected temperature increases in both regions. Results also indicated that the sum of precipitation (Psum) plays a more important role in the occurrence of RoS days compared to air temperature. In Czechia, relatively strong positive correlations with precipitation totals became less important for warmer perturbations, which may be associated with the decrease in snowfall totals causing an overall RoS decrease for warmer perturbations. In Switzerland, seasonal snowfall totals (Ssum) were detected as the less important driver for RoS occurrence compared to the seasonal sum of all precipitation, regardless of the perturbation. Parameters related to SWE (SWEmean, SWEmax) were shown as the most important factor for the Czech catchments, showing an increasing positive relation for the warmer perturbations.
Like the Czech catchments, the importance of SWE increased with the temperature increase in Switzerland. However, the positive correlation was relatively lower, particularly for the perturbations with a relatively lower increase in air temperature. Snowfall fraction (Sf) was identified as the parameter with the largest fluctuations across perturbations and regions. Positive correlations increasing with the warmer perturbations were detected in Czechia, while increasing snowfall fraction led to fewer RoS days in perturbations characterized by a temperature increase of up to 1 °C. Overall, results suggested that RoS events are sensitive to different changes in individual parameters among both regions and individual perturbations.
These parameter relations were investigated more in detail, evaluating particular RoS changes driven by disappearing/advancing snow cover or changes in the precipitation phase and amount (see Sankey diagrams in Fig. S1 in the Supplement). The supplementary analysis revealed that a decrease in the number of RoS days during the temperature increase by 3 °C can be attributed to the shortening period with snow cover since precipitation remained unchanged (Fig. S1a and b). In this perturbation, most RoS days transitioned into the rain-on-ground category. However, these lost RoS days are partially substituted from the snow-on-snow category regarding the change in precipitation phase from solid to liquid. Perturbations suggesting precipitation decrease and no temperature change (Fig. S1c and d) showed RoS days transitioning into categories of low precipitation (below the 5 mm threshold) or rain-on-ground due to less rain and lower snow accumulations. In contrast, increased precipitation (Fig. S1e and f, with unchanged temperature) resulted in a prolonged snow cover period, causing an increase in the total number of RoS days. These days shifted from rain-on-ground and low-precipitation categories.
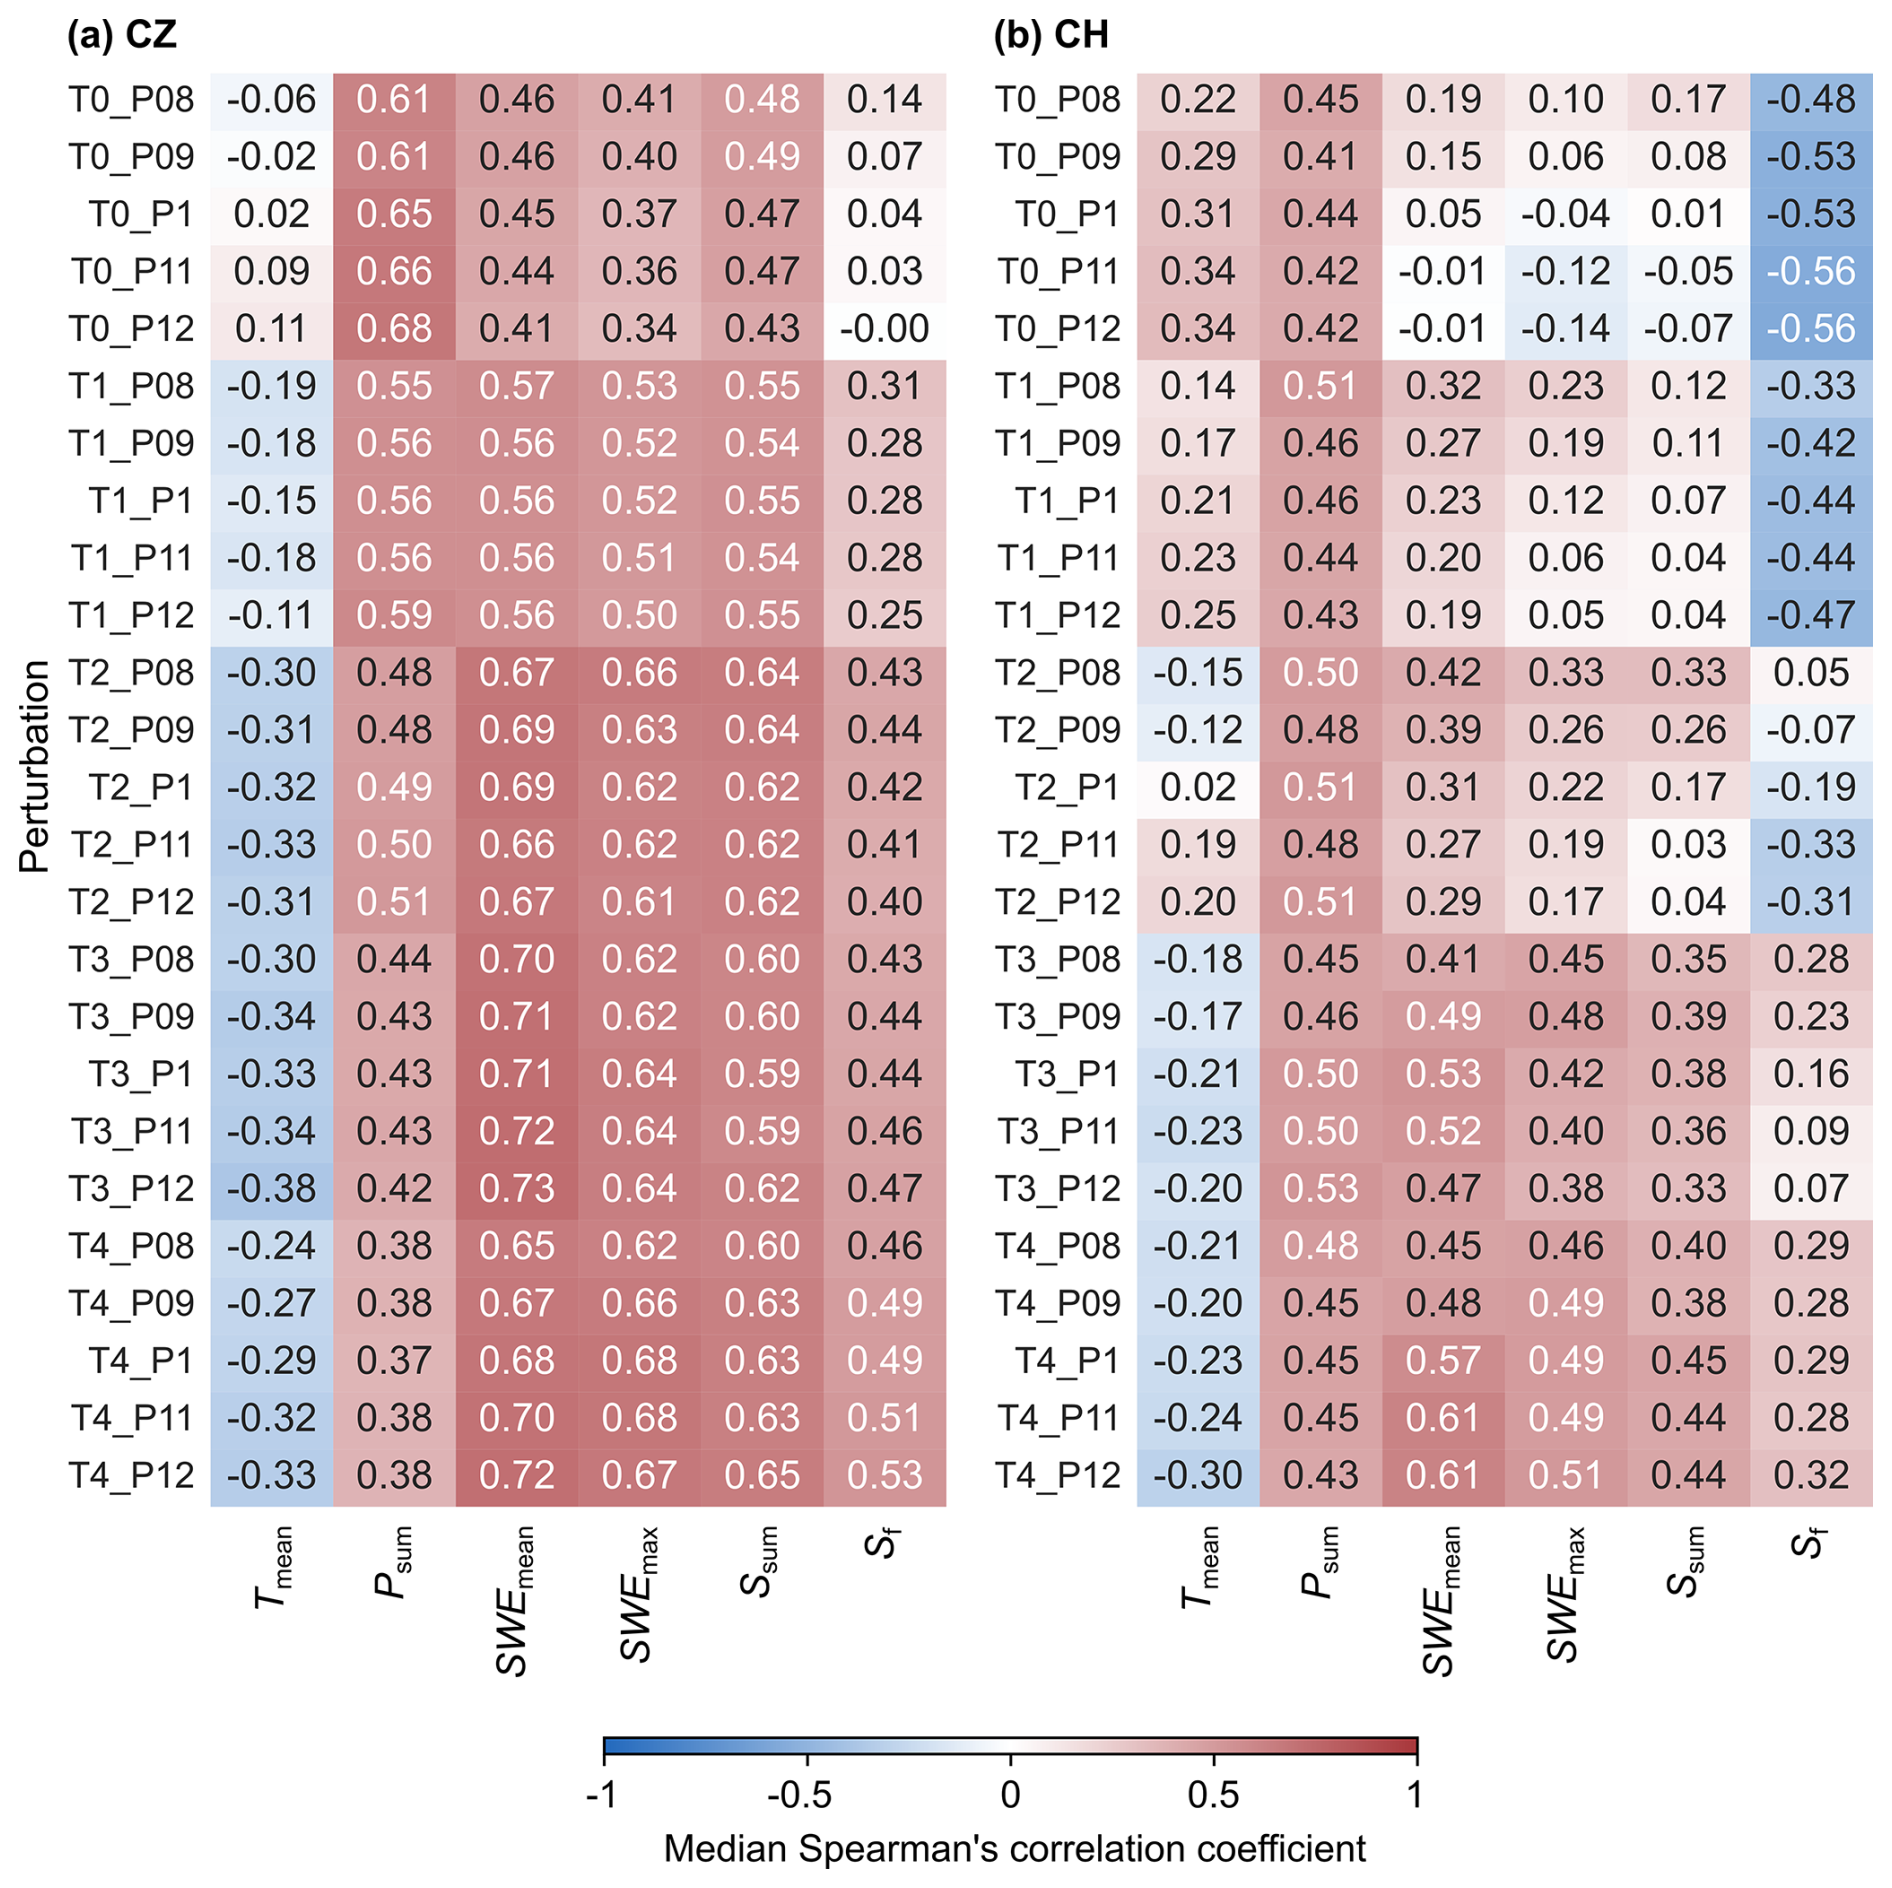
Figure 8Median Spearman's correlation coefficients indicated by colour and number for all perturbations in both Czech (a) and Swiss (b) regions valid for the selected climate and snow characteristics: seasonal mean air temperature (Tmean), sum of precipitation (Psum), mean snow water equivalent (SWEmean), maximum snow water equivalent (SWEmax), sum of snowfall (Ssum), and snowfall fraction (Sf).
3.7 Runoff response to RoS
To assess RoS event-related runoff response and its changes for different perturbations, the total RoS runoff (Qevent) for each RoS event was calculated (Sect. 2.6) and shown as a ratio to the total annual runoff in both regions (Fig. 9). The results show that RoS-driven runoff contributes to the total runoff with different volumes in both regions. These contributions are expected to change for different perturbations. In the reference conditions (T0_P1), RoS events contributed on average by 10 % to the total annual runoff in the Czech catchments, with the highest contribution of 19 % for some catchments (Fig. 9a). In Switzerland, where the variability was much higher, RoS events contributed on average 18 % to the total annual runoff with some catchments contributing up to 35 % (Fig. 9b). The results indicated that the RoS contributions will likely decrease in the future following a temperature increase. For instance, model simulations suggested that RoS events will be responsible for 5 %–9 % of the total annual runoff in Czechia for a temperature increase of 2 °C, and 11 %–16 % in Switzerland. perturbations with a temperature increase of 4 °C would reduce the runoff fractions to 2 %–4 % across the Czech catchments and 5 %–9 % for the Swiss catchments. Nevertheless, the RoS runoff decrease caused by the increased air temperature may be partly compensated by the precipitation increase. Despite the expectations that the RoS impact on the total runoff will be lower in the future, extreme hydrological response and flooding triggered by RoS events may still occur.
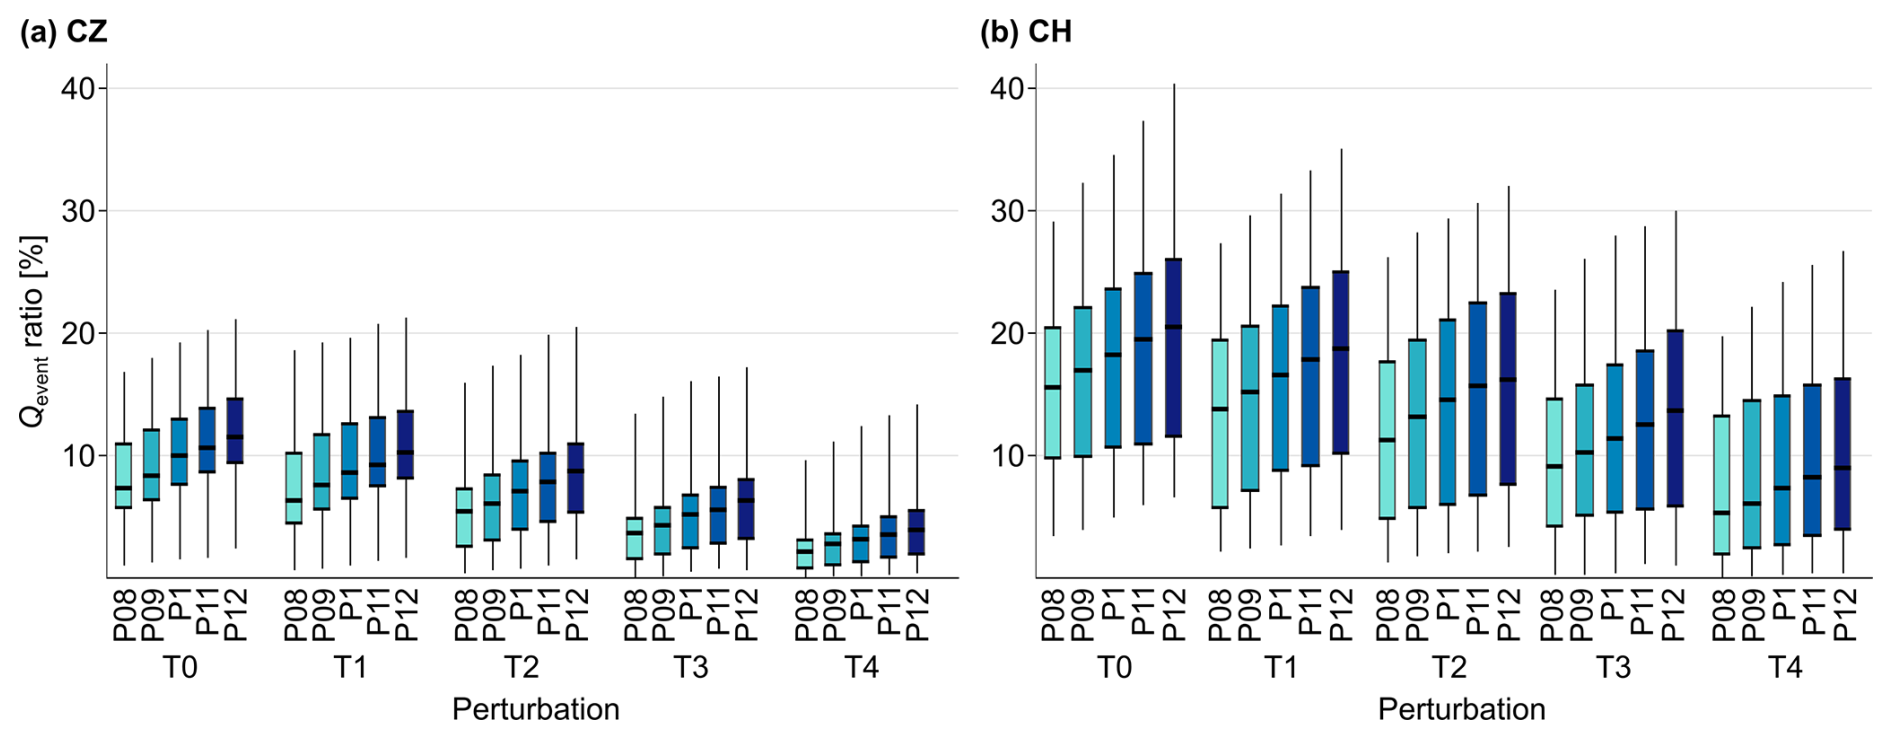
Figure 9Fractions of RoS-driven runoff (Qevent) to the total annual runoff in both Czech (a) and Swiss (b) regions for all perturbations. Boxes represent the 25th and 75th percentiles, with the median from all catchments indicated as a thick line. Whiskers represent maximum and minimum values. Boxes are grouped and coloured according to the temperature (T) and precipitation (P) perturbations.
The regional differences in the annual RoS runoff fractions were further investigated for individual months during the cold season, showing the relative changes in the direct runoff during RoS days (Qdirect) for all perturbations (Fig. 10). These relative changes, in parallel with the changes in hydrological response, were consistent with relative changes in the number of RoS days shown in Fig. 5. For the Czech catchments, a relative increase of at least 25 % was projected only for two perturbations (T0_P11 and T0_P12) for all months (Fig. 10a). Note that May to October (for Czechia) and August to October (for Switzerland) were excluded from the analysis due to a low number of RoS events, which does not allow for a robust analysis.
In Switzerland, changes in RoS-related direct runoff and RoS occurrence correlated even better, and hydrological impacts generated by RoS events were generally more pronounced (Fig. 10b). In contrast to the Czech catchments, the mid-winter months (December to March) were assessed to be the most hazardous for increased RoS-related runoff response. A notable direct runoff increase of more than 50 % was projected for warmer and wetter perturbations throughout December to February. For January and February, higher RoS-related runoff was predicted even for some drier perturbations. With the expected more frequent RoS events during these months in the future, Swiss catchments, particularly high-elevated ones, may face more extreme RoS-related flood events.
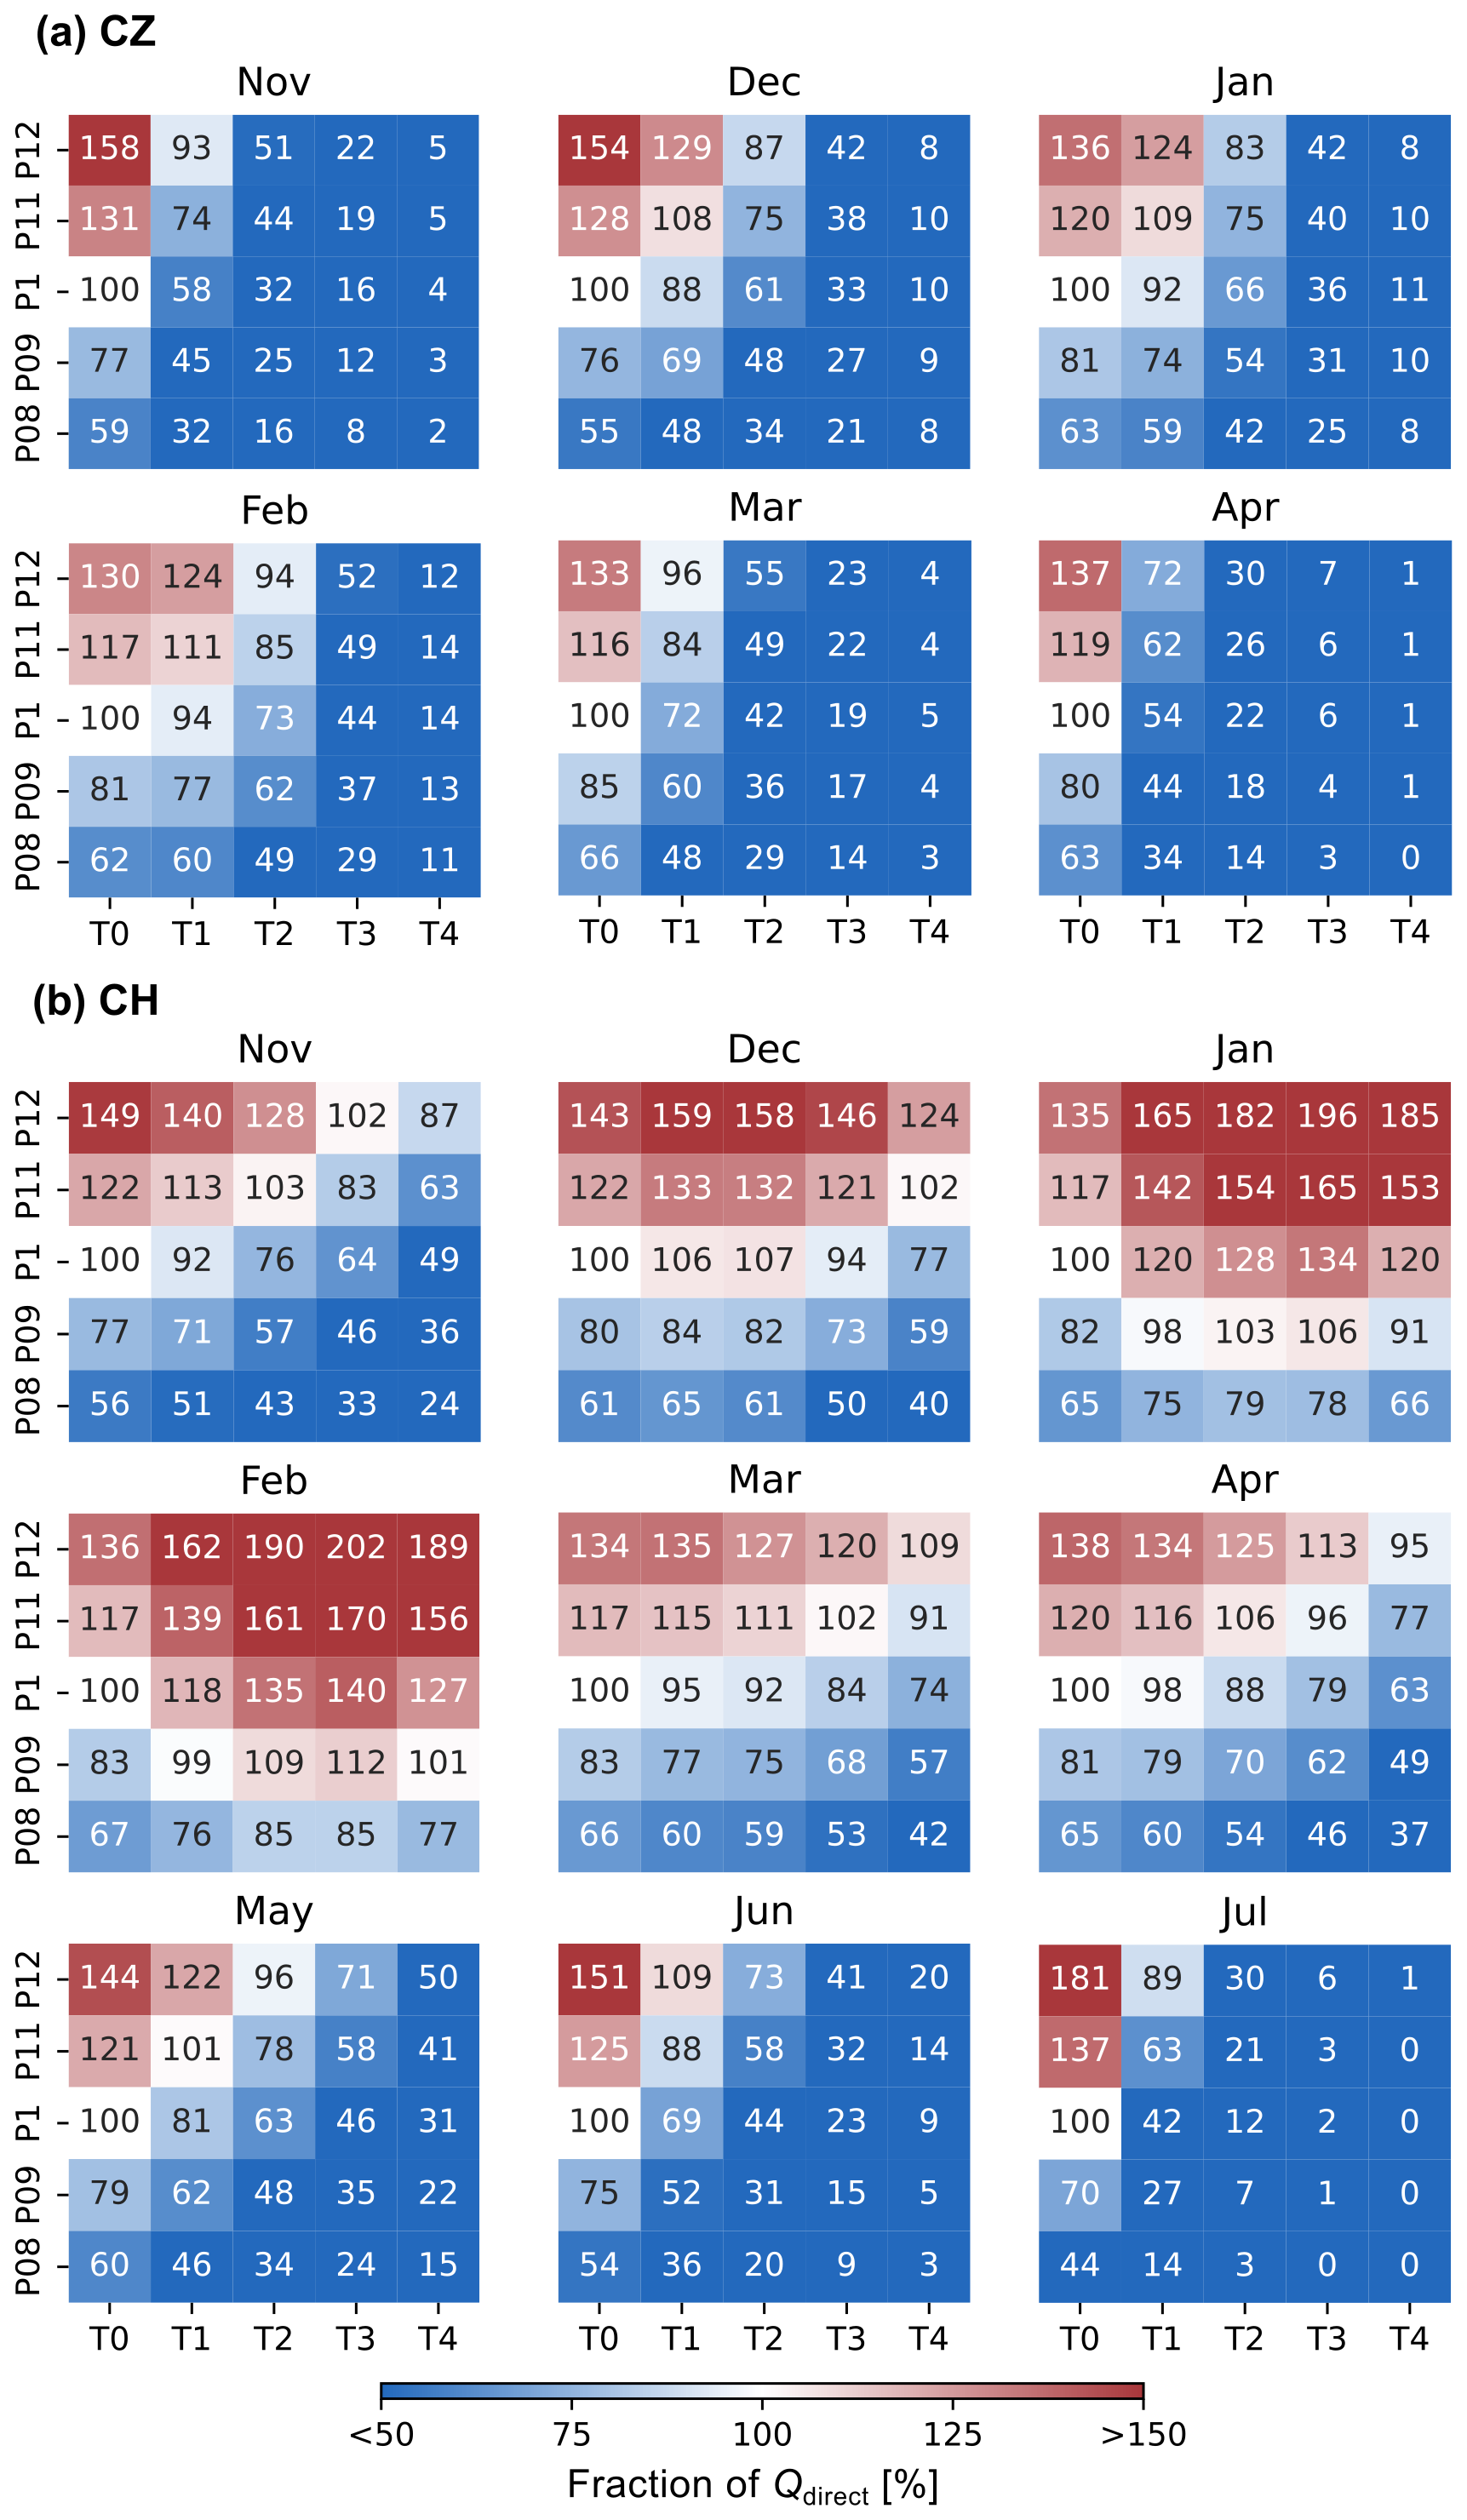
Figure 10Monthly fraction of RoS-driven direct runoff (Qdirect) relative to reference conditions T0_P1 (100, white entries, first column, third row) for all perturbations (T and P combinations) in both Czech (a) and Swiss (b) regions.
4.1 HBV model uncertainty
To determine rainfall-runoff components and thus to identify RoS days, RoS events, related variables, and all projected changes, a semi-distributed hydrological model HBV was employed in this study, similar to Freudiger et al. (2014), Hotovy et al. (2023), and Juras et al. (2021). Model calibration, validation, and testing were performed in the previous studies using similar datasets (Jenicek et al., 2021; Jenicek and Ledvinka, 2020). Consistently with these studies, multi-criteria model calibration and reiterated calibration runs were performed to reduce the overall parameter uncertainty. Nash–Sutcliffe efficiency values over 0.7, which were also reached for the extended dataset in this study, represent one of the acceptable test criteria (Moriasi et al., 2015).
Since the presented results are based on modelled SWE to define RoS situations, uncertainties arising from the model parametrization must be addressed. The assessment of the model's ability to simulate SWE and thus detect RoS days correctly was investigated by Hotovy et al. (2023), who compared counts of observed and simulated RoS days, as well as simulated runoff and SWE during RoS events specifically, and did not find major inconsistencies in the model runs and assumed that the model provided sufficiently good simulations. Differences between observed and modelled values may result from the lack of SWE measurements and representativeness of the measurement location, particularly across the Czech catchments. More detailed testing of SWE simulations for the Czech catchments was carried out by Jenicek et al. (2021) and Nedelcev and Jenicek (2021). For example, Nedelcev and Jenicek (2021) compared simulated and observed trends in air temperature, precipitation, and SWE, concluding that the model can provide overall reliable simulations of the above variables, which are temporally and spatially consistent with observed data. SWE simulations were not explicitly evaluated for the Swiss catchments. However, overall model performance is better in simulating SWE for the Swiss catchments, since daily gridded SWE data combining snow depth station data and a snow density model have been used for model calibration (Magnusson et al., 2014).
The HBV model uses a relatively simple snow accumulation and melt calculation employing the modified degree-day approach, which may raise further questions about model simplification. For example, the snow routine does not allow mixed-phase precipitation, as it applies a temperature threshold (TT) to classify precipitation as either rain or snow. Therefore, we tested how different TT values (within a defined range around the calibrated value) influence the number of RoS days. The results showed that the absolute number of RoS days changed. Still, the relative variability and trends remained unchanged, including relative changes in RoS days for the reference period and individual perturbations (results not shown).
Several recent studies showed that the simplified degree-day method, which is based on a near-linear relationship between snowmelt and air temperature, was hard to outperform at a catchment scale using more sophisticated models, accounting for the entire energy balance of the snowpack (Girons Lopez et al., 2020; Seibert and Bergström, 2022). Moreover, the complex energy balance approach demands specific data, which are difficult or even impossible to use at a regional scale with various types of catchments. Despite the possible limitations of these bucket-type approaches, several studies have demonstrated that the degree-day method is adequate to be used for snow storage simulation at a catchment scale under a changing climate (Addor et al., 2014; Etter et al., 2017; Juras et al., 2021). Girons Lopez et al. (2020) tested several modifications of the HBV model snow routine in Swiss and Czech catchments (a subset of those used in this study). They confirmed that the current HBV snow routine provides results at a catchment level that can hardly be improved despite increasing the physical representation. Overall, the above studies confirmed that the model can correctly simulate and distribute all selected snow-related parameters for study catchments adequately to trends in time series. Results presented in the previous studies showed that model setup, procedures, and derived parameters can satisfactorily represent the actual natural processes, including specifics of RoS events.
4.2 RoS definitions
Variations in the threshold values set to identify individual RoS days/events may significantly affect the total number of recognized situations. A unified RoS definition does not exist in the literature. Different authors use different parameters and thresholds in their studies. The average temperature, duration of snow cover, and the dominant phase of precipitation are expected to be the main factors that explain the variation in the sensitivity of RoS to climate warming (López-Moreno et al., 2021).
As for air temperature, several studies (Bieniek et al., 2018; Crawford et al., 2020; Surfleet and Tullos, 2013) used the threshold of 0 °C for the daily mean air temperature, while numerous recent studies did not specify the temperature threshold for detecting RoS (Mooney and Li, 2021; Pall et al., 2019; Schirmer et al., 2022; Yang et al., 2022). In this study, we determined the air temperature threshold as one of the RoS-defining parameters, which has been calibrated separately for each of the study catchments. This approach appeared to be a valuable addition to the previous definition used by Hotovy et al. (2023), who used zero as the temperature threshold. The varying threshold temperature may buffer local climatic conditions affected by different catchment properties, such as elevation range, topography, or vegetation, and thus reduce one of the sources of potential errors when identifying RoS days and events. However, we found only minor local differences in the number of RoS days in this presented research and in the study performed by Hotovy et al. (2023).
Derived threshold temperatures applied in this study varied from −1.9 to 1.6 °C within all study catchments (Sect. 2.3). This threshold temperature range is comparable to the one presented by Jennings et al. (2018), who identified the temperature range between −0.4 and 2.4 °C to be valid for 95 % of the stations across the Northern Hemisphere, indicating the air temperature at which rainfall and snowfall are in equal frequency. Lower temperature thresholds occurred particularly at high-elevation catchments, where snowfall occurs more often than rainfall. The temperature threshold is a challenging criterion that is used in the model to distinguish the precipitation phase. This can be especially challenging on days when the air temperature fluctuates around the freezing point, and consequently, the snowfall fraction is even more sensitive to changes in air temperature.
Although we are aware that shallow snow can contribute significantly to hydrological responses during RoS days/events, particularly in future climates where shallow snow is expected to occur more often and will be more susceptible to rapid melting, we chose the 10 mm SWE threshold in our analysis to ensure that RoS days/events were defined in areas with meaningful snow cover. This SWE threshold represents a catchment mean. Thus, it covers a variety of possible snow distributions, such as equally distributed snow cover across the catchment or higher snowpack at high elevations and no snowpack at lower elevations.
Similar to the TT (Sect. 4.1), we tested how different SWE thresholds (5, 10, and 20 mm) influence the number of RoS days. The results showed that the absolute number of RoS days changed for different SWE thresholds. Still, the relative change mainly remained the same for the reference period, although it somewhat changed for individual perturbations. However, the general trends of the changes remain unaffected with an overall first-order decrease in RoS day fractions with air temperature and a particular increase with increasing precipitation (results not shown).
4.3 Sensitivity analysis approach
In this study, we investigated potential RoS changes due to variations in climate variables, namely air temperature and precipitation, assessing regional and seasonal changes, changes at different elevations, and changes in RoS-related runoff response. This methodological approach was designed to systematically test how catchments are sensitive to changes in climate variables rather than project changes in RoS into the future. For example, current climate projections suggest non-stationary changes, such as that precipitation will likely increase during winter and decrease in summer (Kotlarski et al., 2023). Similarly, overall higher precipitation intensities are expected. None of the above was taken into account by our modelling setup, so our analyses cannot be interpreted as projections of future climate.
To limit uncertainties related to the climatological modelling, a sensitivity analysis was applied in this study instead of the complex climatological modelling approach to assess how air temperature and precipitation changes affect RoS occurrence and extremity. Different sources of uncertainty resulting from the modelling approach were considered in several RoS studies, with natural climate variability being seen as the primary source of uncertainty in RoS projections (Schirmer et al., 2022). A sensitivity analysis approach for RoS-related research was performed by López-Moreno et al. (2021), who used this method to demonstrate the effects of the warming climate.
In this study, climate variables were altered with regard to the expected future climate variations presented by various respected sources (Gutiérrez et al., 2021). A total of 24 combinations covered a large range of possible future climate behaviour. These perturbations were related to the given reference period, representing the current climate conditions that are already even more than 1 °C warmer compared to the air temperature in the pre-industrial era. Selected temperature perturbations cover more optimistic ranges, with an air temperature increase up to 2 °C, but also pessimistic perturbations, with a temperature increase close to 4 °C. Since the direction of precipitation changes is uncertain for the regions of central Europe, projecting both increases and decreases using different climate models, a range from a 20 % decrease to a 20 % increase was applied in this study to cover a wide range of potential future climates. In this study, the tested temperature and precipitation perturbations are presented as equally likely to occur. However, some of them are more likely to emerge in the future climate, such as perturbations combining air temperature increase by 2 and 3 °C (T2, T3) with a variety of precipitation changes from its decrease by 10 % (P09) to increase by 10 % (P11).
4.4 Observed and future changes in RoS
Studies investigating RoS occurrence are usually limited to specific regions (Li et al., 2019; Yang et al., 2022) since the spatial and temporal distribution of RoS days and events is controlled by current and local weather conditions. Thus, a comparison of RoS occurrence across different regions may be challenging. Notable regional differences within both study regions and individual subregions and mountain ranges were also detected in this study, revealing a range from 31 to 1554 RoS days across the study catchments (Sect. 3.2). Although this study does not provide evidence of such high RoS occurrence based on measurements, our previous study, Hotovy et al. (2023), provided a comparison of the observed and simulated number of RoS days for Czech catchments (similar selection to this study), showing overall good fit between observed and simulated values. Therefore, we assume that the numbers of RoS days are realistic.
Local climate variability and uncertainty in climate model projections (discussed more in detail in Sect. 4.3) are other factors that make climate change-driven variations in RoS even more challenging to assess. The sensitivity of RoS to climate change is highly variable among sites and also with different elevations, aspects, and slopes in each basin (López-Moreno et al., 2021). To enhance the robustness and relevance of our study, we performed supplementary analyses to test how climate perturbations affect RoS occurrence in contrasting snow-rich and snow-poor seasons (Fig. S2 in the Supplement) and how the number of RoS days differs in a few selected catchments with contrasting characteristics (Fig. S3 in the Supplement). The results proved site-specific patterns in the RoS frequency and revealed that RoS days/events are more temperature-sensitive during snow-poor seasons when a notable decrease in RoS days was identified for the warmest perturbations (T3 and T4). In contrast, the number of RoS days in the snow-rich seasons remains similar or even higher for the warmest perturbations, likely due to more frequent RoS occurrence during a prolonged period with existing snow on the ground, with more RoS days/events expected early and late season.
Our results were consistent with the conclusions presented by Mooney and Li (2021) or Schirmer et al. (2022), who found climate change signals towards more intense and frequent RoS events for an RCP 8.5 scenario (closest to the warmest perturbations in our study assuming an increase in temperature of 4 °C) at high elevations. Many studies (Il Jeong and Sushama, 2017; Li et al., 2019; Mooney and Li, 2021; Musselman et al., 2018; Sezen et al., 2020; Trubilowicz and Moore, 2017) evaluating and modelling RoS events for different climate scenarios predict an increase in RoS events, particularly at higher elevations (usually valid for catchments above 1500 m a.s.l.). In contrast, their results showed a general RoS decrease with lower hydrological extreme responses at lower elevations (usually covering catchments below 1000 m a.s.l.). These broader elevation-based behaviours were more pronounced in the Czech catchments in our study. Results also showed seasonally dependent changes in RoS occurrence. Most of the perturbations suggested a decrease in the number of RoS days towards the end of winter (particularly April and May), which supports the findings presented by Sezen et al. (2020). The signals towards more frequent RoS events, more pronounced in the Swiss catchments, were detected in the middle of the snow season. This RoS increase is likely driven by changes in precipitation since more precipitation is expected to occur as rain rather than snow (Nedelcev and Jenicek, 2021). Additional analyses investigating the effect of individual parameters are shown in the Supplement (Fig. S1).
There is still limited knowledge on how RoS-driven hydrological response will be affected by climate change (Myers et al., 2023). Therefore, RoS-related runoff projections presented in this study are very beneficial. Sikorska-Senoner and Seibert (2020) identified an overall decreasing trend of RoS-related flooding for 27 Swiss catchments between 1980 and 2014, which agrees with our general results for the Swiss study catchments throughout the year. In our study, we found that these general trends may not be present for winter months (January, February, and March) due to expected changes in air temperature and precipitation patterns. Beniston and Stoffel (2016) concluded that the frequency of floods triggered by RoS may increase by 50 % in Switzerland with a temperature increase of 2–4 °C. However, an air temperature increase of more than 4 °C may result in a RoS-driven flood decrease due to the decline in snowpack duration.
Runoff projections presented in this study did not specifically assess changes in the extreme hydrological RoS-related response. Thus, these possible climate-driven changes remain uncertain. Such extreme hydrological events triggered by RoS may occur. However, the probability will likely be lowered with gradual warming, although significant RoS runoff events remain an important flood risk, especially for moderate warming up to 2 °C compared to the reference period. The relative increase in RoS-driven runoff was projected to be even less frequent than the relative increase in the number of RoS days in January and February. This fact may indicate that more frequent RoS occurrence does not necessarily result in increased runoff with potential flooding. All perturbations with a temperature increase above 2 °C, which seem realistic for the future climate, show an expected decrease in RoS runoff response for all months.
According to López-Moreno et al. (2021), the hydrological importance of RoS is not expected to decrease, although the overall frequency of RoS drops. Their model runs showed that maximum runoffs caused by RoS may increase due to warmer snowpack during future RoS events and more accelerated snowmelt enhanced by energy inputs. The above-mentioned inconsistency between relative changes in RoS numbers (Fig. 6) and relative changes in runoff response (Fig. 10) was evident in our analyses. The initial snowpack properties and related snowpack retention capacity can also play an important role in runoff formation during RoS events (Garvelmann et al., 2015; Würzer et al., 2016). Consequently, some RoS events do not increase runoff (Juras et al., 2021; Wayand et al., 2015).
We evaluated potential regional and seasonal variations in RoS occurrence that are projected to occur in the future due to climate change. We performed a sensitivity analysis using a conceptual hydrological model simulating the change in RoS situations and their runoff response to precipitation and air temperature changes. Based on the results, we can draw the following conclusions.
The mean number of RoS days per season varied from one to more than 50 RoS days at a catchment scale, with the most frequent RoS occurrence in the elevation range from 1000 to 2000 m a.s.l. Regarding the elevation, distinct catchments saw the average RoS occurrence at different times of the year from mid-January to mid-May. March was the month with the highest RoS occurrence.
The results showed that climate change-driven RoS changes are highly variable over regions and sub-regions, across elevations, and within the cold season. In general, RoS days are expected to occur less frequently with further warming, particularly at lower elevations. The warmest perturbations suggested a decrease in RoS days by about 75 % for the Czech catchments. High-elevation Swiss catchments may respond less sensitively, at least in perturbations leading to wetter conditions, compared to the reference period. However, the number of RoS days may increase, specifically during mid-winter (January, February) and at higher elevations following moderate warming, which may be further enhanced by increased precipitation.
Various seasonal climate and snow characteristics may control RoS occurrences. The RoS occurrence was identified as more sensitive to changes in snowfall in the Czech catchments, while seasonal precipitation totals (regardless of snowfall or rainfall) appeared to be the primary driver in Switzerland. Surprisingly, the correlation between RoS and air temperature was relatively weak in both regions.
The results suggested that RoS contribution to annual runoff will likely be reduced from the current 10 % to 2 %–4 % for the warmest perturbations in Czechia and from 18 % to 5 %–9 % in Switzerland. However, the RoS contribution to runoff may increase in winter months in Switzerland for almost all perturbations with the same or higher amount of precipitation, regardless of air temperature increase. With the expected more frequent RoS events during these months, Swiss catchments, particularly high-elevation ones, may face more extreme RoS-related flood events in the future. For Czech catchments, the winter runoff increase is expected only for wet perturbations with a relatively small air temperature increase. Despite the expectations that the overall RoS impact on runoff will be lower in the future, extreme hydrological response and flooding triggered by RoS events may still represent a significant flood risk.
The HBV model outputs were published as an open dataset (https://doi.org/10.5281/zenodo.12772038; Jenicek et al., 2024).
The supplement related to this article is available online at https://doi.org/10.5194/hess-29-4199-2025-supplement.
OH and MJ initiated the study and designed the research; OH, ON, and MJ prepared and analysed data; OH and ON produced the figures and tables; all authors contributed to interpreting the results; OH wrote the manuscript with the contribution of all co-authors.
At least one of the (co-)authors is a member of the editorial board of Hydrology and Earth System Sciences. The peer-review process was guided by an independent editor, and the authors also have no other competing interests to declare.
Publisher's note: Copernicus Publications remains neutral with regard to jurisdictional claims made in the text, published maps, institutional affiliations, or any other geographical representation in this paper. While Copernicus Publications makes every effort to include appropriate place names, the final responsibility lies with the authors.
The authors wish to thank Tobias Jonas for preparing and providing SWE data for the Swiss catchments. Many thanks are due to Tracy Ewen for improving the language. We also thank the editor Shraddhanand Shukla and two anonymous reviewers for their valuable feedback.
This work was supported jointly by the Czech Science Foundation and Swiss National Science Foundation (project MountSnow, nos. GAČR 23-06859K and SNSF 200021E_213165), Charles University Grant Agency (project no. GAUK 316821), Technology Agency of the Czech Republic (project SS02030040), and the Johannes Amos Comenius Programme (P JAC, project no. CZ.02.01.01/00/22_008/0004605, Natural and Anthropogenic Georisks).
This paper was edited by Shraddhanand Shukla and reviewed by two anonymous referees.
Addor, N., Rössler, O., Köplin, N., Huss, M., Weingartner, R., and Seibert, J.: Robust changes and sources of uncertainty in the projected hydrological regimes of Swiss catchments, Water Resour. Res., 50, 7541–7562, https://doi.org/10.1002/2014WR015549, 2014.
Bartsch, A., Kumpula, T., Forbes, B. C., and Stammler, F.: Detection of snow surface thawing and refreezing in the Eurasian arctic with QuikSCAT: Implications for reindeer herding, Ecol. Appl., 20, 2346–2358, https://doi.org/10.1890/09-1927.1, 2010.
Bartsch, A., Bergstedt, H., Pointner, G., Muri, X., Rautiainen, K., Leppänen, L., Joly, K., Sokolov, A., Orekhov, P., Ehrich, D., and Soininen, E. M.: Towards long-term records of rain-on-snow events across the Arctic from satellite data, The Cryosphere, 17, 889–915, https://doi.org/10.5194/tc-17-889-2023, 2023.
Beniston, M. and Stoffel, M.: Rain-on-snow events, floods and climate change in the Alps: Events may increase with warming up to 4 °C and decrease thereafter, Sci. Total Environ., 571, 228–236, https://doi.org/10.1016/j.scitotenv.2016.07.146, 2016.
Berghuijs, W. R., Harrigan, S., Molnar, P., Slater, L. J., and Kirchner, J. W.: The Relative Importance of Different Flood-Generating Mechanisms Across Europe, Water Resour. Res., 55, 4582–4593, https://doi.org/10.1029/2019WR024841, 2019.
Beven, K.: An epistemically uncertain walk through the rather fuzzy subject of observation and model uncertainties1, Hydrol. Process., 35, 1–9, https://doi.org/10.1002/hyp.14012, 2021.
Bieniek, P. A., Bhatt, U. S., Walsh, J. E., Lader, R., Griffith, B., Roach, J. K., and Thoman, R. L.: Assessment of Alaska rain-on-snow events using dynamical downscaling, J. Appl. Meteorol. Climatol., 57, 1847–1863, https://doi.org/10.1175/JAMC-D-17-0276.1, 2018.
Blahušiaková, A., Matoušková, M., Jenicek, M., Ledvinka, O., Kliment, Z., Podolinská, J., and Snopková, Z.: Snow and climate trends and their impact on seasonal runoff and hydrological drought types in selected mountain catchments in Central Europe, Hydrol. Sci. J., 65, 2083–2096, https://doi.org/10.1080/02626667.2020.1784900, 2020.
Blöschl, G., Bierkens, M. F. P., Chambel, A., Cudennec, C., Destouni, G., Fiori, A., Kirchner, J. W., McDonnell, J. J., Savenije, H. H. G., Sivapalan, M., Stumpp, C., Toth, E., Volpi, E., Carr, G., Lupton, C., Salinas, José, Széles, B., Viglione, A., Aksoy, H., Allen, S. T., Amin, A., Andréassian, V., Arheimer, B., Aryal, S. K., Baker, V., Bardsley, E., Barendrecht, M. H., Bartosova, A., Batelaan, O., Berghuijs, W. R., Beven, K., Blume, T., Bogaard, T., Borges de Amorim, P., Böttcher, M. E., Boulet, G., Breinl, K., Brilly, M., Brocca, L., Buytaert, W., Castellarin, A., Castelletti, A., Chen, X., Chen, Y., Chen, Y., Chifflard, P., Claps, P., Clark, M. P., Collins, A. L., Croke, B., Dathe, A., David, P. C., de Barros, F. P. J., de Rooij, G., Di Baldassarre, G., Driscoll, J. M., Duethmann, D., Dwivedi, R., Eris, E., Farmer, W. H., Feiccabrino, J., Ferguson, G., Ferrari, E., Ferraris, S., Fersch, B., Finger, D., Foglia, L., Fowler, K., Gartsman, B., Gascoin, S., Gaume, E., Gelfan, A., Geris, J., Gharari, S., Gleeson, T., Glendell, M., Gonzalez Bevacqua, A., González-Dugo, M. P., Grimaldi, S., Gupta, A. B., Guse, B., Han, D., Hannah, D., Harpold, A., Haun, S., Heal, K., Helfricht, K., Herrnegger, M., Hipsey, M., Hlaváčiková, H., Hohmann, C., Holko, L., Hopkinson, C., Hrachowitz, M., Illangasekare, T. H., Inam, A., Innocente, C., Istanbulluoglu, E., Jarihani, B., Kalantari, Z., Kalvans, A., Khanal, S., Khatami, S., Kiesel, J., Kirkby, M., Knoben, W., Kochanek, K., Kohnová, S., Kolechkina, A., Krause, S., Kreamer, D., Kreibich, H., Kunstmann, H., Lange, H., Liberato, M. L. R., Lindquist, E., Link, T., Liu, J., Loucks, D. P., Luce, C., Mahé, G., Makarieva, O., Malard, J., Mashtayeva, S., Maskey, S., Mas-Pla, J., Mavrova-Guirguinova, M., Mazzoleni, M., Mernild, S., Misstear, B. D., Montanari, A., Müller-Thomy, H., Nabizadeh, A., Nardi, F., Neale, C., Nesterova, N., Nurtaev, B., Odongo, V. O., Panda, S., Pande, S., Pang, Z., Papacharalampous, G., Perrin, C., Pfister, L., Pimentel, R., Polo, M. J., Post, D., Prieto Sierra, C., Ramos, M.-H., Renner, M., Reynolds, J. E., Ridolfi, E., Rigon, R., Riva, M., Robertson, D. E., Rosso, R., Roy, T., Sá, J. H. M., Salvadori, G., Sandells, M., Schaefli, B., Schumann, A., Scolobig, A., Seibert, J., Servat, E., Shafiei, M., Sharma, A., Sidibe, M., Sidle, R. C., Skaugen, T., Smith, H., Spiessl, S. M., Stein, L., Steinsland, I., Strasser, U., Su, B., Szolgay, J., Tarboton, D., Tauro, F., Thirel, G., Tian, F., Tong, R., Tussupova, K., Tyralis, H., Uijlenhoet, R., van Beek, R., van der Ent, R. J., van der Ploeg, M., Van Loon, A. F., van Meerveld, I., van Nooijen, R., van Oel, P. R., Vidal, J.-P., von Freyberg, J., Vorogushyn, S., Wachniew, P., Wade, A. J., Ward, P., Westerberg, I. K., White, C., Wood, E. F., Woods, R., Xu, Z., Yilmaz, K. K., and Zhang, Y. : Twenty-three unsolved problems in hydrology (UPH) – a community perspective, Hydrol. Sci. J., 64, 1141–1158, https://doi.org/10.1080/02626667.2019.1620507, 2019.
Brunner, M. I. and Fischer, S.: Snow-influenced floods are more strongly connected in space than purely rainfall-driven floods, Environ. Res. Lett., 17, 104038, https://doi.org/10.1088/1748-9326/ac948f, 2022.
Crawford, A. D., Alley, K. E., Cooke, A. M., and Serreze, M. C.: Synoptic climatology of rain-on-snow events in Alaska, Mon. Weather Rev., 148, 1275–1295, https://doi.org/10.1175/MWR-D-19-0311.1, 2020.
Cui, G., Anderson, M., and Bales, R.: Runoff response to the uncertainty from key water-budget variables in a seasonally snow-covered mountain basin, J. Hydrol. Reg. Stud., 50, 101601, https://doi.org/10.1016/j.ejrh.2023.101601, 2023.
Earman, S., Campbell, A. R., Phillips, F. M., and Newman, B. D.: Isotopic exchange between snow and atmospheric water vapor: Estimation of the snowmelt component of groundwater recharge in the southwestern United States, J. Geophys. Res., 111, D09302, https://doi.org/10.1029/2005JD006470, 2006.
Etter, S., Addor, N., Huss, M., and Finger, D.: Climate change impacts on future snow, ice and rain runoff in a Swiss mountain catchment using multi-dataset calibration, J. Hydrol. Reg. Stud., 13, 222–239, https://doi.org/10.1016/j.ejrh.2017.08.005, 2017.
Freudiger, D., Kohn, I., Stahl, K., and Weiler, M.: Large-scale analysis of changing frequencies of rain-on-snow events with flood-generation potential, Hydrol. Earth Syst. Sci., 18, 2695–2709, https://doi.org/10.5194/hess-18-2695-2014, 2014.
Garvelmann, J., Pohl, S., and Weiler, M.: Variability of Observed Energy Fluxes during Rain-on-Snow and Clear Sky Snowmelt in a Midlatitude Mountain Environment, J. Hydrometeorol., 15, 1220–1237, https://doi.org/10.1175/JHM-D-13-0187.1, 2014.
Garvelmann, J., Pohl, S., and Weiler, M.: Spatio-temporal controls of snowmelt and runoff generation during rain-on-snow events in a mid-latitude mountain catchment, Hydrol. Process., 29, 3649–3664, https://doi.org/10.1002/hyp.10460, 2015.
Girons Lopez, M., Vis, M. J. P., Jenicek, M., Griessinger, N., and Seibert, J.: Assessing the degree of detail of temperature-based snow routines for runoff modelling in mountainous areas in central Europe, Hydrol. Earth Syst. Sci., 24, 4441–4461, https://doi.org/10.5194/hess-24-4441-2020, 2020.
Grenfell, T. C. and Putkonen, J.: A method for the detection of the severe rain-on-snow event on Banks Island, October 2003, using passive microwave remote sensing, Water Resour. Res., 44, 3425, https://doi.org/10.1029/2007WR005929, 2008.
Gutiérrez, J. M., Jones, R. G., Narisma, G. T., Alves, L. M., Amjad, M., Gorodetskaya, I. V., Grose, M., Klutse, N. A. B., Krakovska, S., Li, J., Martinez-Castro, D., Mearns, L. O., Mernild, S. H., Ngo-Duc, T., van den Hurk, B., and Yoon, J. H.: Atlas, in: Climate Change 2021 – The Physical Science Basis, Cambridge University Press, 1927–2058, https://doi.org/10.1017/9781009157896.021, 2021.
Hale, K. E., Jennings, K. S., Musselman, K. N., Livneh, B., and Molotch, N. P.: Recent decreases in snow water storage in western North America, Commun. Earth Environ., 4, 1–11, https://doi.org/10.1038/s43247-023-00751-3, 2023.
Hotovy, O. and Jenicek, M.: The impact of changing subcanopy radiation on snowmelt in a disturbed coniferous forest, Hydrol. Process., 34, 5298–5314, https://doi.org/10.1002/hyp.13936, 2020.
Hotovy, O., Nedelcev, O., and Jenicek, M.: Changes in rain-on-snow events in mountain catchments in the rain–snow transition zone, Hydrol. Sci. J., 68, 572–584, https://doi.org/10.1080/02626667.2023.2177544, 2023.
Jenicek, M. and Ledvinka, O.: Importance of snowmelt contribution to seasonal runoff and summer low flows in Czechia, Hydrol. Earth Syst. Sci., 24, 3475–3491, https://doi.org/10.5194/hess-24-3475-2020, 2020.
Jenicek, M., Hnilica, J., Nedelcev, O., and Sipek, V.: Future changes in snowpack will impact seasonal runoff and low flows in Czechia, J. Hydrol. Reg. Stud., 37, 100899, https://doi.org/10.1016/j.ejrh.2021.100899, 2021.
Jenicek, M., Nedelcev, O., and Hotovy, O.: Supplementary data: Rain-on-snow events in mountainous catchments under climate change, Zenodo [data set], https://doi.org/10.5281/zenodo.12772038, 2024.
Jennings, K. S., Winchell, T. S., Livneh, B., and Molotch, N. P.: Spatial variation of the rain-snow temperature threshold across the Northern Hemisphere, Nat. Commun., 9, 1–9, https://doi.org/10.1038/s41467-018-03629-7, 2018.
Il Jeong, D. and Sushama, L.: Rain-on-snow events over North America based on two Canadian regional climate models, Clim. Dynam., 50, 303–316, https://doi.org/10.1007/s00382-017-3609-x, 2017.
Juras, R., Blöcher, J. R., Jenicek, M., Hotovy, O., and Markonis, Y.: What affects the hydrological response of rain-on-snow events in low-altitude mountain ranges in Central Europe?, J. Hydrol., 603, 127002, https://doi.org/10.1016/j.jhydrol.2021.127002, 2021.
Kotlarski, S., Gobiet, A., Morin, S., Olefs, M., Rajczak, J., and Samacoïts, R.: 21st Century alpine climate change, Clim. Dynam., 60, 65–86, https://doi.org/10.1007/s00382-022-06303-3, 2023.
Li, D., Lettenmaier, D. P., Margulis, S. A., and Andreadis, K.: The Role of Rain-on-Snow in Flooding Over the Conterminous United States, Water Resour. Res., 55, 8492–8513, https://doi.org/10.1029/2019WR024950, 2019.
Li, Z., Chen, Y., Li, Y., and Wang, Y.: Declining snowfall fraction in the alpine regions, Central Asia, Sci. Rep., 10, 1–12, https://doi.org/10.1038/s41598-020-60303-z, 2020.
Lindström, G., Johansson, B., Persson, M., Gardelin, M., and Bergström, S.: Development and test of the distributed HBV-96 hydrological model, J. Hydrol., 201, 272–288, https://doi.org/10.1016/S0022-1694(97)00041-3, 1997.
López-Moreno, J. I., Pomeroy, J. W., Morán-Tejeda, E., Revuelto, J., Navarro-Serrano, F. M., Vidaller, I., and Alonso-González, E.: Changes in the frequency of global high mountain rain-on-snow events due to climate warming, Environ. Res. Lett., 16, 094021, https://doi.org/10.1088/1748-9326/ac0dde, 2021.
Magnusson, J., Gustafsson, D., Hüsler, F., and Jonas, T.: Assimilation of point SWE data into a distributed snow cover model comparing two contrasting methods, Water Resour. Res., 50, 7816–7835, https://doi.org/10.1002/2014WR015302, 2014.
Maina, F. Z. and Kumar, S. V.: Diverging Trends in Rain-On-Snow Over High Mountain Asia, Earth's Futur., 11, e2022EF003009, https://doi.org/10.1029/2022EF003009, 2023.
Mccabe, G. J., Clark, M. P., and Hay, L. E.: Rain-on-snow events in the western United States, B. Am. Meteorol. Soc., 88, 319–328, https://doi.org/10.1175/BAMS-88-3-319, 2007.
Mooney, P. A. and Li, L.: Near future changes to rain-on-snow events in Norway, Environ. Res. Lett., 16, 064039, https://doi.org/10.1088/1748-9326/abfdeb, 2021.
Morán-Tejeda, E., López-Moreno, J. I., Stoffel, M., and Beniston, M.: Rain-on-snow events in Switzerland: Recent observations and projections for the 21st century, Clim. Res., 71, 111–125, https://doi.org/10.3354/cr01435, 2016.
Moriasi, D. N., Gitau, M. W., Pai, N., and Daggupati, P.: Hydrologic and water quality models: Performance measures and evaluation criteria, Trans. ASABE, 58, 1763–1785, https://doi.org/10.13031/trans.58.10715, 2015.
Mott, R., Winstral, A., Cluzet, B., Helbig, N., Magnusson, J., Mazzotti, G., Quéno, L., Schirmer, M., Webster, C., and Jonas, T.: Operational snow-hydrological modeling for Switzerland, Front. Earth Sci., 11, 1–20, https://doi.org/10.3389/feart.2023.1228158, 2023.
Musselman, K. N., Lehner, F., Ikeda, K., Clark, M. P., Prein, A. F., Liu, C., Barlage, M., and Rasmussen, R.: Projected increases and shifts in rain-on-snow flood risk over western North America, https://doi.org/10.1038/s41558-018-0236-4, 2018.
Myers, D. T., Ficklin, D. L., and Robeson, S. M.: Hydrologic implications of projected changes in rain-on-snow melt for Great Lakes Basin watersheds, Hydrol. Earth Syst. Sci., 27, 1755–1770, https://doi.org/10.5194/hess-27-1755-2023, 2023.
Nedelcev, O. and Jenicek, M.: Trends in seasonal snowpack and their relation to climate variables in mountain catchments in Czechia, Hydrol. Sci. J., 66, 2340–2356, https://doi.org/10.1080/02626667.2021.1990298, 2021.
Notarnicola, C.: Hotspots of snow cover changes in global mountain regions over 2000–2018, Remote Sens. Environ., 243, 111781, https://doi.org/10.1016/j.rse.2020.111781, 2020.
Ohba, M. and Kawase, H.: Rain-on-Snow events in Japan as projected by a large ensemble of regional climate simulations, Clim. Dynam., 55, 2785–2800, https://doi.org/10.1007/s00382-020-05419-8, 2020.
Oudin, L., Hervieu, F., Michel, C., Perrin, C., Andréassian, V., Anctil, F., and Loumagne, C.: Which potential evapotranspiration input for a lumped rainfall-runoff model? Part 2 – Towards a simple and efficient potential evapotranspiration model for rainfall-runoff modelling, J. Hydrol., 303, 290–306, https://doi.org/10.1016/j.jhydrol.2004.08.026, 2005.
Pall, P., Tallaksen, L. M., and Stordal, F.: A climatology of rain-on-snow events for Norway, J. Climate, 32, 6995–7016, https://doi.org/10.1175/JCLI-D-18-0529.1, 2019.
Parajka, J., Bezak, N., Burkhart, J., Hauksson, B., Holko, L., Hundecha, Y., Jenicek, M., Krajčí, P., Mangini, W., Molnar, P., Riboust, P., Rizzi, J., Sensoy, A., Thirel, G., and Viglione, A.: Modis snowline elevation changes during snowmelt runoff events in Europe, J. Hydrol. Hydromechanics, 67, 101–109, https://doi.org/10.2478/johh-2018-0011, 2019.
Poschlod, B., Zscheischler, J., Sillmann, J., Wood, R. R., and Ludwig, R.: Climate change effects on hydrometeorological compound events over southern Norway, Weather Clim. Extrem., 28, 100253, https://doi.org/10.1016/j.wace.2020.100253, 2020.
Schirmer, M., Winstral, A., Jonas, T., Burlando, P., and Peleg, N.: Natural climate variability is an important aspect of future projections of snow water resources and rain-on-snow events, The Cryosphere, 16, 3469–3488, https://doi.org/10.5194/tc-16-3469-2022, 2022.
Seibert, J. and Bergström, S.: A retrospective on hydrological catchment modelling based on half a century with the HBV model, Hydrol. Earth Syst. Sci., 26, 1371–1388, https://doi.org/10.5194/hess-26-1371-2022, 2022.
Seibert, J. and Vis, M. J. P.: Teaching hydrological modeling with a user-friendly catchment-runoff-model software package, Hydrol. Earth Syst. Sci., 16, 3315–3325, https://doi.org/10.5194/hess-16-3315-2012, 2012.
Sezen, C., Sraj, M., Medved, A., and Bezak, N.: Investigation of rain-on-snow floods under climate change, Appl. Sci., 10, https://doi.org/10.3390/app10041242, 2020.
Sikorska-Senoner, A. E. and Seibert, J.: Flood-type trend analysis for alpine catchments, Hydrol. Sci. J., 65, 1281–1299, https://doi.org/10.1080/02626667.2020.1749761, 2020.
Surfleet, C. G. and Tullos, D.: Variability in effect of climate change on rain-on-snow peak flow events in a temperate climate, J. Hydrol., 479, 24–34, https://doi.org/10.1016/j.jhydrol.2012.11.021, 2013.
Suriano, Z. J.: North American rain-on-snow ablation climatology, Clim. Res., 87, 133–145, https://doi.org/10.3354/cr01687, 2022.
Trubilowicz, J. W. and Moore, R. D.: Quantifying the role of the snowpack in generating water available for run-off during rain-on-snow events from snow pillow records, Hydrol. Process., 31, 4136–4150, https://doi.org/10.1002/hyp.11310, 2017.
Urban, G., Richterová, D., Kliegrová, S., and Zusková, I.: Reasons for shortening snow cover duration in the Western Sudetes in light of global climate change, Int. J. Climatol., 43, 5485–5511, https://doi.org/10.1002/joc.8157, 2023.
Wayand, N. E., Lundquist, J. D., and Clark, M. P.: Modeling the influence of hypsometry, vegetation, and storm energy on snowmelt contributions to basins during rain-on-snow floods, Water Resour. Res., 51, 8551–8569, https://doi.org/10.1002/2014WR016576, 2015.
Würzer, S., Jonas, T., Wever, N., and Lehning, M.: Influence of Initial Snowpack Properties on Runoff Formation during Rain-on-Snow Events, J. Hydrometeorol., 17, 1801–1815, https://doi.org/10.1175/JHM-D-15-0181.1, 2016.
Yang, T., Li, Q., Hamdi, R., Chen, X., Zou, Q., Cui, F., De Maeyer, P., and Li, L.: Trends and spatial variations of rain-on-snow events over the high Mountain Asia, J. Hydrol., 614, 128593, https://doi.org/10.1016/j.jhydrol.2022.128593, 2022.
Yang, Z., Chen, R., Liu, Y., Zhao, Y., Liu, Z., and Liu, J.: The impact of rain-on-snow events on the snowmelt process: A field study, Hydrol. Process., 37, e15019, https://doi.org/10.1002/hyp.15019, 2023.