the Creative Commons Attribution 4.0 License.
the Creative Commons Attribution 4.0 License.
 | 08 Sep 2025
Comparison of high-resolution climate reanalysis datasets for hydro-climatic impact studies
Joren Janzing
Amber van Hamel
Jonas Götte
Dominik L. Schumacher
Manuela I. Brunner
Continuous high-quality meteorological information is needed to describe and understand extreme hydro-climatic events, such as droughts and floods. Observation-based information of the highest quality is often only available on a national level and for a few meteorological variables. As an alternative, large-scale climate reanalysis datasets that blend model simulations with observations are often used. However, their performance can be biased due to coarse spatial resolutions, model uncertainty, and data assimilation biases. Previous studies on the performance of reanalysis datasets either focused on the global scale, on single variables, or on a few aspects of the hydro-climate. Therefore, we here conduct a comprehensive spatio-temporal evaluation of different precipitation, temperature, and snowfall metrics for four state-of-the-art reanalysis datasets (ERA5, ERA5-Land, CERRA, and CHELSA-v2.1) over complex terrain. We consider the climatologies of mean and extreme climate metrics, daily to inter-annual variability, as well as consistency in long-term trends. Further, we compare the representation of extreme events, namely, the intensity and severity of the 2003 and 2018 meteorological droughts as well as the 1999 and 2005 heavy precipitation events that triggered flooding in Switzerland. The datasets generally show a satisfactory performance for most of these characteristics, except for the representation of snowfall (solid precipitation) and the number of wet days in ERA5 and ERA5-Land. Our results show that there are clear differences in the representation of precipitation among datasets, with CERRA showing a substantial improvement in the representation of precipitation compared to the other datasets. In contrast to precipitation, temperature is more comparable across datasets, with CERRA and CHELSA showing smaller biases but a clear increase in bias with elevation. All the datasets were able to identify the 2003 and 2018 drought events; however, ERA5, ERA5-Land, and CHELSA overestimated their intensity and severity, while CERRA underestimated them. The 1999 and 2005 floods were overall well represented by all the datasets, with CERRA showing the best agreement with observations, and the other datasets overestimating the spatial extent of the events. We conclude that, overall, CERRA is the most reliable dataset and suitable for a broad range of analyses, particularly for regions where snow processes are relevant and for applications where the representation of daily to inter-annual precipitation variability is important.
- Article
(8493 KB) - Full-text XML
-
Supplement
(11847 KB) - BibTeX
- EndNote


Continuous and high-quality gridded meteorological datasets are crucial for describing, understanding, and monitoring extreme hydro-climatic events, such as droughts and floods. However, identifying suitable meteorological datasets for hydrological applications is challenging, especially over complex terrain, where climate is influenced by orographic effects (Napoli et al., 2019), and high-quality information is available only from a few observational stations. Many different types of datasets exist, ranging from gauge-based data and gridded products interpolated from these station data to satellite-derived products, reanalysis products, and products that merge information from multiple sources (Roca et al., 2019; Vidal et al., 2009; Soci et al., 2016). Among these, gauge-based and interpolated observations are often seen as “ground truth” or benchmark datasets (Sun et al., 2018) and offer the best source of meteorological data for hydrological modeling (Tarek et al., 2020), especially in regions with dense station networks and long homogeneous records. Such gridded observation-based products provide temperature and precipitation fields by spatially interpolating point information from measurement stations onto a grid using different deterministic interpolation schemes of varying complexity (e.g., Hofstra et al., 2008; Daly et al., 2008; Rauthe et al., 2013; Frei, 2013). While of high quality, these observation-based products are often only available on the national level (e.g., Frei, 2013; Krähenmann et al., 2016), or for some trans-boundary catchments (e.g., Rauthe et al., 2013; Lussana et al., 2019; Isotta et al., 2013), and most of them are only available for a limited number of meteorological variables (i.e., precipitation and/or temperature). However, consistent data across larger scales and for multiple variables are desirable, as droughts and floods often extend across large regions. Reanalysis datasets, unlike purely observation-based datasets, are available over larger domains and provide physically consistent information on multiple variables, including precipitation and temperature (e.g., Hersbach et al., 2020; Gelaro et al., 2017).
Reanalysis datasets use numerical models (Dee et al., 2014) to create a realistic representation of past atmospheric, ocean, and land-surface states. Reanalysis systems utilize various data assimilation schemes to integrate observed surface and atmospheric conditions (e.g., pressure, humidity, temperature, and wind) to constrain simulations to large-scale observed Earth system states (Hersbach et al., 2020; Ridal et al., 2024). For example, in the case of a large-scale drought event caused by a stable high-pressure system, the reanalysis system will simulate a comparable blocking-type weather regime, based on the assimilated pressure and wind fields. Further, the associated precipitation anomalies will be simulated as a response to the modeled system states. Given that, for example, precipitation processes are unresolved on coarse model scales, and hence depend on the internal model structure and implemented physical equations (i.e., parameterization), they will suffer from model uncertainties. Therefore, simulated precipitation and temperature fields can differ from local observations and vary greatly across reanalysis datasets relying on different modeling systems (Alexander et al., 2020; Sun et al., 2018).
As it is computationally expensive to run reanalyses on the continental and global scale, large-domain simulations often use a limited spatial resolution. The current generation of the most widely used global reanalysis datasets have spatial resolutions between 31 and 60 km. These include the fifth-generation European Centre for Medium-Range Weather Forecasts (ECMWF) reanalysis dataset (ERA5, ≈31 km; Hersbach et al., 2020), the Modern-Era Retrospective analysis for Research and Applications, Version 2 (MERRA-2, ≈50 km; Gelaro et al., 2017), and the Japanese 55-year Reanalysis (JRA-55, ≈79 km; Kobayashi et al., 2015). Because of their coarse spatial resolutions, these datasets fail to deliver information at impact-relevant scales. To provide higher-resolution climate information, and to better represent water and energy cycles over land, ECMWF has produced an offline land-surface model simulation forced with bilinearly interpolated atmospheric fields from ERA5, resulting in the ERA5-Land dataset at a ≈9 km spatial resolution (Muñoz-Sabater et al., 2021). At continental scales, even higher-resolution regional reanalysis products can be produced by dynamically downscaling global reanalysis information over a limited area with or without an additional data assimilation scheme (Bollmeyer et al., 2014). Thereby, the regional reanalysis system is one-way nested within the global reanalysis, which means that the global reanalysis delivers the large-scale boundary and initial conditions for the higher resolution numerical model over the target region. Examples of such regional reanalysis products include the Copernicus European Regional Reanalysis (CERRA) at 5.5 km horizontal resolution (Ridal et al., 2024) and the COSMO-REA6 by the German Weather Service at 6 km resolution (Bollmeyer et al., 2014). Because many applications require even higher resolution data (Karger et al., 2023; Brun et al., 2022; Willkofer et al., 2020), there have been many efforts to statistically downscale global reanalysis datasets in a physically meaningful way, for example, the Climatologies at High resolution for the Earth’s Land Surface Areas (CHELSA) datasets (Karger et al., 2017, 2021b) provide refined information at an approximately 1 km resolution.
The main advantage of global and regional climate reanalyses is that they provide continuous and physically consistent time series of many surface and atmospheric variables across space and time. Therefore, they are increasingly used to study and model hydro-climatic extremes. Choosing a suitable dataset for a particular hydrological application is not a straightforward process, owing to the wide range of available data products (by various providers) at different temporal and spatial resolutions and with different spatial domains. Choosing a dataset would require information on dataset performance with respect to key climatic variables, including temperature and precipitation. In other words, thorough comparisons of reanalysis datasets and gridded observations are required, as both are used as climatic reference conditions in various applications, including those pertaining to understanding the drivers of hydrological drought (e.g., Bakke et al., 2020; Brunner et al., 2023); tracking the propagation of drought from the atmosphere to the hydrosphere (Brunner and Chartier-Rescan, 2024); simulating streamflow with hydrological models to understand the risk of floods (e.g., Brunner and Fischer, 2022; Willkofer et al., 2020); analyzing elevation-dependent trends in mean and extreme precipitation across mountain regions (Ferguglia et al., 2024); and evaluating climate model performance and bias adjustment (e.g., Vautard et al., 2021; Tootoonchi et al., 2022).
There is ample evidence that the choice of reanalysis dataset can influence the results and conclusions of hydrological impact studies (e.g., Kotlarski et al., 2017; Gampe et al., 2019; Tarek et al., 2021. Therefore, several studies have compared different sets of reanalysis datasets with respect to various climate characteristics. For example, Bandhauer et al. (2021) evaluated precipitation in ERA5 for three mountain regions in Europe, while Lavers et al. (2022) examined extreme precipitation across 5637 precipitation stations quasi-globally. Both studies concluded that ERA5 has deficiencies in modeling precipitation characteristics, such as means and wet day frequency and extremes, compared to high-resolution gridded observations and station data. Gebrechorkos et al. (2024) assessed ERA5-Land precipitation for streamflow simulations worldwide, concluding that it performs better than other datasets, but that there is not one single global precipitation dataset that performed best in all catchments. Tarek et al. (2020) assessed the value of ERA5 in North American catchments, showing that ERA5 leads to improved hydrological performance compared to its predecessor, ERA-Interim, but that observations remain the best source of precipitation data for hydrological modeling. McClean et al. (2023) evaluated the capabilities of global reanalysis products for flood risk modeling in river catchments in Northern England and showed that the higher resolution ERA5-Land has lower errors compared to coarser resolution reanalysis datasets. Dura et al. (2024) analyzed seven gridded precipitation products, including ERA5-Land and CERRA-Land, for their suitability to estimate precipitation enhancement with altitude in France. They found that ERA5-Land underestimates annual precipitation gradients for mid-range mountains and even more so in high-altitude regions, while CERRA-Land strongly correlates with annual observed precipitation, but it is slightly biased in some regions, and the bias may change the sign according to elevation. Monteiro and Morin (2023) compared ERA5, ERA5-Land, and CERRA-Land, among other datasets, concluding that CERRA-Land performs better in terms of modeling snow depth and snow seasonality in the European Alps, than ERA5 and ERA5-Land.
Most studies evaluating reanalysis datasets focused on one specific aspect, for example, the representation of precipitation. In addition, they stratified their analyses into very large spatial units, for example, the entire globe or mesoscale catchments and regions, which can hide dataset differences. Further, only a few of these studies provide information on reanalysis dataset performance with respect to the representation of extreme events, daily to interannual variability, and temporal trends. Therefore, while all of these studies provide valuable insights with respect to certain climatic characteristics for specific regions, it remains unclear how well different datasets perform in mountain regions in terms of representing temperature and precipitation characteristics. However, good performance in mountain regions is essential for climate monitoring, as they are hotspots of climate and hydrological change (Adler et al., 2022). A thorough reanalysis dataset comparison is needed in these regions, because dataset performance may vary greatly depending on elevation (Monteiro and Morin, 2023; Dura et al., 2024). Furthermore, an accurate representation of both temperature and precipitation as well as their interplay is crucial in these regions, because it determines the partitioning of liquid and solid precipitation and hence the build-up of snow storage. Along the climate-hydrological modeling chain, a misrepresentation of either of these variables can lead to a misrepresentation of hydrological extremes including floods and droughts. Therefore, the representation of all of these components is crucial for hydro-climatic impact studies, in particular, in regions with complex topography.
To understand which reanalysis products are most suitable for hydrological impact studies in the mountainous regions of Europe, we compare four state-of-the-art and widely used global and regional reanalysis datasets with gridded observations with respect to climate variables that are crucial to describing hydrological behavior, namely temperature and precipitation. Our analysis is focused on Switzerland because it shows a large climatic gradient owing to its complex topography, and because high-quality observation-based gridded datasets are available for benchmarking. To account for the variety in available reanalysis datasets, we compare the global ERA5 reanalysis dataset, its higher-resolution version over land (ERA5-Land), the regional reanalysis dataset for Europe (CERRA), and a statistically downscaled global reanalysis dataset (CHELSA). We evaluate these datasets by quantifying the differences between model simulations and gridded observations for different climate metrics, including mean and extreme climate metrics (Sects. 4.1, 4.2); precipitation and temperature variability across various temporal scales (Sect. 5.1); consistency in long-term trends (Sect. 5.2); snowfall estimates as a result of precipitation–temperature dependence (Sect. 4.3); and the spatial and temporal representation of observed severe droughts (Sect. 6.1) and heavy precipitation events that led to flooding in Switzerland (Sect. 6.2).
For our comparison, we use temperature and precipitation data from four reanalysis products as well as two gridded observational datasets, which we use as our benchmarks (Table 1). We limit our comparison to the period 1986–2020, based on the dataset with the shortest temporal coverage, i.e., the Copernicus European Regional ReAnalysis (CERRA). Although some reanalysis products provide data at a sub-daily time resolution, the comparison is performed at a daily resolution, which is the resolution of the observational benchmark dataset. As the datasets provide climate information at various grid resolutions and grid specifications, we quantify dataset differences based on catchment averages (Fig. 1).
2.1 Gridded observations
We use two gridded observational products from the Swiss Federal Office of Meteorology and Climatology (MeteoSwiss) as our benchmark products. These products use daily observations from measurement stations, which are spatially interpolated onto a 75 arcsec grid (≈2 km) over Switzerland. We use daily mean temperature (TabsD), which is based on data from 90 high-quality stations (MeteoSchweiz, 2021b; Frei, 2013), and precipitation (RhiresD), which provides total precipitation over a day, starting from 06:00 UTC, and is based on data from 650 measurement stations (MeteoSchweiz, 2021a; Schwarb, 2000). Here, these gridded MeteoSwiss products serve as a purely observation-based reference for comparing with the reanalysis datasets.
Hersbach et al. (2020)Muñoz-Sabater et al. (2021)Schimanke et al. (2021)Verrelle et al. (2022)Karger et al. (2023)MeteoSchweiz (2021a, b)Höge et al. (2023b)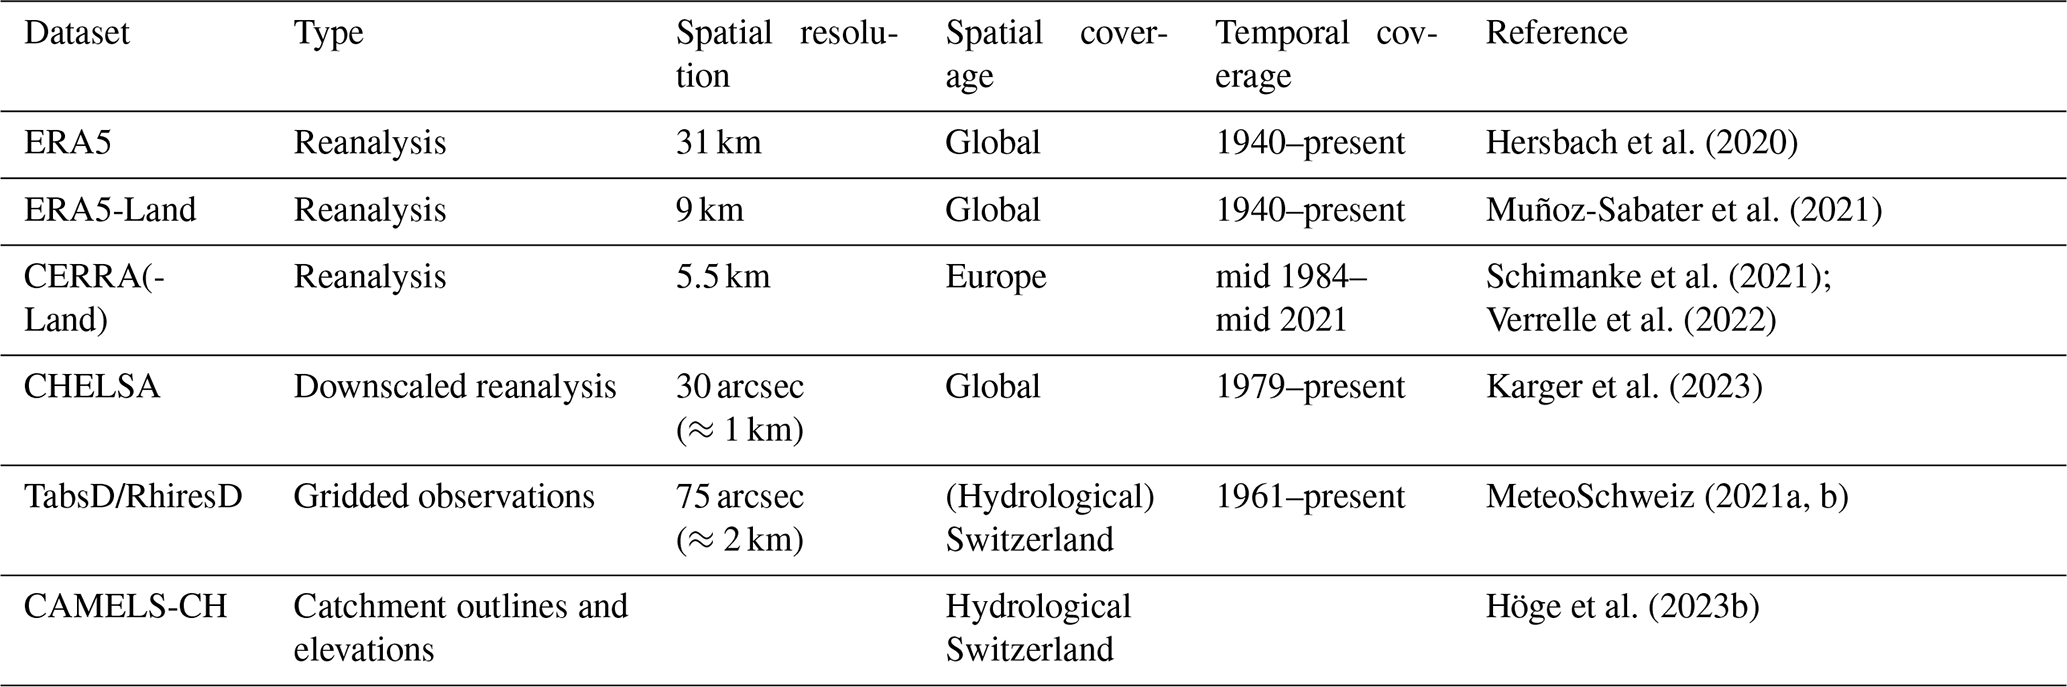
2.2 Reanalysis datasets
We selected the newest generation of reanalysis products with a high resolution, that is, the ERA5 suite (i.e., ERA5 and ERA5-Land) and two of its derivatives (CERRA and CHELSA). The datasets CERRA and CHELSA were chosen as they are expected to soon be extended back in time, offering a valuable tool at an even higher resolution. We chose to exclude other widely used global reanalysis products (i.e., MERRA2 or JRA-55), as they are only available at a very coarse spatial resolution (>50 km).
2.2.1 ERA5 and ERA5-Land
We use two reanalysis datasets from the ERA5 product family, namely, ERA5 and ERA5-Land. ERA5 is a global reanalysis dataset produced by the European Centre for Medium-Range Weather Forecasts (ECMWF), with a spatial resolution of 31 km and hourly temporal resolution (Hersbach et al., 2020). It is the coarsest resolution dataset that we consider. ERA5 is created with the Integrated Forecasting System Cy41r2 and covers the period from 1940 until the present. ERA5-Land uses linearly interpolated atmospheric forcing from ERA5 data to run the CHTESSEL (Carbon Hydrology-Tiled ECMWF Scheme for Surface Exchanges over Land) land-surface model at a spatial resolution of 9 km (Muñoz-Sabater et al., 2021). The dataset provides improved and additional land-surface variables (e.g., soil moisture, snow, or hydrological variables) compared to ERA5. The ERA5-Land precipitation data are provided as linearly interpolated fields from ERA5 without any adjustments – by linear interpolation onto the ERA5-Land grid (Muñoz-Sabater et al., 2021)– and accumulated to 24 h, whereas ERA5-Land temperature data were interpolated and adjusted using daily lapse rates – to account for the altitude differences between the ERA5 and ERA5-Land grids (Dutra et al., 2020; Muñoz-Sabater et al., 2021) – and are provided at an hourly time step.
2.2.2 CERRA
In addition to the two global reanalyses products, we use Copernicus European Regional ReAnalysis (CERRA), which provides data for Europe for the period from mid-1984 until mid-2021. The CERRA reanalysis system comprises multiple datasets, from which we use the CERRA high-resolution dataset for temperature (Schimanke et al., 2021; Ridal et al., 2024), which has a 5.5 km resolution and a 3-hourly temporal resolution, and the CERRA-Land dataset (Verrelle et al., 2022) for precipitation, which has a 5.5 km resolution and daily accumulation. CERRA is a classic reanalysis system based on the HARMONIE-ALADIN model (Bengtsson et al., 2017; Termonia et al., 2018), which utilizes data assimilation for atmospheric and surface conditions. Since it is a regional reanalysis system, it requires lateral boundary conditions, which are based on ERA5 model simulations (Ridal et al., 2024). CERRA-Land is a standalone simulation of the land-surface model, SURFEX v8.1, which delivers additional land-surface variables. SURFEX is driven by atmospheric variables from the CERRA high-resolution simulations and uses precipitation from the regional precipitation analysis system, MESCAN (Soci et al., 2016; Ridal et al., 2024). The MESCAN regional precipitation analysis system uses precipitation fields from the CERRA simulations as a first guess and incorporates additional in-situ observational rain gauge data through optimal interpolation (Soci et al., 2016). Because of this additional precipitation data assimilation, we use the CERRA-Land precipitation product instead of the CERRA product. We will refer to this dataset composed of CERRA temperature and CERRA-Land precipitation as CERRA.
2.2.3 CHELSA
Climatologies at High resolution for the Earth’s Land Surface Areas (CHELSA) products are statistically downscaled versions of large-scale reanalysis datasets, provided on a high resolution 30 arcsec grid (≈1 km at the Equator) (Karger et al., 2017, 2021b, 2023). Here, we use precipitation and temperature data from CHELSA version 2.1 (Karger et al., 2023, 2021a), which is based on a statistical downscaling of the W5E5 global reanalysis dataset (original spatial resolution of 0.5°) (Cucchi et al., 2020). W5E5 is a bias-adjusted version of ERA5 over land. The CHELSA high-resolution temperature data are based on an atmospheric lapse-rate downscaling (Karger et al., 2017), accounting for differences in orography between the 30 arcsec CHELSA topography – based on global multi-resolution terrain elevation data from GMTED2010 (Danielson and Gesch, 2011) – and the W5E5 topography, as well as lapse rates determined for different atmospheric pressure levels in ERA5. The precipitation data are based on a downscaling algorithm that uses spatial wind fields and boundary layer thickness to account for orographic wind effects (Karger et al., 2021b). The precipitation fluxes are thereby preserved at the 0.5° grid of the parent W5E5 dataset.
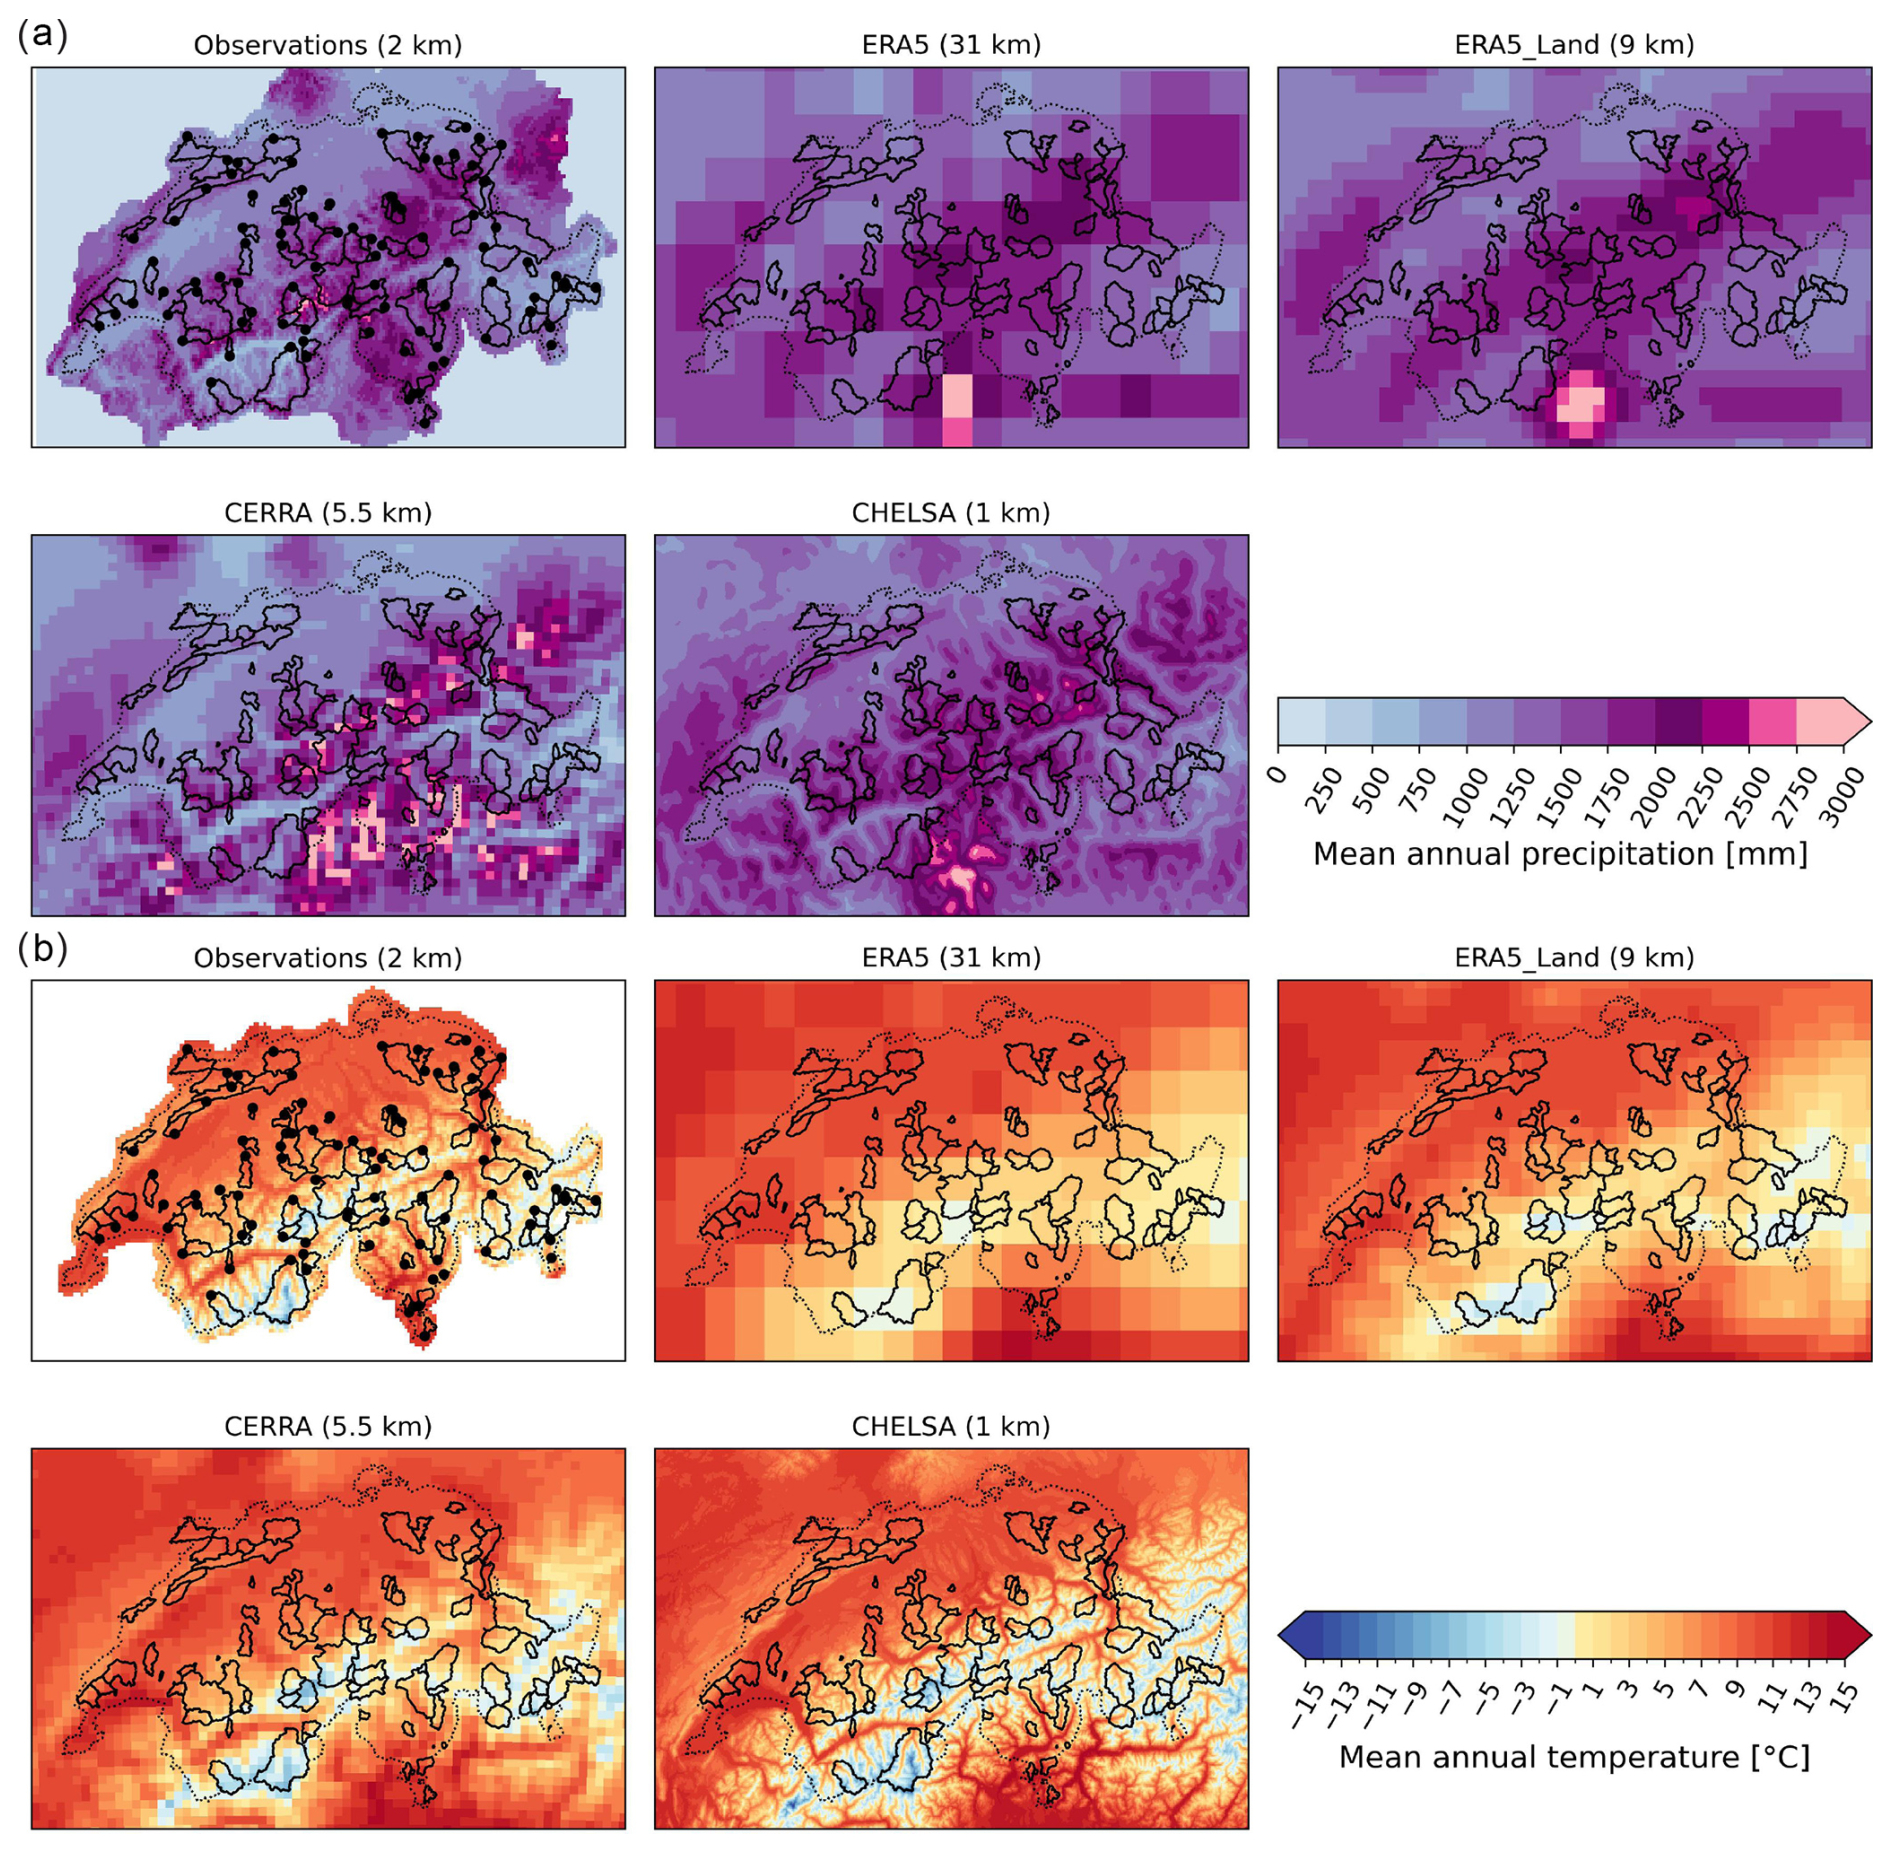
Figure 1Mean annual climatology for 1986–2020 for the five datasets at their original grid resolution. (a) Mean annual precipitation for the gridded observations, ERA5 reanalysis, ERA5-Land reanalysis, CERRA reanalysis, and CHELSA reanalysis (upper left to bottom right panels). (b) Mean annual temperature for the five datasets. Plots are overlaid with the outline of the 97 headwater catchments of the CAMELS-CH dataset (solid) and Swiss country borders (dotted). The observations in (a) and (b) are further overlaid with the catchment outlets (solid dots).
2.3 Catchments CAMELS-CH
For the calculation of catchment averages, we rely on catchment delineations from the CAMELS-CH dataset (Catchment Attributes and MEteorology for large-sample Studies – Switzerland; Höge et al., 2023b). CAMELS-CH is a large sample hydro-meteorological dataset providing catchment outlines and static attributes for 331 catchments in Switzerland and neighboring countries (i.e., hydrological Switzerland). We limit the analysis to 97 non-overlapping headwater catchments within the political borders of Switzerland. While all the reanalysis datasets provide data beyond the borders of Switzerland, the gridded temperature observations are limited to political Switzerland. For the analysis of elevation dependence, we use catchment elevation from the CAMELS-CH dataset. The selected catchments cover the three elevation bins, low (≤1000 m, n=32), mid (1000–2000 m, n=36), and high (>2000 m, n=29), with a comparable number of catchments in each bin.
To describe and identify the most important differences between datasets, we compare the four reanalysis datasets to the gridded observations for a broad range of precipitation, temperature, and snowfall metrics calculated (Sect. 3.1) at the catchment level. First, our comparison focuses on both the absolute and relative differences between the climate metrics derived from the reanalysis datasets and from the gridded observations. Second, we use these climate metrics to analyze the temporal consistency of precipitation and temperature variability (Sect. 3.2.1) as well as the consistency in long-term trends (Sect. 3.2.2). Last, we use catchment time series of precipitation to compare the spatial and temporal representation of two severe droughts (2003 and 2018) and two heavy precipitation events that led to severe floods in Switzerland (1999 and 2005) (Sect. 3.3).
To calculate metrics on the catchment level, we use two complementary approaches: a time-series-based approach, which first calculates time series of daily catchment averages and then calculates the metric of interest; and a metric-based approach, which first calculates the metric on the native dataset grid before averaging over the catchment. The time-series-based perspective provides information about the average state of the catchment from a hydrology perspective, while the metric-based perspective allows us to compare the average behavior of the index at the catchment scale.
3.1 Climate metrics
First, we compare general climatic characteristics, such as the long-term mean daily precipitation and temperature at the annual and seasonal scales, which are based on catchment average time series of daily precipitation and temperature (i.e., the time-series-based approach). To compare dataset differences, we calculate relative (%, precipitation metrics) and absolute differences (°C, temperature metrics) between the metrics of the reanalysis datasets and gridded observations for each catchment. Further, we check whether these differences are elevation dependent, i.e., vary with catchment elevation.
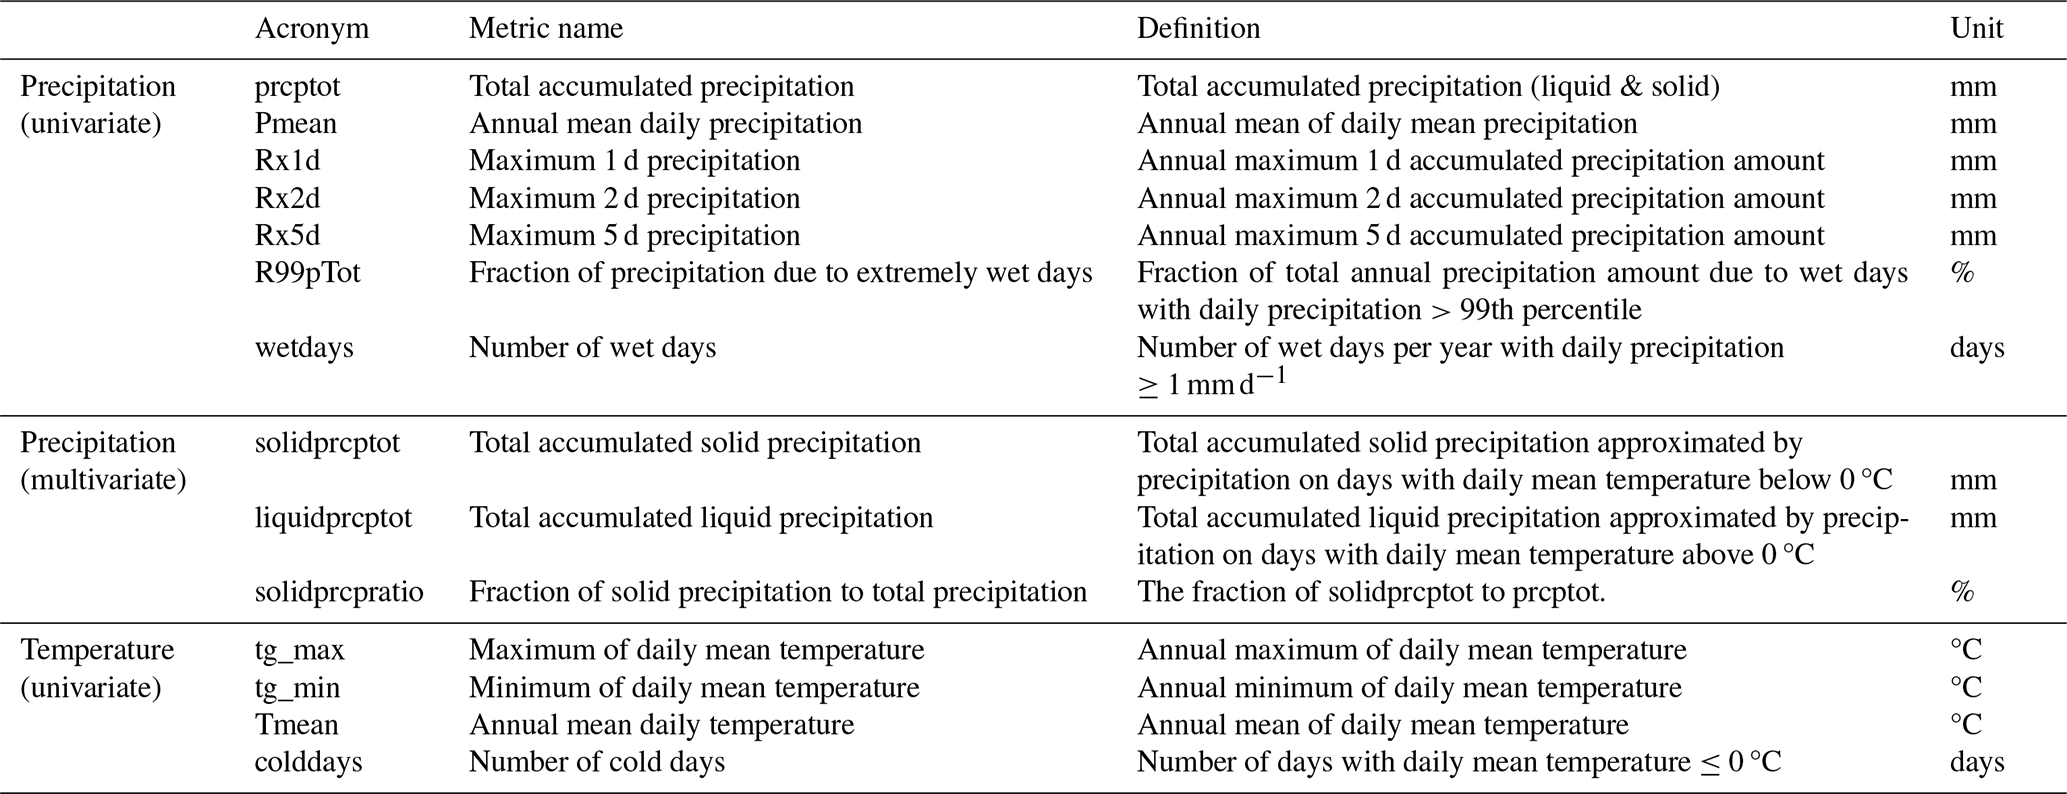
Second, we calculate a selection of univariate annual extreme and non-extreme precipitation and temperature metrics using the metric-based approach. To describe non-extreme precipitation characteristics, we consider the annual number of wet days (wetdays) within a year. To describe extreme precipitation characteristics, we use the annual maximum accumulated precipitation over 1 d (Rx1d), 2 d (Rx2d), and 5 d (Rx5d) and the fraction of the total annual accumulated precipitation falling on very wet days (R99pTot). To describe temperature, we consider the annual number of cold days (colddays), the annual maximum daily mean temperature (tg_max), and the annual minimum daily mean temperature (tg_min). All above metrics are based on a calendar year (Jan-Dec).
Lastly, we compare the datasets with respect to their representation of snowfall (i.e., solid precipitation), which is influenced by the interdependence of precipitation and temperature. While ERA5, ERA5-Land, and CERRA explicitly represent snow, CHELSA and observations do not. Therefore, we consistently approximate snowfall using a common temperature threshold for all reanalysis datasets and the observations. We separate precipitation into liquid and solid precipitation using 0 °C as a threshold, with liquid precipitation and solid precipitation falling above and below 0 °C, respectively. Our analysis focuses on the representation of total accumulated solid precipitation (solidprcptot) and the fraction of solid to total accumulated precipitation (liquid + solid) – both computed for the hydrological year (October–September) and following the metric-based approach.
A complete list of the metrics used for the comparison and their definitions are provided in Table 2. All climate metrics were calculated with the xclim Python package (Bourgault et al., 2023b).
3.2 Temporal consistency
3.2.1 Daily to annual variability
To compare the temporal consistency, we analyze the representation of daily, monthly, seasonal, and inter-annual temperature and precipitation variability. We define variability as the standard deviation of daily, monthly, and annual anomalies. Anomalies (absolute anomalies (K) for temperature, and relative anomalies (%) for precipitation) are computed using the 1986–2020 climatology of each dataset. Daily anomalies are calculated for each day of the year with a 30 d window centered on the day of interest for the climatology quantification. For monthly anomalies, we first calculate monthly means and then calculate anomalies based on the monthly climatology. Similarly, seasonal anomalies are calculated for winter (DJF), spring (MAM), summer (JJA), and fall (SON). Annual anomalies are based on annual means or extreme metrics (i.e., Rx1d, Rx5d, tg_max, tg_min) and their respective annual climatology. To compare datasets, we calculate the relative (%, precipitation metrics) and absolute differences (K, temperature metrics) between the variability of the reanalysis datasets and gridded observations for each catchment.
3.2.2 Trends
Next, we analyze the consistency of significant long-term trends and their trend magnitudes in various metrics across the different datasets and assess how well trends in the reanalysis match observed trends. For trend significance, we apply the Mann–Kendall test (Mann, 1945; Kendall, 1975) using 0.05 as the significance level. Further, as precipitation trends are typically masked by large internal variability (Wood and Ludwig, 2020; Wood, 2023), we additionally consider trends as weakly significant if the p-value lies between 0.05 and 0.1. Trends with p-values above 0.1 are considered non-significant and are labeled as “no trend”. The trend magnitude and sign are estimated using the Theil-Sen slope estimator (Sen, 1968). To assess the spatial consistency of trends, we compare the trends of each reanalysis dataset with trends in observations and test for each catchment whether the two datasets agree on the significance and sign of the trend. We label the test as true when both datasets show a significant trend and the same sign or when both datasets show no significant trend. The test is labeled false when either the observations show a significant trend and the reanalysis dataset shows no trend or vise versa, or when both datasets show a significant trend but they do not agree on the sign.
3.3 Extreme event analysis
Lastly, we compare the reanalysis datasets with respect to their ability to represent observed extreme events. Specifically, we analyze the consistency among the datasets for two distinct extreme event types – meteorological droughts and extreme precipitation. We compare the spatial and temporal representation of the 2003 and 2018 droughts as well as the extreme precipitation events in 1999 and 2005 that triggered floods in Switzerland. For both event types, we compare the severity – expressed by standardized precipitation values – and the intensity of the events, expressed by cumulative 6-month precipitation deficits (for droughts) or 2 d precipitation sums (for extreme precipitation).
3.3.1 Meteorological drought
In the summers of 2003 and 2018, Switzerland was affected by severe drought conditions (Brunner et al., 2019). In 2003, the drought resulted in reduced streamflow in the Rhine (−46 % of normal summer flow) and in the Aare catchments (−38 %) (Zappa and Kan, 2007). In 2018, Switzerland, on average, only received 57 % of its normal precipitation amount between April and September (MeteoSchweiz, 2019).
We analyze differences in drought intensity across the datasets by comparing the cumulative precipitation deficits from March until August in 2003 (2018). Deficits are calculated as the differences from the long-term mean of cumulative sums (March–August) in 1986–2020. The severity of the events is compared based on the widely used Standardized Precipitation Index (SPI) for a 6-month accumulation period (March–August), which we computed by transforming the 6-month sums to a standard normal distribution using a Gamma distribution (Lloyd-Hughes and Saunders, 2002; Stagge et al., 2015). The reference for the SPI-6 are all 6-month sums (March–August) in the period 1986–2020.
3.3.2 Extreme precipitation
In May 1999 and August 2005, Switzerland was affected by multiple extreme precipitation events, which triggered severe flooding in different parts of the country. For the May 1999 flood, we compare two precipitation events that occurred within 10 d of each other (11–12 and 21–22 May) and caused flooding in the Swiss Midlands (Hilker et al., 2009). For the August 2005 flood, we compare the single two-day precipitation event on 21–22 August, which affected the northern slopes of the Swiss Alps and caused widespread flooding in Central Switzerland and the Bernese Oberland (Beniston, 2006; Hilker et al., 2009). Similar to the drought analysis, we compare the representation of these events in terms of their intensity and severity. Intensity is defined as the 2 d precipitation sum during each of the events, and the severity is described using standardized precipitation. In contrast to the SPI-6 calculation for droughts, we apply standardization to all 2 d rolling precipitation sums in May or August. To also include extreme events from the adjacent months, we include ±15 d of the previous/past month to the rolling window calculation. Here, we fitted a generalized extreme value distribution prior to the transformation to a standard normal distribution to retrieve the 2 d SPI values. Precipitation sums less then 1 mm were excluded from the standardization to reduce the influence of the large number of zero precipitation days.
4.1 Mean climatology
The four reanalysis datasets differ only slightly in terms of their annual and seasonal precipitation and temperature climatology; however, on the catchment level, biases exist with respect to the observations (Fig. 2). Simulated mean daily precipitation is generally overestimated across catchments by most reanalysis datasets – except for CERRA, which shows median biases around 0 % – both at an annual and seasonal time scale (Fig. 2a). In general, precipitation biases do not show a clear elevation dependence; however, they can show slightly higher biases in lower and higher elevated catchments (see black markers in Fig. 2a). In summer, all the reanalysis datasets overestimate precipitation with respect to observations. The positive reanalysis biases are more pronounced in catchments at high and low elevations (>2000 and ≤1000 m a.s.l.), and they are less pronounced in catchments at mid-elevations (1000–2000 m a.s.l.) for all reanalysis datasets (Figs. 2a and S1).
In contrast, simulated mean daily temperature is generally slightly underestimated by most reanalysis datasets, or it matches observations well, and most datasets show comparable biases, except for ERA5 (Fig. 2b). ERA5 generally has a warm bias – except for winter – while the other reanalysis datasets have a slight cold bias of less than 1 °C (median bias). In winter, all the reanalyses show clear cold biases, with median catchment biases of at least −1 °C. They also show a strong elevation dependence, with larger biases at higher elevations (see Fig. 2b (black markers)). ERA5 and CERRA show smaller winter biases (median) than the other datasets. In summer, ERA5-Land, CERRA, and CHELSA show small biases (median biases around 0 °C) across most catchments, while ERA5 shows median biases of more than 1 °C, with a clear elevation dependence (i.e., warmer biases with higher elevation). In the other seasons (spring and fall) and annually, ERA5 shows warm biases without a clear elevation dependence and spatial pattern (Fig. S2), while the other datasets show comparably small cold biases and partially larger biases at higher elevations. In CERRA and CHELSA, biases generally show a pronounced dependence on elevation (i.e., higher biases at higher elevation) in most seasons with varying strength.
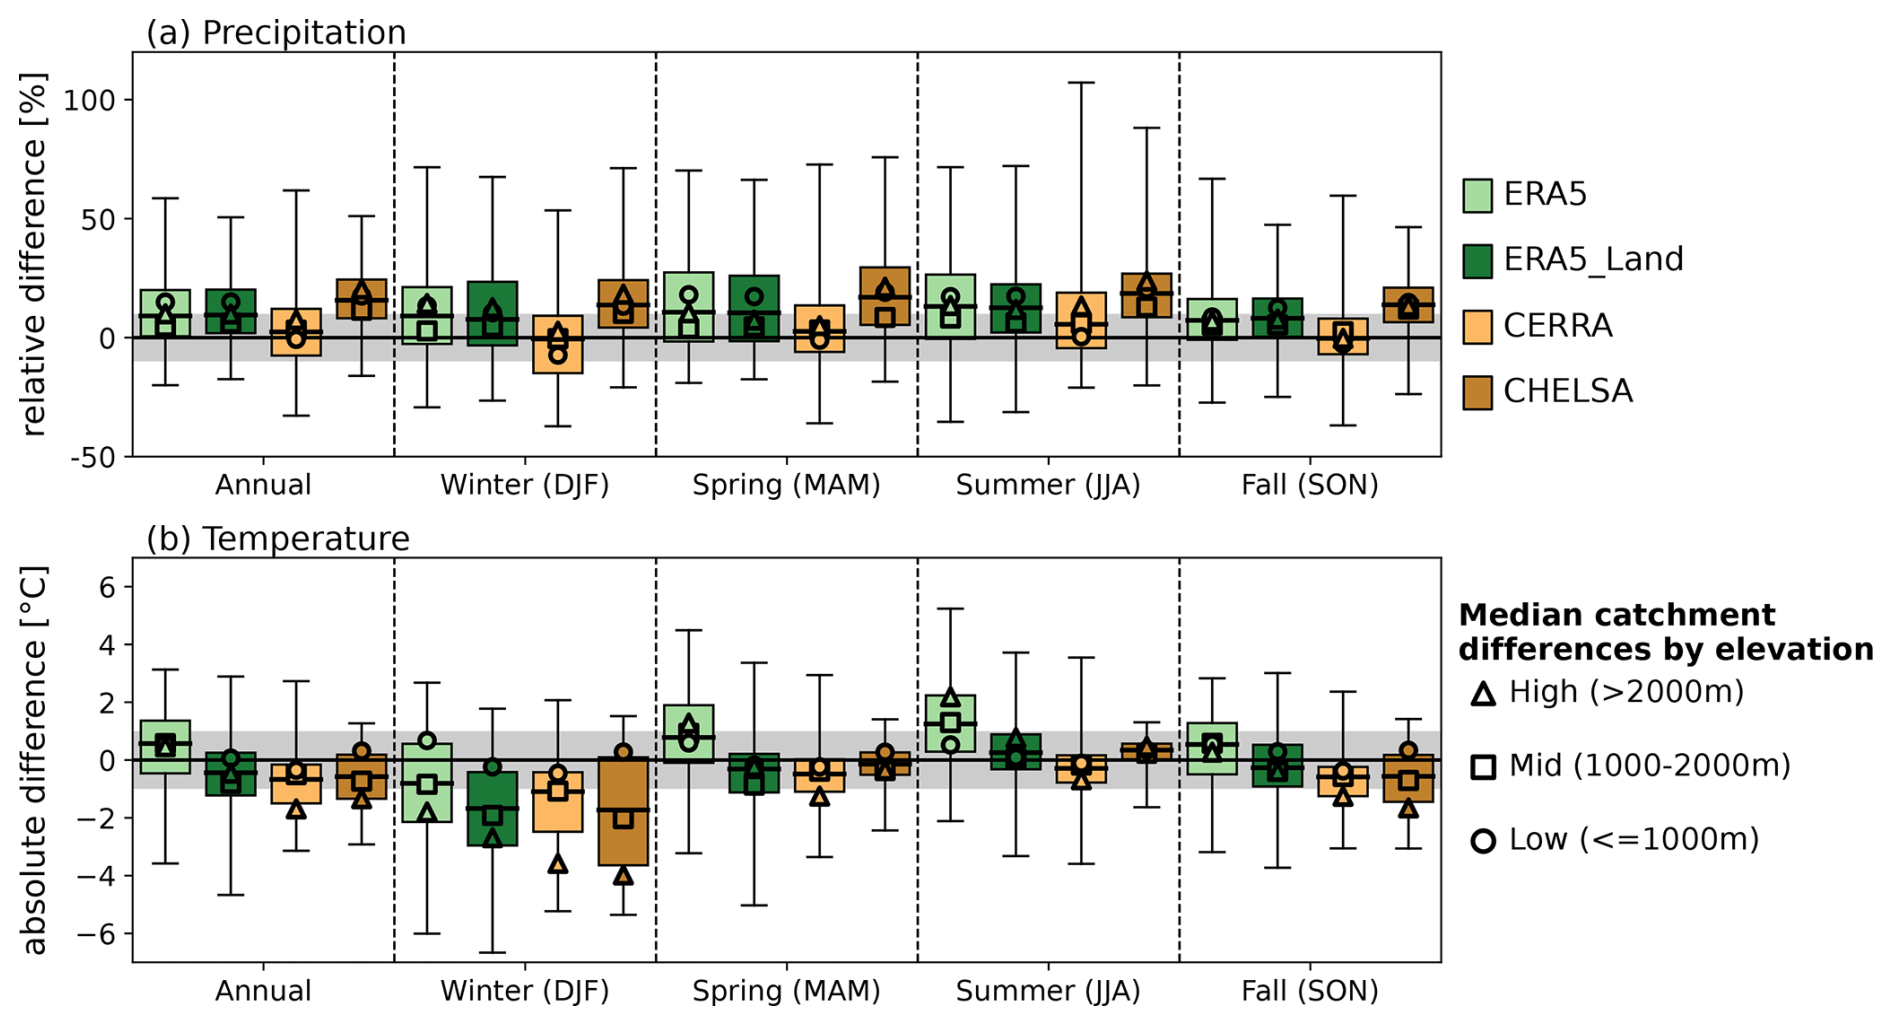
Figure 2Differences in the mean daily precipitation and temperature at the annual and seasonal scale between the catchment means of the reanalysis datasets and observations. Boxplots show the differences at the catchment level of (a) precipitation (relative in %) and (b) temperature (absolute in °C) for the entire year (all) and the four meteorological seasons (winter: December–February, spring: March–May, summer: June–August, fall: September–November). Boxplots are overlaid with median catchment biases by elevation bin (high: >2000 m (triangle), mid: 1000–2000 m (square), low: ≤1000 m (circle)). Gray shading indicates biases of ±10 % (a) and ±1 °C (b). Whiskers of the boxplots show min/max.
4.2 Extreme climatology
While reanalysis datasets only slightly vary in terms of mean climatology, they can substantially differ for certain extreme metrics, meaning that some products show stronger biases compared with observations than others (Fig. 3). These biases are strongest for extreme precipitation metrics, namely, mean annual maximum 1 d precipitation (Rx1d; Fig. 3a), fraction of total precipitation related to very wet days (R99pTot; Fig. 3b), and mean number of wet days per year (wetdays; Fig. 3c). All of these metrics are on average under- or overestimated by all reanalysis products, except by CERRA, which shows lower biases across all catchments. Rx1d, Rx5d, and R99pTot are underestimated by ERA5, ERA5-Land, and CHELSA across all elevation zones (Figs. 3a–c, S3 and S4), as precipitation is distributed across too many days with moderate precipitation intensity in all of these products, especially in catchments at higher elevations (Figs. 3d, S5). In contrast, CERRA captures both precipitation intensity (Rx1d and R99pTot) and the number of wet days well on average across all catchments, with slightly higher dry biases but too many wet days in high-elevation catchments (Figs. 3, S3, S4, and S5).
Biases in extreme temperature indicators are much less pronounced across all catchments and datasets than those related to extreme precipitation metrics (Fig. 3e–h). Mean annual maximum daily temperature is slightly overestimated by ERA5, with larger biases at high elevations, and it is underestimated by the other datasets. CERRA shows larger biases at higher elevations, while the biases of the other two datasets are less related to elevation (Figs. 3 and S6). ERA5 and ERA5-Land show a large spread of positive (low elevation) and negative (high elevation) biases in mean annual minimum daily temperatures. CERRA and CHELSA generally underestimate tg_min, especially at high elevations (Figs. 3f, S7). The number of cold days is underestimated by ERA5 and overestimated by ERA5-Land, CERRA, and CHELSA, with generally larger biases in high-elevation catchments (Figs. 3g, S8).
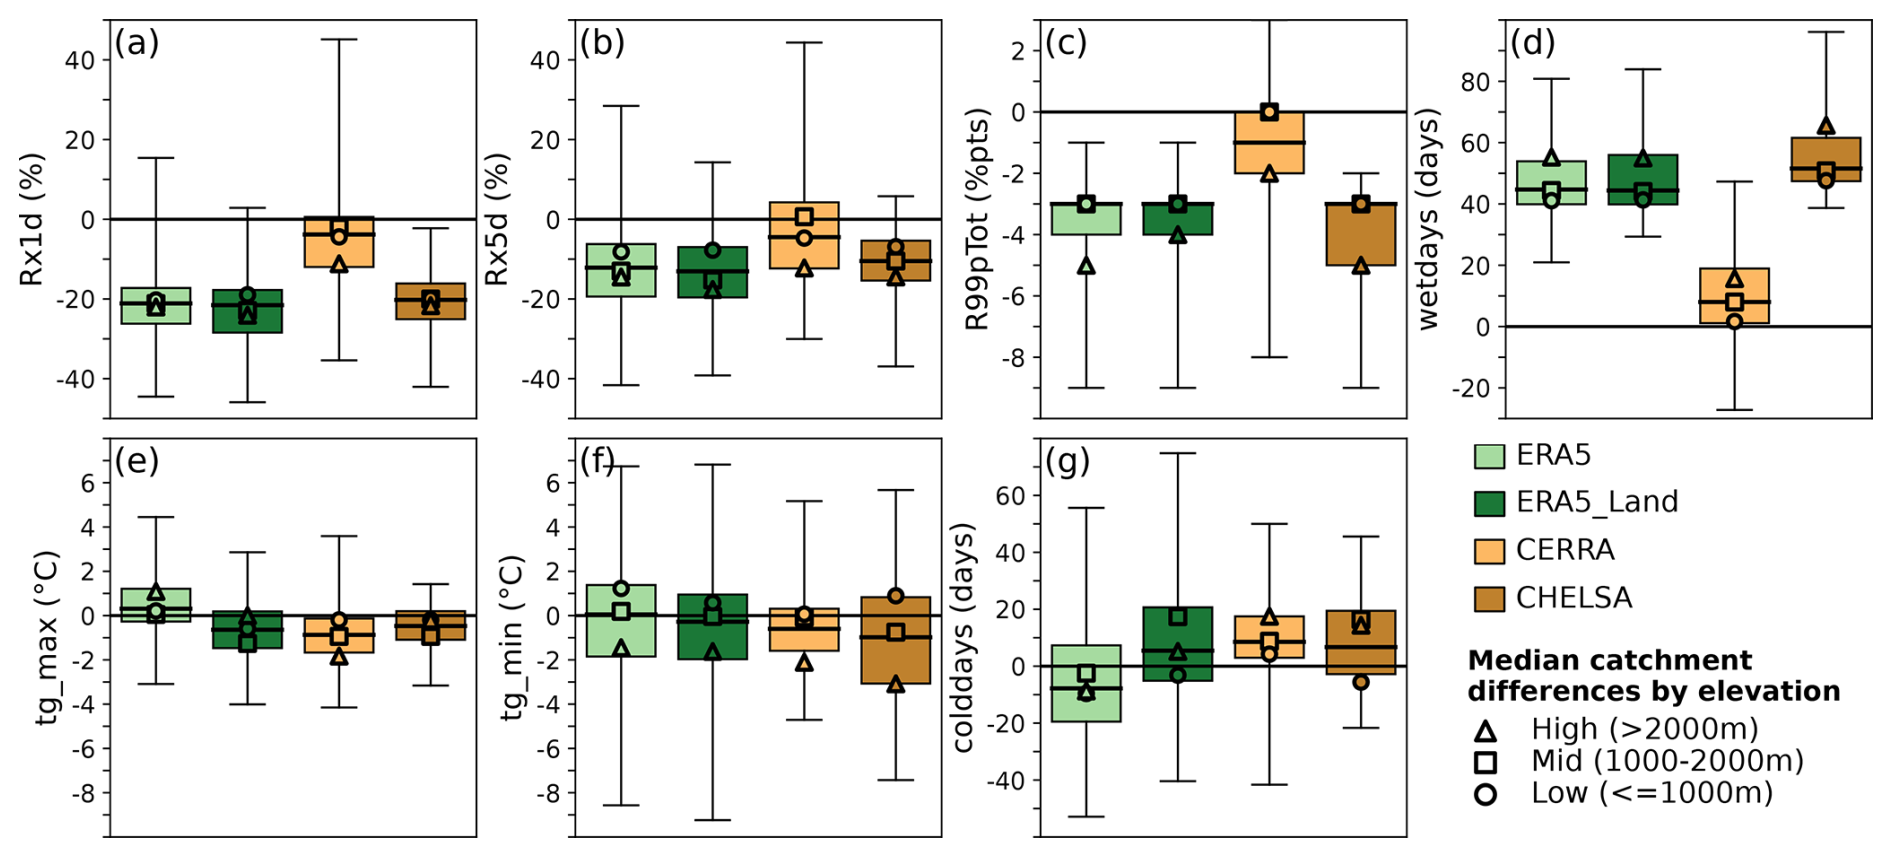
Figure 3Differences in selected precipitation (a–d) and temperature (e–g) metrics between the catchment means of the reanalysis datasets and observations. Boxplots show differences at the catchment level for: (a) Rx1d (relative in %), (b) Rx5d (relative in %), (c) R99pTot (absolute in %pts), (d) wetdays (absolute in days), (e) tg_max (absolute in °C), (f) tg_min (absolute in °C), and (g) colddays (absolute in days). Boxplots are overlaid with median catchment biases by elevation bin (high: >2000 m (triangle), mid: 1000–2000 m (square), low: ≤1000 m (circle)). Whiskers of the boxplots show min/max.
4.3 Solid precipitation
The fraction of solid to total precipitation and the total amount of solid precipitation are best represented by CERRA and CHELSA, which show high agreement with observations, especially in catchments below 1500 m. Thereby, the biases in CERRA seem to be catchment-specific, while CHELSA shows a slight overestimation of solid precipitation with elevation. ERA5 generally underestimates both the fraction and total amount of snowfall with a clear increase in biases with elevation, while ERA5-Land clearly overestimates solid precipitation at all elevations.
The estimated fraction of solid to total (liquid + solid) precipitation in observations increases linearly from up to 10 % in the low-elevation catchments (≤1000 m.a.s.l) to 40 % and more in the high-elevation catchments (≥2000 m.a.s.l) and up to 70 % in the highest catchments above 2500 m (Fig. 4e). Analogously, the total amount of solid precipitation increases from an average of less than 100 mm yr−1 in the low-elevation catchments to above 1250 mm in the high-elevation catchments (Fig. 4e). ERA5 generally underestimates the fraction of solid precipitation and shows a clear increase in bias, from lower biases at lower elevations (up to 10 percentage points) to larger biases of up to 20 percentage points at higher elevations (Fig. 4a). Such elevation dependence – although reversed – is also apparent when looking at the relative biases in the mean annual amount of solid precipitation, with a clear underestimation of up to 100 % in the low-elevation catchments and up to 50 % in the middle- to high-elevation catchments (Fig. 4a, coloring of dots). In contrast, ERA5-Land overestimates the fraction of solid precipitation by 10–20 percentage points with no clear elevation bias (Fig. 4b). As a result, the total amount of solid precipitation is largely overestimated by ERA5-Land, especially at lower elevations (>100 % dark purple) compared to higher elevations (25 %–75 %, blues). This difference between ERA5 and ERA5-Land is also apparent when looking at the number of cold days, which is overestimated by ERA5-Land but not by ERA5 (Fig. 3). CERRA and CHELSA show small biases for the estimated fraction of solid precipitation compared to the estimated fraction in observations, especially at low elevations. Both datasets show slightly larger biases with increasing elevation, but they remain well below the biases of ERA5 and ERA5-Land. While CERRA shows no clear elevation dependence for an over- or underestimation of the fraction of solid precipitation – differences rather seem to be catchment dependent. CHELSA shows slightly larger biases in catchments above 1500 m. The biases in the total amount of solid precipitation are comparably low in CERRA and vary between over- and underestimation depending on the catchment. CHELSA also shows good agreement with respect to the fraction of solid precipitation with very low differences at lower elevations and slightly larger biases at higher elevations. CHELSA generally overestimates the total amount of solid precipitation by up to 75 %.
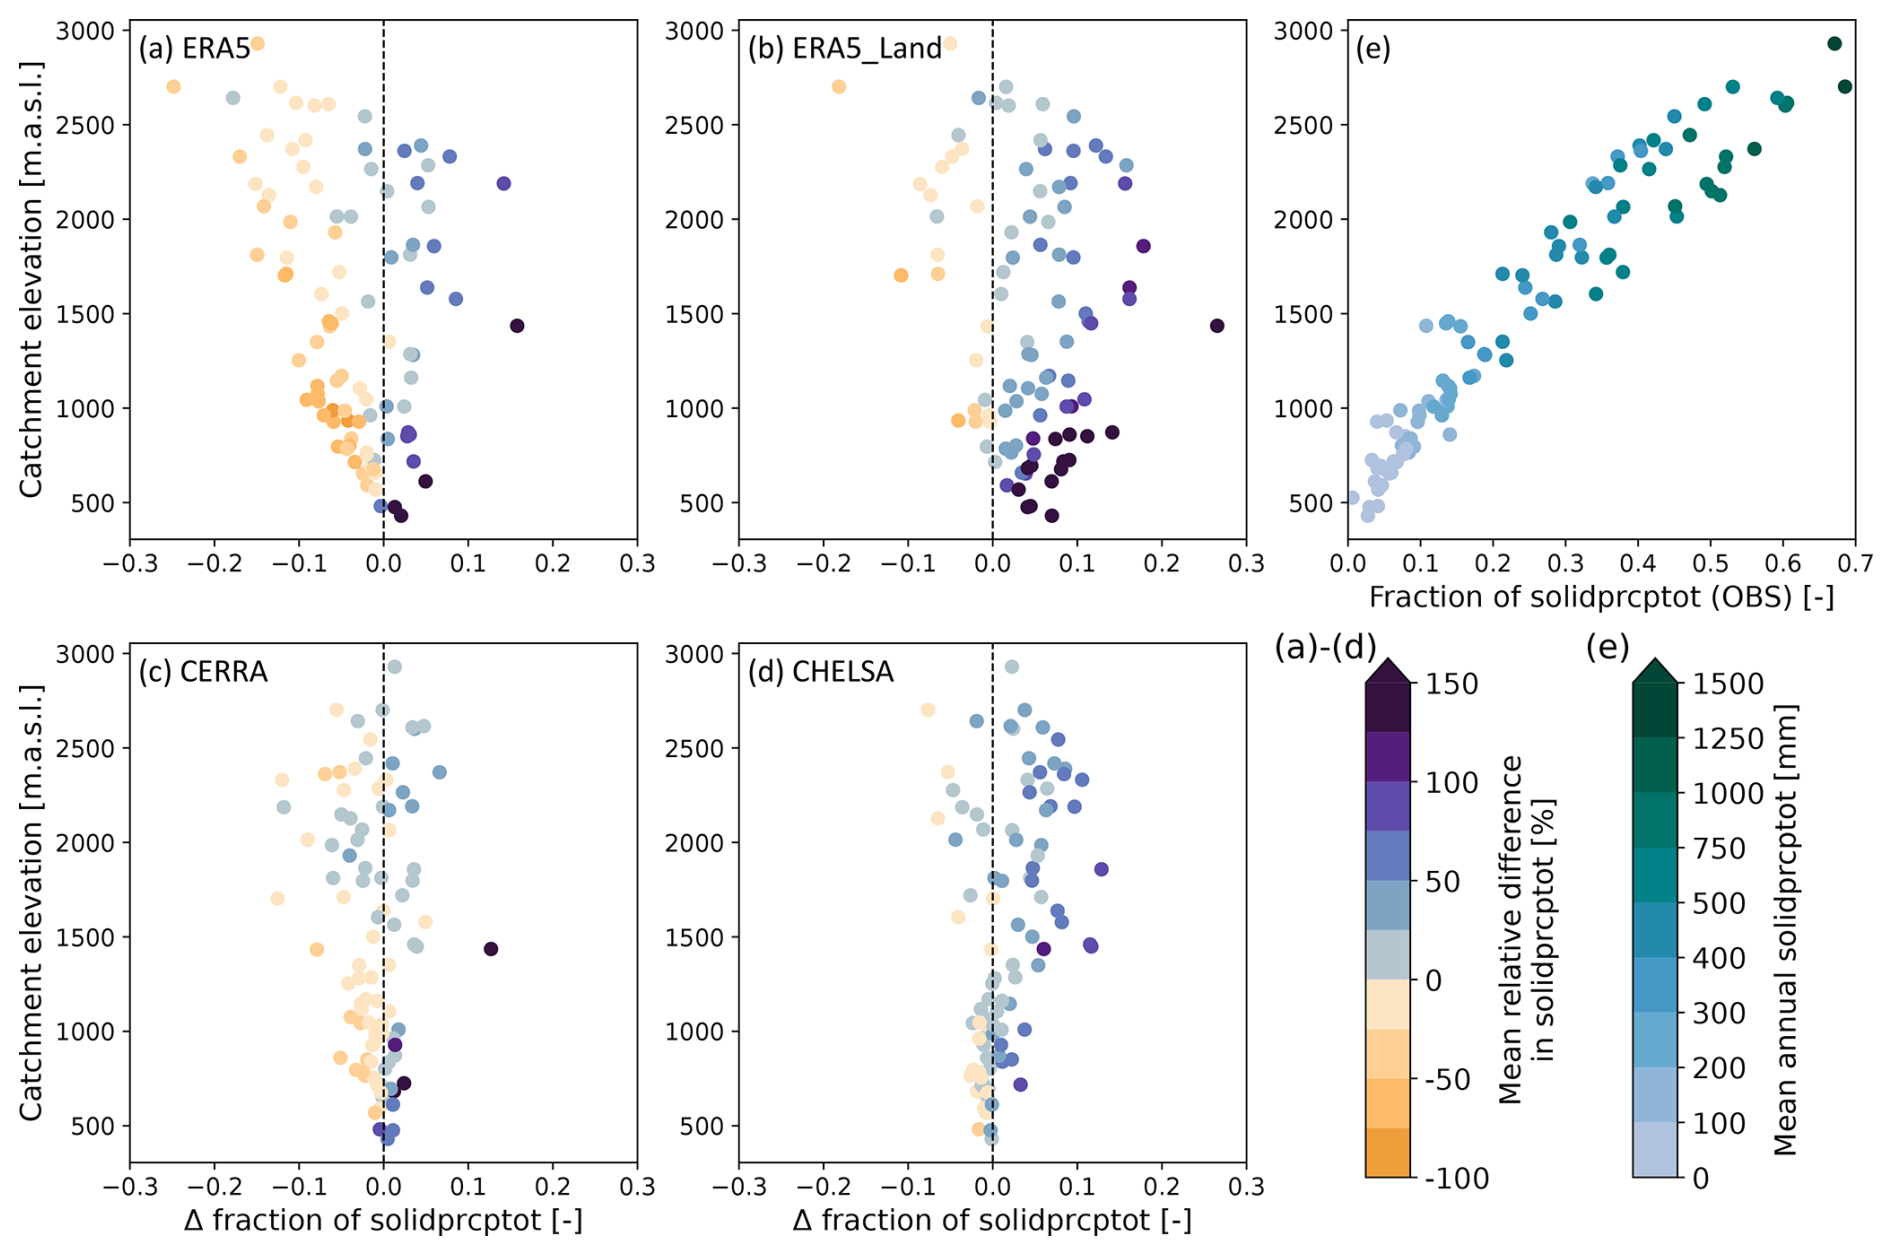
Figure 4Absolute differences in the fraction of solid (solidprcptot) to total precipitation (prcptot) (x-axes of a–d) and mean relative difference in solidprcptot (coloring of dots in a–d) for the four reanalysis datasets [(a) ERA5, (b) ERA5-Land, (c) CERRA, (d) CHELSA] compared to observations. Differences are plotted against the respective catchment mean elevation on the y-axis. (e) Shows the fraction of solidprcptot to prcptot for the observations on the x-axis and the mean annual solidprcptot as dot colors. Solid precipitation is estimated in all reanalysis datasets and observations by the same temperature threshold.
5.1 Precipitation and temperature variability
The representation of precipitation variability is clearly best in CERRA across all timescales and seasons, while all other datasets (ERA5, ERA5-Land, and CHELSA) underestimate precipitation variability (Fig. 5). Daily variability is underestimated by all reanalysis datasets with higher biases at higher elevations (Fig. 5a). While ERA5, ERA5-Land, and CHELSA clearly underestimate daily variability, CERRA is closer to observations. The observations show a considerably higher spread of variability across catchments than all of the reanalysis datasets. For monthly variability, CERRA shows a very similar median variability across catchments compared to observations (Fig. 5b), but it shows slightly larger biases at higher elevations. The other datasets clearly underestimate variability and also show higher biases at higher elevations.
At the inter-annual timescale (Fig. 5c), ERA5, ERA5-Land, and CHELSA continue to underestimate precipitation variability – without any elevation dependence – and CERRA is again closest to observations (i.e., median biases). However, CERRA overestimates variability in many catchments. If we look at the year-to-year variability in the different seasons (Fig. 5d–g), then the general picture prevails that ERA5, ERA5-Land, and CHELSA underestimate variability, while CERRA matches observed variability well. CERRA shows median biases around zero in winter and spring, and it only slightly underestimates variability in summer and fall. Only in fall CERRA shows an elevation dependent underestimation. The other reanalyses show a pronounced elevation dependent underestimation in winter and summer. Surprisingly, ERA5, ERA5-Land, and CHELSA better represent inter-annual variability of the wettest day of the year (i.e., Rx1d) (Fig. 5h) than annual and seasonal variability, especially because these datasets clearly underestimate the magnitude of Rx1d (see Fig. 3a). CERRA is again closer to observations, but it also slightly underestimates variability. We find similar results for the variability of the maximum 5 d precipitation (Rx5d, Fig. 5i).
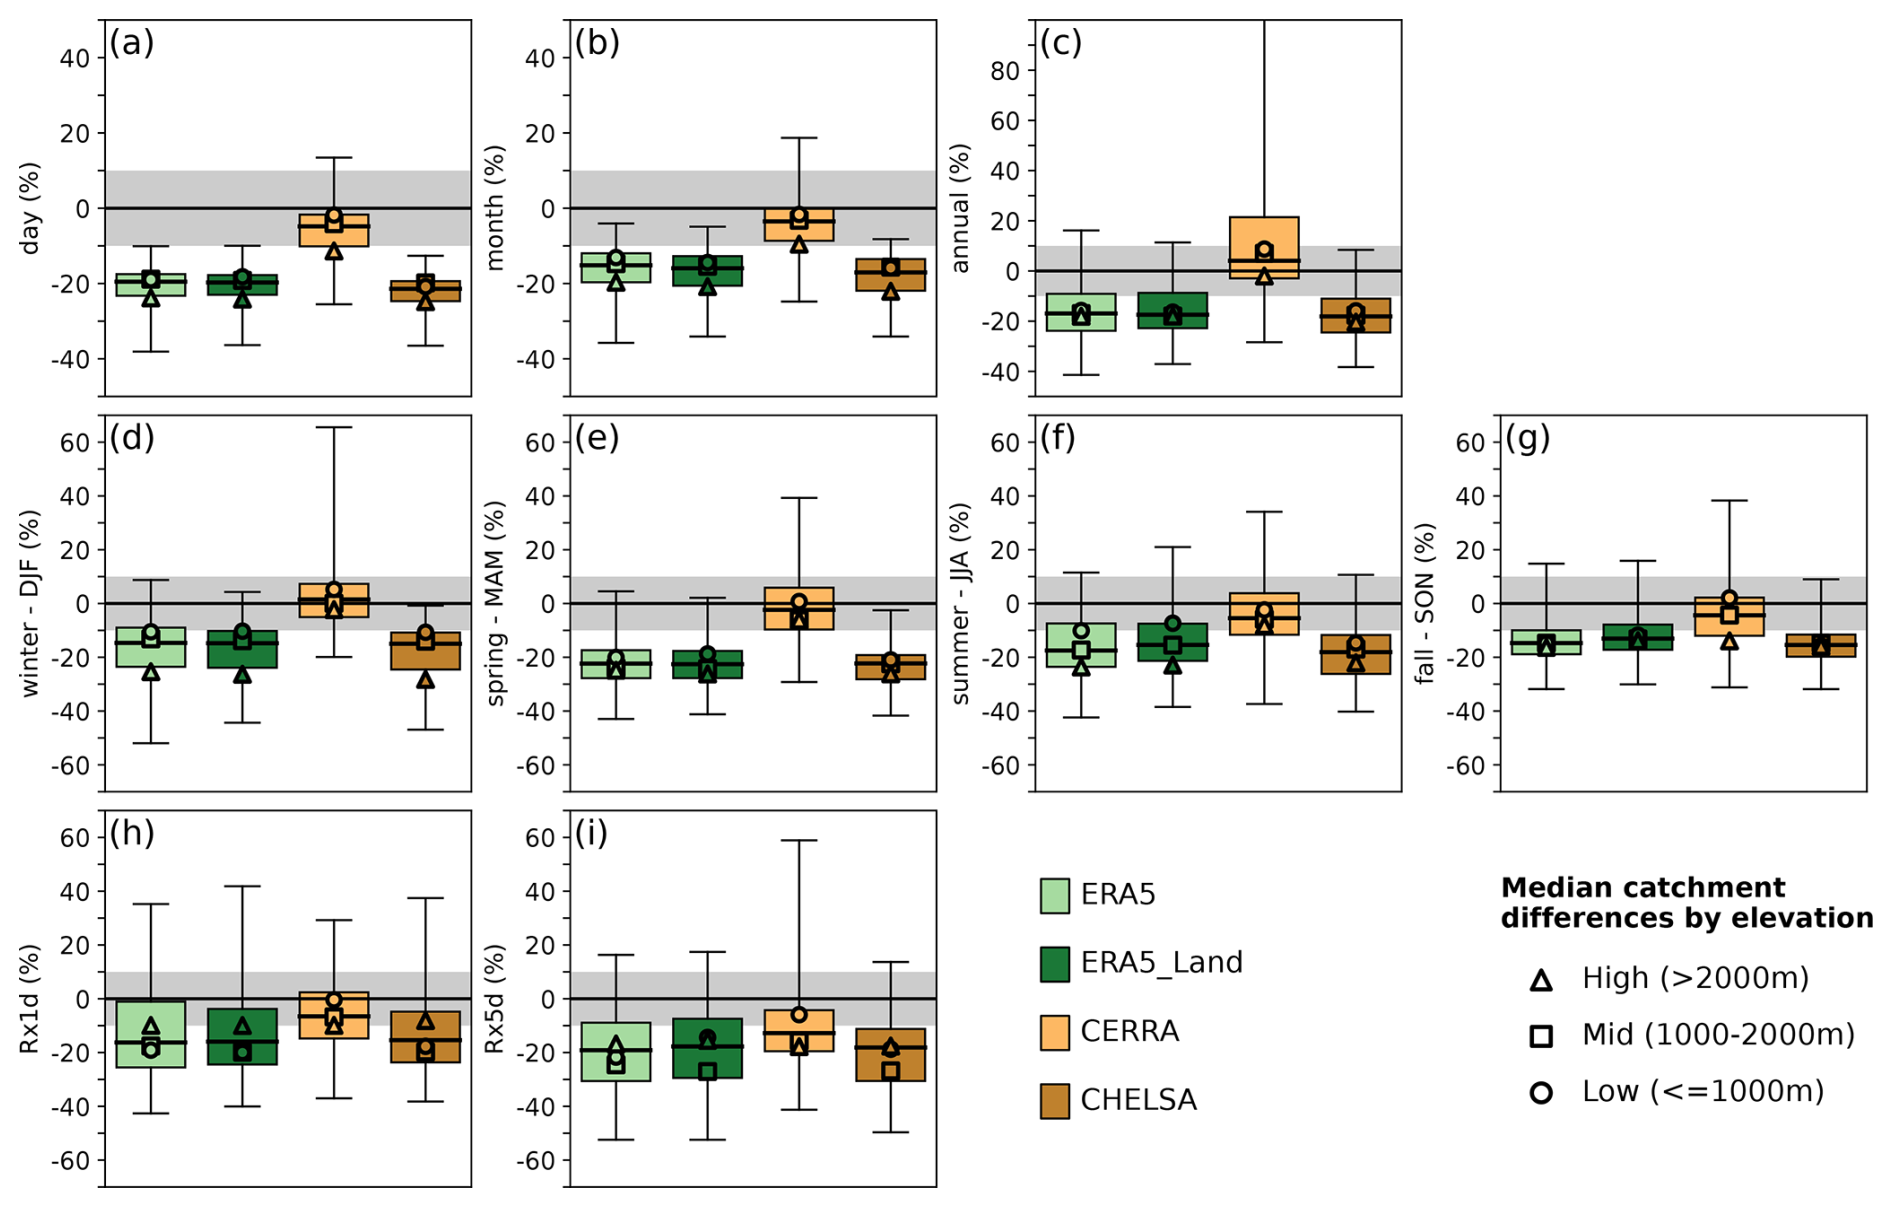
Figure 5Relative differences in daily to inter-annual precipitation variability at the catchment level of the respective variability metric in the reanalysis dataset compared to the variability of the gridded observations. Boxplots with (a) daily, (b) monthly, and (c) inter-annual precipitation variability. (d)–(i) Show inter-annual variability for different seasons [(d) DJF, (e) MAM, (f) JJA, (g) SON] and the extreme metrics (h) Rx1d and (i) Rx5d. The different reanalysis datasets are indicated by the colors. Boxplots are overlaid with median catchment biases by elevation bin (high: >2000 m (triangle), mid: 1000–2000 m (square), low: ≤1000 m (circle)). Individual panels can show different scaling of the y-axis. Gray shading indicates biases of ±10 %.
In contrast to precipitation variability, all datasets are more consistent with observations regarding temperature variability (Fig. 6), especially on inter-annual timescales. ERA5, CERRA, and CHELSA show comparable biases, while ERA5-Land often shows larger negative biases. On daily to monthly time scales, all datasets show an underestimation of variability compared to observations (Fig. 6a–b). The inter-annual temperature variability is well represented by all datasets, and only ERA5 and CHELSA show a slight overestimation of variability (Fig. 6c). All reanalysis datasets agree with observations on the seasonal course of variability and show considerably lower biases – except for winter (Fig. 6d–g). In winter, all datasets underestimate temperature variability, with ERA5-Land showing the strongest underestimation. In spring, ERA5-Land also clearly underestimates year-to-year variability, while all other datasets are comparable with observations (median biases around 0°C). In summer and fall, all datasets are more or less consistent with observations. Looking at the inter-annual variability of the maximum (minimum) daily mean temperature, all datasets are closer to observations on the warmest day (tg_max, Fig. 6h) than on the coldest day of the year (tg_min, Fig. 6i), whose temperature is underestimated by all datasets. For the variability of the coldest day, all datasets show increasing biases with elevation, and ERA5, ERA5-Land, and CHELSA show a large spread of biases across catchments.
In summary, CERRA best represents precipitation variability across all temporal scales and seasons. ERA5, ERA5-Land, and CHELSA feature similar precipitation variability, which is considerably lower than in CERRA and observations. In contrast, all datasets are more consistent with observations in terms of temperature variability, and no single datasets is clearly better than the others. Only ERA5-Land shows a generally lower temperature variability than observations and all other datasets. All datasets show a better agreement for the variability of the warmest day of the year (tg_max) than for the coldest day (tg_min), compared to observations.
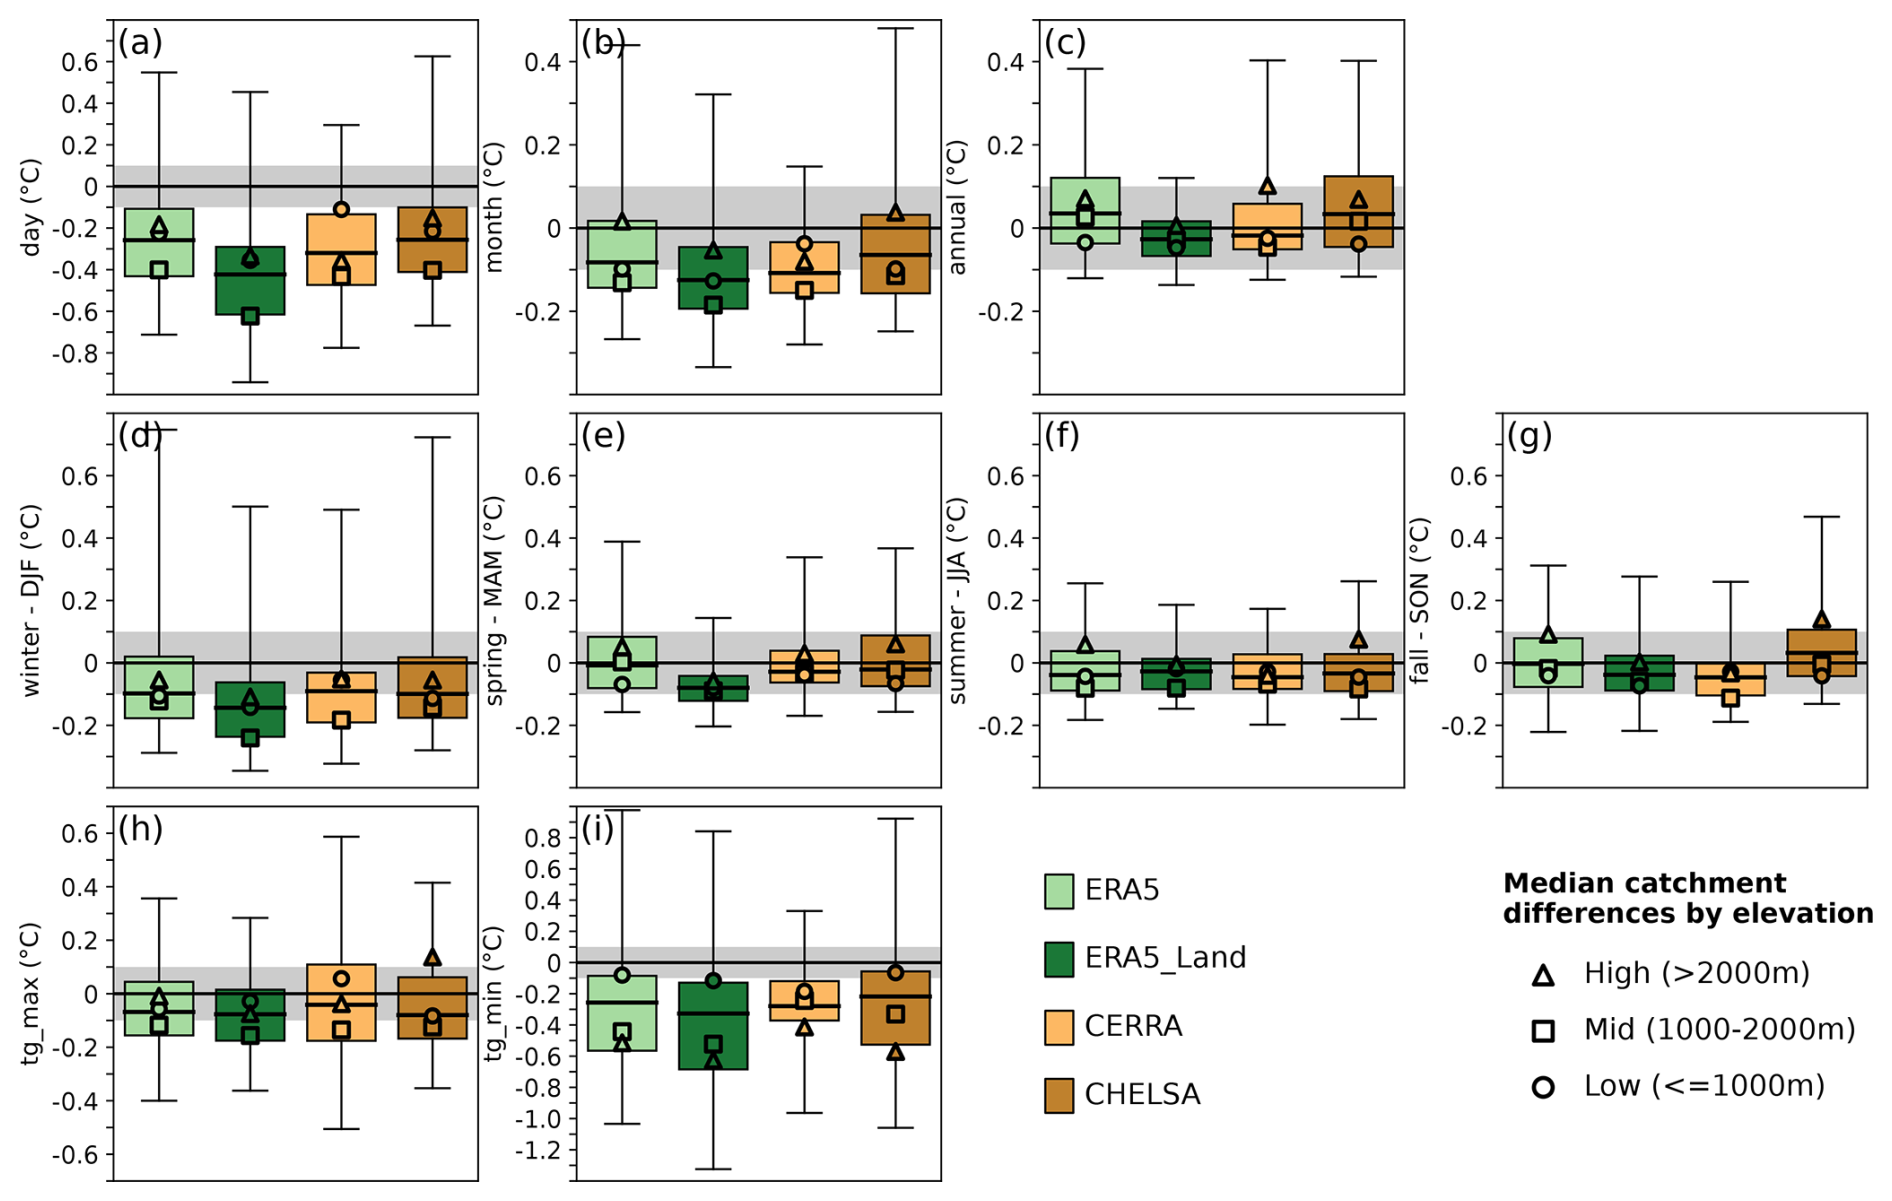
Figure 6Absolute differences in daily to inter-annual temperature variability at the catchment level of the respective variability metric in the reanalysis dataset compared to the variability of the gridded observations. Boxplots with (a) daily, (b) monthly, and (c) inter-annual temperature variability. (d)–(i) Show inter-annual variability for different seasons [(d) DJF, (e) MAM, (f) JJA, (g) SON] and the extreme metrics (h) tg_max and (i) tg_min. The different reanalysis datasets are indicated by the colors. Boxplots are overlaid with median catchment biases by elevation bin (high: >2000 m (triangle), mid: 1000–2000 m (square), low: ≤1000 m (circle)). Individual panels can show different scaling of the y-axis. Gray shading indicates biases of ±0.1 °C.
5.2 Trends
The presence of significant trends and trend magnitudes in precipitation and temperature metrics are best represented by CERRA, while the other datasets show inconsistent precipitation trends compared with observations. While CERRA shows the highest agreement with observed trends, it also tends to overemphasize the number of significant trends compared to observations and the other reanalysis datasets. Over the period 1986–2020, the observations show a general decrease in annual mean daily precipitation (Fig. 7a), with approximately 20 % of catchments showing significant (or weakly significant) trends (see Fig. 7e, blue), and 80 % of catchments showing no significant trend (see Fig. 7e, gray). ERA5, ERA5-Land, and CHELSA show no significant negative trends in any catchment (Fig. 7e). Therefore, they correctly identify all no trend catchments according to observations (see Fig. 7e, non-hatched gray bar) and fail to represent trends for the 20 % of catchments that do show significant trends according to observations (see Fig. 7e, hatched blue bar). CERRA shows a general decrease in mean precipitation over time, with significant trends being detected in many catchments. About 50 % of the catchments with a significant observed decreasing trend also show significant trends in CERRA (Fig. 7e). CERRA shows a considerably larger spread in trend magnitudes across catchments than observations and the other reanalysis datasets. As a result, it shows overall more catchments with significant trends (Fig. S18) where observations show no trend, which leads to an overall lower percentage of catchments where CERRA and observations agree on the sign and significance of trends (see Fig. 7e, number above the bar). These results are also consistent on the seasonal scale (see Fig. S9).
The observed annual maximum 1 d precipitation sum (Rx1d) shows a considerably larger spread in trend magnitudes across all catchments compared to mean precipitation (Fig. 7b). Depending on the catchment, we find positive or negative trends in observed extreme precipitation. However, approximately only 20 % of the catchments show a significant (or weakly significant) decreasing trend in the observations (Fig. 7f). ERA5, ERA5-Land, and CHELSA show only little agreement with the significant trends in the observations (Fig. 7f). They show a few individual catchments with significant positive trends (opposed to observations), but they largely agree on the catchments with no trend. Overall, they show a lower spread in trend magnitudes across catchments than observations, with a median around zero (Fig. 7b). CERRA agrees with the trends in observations for the majority of catchments; however, it shows the largest proportion of catchments with false trends, but also with correct significant decreasing trends. For the trends in mean annual solid precipitation (Fig. 7c, g) and the number of wet days (Fig. 7d, h), this overall pattern remains: CERRA shows both the largest agreement in significant trends as well as the largest proportion of catchments with different trends than those in the observations, while ERA5, ERA5-Land, and CHELSA show no overlap with catchments with significant trends in the observations. For solid precipitation, all datasets – except for ERA5-Land, which shows no change – represent the decreasing trends found in observations and the elevation pattern of these trends (Fig. 7c, markers). For the number of wet days, neither ERA5, ERA5-Land, nor CHELSA show clear increases or decreases, which might be a reflection of the poor representation of wet days in these datasets (Fig. 3d). In contrast, observations and CERRA tend to show a decrease in the number of wet days with larger decreases at lower elevations.
All the datasets agree on a significant increase in mean daily temperature (Fig. 7i, m) and the temperature of the warmest day of the year (tg_max; Fig. 7j, n) for all catchments, but not for the temperature of the coldest day (tg_min; Fig. 7k, o). ERA5-Land shows slightly weaker trends in mean temperature compared to observations, while ERA5, CERRA, and CHELSA show stronger trends. The trend magnitudes of temperature on the warmest day is comparable across all datasets. For the temperature of the coldest day, trend magnitudes in ERA5, CERRA, and CHELSA are comparable with observations, while ERA5-Land underestimates the trend magnitudes. However, trends in temperature on the coldest day are largely non-significant: only 20 % of catchments in the observations show a significant increase (Fig. 7k, o). Among all datasets, CERRA agrees the most with observed temperature trends, as it shows both similar trend magnitudes and a high agreement in true trends as well as only a small number of false or undetected trends.
The number of cold days (Fig. 7l, p) decreases in all reanalysis datasets and observations, and this trend is significant in the majority of catchments. ERA5, CERRA, and CHELSA show good agreement for catchments with a significant trend in observations and only a small proportion of undetected trends. However, all three datasets overestimate the number of significant trends and trend magnitude compared to observations. ERA5-Land shows the weakest decrease in the number of cold days as well as the lowest agreement with observations, as it shows a larger number of catchments with undetected trends.
The general findings that CERRA has the highest agreement with observations with respect to the number of catchments with significant trends, false trends, as well as the best match in terms of trend magnitude, also applies for seasonal trends in mean precipitation and temperature (Fig. S9).
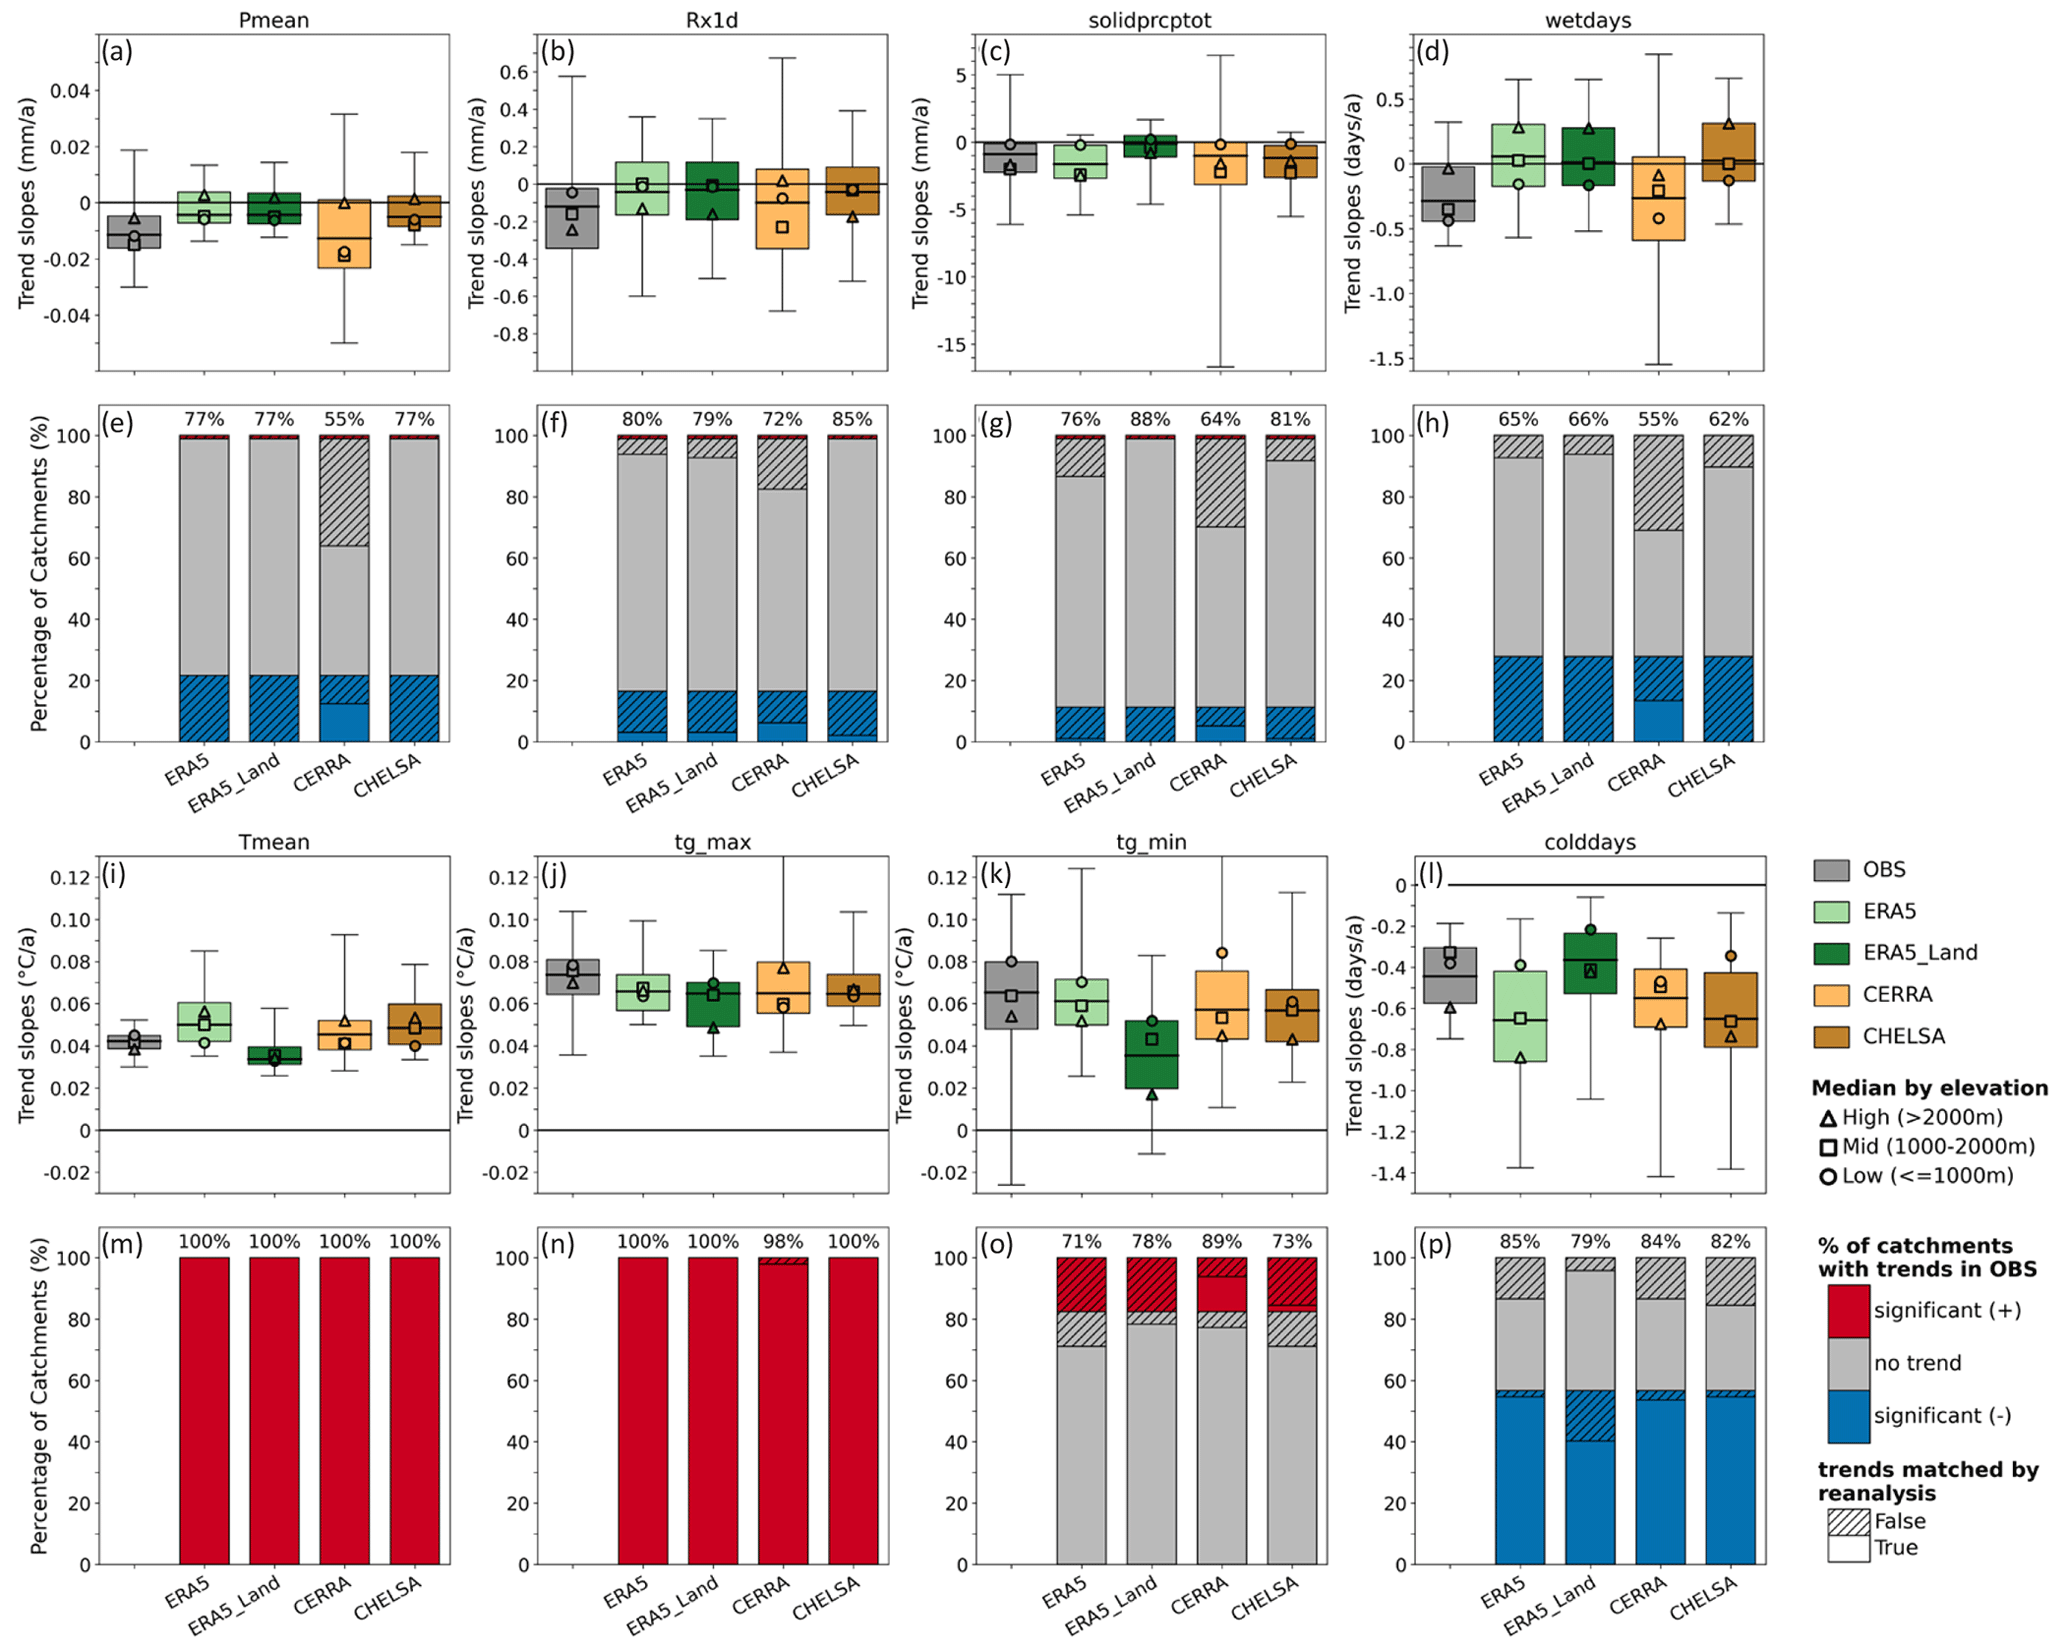
Figure 7Comparison of trend magnitudes and trend significance in precipitation and temperature metrics. (a, e) mean daily precipitation (Pmean; mm), (b, f) maximum 1 d precipitation (Rx1d; mm), (c, g) mean annual amount of solid precipitation (solidprcptot; mm), (d, h) annual number of wet days (wetdays; days), (i, m) mean daily temperature (Tmean; °C), (j, n) annual maximum of daily mean temperature (tg_max; °C), (k, o) annual minimum of daily mean temperature (tg_min; °C), and (l–p) number of cold days (colddays; days). Boxplots show trend magnitudes (Theil–Sen slopes; 1986–2020) in observations (gray) and reanalysis datasets (colors) across all catchments. Boxplots are overlaid with median trend slopes for the three elevation bins (high: >2000 m (triangle), mid: 1000–2000 m (square), low: ≤1000 m (circle)). The bar plots show the percentage of catchments in observations with significant negative trends (blue), no significant trends (gray), and significant positive trends (red) for the respective metric. Each stacked bar is repeated for the reanalysis datasets and is overlaid with the percentage of catchments matching (non-hatched) or not matching (hatched) the observed trend in sign and significance. The number above the bars indicates the percentage of catchments where the reanalysis and the observations agree on the sign and significance of trends.
6.1 Meteorological drought
The observed drought events in 2003 and 2018 show considerable differences in their spatial patterns, which all the reanalysis datasets are able to capture (Figs. 8, 9). While ERA5, ERA5-Land, and CHELSA overestimate drought severity and intensity, CERRA underestimates them. The drought in 2003 is characterized by many catchments showing dry (SPI6 ) to very dry conditions (SPI6 ) in the observations (Fig. 8a), varying between −0.9 and −3.1 across catchments (e.g., Fig. 8c, x-axis). The central and southern parts of Switzerland especially show low SPI6 values and the largest cumulative precipitation deficits of more than 400 mm (Fig. 8a, b). In contrast, the drought of 2018 affected fewer catchments (Fig. 9a) and is characterized by a large spread of SPI6 values from 0.4 (no drought) to −2.8 (severe drought) across catchments (e.g., Fig. 9c, x-axis). The center of the drought lay over the central and north-eastern parts of Switzerland, where cumulative precipitation deficits for several catchments were above 400 mm in the observations (Fig. 9b). The southern, eastern, and northern parts of Switzerland were less affected by the 2018 drought. All the reanalysis datasets capture these differences between the two drought events – that is, the large spatial drought extent and small SPI6 spread across catchments in 2003 (Fig. 8c–f) and the smaller drought extent and large SPI6 spread in 2018 (Fig. 9c–f).
The reanalysis datasets ERA5, ERA5-Land, and CHELSA show a high agreement with observations for the 2003 drought in terms of widespread drought conditions (SPI6 ) (Fig. 8c, d, f). However, they show a smaller catchment spread in SPI values than observations and have a tendency to overestimate drought severity (i.e., lower SPI6 values; points below the 1:1 line). Catchments that show an overestimation of SPI6 in the reanalysis datasets also show an overestimation of the precipitation deficit compared to the observed deficit by generally 20 %–80 %, which can exceed 100 % in individual catchments (Fig. 8c, d, f, coloring of dots). CERRA generally underestimates drought severity and shows a larger spread of SPI6 values across catchments than observations. Furthermore, CERRA estimates SPI6 values above −1 for several catchments, indicating no drought, contrary to observations (Fig. 8e). Although most catchment averages in CERRA agree with the observations on drought conditions, and differences in the cumulative precipitation deficit are between ±20 %, several catchments underestimate precipitation deficits by more than 40 % compared to observations.
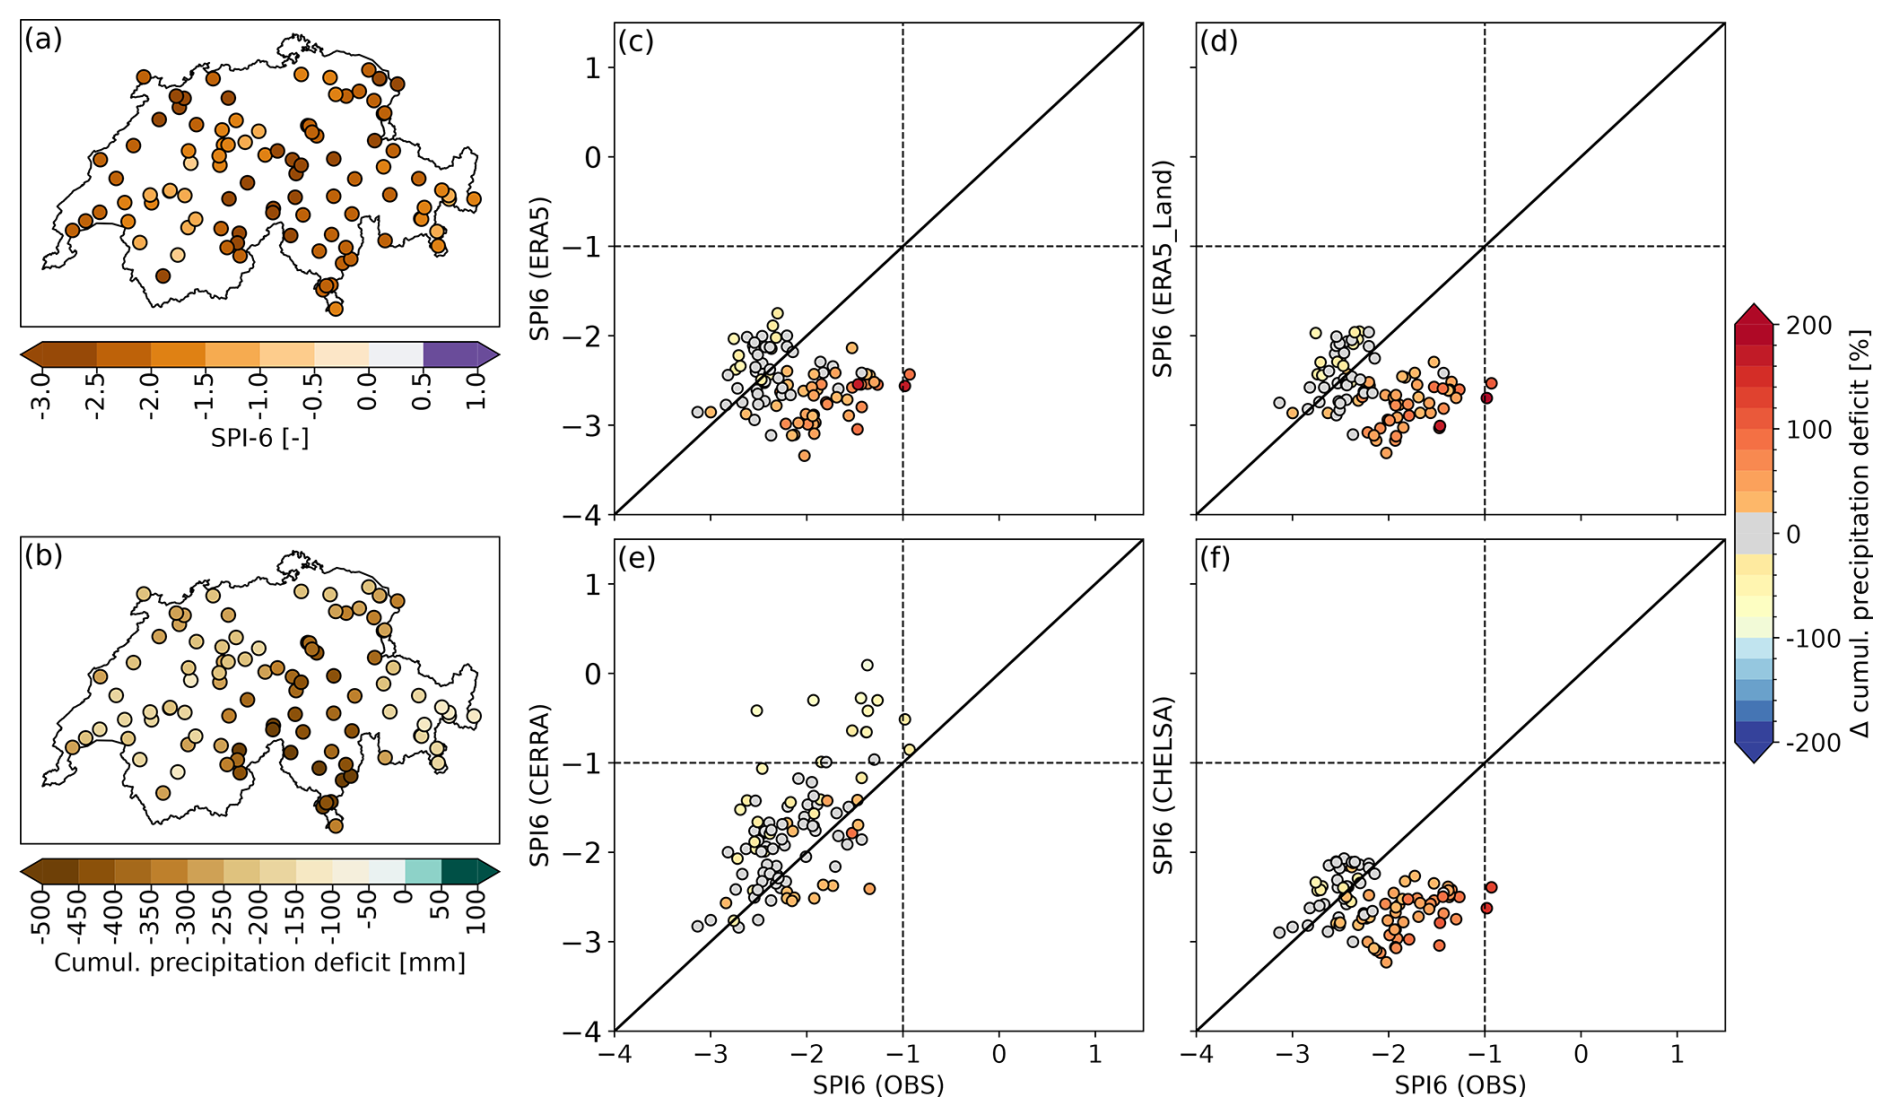
Figure 8Comparison of the severity and intensity of the 2003 drought event for the different reanalysis datasets. (a) Shows the SPI6 catchment values (March–August) of the observations (i.e., severity). (b) Shows the cumulative precipitation deficit (mm) of the observations for the same period (i.e., intensity). The scatterplots in panels (c)–(f) show the four reanalysis datasets (y-axis) compared to the gridded observations (x-axis) for the period 1986–2020 and all catchments. The location of the dots shows the SPI6 values, and the coloring of the dots shows the relative differences in the cumulative precipitation deficit (in percent compared to observed deficits). Orange and red coloring highlight larger deficits in the reanalysis, yellow coloring shows smaller deficits in the reanalysis, and blue coloring shows a surplus of precipitation rather than a deficit compared to observations. The dashed vertical and horizontal line indicate an SPI6 ≤ −1, which indicates moderate to severe drought conditions. The solid black line indicates the 1:1 line. (c) ERA5, (d) ERA5-Land, (e) CERRA, and (f) CHELSA.
The 2018 drought is reasonably captured by ERA5, ERA5-Land, and CHELSA, which show a similar spread of minimum and maximum SPI6 values as the observations, and a good match for catchments with low to high drought severity (Fig. 9c, d, f). CERRA underestimates drought severity and shows a larger spread of SPI6 values (−3 to 1.3) than the observations (Fig. 9e). A large number of catchments in CERRA shows undetected drought conditions (data points in the upper left quadrant; Fig. 9e) or even a precipitation surplus (indicated by blue coloring). Catchments that show no drought condition in the observations also show no drought condition in CERRA, which shows some overall agreement despite some large deviations in event magnitude and several undetected drought occurrences.
Beyond the two drought years of 2003 and 2018, all the reanalysis datasets agree well with the full distribution of observed SPI6 values (Fig. S10), which indicates a correct temporal match of drought and no-drought conditions despite some apparent biases.
In summary, all four datasets capture the differences between the two drought events, with the 2003 drought being better represented than the one in 2018. ERA5, ERA5-Land, and CHELSA overestimate drought severity and intensity in 2003 and partly under- and overestimate it in 2018, while CERRA overall underestimates the magnitude of both drought events.
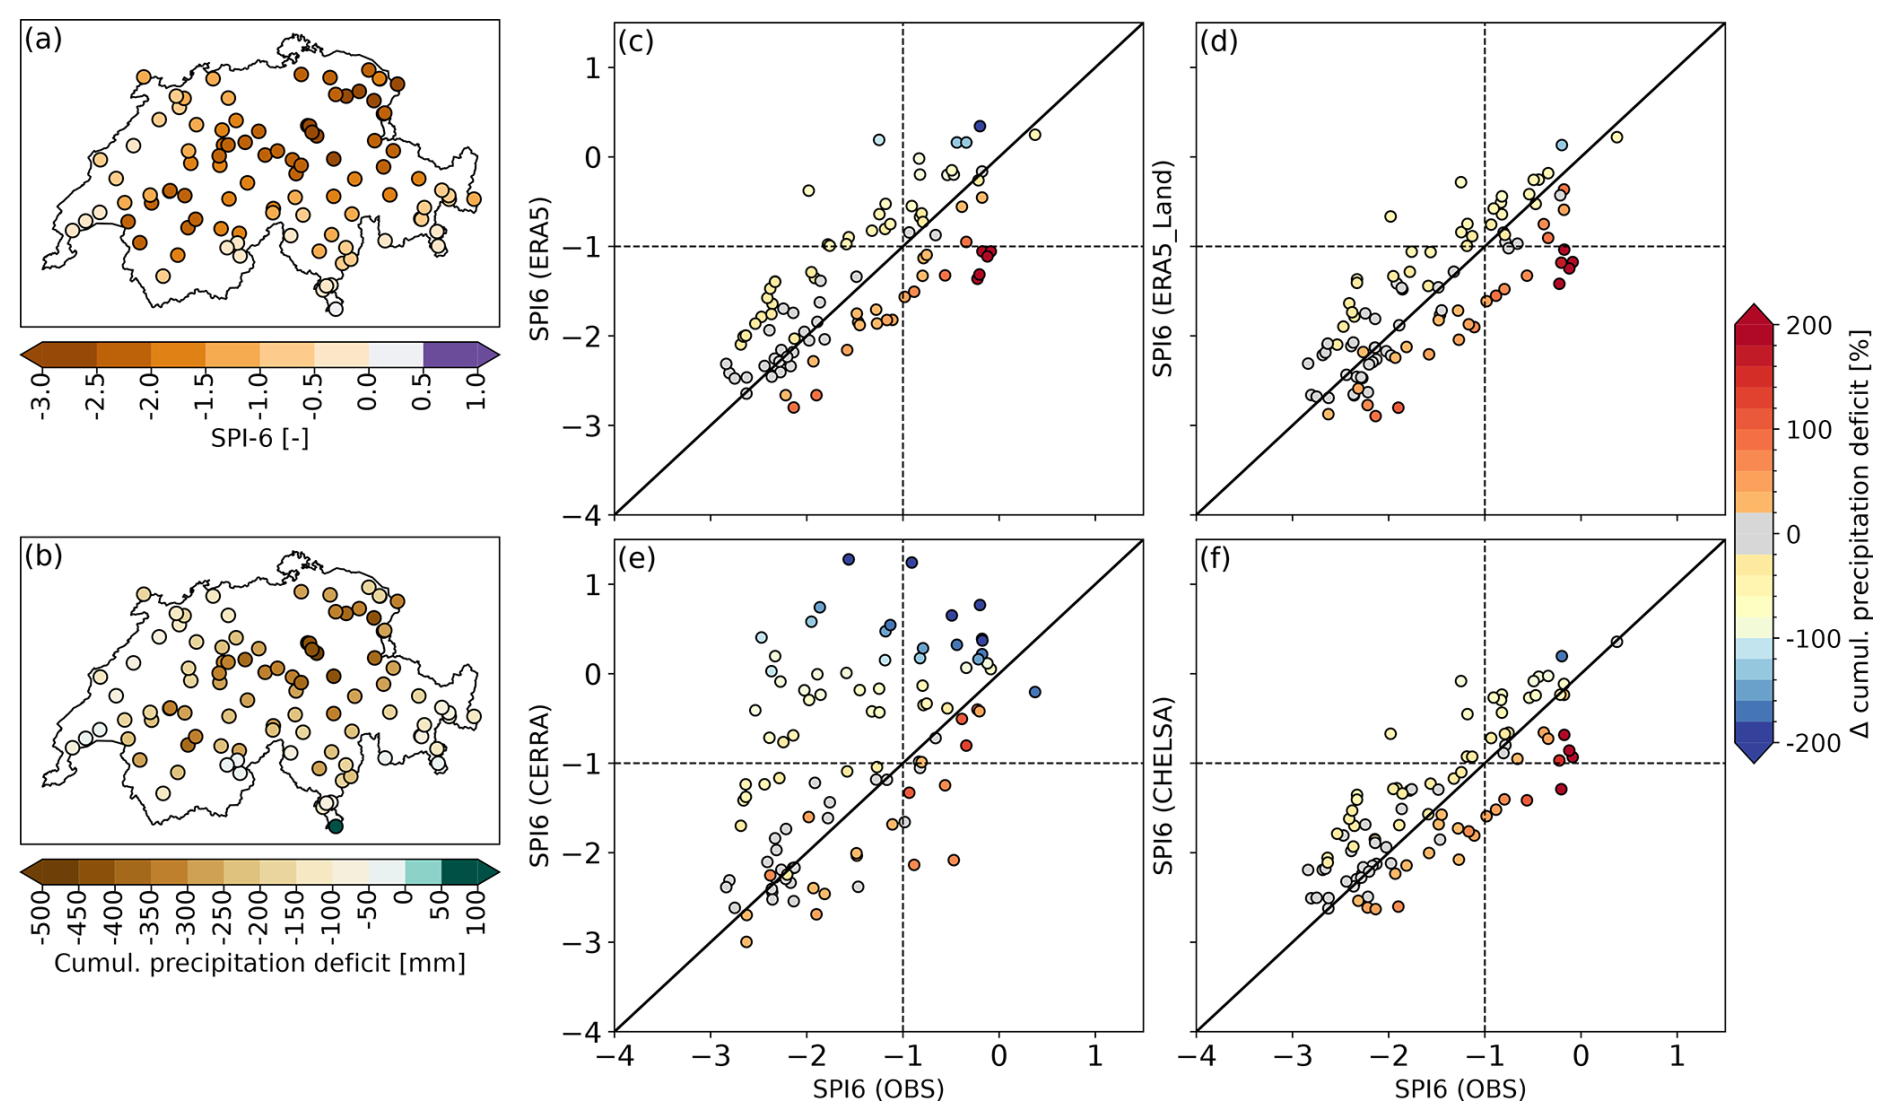
Figure 9Same as Fig. 8 but for the 2008 drought.
6.2 Extreme precipitation
The intensity, severity, and spatial structure of the three extreme precipitation events in 1999 and 2005 are captured by all the reanalysis datasets, with CERRA showing the highest agreement with observations, and the other datasets showing larger spatial extents than the observations and some overestimation and underestimation of event intensity locally. The 1999 extreme precipitation event was a sequence of two consecutive extreme precipitation events occurring only 10 d apart, with major flood peaks observed during the second event. Both of these events were centered on the north-eastern part of Switzerland (Fig. 10a–d). The first event on 12 May (end of accumulation period) covered a larger area, with catchments showing standardized precipitation indices above 2 (Fig. 10a) and precipitation intensities of 100–160 mm (Fig. 10b). The second event (22 May) had a smaller extent and was less intense (Fig. 10c, d). All the datasets are generally able to reproduce this event sequence in 1999. The catchments showing high-intensity rainfall in the observations are also shown to be affected by extreme precipitation in all four reanalysis datasets (see the large number of points in the upper-right corner of Fig. 11a–h). Thereby, the first precipitation event in 1999 (Fig. 11a–d) is represented well by all datasets, with only a few catchments showing extreme precipitation instead of moderate or low precipitation (upper-left quadrant in Fig. 11), or vice versa (lower-right quadrant). CERRA generally matches the observations well, but it shows a clear underestimation of severity and intensity over the southern-most catchments, which only received little to no precipitation (see Fig. S13a). The second precipitation event in 1999 is partly overestimated by ERA5, ERA5-Land, and CHELSA, which show a larger number of catchments with standardized precipitation above 1.5 than the observations (Fig. 11e, f, h). In catchments with the highest event severity in observations, all three reanalyses (ERA5, ERA5-Land, and CHELSA) slightly underestimate event severity and intensity, while precipitation in catchments with low and moderate precipitation in the observations is largely overestimated (Fig. 11e, f, h). They show a larger spatial extent for the precipitation event than the observations (see Fig. S16), mainly in the south-east (towards the Engadin) and the south (Ticino) (see Fig. S13b). CERRA clearly shows a better match with observations than the other datasets (Fig. 11g). It matches the geographical center of the event very well (see Fig. S13b) and only shows very small biases in the severity and intensity of the event.
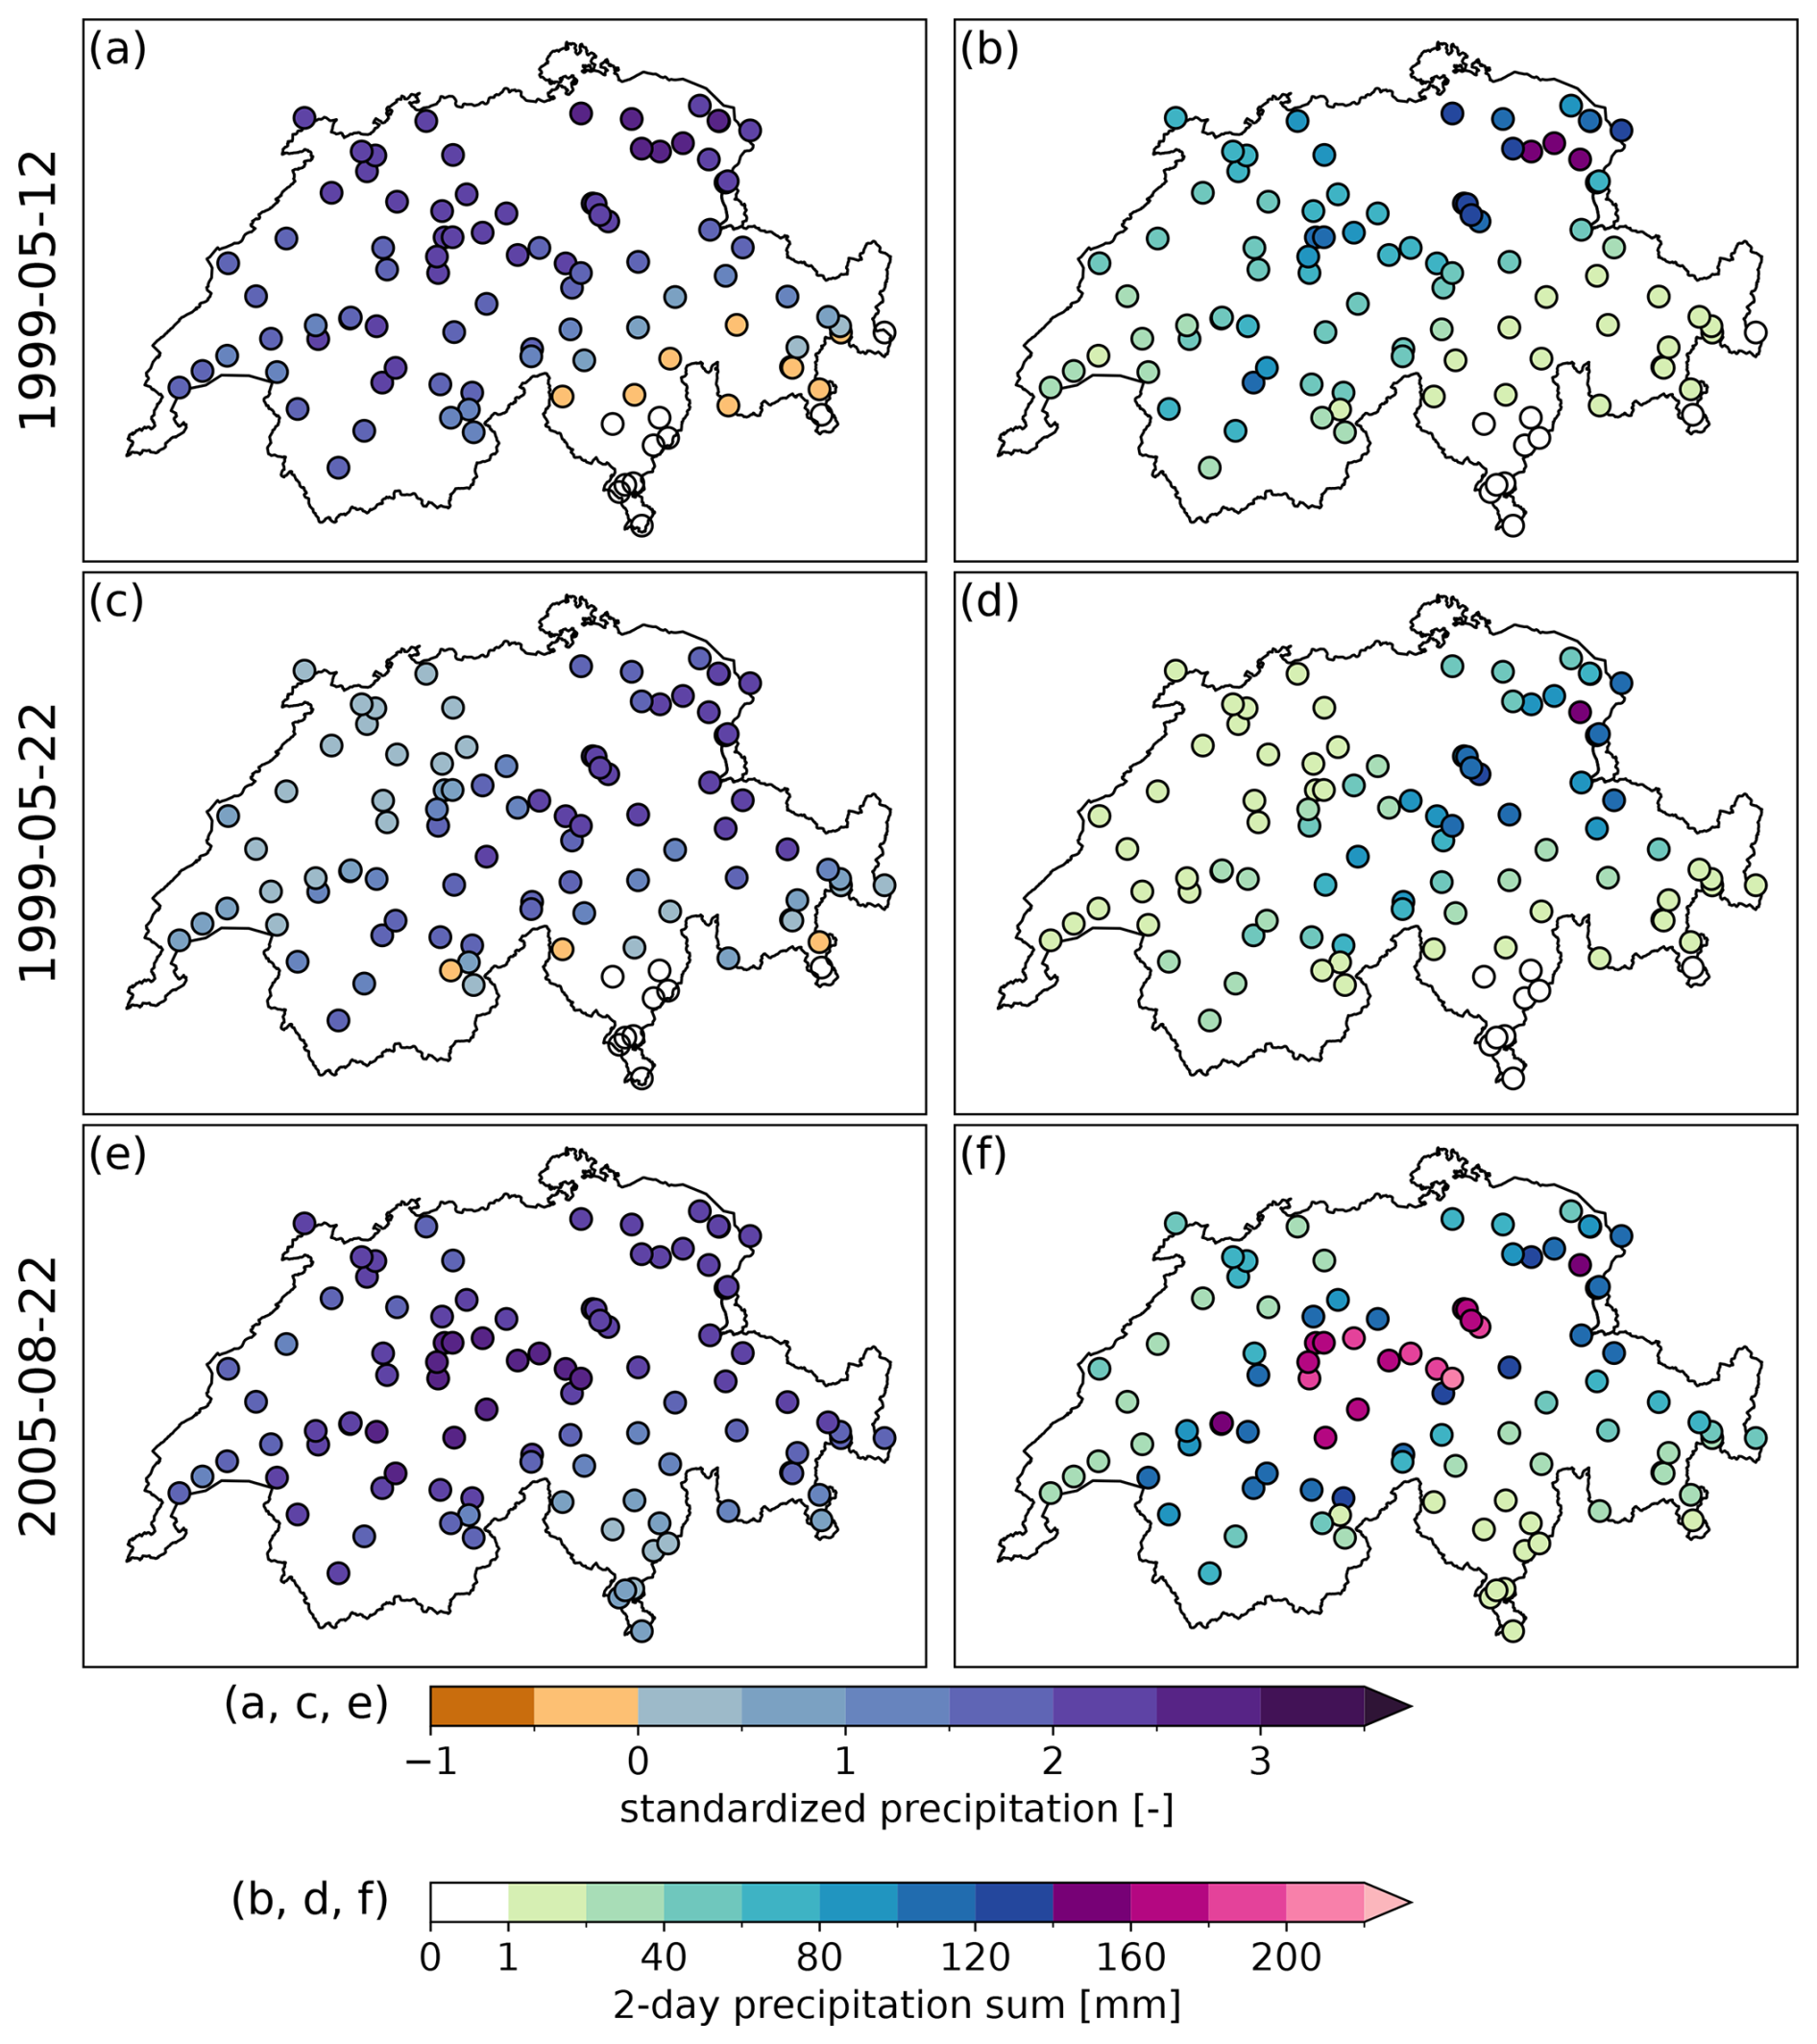
Figure 10Maps of the severity and intensity of extreme precipitation events related to selected major floods in Switzerland based on gridded observations. The maps show the two extreme precipitation events in May 1999 (11–12 May 1999, a–b; 21–22 May 1999, c–d) and the single event in August 2005 (21–22 August 2005, e–f). Panels (a), (c) and (e) show the severity of the events expressed as the standardized 2 d precipitation sums. Panels (b), (d) and (f) show the intensity of the events expressed as the 2 d precipitation sum (mm).
The extreme precipitation event in 2005 was severe in most parts of Switzerland except the south, with intensities of 160 mm and more in large parts of central Switzerland, and slightly lower intensities in the west and east (Fig. 10e, f). CERRA shows very good agreement with observations in terms of severity and intensity (Fig. 11k) as well as the geographical location of the center of the event (see Fig. S13c). ERA5, ERA5-Land, and CHELSA slightly underestimate event severity but overestimate spatial extent compared to observations. All three datasets slightly underestimate event intensity and severity in those catchments that show the highest severity in observations, and they overestimate the severity and intensity in locations with low to moderately high precipitation (with an approximate standardized precipitation of 1.5).
In summary, CERRA shows the smallest biases among all four datasets for flood-triggering extreme precipitation, in particular, for the most severe intensities. While ERA5, ERA5-Land, and CHELSA tend to overestimate the standardized precipitation and precipitation accumulation for catchments with low to moderate precipitation, CERRA seems to slightly underestimate precipitation in these catchments. The spatial event extents are best represented by CERRA and overestimated by ERA5, ERA5-Land, and CHELSA compared to observations (see Figs. S13, S16).
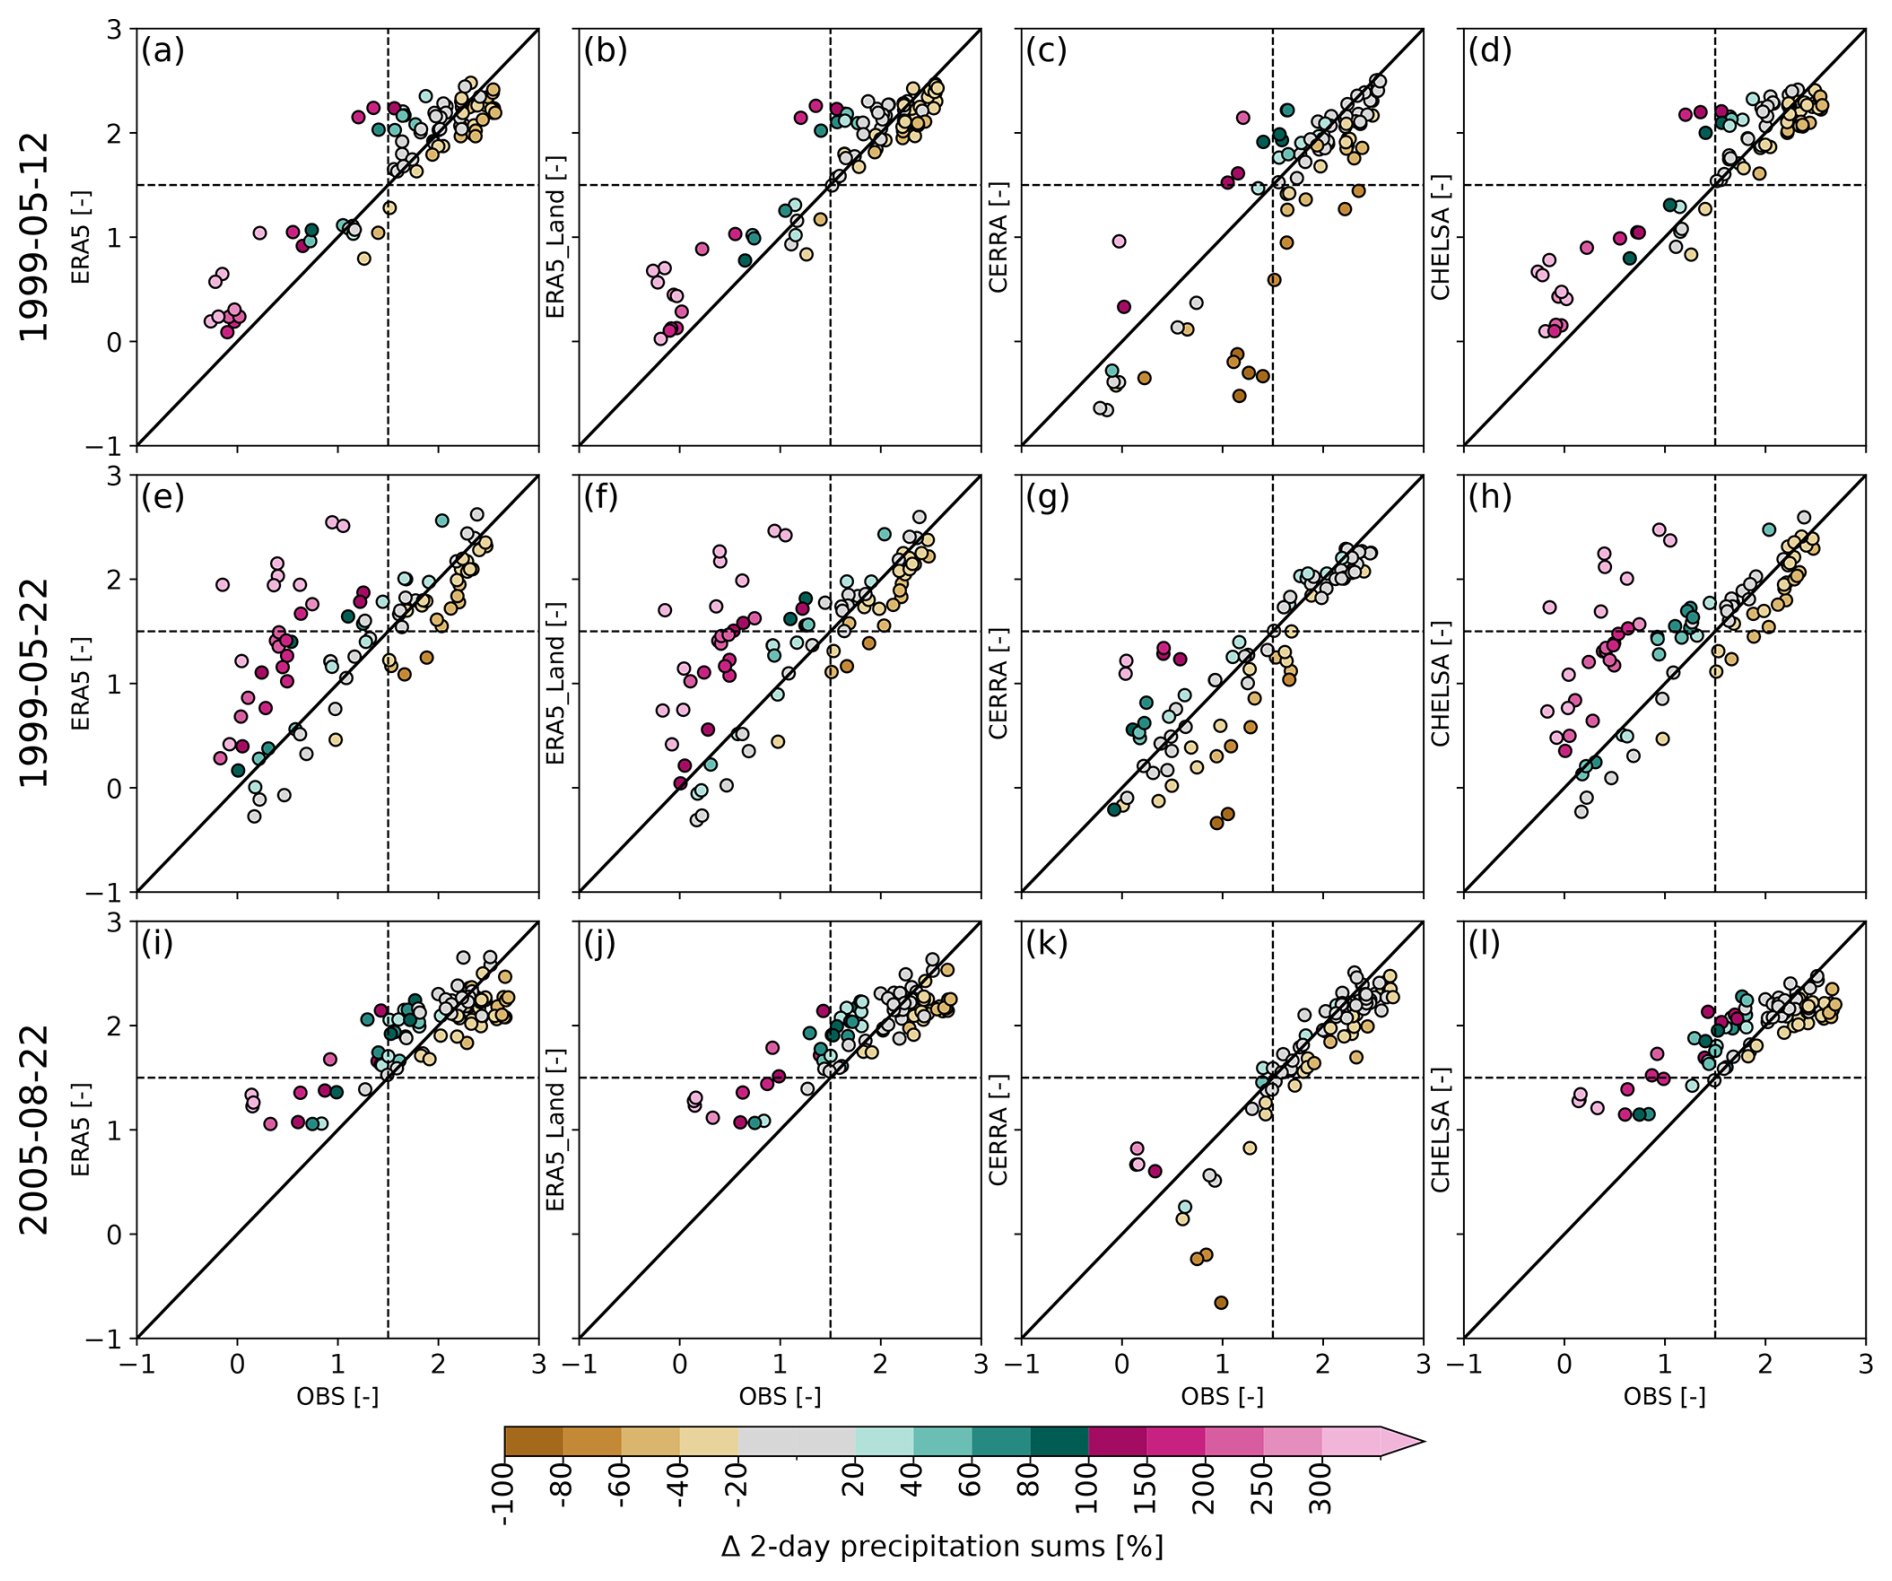
Figure 11Comparison of the severity and intensity of extreme precipitation events related to selected major floods in Switzerland. Scatterplots compare the two extreme precipitation events in May 1999 (11–12 May 1999, a–d; 21–22 May 1999, e–f) and the single event in August 2005 (21–22 August 2005, i–l). Event severity is expressed as the standardized 2 d precipitation sums of the four reanalysis datasets (y-axis) and is compared to the respective standardized precipitation of observations (x-axis, values from Fig. 10a, c, e). Dot locations in the scatterplots show the standardized precipitation. For illustration purposes, the +1.5 standard deviation is indicated by the dashed vertical/horizontal lines, demonstrating heavy to extreme precipitation events, and the 1:1 line, showing a perfect match. The coloring of dots in all panels shows the relative difference (%) in the 2 d precipitation sums compared to observations (values from Fig. 10b, d, f). Brown colors indicate less precipitation than observed, gray precipitation in the range of ±20 %, and green and pink colors the values above. Each dot represents one catchment.
7.1 Climate metrics best represented in high-resolution datasets
Our results show that CERRA clearly improves the representation of precipitation metrics compared to the other reanalysis datasets (Figs. 2, 3, 12), likely due to the assimilation of data from additional precipitation stations within the MESCAN regional precipitation analysis. In contrast to CERRA, the other reanalysis products are not assimilating any precipitation observations, except for ERA5, which includes a regionally and temporally limited precipitation assimilation over the contiguous U.S.A. through a radar gauge product since 2010 (Hersbach et al., 2020). This highlights how closely model performance is linked with the availability of high quality data and dense station networks. Even though CERRA, among all the reanalysis datasets, best represents most of the precipitation metrics, it shows some deficiencies in representing the studied drought events in 2003 and 2018 (Figs. 8, 9, 12, S16). While the large-scale SPI pattern over Switzerland is simulated quite well, CERRA seems to simulate spurious local-scale precipitation events over regions with complex topography, which can locally alleviate large-scale drought signals (Fig. S11). This is an issue across the European domain, including Switzerland and the Apennine Mountains in Italy, where CERRA suffers from precipitation artifacts with bubble structures (Fig. S12). We believe that these artifacts result from a lack of sufficient data for data assimilation over complex terrain, leading to a stronger reliance on the underlying numerical weather prediction model (HARMONIE-ALADIN). In the context of droughts, a few short and heavy precipitation events can offset the presence of a drought locally, as seen in CERRA. Similar performance deficiencies of CERRA over regions with scarce station networks have also been highlighted by Le Moigne et al. (2021) for northern and eastern Europe.
Our finding that CERRA represents snowfall metrics well and ERA5-Land does not (Figs. 4, 12, S14) is in agreement with Monteiro and Morin (2023), who, in contrast to our results, found a good performance for ERA5. This difference may be related to the scale difference between the two analyses or that they used the snow outputs from the reanalysis directly, while we approximated snow from precipitation and temperature. While our comparison focused on small- to medium-sized catchments, Monteiro and Morin (2023) looked at four large regions in the Alps, where higher resolution might be less crucial than at the catchment scale. Our results show strong differences between ERA5 and ERA5-Land in terms of temperature-derived snowfall characteristics. While ERA5 clearly underestimates solid precipitation, ERA5-Land clearly overestimates it. These differences are likely driven by the considerable temperature differences between the two datasets, as the differences in precipitation are marginal. Generally, ERA5-Land shows lower temperatures and temperature variability than ERA5 and observations, especially in winter and spring. Further, ERA5-Land shows larger biases at lower and higher elevations and simulates more cold days than ERA5, which explains the overestimation of solid precipitation. Even though CHELSA shows similar biases as ERA5 for many of the climate metrics, the higher resolution of CHELSA seems to clearly improve the representation of snowfall compared to ERA5 (Fig. 4). The snowfall overestimation by CHELSA at higher elevations might not be as severe as quantified, because the benchmark observations are known to underestimate solid precipitation at higher elevations (>1500 m) by up to 30 % (Bandhauer et al., 2021).
All the reanalysis datasets, except CERRA, clearly underestimate precipitation variability across all time scales (Fig. 5). On daily timescales, this might be explained by the overestimation of low to moderate precipitation by the reanalysis datasets and the underestimation of heavy precipitation intensities, which leads to a smaller range of daily precipitation variance or a flattening of the intensity curve. However, this explanation is not likely to be valid for the underestimation of monthly and inter-annual variability. The reasons for the underestimation of monthly to inter-annual variability could instead be model-driven and caused by deficiencies in representing orographic effects or uncertainties in data assimilation. Monteiro and Morin (2023) show no underestimation of precipitation variability by any of the datasets at the scale of the entire Alps. This suggests that the datasets agree well with observations at larger scales but not at local scales, where temporal variability is underestimated by most datasets.
Our results show that the studied extreme precipitation events have a larger spatial extent in ERA5 and ERA5-Land than in the other reanalyses datasets and the observations (Figs. 11, 12, S13, S16). This might result from their coarser grid resolution, which has the effect that single grid cells influence the precipitation averages of multiple catchments. However, CHELSA, which has a much finer spatial resolution, shows the same behavior, likely because the CHELSA downscaling approach conserves the mass of precipitation fluxes at the original coarser grid resolution of the W5E5. This means that when we average CHELSA values over catchments, we move closer to the original coarser grid resolution. This highlights that the actual spatial scales of these datasets are likely coarser than their grid spacing, especially for the interpolated or statistically downscaled datasets (ERA5-Land and CHELSA). This also applies to the gridded observations, which, depending on the number of stations, have an effective resolution of 15–20 km rather than 2 km (MeteoSchweiz, 2021a) or an even coarser resolution for intense convective precipitation (Frei and Isotta, 2019). Further, the results suggest that the spatial resolution of the ERA5 products is still not refined enough for heavy precipitation events, especially in complex terrain. Lavers et al. (2022) have found similar overestimation of the spatial extent of the heavy precipitation event during storm Alex in October 2020 on the northern side of the Alps, which they attributed to a poor representation of the orography in ERA5, leading to a larger moisture influx from the south.
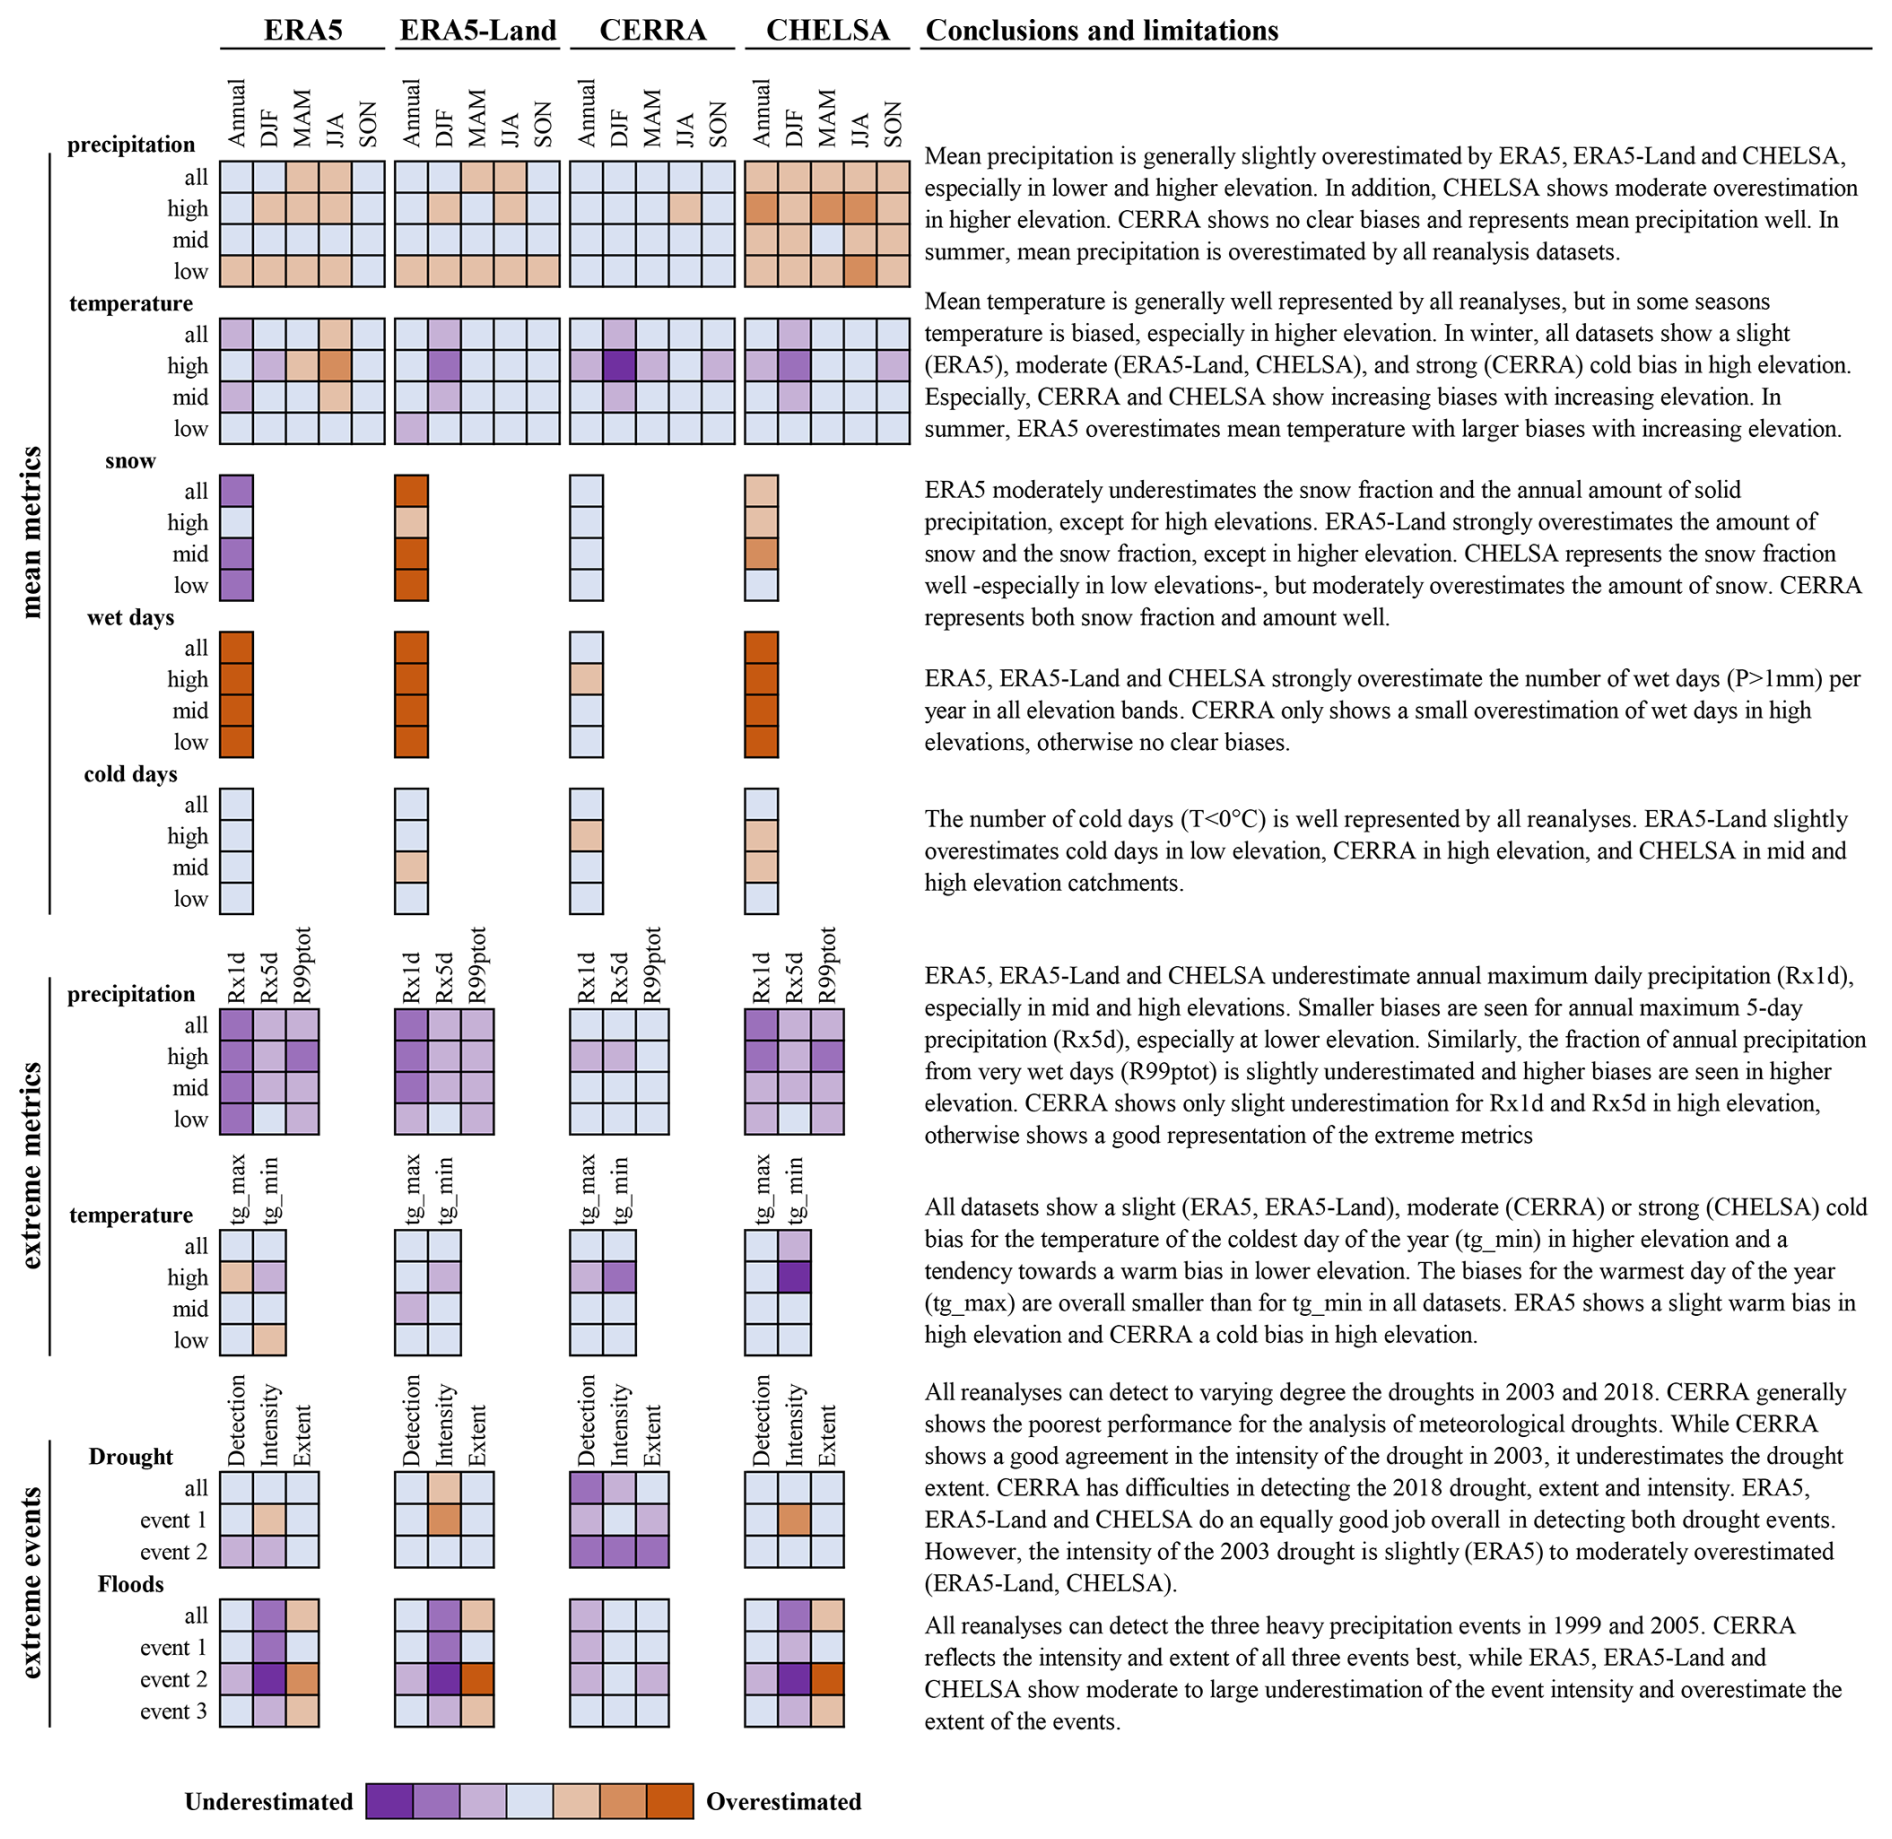
Figure 12Summary of results and dataset limitations for mean and extreme metrics and the two extreme event types. Orange colors indicate an overestimation and purple colors an underestimation by the datasets compared to observations. The color intensity reflects biases ranging from slight, moderate, to large over-/underestimation (see Figs. S14–S16 for the related quantitative biases). Biases in mean metrics and extreme metrics are stratified for low, mid, and high elevation catchments and all catchments. The quality of the datasets for meteorological droughts and heavy precipitation linked to floods are shown for the individual events and the average across events (all). The quality is divided into detection – event is detected in the same catchments in both observations and the reanalysis; intensity – bias in the intensity of the event; and extent – overall number of catchments showing an extreme event.
7.2 Differences due to varying modeling techniques
As all reanalysis datasets depend to varying degrees on the ERA5 reanalysis but use different modeling techniques to enhance the spatial representation and accuracy of ERA5, we can hypothesize whether these modeling choices may lead to a better performance. CHELSA and ERA5-Land use statistical downscaling with varying complexity to enhance the spatial resolution of ERA5, while CERRA uses a combination of dynamical downscaling and additional data assimilation to enhance spatial resolution and the representation of precipitation. Statistical downscaling did not substantially improve the representation of temperature and precipitation metrics compared to ERA5 and observations (Figs. 2, 3, 12). However, the statistical downscaling technique employed by CHELSA improved the representation of snowfall metrics (Fig. 4), likely due to the refinement of resolution (1 km). This allows for the representation of locally varying elevation features, which play a key role in snow formation. ERA5-Land, which partly uses interpolated meteorological variables from ERA5, shows that a pure interpolation without any additional adjustments does not lead to any improvements in the representation of precipitation metrics, compared to statistical downscaling with additional adjustments. In addition, the 9 km resolution of ERA5-Land might still be too coarse to refine the topography. In contrast to precipitation, ERA5 and ERA5-Land show considerable differences for temperature, which might be explained by the lapse-rate adjustment in ERA5-Land (Dutra et al., 2020), but might also be influenced by differences in soil-moisture interactions affecting evapotranspiration and energy fluxes, which in turn influence temperature (Hersbach et al., 2020; Muñoz-Sabater et al., 2021; Scherrer et al., 2022). Our analyses do not allow for clear conclusions on the isolated effect of dynamical downscaling, because the analyzed precipitation data from CERRA in our study (i.e., CERRA-Land) relies on dynamical downscaling and additional precipitation assimilation. However, CERRA(-Land) clearly shows that combining information from a reanalysis dataset with observations benefits the overall representation of climate metrics even when the resolution remains the same. To disentangle the influence of the dynamical downscaling from the influence of the MESCAN regional precipitation system in CERRA(-Land), future work would need to include the precipitation data from the CERRA high-resolution dataset, for which no additional precipitation information has been assimilated, and compare it to the precipitation data from CERRA with precipitation assimilation (i.e., CERRA-Land). The results from Ridal et al. (2024) suggest that the dynamical downscaling, even without precipitation assimilation (i.e., CERRA), leads to a clear improvement in the skill of precipitation with a lower false alarm rate and lower RMSE values compared to ERA5. Further, they show that the precipitation from CERRA-Land, i.e., as used in our analysis, yields even greater skill compared to ERA5. This suggests that the overall improvement by CERRA-Land likely results from the combination of the added-value of the dynamical downscaling and the post-processing of the regional precipitation analysis, MESCAN. Similarly, Bollmeyer et al. (2014) suggested that another dynamically downscaled regional reanalysis – the COSMO-REA6 – can show an improved representation of precipitation compared to its parent global reanalysis datasets (i.e., ERA-Interim) and that the added-value is especially pronounced when the regional reanalysis includes additional data assimilation.
7.3 Performance in high-elevation versus low-elevation catchments
Since we have low to high elevated catchments, we can compare whether the performance of the reanalyses is dependent on elevation. Generally, all reanalysis datasets show comparable performance in low-, mid-, and high-elevation catchments. However, for a few metrics and datasets, we can see larger biases in high-elevation or low-elevation catchments (Fig. 12). Temperature metrics related to the cold season particularly show larger biases in the high-elevation catchments. For example, in high-elevation catchments, mean daily winter temperature is colder in all datasets compared to observations (Figs. 2, 12); CERRA and CHELSA especially show clear elevation-dependent biases. The coldest day of the year (tg_min) is colder in high-elevation catchments and in all datasets compared to observations (Figs. 3, S7). Also, the number of cold days is overestimated by CERRA and CHELSA at high elevations (Fig. 3, S8). Otherwise, we find larger biases in higher elevation catchments for mean precipitation and annual maximum precipitation, especially for ERA5, ERA5-Land and CHELSA (Fig. 12).
7.4 Limitations
We acknowledge that the 35-year time period studied (1986–2020) may be too short to robustly estimate the real spread of inter-annual variability and to robustly detect trends. Especially for precipitation but also for temperature, a large number of samples is needed to adequately gauge inter-annual variability (Wood et al., 2021; Maher et al., 2020). However, as the reanalysis datasets are constrained by observations, the reanalyses and observations should both represent the same large-scale variability, and this constraint can partly be neglected. Nevertheless, the presented estimates of variability, based on 35 years of data, might deviate from the variability estimated by longer periods. Besides variability, the time period length also influences the detection of trends, as small signal to noise ratios can mask trends. Further, any trend analysis is time period sensitive and only a snapshot in time. For example, our trend analysis starting in 1986 yields decreasing trends in observed extreme precipitation (Fig. 7c); however, starting in 1901, it yields clearly increasing trends in observations (see e.g., Scherrer et al., 2016). Also Bruno and Duethmann (2024) show that the sign and significance of trends can vary depending on the time. In addition, the time varying quantity and quality of stations, which are in varying degrees used to generate the studied datasets and observations, might lead to spurious or artificial trends (Monteiro and Morin, 2023). This could be a reason for the large number of significant or opposite trends in the CERRA dataset (Fig. S18).
One main drawback of the current version of CERRA is the short simulation period (1984–2021). However, there are plans to extend the dataset to the present and back extend it to 1961 (Ridal et al., 2024). Once the long time period is available, the drawbacks arising from the short simulation period can partly be neglected. However, the good performance of CERRA over the recent period, which can in part be attributed to the large number of station data included in the MESCAN regional precipitation analysis system, needs to be re-assessed and confirmed for the back extension, where abundant and high-quality station records will be rarer.
The choice of the gridded observational product from MeteoSwiss might have influenced the results of our evaluation. Kotlarski et al. (2017) show that such influence is rather weak for temperature but larger for precipitation. The precipitation observations (RhiresD) used in this study tend to overestimate light precipitation and underestimate strong precipitation (MeteoSchweiz, 2021a; Kotlarski et al., 2017). This means that the underestimation of extreme precipitation metrics in ERA5, ERA5-Land, and CHELSA is likely even larger than shown here. In general, gridded observations suffer from uncertainties not only from measurement errors (Kochendorfer et al., 2017) but also from the interpolation of station data (Frei and Isotta, 2019). The interpolation uncertainty is thereby influenced by varying station densities or the lack of representative stations, especially at high altitudes (Frei, 2013). For the gridded temperature dataset TabsD, Frei (2013) show seasonally varying interpolation errors with larger biases in winter, which can reach mean absolute errors of 3°C and more, and smaller errors in summer. This means that dataset differences, especially in winter (e.g., for the snowfall approximation), could in reality be larger or smaller depending on the location. To account for these uncertainties, more observational datasets would be required, although most gridded datasets rely on more or less the same station network, which would then only allow for disentangling the uncertainties from the interpolation scheme. As the interpolated fields are only one possible realization of the real spatial distribution, one could use ensembles of the same gridded product to estimate the interpolation uncertainty (e.g., Frei and Isotta, 2019. However, not many ensemble products for gridded observations exist, and, for example, Bandhauer et al. (2021) show that such an ensemble might not represent the full spread of interpolation uncertainty.
In this paper, we conducted a comprehensive spatio-temporal evaluation of four state-of-the-art reanalysis datasets (ERA5, ERA5-Land, CERRA(-Land), and CHELSA-v2.1) for different precipitation, temperature, and snowfall metrics over complex terrain by comparing them to gridded observations. Across the various precipitation and temperature metrics, and their temporal variability, the CERRA dataset best represents the observations (Figs. 12, S17), making it a good overall choice for hydrological impact studies in low- to high-elevation catchments. In the following, we will provide a few general recommendations for the use of the reanalysis datasets compared and some more specific recommendations for some hypothetical use-cases.
As precipitation is the dominant variable in driving the hydrological response, we recommend using the CERRA dataset for hydrological impact studies and hypothesize that CERRA will likely serve as a good input for hydrological models, because (a) CERRA captures mean and extreme precipitation well across seasons and elevations; (b) captures the three heavy precipitation events that triggered flooding in Switzerland well in terms of intensity and spatial extent; and (c) can in combination with its good representation of temperature lead to small biases in snowfall fraction and total snow amount. In snow-dominated catchments, we can further recommend the use of CHELSA, as it also represents snow fraction and amount well.
Many climate change impact studies require bias adjustment of climate model simulations prior to modeling hydrological changes. Here, we can recommend using CERRA as the reference for the bias adjustment, for similar reasons as above and because of its good representation of wet-day frequency. ERA5, ERA5-Land, or CHELSA will likely be an insufficient reference to correct for biases, as these datasets themselves are biased in terms of wet-day frequency and mean and extreme precipitation.
Overall, all four reanalysis datasets can represent extreme dry and wet meteorological conditions of varying severity and intensity as illustrated for the droughts in 2003 and 2018 and the extreme precipitation events in 1999 and 2005. For studying meteorological droughts in mountain regions, we recommend using ERA5, ERA5-Land, or CHELSA. While they can overestimate drought severity, they overall capture these events well. CERRA, on the other hand, underestimates the severity and intensity of the studied drought events, revealing spurious precipitation events that alleviate drought conditions, which seems to be the major limitation of this dataset. For heavy precipitation events, we recommend using CERRA. It best represents wet extremes, while the other datasets overestimate spatial extents, severity, and intensity in catchments with low to moderate precipitation characteristics.
In conclusion, CERRA seems to be the best reanalysis choice for hydrological impact studies that rely on precipitation, temperature, and their interplay as it captures their mean characteristics, variability, and extremes well, with the exception of distinct droughts.
The reanalysis datasets ERA5, ERA5-Land, and CERRA are all freely available through the Copernicus Climate Change Service (C3S) Climate Data Store (CDS). ERA5: https://doi.org/10.24381/cds.adbb2d47 (Hersbach et al., 2023); ERA5-Land: https://doi.org/10.24381/cds.e2161bac (Muñoz Sabater, 2019); CERRA high resolution: https://doi.org/10.24381/cds.622a565a (Schimanke et al., 2021); CERRA-Land: https://doi.org/10.24381/cds.a7f3cd0b (Verrelle et al., 2022). The CHELSA dataset is available through EnviDat: https://doi.org/10.16904/envidat.228 (Karger et al., 2021a). CAMELS-CH is available through Zenodo: https://doi.org/10.5281/zenodo.7957061 (Höge et al., 2023a). The xclim Python package v0.44.0 for the climate indicators is available through Zenodo: https://doi.org/10.5281/zenodo.8075481 (Bourgault et al., 2023a).
The supplement related to this article is available online at https://doi.org/10.5194/hess-29-4153-2025-supplement.
RRW conceptualized and performed the majority of the analysis and wrote the first draft of the manuscript. JJ contributed to the drought analysis, supported the data pre-processing, and contributed to the writing of the manuscript. AvH supported the data pre-processing and contributed to editing and reviewing of the manuscript. JG contributed to the flood event analysis and to editing and reviewing the manuscript. DLS contributed to editing and reviewing the manuscript. MIB supported the data analysis and contributed to writing, reviewing, and editing the manuscript and acquired the funding for this project.
At least one of the (co-)authors is a member of the editorial board of Hydrology and Earth System Sciences. The peer-review process was guided by an independent editor, and the authors also have no other competing interests to declare.
Publisher’s note: Copernicus Publications remains neutral with regard to jurisdictional claims made in the text, published maps, institutional affiliations, or any other geographical representation in this paper. While Copernicus Publications makes every effort to include appropriate place names, the final responsibility lies with the authors.
We thank Ruth Lorenz for her vital support in data curation and data management.
This research has been supported by the Schweizerischer Nationalfonds zur Förderung der Wissenschaftlichen Forschung (grant no. PZ00P2_201818) and the Swiss Federal Office for the Environment FOEN (HydroSMILE-CH grant).
This paper was edited by Lelys Bravo de Guenni and reviewed by Laurent Strohmenger and one anonymous referee.
Adler, C., Wester, P., Bhatt, I., Huggel, C., Insarov, G., Morecroft, M., Muccione, V., and Prakash, A.: Cross-Chapter Paper 5: Mountains, in: Climate Change 2022 – Impacts, Adaptation and Vulnerability, edited by Pörtner, H.-O., Roberts, D., Tignor, M., Poloczanska, E., Mintenbeck, K., Alegría, A., Craig, M., Langsdorf, S., Löschke, S., Möller, V., Okem, A., and Rama, B., 2273–2318, Cambridge University Press, Cambridge, UK and New York, NY, USA, ISBN 9781009325844, https://doi.org/10.1017/9781009325844.022, 2022. a
Alexander, L. V., Bador, M., Roca, R., Contractor, S., Donat, M. G., and Nguyen, P. L.: Intercomparison of annual precipitation indices and extremes over global land areas from in situ, space-based and reanalysis products, Environ. Res. Lett., 15, 055002, https://doi.org/10.1088/1748-9326/ab79e2, 2020. a
Bakke, S. J., Ionita, M., and Tallaksen, L. M.: The 2018 northern European hydrological drought and its drivers in a historical perspective, Hydrol. Earth Syst. Sci., 24, 5621–5653, https://doi.org/10.5194/hess-24-5621-2020, 2020. a
Bandhauer, M., Isotta, F., Lakatos, M., Lussana, C., Båserud, L., Izsák, B., Szentes, O., Tveito, O. E., and Frei, C.: Evaluation of daily precipitation analyses in E-OBS (v19.0e) and ERA5 by comparison to regional high-resolution datasets in European regions, Int. J. Climatol., 42, 727–747, https://doi.org/10.1002/joc.7269, 2021. a, b, c
Bengtsson, L., Andrae, U., Aspelien, T., Batrak, Y., Calvo, J., de Rooy, W., Gleeson, E., Hansen-Sass, B., Homleid, M., Hortal, M., Ivarsson, K.-I., Lenderink, G., Niemelä, S., Nielsen, K. P., Onvlee, J., Rontu, L., Samuelsson, P., Muñoz, D. S., Subias, A., Tijm, S., Toll, V., Yang, X., and Køltzow, M. Ã.: The HARMONIE–AROME Model Configuration in the ALADIN–HIRLAM NWP System, Mon. Weather Rev., 145, 1919–1935, https://doi.org/10.1175/mwr-d-16-0417.1, 2017. a
Beniston, M.: August 2005 intense rainfall event in Switzerland: Not necessarily an analog for strong convective events in a greenhouse climate, Geophys. Res. Lett., 33, L05701, https://doi.org/10.1029/2005gl025573, 2006. a
Bollmeyer, C., Keller, J. D., Ohlwein, C., Wahl, S., Crewell, S., Friederichs, P., Hense, A., Keune, J., Kneifel, S., Pscheidt, I., Redl, S., and Steinke, S.: Towards a high-resolution regional reanalysis for the European CORDEX domain, Q. J. Roy. Meteor. Soc., 141, 1–15, https://doi.org/10.1002/qj.2486, 2014. a, b, c
Bourgault, P., Huard, D., Smith, T. J., Logan, T., Aoun, A., Lavoie, J., Dupuis, Ã., Rondeau-Genesse, G., Alegre, R., Barnes, C., Beaupré Laperrière, A., Biner, S., Caron, D., Ehbrecht, C., Fyke, J., Keel, T., Labonté, M.-P., Lierhammer, L., Low, J.-F., Quinn, J., Roy, P., Squire, D., Stephens, A., Tanguy, M., and Whelan, C.: xclim: xarray-based climate data analytics (v0.44.0), Zenodo [code], https://doi.org/10.5281/zenodo.8075481, 2023a. a
Bourgault, P., Huard, D., Smith, T. J., Logan, T., Aoun, A., Lavoie, J., Dupuis, Ã., Rondeau-Genesse, G., Alegre, R., Barnes, C., Laperrière, A. B., Biner, S., Caron, D., Ehbrecht, C., Fyke, J., Keel, T., Labonté, M.-P., Lierhammer, L., Low, J.-F., Quinn, J., Roy, P., Squire, D., Stephens, A., Tanguy, M., and Whelan, C.: xclim: xarray-based climate data analytics, Journal of Open Source Software, 8, 5415, https://doi.org/10.21105/joss.05415, 2023b. a
Brun, P., Zimmermann, N. E., Hari, C., Pellissier, L., and Karger, D. N.: Global climate-related predictors at kilometer resolution for the past and future, Earth Syst. Sci. Data, 14, 5573–5603, https://doi.org/10.5194/essd-14-5573-2022, 2022. a
Brunner, M. I. and Chartier-Rescan, C.: Drought Spatial Extent and Dependence Increase During Drought Propagation From the Atmosphere to the Hydrosphere, Geophys. Res. Lett., 51, e2023GL107918, https://doi.org/10.1029/2023gl107918, 2024. a
Brunner, M. I. and Fischer, S.: Snow-influenced floods are more strongly connected in space than purely rainfall-driven floods, Environ. Res. Lett., 17, 104038, https://doi.org/10.1088/1748-9326/ac948f, 2022. a
Brunner, M. I., Liechti, K., and Zappa, M.: Extremeness of recent drought events in Switzerland: dependence on variable and return period choice, Nat. Hazards Earth Syst. Sci., 19, 2311–2323, https://doi.org/10.5194/nhess-19-2311-2019, 2019. a
Brunner, M. I., Götte, J., Schlemper, C., and Van Loon, A. F.: Hydrological Drought Generation Processes and Severity Are Changing in the Alps, Geophys. Res. Lett., 50, e2022GL101776, https://doi.org/10.1029/2022gl101776, 2023. a
Bruno, G. and Duethmann, D.: Increases in Water Balance-Derived Catchment Evapotranspiration in Germany During 1970s–2000s Turning Into Decreases Over the Last Two Decades, Despite Uncertainties, Geophys. Res. Lett., 51, e2023GL107753, https://doi.org/10.1029/2023gl107753, 2024. a
Cucchi, M., Weedon, G. P., Amici, A., Bellouin, N., Lange, S., Müller Schmied, H., Hersbach, H., and Buontempo, C.: WFDE5: bias-adjusted ERA5 reanalysis data for impact studies, Earth Syst. Sci. Data, 12, 2097–2120, https://doi.org/10.5194/essd-12-2097-2020, 2020. a
Daly, C., Halbleib, M., Smith, J. I., Gibson, W. P., Doggett, M. K., Taylor, G. H., Curtis, J., and Pasteris, P. P.: Physiographically sensitive mapping of climatological temperature and precipitation across the conterminous United States, Int. J. Climatol., 28, 2031–2064, https://doi.org/10.1002/joc.1688, 2008. a
Danielson, J. J. and Gesch, D. B.: Global multi-resolution terrain elevation data 2010 (GMTED2010), USGS, https://doi.org/10.3133/ofr20111073, 2011. a
Dee, D. P., Balmaseda, M., Balsamo, G., Engelen, R., Simmons, A. J., and Thépaut, J.-N.: Toward a Consistent Reanalysis of the Climate System, B. Am. Meteorol. Soc., 95, 1235–1248, https://doi.org/10.1175/bams-d-13-00043.1, 2014. a
Dura, V., Evin, G., Favre, A.-C., and Penot, D.: Spatial variability in the seasonal precipitation lapse rates in complex topographical regions – application in France, Hydrol. Earth Syst. Sci., 28, 2579–2601, https://doi.org/10.5194/hess-28-2579-2024, 2024. a, b
Dutra, E., Muñoz-Sabater, J., Boussetta, S., Komori, T., Hirahara, S., and Balsamo, G.: Environmental Lapse Rate for High-Resolution Land Surface Downscaling: An Application to ERA5, Earth and Space Science, 7, e2019EA000984, https://doi.org/10.1029/2019ea000984, 2020. a, b
Ferguglia, O., Palazzi, E., and Arnone, E.: Elevation dependent change in ERA5 precipitation and its extremes, Clim. Dynam., 62, 8137–8153, https://doi.org/10.1007/s00382-024-07328-6, 2024. a
Frei, C.: Interpolation of temperature in a mountainous region using nonlinear profiles and non-Euclidean distances, Int. J. Climatol., 34, 1585–1605, https://doi.org/10.1002/joc.3786, 2013. a, b, c, d, e
Frei, C. and Isotta, F. A.: Ensemble Spatial Precipitation Analysis From Rain Gauge Data: Methodology and Application in the European Alps, J. Geophys. Res.-Atmos., 124, 5757–5778, https://doi.org/10.1029/2018jd030004, 2019. a, b, c
Gampe, D., Schmid, J., and Ludwig, R.: Impact of Reference Dataset Selection on RCM Evaluation, Bias Correction, and Resulting Climate Change Signals of Precipitation, J. Hydrometeorol., 20, 1813–1828, https://doi.org/10.1175/jhm-d-18-0108.1, 2019. a
Gebrechorkos, S. H., Leyland, J., Dadson, S. J., Cohen, S., Slater, L., Wortmann, M., Ashworth, P. J., Bennett, G. L., Boothroyd, R., Cloke, H., Delorme, P., Griffith, H., Hardy, R., Hawker, L., McLelland, S., Neal, J., Nicholas, A., Tatem, A. J., Vahidi, E., Liu, Y., Sheffield, J., Parsons, D. R., and Darby, S. E.: Global-scale evaluation of precipitation datasets for hydrological modelling, Hydrol. Earth Syst. Sci., 28, 3099–3118, https://doi.org/10.5194/hess-28-3099-2024, 2024. a
Gelaro, R., McCarty, W., Suárez, M. J., Todling, R., Molod, A., Takacs, L., Randles, C. A., Darmenov, A., Bosilovich, M. G., Reichle, R., Wargan, K., Coy, L., Cullather, R., Draper, C., Akella, S., Buchard, V., Conaty, A., da Silva, A. M., Gu, W., Kim, G.-K., Koster, R., Lucchesi, R., Merkova, D., Nielsen, J. E., Partyka, G., Pawson, S., Putman, W., Rienecker, M., Schubert, S. D., Sienkiewicz, M., and Zhao, B.: The Modern-Era Retrospective Analysis for Research and Applications, Version 2 (MERRA-2), J. Climate, 30, 5419–5454, https://doi.org/10.1175/jcli-d-16-0758.1, 2017. a, b
Hersbach, H., Bell, B., Berrisford, P., Hirahara, S., Horányi, A., Muñoz-Sabater, J., Nicolas, J., Peubey, C., Radu, R., Schepers, D., Simmons, A., Soci, C., Abdalla, S., Abellan, X., Balsamo, G., Bechtold, P., Biavati, G., Bidlot, J., Bonavita, M., De Chiara, G., Dahlgren, P., Dee, D., Diamantakis, M., Dragani, R., Flemming, J., Forbes, R., Fuentes, M., Geer, A., Haimberger, L., Healy, S., Hogan, R. J., Hólm, E., Janisková, M., Keeley, S., Laloyaux, P., Lopez, P., Lupu, C., Radnoti, G., de Rosnay, P., Rozum, I., Vamborg, F., Villaume, S., and Thépaut, J.-N.: The ERA5 global reanalysis, Q. J. Roy. Meteor. Soc., 146, 1999–2049, https://doi.org/10.1002/qj.3803, 2020. a, b, c, d, e, f, g
Hersbach, H., Bell, B., Berrisford, P., Biavati, G., Horányi, A., Muñoz Sabater, J., Nicolas, J., Peubey, C., Radu, R., Rozum, I., Schepers, D., Simmons, A., Soci, C., Dee, D., and Thépaut, J.-N.: ERA5 hourly data on single levels from 1940 to present, Copernicus Climate Change Service (C3S) Climate Data Store (CDS) [data set], https://doi.org/10.24381/cds.adbb2d47, 2023. a
Hilker, N., Badoux, A., and Hegg, C.: The Swiss flood and landslide damage database 1972–2007, Nat. Hazards Earth Syst. Sci., 9, 913–925, https://doi.org/10.5194/nhess-9-913-2009, 2009. a, b
Hofstra, N., Haylock, M., New, M., Jones, P., and Frei, C.: Comparison of six methods for the interpolation of daily, European climate data, J. Geophys. Res.-Atmos., 113, D21110, https://doi.org/10.1029/2008jd010100, 2008. a
Höge, M., Kauzlaric, M., Siber, R., Schönenberger, U., Horton, P., Schwanbeck, J., Floriancic, M., Viviroli, D., Wilhelm, S., Sikorska-Senoner, A., Addor, N., Brunner, M., Pool, S., Zappa, M., and Fenicia, F.: Catchment attributes and hydro-meteorological time series for large-sample studies across hydrologic Switzerland (CAMELS-CH) (0.6), Zenodo [data set], https://doi.org/10.5281/zenodo.7957061, 2023a. a
Höge, M., Kauzlaric, M., Siber, R., Schönenberger, U., Horton, P., Schwanbeck, J., Floriancic, M. G., Viviroli, D., Wilhelm, S., Sikorska-Senoner, A. E., Addor, N., Brunner, M., Pool, S., Zappa, M., and Fenicia, F.: CAMELS-CH: hydro-meteorological time series and landscape attributes for 331 catchments in hydrologic Switzerland, Earth Syst. Sci. Data, 15, 5755–5784, https://doi.org/10.5194/essd-15-5755-2023, 2023b. a, b
Isotta, F. A., Frei, C., Weilguni, V., Perčec Tadić, M., Lassègues, P., Rudolf, B., Pavan, V., Cacciamani, C., Antolini, G., Ratto, S. M., Munari, M., Micheletti, S., Bonati, V., Lussana, C., Ronchi, C., Panettieri, E., Marigo, G., and Vertačnik, G.: The climate of daily precipitation in the Alps: development and analysis of a high-resolution grid dataset from pan-Alpine rain-gauge data, Int. J. Climatol., 34, 1657–1675, https://doi.org/10.1002/joc.3794, 2013. a
Karger, D. N., Conrad, O., Böhner, J., Kawohl, T., Kreft, H., Soria-Auza, R. W., Zimmermann, N. E., Linder, H. P., and Kessler, M.: Climatologies at high resolution for the earth's land surface areas, Scientific Data, 4, 170122, https://doi.org/10.1038/sdata.2017.122, 2017. a, b, c
Karger, D. N., Conrad, O., Böhner, J., Kawohl, T., Kreft, H., Soria-Auza, R. W., Zimmermann, N. E., Linder, H. P., and Kessler, M.: Climatologies at high resolution for the earth’s land surface areas, EnviDat [data set], https://doi.org/10.16904/envidat.228, 2021a. a, b
Karger, D. N., Wilson, A. M., Mahony, C., Zimmermann, N. E., and Jetz, W.: Global daily 1 km land surface precipitation based on cloud cover-informed downscaling, Scientific Data, 8, 307, https://doi.org/10.1038/s41597-021-01084-6, 2021b. a, b, c
Karger, D. N., Lange, S., Hari, C., Reyer, C. P. O., Conrad, O., Zimmermann, N. E., and Frieler, K.: CHELSA-W5E5: daily 1 km meteorological forcing data for climate impact studies, Earth Syst. Sci. Data, 15, 2445–2464, https://doi.org/10.5194/essd-15-2445-2023, 2023. a, b, c, d
Kendall, M. G.: Rank correlation methods, Charles Griffin, London, 1975. a
Kobayashi, S., Ota, Y., Harada, Y., Ebita, A., Moriya, M., Onoda, H., Onogi, K., Kamahori, H., Kobayashi, C., Endo, H., Miyaoka, K., and Takahashi, K.: The JRA-55 Reanalysis: General Specifications and Basic Characteristics, J. Meteorol. Soc. Jpn. Ser. II, 93, 5–48, https://doi.org/10.2151/jmsj.2015-001, 2015. a
Kochendorfer, J., Rasmussen, R., Wolff, M., Baker, B., Hall, M. E., Meyers, T., Landolt, S., Jachcik, A., Isaksen, K., Brækkan, R., and Leeper, R.: The quantification and correction of wind-induced precipitation measurement errors, Hydrol. Earth Syst. Sci., 21, 1973–1989, https://doi.org/10.5194/hess-21-1973-2017, 2017. a
Kotlarski, S., Szabó, P., Herrera, S., Räty, O., Keuler, K., Soares, P. M., Cardoso, R. M., Bosshard, T., Pagé, C., Boberg, F., Gutiérrez, J. M., Isotta, F. A., Jaczewski, A., Kreienkamp, F., Liniger, M. A., Lussana, C., and Pianko-Kluczyńska, K.: Observational uncertainty and regional climate model evaluation: A pan-European perspective, Int. J. Climatol., 39, 3730–3749, https://doi.org/10.1002/joc.5249, 2017. a, b, c
Krähenmann, S., Walter, A., Brienen, S., Imbery, F., and Matzarakis, A.: High-resolution grids of hourly meteorological variables for Germany, Theor. Appl. Climatol., 131, 899–926, https://doi.org/10.1007/s00704-016-2003-7, 2016. a
Lavers, D. A., Simmons, A., Vamborg, F., and Rodwell, M. J.: An evaluation of ERA5 precipitation for climate monitoring, Q. J. Roy. Meteor. Soc., 148, 3152–3165, https://doi.org/10.1002/qj.4351, 2022. a, b
Le Moigne, P., Bazile, E., Glinton, M., and A., V.: Documentation of the CERRA-Land system, Tech. Rep. C3S deliverable C3S_D322_Lot1.1.1.12_202110_documentation_CERRA-Land, Copernicus Climate Change Service, https://dast.copernicus-climate.eu/documents/reanalysis-cerra/D322_Lot1.1.1.12_Documentation_CERRA-Land.pdf (last access: 1 September 2025), 2021. a
Lloyd-Hughes, B. and Saunders, M. A.: A drought climatology for Europe, Int. J. Climatol., 22, 1571–1592, https://doi.org/10.1002/joc.846, 2002. a
Lussana, C., Tveito, O. E., Dobler, A., and Tunheim, K.: seNorge_2018, daily precipitation, and temperature datasets over Norway, Earth Syst. Sci. Data, 11, 1531–1551, https://doi.org/10.5194/essd-11-1531-2019, 2019. a
Maher, N., Lehner, F., and Marotzke, J.: Quantifying the role of internal variability in the temperature we expect to observe in the coming decades, Environ. Res. Lett., 15, 054014, https://doi.org/10.1088/1748-9326/ab7d02, 2020. a
Mann, H. B.: Nonparametric Tests Against Trend, Econometrica, 13, 245, https://doi.org/10.2307/1907187, 1945. a
McClean, F., Dawson, R., and Kilsby, C.: Intercomparison of global reanalysis precipitation for flood risk modelling, Hydrol. Earth Syst. Sci., 27, 331–347, https://doi.org/10.5194/hess-27-331-2023, 2023. a
MeteoSchweiz: Klimareport 2018, Tech. rep., Bundesamt für Meteorologie und Klimatologie MeteoSchweiz, Zürich, https://www.meteoschweiz.admin.ch/service-und-publikationen/publikationen/berichte-und-bulletins/2019/klimareport-2018.html (last access: 26 June 2025), 2019. a
MeteoSchweiz: Documentation of MeteoSwiss Grid-Data Products. Daily Precipitation (final analysis): RhiresD, techreport, Bundesamt für Meteorologie und Klimatologie MeteoSchweiz, Zürich, https://www.meteoschweiz.admin.ch/dam/jcr:4f51f0f1-0fe3-48b5-9de0-15666327e63c/ProdDoc_RhiresD.pdf (last access: 26 June 2025), 2021a. a, b, c, d
MeteoSchweiz: Documentation of MeteoSwiss Grid-Data Products. Daily Mean, Minimum and MaximumTemperature: TabsD, TminD, TmaxD, Tech. rep., Bundesamt für Meteorologie und Klimatologie MeteoSchweiz, Zürich, https://www.meteoschweiz.admin.ch/dam/jcr:818a4d17-cb0c-4e8b-92c6-1a1bdf5348b7/ProdDoc_TabsD.pdf (last access: 26 June 2025), 2021b. a, b
Monteiro, D. and Morin, S.: Multi-decadal analysis of past winter temperature, precipitation and snow cover data in the European Alps from reanalyses, climate models and observational datasets, The Cryosphere, 17, 3617–3660, https://doi.org/10.5194/tc-17-3617-2023, 2023. a, b, c, d, e, f
Muñoz Sabater, J.: ERA5-Land hourly data from 1950 to present, Copernicus Climate Change Service (C3S) Climate Data Store (CDS) [data set], https://doi.org/10.24381/cds.e2161bac, 2019. a
Muñoz-Sabater, J., Dutra, E., Agustí-Panareda, A., Albergel, C., Arduini, G., Balsamo, G., Boussetta, S., Choulga, M., Harrigan, S., Hersbach, H., Martens, B., Miralles, D. G., Piles, M., Rodríguez-Fernández, N. J., Zsoter, E., Buontempo, C., and Thépaut, J.-N.: ERA5-Land: a state-of-the-art global reanalysis dataset for land applications, Earth Syst. Sci. Data, 13, 4349–4383, https://doi.org/10.5194/essd-13-4349-2021, 2021. a, b, c, d, e, f
Napoli, A., Crespi, A., Ragone, F., Maugeri, M., and Pasquero, C.: Variability of orographic enhancement of precipitation in the Alpine region, Scientific Reports, 9, 13352, https://doi.org/10.1038/s41598-019-49974-5, 2019. a
Rauthe, M., Steiner, H., Riediger, U., Mazurkiewicz, A., and Gratzki, A.: A Central European precipitation climatology – Part I: Generation and validation of a high-resolution gridded daily data set (HYRAS), Meteorol. Z., 22, 235–256, https://doi.org/10.1127/0941-2948/2013/0436, 2013. a, b
Ridal, M., Bazile, E., Le Moigne, P., Randriamampianina, R., Schimanke, S., Andrae, U., Berggren, L., Brousseau, P., Dahlgren, P., Edvinsson, L., El-Said, A., Glinton, M., Hagelin, S., Hopsch, S., Isaksson, L., Medeiros, P., Olsson, E., Unden, P., and Wang, Z. Q.: CERRA, the Copernicus European Regional Reanalysis system, Q. J. Roy. Meteorol. Soc., 150, 3385–3411, https://doi.org/10.1002/qj.4764, 2024. a, b, c, d, e, f, g
Roca, R., Alexander, L. V., Potter, G., Bador, M., Jucá, R., Contractor, S., Bosilovich, M. G., and Cloché, S.: FROGS: a daily 1° × 1° gridded precipitation database of rain gauge, satellite and reanalysis products, Earth Syst. Sci. Data, 11, 1017–1035, https://doi.org/10.5194/essd-11-1017-2019, 2019. a
Scherrer, S. C., Fischer, E. M., Posselt, R., Liniger, M. A., Croci-Maspoli, M., and Knutti, R.: Emerging trends in heavy precipitation and hot temperature extremes in Switzerland, J. Geophys. Res.-Atmos., 121, 2626–2637, https://doi.org/10.1002/2015jd024634, 2016. a
Scherrer, S. C., Hirschi, M., Spirig, C., Maurer, F., and Kotlarski, S.: Trends and drivers of recent summer drying in Switzerland, Environmental Research Communications, 4, 025004, https://doi.org/10.1088/2515-7620/ac4fb9, 2022. a
Schimanke, S., Ridal, M., Moigne, L., Berggren, P., Undén, L., Randriamampianina, P., Andrea, R., Bazile, U., Bertelsen, E., Brousseau, A., Dahlgren, P., Edvinsson, P., El Said, L., Glinton, A., Hopsch, M., Isaksson, S., Mladek, L., Olsson, R., Verrelle, E., Wang, A., and Z: CERRA sub-daily regional reanalysis data for Europe on single levels from 1984 to present, Copernicus Climate Change Service (C3S) Climate Data Store (CDS) [data set], https://doi.org/10.24381/cds.622a565a, 2021. a, b, c
Schwarb, M.: The alpine precipitation climate: evaluation of a high-resolution analysis scheme using comprehensive rain-gauge data, PhD thesis, ETH Zürich, https://doi.org/10.3929/ETHZ-A-004121274, 2000. a
Sen, P. K.: Estimates of the Regression Coefficient Based on Kendall's Tau, J. Am. Stat. Assoc., 63, 1379–1389, https://doi.org/10.1080/01621459.1968.10480934, 1968. a
Soci, C., Bazile, E., Besson, F., and Landelius, T.: High-resolution precipitation re-analysis system for climatological purposes, Tellus A, 68, 29879, https://doi.org/10.3402/tellusa.v68.29879, 2016. a, b, c
Stagge, J. H., Tallaksen, L. M., Gudmundsson, L., Van Loon, A. F., and Stahl, K.: Candidate Distributions for Climatological Drought Indices (SPI and SPEI), Int. J. Climatol., 35, 4027–4040, https://doi.org/10.1002/joc.4267, 2015. a
Sun, Q., Miao, C., Duan, Q., Ashouri, H., Sorooshian, S., and Hsu, K.: A Review of Global Precipitation Data Sets: Data Sources, Estimation, and Intercomparisons, Rev. Geophys., 56, 79–107, https://doi.org/10.1002/2017rg000574, 2018. a, b
Tarek, M., Brissette, F. P., and Arsenault, R.: Evaluation of the ERA5 reanalysis as a potential reference dataset for hydrological modelling over North America, Hydrol. Earth Syst. Sci., 24, 2527–2544, https://doi.org/10.5194/hess-24-2527-2020, 2020. a, b
Tarek, M., Brissette, F., and Arsenault, R.: Uncertainty of gridded precipitation and temperature reference datasets in climate change impact studies, Hydrol. Earth Syst. Sci., 25, 3331–3350, https://doi.org/10.5194/hess-25-3331-2021, 2021. a
Termonia, P., Fischer, C., Bazile, E., Bouyssel, F., Brožková, R., Bénard, P., Bochenek, B., Degrauwe, D., Derková, M., El Khatib, R., Hamdi, R., Mašek, J., Pottier, P., Pristov, N., Seity, Y., Smolíková, P., Španiel, O., Tudor, M., Wang, Y., Wittmann, C., and Joly, A.: The ALADIN System and its canonical model configurations AROME CY41T1 and ALARO CY40T1, Geosci. Model Dev., 11, 257–281, https://doi.org/10.5194/gmd-11-257-2018, 2018. a
Tootoonchi, F., Haerter, J. O., Todorović, A., Räty, O., Grabs, T., and Teutschbein, C.: Uni- and multivariate bias adjustment methods in Nordic catchments: Complexity and performance in a changing climate, Sci. Total Environ., 853, 158615, https://doi.org/10.1016/j.scitotenv.2022.158615, 2022. a
Vautard, R., Kadygrov, N., Iles, C., Boberg, F., Buonomo, E., Bülow, K., Coppola, E., Corre, L., van Meijgaard, E., Nogherotto, R., Sandstad, M., Schwingshackl, C., Somot, S., Aalbers, E., Christensen, O. B., Ciarlo, J. M., Demory, M., Giorgi, F., Jacob, D., Jones, R. G., Keuler, K., Kjellström, E., Lenderink, G., Levavasseur, G., Nikulin, G., Sillmann, J., Solidoro, C., Sørland, S. L., Steger, C., Teichmann, C., Warrach-Sagi, K., and Wulfmeyer, V.: Evaluation of the Large EURO-CORDEX Regional Climate Model Ensemble, J. Geophys. Res.-Atmos., 126, e2019JD032344, https://doi.org/10.1029/2019jd032344, 2021. a
Verrelle, A., Glinton, M., Bazile, E., Moigne, L., Randriamampianina, P., Ridal, R., Berggren, M., Undén, L., Schimanke, P., Mladek, S., Soci, R., and C: CERRA-Land sub-daily regional reanalysis data for Europe from 1984 to present, Copernicus Climate Change Service (C3S) Climate Data Store (CDS) [data set], https://doi.org/10.24381/cds.a7f3cd0b, 2022. a, b, c
Vidal, J., Martin, E., Franchistéguy, L., Baillon, M., and Soubeyroux, J.: A 50-year high-resolution atmospheric reanalysis over France with the Safran system, Int. J. Climatol., 30, 1627–1644, https://doi.org/10.1002/joc.2003, 2009. a
Willkofer, F., Wood, R. R., von Trentini, F., Weismüller, J., Poschlod, B., and Ludwig, R.: A Holistic Modelling Approach for the Estimation of Return Levels of Peak Flows in Bavaria, Water, 12, 2349, https://doi.org/10.3390/w12092349, 2020. a, b
Wood, R. R.: Role of mean and variability change in changes in European annual and seasonal extreme precipitation events, Earth Syst. Dynam., 14, 797–816, https://doi.org/10.5194/esd-14-797-2023, 2023. a
Wood, R. R. and Ludwig, R.: Analyzing Internal Variability and Forced Response of Subdaily and Daily Extreme Precipitation Over Europe, Geophys. Res. Lett., 47, e2020GL089300, https://doi.org/10.1029/2020gl089300, 2020. a
Wood, R. R., Lehner, F., Pendergrass, A. G., and Schlunegger, S.: Changes in precipitation variability across time scales in multiple global climate model large ensembles, Environ. Res. Lett., 16, 084022, https://doi.org/10.1088/1748-9326/ac10dd, 2021. a
Zappa, M. and Kan, C.: Extreme heat and runoff extremes in the Swiss Alps, Nat. Hazards Earth Syst. Sci., 7, 375–389, https://doi.org/10.5194/nhess-7-375-2007, 2007. a
- Abstract
- Introduction
- Datasets
- Methods
- Mean and extreme precipitation and temperature climatology
- Temporal consistency
- Representation of extreme events
- Discussion
- Conclusions and recommendations
- Code and data availability
- Author contributions
- Competing interests
- Disclaimer
- Acknowledgements
- Financial support
- Review statement
- References
- Supplement