the Creative Commons Attribution 4.0 License.
the Creative Commons Attribution 4.0 License.
 | 04 Sep 2025
Multi-instrumental monitoring of snowmelt infiltration in Vallon de Nant, Swiss Alps
Judith Eeckman
Brian De Grenus
Floreana Marie Miesen
James Thornton
Philip Brunner
Nadav Peleg
To gain a deeper understanding of the dynamics of the contribution of snowmelt to mountainous water cycles, it is necessary to better understand the processes controlling the infiltration of snowmelt into mountainous soils. This research uniquely combines snowmelt rate data with soil moisture dynamics, providing a comprehensive 3-year dataset. The integration of multiple measurement techniques and the estimation of the snowmelt rate through the measurement of snow resistivity offer a new perspective on snowmelt infiltration processes. The study area is located in Vallon de Nant, Swiss Alps. Measurement points are distributed at mid- to high elevations in various alpine environments. Besides demonstrating the instrumental setup, we also investigated the snowmelt infiltration dynamics in the study area. Results indicate that, although melt rates are considerably lower than soil saturated hydraulic conductivity values, the response times of shallow soil moisture and stream discharge to melt events are fast (from 2 to 5 h). At the point measurement locations, snowmelt hardly infiltrates below 30 cm. These findings highlight how the fast recession of soil moisture peaks to snowmelt may limit the capacity of mountain soils to retain water, potentially increasing their vulnerability to dry periods in the future.
- Article
(5424 KB) - Full-text XML
- BibTeX
- EndNote


Understanding the processes controlling the snowmelt infiltration in alpine soils remains one of the most challenging questions in mountain hydrology. Due to steep slopes and erosion processes, alpine soils are generally relatively thin and commonly present textures from sand to silt (Legros, 1992). Infiltration processes in mountainous soils are controlled by two competing factors: (i) the coarse granulometry of superficial soils, which enhances their infiltration capacity (Legros, 1992), and (ii) the typically steep slopes, which increase the velocity of lateral transfer (Webb et al., 2018b; Carey and Woo, 2001). Kampf et al. (2015) provide an overview of the different snowmelt infiltration processes encountered in various mountainous areas. Evidence of fast lateral transfer in shallow soils during snowmelt periods is mentioned in several studies (Santos et al., 2018; Fang et al., 2019; Heidbüchel et al., 2012). Young waters (i.e., from snowmelt and superficial storage) have been shown to actively contribute to discharge during both winter and spring melt periods (Ceperley et al., 2020). An “inverse storage effect” (i.e., emptying of the most superficial soil layers) has been observed during snow accumulation periods (Benettin et al., 2017; Wilusz et al., 2020).
On the other hand, evidence exists regarding circulations in deeper layers, particularly through unconsolidated moraine deposits and fractured bedrock, observed in mountainous catchments during snowmelt periods (Schaefli et al., 2014; Meeks et al., 2017; Thornton et al., 2018; Carroll et al., 2019; Lorenzi et al., 2024). The question of the partitioning of meltwater fluxes into lateral transfers or deeper vertical infiltration therefore remains open, as do the preferential conditions for each of these processes.
One common method for assessing the contribution of soil water to discharge is natural tracer analysis, particularly stable water isotopes (Klaus and McDonnell, 2013; Beria et al., 2018; Michelon et al., 2023). However, transfers into superficial soils are hard to track via natural tracers because their signature is inconclusive. Other studies on this topic have deployed instrumental networks of soil moisture measurement probes. However, few studies couple these moisture probes with accurate estimations of the snowmelt rate. Current understanding of the physical processes involved remains insufficient to explain the role of the unsaturated zone in the infiltration of snowmelt in mountains. In particular, additional descriptions are needed of (i) the partitioning between surface runoff and vertical infiltration of snowmelt rate into soil layers, (ii) the depths reached by vertical percolation and the depth of preferential circulations for lateral transmission along the slopes, and (iii) the response times to melt events of both the soil moisture and the river discharge.
In addition, estimation methods of snowmelt rates, whether by modeling or by in situ measurements, are associated with high uncertainties. Despite a wide range of model formalisms, from simple temperature index methods to full energy balance methods, being applied to simulate the flux at the interface between snowpack and soil (Martinec, 1975; Rulin et al., 2008; Vionnet et al., 2012; He et al., 2014; Zhang et al., 2015; Thornton et al., 2021), modeling approaches still face large uncertainties in accurately representing snowmelt infiltration into soils. This is mainly due to large heterogeneity in soil and snowpack properties and a lack of measurements for these particular variables in mountainous areas (Meeks et al., 2017). Some studies apply direct monitoring of meltwater using snow lysimeters, ranging from simple buried rain gauges to complex melted water collecting systems (Kattelmann, 2000; Webb et al., 2018a). Other studies estimate the melt rate through the measured or modeled variation in snow depth or snow water equivalent (SWE) of the snowpack (Kampf et al., 2015; Fang et al., 2019; Archer and Stewart, 1995). However, these variables take neither the vertical heterogeneity of the snowpack nor surface effects, such as sublimation or wind depletion, into account. In addition, in situ melt measurement methods are often qualitative or have low temporal resolution, leading to inaccurate estimations of the response time of both soil water and river discharge to melt events.
This work aims to address the two issues of (i) providing a measurement framework for the estimation of snowmelt rate and (ii) accurately detailing the physical processes involved in the unsaturated zone during the infiltration of snowmelt at a study point. This paper proposes a method that enables the precise estimation over 3 years at an hourly resolution of both melting and infiltration processes. Three instrumental methods to estimate snowmelt rates are compared in order to provide a more robust quantification of this variable. The soil analysis methods are also described, including vertical conductivity estimation. Snowmelt infiltration into soil layers is monitored at depths up to 30 cm using a network of capacitive probes. These probes are deployed at the same locations where snowmelt is monitored, allowing the tracking of the vertical penetration of melt flux into soil layers and accounting for spatial variations. We performed different analyses of (i) a multi-instrumental quantification of the snowmelt rate; (ii) a description of the processes controlling the partition between surface runoff and vertical infiltration during melt events; and (iii) a quantification of the vertical percolation of the melt flux and its lateral transfers along the slopes toward the outlet, including an estimation of response times.
The proposed multi-instrumental monitoring setup provides valuable insights into snowmelt infiltration dynamics in mountainous catchments. We present an implementation of our monitoring approach in Vallon de Nant. The monitoring was performed for 3 consecutive years (2021 to 2024), and winter field campaigns were conducted to provide validation measurements of snow properties.
2.1 Site description
The study area is located in Vallon de Nant (46.23° N, 7.07° E), a Swiss pre-Alpine catchment that contains typical alpine ecosystems, from deciduous forest to post-glacial recolonization (Fig. 1). The catchment area is 13.4 km2. and the altitude ranges from 1200 to 3051 m above sea level (a.s.l.). The catchment is selected because of its importance for ecological monitoring and the quantity and duration of measurements available from decades of monitoring. Perret and Martin (2015) presented a detailed map of surface geomorphological units. Three main geomorphological units are described (Fig. 1b): (i) limestone cliffs from the Nappe de Morcles on the eastern ridge of the valley, (ii) active and passive moraine deposits from the Martinet glacial on the upper part of the valley, and (iii) flysch cliffs and associated screes and rockfalls on the western ridge of the valley. The majority of the superficial soils in Vallon de Nant are developed on top of ancient moraine deposits, screens, and landslides, resulting in relatively shallow sandy to silty soils (Grand et al., 2016). While these formations are common in alpine areas, in this valley, the accumulation of erosion material from the schist cliffs into small depressions has led to the development of unusually thick soils in places. Several studies have investigated the catchment's surface and subsurface hydrology (Antoniazza, 2023; Michelon et al., 2023; Thornton et al., 2022). Besides assessing the recent shift in snowmelt peak and its impact on the discharge, these studies showed that a limited understanding of snowmelt flowpaths hinders hydrological model development for this catchment, which further motivated our research in this area.
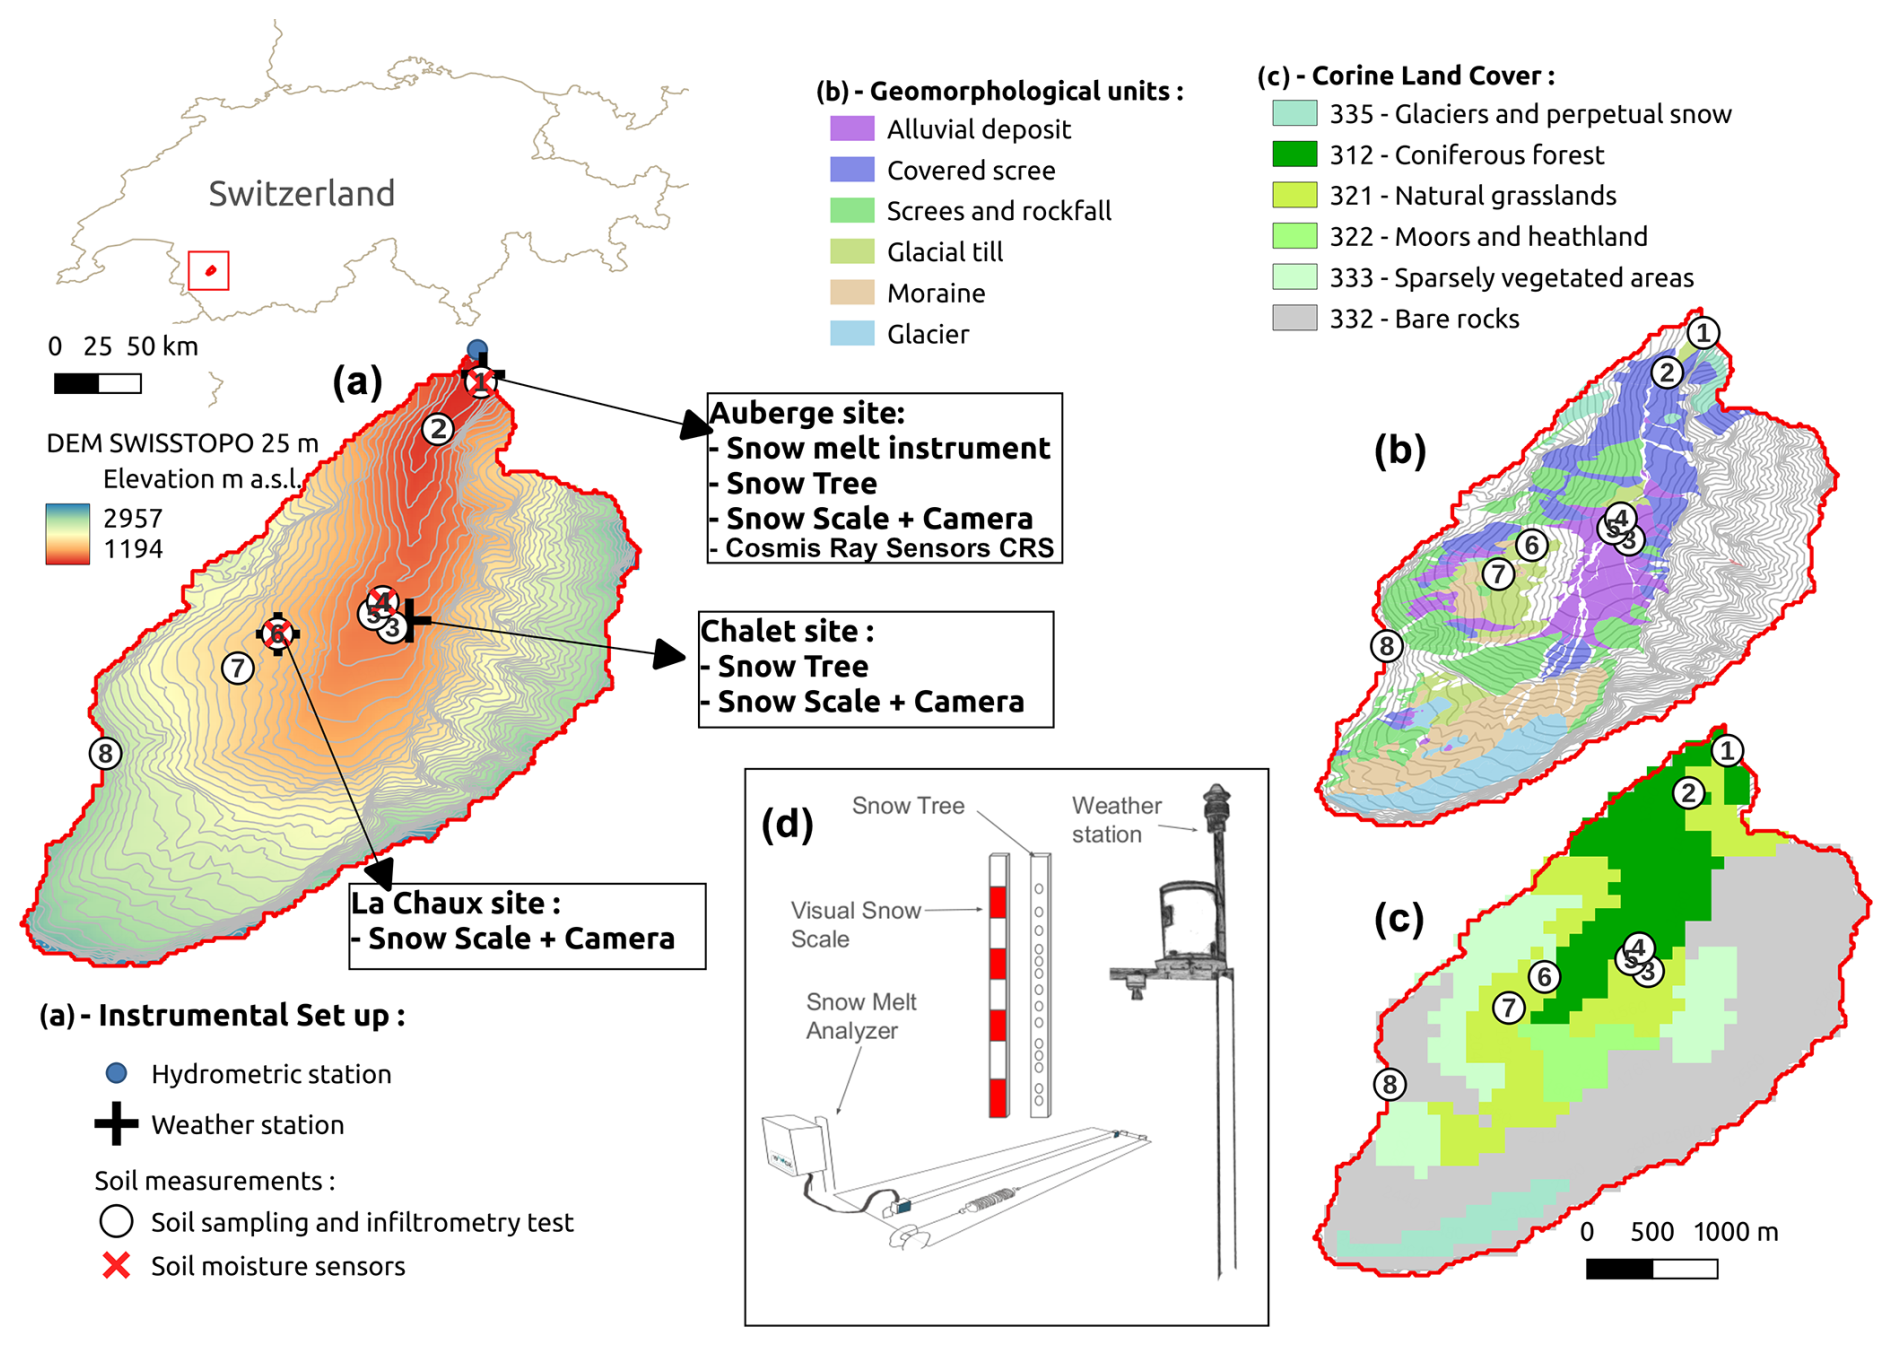
Figure 1Vallon de Nant, Bex, Switzerland, and the locations of the instrument setup deployed in this study (a), together with geomorphological units described by (b) Perret and Martin (2015) and (c) Corine Land Cover 2006 (Aune-Lundberg and Strand, 2010). Panel (d) is an illustration of the devices installed at the Auberge station for snowmelt monitoring: the Snow Melt Analyzer (SMA), the SnowTree, and a weather station. The point numbers correspond to sample points in Table 1.
2.2 Meteorological and hydrological data
A hydrometric station is located at the outlet of the catchment (Fig. 1a), recording hourly water levels since 2010. A rating curve was computed based on 55 reference gauging performances at various water levels (Antoniazza, 2023). Moreover, weather data from three weather stations at different locations (at the elevations 1253, 1485, and 1780 m a.s.l., respectively) in the catchment are available from 2010 onwards (Fig. 1a). These stations record total precipitation, near-surface air temperature, atmospheric pressure, shortwave solar radiation, and wind direction and velocity at 5 min intervals, which were subsequently averaged to hourly time steps. However, considering the exposure of these stations to harsh climatic conditions and their difficult access, the reliability of the recorded data is low and the time series presents many gaps. Moreover, as the climate stations are not heated, solid precipitation records are considerably underestimated (Benoit et al., 2018; Thornton et al., 2021). Consequently, the estimation of precipitation in the catchment remains highly uncertain. Precipitation uncertainties were not quantified, as they are not the main focus of this work, and this limitation is presented in the Discussion.
Daily remote sensed information on snow cover area (SCA) is available at the 500 m resolution from the MODISA1 Level3 remote product (Hall et al., 2009). We used this product to describe the overall dynamics of the snow cover at the catchment scale. However, its spatial and temporal resolutions are not sufficient to compare this product at the pixel scale to the in situ snow measurements.
Three different types of monitoring devices were deployed to obtain local values of snow depth, extent of snow cover, snow water equivalent (SWE), and snowmelt rate.
3.1 Snow Melt Analyzer
The Snow Melt Analyzer (SMA) is a unique system for automatic and continuous measurements of diverse snowpack parameters developed by SOMMER Messtechnik. This monitoring device has been used in various studies in alpine environments (Sommertechnik, 2009), and it can be used independently or in combination with a more complete instrumental setup for snowpack analysis. Here, the configuration of the instrument that allows the measurement of the liquid and solid water content and density of the bottom snow layer is chosen. The assumption made in this approach is that the liquid water content of the bottom snow layer (Λ, lowermost 7 cm) can be used as a proxy for the snowmelt rate. Snowmelt rates are derived from the direct measurement of the liquid water content of the snowpack through snow electric resistivity. The instrumental method has previously been shown to yield reliable assessments of snowmelt rates in various alpine studies (French and Binley, 2004; Gance et al., 2016; Bloem et al., 2020).
The SMA consists of a metal frame setup in a suitable position on level ground (Fig. 1d). A weather- and UV-resistant sensor band penetrates the snow and measures the volumes of ice, water, and air content in the snowpack using the variation of impedance between two connected electrodes. Three aspects were considered in choosing the device location: (i) installing the SMA on flat ground with snow conditions representative of the area and orienting the frame to avoid wind effects; (ii) selecting soils with significant storage and infiltration capacity, specifically, deep alpine meadow soils; and (iii) ensuring ease of access and power supply. Consequently, the SMA was deployed near the Auberge climate station at 1253 m a.s.l. (Fig. 1a). This mid-altitude location, with its developed soil, allows the analysis of snowmelt rate and represents a favorable case for snowmelt infiltration compared to typical alpine sites with finer soils and steeper slopes.
3.2 SnowTree and visual scale
To estimate the snow cover extent in the surroundings of the measurement points, three visual scales coupled with time-lapse cameras were installed in the vicinity of the three climate stations (Fig. 1a). The images obtained from the cameras were evaluated in two respects: (i) the graduation reached on the visual scale, which gave the local snow depth with a 10 cm accuracy, and (ii) the qualitative extent of snow cover over the visible landscape, divided into three categories: no snow, partially covered surface, and covered surface. Despite the limited nature of such data, they provide valuable information about snow conditions during the measurement periods.
In addition, to locally assess the snow depth, two “SnowTree” instruments were developed and deployed at the Auberge and Chalet measurement points (Fig. 1a). The SnowTree is a 2.5 m high wooden mast, equipped with small iButton thermometers, which provide good performance for many environmental science applications (Hubbart et al., 2005), glued at 5 or 10 cm intervals. Temperatures were recorded every 2 h. This instrument aims to track the snow depth by discriminating between thermometers covered by snow or not covered, with a ±5 cm accuracy. This instrument complements the observations made with the visual scale, with a vertical accuracy of ±20 cm. In addition, this instrument is simpler to install than an optical snow depth sensor because it does not require any structure or power supply, which is crucial for operations in remote mountain environments. Reusser and Zehe (2011) propose using the standard deviation of the hourly temperatures computed over 24 h (σ) for this differentiation, as the diurnal amplitude of temperatures is lowered when a sensor is covered by snow. It appears during the study that the SnowTree better monitored the snow depth when it was well exposed to direct solar radiation, i.e., after mid-January (time-lapse images showed undetected frosted residual snow remaining along the wood mast). Indeed, in a narrow and shadowed valley such as Vallon de Nant, the diurnal heating due to solar radiation when the sun position is low in winter is not dramatically varying and the determination of snow depth based on logger temperature is challenging. This issue is tackled by applying different thresholds whether the daily temperature exceeds 1 °C:
where Tday (°C) is the average daily temperature and σ (°C) is the standard deviation of the hourly temperatures computed for each day.
Values of σ from 0.5 to 5 °C with a step of 0.1 °C have been tested for each of these two thresholds. The optimal value retained for each threshold minimizes the average RMSE criteria, using the daily snow height observed at the visual scale as reference time series. This optimization step is performed separately for days with Tday<1 °C and Tday>1 °C. No multi-parameter optimization is performed.
This differentiated empirical threshold, combined with manual checking of the images from the camera, makes SnowTree a potentially valuable instrument for assessing snow depth in remote areas. The two SnowTrees and the visual scales were installed between November 2022 and March 2023 (2022–2023 winter) but were not maintained for the 2023–2024 winter due to lack of personnel. Instead, a classical optical infra-red snow depth sensor was installed at the Auberge meteorological station in November 2023, which recorded hourly data.
3.3 Cosmic Ray Sensor
Hydroinnova's Cosmic Ray Sensor (CRS) monitoring device was installed at the Auberge station to measure snow water equivalent (SWE) over a uniquely large footprint (Fig. 1). The advantages of the device, beyond the large footprint, are that it is automatic, easy to install, and requires little maintenance. The basis of the technique is that hydrogen contained in the snowpack attenuates downward neutrons coming from cosmic rays. The amount of attenuation is directly related to the mass of intervening snow and, by extension, the amount of SWE. The method described by Desilets (2017) to convert the count of incoming neutrons into an SWE value was used:
and
where Nraw (count h−1) is the measured count of incoming neutrons, P (hPa) is the atmospheric pressure, P0 (hPa) is the reference barometric pressure, and N0 (count h−1) is the proton flux in the absence of snow. Λ (–) and β (–) are fixed parameters, following the technical recommendations (Desilets, 2017). To complement these SWE time series, local density measurements were carried out during the winter of 2022–2023 near the Auberge station, using the method of weighing cylindrical samples: snow profiles were dug, and snow samples were collected horizontally with a metal cylinder of volume 550 cm3 (diameter 12 cm). The collected snow is weighed to calculate the density of the snow sample. At each location, a sample is collected approximately 7 cm from the ground (which corresponds to the SMA measurement height), and, if the depth of the snowpack allows, another sample is taken in the middle of the vertical.
3.4 Soil sampling and analysis
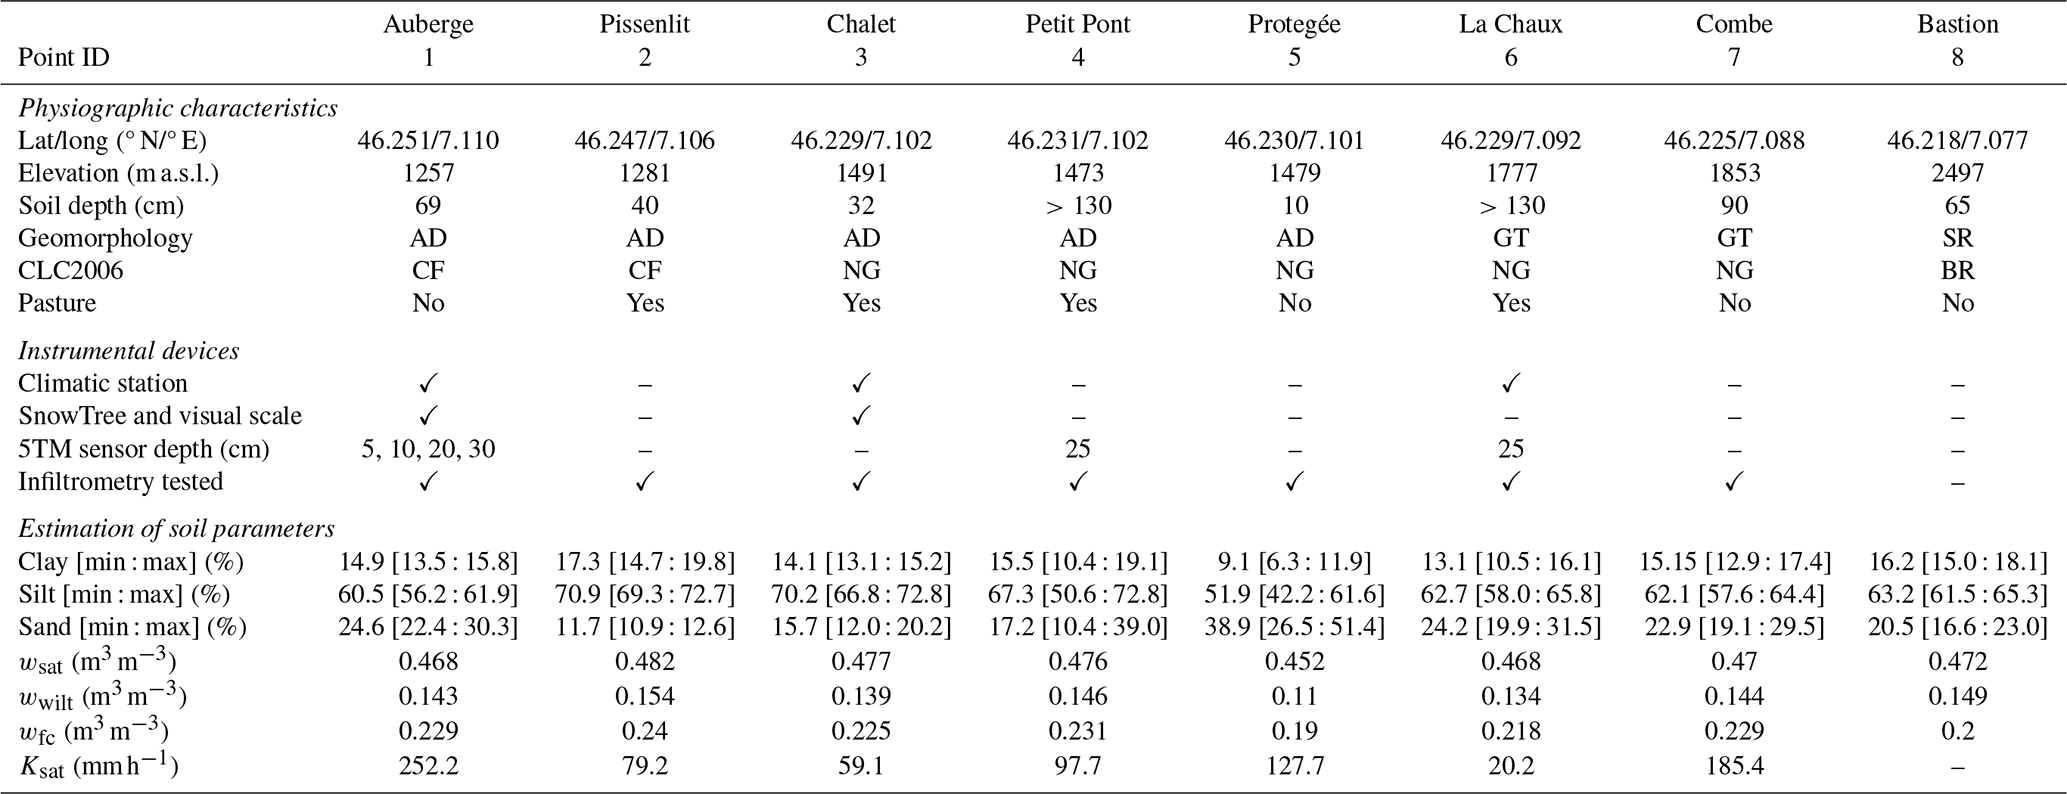
To describe the variety of soils in the study area, eight varied sampling sites were chosen. The physiographic characteristics of these eight sites and the instrumental setup are presented in Table 1, and the point IDs are referenced in Fig. 1. At each site, soil cores were taken and the granulometry of the sampled soil was analyzed. Infiltrometer tests were conducted for seven of the eight sampling sites (expect the Bastion point for technical reasons at this distant point). Soil moisture probes were installed at the three sampling sites that are located close to the climatic stations: the Auberge, Petit Pont, and La Chaux points (see Table 1). The locations were chosen to represent the different geomorphological characteristics and environments in the catchment, from deep soil covered by mixed forest to shallow soils developed above the moraine deposit. Both grazed and non-grazed sites were sampled. In particular, three points at different elevations (Auberge, Petit Pont, and La Chaux) were specially analyzed because they present particularly deep soils, resulting from the accumulation of material eroded from the schist cliffs on the western side of the valley. Evidence of superficial water saturation in springs observed at these sites for the 3 years studied motivates the detailed analysis of the dynamics of their contribution to the hydrological system. 5TM/DECAGON capacitive sensors were used to measure soil moisture and soil temperature at hourly intervals at different depths at these three points (Fig. 1). These sensors were installed in August 2021.
Table 1Physiographic characteristics of the nine soil sampling points (location, soil depth, geomorphology (Perret and Martin, 2015), and CLC2006 Land Cover (Aune-Lundberg and Strand, 2010) classifications), together with the estimation of soil parameters: granulometry, water content of the total soil column at saturation wsat and at the wilting point wwilt, field capacity wfc, and hydraulic conductivity at saturation Ksat. AD – alluvial deposit; GT – glacial till; SR – screes and rockfall; CF – coniferous forest; NG – natural grasslands; BR – bare rock.
3.5 Granulometry analysis and pedotransfer functions
Vertical descriptions of the soils and sampling were performed at one or two auger holes for each sampling point. Granulometry analysis was then performed for each of the samples collected for the main observed horizons at the eight sampling points. Particle size distributions were determined via laser granulometry analysis (Blott et al., 2004). The empirical pedotransfer functions proposed by Clapp and Hornberger (1978) were used to compute values of soil water content at saturation (wsat (m3 m−3)), wilting point (wwilt (m3 m−3)), and field capacity (wfc (m3 m−3)) from the clay C (–) and sand S (–) fraction of each sample:
and
The soil parameters were computed for each depth and then averaged on the soil vertically to get one value for each of the nine sampling points. To consider commensurate variables, the relative water content Wr (–) was used for each soil layer:
where W (m3 m−3) is the measured soil water content. A Wr value equal to 1 means that the saturation of the soil layer is reached, while 0 means that its wilting point is reached.
The clay, sand, and silt fractions resulting from the laser granulometry analysis, together with the water content at different phases computed through Clapp and Hornberger's equation, are summarized in Table 1. Using the USDA soil texture classification, all the samples are in the silty loam category, which is consistent with silty moraine deposits. In addition, the results are consistent with previous studies in Vallon de Nant (Grand et al., 2016; Cianfrani et al., 2019). The hydraulic conductivity at saturation (Ksat) and the average soil water content are also presented in Table 1. The values of Ksat obtained are consistent with general values considered by Cosby et al. (1984) for soil classes. Cattle trampling and grazing affect Ksat; non-grazed locations (Combe, Protegee, Auberge) present Ksat values that are considerably higher than those at grazed locations (Chalet, La Chaux, Pissenlit). In addition, a dense grass root system is observed in Combe, which might act to reduce the infiltration rate at this location.
3.6 Infiltrometry test
The Beerkan infiltration method was used to determine the saturated hydraulic conductivity at the sampling points. This method is detailed by Haverkamp et al. (1994) and Braud et al. (2005). A PVC cylinder of diameter 25 cm was used with 1 L of water poured at each iteration. For estimating retention curves and hydraulic conductivities, the Beerkan Estimation of Soil Transfer parameters (BEST) method (Lassabatère et al., 2006) was applied. BEST approaches the series of cumulative infiltration rates and instantaneous infiltration rates by the expressions provided by Haverkamp et al. (1994) and involves the sorptivity and the hydraulic conductivity at saturation Ksat of the soil (Van Genuchten, 1980; Burdine, 1953; Brooks and Corey, 1966). These expressions involve three parameters of form which are determined from particle size distributions (Fuentes et al., 2017) and based on capillarity models (Haverkamp et al., 1994).
4.1 Multi-instrumental assessment of snowmelt
At the Auberge station, the dynamics of the snow depths deduced from the SnowTree measurements are consistent with the observation at the visual scale (Fig. 2). In particular, the snow depth peak on 21 January 2023 is represented with the same timing in the SnowTree and visual-scale results. In addition, the only point snow density measurement taken within the CRS recording period (recorded on 5 December 2022) gave a snow density of ρobs=293 kg m−3 and a 24 cm snow depth. For this time point, the CRS provided an SWE of 7.9 cm, which is equivalent to 26.9 cm using the ρobs density. This shows that the estimation of SWE by the CRS led to an estimation of snow depth consistent with the snow depth estimated at the Auberge SnowTree (26.9 cm against observation of 24 cm). These measurements reinforce the robustness of the SnowTree results.
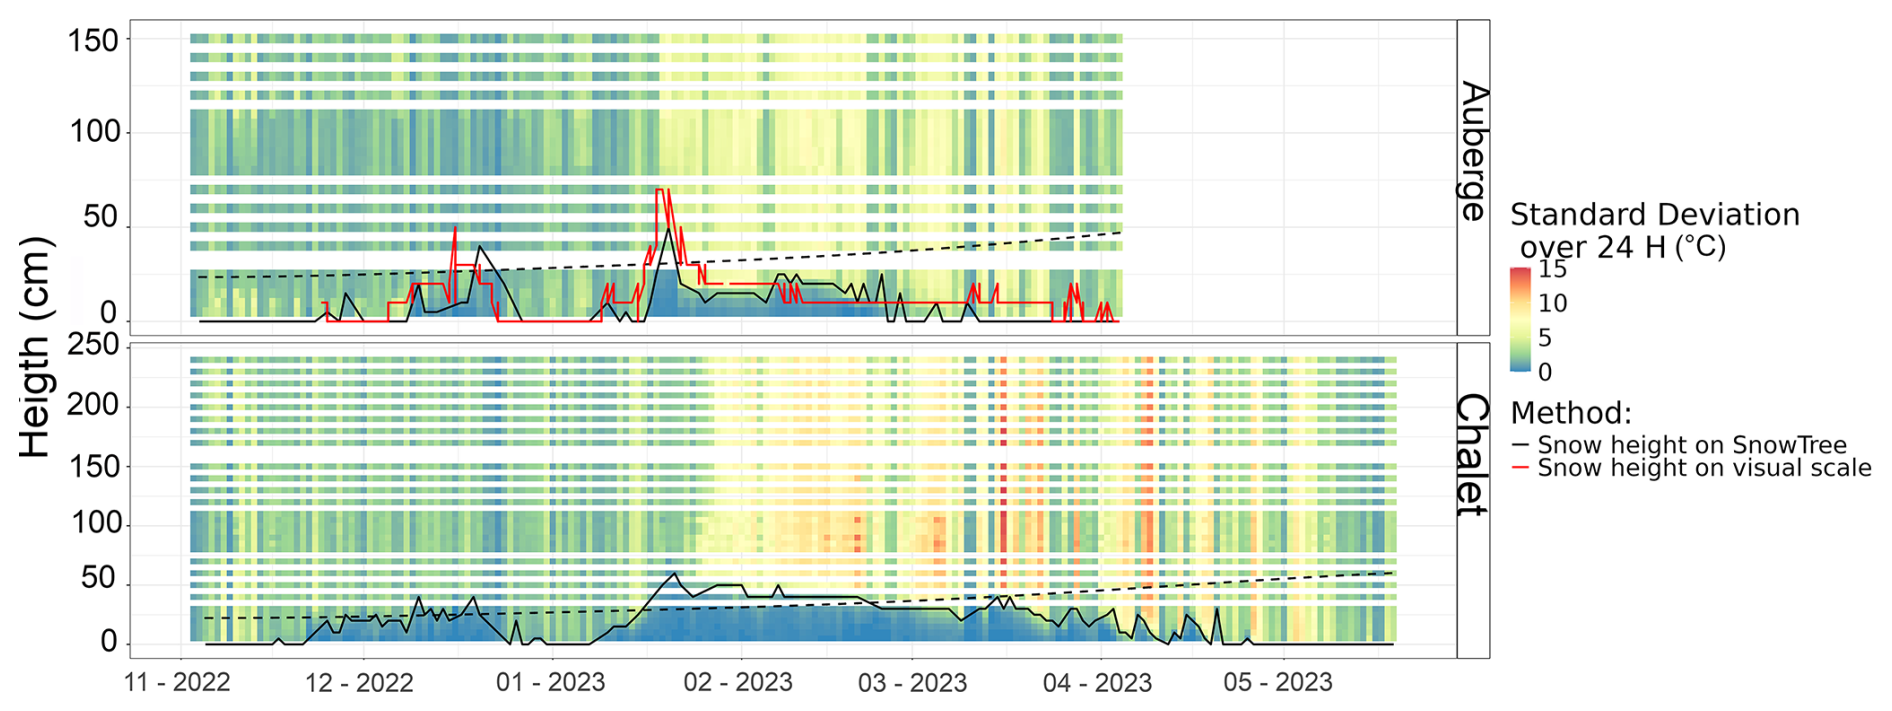
Figure 2Temperature standard deviation computed over 24 h recorded by the iButton loggers on the SnowTree instrument at the Auberge and Chalet locations (background colors). Solid black and red lines represent the snow depths obtained from the SnowTrees and the visual scales, respectively. The dashed line corresponds to the intensity of solar illumination received at the measurement points. The solar illumination in the valley, including hill-shading effects, is computed with the hillshading function (insol R package; Corripio and Corripio, 2019).
The two SnowTree instruments at the Auberge and Chalet site allowed us to estimate the seasonal dynamics of snow depths. Over the monitored winter (2022–2023), the average snow depth at Auberge is 16 cm, and the average snow depth at Chalet is 27 cm. The dynamics at the two sites are consistent, with the beginning of snow accumulation in mid-November (25 November at Auberge and 17 November at Chalet) and the disappearance of snow cover between late December and mid-January. The snow peak on 21 January is observed at the two sites.
Figure 3, despite the time series being short (the CRS instrument stopped due to an unstable electric feeding in early February 2023), the SWE measured by the CRS and the liquid water content of the bottom layer measured by the SMA (Λ) can be compared at the hourly time step. The recorded period consists of two periods: (i) between 21 December and 15 January, a period with high temperature (above 1 °C) and liquid precipitation happening, and (ii) between 15 January and 20 January, a period without precipitation and with temperature below 1 °C. During the first period, Λ appears to actively react to liquid precipitation, which is consistent with a rapid transfer of liquid water through the snowpack. On the other hand, during the second period, the SWE reacts to the changes in temperature, whereas Λ remains stable. This corresponds to a compaction of the snowpack not associated with melt.
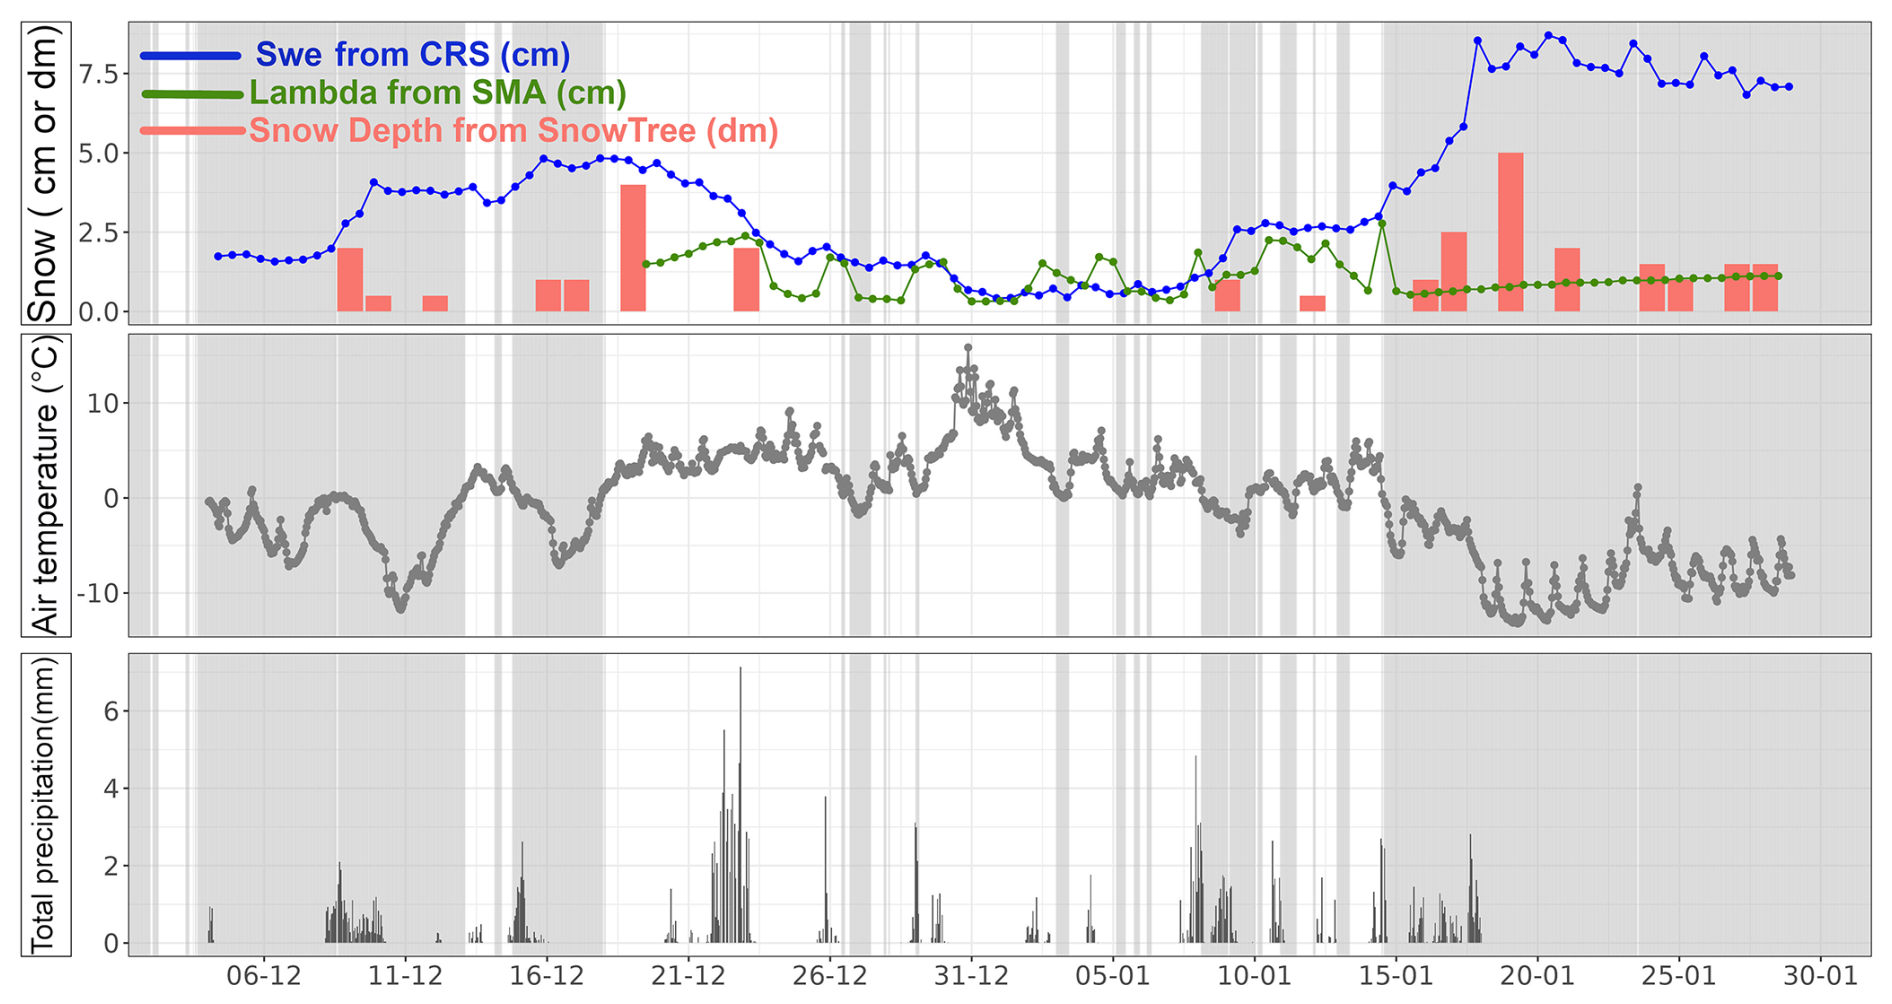
Figure 3Snow water equivalent computed from Cosmic Ray Sensor measurements SWE (mm), together with the liquid water content of the bottom snow layer measured by the Snow Melt Analyzer Λ (%). The gray bands indicate the time step with temperatures below 1 °C.
This shows that the variation in SWE does not necessarily correctly represent the melt rate, as it is often assumed in other studies (Kampf et al., 2015; Fang et al., 2019; Archer and Stewart, 1995). By focusing on the lowermost snow layer, our approach isolates actual melt from other transformations of the snowpack, such as icing, compaction, or wind depletion, allowing more accurate estimations of local melt rates – a key target variable. However, Λ values must be considered with caution when liquid rainfall happens (see Sect. 5).
4.2 Infiltration/runoff partition
The partition between surface runoff and infiltration can occur either by exceeding the water content at saturation (wsat) of the first soil layer (Dunne runoff) or by exceeding the soil conductivity at saturation (Ksat) (Hortonian runoff). At the Auberge site, or the entire monitored period (22 287 h), snowmelt was detected for 2086 h, i.e., 9.3 % of the time. Among these time steps with melt occurring, the first soil layer reached saturation for 326 h (15 % of the hours with snowmelt). This shows that snowmelt resulted in Dunne surface runoff for 15 % of the melt event at the Auberge site during the monitored period. Regarding Hortonian runoff, based on the obtained Ksat value for the Pissenlit site (see Table 1), DeltaLambda exceeded Ksat for 91 h during the recorded period (4.3 % of the hours with snowmelt). Both conditions with DeltaLambda greater than Ksat on saturated soil happened for only 13 time steps during the monitored period. Depending on the site, Hortonian runoff can occur for between 4.3 % (at Auberge site) and 100 % (La Chaux site) of the melt events.
Figure 4 shows that snowmelt produces surface runoff mainly during early winter and spring, with low DeltaLambda during February and March. However, the runoff processes vary strongly between winter and spring. During spring (Fig. 5a), the peaks in snowmelt that exceed Ksat are mainly associated with changes in the energy budget, led by diurnal variations in radiation and temperature. The runoff generation results from DeltaLambda greater than Ksat around the maximal peak in diurnal temperature. The response of the soil layers and the river discharge is between 3 and 5 h (graphical assessment). The dynamics for early winter melt are less clear (Fig. 5b): both Dunne and Hortonian runoff occurred, but neither the soil layer response nor the response of river discharge to the melt event is clear. The delay induced by soil storage during early winter melt strongly varies between the events.
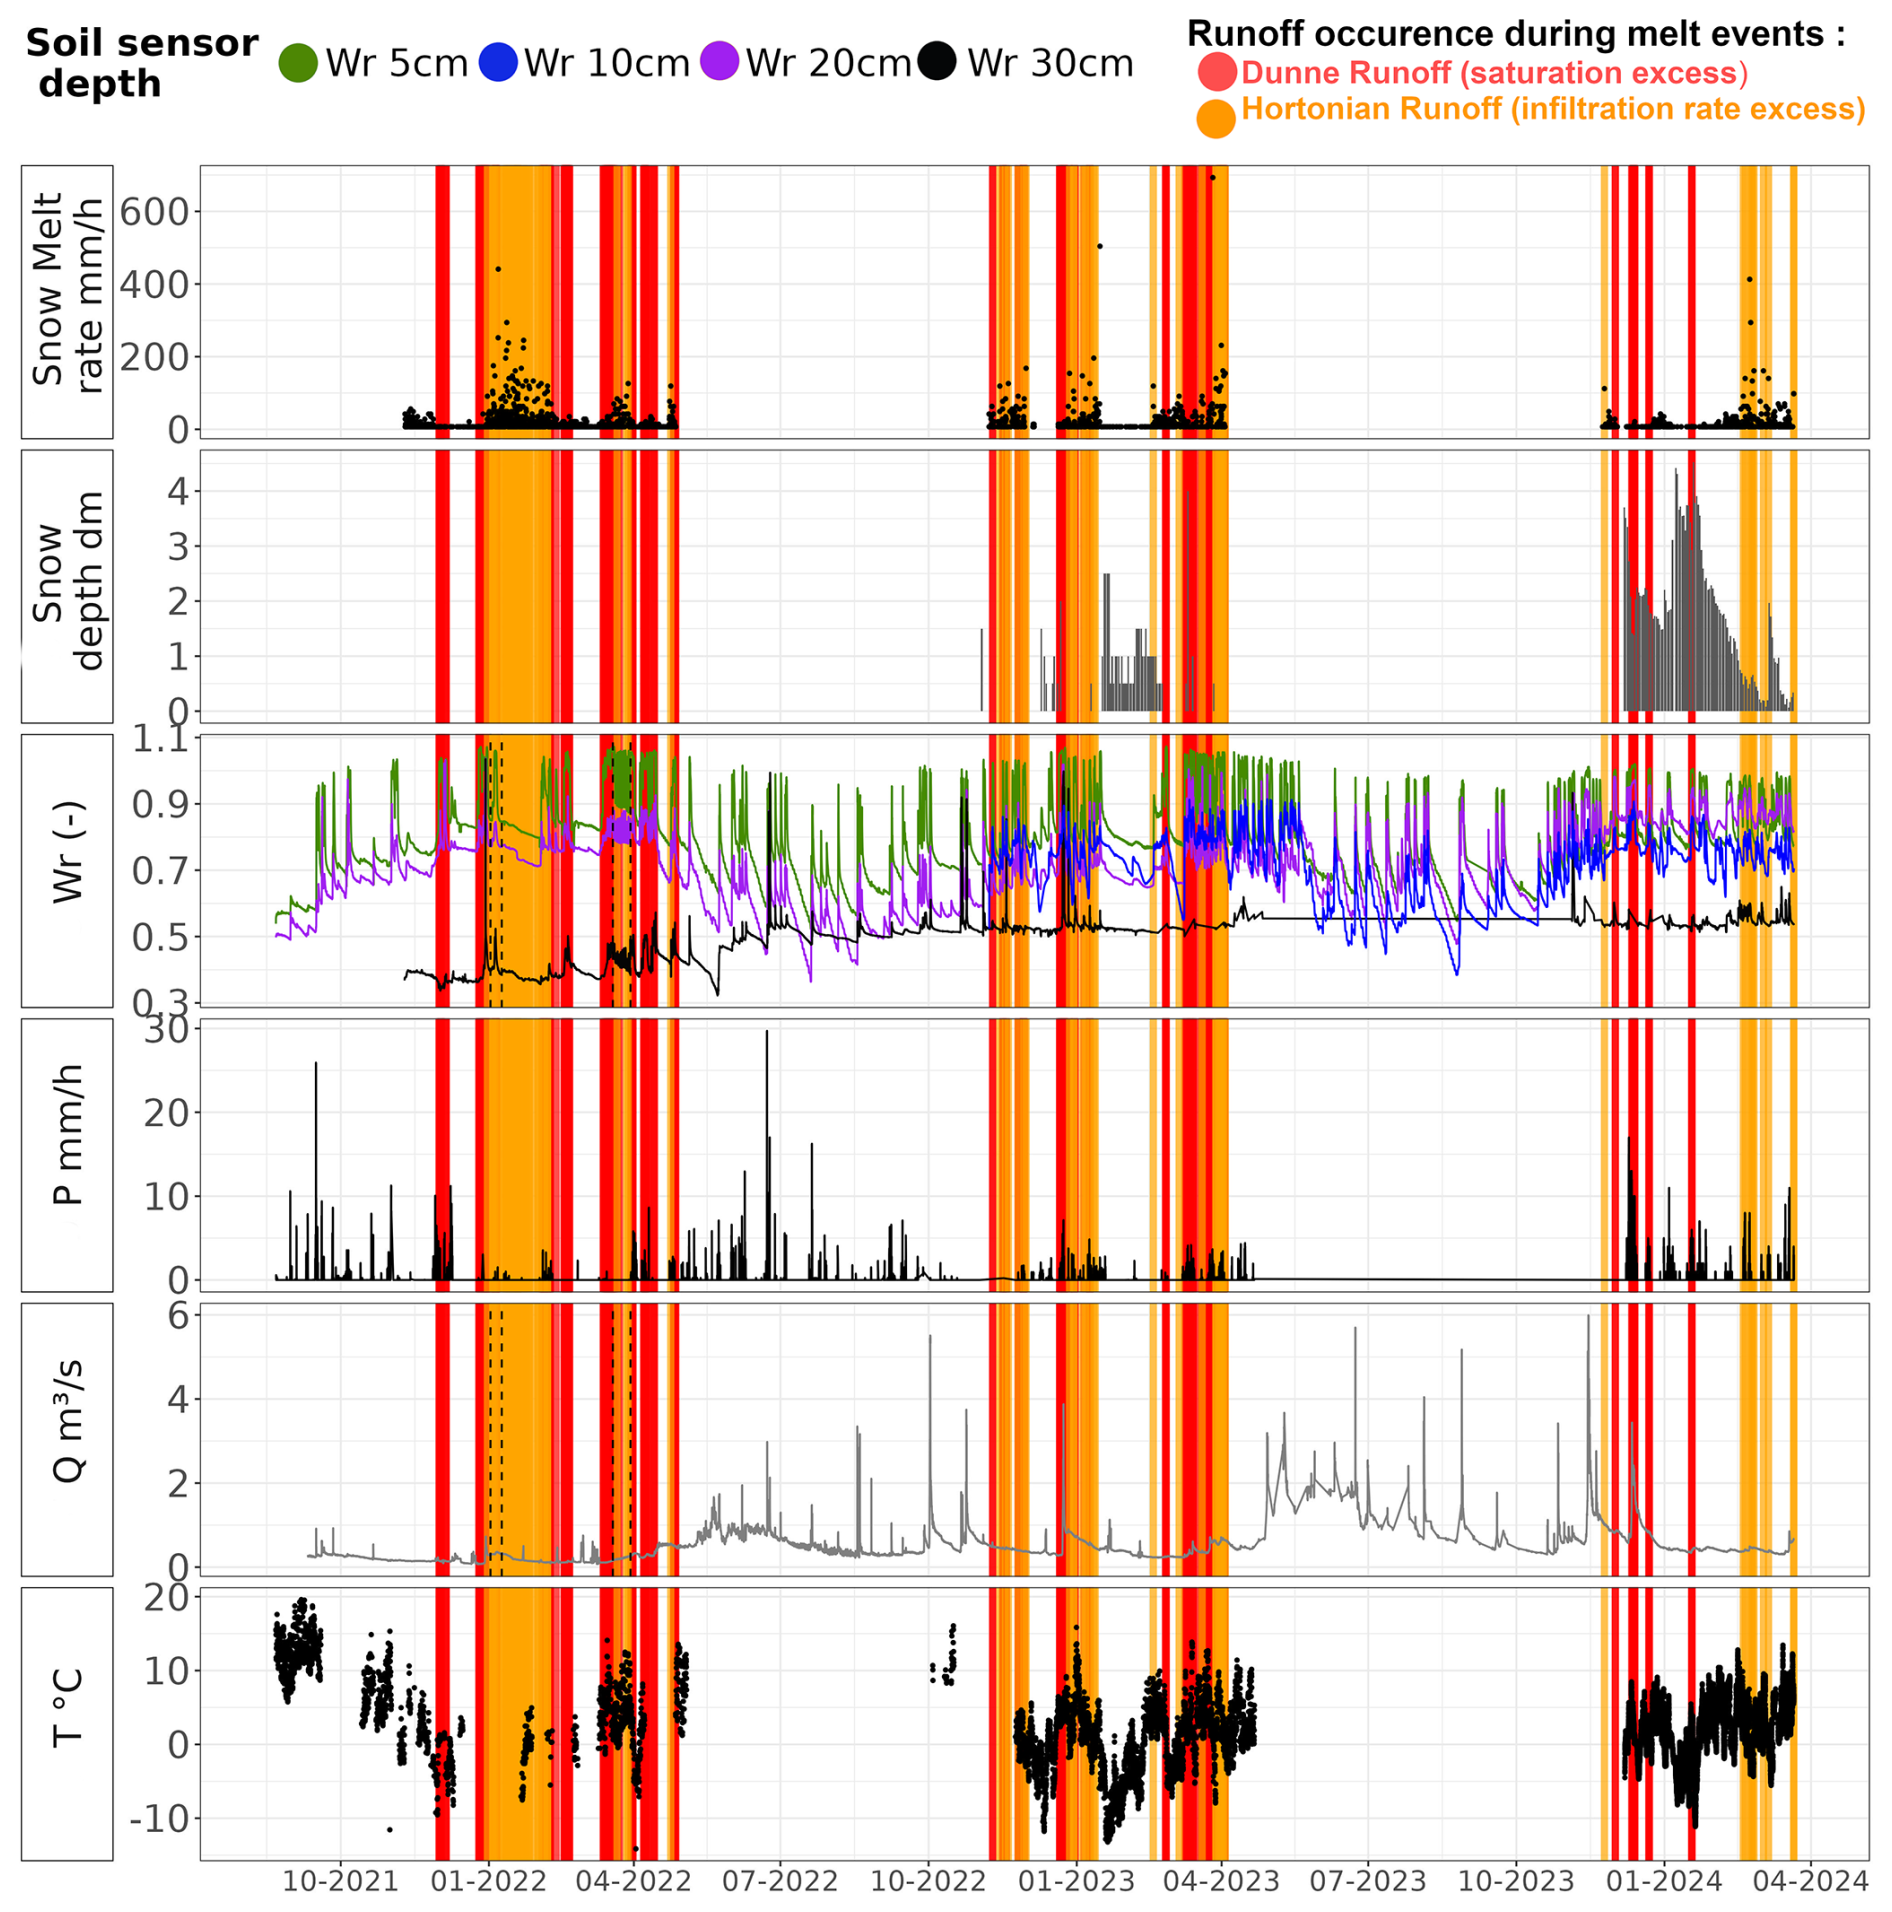
Figure 4Soil moisture (Wr), precipitation (P), temperature, discharge at the outlet (Q), water content of the bottom snow layer, and snow depth measured at the Auberge point, together with Ksat values and zooming in on periods of interest, for the entire recording period: from September 2021 to March 2024. The vertical gray lines represent the time steps when the hourly melt rate overtakes the Ksat value measured at the Auberge soil sampling point.
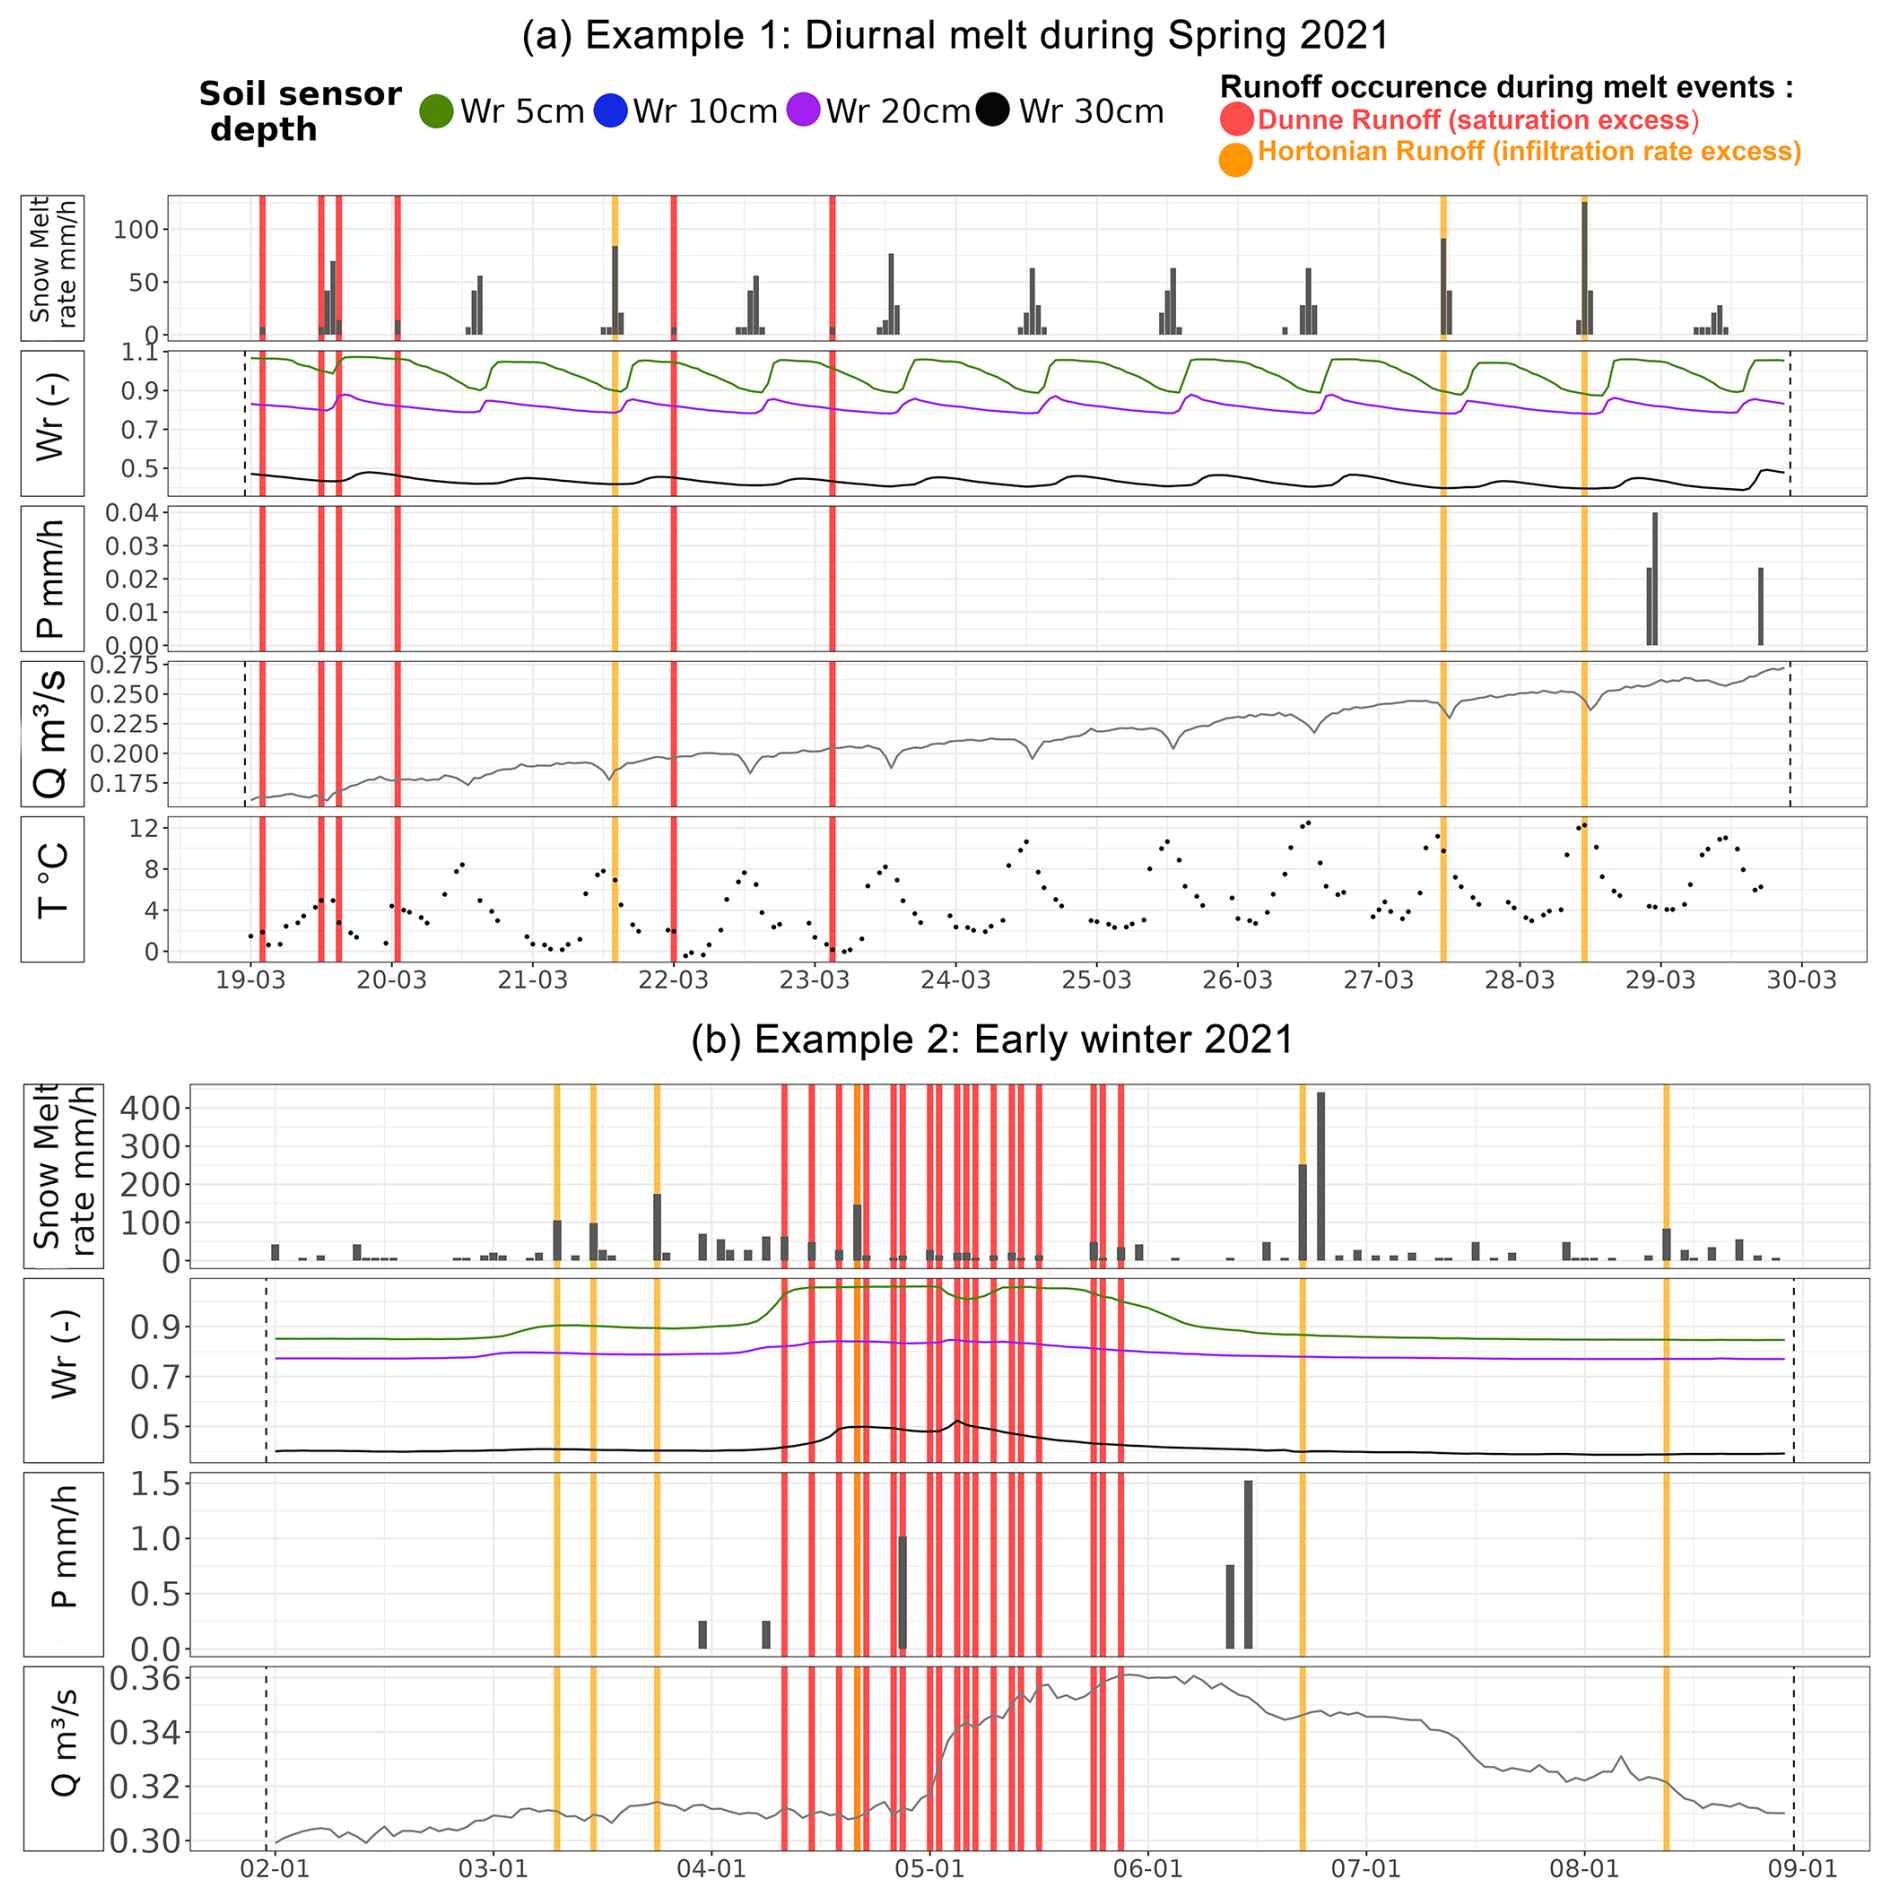
Figure 5Zooming in on specific periods for the variables soil moisture (Wr), precipitation (P), temperature, discharge at the outlet (Q), water content of the bottom snow layer, and snow depth measured at the Auberge point.
4.3 Lateral transfer of melt flux
Figures 4 and 5 show that, during both the spring and winter melt, the response of the soil layer at 30 cm depth is limited. This means that the infiltration of snowmelt hardly exceeds 30 cm at this measurement point. The main increase in the soil water content of this soil layer mainly coincides with liquid precipitation in late spring. This observation suggests that, despite the fact that melt flux can infiltrate in the superficial soil layers when neither Ksat nor wsat is exceeded, deeper infiltration does not occur at the Auberge site. These results suggest that lateral transfer in superficial soil layers (above 30 cm depth) dominates the vertical infiltration in a mountainous context, even in a context favorable to infiltration, such as the Auberge site. The first soil layers can then represent a zone where lateral transfers towards the outlet are significant. These results corroborate those of Ceperley et al. (2020), who found that young water is the main contributor to discharge during winter. Kampf et al. (2015) also noticed empirical evidence of lateral transfers during spring melt, based on audible sounds.
We explore the spatial variability in snowmelt infiltration dynamics, focusing on the hydrological response at 25 cm depth at the Chalet, La Chaux, and Auberge sites (Fig. 6). The annual dynamics of the soil moisture are similar at the three measurement points: overall soil moisture increases with increased snowpack. This is clearly visible in December 2022. A graphical assessment of the response times of the soil moisture shows that the peaks due to liquid to mixed precipitation in winter and liquid precipitation in summer are shifted by only 2 h between the three sites. The peaks in soil moisture due to diurnal melt in spring are shifted from about 5 h between the Chalet and Auberge stations. This is due to the lag between diurnal snowmelt at different altitudes, whereas precipitation happens more simultaneously in the catchment. One can also note that the soil moisture peaks are less pronounced at La Chaux, compared to the other two. This is due to the fact that the Ksat value measured at La Chaux is lower than at Chalet or Auberge, leading to more occurrences of surface runoff that infiltrate the La Chaux site.
These time series show that, across the whole catchment, the reaction of soils to both snowmelt and liquid precipitation is fast (less than 6 h) and happens almost simultaneously (with a shift of less than 5 h). This demonstrates that the transfers along the catchment toward the outlet are fast for both liquid precipitation and snowmelt.
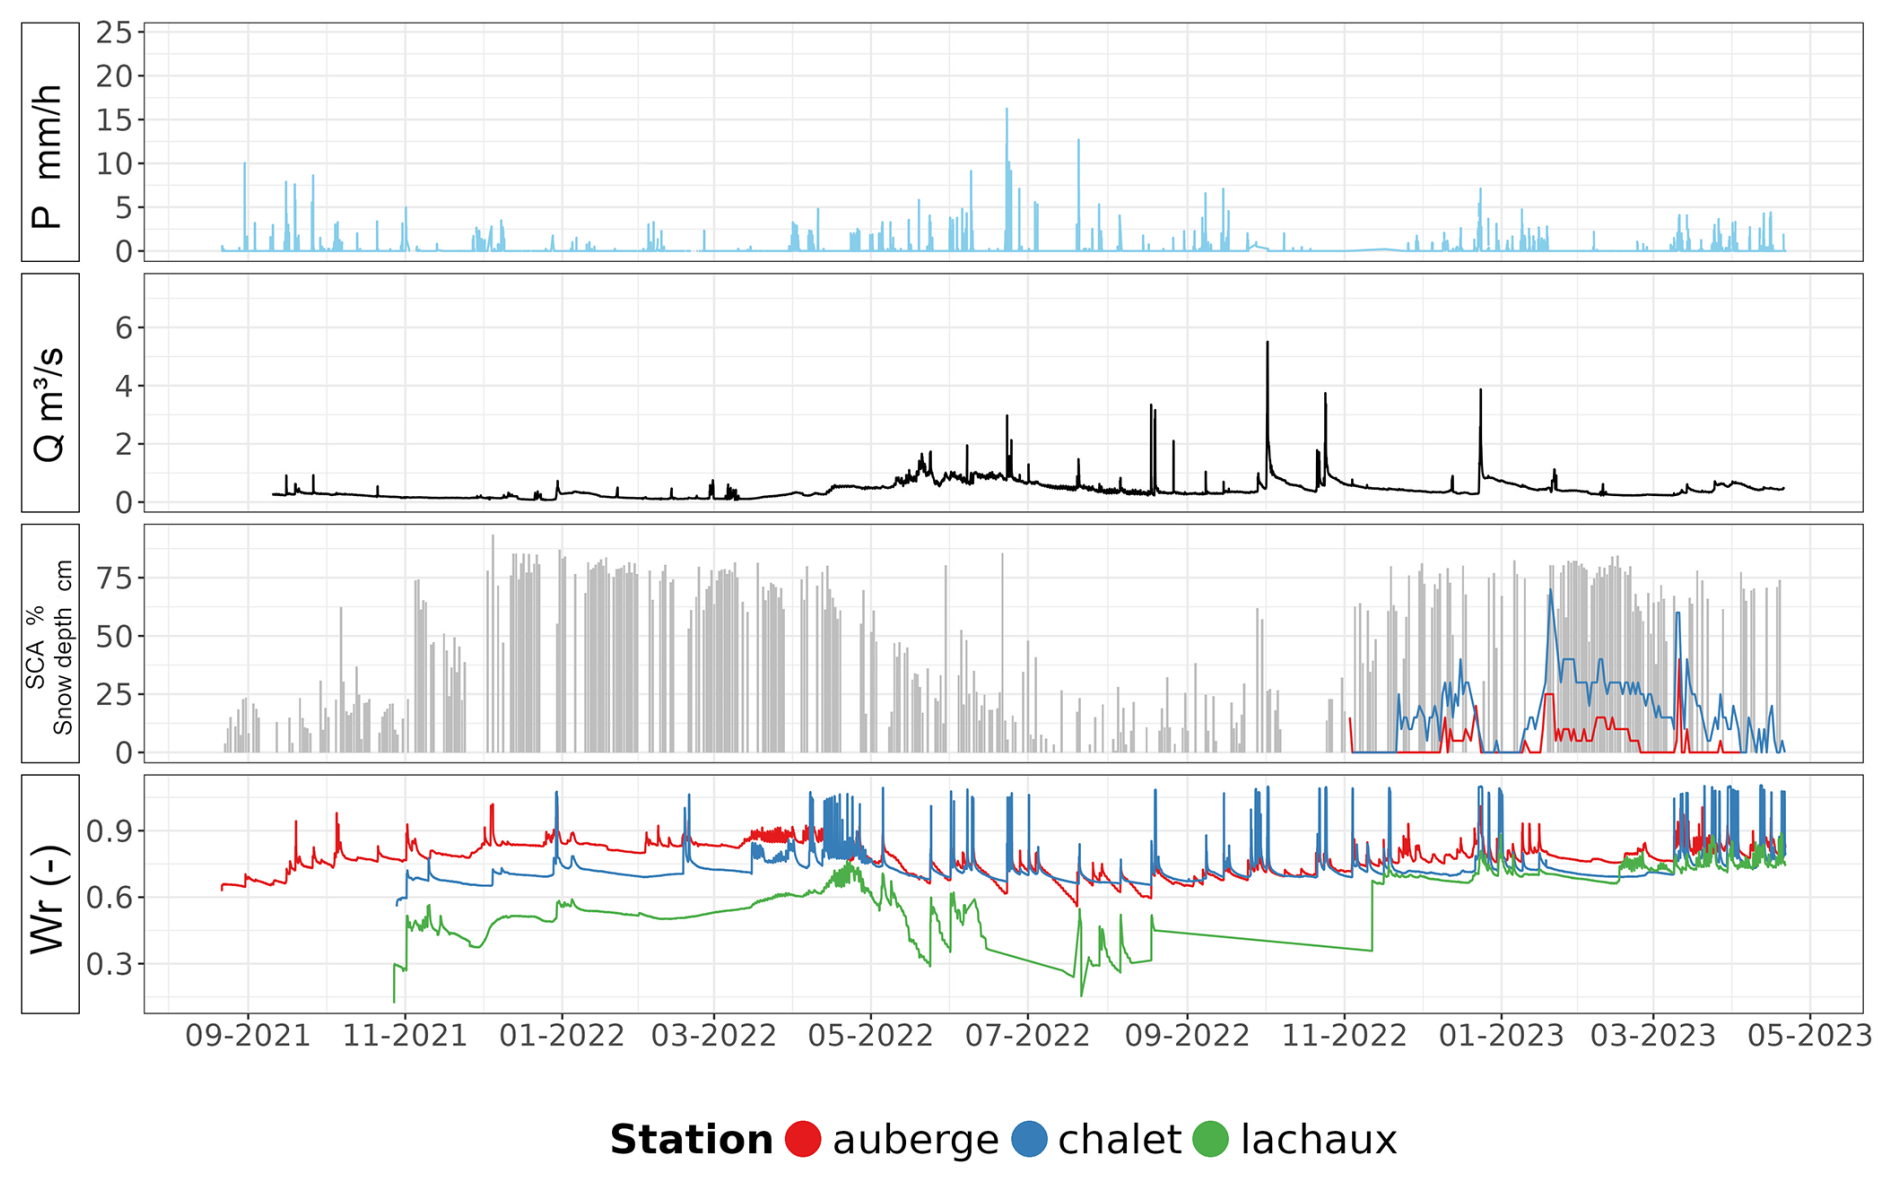
Figure 6Soil moisture measured at 25 cm depth at the three measurement points, together with precipitation recorded at Auberge station, the MOD10A1 daily values of snow cover area, the average over the entire catchment, and the snow depths estimated at the SnowTree instruments at the Auberge and Chalet spots.
5.1 Uncertainties in snowmelt estimation
Although this instrumental approach makes it possible to enhance the robustness of snowmelt measurement, significant uncertainties remain. In particular, rain-on-snow phenomena strongly disturb the measurements. In Fig. 3, between 21 December and 15 January (period with liquid precipitation happening on snowpack), Λ values recorded by the SMA react to precipitation within the next hour. This raises the issue of the representativeness of the SMA measurement in such conditions and the delay induced by vertical percolation of the liquid water through the snowpack. The transfer time of liquid water during rain-on-snow phenomena can be regarded as the fastest transfer through the snowpack, i.e., the minimal delay induced. This means that the Λ time series might include a ±1 h uncertainty.
In addition, the main weakness of the SMA is that very thin snowpacks, thinner than the sensor ribbon size (7 cm), are inaccurately represented. However, this situation has little impact in terms of hydrology, as the equivalent volumes are low. Λ variations recorded with very thin snowpacks must therefore be considered with caution. Lastly, one can also note that the positive variations in Λ may also be due to refreezing of the bottom layer in the case of very thin snow cover. This is a limitation of the estimation of melt rate. However, since the SMA also provides the ice content of the bottom snow layer, refreezing periods can be determined.
5.2 Inter-annual variability and climate change
The three monitored winters markedly differ in terms of snowpack dynamics (Fig. 4). The winter of 2021–2022 consisted of an intense melting period in early winter; the 2022–2023 winter presented intermittent snow conditions, with the alternation of accumulation and melting periods; and the 2023–2024 winter exhibited a shorter snow cover period but with a melt period concentrated in the spring season. For the 2021–2022 winter, the first snow accumulation period occurred in early winter (December), followed by a warmer melting period in January, another accumulation period in late winter (March), and a gradual melting in April. For the 2022–2023 winter, the snow season consisted mainly of an alternation of accumulation and fast melt periods due to the sharp increase in temperature. The spring melt period expanded from mid-February to the beginning of April. In Fig. 7, the behavior of snowmelt, along with the Dunne runoff and the Hortonian runoff, strongly differ between the three monitored winters. Consequently, this 3-year dataset does not allow us to describe the seasons of majority influence of the different types of runoff and infiltration processes during snowmelt.
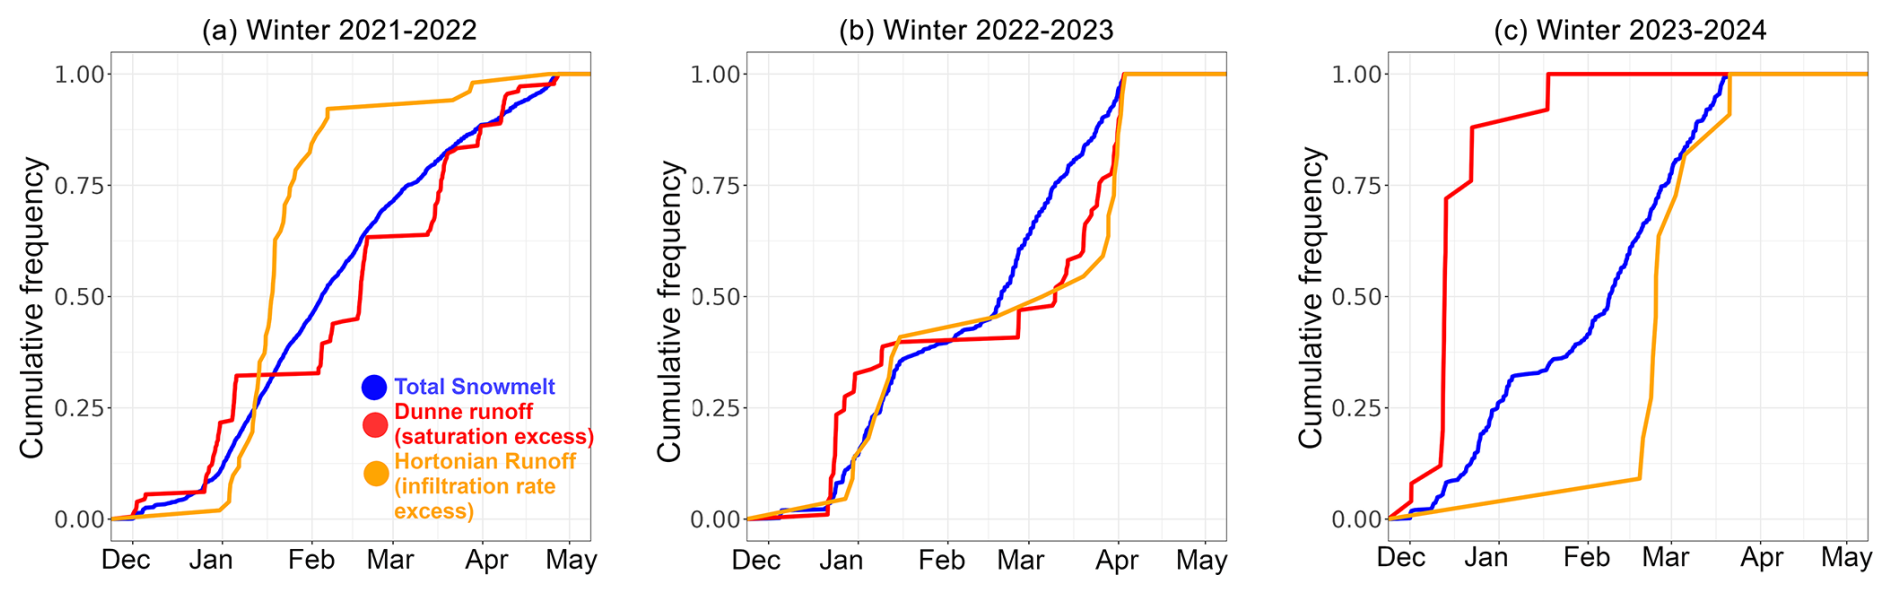
Figure 7Cumulative frequency of occurrence during each of the three monitored winters for snowmelt (blue), Hortonian runoff (orange), and Dunne runoff (red) happening during melt events.
The potential implications of these results in the context of climate change can be considered. The amount of solid precipitation is projected to decrease, and the onset of the melt is expected to commence earlier (Masson-Delmotte et al., 2021), changing the snowmelt infiltration dynamics. In the Swiss Alps, for example, a reduction in snow amount, a shortening of the melt period, and faster melt rates associated with shortened snow events are expected (Fischer et al., 2022). The rapid infiltration in the upper soil layers and the fast response of the river flow highlighted in this work corroborate the increase in flood risk during the spring season (Kundzewicz et al., 2014), particularly in the context of increased melt flux intensities. In addition, the expected increases in the duration of the low-flow period (from July–August to June–August) could lead to an increasing risk of damage to riverine ecosystems (Pletterbauer et al., 2018) and could affect hydroelectrical production. This work emphasizes that the fast response of soils and discharge to snowmelt increases the risk of low flow and water shortage outside of the melt period. This highlights the dependency of water availability on the delayed melt of the snowpack at high elevations.
5.3 Spatial variability in soil water processes
The eight points sampled for the soil analysis represent various soil contexts. Some sites present low values of Ksat, such as the La Chaux and Chalet sites. The impact of pasturing on the Ksat values for nearby sites can be noted, just like between the Auberge and Pissenlit sites and between the Combe and La Chaux sites. For these four sites, cow pasture significantly reduces the soil conductivity at saturation.
Other sites present higher Ksat values, such as the Protegee (protected from cows) and La Combe sites. This variability illustrates that some areas may actually block the infiltration of meltwater and produce significant surface runoff. Conversely, Combe-like areas may act as recharge zones, with higher vertical infiltration rates. This emphasizes the crucial role of these areas in enabling infiltration in mountains. However, eight points remain limited for such a heterogeneous environment, and the representativeness of these sites is necessarily restricted.
In addition, the response of deeper soils and groundwater is not considered here. In particular, the flows and storage in unconsolidated subsoils, such as moraine deposits from landslides and rockfalls, can be significant, especially in the alluvial fan which is present in the middle of the valley. This work paves the way for a better understanding of the contribution of snowmelt to deep water recharge in mountainous regions: at the study site, the superficial soil layers (i.e., above 30 cm) appear to limit the infiltration flux toward deeper zones. The assumption can then be made that the recharge of deep storage might preferentially occur in specific areas presenting little or no developed soils, such as bare rock or uncovered moraines. This assumption could be explored using advanced modeling approaches (Thornton, 2022). Further instrumental work could allow a better description of the circulation below 30 cm depth. Interactions between the fast-reacting unsaturated zone of the soil and the snow–groundwater system at the catchment scale could then be considered in future work.
The results (i) compare three different methods to estimate snowmelt rate at the local scale, (ii) compare the intensities of melt rates with the infiltration capacity of soils to better quantify the partition between surface runoff and infiltration of the melt flux, and (iii) describe the dynamics of vertical and lateral transfers of the flux issued from snowmelt in the superficial soil layers and the response of the stream discharge to melt events to better quantify the response of the catchment to melt events.
The main conclusions of this instrumental experiment are as follows:
-
SnowTree temperature measurements align well with visual observations, confirming their reliability. SWE estimates from the CRS are consistent with snow depth measurements. The study shows that SWE variations do not always reflect actual melt, as other snowpack processes (e.g., compaction) can interfere. Focusing on the bottom snow layer provides a more accurate melt rate estimation.
-
The measured snowmelt rate is generally lower than the soil conductivity at saturation, allowing infiltration of melt flux in the first soil layers. For the Auberge site, Hortonian runoff (exceeding soil conductivity) occurred during 4.3 % of the melt events. Dunne runoff (due to soil saturation) happened in 15 % of the melt events. The infiltration processes strongly differ between winter and spring. In spring, runoff is mainly driven by diurnal temperature variations, while winter runoff patterns are more irregular.
-
Soil layers below 30 cm are influenced little by snowmelt, and soil moisture responses at the three monitored sites show rapid and simultaneous reactions to melt and precipitation (delay <5 h), confirming fast water transfer across the catchment. No inter-seasonal storage in soils is observed.
Even though this work is limited by compiling only 3 years of data, which occasionally include significant gaps and restricted recording periods with limited measurement points and uncertainties, especially regarding weather and snow depth data, it nonetheless provides an uncommon combination of soil and snow data using various acquisition methods. The resulting dataset represents a valuable contribution to the understanding of mountainous environments. In addition to their contribution to process understanding, these snow and soil records can be used as validation or calibration data to improve process simulation in physically based hydrological models, particularly for local-scale studies. These observations could assist in refining aspects of physically based surface schemes implemented at the measurement point.
All the data produced in this work are freely available on the dedicated Zenodo platform: https://zenodo.org/communities/vdn/ (last access: 27 August 2025).
Soil moisture, soil temperature data, and granulometry results can be downloaded at https://doi.org/10.5281/zenodo.10136586 (Eeckman, 2023). SMA snowmelt rate and snow water content data and SnowTree data can be downloaded at https://doi.org/10.5281/zenodo.11580271 (Eeckman, 2024).
JE initiated and developed the research project, raised funding for the instrumentation and fieldwork, carried out the fieldwork and data analysis, and wrote the paper. NP advised the writing of the paper and significantly contributed to its redaction. BDG actively assisted with the fieldwork and participated in the processing of field data. FMM actively assisted with the fieldwork and preparation of materials. JT contributed to the analysis of CRS data and helped to correct the article. PB performed funding acquisition and project management for JT and assisted with revision and correction of the article.
At least one of the (co-)authors is a member of the editorial board of Hydrology and Earth System Sciences. The peer-review process was guided by an independent editor, and the authors also have no other competing interests to declare.
Publisher's note: Copernicus Publications remains neutral with regard to jurisdictional claims made in the text, published maps, institutional affiliations, or any other geographical representation in this paper. While Copernicus Publications makes every effort to include appropriate place names, the final responsibility lies with the authors.
This article is part of the special issue “Drought, society, and ecosystems (NHESS/BG/GC/HESS inter-journal SI)”. It is not associated with a conference.
The authors would like to thank the UNIL Institute of Geography and Sustainability (IGD) and the UNIL Institute of Earth Surface Dynamics (IDYST) for their support. Nadav Peleg was supported by the Swiss National Science Foundation (SNSF), grant no. 194649 (“Rainfall and floods in future cities”).
The SMA and SnowTree were financed thanks to the investment fund (FINV) of the University of Lausanne. The field assistance was financed thanks to the contribution of the UNIL Institute of Geography and Sustainability (IGD). Other costs related to fieldwork were financed by the IGD fund for fieldwork. The publication fees were supported by the UNIL Institute of Earth Surface Dynamics (IDYST).
This paper was edited by Jan Seibert and reviewed by Steven Fassnacht and two anonymous referees.
Antoniazza, G.: Bedload transport in Alpine streams: Lessons from newly-emerging monitoring systems, Phd thesis, University of Lausanne, Faculty of Geoscience and Environment, University of Lausanne, Switzerland, https://iris.unil.ch/handle/iris/167325 (lass access: 27 August 2025), 2023. a, b
Archer, D. and Stewart, D.: The installation and use of a snow pillow to monitor snow water equivalent, Water Environ. J., 9, 221–230, 1995. a, b
Aune-Lundberg, L. and Strand, G.-H.: CORINE Land Cover 2006. The Norwegian CLC2006 project, Norsk institutt for skog og landskap, ISBN 9788231101147, 2010. a, b
Benettin, P., Soulsby, C., Birkel, C., Tetzlaff, D., Botter, G., and Rinaldo, A.: Using SAS functions and high-resolution isotope data to unravel travel time distributions in headwater catchments, Water Resour. Res., 53, 1864–1878, 2017. a
Benoit, L., Allard, D., and Mariethoz, G.: Stochastic rainfall modeling at sub-kilometer scale, Water Resour. Res., 54, 4108–4130, 2018. a
Beria, H., Larsen, J. R., Ceperley, N. C., Michelon, A., Vennemann, T., and Schaefli, B.: Understanding snow hydrological processes through the lens of stable water isotopes, WIRes Water, 5, e1311, https://doi.org/10.1002/wat2.1311, 2018. a
Bloem, E., Forquet, N., Søiland, A., Binley, A., and French, H. K.: Towards understanding time-lapse electrical resistivity signals measured during contaminated snowmelt infiltration, Near Surf. Geophys., 18, 399–412, 2020. a
Blott, S. J., Croft, D. J., Pye, K., Saye, S. E., and Wilson, H. E.: Particle size analysis by laser diffraction, Geological Society, London, Special Publications, 232, 63–73, 2004. a
Braud, I., De Condappa, D., Soria, J. M., Haverkamp, R., Angulo-Jaramillo, R., Galle, S., and Vauclin, M.: Use of scaled forms of the infiltration equation for the estimation of unsaturated soil hydraulic properties (the Beerkan method), Eur. J. Soil Sci., 56, 361–374, 2005. a
Brooks, R. H. and Corey, A. T.: Properties of porous media affecting fluid flow, J. Irrig. Drain. Div.-ASCE, 92, 61–88, 1966. a
Burdine, N.: Relative permeability calculations from pore size distribution data, J. Petrol. Technol., 5, 71–78, 1953. a
Carey, S. K. and Woo, M.-K.: Slope runoff processes and flow generation in a subarctic, subalpine catchment, J. Hydrol., 253, 110–129, 2001. a
Carroll, R. W., Deems, J. S., Niswonger, R., Schumer, R., and Williams, K. H.: The importance of interflow to groundwater recharge in a snowmelt-dominated headwater basin, Geophys. Res. Lett., 46, 5899–5908, 2019. a
Ceperley, N., Zuecco, G., Beria, H., Carturan, L., Michelon, A., Penna, D., Larsen, J., and Schaefli, B.: Seasonal snow cover decreases young water fractions in high Alpine catchments, Hydrol. Process., 34, 4794–4813, 2020. a, b
Cianfrani, C., Buri, A., Vittoz, P., Grand, S., Zingg, B., Verrecchia, E., and Guisan, A.: Spatial modelling of soil water holding capacity improves models of plant distributions in mountain landscapes, Plant Soil, 438, 57–70, 2019. a
Clapp, R. B. and Hornberger, G. M.: Empirical equations for some soil hydraulic properties, Water Resour. Res., 14, 601–604, 1978. a
Corripio, J. G., and Corripio, M. J. G.: insol: Solar radiation, R package version 1.2.2, https://cran.r-project.org/src/contrib/Archive/insol/ (last access: 27 August 2025), 2019. a
Cosby, B., Hornberger, G., Clapp, R., and Ginn, T.: A statistical exploration of the relationships of soil moisture characteristics to the physical properties of soils, Water Resour. Res., 20, 682–690, 1984. a
Desilets, D.: Calibrating a non-invasive cosmic ray soil moisture probe for snow water equivalent, Hydroinnova Technical Document 17-01, https://doi.org/10.5281/zenodo.439105, 2017. a, b
Eeckman, J.: Soil study results at Vallon de Nant: Soil moisture and soil temperature time series and granulometry results, Zenodo [data set], https://doi.org/10.5281/zenodo.10136586, 2023. a
Eeckman, J.: Liquid water content, ice water content and density measured via the SnowMelt Instrument at Auberge station, Zenodo [data set], https://doi.org/10.5281/zenodo.11580271, 2024. a
Fang, Z., Carroll, R. W., Schumer, R., Harman, C., Wilusz, D., and Williams, K. H.: Streamflow partitioning and transit time distribution in snow-dominated basins as a function of climate, J. Hydrol., 570, 726–738, 2019. a, b, c
Fischer, A., Strassmann, K., Croci-Maspoli, M., Hama, A., Knutti, R., Kotlarski, S., Schär, C., Schnadt Poberaj, C., Ban, N., Bavay, M., Beyerle, U., Bresch, D., Brönnimann, S., Burlando, P., Casanueva, A., Fatichi, S., Feigenwinter, I., Fischer, E., Hirschi, M., Liniger, M., Marty, C., Medhaug, I., Peleg, N., Pickl, M., Raible, C., Rajczak, J., Rössler, O., Scherrer, S., Schwierz, C., Seneviratne, S., Skelton, M., Sørland, S., Spirig, C., Tschurr, F., Zeder, J., and Zubler, E.: Climate scenarios for Switzerland CH2018 – approach and implications, Climate Services, 26, 100288, https://doi.org/10.1016/j.cliser.2022.100288, 2022. a
French, H. and Binley, A.: Snowmelt infiltration: monitoring temporal and spatial variability using time-lapse electrical resistivity, J. Hydrol., 297, 174–186, 2004. a
Fuentes, C., Vauclin, M., Parlange, J.-Y., and Haverkamp, R.: Soil-water conductivity of a fractal soil, in: Revival: Fractals in Soil Science (1998), CRC Press, 333–340, https://doi.org/10.1201/9781315151052, 2017. a
Gance, J., Malet, J.-P., Supper, R., Sailhac, P., Ottowitz, D., and Jochum, B.: Permanent electrical resistivity measurements for monitoring water circulation in clayey landslides, J. Appl. Geophys., 126, 98–115, 2016. a
Grand, S., Rubin, A., Verrecchia, E. P., and Vittoz, P.: Variation in soil respiration across soil and vegetation types in an alpine valley, Plos One, 11, e0163968, https://doi.org/10.1371/journal.pone.0163968, 2016. a, b
Hall, D. K., Nghiem, S. V., Schaaf, C. B., DiGirolamo, N. E., and Neumann, G.: Evaluation of surface and near-surface melt characteristics on the Greenland ice sheet using MODIS and QuikSCAT data, J. Geophys. Res.-Earth, 114, F04006, https://doi.org/10.1029/2009JF001287, 2009. a
Haverkamp, R., Ross, P., Smettem, K., and Parlange, J.: Three-dimensional analysis of infiltration from the disc infiltrometer: 2. Physically based infiltration equation, Water Resour. Res., 30, 2931–2935, 1994. a, b, c
He, Z. H., Parajka, J., Tian, F. Q., and Blöschl, G.: Estimating degree-day factors from MODIS for snowmelt runoff modeling, Hydrol. Earth Syst. Sci., 18, 4773–4789, https://doi.org/10.5194/hess-18-4773-2014, 2014. a
Heidbüchel, I., Troch, P. A., Lyon, S. W., and Weiler, M.: The master transit time distribution of variable flow systems, Water Resour. Res., 48, W06520, https://doi.org/10.1029/2011WR011293, 2012. a
Hubbart, J., Link, T., Campbell, C., and Cobos, D.: Evaluation of a low-cost temperature measurement system for environmental applications, Hydrol. Process., 19, 1517–1523, 2005. a
Kampf, S., Markus, J., Heath, J., and Moore, C.: Snowmelt runoff and soil moisture dynamics on steep subalpine hillslopes, Hydrol. Process., 29, 712–723, 2015. a, b, c, d
Kattelmann, R.: Snowmelt lysimeters in the evaluation of snowmelt models, Ann. Glaciol., 31, 405–410, 2000. a
Klaus, J. and McDonnell, J.: Hydrograph separation using stable isotopes: Review and evaluation, J. Hydrol., 505, 47–64, 2013. a
Kundzewicz, Z. W., Kanae, S., Seneviratne, S. I., Handmer, J., Nicholls, N., Peduzzi, P., Mechler, R., Bouwer, L. M., Arnell, N., Mach, K., Muir-Wood, R., Brakenridge, G. R., Kron, W., Benito, G., Honda, Y., Takahashi, K., and Sherstyukov, B.: Flood risk and climate change: global and regional perspectives, Hydrolog. Sci. J., 59, 1–28, 2014. a
Lassabatère, L., Angulo-Jaramillo, R., Soria Ugalde, J., Cuenca, R., Braud, I., and Haverkamp, R.: Beerkan estimation of soil transfer parameters through infiltration experiments – BEST, Soil Sci. Soc. Am. J., 70, 521–532, 2006. a
Legros, J.: Soils of Alpine mountains, in: Developments in Earth Surface Processes, vol. 2, Elsevier, 155–181, https://doi.org/10.1016/B978-0-444-89198-3.50012-X, 1992. a, b
Lorenzi, V., Banzato, F., Barberio, M. D., Goeppert, N., Goldscheider, N., Gori, F., Lacchini, A., Manetta, M., Medici, G., Rusi, S., and Petittaa, M.: Tracking flowpaths in a complex karst system through tracer test and hydrogeochemical monitoring: Implications for groundwater protection (Gran Sasso, Italy), Heliyon, 10, e24663, https://doi.org/10.1016/j.heliyon.2024.e24663, 2024. a
Martinec, J.: Snowmelt-runoff model for stream flow forecasts, Hydrol. Res., 6, 145–154, 1975. a
Masson-Delmotte, V., Zhai, P., Pirani, S., Connors, C., Péan, S., Berger, N., Caud, Y., Chen, L., Goldfarb, M., and Scheel Monteiro, P. M.: Ipcc, 2021: Summary for policymakers. in: Climate change 2021: The physical science basis. Contribution of working group i to the sixth assessment report of the intergovernmental panel on climate change, https://doi.org/10.1017/9781009157896, 2021. a
Meeks, J., Moeck, C., Brunner, P., and Hunkeler, D.: Infiltration under snow cover: Modeling approaches and predictive uncertainty, J. Hydrol., 546, 16–27, 2017. a, b
Michelon, A., Ceperley, N., Beria, H., Larsen, J., Vennemann, T., and Schaefli, B.: Hydrodynamics of a high Alpine catchment characterized by four natural tracers, Hydrol. Earth Syst. Sci., 27, 1403–1430, https://doi.org/10.5194/hess-27-1403-2023, 2023. a
Michelon, A., Ceperley, N., Beria, H., Larsen, J., Vennemann, T., and Schaefli, B.: Hydrodynamics of a high Alpine catchment characterized by four natural tracers, Hydrol. Earth Syst. Sci., 27, 1403–1430, https://doi.org/10.5194/hess-27-1403-2023, 2023. a
Perret, A. and Martin, S.: Carte géomorphologique du vallon de Nant et étude de la marge proglaciaire du glacier des Martinets, Bulletin de la Murithienne, 132, 69–82, https://bureau-relief.ch/reference/carte-geomorphologique-du-vallon-de-nant-vd/ (last access: 1 September 2025), 2015. a, b, c
Pletterbauer, F., Melcher, A., and Graf, W.: Climate change impacts in riverine ecosystems, Riverine Ecosystem Management, Aquatic Ecology Series, 8, 203–223, 2018. a
Reusser, D. E. and Zehe, E.: Low-cost monitoring of snow height and thermal properties with inexpensive temperature sensors, Hydrol. Process., 25, 1841–1852, 2011. a
Rulin, O., Liliang, R., Weiming, C., and Zhongbo, Y.: Application of hydrological models in a snowmelt region of Aksu River Basin, Water Science and Engineering, 1, 1–13, 2008. a
Santos, A. C., Portela, M. M., Rinaldo, A., and Schaefli, B.: Analytical flow duration curves for summer streamflow in Switzerland, Hydrol. Earth Syst. Sci., 22, 2377–2389, https://doi.org/10.5194/hess-22-2377-2018, 2018. a
Schaefli, B., Nicótina, L., Imfeld, C., Da Ronco, P., Bertuzzo, E., and Rinaldo, A.: SEHR-ECHO v1.0: a Spatially Explicit Hydrologic Response model for ecohydrologic applications, Geosci. Model Dev., 7, 2733–2746, https://doi.org/10.5194/gmd-7-2733-2014, 2014. a
Sommertechnik: Snow Pack Analyser (SPA), Examples, document release: V1.0.0, http://www.sommer.at (last access: 27 August 2025), 2009. a
Thornton, J.: Fully-integrated hydrological modelling in steep, snow-dominated, geologically complex Alpine terrain, Water Resour. Res., 58, e2020WR029390, https://doi.org/10.1029/2020WR029390, 2022. a
Thornton, J. M., Mariethoz, G., and Brunner, P.: A 3D geological model of a structurally complex Alpine region as a basis for interdisciplinary research, Scientific Data, 5, 1–20, 2018. a
Thornton, J. M., Brauchli, T., Mariethoz, G., and Brunner, P.: Efficient multi-objective calibration and uncertainty analysis of distributed snow simulations in rugged alpine terrain, J. Hydrol., 598, 126241, https://doi.org/10.1016/j.jhydrol.2021.126241, 2021. a, b
Thornton, J. M., Therrien, R., Mariéthoz, G., Linde, N., and Brunner, P.: Simulating fully-integrated hydrological dynamics in complex alpine headwaters: potential and challenges, Water Resour. Res., 58, e2020WR029390, https://doi.org/10.1029/2020WR029390, 2022. a
Van Genuchten, M. T.: A closed-form equation for predicting the hydraulic conductivity of unsaturated soils, Soil Sci. Soc. Am. J., 44, 892–898, 1980. a
Vionnet, V., Brun, E., Morin, S., Boone, A., Faroux, S., Le Moigne, P., Martin, E., and Willemet, J.-M.: The detailed snowpack scheme Crocus and its implementation in SURFEX v7.2, Geosci. Model Dev., 5, 773–791, https://doi.org/10.5194/gmd-5-773-2012, 2012. a
Webb, R., Williams, M. W., and Erickson, T. A.: The spatial and temporal variability of meltwater flow paths: Insights from a grid of over 100 snow lysimeters, Water Resour. Res., 54, 1146–1160, 2018a. a
Webb, R. W., Fassnacht, S. R., and Gooseff, M. N.: Hydrologic flow path development varies by aspect during spring snowmelt in complex subalpine terrain, The Cryosphere, 12, 287–300, https://doi.org/10.5194/tc-12-287-2018, 2018b. a
Wilusz, D., Harman, C., Ball, W., Maxwell, R., and Buda, A.: Using particle tracking to understand flow paths, age distributions, and the paradoxical origins of the inverse storage effect in an experimental catchment, Water Resour. Res., 56, e2019WR025140, https://doi.org/10.1029/2019WR025140, 2020. a
Zhang, F., Zhang, H., Hagen, S. C., Ye, M., Wang, D., Gui, D., Zeng, C., Tian, L., and Liu, J.: Snow cover and runoff modelling in a high mountain catchment with scarce data: effects of temperature and precipitation parameters, Hydrol. Process., 29, 52–65, 2015. a