the Creative Commons Attribution 4.0 License.
the Creative Commons Attribution 4.0 License.
Reinforce lake water balance component estimations by integrating water isotope compositions with a hydrological model
Nariman Mahmoodi
Hyoun-Tae Hwang
Ulrich Struck
Michael Schneider
Christoph Merz
Accurate estimation of water balance components of groundwater-fed lakes, including subsurface inflow and actual evaporation from lakes, is a complex task for hydrologists employing hydrological models. In this study, an approach that integrates isotope analysis and hydrological modeling is used to improve the representation of groundwater–surface water interactions. While based on 1 year of sampling, this method provides direct observational data to complement hydrological models and serves as a validation tool for water balance estimates. The approach, based on measurements of stable isotopes (oxygen-18: 18O; deuterium: 2H), enables quantitative estimation of the individual water flux and evapotranspiration rates. An isotope-mass-balance model was used to quantify lake water balances over a 1-year sampling period. The approach is based on the global relationship between the δ18O and δ2H values in the precipitation and kinetic isotopic fractionation in the lake water during evaporation. Assuming that the lake is hydraulically connected to the groundwater, the isotope mass-balance model accounts for the quantification of the evaporation rate considering the groundwater inflow compensating for the evaporation loss. The study addresses the model-based quantification of groundwater inflow and evaporation losses of a young glacial groundwater lake (Lake Groß Glienicke (GGS), southwest of Berlin in the Havel catchment) over the period from 2015 to 2023 with the integrated HydroGeoSphere (HGS) hydrological model. Utilizing the isotopic mass balance model, HydroCalculator, under steady-state hydrological regime conditions, the evaporation-to-inflow () ratio is determined for the period of 1 year from August 2022 to September 2023. Employing the fully integrated hydrological model, calibrated and validated under monthly normal transient flow conditions from 2008 to 2023 for the lake catchment, subsurface and groundwater inflows to the lake are calculated and compared to the calculated ratios based on the isotopic measurement of the lake water. Isotopic signatures confirm the lake's flow-through conditions. The calculated ratio for GGS is around 40 %. The calculated evaporation for the years 2022 and 2023, within the isotopic mass balance model framework, aligns well with the evaporation from the lake calculated by the HGS model. The change in leads to a significantly improved estimation of evaporation rates after correction for temperature fluctuations and inflow data from previous years (2015–2021). With a correlation coefficient of 0.81, these revised values show a high degree of agreement with the evaporation rates predicted by the HGS model for the corresponding years. Despite the uncertainties associated with the analysis of the water isotope signature, its integration into the hydrological model serves as a validation of the hydrological model calculations of the water balance components.
- Article
(4001 KB) - Full-text XML
- BibTeX
- EndNote
Hydrological models have undergone substantial advancements in the past few decades (Singh, 2018; Herrera et al., 2022) but still face unsolved problems and uncertainties in depicting hydrological processes (Liu and Gupta, 2007; Renard et al., 2010). Recently, a wide range of monitoring and modeling techniques has emerged for investigating water fluxes at different scales (Fekete et al., 2006; Windhorst et al., 2014). However, limitations in the hydrological model parameterizations lead to insufficient quantification of water flows and therefore a quantitatively and qualitatively incorrect interpretation of hydrodynamic processes and inaccurate assumptions for water management purposes (Müller Schmied et al., 2014). Improvement of the informative value of the models representing complex hydrological processes is needed to enhance the applicability of the models for future estimations and scenario analyses. The optimal adaptation of hydrological models to real conditions for precise determination of water balance components is often considered unattainable within the current technical possibilities due to the overwhelming amount of work associated with field measurements. In particular, the quantification of groundwater–surface water exchange using hydrological models faces pronounced uncertainties in considering geostructural heterogeneities on different scales. To validate the model results, arduous monitoring surveys are required to measure, for example, groundwater–surface water interactions along riverbanks or lake shorelines (Partington et al., 2020). Hence, a combination of hydrogeological modeling, field measurements, and innovative isotopic-based studies, along with appropriate linkage between these approaches, will be a concrete way of achieving optimal parameterization and validation capabilities for modeling hydrological processes in complex geohydraulic systems.
Recent studies show that the stable water isotope mass balance in different water sources, together with the numerical models, improves the model performance in simulating the interactions between groundwater and surface water (e.g., Jafari et al., 2021). The isotopic insights enhance hydrogeologists' efforts to calculate water balance components such as the groundwater inflow to the surface water resources and water losses due to evaporation (Skrzypek et al., 2015; Vyse et al., 2020). This method is based on the fractionation of heavier isotopes caused by evaporation from surface water, provoking a disparity in isotope composition between groundwater and surface water. However, a key limitation is that the stable water isotope mass balance only reflects the conditions during the sampling period, making its results non-transferable to other time periods. While the method integrates over the lake's water residence time, it may not fully capture transient groundwater–surface water exchanges, especially if the lake is stratified and not well mixed. Although water isotope analyses can track changes in water fluxes over specific time intervals (e.g., monthly), capturing spatial groundwater–surface water exchanges requires a large number of samples. The challenge lies in the sampling effort needed to sufficiently describe the spatial and temporal dynamics of the exchange. These limitations can be mitigated by integrating water isotope analyses with physically based hydrogeological models.
Water isotope data analyses are helpful techniques for evaluating the model's performance. For instance, Ala-aho et al. (2015) assessed the hydrogeological model performance by comparing the simulated groundwater inflow to lakes in the middle of Finland with calculated recharge by analyzing water isotope data.
In the northeast of Germany, groundwater levels and landscape runoff have largely been in decline for over 3 decades (Lahmer and Pfützner, 2003); Germer et al., 2011; Merz and Pekdeger, 2011); regional climate studies suggest further decreases over the next decades (Gerstengarbe et al., 2003, 2013). Effective water resource management for this region requires a thorough assessment of possible adaptions and measures to mitigate severe consequences, such as declining groundwater heads and surface water levels and water quality. In particular, developing integrated management schemes for groundwater-dependent ecosystems such as lakes under climate change requires a more comprehensive understanding of hydrological dynamics and better estimates of ecologically relevant water fluxes.
This study aims to address these challenges by developing an approach to capture the complex interactions within the groundwater–surface water system. The proposed approach enhances the parameterization of hydrological models and improves the validation of water balance components, ultimately contributing to more effective water resource management under changing climatic conditions.
2.1 Study area
Lake Groß Glienicke (GGS) with an area of 0.59 km2 and a maximum depth of 10 m is located in the states of Berlin and Brandenburg, Germany (30–87 m a.s.l., Fig. 1a). It is a young glacial lowland lake that is exclusively fed by groundwater. The lake's water levels have shown significant seasonal variability (around 0.4 m) over recent decades (Fig. 2). Since 2014, the lake's water level has faced severe drops (Fig. 2) of around 1.28 m. GGS as a seepage lake (lake without an outlet) is surrounded by low-density residences (Fig. 1). In the northern and northwestern parts, grassland and farmland are the dominant surface covers, while forest, covering approximately 50 % of the catchment, is the predominant land cover in the catchment overall and directly overlies sandy soils. The aquifers are recharged in the Döberitzer-Heide region, where fine sandy soil with a hydraulic conductivity ranging from 8 × 10⁻⁵ to 12 × 10−5 m s−1 can be found according to the laboratory analysis. The root zone depth ranges from the surface to 30 cm in grasslands and farmlands and up to 3 m in forests. Although the forest roots are deep, direct plant water uptake from groundwater is not possible due to the thick (>5 m) unsaturated zone. The groundwater monitoring measurements illustrate a smooth hydraulic head gradient from west to east, highlighting the connections between the lake and the aquifer recharge area from the Döberitzer-Heide region (Fig. 3). On the eastern side of the lake's catchment, a regulated river, the Havel, flows from northeast to southwest. Continuous stratigraphic units have been delineated throughout the lake's catchment based on the geological feature information collected from 480 boreholes (Fig. 2, The Federal Institute for Geosciences and Natural Resources – BGR, 2007). The geology in the study area is formed by a series of layered Pleistocene and Tertiary sediments that are approximately 150 to 200 m thick, with a lower confining bed of Oligocene marine Rupel clay. The series consists of a complex interplay of glacial deposits from the Pleistocene and permeable marine and limnic sediments of the Upper Oligocene and Miocene. The series can be divided into an upper unconfined aquifer system of shallow Weichselian and late Saalian sediments. In general, a shallow (i.e., 5 to 10 m) unconfined aquifer is separated from the lower confined aquifer by a 15 to 20 m thick layer of Saalian sediments. The confined and unconfined aquifers consist of multiple permeable sediment layers partially disconnected by layers of till, but they are still hydraulically connected. The hydraulic connection to the lakes is mainly controlled by these aquifer layers. Underneath these sediments is a thick confined aquifer system of the early Saalian and Elster layers as well as Upper Oligocene and Miocene sediments.
The first shallow, unconfined aquifer in the catchment area is characterized by highly permeable glacial sand and gravel deposits (Holocene and Weichselian). A till layer (Weichselian age, Fig. 3) is found in the underlying layers. The till is underlain by late Warthe sandy sediments forming the second aquifer.
2.2 Available meteorological data
From 1990 to 2023, radar-based CER v2 (Central Europe Refined Analysis version 2; details on the data preprocessing and postprocessing are provided by Jänicke et al., 2017) data generated a mean daily temperature of 10.4 °C and an average annual precipitation of 612 mm, with average annual actual evapotranspiration (AET) values of 639, 646, and 670 mm for farmland, grassland, and forest areas, respectively. The annual mean humidity at the Gatow station has varied from 50 % to 70 % over the last 2 decades (2000–2023). During the hydrological year of the survey (August 2022 to September 2023), the mean monthly precipitation, temperature, and humidity in the study region were 51.9 mm, 12.3 °C (Potsdam weather station, DWD, 2024), and 69 %, respectively (recorded at the Gatow weather station of the Berlin Measurement Network MEVIS; Fig. 1). Precipitation data as one of the boundary conditions in the modeling work were obtained from the Potsdam station of the DWD (2024).
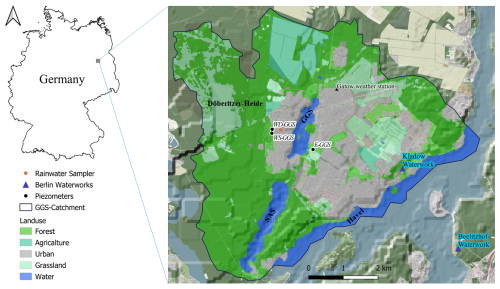
Figure 1Location of the study area, highlighting Lake Groß Glienicke (GGS), Lake Sacrow (SAS), the Havel channel, piezometers on the eastern (E-GGS) and western (WD-GGS: deep piezometer; WS-GGS: shallow piezometer) sides of GGS, the rainwater sampler, Berlin waterworks, and land use classifications. © OpenStreetMap contributors 2023. Distributed under the Open Data Commons Open Database License (ODbL) v1.0.
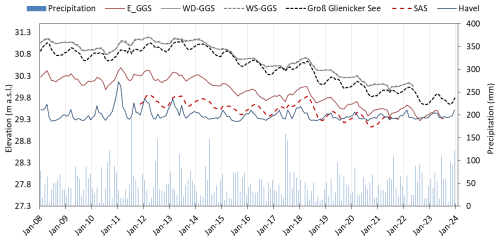
Figure 2Measured lake water level fluctuations and monthly precipitation variations during the period 2008–2023 from the Potsdam station.
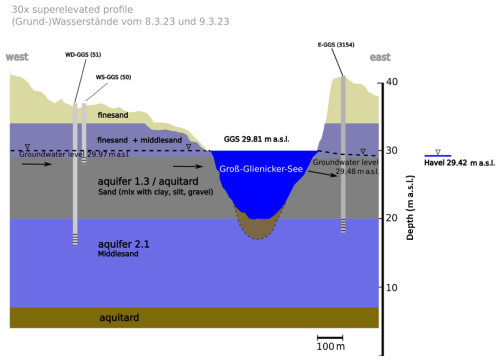
Figure 3Conceptual cross section of the aquifer demonstrating the geological structure, hydraulic head, and water flow direction from the groundwater recharge area towards GGS and the groundwater discharge area at a lower altitude. WD-GGS, WS-GGS, and E-GGS are the piezometers on the western and eastern sides of GGS.
2.3 Stable isotope analysis
Surface water samples were collected for 1 year (from August 2022 to September 2023) at a monthly time interval from GGS using three piezometers installed in the first two aquifers encompassing the lakes and using a rainwater sampler. Before groundwater sampling, the total depth and water volume of the monitoring well were measured to determine the volume of stagnant water inside the piezometer. At least three well volumes of water were then pumped, with pumping continuing until in situ parameters such as temperature, electrical conductivity (EC), and pH stabilized. This ensured that the sample was representative of the aquifer rather than stagnant casing water. All of the water samples (bottles with polyseal conical caps) collected in clusters from 2 d excursions were filtered through a membrane (0.2 and 0.45 µm pores) and stored at 6 °C to prevent evaporation before laboratory analysis. Stable isotope ratios of oxygen () and hydrogen () in H2O in the water samples were measured with a PICARRO L1102-i isotope analyzer. L1102-i is based on the WS-CRDS (wavelength-scanned cavity ring-down spectroscopy) technique (Gupta et al., 2009). Measurements were calibrated by the application of linear regression of the analyses of IAEA calibration material VSMOW, VSLAP, and GISP. The stable isotope ratios of oxygen and hydrogen are expressed in conventional delta notation (δ18O and δ2H) per mil (‰) vs. VSMOW. For each sample, six replicate injections were performed, and the arithmetic average and standard deviations (1σ) were calculated. The reproducibilities of the replicate measurements are generally better than 0.1 ‰ for oxygen and 0.5 ‰ for hydrogen.
2.4 Isotope mass balance model
The evaporation loss from a lake such as GGS can be calculated considering the transient stable water isotope compositions of lake water, groundwater inflow, and moisture in ambient air and climate data (air temperature and humidity) for the specific period of time. Steady-state hydrological conditions were adopted for the calculations (the lake's water level stays constant because the inflow matches losses; Tweed et al., 2009; Gibson and Reid, 2010; Skrzypek et al., 2015). The isotope mass balance model (HydroCalculator), whose capability has been verified through various field experiments globally (Skrzypek et al., 2015; Vyse et al., 2020), was applied to calculate the evaporation-to-inflow ratio () for GGS under steady-state conditions. In the HydroCalculator model, isotopic dynamics in lake water are assumed to be caused by evapoconcentration (increasing isotope ratios) or dilution from meteoric water (lowering isotope ratios). Hence, a series of time-based analyses enables the assessment of evaporation progress. Climate data from nearby weather stations (Gatow and Potsdam) were utilized to address uncertainties arising from the distance between the weather stations and the points of water sampling (Gibson and Reid, 2014; Skrzypek et al., 2015). The stable isotope composition of moisture in ambient air (δair) was calculated from the mean monthly weighted averages (for the months when the lake was sampled) and from the stable isotope composition of precipitation (δpcp) at the GNIP station (GNIP/Berlin, DWD, BFG, BGR, and HHZM) (Stumpp et al., 2014; Schmidt et al., 2020). To ensure consistency between the GNIP dataset and local precipitation in terms of isotope composition, rainwater was sampled using an evaporation-free rain sampler on a monthly basis near the lake and analyzed in the laboratory. These analyses were conducted for verification purposes and were not used in the HydroCalculator model analyses.
can be calculated using the following reformulated equation (e.g., as by Mayr et al., 2007) under steady-state hydrological conditions. is the fraction of inflowing water evaporated from GGS:
The enrichment slope (Es) is defined by Welhan and Fritz (1977) and Allison and Leaney (1982) accordingly:
The enrichment of stable isotope compositions can be limited by local climate conditions. According to Gat and Gat (1978) and Gat (1981), this limitation threshold (δ∗) can be estimated by considering air humidity (h), δair, and a total enrichment factor (ε).
When this limitation is exceeded, further evaporation does not result in isotope enrichment. Theoretically, the total enrichment factor represents a maximum limit and cannot be exceeded.
ε is the total fractionation factor and equals the sum of the equilibrium isotope fractionation factor ε+ plus the kinetic isotope fractionation factor εk (Skrzypek et al., 2015):
α+ was determined experimentally by Horita and Wesolowski (1994) based on temperature and was calculated as the following in HydroCalculator (Skrzypek et al., 2015):
The equilibrium isotope fractionation (ε+) is solely temperature-dependent. The kinetic fractionation εk is defined as (Gat, 1995)
According to Gonfiantini (1986) and Araguas-Araguas et al. (2000), the kinetic fractionation constant (Ck) is 12.5 % for δ2H and 14.2 % for δ18O. Air relative humidity (h) is given as a fraction.
δair is calculated based only on the rain stable isotope compositions as follows (Gibson and Reid, 2014):
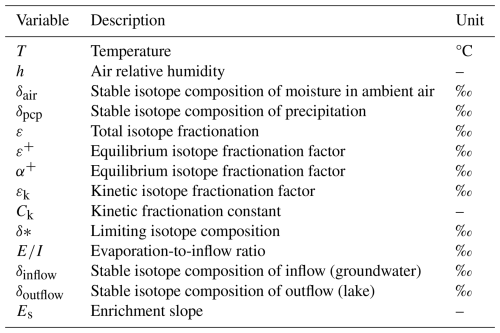
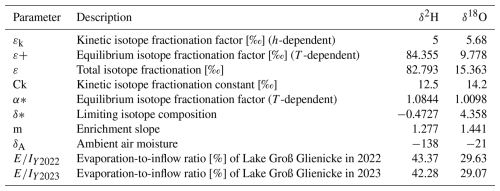
The model calculates the evaporative losses based on the theory behind the Craig–Gordon model (Gibson and Reid, 2014). The variables used in the HydroCalculator model are listed in Table 1.
2.5 Model domain configuration and boundary conditions
2.5.1 Surface–subsurface flows
HydroGeoSphere (HGS) (Aquanty Inc., 2023) was used to simulate the hydrological processes in the GGS catchment. The HGS model allows the simulation of spatially distributed land surface processes, such as evapotranspiration, infiltration, and runoff, without requiring extensive customization. Its ability to dynamically couple surface and subsurface flow provides a more realistic representation of groundwater-fed lake systems. These features make HGS particularly suited to capturing the hydrological complexity of our study area. The HGS model is a three-dimensional (3-D), fully integrated, and physically based model with the capacity to simulate the interwoven flow mechanisms of subsurface and surface water by coupling solutions obtained from the diffusion wave of the 2-D depth-integrated diffusion wave of the Saint-Venant equation governing surface water flow (Eq. 8, Viessman and Lewis, 1996) and the Richards equation governing 3-D unsaturated and saturated subsurface flows (Eq. 10).
ϕ0 represents the porosity (dimensionless) of the surface flow domain, which varies based on the presence of rills and obstructions. h0 stands for the water surface elevation (L). t denotes time (T). d0 indicates L. K0x and K0y represent the surface conductance. Γ0 is the water exchange rate (L3 L−3 T−1) between the surface and subsurface systems. Q0 represents external sources or sinks. In this model setup, L is expressed in meters (m) and time (T) in days (d) for all input variables.
The interaction between the two flow domains is facilitated by the exchange term Γ0 through
kr symbolizes the relative permeability. Kzz represents the saturated hydraulic conductivity in the vertical direction. lexch corresponds to the coupling length.
In the given context, Wm (dimensionless) represents the volumetric porosity fraction within the porous-media domain. Γex stands for the volumetric exchange rate (L3 L−3 T−1) occurring between the porous media and other flow domains. Q denotes the source or sink term. t signifies T. θs corresponds to the porosity (dimensionless). Sw refers to the degree of water saturation (dimensionless).
The flow rate, q (L T−1), is portrayed as
K signifies the hydraulic conductivity (L T−1). kr represents the relative permeability (dimensionless), which is dependent on water saturation. h corresponds to the hydraulic head (L), calculated as the sum of the elevation head and the pressure head.
The 3-D surface–subsurface flows in porous media and saturated zones were solved using the control volume finite-element method. Nonlinear equations were linearized using the Newton–Raphson method and solved iteratively at each time step for the entire hydrological system (Hwang et al., 2014). The model employs Newton's method with a maximum of 12 iterations, specific convergence criteria, and an adaptive time-stepping scheme to ensure numerical stability. Overland flow is computed using the integrated finite-difference method with an under-relaxation factor for enhanced stability. The initial conditions for subsurface and surface flows were established by running the HGS model under steady-state conditions. Predefined groundwater and surface heads were used as the starting points for the transient simulation. Lateral boundaries were defined using specific node sets along the Havel River, representing flow exchange across these boundaries.
2.5.2 Evapotranspiration
The evapotranspiration process needs specific prerequisites for accurate parameterization as it is treated to play a dual role in the HGS as both a boundary condition and a distinct domain. Within this framework, the evapotranspiration fluxes encounter a restriction governed by a potential evapotranspiration flux (PET) which is defined by the modeler. The PET values are designated as a boundary condition, serving its purpose in the surface domain. With each subsequent time step, a condition emerges if the calculated AET surpasses the PET, and then the PET value is employed as a flux directed toward the relevant model faces. Conversely, if the calculated AET falls short of the PET, the computed AET value itself becomes the applied flux. Additional details on the evapotranspiration process formulations within the HGS model are presented in Kristensen and Jensen (1975). The 2-D PET database used in this research is calculated using the energy balance method and covers the period 2000–2022. The method is a balance of the energy terms, i.e., the net radiation, the change in the heat content of the lake, and the latent and sensible heat fluxes. The equation is based on measurements of the global radiation, air and water temperature, cloud cover, and vapor pressure. The latent heat flux, which represents the energy used for evaporation, was determined by subtracting the sensible heat flux and the change in the heat content of the lake from the net radiation. The evaporation rate was then calculated by dividing the latent heat flux by the latent heat of vaporization of water. A maximum evaporation threshold of 15 mm d−1 was set. More details are given in Ölmez et al. (2024).
The simulation domain encompasses the entire GGS catchment (Fig. 4) and is defined based on the surface topography considering the equipotential lines derived from the lakes' levels and measurements of the hydraulic head surrounding the lakes (piezometers). The surface topography across the catchment was produced by stitching a digital elevation model (DEM) from the Shuttle Radar Topography Mission (SRTM) with a resolution of 30 m and the bathymetry data of GGS (Wolter, 2010) and Lake Sacrow (SAS) (Lüder et al., 2006; Bluszcz et al., 2008). Due to the high vegetation density, flat elevations, and substantial hydraulic conductivity of the predominantly sandy soil, the absence of river formation is currently observed in the catchment. The foundational 2-D triangular mesh supporting the comprehensive 3-D triangular prism grid within the HGS model was created using AlgoMesh (Merrick, 2017). Each 2-D mesh layer encompasses a total of 2837 mesh nodes and 5300 triangular finite elements (Fig. 4). The complete 3-D model (Fig. 4) grid extends the 2-D mesh across 15 subsurface layers, broadly categorized as 1 soil layer, 14 Quaternary material layers, and 1 competent bedrock layer (Rupel clay).
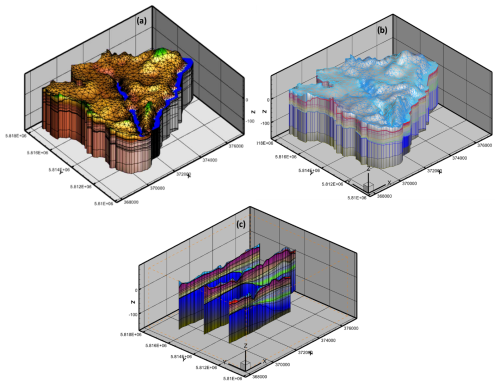
Figure 4The locations of Lake Groß Glienicke and the Havel River, along with an enlarged view of the mesh within the catchment, highlighting mesh quality and topography (Fig. 4a); representation of the stratigraphic layers (Fig. 4b); and the zonation, illustrating different characteristics and parameterization, along with various west-east cross-sections (Fig. 4c).
Spatially distributed land cover data (Fig. 1) were utilized to capture a broad range of factors influencing evapotranspiration and overland flow, including evaporation depth, root depth, leaf area index (LAI), surface roughness, rill storage height, and obstruction storage height. Specific parameters for evapotranspiration (ET) and overland flow are tailored to each land cover type. To accurately reflect the impact of vegetation growth on water demand through evapotranspiration, the LAI during winter (January) and summer (July) using the Sun Sacan device type SS1 was measured, capturing both maximum and minimum current LAI values. The measured LAI indices were then compared with data from the MCD15A2H Version 61 Moderate Resolution Imaging Spectroradiometer (MODIS), which provides a 4 d composite with a pixel size of 500 m for January and July (Myneni et al., 2021). Corrected monthly average MODIS LAI values for each land cover type, spanning from 2000 to 2023, were subsequently integrated into the HGS model. In the HGS model, ET combines plant transpiration and evaporation, affecting both surface and subsurface flows. Plant transpiration within the root zone depends on LAI, nodal moisture content (θ), and a root distribution function (RDF) applied to a defined extinction depth. Depth-dependent evaporation is modeled using a quadratic depth decay function, allowing for greater root distribution in the upper soil layers compared to the lower ones.
2.5.3 Unsaturated zone
The top subsurface layer in the 3-D mesh with spatial varying depths shows the distribution of soil materials across the catchment. The soil data were obtained from the soil map at a scale of 1:200 000 (BUEK200), which was prepared by the Federal Institute for Geosciences and Natural Resources (BGR, 2007). The soil samples were collected from various depths, extending up to 3 m, at 10 different sites, primarily in the groundwater recharge area (Döberitzer-Heide region) and natural conservation zones. The sampling locations were selected based on soil types. The percentages of sand, silt, and clay for each soil type were determined in the laboratory to classify the soil textural types, using the United States Department of Agriculture (USDA) soil textural calculator. A set of two soil textural types – sand and loamy sand – has been recognized. Unsaturated soil hydraulic parameters and soil moisture retention properties required for the van Genuchten application with the HGS model were uniquely estimated for each soil type using the ROSETTA program, version 1 (Schaap et al., 2001).
To represent the topography of the subsurface in the lake's catchment, relevant data were extracted from the groundwater model provided by Berliner Wasserbetriebe (BWB, Berlin Water). This model (FEFLOW software) was calibrated in 2012 and updated in 2013 (BWB, 2013, unpublished) using measured data from the year 2010. The model focuses on analyses of the waterworks at Beelitzhof, Tiefwerder, and Kladow, covering areas along both banks of the Havel River. Additional datasets from boreholes were merged into a single surficial geology dataset using the Rockware model setup for the GGS catchment. The initial hydraulic conductivity values for each type of Quaternary material were taken from the FEFLOW model. The hydraulic properties of the unsaturated zone were adjusted during manual model calibration.
2.5.4 Groundwater–lake level loggers
A total of eight groundwater monitoring wells scattered within the catchments, along with two loggers set on the lakes, provide a spatially well-distributed dataset of groundwater–lake level dynamics for evaluating model simulations. The groundwater monitoring wells were selected based on location, catchment area, and data availability from 2000 to 2023. GGS has been monitored since 1964. Moreover, within the study catchment, the regulated flow system of the Havel River is maintained to facilitate water conveyance. Since 1980, an established logger has been operational for meticulously monitoring the water level dynamics within this river. For the presented study, particular interest lies in logger nos. 51, 52 (WD-GGS and WS-GGS), and 3154 (E-GGS). WD-GGS (50) and WS-GGS (51) belong to two different aquifers (shallow (WS-GGS) and deep (WD-GGS) aquifers) and are situated on the western side of GGS (Brandenburg, Fig. 3). These loggers in the recharge area of GGS consistently maintain water levels averaging 15–20 cm higher than GGS. Additionally, a longer E-GGS, located close to the eastern shoreline downstream of GGS (Berlin), consistently registers water levels averaging 30–40 cm lower than GGS (Fig. 3).
2.5.5 Groundwater abstractions
Two major drinking water supply systems, Kladow and Beelitzhof, located alongside the Havel on the southwestern side of Berlin, have been in operation by BWB since 1888 and 1932, respectively. Kladow comprises 16 wells up to 93 m deep with a maximum pumping rate of 30 000 m3 d−1, while Beelitzhof has 85 wells up to 170 m deep and a maximum pumping rate of 160 000 m3 d−1. To assess the impact of groundwater withdrawals from deeper layers, the model domain was extended to a depth of 150 m below sea level. According to studies by BWB, approximately 80 %–90 % of the water extracted by Kladow originates from bank filtration along the Havel River. The remaining 10 %–20 % of the extracted water originates directly from groundwater recharge as well as outflow from GGS. The Kladow waterworks were implemented directly as a well gallery in the HGS model. As various water resources contribute to the overall drinking water production in the main waterworks in this area (Beelitzhof, located on the western side of the Havel), a detailed analysis was conducted to assess the share of the GGS catchment. The analysis involved the implementation of distinct scenarios within the hydrological model.
2.5.6 Groundwater contribution to Lake Groß Glienicke
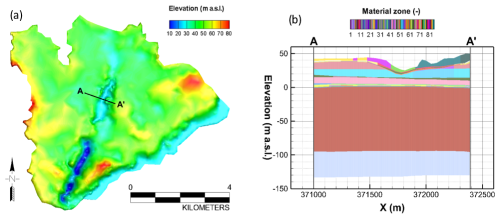
To calculate the groundwater contribution to GGS and identify which specific geological layers (aquifers) contribute, a cross-sectional model was constructed along the A–A' line in the GGS catchment model (Fig. 5a). The cross-sectional model spans approximately 1.2 km in length and primarily covers the lake, along with its upstream and downstream peripheries. As the primary groundwater flow in the model is nearly normal to GGS, horizontal flow towards the lake (i.e., normal to GGS) was considered, while lateral flow (i.e., parallel to GGS) was limited. The GGS cross-sectional model, which measures 1233 m × 1 m × 175 m, depicts various subsurface material zones with relatively thin layers above 0 m a.s.l. and two homogeneous zones with thicknesses of 30 m and 100 m below 0 m a.s.l. (Fig. 5b). Regarding the discretization of the cross-sectional model, the vertical layers are the same as those in the GGS model, but the horizontal meshes were refined to a 1 m distance. The locations and material properties of the cross-sectional model match those of the GGS model exactly.
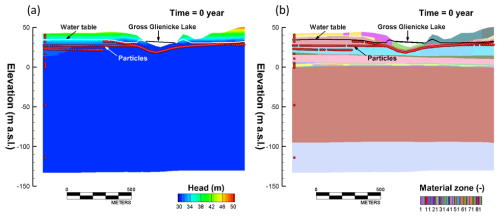
Particle-tracking simulations were performed using the cross-sectional model based on steady-state flow conditions, using the initial conditions applied in the GGS model (Fig. 6). The groundwater flow direction is from the left to right sides of the domain (Fig. 6a). Particles were initially placed horizontally 2 to 10 m below the water table, primarily within aquifer 2 (Fig. 6). Additionally, particles were vertically assigned along the main material layers on the left side of the domain, including both saturated and unsaturated zones (Fig. 6). The particle-tracking simulation was performed for 400 years.
2.5.7 Model evaluations
This study emphasizes the importance of a multifaceted approach to evaluate hydrological model performance, utilizing both traditional and innovative methodologies. Initially meant to evaluate model performance, the simulated seasonal and long-term groundwater and lake level fluctuations will be compared to observed water levels of the lakes and piezometers around the lakes. The performance evaluation of hydrological models commonly relies on various metrics such as percent bias (PBIAS), root mean squared error (RMSE), and Kling–Gupta efficiency (KGE). KGE, introduced by Gupta et al. (2009), offers a comprehensive assessment by considering bias, correlation, and variability separately. Given the specific hydrological focus of each metric, a multi-metric approach was adopted to calibrate the HGS model parameters, as demonstrated to efficiently balance model performance by previous studies (Pfannerstill et al., 2014; Mahmoodi et al., 2020). For model assessment, PBIAS, RMSE, and KGE were employed as performance metrics on a monthly basis. Calibration runs were evaluated based on a predefined threshold for KGE (0.5) to identify the most suitable configurations. The calibration process was carried out manually due to the long execution time and limited computational capacity. Emphasis was placed on calibrating model parameters of the unsaturated zone which governs water movement into the soil and subsequently into or out of the aquifer. The initial hydraulic conductivity values for each type of soil were determined from the existing literature (Steidl et al., 2023), laboratory analysis, and later manual adjustment during model calibration. The model parameterization for the saturated zone was initially derived from the FEFLOW model calibrated by the Berliner Wasserbetriebe (BWB, 2013, unpublished). The calibration and validation periods chosen for the simulation runs were 2008–2018 and 2019–2023, respectively, preceded by an 8-year spinup phase before 2008 to reach a quasi-steady-state condition fitting the conditions in 2008.
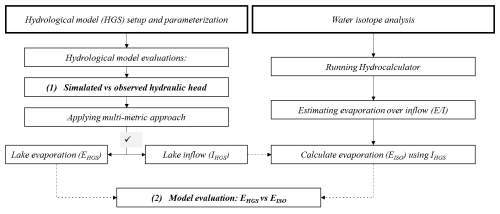
To evaluate the performance of the HGS model from different angles, a detailed assessment involving the simulation of the inflow to GGS (denoted as IHGS) was undertaken. This parameter (IHGS) was subsequently used as a testing parameter to evaluate the model performance in calculating evaporation rates for the years 2022 and 2023 using an isotopically derived ratio. The evaporation rate (EISO; m) can be expressed as
where A is the area of the lake water body (m2), IHGS represents the total annual inflow to the lake (m3), and P is the percentage of losses of inflow due to evaporation (given as a fraction) derived from the isotope analysis (). In this approach, seasonal variations in inflow and evaporation are not considered explicitly. Instead, only the annual water balance, based on annual isotopic dynamics (dilution and enrichment), is accounted for. Figure 7 shows the methodology used to evaluate the model performance across different dimensions. The underlying assumption for this evaluation is that an accurate simulation of inflow to the lake by the HGS model (IHGS) would yield evaporation rates (EISO) comparable to those calculated by the HGS model (EHGS). Thus, the consistency between evaporation calculations derived from both approaches serves as a validation of the HGS model's capability to simulate other water balance components precisely.
The inflow and subsequent evaporation rates for the years 2022 and 2023 captured well by the HGS model allow us to extend this approach for estimating evaporation during the earlier period from 2015 to 2021. This period is crucial as it encompasses years without water isotope analyses, during which significant drops in lake water and groundwater levels were observed. Since direct isotope-based evaporation calculations were only available for 2022–2023, applying the same ratio to earlier years would be inaccurate due to interannual variations in temperature and inflow, which directly influence isotopic signatures through dilution and enrichment. Therefore, to extend the isotope-based method to years without measured isotope data (2015–2021), we adjusted the ratio to account for these variations. This adjustment does not imply an issue with the HydroCalculator calculations but rather ensures that the ratio is consistent with the specific hydrometeorological conditions of each year.
To make these adjustments, we calculated yearly temperature and inflow ratios relative to the 2022–2023 reference period as follows:
-
The temperature ratio (TYxY22-23) accounts for differences in evaporation potential, where higher temperatures lead to greater evaporation and isotopic enrichment.
-
The inflow ratio (IY2023IYx) accounts for changes in dilution effects, where lower inflow results in stronger isotopic enrichment.
The adjusted ratio for each year (Yx) was calculated as
-
If a year (Yx) was warmer than 2022–2023, the higher evaporation led to greater enrichment, increasing .
-
If inflow (IYx) was lower than in 2022–2023, reduced dilution also led to greater enrichment, further increasing .
These adjusted ratios were then used to calculate lake evaporation for 2015–2021, allowing comparison with the HGS model calculations. This approach ensures that evaporation calculations for years without isotope data remain physically consistent with known hydrological conditions.
3.1 Isotopic analysis
Alterations in the mean monthly isotope compositions of lake water and groundwater, along with air temperature and precipitation data from August 2022 to August 2023, are presented in Fig. 8. The δ2H values for GGS (Fig. 8a) show significant variability, with a pronounced drop in δ2H values from around −8 ‰ in August 2022 to −17 ‰ in January 2023, followed by a gradual decrease (except for February) to approximately −16 ‰ by June 2023, which represents a strong dilution phase. The period from July to September demonstrates enriched values of δ2H alongside rising temperature and evaporation as a consequence. The δ18O values for GGS (Fig. 8b) record a fluctuating pattern, ranging from −0.27 ‰ to 1.4 ‰, with peaks observed in August 2022 and July 2023, but they experienced noticeable drops in April and May 2023. Overall, the isotope data indicate that GGS experiences great isotopic enrichment (heavier isotope composition) during summer, when evaporation is higher (Fig. 8g).
The δ2H values of groundwater on the eastern side of GGS (E-GGS, Fig. 8c) range from approximately −40 ‰ to −50 ‰, with notable fluctuations throughout the year. The isotope composition of groundwater on the western side of GGS (W-GGS, Fig. 8c) has less variability, with δ2H values mostly remaining between −55 ‰ and −60‰, suggesting a rather stable isotopic environment. Despite the fluctuations in δ2H values, the δ18O values (Fig. 8d) show less variation, indicating some isotopic stability of oxygen isotopes in the groundwater of both sides of the lake. E-GGS presents a relatively stable trend with δ18O values fluctuating between −5 ‰ and −6 ‰. W-GGS, with a seasonal pattern similar to E-GGS, shows a consistent range of δ18O values between −8 ‰ and −8.5‰, with minimal fluctuations (Fig. 8d). Overall, E-GGS with heavier isotopic signatures experiences greater isotopic variability. Meanwhile, the W-GGS site maintains a more consistent isotopic signature indicative of a more stable hydrological regime. These observations (Fig. 8a, b, c, and d) indicate that the isotope composition of both lake water and groundwater (E-GGS) was generally heavier (stronger enrichments) during the summer of 2022 compared to the summer of 2023.
The monthly average temperature (TMP, Fig. 8e) follows a clear seasonal pattern. It drops from around 20 °C in August 2022 to a low of 5 °C in January 2023 and then rises again to about 20 °C by July 2023. Alongside temperature, precipitation values fluctuate significantly, with peaks exceeding 90 mm in August 2022 and June 2023 and lower values around 20 mm observed in October and November 2022 and May and September 2023.
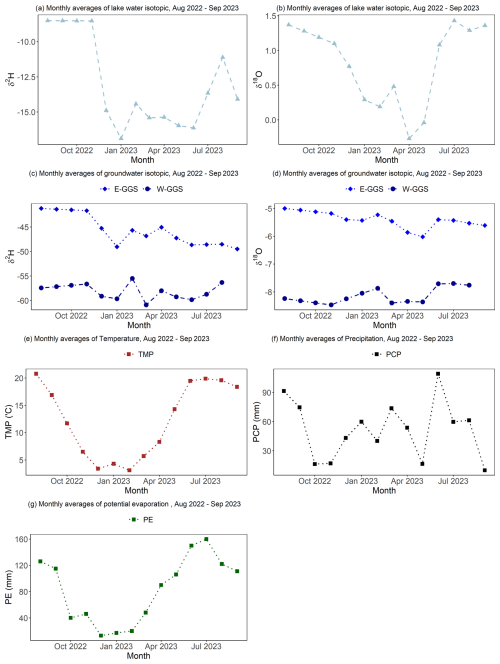
Figure 8Monthly averages of lake water isotope compositions (a: δ2H; b: δ18O), groundwater isotope compositions (c: δ2H; d: δ18O), temperature ((e)), precipitation ((f)), and evaporation from the lake (energy balance method) data from August 2022 to September 2023 ((g)).
The relationships between δ2H and δ18O values for lake water and groundwater (W-GGS and E-GGS) from August 2022 to September 2023 are illustrated in Fig. 9. The isotopic values for lake water are significantly clustered, with δ2H values between −25 ‰ and −5 ‰ and δ18O values between 2 ‰ and −2 ‰, and they are isotopically heavier compared to precipitation and groundwater, suggesting significant evaporative enrichment. W-GGS exhibits δ2H values from −50 ‰ to −65 ‰ and δ18O values from −9 ‰ to −7‰. E-GGS δ2H values range from approximately −50 ‰ to −40 ‰, with δ18O values between −7 ‰ and −5‰, indicating less enrichment compared to lake water and higher enrichment compared to the groundwater on the western side.
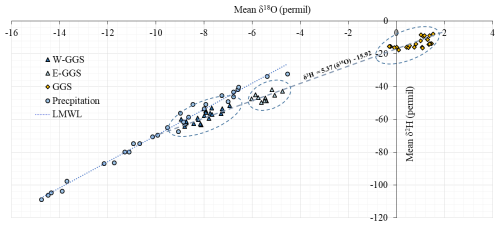
Figure 9Isotope composition of lake water and groundwater measured on the western (W-GGS) and eastern (E-GGS) sides of GGS from August 2022 to September 2023. The local meteoric water line (LMWL) is from GNIP/Berlin (DWD, BFG, BGR, and HHZM; Stumpp et al., 2014).
Variables used for the calculation of evaporative losses and calculated for GGS during the August 2022–September 2023 period are presented in Table 2. The winter water isotope compositions (dilution phase) served as the initial sampling point for calculating the ratio in both 2022 and 2023. The δA value of the ambient air moisture was calculated based on the stable isotope composition of local precipitation sampled in the Groß Glienicke region and on the Lankwitz campus of the Freie Universität Berlin. The calculated evaporative losses over inflow were equal to 43.4 % and 42.3 % based on δ2H and 30.11 % and 29.4 % based on δ18O in 2022 and 2023, respectively. The ratio calculated based on δ2H is around 12 % higher compared to the based on δ18O. Therefore, as a mean ratio, an average of 37 % will be used for further analyses.
3.2 Hydrological modeling and model evaluations
Figure 10 illustrates the simulated and observed hydraulic heads (meters above sea level: m a.s.l.) at W-GGS, GGS, and E-GGS over the period from January 2008 to December 2023. The model's performance is evaluated using several metrics, including KGE, PBIAS, and RMSE, as shown in Table 3. A strong alignment is evident between the simulated and observed hydraulic heads in terms of both magnitude and seasonality.
The simulated groundwater levels on the western side of the lake, despite some overestimations and underestimations, showed very good agreement with the observed data. For the calibration period (2008–2018), the performance metrics are a KGE of 0.86, PBIAS of 0.0 %, and RMSE of 0.13 m. During the validation period (2019–2023), the model maintained high performance with a KGE of 0.82, PBIAS of −0.1 %, and RMSE of 0.07 m. Both the observed and simulated data exhibit a general declining trend over the study period, with hydraulic heads decreasing from approximately 30.15 to 30 m.
For GGS, similar to W-GGS, both observed and simulated values show a decreasing trend from around 31 m in 2008 to approximately 29.80 m in 2023. The model simulations closely follow the observed data, with minor deviations. The performance metrics for GGS during the calibration period are a KGE of 0.78, PBIAS of −0.2 %, and RMSE of 0.13 m. In the validation period, the metrics are a KGE of 0.75, PBIAS of 0.0 %, and RMSE of 0.06 m, indicating high accuracy in representing the hydraulic behavior of the lake.
The observed and simulated groundwater dynamics on the eastern side of GGS show good agreement. During the calibration period, the performance metrics are a KGE of 0.84, PBIAS of 0.1 %, and RMSE of 0.09 m. In the validation period, the metrics are a KGE of 0.70, PBIAS of 0.2 %, and RMSE of 0.09 m. Overall, the high-performance metrics confirm the model's reliability and accuracy in capturing both long-term trends and seasonal variations of groundwater–surface water dynamics within the study area, providing valuable insights into groundwater–surface water interactions.
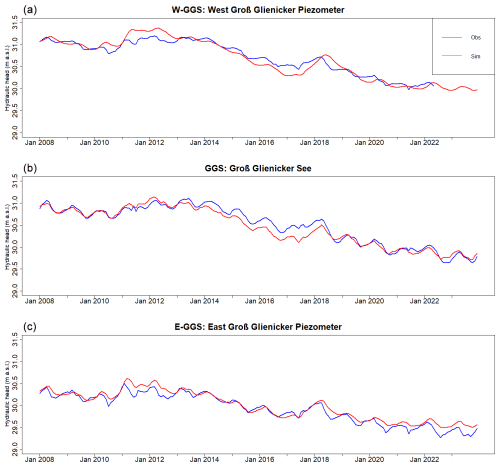
Figure 10Time series of observed and simulated hydraulic heads at three locations, i.e., (a) W-GGS, (b) GGS, and (c) E-GGS, from January 2008 to December 2023.
Table 3Model performance evaluation using several metrics for both the calibration (2008–2008) and validation (2018–2023) periods.

Particle-tracking results indicate that groundwater–lake interactions primarily occur within the top nine geological layers, consisting of alternating aquifers and aquitards. Over 1 to 10 years, most particles near the water table move vertically, indicating a relatively highly permeable layer (Fig. 11a, b). However, particles below the lake do not exhibit similar movement patterns compared to those farther from the lake due to the groundwater flow directions towards the lake and their locations in a less conductive layer. During the simulation period from 30 to 100 years, as shown in Fig. 11c–e, the vertical travel distance increases, with some particles moving along the thin aquitard layers consisting of till located around 0 to 5 m a.s.l. (see Fig. 11), before continuing downwards into the layers below the aquitard. From 200 to 400 years, as shown in Fig. 11f–h, most particles in the aquitard layer reach the lake, while the remaining particles move along the bedrock layer.
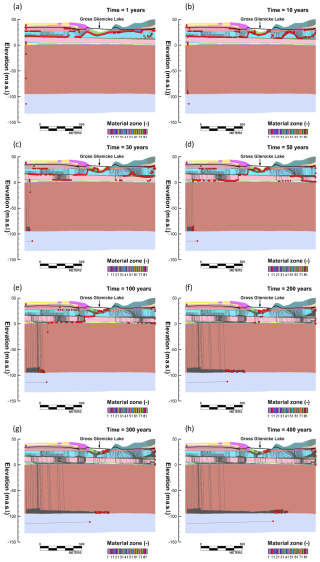
Figure 11Spatiotemporal locations of particle-tracking simulation results: (a) 1 year, (b) 10 years, (c) 30 years, (d) 50 years, (e) 100 years, (f) 200 years, (g) 300 years, and (h) 400 years. Red circles represent particles, and dark-gray lines represent trace lines of particles.
The calculated annual water exchange for GGS from 2008 to 2023, detailing the inflow to the lake, outflow from the lake, and their differences (net flow = inflow − outflow), is presented in Fig. 12. The inflow to GGS demonstrates substantial annual variability. For instance, years such as 2008, 2011, 2012, and 2018 show relatively higher inflows compared to other years. Notably, there is a discernible decreasing trend in inflow from 2011 to 2021, with 2018 being an exception. This trend indicates a progressive reduction in the hydrological inputs to the lake over the decade. Simultaneously, the outflow from GGS shows significant annual variability, with the highest outflow occurring between 2012 and 2017. This increased outflow, coupled with the decreasing inflow, points to a period of significant net water loss for GGS, potentially impacting the lake's water levels. Positive net flow values in 2011, 2018, and 2022 indicate years when inflow exceeds outflow, contributing to the lake's water gain. Variation in both water gain and loss over the study period reflects the complex interplay of natural hydrological processes governing the lake's water balance.
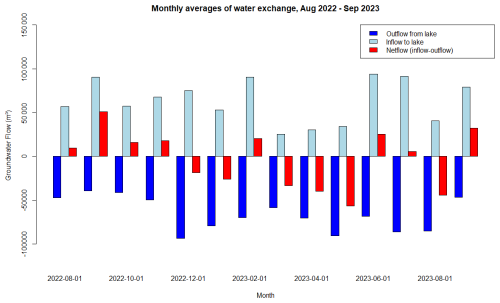
Figure 13 illustrates the water exchange dynamics of GGS over the period from August 2022 to September 2023, highlighting seasonal patterns in inflow, outflow, and net flow. During the warmer months, particularly June and July, the inflow to the lake peaks at approximately 90 000 m3, indicating a significant increase in water input during this period. Of the summer months (July to September), August has the lowest amount of inflow, with an average of approximately 40 000 m3. In contrast, the inflow is pronouncedly lower during the months of March, April, and May, averaging around 20 000 m3. The lake experiences positive net flow, reflecting water gain during June and July. From December to May (except February), the net flow is predominantly negative, indicating that the outflow exceeds the inflow. During these months, the lake loses water, with the outflow reaching its highest levels.
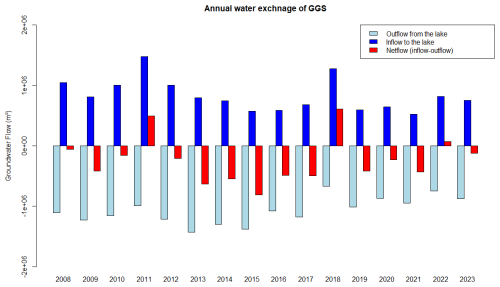
Figure 12Annual water exchange of GGS from 2008 to 2023, showing the inflow to the lake, outflow from the lake, and net flow (outflow − inflow).
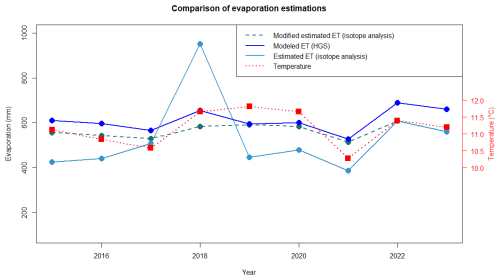
To compare the lake evaporation values calculated by the HGS model and the results of the isotopic signature of lake water actual evaporation (E), GGS for the years 2022 and 2023 was calculated using Eq. (12), which incorporates simulated annual water inflow into GGS (IHGS) from the HGS model and the ratio derived from isotope analysis (mean ratio: 37 %). These results were compared to the evaporation rates from GGS simulated by the HGS model (Fig. 14). The annual evaporation calculations from the isotope analysis for the years 2022 and 2023 show good agreement. The values calculated by the HGS model (EHGS) are slightly lower (around 80 mm). The general agreement between the evaporation rates simulated by the HGS model and the values derived from the isotope approach indicates accurate inflow simulations by the HGS model. Transferring the ratios from 2022 and 2023 to calculate evaporation for earlier years (2015–2021, Fig. 14) results in notable discrepancies that are particularly evident in 2015 and 2018, when evaporation reaches 450 and 1000 mm, respectively, compared to EHGS values of 590 and 614 mm for those years. However, modified isotope analysis (considering annual variations in inflow and temperature; see Eq. 13) demonstrates good agreement with the HydroGeoSphere model, emphasizing our approach of incorporating temperature and inflow data for accurate evaporation predictions for earlier years. This suggests that, while the ratio obtained from 2022 and 2023 can be applied to calculate evaporation in previous years, adjustments for differences in inflow and temperature between those years and 2022–2023 are crucial for enhanced estimations of evaporations in years without isotope analysis ().
The comparison of actual evaporation (E) from GGS for 2022 and 2023, derived from isotope analysis () and HGS model calculations, demonstrates the comparability of these methods. Despite slight differences in the results, likely due to the influence of direct precipitation with lighter isotope signatures diluting the lake water, the general consistency between the methods underscores the accurate simulation of inflows by the HGS model. Seasonal variations in water isotope compositions offer a valuable perspective for evaluating hydrological model simulations. Higher outflow observed from December 2022 to May 2023 provides insights into the dilution phase of groundwater isotope compositions on the eastern side of GGS during these months. Notably, GGS water isotopes reached their heaviest form in August 2023, contrasting with other summer months with similar temperatures and precipitation and suggesting lower inflow during that particular month as simulated by the HGS model.
This approach highlights the value of using isotope data to evaluate model simulations, providing a complementary angle to traditional methods. Considering the higher precipitation and warmer temperatures in the summer of 2022 compared to the summer of 2023, the isotope composition of both lake water and eastern groundwater was heavier during the summer of 2022. This indicates that isotopic “light” rainwater, which directly recharged the lakes in the summer of 2022, was insufficient to counterbalance the influence of the higher temperatures, resulting in a heavier isotope composition in the lakes. Despite the high precipitation in the summer of 2022, which would typically dilute the isotope signature of the lake, the higher temperatures (evaporation) led to an enrichment of the water isotopes. This phenomenon can be attributed to the large water body of the lake (approximately 4×10⁶ m3 considering the average water depth of 6.5 m reported by Wolter and Ripl (1999) compared to the rain amount of 0.05×10⁶ m3), where the relatively small volume of rainwater was not enough to significantly alter the isotope composition of the much larger lake volume. This is in line with the findings of the study by Vyse et al. (2020), where they discovered a more significant influence of rain on shallow water bodies compared to larger water bodies in the state of Brandenburg (northeastern Germany). The low impacts of rainwater on the isotope composition of the lake can also be interpreted as meaning that GGS is a groundwater-dominated lake with a very good hydraulic connection to the groundwater, which keeps the lake water fresh and diluted by providing a source of isotopically depleted water. This underscores the robustness of the isotopic approach against the variations of meteorological factors influencing the isotopic signature.
The isotopic differences between lake water and groundwater on both sides of GGS highlight the complex interactions and distinct hydrological processes occurring within the study area. Considering that the groundwater samples from the eastern and western sides of GGS belong to the same depth (9–10 m below the surface) and the same aquifer, the isotopically enriched groundwater on the eastern side can only be explained by a well-mixed interaction of lake water and groundwater in this area. This underlines the fact that GGS is a flow-through lake (Mahmoodi et al., 2023), a conclusion supported by the ratio being up to 37 % (i.e., a mean ratio) in 2022 and 2023. The ratio of GGS aligns with the ratio reported for wetlands and lake water bodies downstream of the Spree catchment showing similar climate conditions. In 2021, the ratio in this area was up to 34 % (Chen et al., 2023). Vyse et al. (2020) reported that the wetlands with lower landscape elevations located in northern Brandenburg typically had higher ratios than the ones with higher elevations. This is due to the hydrological function of small water bodies in the Pleistocene landscape. Higher wetlands have a more recharge or flow-through character, whereas lower positions show a discharge character. Moreover, Cluett and Thomas (2020) highlighted that the sensitivity of lake water isotopes to inflow and evaporation can vary significantly over time, influenced by regional hydroclimate (e.g., direct precipitation and humidity) and local hydrology (e.g., type of lake). The uncertainty in evaporative loss calculated using the code embedded in HydroCalculator is mainly due to uncertainties in the required inputs, temperature, and humidity, which can cause variations of up to 2 % (), according to Skrzypek et al. (2015). Despite these potential measurement variations, the calculated ratio for GGS provides a reliable estimate that aligns with known hydrological behaviors in similar regions.
For the period 2015–2021, evaporation calculations derived from the isotope analyses () of 2022 and 2023 generally show lower values compared to the HGS model's evaporation calculations, except for 2018. This year saw a strong inflow peak due to heavy rainfall events in the summer of 2017. This suggests that using the ratios from 2022 and 2023 for earlier years without adjustments can lead to significant inaccuracies. The modified isotope analysis (), which incorporates annual variations in inflow and temperature, shows better agreement with the HGS model evaporation calculations, especially in earlier years. This finding underscores the importance of including both temperature and inflow data for more accurate evaporation predictions. Comparing these results with previous studies, Herbst and Kappen (1999) reported evaporation from Lake Bornhöved, which covers 1.1 km2 in northern Germany and has a maximum depth of 26 m, to be around 650 mm for the years 1992–1995. The evaporation calculations for GGS from both the HGS model and the modified isotope analysis fall within a similar range reported by Herbst and Kappen (1999), suggesting that, despite differences in geographical and hydrological characteristics, the annual evaporation rates for German lowland lakes are comparable. These findings support the use of comprehensive, multifaceted approaches in hydrological studies to improve the precision of evaporation calculations and enhance water resource management.
This study has comprehensively addressed the challenge of accurate estimation of water balance components through the quantification of subsurface–groundwater inflow and evaporation losses to Lake Groß Glienicke (GGS) located in northeastern Germany. Through the combined use of the HydroCalculator isotopic mass balance model and the fully integrated HydroGeoSphere (HGS) hydrological model, a detailed understanding of the hydrological dynamics governing GGS was attained. The calculated evaporation rates derived from the isotopic mass balance model exhibit strong alignment with the actual evaporation rates calculated by the HGS model. This alignment underscores on the one hand the reliability and efficacy of the integrated hydrological modeling approach in predicting water balance components such as inflow to the lake in a complex hydrogeological setting. On the other hand, incorporating evaporation rate estimations given by isotope analysis corrected by temperature variations and historical inflows leads to an improvement in the inflow estimates, even for the years without measured isotope data. Despite inherent uncertainties associated with water isotope signature analyses, the integration of isotope data with hydrological modeling has provided valuable validation for the estimation of water balance components. Moving forward, this integrated approach holds promise for enhancing the robustness of hydrological models and facilitating more accurate assessments of water resources and ecosystem dynamics in similar lake environments.
All of the data (except for the data provided by Berliner Wasserbetriebe) used to process and set up the models will be available upon request. Data provided by Berliner Wasserbetriebe can be requested through a separate usage agreement with Berliner Wasserbetriebe. The atmospheric dataset from CER v2 is available from the Climatology Group at the Technical University of Berlin upon request
NM: data collection, fieldwork, HGS model setup, code development, model input–output analysis, writing (original draft, review, and editing). HTH: HGS model setup, model input–output analysis, writing (review and editing). US: isotopic laboratory analysis, writing (review and editing). MS: model input–output analysis, writing (original draft, review, and editing). CM: model input–output analysis, writing (original draft, review, and editing).
The contact author has declared that none of the authors has any competing interests.
Publisher's note: Copernicus Publications remains neutral with regard to jurisdictional claims made in the text, published maps, institutional affiliations, or any other geographical representation in this paper. While Copernicus Publications makes every effort to include appropriate place names, the final responsibility lies with the authors.
This investigation was funded by the Einstein Research Unit “Climate and Water under Change” of the Einstein Foundation Berlin and Berlin University Alliance (grant no. ERU-2020-609). We would like to thank Reinhard Hinkelmann, Franziska Tügel, and Can Ölmez from the Technical University of Berlin for providing the potential evaporation data. We would like to thank Gunnar Lorenzen and Bertram Monninkhoff (Berliner Wasserbetriebe) for providing us with the FEFLOW model as well as the actual data on the drinking water extraction rates around the Havel River. We are grateful to our colleague Dieter Scherer from the Technical University of Berlin for providing the atmospheric dataset from CER v2 and his rainwater sampling assistance, together with Patrick Zentel for his field and laboratory assistance. We sincerely thank Renée Brooks for her thoughtful review and insightful comments, which greatly improved the quality of this paper. AI tools (e.g., ChatGPT) were partly used to support the editing of this article.
This research has been supported by the Berlin University Alliance (grant no. ERU-2020-609).
This paper was edited by Markus Weiler and reviewed by J. Renée Brooks and one anonymous referee.
Ala-aho, P., Rossi, P. M., Isokangas, E., and Kløve, B.: Fully integrated surface–subsurface flow modelling of groundwater–lake interaction in an esker aquifer: Model verification with stable isotopes and airborne thermal imaging, J. Hydrol., 522, 391–406, https://doi.org/10.1016/j.jhydrol.2014.12.054, 2015.
Allison, G. B. and Leaney, F. W.: Estimation of isotopic exchange parameters, using constant-feed pans, J. Hydrol., 55, 151–161, https://doi.org/10.1016/0022-1694(82)90126-3, 1982.
Aquanty Inc.: HydroGeoSphere: A three-dimensional numerical model describing fully-integrated subsurface and surface flow and solute transport, Waterloo, Ontario, Canada, https://www.aquanty.com/hgs-download (last access: 15 December 2023), 2023.
Araguás-Araguás, L., Froehlich, K., and Rozanski, K.: Deuterium and oxygen‐18 isotope composition of precipitation and atmospheric moisture, Hydrol. Process., 14, 1341–1355, https://doi.org/10.1002/1099-1085(20000615)14:8<1341::AID-HYP983>3.3.CO;2-Q, 2000.
BGR (Federal Institute for Geosciences and Natural Resources): Soil map of Germany 1 : 200 000 (BÜK 200), Digital map data, Hannover, 2007.
Bluszcz, P., Kirilova, E., Lotter, A. F., Ohlendorf, C., and Zolitschka, B.: Global radiation and onset of stratification as forcing factors of seasonal carbonate and organic matter flux dynamics in a hypertrophic hardwater lake (Sacrower See, Northeastern Germany), Aquat. Geochem., 14, 73–98, https://doi.org/10.1007/s10498-008-9026-3, 2008.
Chen, K., Tetzlaff, D., Goldhammer, T., Freymueller, J., Wu, S., Smith, A. A., Schmidt, A., Liu, G., Venohr, M., and Soulsby, C.: Synoptic water isotope surveys to understand the hydrology of large intensively managed catchments, J. Hydrol., 623, 129817, https://doi.org/10.1016/j.jhydrol.2023.129817, 2023.
Cluett, A. A. and Thomas, E. K.: Resolving combined influences of inflow and evaporation on western Greenland lake water isotopes to inform paleoclimate inferences, J. Paleolimnol., 63, 251–268, https://doi.org/10.1007/s10933-020-00114-4, 2020.
DWD: Historical Daily Station Observations (Temperature, Pressure, Precipitation, Sunshine Duration, etc.) for Germany, Version v21.3, (DWD), D.W., Ed. Offen- 85 bach, 2024, https://opendata.dwd.de/climate_environment/CDC/observations_germany/climate/daily/ (last access: 5 January 2024), 2024.
Fekete, B. M., Gibson, J. J., Aggarwal, P., and Vörösmarty, C. J.: Application of isotope tracers in continental scale hydrological modeling, J. Hydrol., 330, 444–456, https://doi.org/10.1016/j.jhydrol.2006.04.029, 2006.
Gat, J. R.: Properties of the isotopic species of water: the “isotope effect”. Stable Isotope Hydrology, Deuterium and Oxygen-18 in the Water Cycle, IAEA Tech. Rep. Ser, 210, 7–19, 1981.
Gat, J. R. and Gat, J. R.: Isotope hydrology of inland sabkhas in the Bardawil area, Sinai, Limnol. Oceanogr., 23, 841–850, https://doi.org/10.4319/lo.1978.23.5.0841, 1978.
Gat, J. R.: Stable isotopes of fresh and saline lakes, in: Physics and chemistry of lakes, Springer Berlin Heidelberg, 139–165, https://doi.org/10.1007/978-3-642-85132-2_5, 1995.
Germer, S., Kaiser, K., Bens, O., and Hüttl, R. F.: Water balance changes and responses of ecosystems and society in the Berlin-Brandenburg region–a review, DIE ERDE – Journal of the Geographical Society of Berlin, 142, 65–95, 2011.
Gerstengarbe, F. W., Badeck, F. W., Hattermann, F., Krysanova, V., Lahmer, W., Lasch, P., Stock, M., Suckow, F., Wechsung, F., and Werner, P. C.: Studie zur klimatischenEntwicklung im Land Brandenburg bis 2055 und deren Auswirkungenauf den Wasserhaushalt, die Forst- und Landwirtschaft sowie dieAbleitung erster Perspektiven. Report No. 83, Potsdam Institute for Climate Impact Research (PIK), 2003.
Gerstengarbe, F. W., Werner, P. C., Österle, H., and Burghoff, O.: Winter storm-and summer thunderstorm-related loss events with regard to climate change in Germany, Theor. Appl. Climatol., 114, 715–724, https://doi.org/10.1007/s00704-013-0843-y, 2013.
Gibson, J. J. and Reid, R.: Stable isotope fingerprint of open-water evaporation losses and effective drainage area fluctuations in a subarctic shield watershed, J. Hydrol., 381, 142–150, https://doi.org/10.1016/j.jhydrol.2009.11.036, 2010.
Gibson, J. J. and Reid, R.: Water balance along a chain of tundra lakes: A 20-year isotopic perspective, J. Hydrol., 519, 2148–2164, https://doi.org/10.1016/j.jhydrol.2014.10.011, 2014.
Gonfiantini, R.: Environmental isotopes in lake studies, Handbook of environmental isotope geochemistry, 1986.
Gupta, P., Noone, D., Galewsky, J., Sweeney, C., and Vaughn, B. H.: Demonstration of high‐precision continuous measurements of water vapor isotopologues in laboratory and remote field deployments using wavelength‐scanned cavity ring‐down spectroscopy (WS‐CRDS) technology, Rapid Commun. Mass Sp., 23, 2534–2542, https://doi.org/10.1002/rcm.4100, 2009.
Herbst, M. and Kappen, L.: The ratio of transpiration versus evaporation in a reed belt as influenced by weather conditions, Aquat. Bot., 63, 113–125, https://doi.org/10.1016/S0304-3770(98)00112-0, 1999.
Herrera, P. A., Marazuela, M. A., and Hofmann, T.: Parameter estimation and uncertainty analysis in hydrological modeling, WIRES Water, 9, e1569, https://doi.org/10.1002/wat2.1569, 2022.
Horita, J. and Wesolowski, D. J.: Liquid-vapor fractionation of oxygen and hydrogen isotopes of water from the freezing to the critical temperature, Geochim. Cosmoch. Ac., 58, 3425–3437, https://doi.org/10.1016/0016-7037(94)90096-5, 1994.
Hwang, H.-T., Park, Y.-J., Sudicky, E. A., and Forsyth, P. A.: A parallel computational framework to solve flow and transport in integrated surface–subsurface hydrologic systems, Environ. Modell. Softw., 61, 39–58, https://doi.org/10.1016/j.envsoft.2014.06.024, 2014.
Jafari, T., Kiem, A. S., Javadi, S., Nakamura, T., and Nishida, K.: Using insights from water isotopes to improve simulation of surface water-groundwater interactions, Sci. Total Environ., 798, 149253, https://doi.org/10.1016/j.scitotenv.2021.149253, 2021.
Jänicke, B., Meier, F., Fenner, D., Fehrenbach, U., Holtmann, A., and Scherer, D.: Urban-rural differences in near-surface air temperature as resolved by the Central Europe Refined analysis (CER): sensitivity to planetary boundary layer schemes and urban canopy models, Int. J. Climatol., 37, 2063–2079, https://doi.org/10.1002/joc.4835, 2017.
Kristensen, K. J. and Jensen, S. E.: A model for estimating actual evapotranspiration from potential evapotranspiration, Hydrol. Res., 6, 170–188, https://doi.org/10.2166/nh.1975.0012, 1975.
Lahmer, W. and Pfützner, B.: Orts-und zeitdiskrete Ermittlung der Sickerwassermenge im Land Brandenburg auf der Basis flächendeckender Wasserhaushaltsberechnungen, PIK, 2003.
Liu, Y. and Gupta, H. V.: Uncertainty in hydrologic modeling: Toward an integrated data assimilation framework, Water Resour. Res., 43, W07401, https://doi.org/10.1029/2006WR005756, 2007.
Lüder, B., Kirchner, G., Lücke, A., and Zolitschka, B.: Palaeoenvironmental reconstructions based on geochemical parameters from annually laminated sediments of Sacrower See (northeastern Germany) since the 17th century, J. Paleolimnol., 35, 897–912, https://doi.org/10.1007/s10933-005-6188-5, 2006.
Mahmoodi, N., Kiesel, J., Wagner, P. D., and Fohrer, N.: Integrating water use systems and soil and water conservation measures into a hydrological model of an Iranian Wadi system, J. Arid Land, 12, 545–560, https://doi.org/10.1007/s40333-020-0125-3, 2020.
Mahmoodi, N., Merz, C., and Schneider, M.: Application of the stable isotope compositions of water for quantifying evaporative losses, A European vision for hydrological observations and experimentation, Naples, Italy, 12–15 Jun 2023, GC8-Hydro-94, https://doi.org/10.5194/egusphere-gc8-hydro-94, 2023.
Mayr, C., Lücke, A., Stichler, W., Trimborn, P., Ercolano, B., Oliva, G., Ohlendorf, C., Soto, J., Fey, M., Haberzettl, T., and Janssen, S.: Precipitation origin and evaporation of lakes in semi-arid Patagonia (Argentina) inferred from stable isotopes (δ18O, δ2H), J. Hydrol., 334, 53–63, https://doi.org/10.1016/j.jhydrol.2006.09.025, 2007.
Merrick, D.: AlgoCompute Cloud-Computing Platform, Canberra, HydroAlgorithmics Pty Ltd, Australia, 2017.
Merz, C. and Pekdeger, A.: Anthropogenic changes in the landscape hydrology of the Berlin-Brandenburg region, DIE ERDE – Journal of the Geographical Society of Berlin, 142, 21–39, 2011.
Müller Schmied, H., Eisner, S., Franz, D., Wattenbach, M., Portmann, F. T., Flörke, M., and Döll, P.: Sensitivity of simulated global-scale freshwater fluxes and storages to input data, hydrological model structure, human water use and calibration, Hydrol. Earth Syst. Sci., 18, 3511–3538, https://doi.org/10.5194/hess-18-3511-2014, 2014.
Myneni, R., Knyazikhin, Y., and Park, T.: MODIS/Terra leaf area index/FPAR 8-day L4 global 500m SIN grid V061, NASA EOSDIS Land Processes DAAC [data set], https://doi.org/10.5067/MODIS/MOD15A2H.061, 2021.
Ölmez, C., Tügel, F., and Hinkelmann, R.: Sinking Water Level of Groß Glienicker See – A Data-Based Model for Estimating the Water Balance, in: Day of Hydrology conference, Berlin, Germany, 19–21 March 2024, 2024.
Partington, D., Knowling, M. J., Simmons, C. T., Cook, P. G., Xie, Y., Iwanaga, T., and Bouchez, C.: Worth of hydraulic and water chemistry observation data in terms of the reliability of surface water-groundwater exchange flux predictions under varied flow conditions, J. Hydrol., 590, 125441, https://doi.org/10.1016/j.jhydrol.2020.125441, 2020.
Pfannerstill, M., Guse, B., and Fohrer, N.: Smart low flow signature metrics for an improved overall performance evaluation of hydrological models, J. Hydrol., 510, 447–458, https://doi.org/10.1016/j.jhydrol.2013.12.044, 2014.
Renard, B., Kavetski, D., Kuczera, G., Thyer, M., and Franks, S. W.: Understanding predictive uncertainty in hydrologic modeling: The challenge of identifying input and structural errors, Water Resour. Res., 46, W05521, https://doi.org/10.1029/2009WR008328, 2010.
Schaap, M. G., Leij, F. J., and Van Genuchten, M. T.: Rosetta: A computer program for estimating soil hydraulic parameters with hierarchical pedotransfer functions, J. Hydrol., 251, 163–176, https://doi.org/10.1016/S0022-1694(01)00466-8, 2001.
Schmidt, A., Frank, G., Stichler, W., Duester, L., Steinkop, T., and Stumpp, C.: Overview of tritium records from precipitation and surface waters in Germany, Hydrol. Process., 34, 1489–1493, https://doi.org/10.1002/hyp.13691, 2020.
Singh, V. P.: Hydrologic modeling: progress and future directions, Geoscience Letters, 5, 15, https://doi.org/10.1186/s40562-018-0113-z, 2018.
Skrzypek, G., Mydłowski, A., Dogramaci, S., Hedley, P., Gibson, J. J., and Grierson, P. F.: Estimation of evaporative loss based on the stable isotope composition of water using Hydrocalculator, J. Hydrol., 523, 781–789, https://doi.org/10.1016/j.jhydrol.2015.02.010, 2015.
Steidl, J., Gliege, S., Semiromi, M. T., and Lischeid, G.: Groundwater flow reversal between small water bodies and their adjoining aquifers: A numerical experiment, Hydrol. Process., 37, e14890, https://doi.org/10.1002/hyp.14890, 2023.
Stumpp, C., Klaus, J., and Stichler, W.: Analysis of long-term stable isotopic composition in German precipitation, J. Hydrol., 517, 351–361, 2014.
Tweed, S., Leblanc, M., and Cartwright, I.: Groundwater–surface water interaction and the impact of a multi-year drought on lakes conditions in South-East Australia, J. Hydrol., 379, 41–53, https://doi.org/10.1016/j.jhydrol.2014.05.034, 2009.
Viessman Jr., W. and Lewis, G. L.: Introduction to Hydrology, Harper Collins College Publishers, New York, 1996.
Vyse, S. A., Taie Semiromi, M., Lischeid, G., and Merz, C.: Characterizing hydrological processes within kettle holes using stable water isotopes in the Uckermark of northern Brandenburg, Germany, Hydrol. Process., 34, 1868–1887, https://doi.org/10.1002/hyp.13699, 2020.
Welhan, J. A. and Fritz, P.: Evaporation pan isotopic behavior as an index of isotopic evaporation conditions, Geochim. Cosmochim. Ac., 41, 682–686, https://doi.org/10.1016/0016-7037(77)90306-4, 1977.
Windhorst, D., Kraft, P., Timbe, E., Frede, H.-G., and Breuer, L.: Stable water isotope tracing through hydrological models for disentangling runoff generation processes at the hillslope scale, Hydrol. Earth Syst. Sci., 18, 4113–4127, https://doi.org/10.5194/hess-18-4113-2014, 2014.
Wolter, K. D.: Restoration of eutrophic lakes by phosphorus precipitation, with a case study on Lake Gross-Glienicker, Restoration of Lakes, Streams, Floodplains, And Bogs in Europe: Principles and Case Studies, 85–99, https://doi.org/10.1007/978-90-481-9265-6_7, 2010.
Wolter, K. D. and Ripl, W.: Successful restoration of Lake Gross-Glienicker (Berlin, Brandenburg) with combined iron treatment and hypolimnetic aeration. in: 8th International Conference on the Conservation and Managment of Lakes, Kopenhagen, Dänemark, 1999.


