the Creative Commons Attribution 4.0 License.
the Creative Commons Attribution 4.0 License.
 | 14 Aug 2025
Drought and salinity intrusion in the Lower Chao Phraya River: variability analysis and modeling mitigation approaches
Saifhon Tomkratoke
Siriwat Kongkulsiri
Pornampai Narenpitak
Sirod Sirisup
Saltwater intrusion in the Lower Chao Phraya River (LCPYR) is a significant national concern for Thailand, requiring a thorough understanding and the development of effective prediction systems for current and future management. This study investigates the key drivers influencing saltwater intrusion in the LCPYR. Cross-wavelet analysis was applied to examine the interactions between tidal forces, drought conditions represented by the rolling standardized discharge anomaly (RSDA) and rolling standardized precipitation anomaly (RSPA), and salinity levels. The results reveal that saltwater intrusion in the LCPYR is controlled by two interacting mechanisms: a drought-dependent mechanism and a drought-relaxation mechanism. The drought-dependent process, driven by regional hydro-climatic variability and quantified using the RSDA, dominates sub-annual to annual salinity fluctuations. Extreme salinity peaks are primarily modulated by non-tidal sea-level anomalies, underscoring the crucial influence of sea-level oscillations. In turn, the drought-relaxation mechanism, captured by the RSPA, reflects transient wet periods that can temporarily reduce salinity levels, at times weakening the usual correlation between salinity and hydrological drought severity. The numerical model demonstrates high accuracy in simulating both hydrodynamic and salinity behaviors, validating the cross-wavelet analysis and offering a reliable approach for modeling salinity in this complex estuarine system. We revise and suggest strategies to mitigate the salinity intrusion for emergent drought periods (e.g., optimal redistribution of the diverting freshwater) and proactive/long-term solutions, e.g., using impacts of urban runoff from tributary rivers and developing a robust prediction system. These findings offer essential insights to guide management strategies and the development of prediction tools for the LCPYR and surrounding regions.
- Article
(9451 KB) - Full-text XML
-
Supplement
(2148 KB) - BibTeX
- EndNote


The Lower Chao Phraya River (LCPYR; Fig. 1), a crucial segment of the Great Chao Phraya Basin (CPYB), serves as a vital artery for Bangkok and other major cities in central Thailand, providing essential water resources for various sectors. However, the river has increasingly been impacted by climate variability and growing human demand, leading to significant fluctuations in the freshwater required to sustain life, agriculture, and industry. Over the past decade, water scarcity in the LCPYR has become more frequent, while the demand for water continues to rise. This increasing demand is driven by industrial developments, large-scale agriculture, urbanization in Bangkok and the surrounding cities, and the country's economic growth. Recent drought events such as those in 2019 to 2021 have highlighted the escalating water scarcity in the CPYB. During the dry seasons, particularly in boreal winter, the LCPYR experiences critically low runoff due to reduced rainfall. Despite the limited water flow, substantial allocations are made for irrigation and raw water production, with additional losses attributed to evaporation and other uses. As a result, the river's flow diminishes to levels insufficient to maintain a river-dominated regime, turning the LCPYR into a tide-dominated regime instead. This shift allows saltwater from the Gulf of Thailand (GOT) to penetrate upstream, causing severe saltwater intrusion in the lower reaches of the river and affecting Bangkok and nearby provinces.
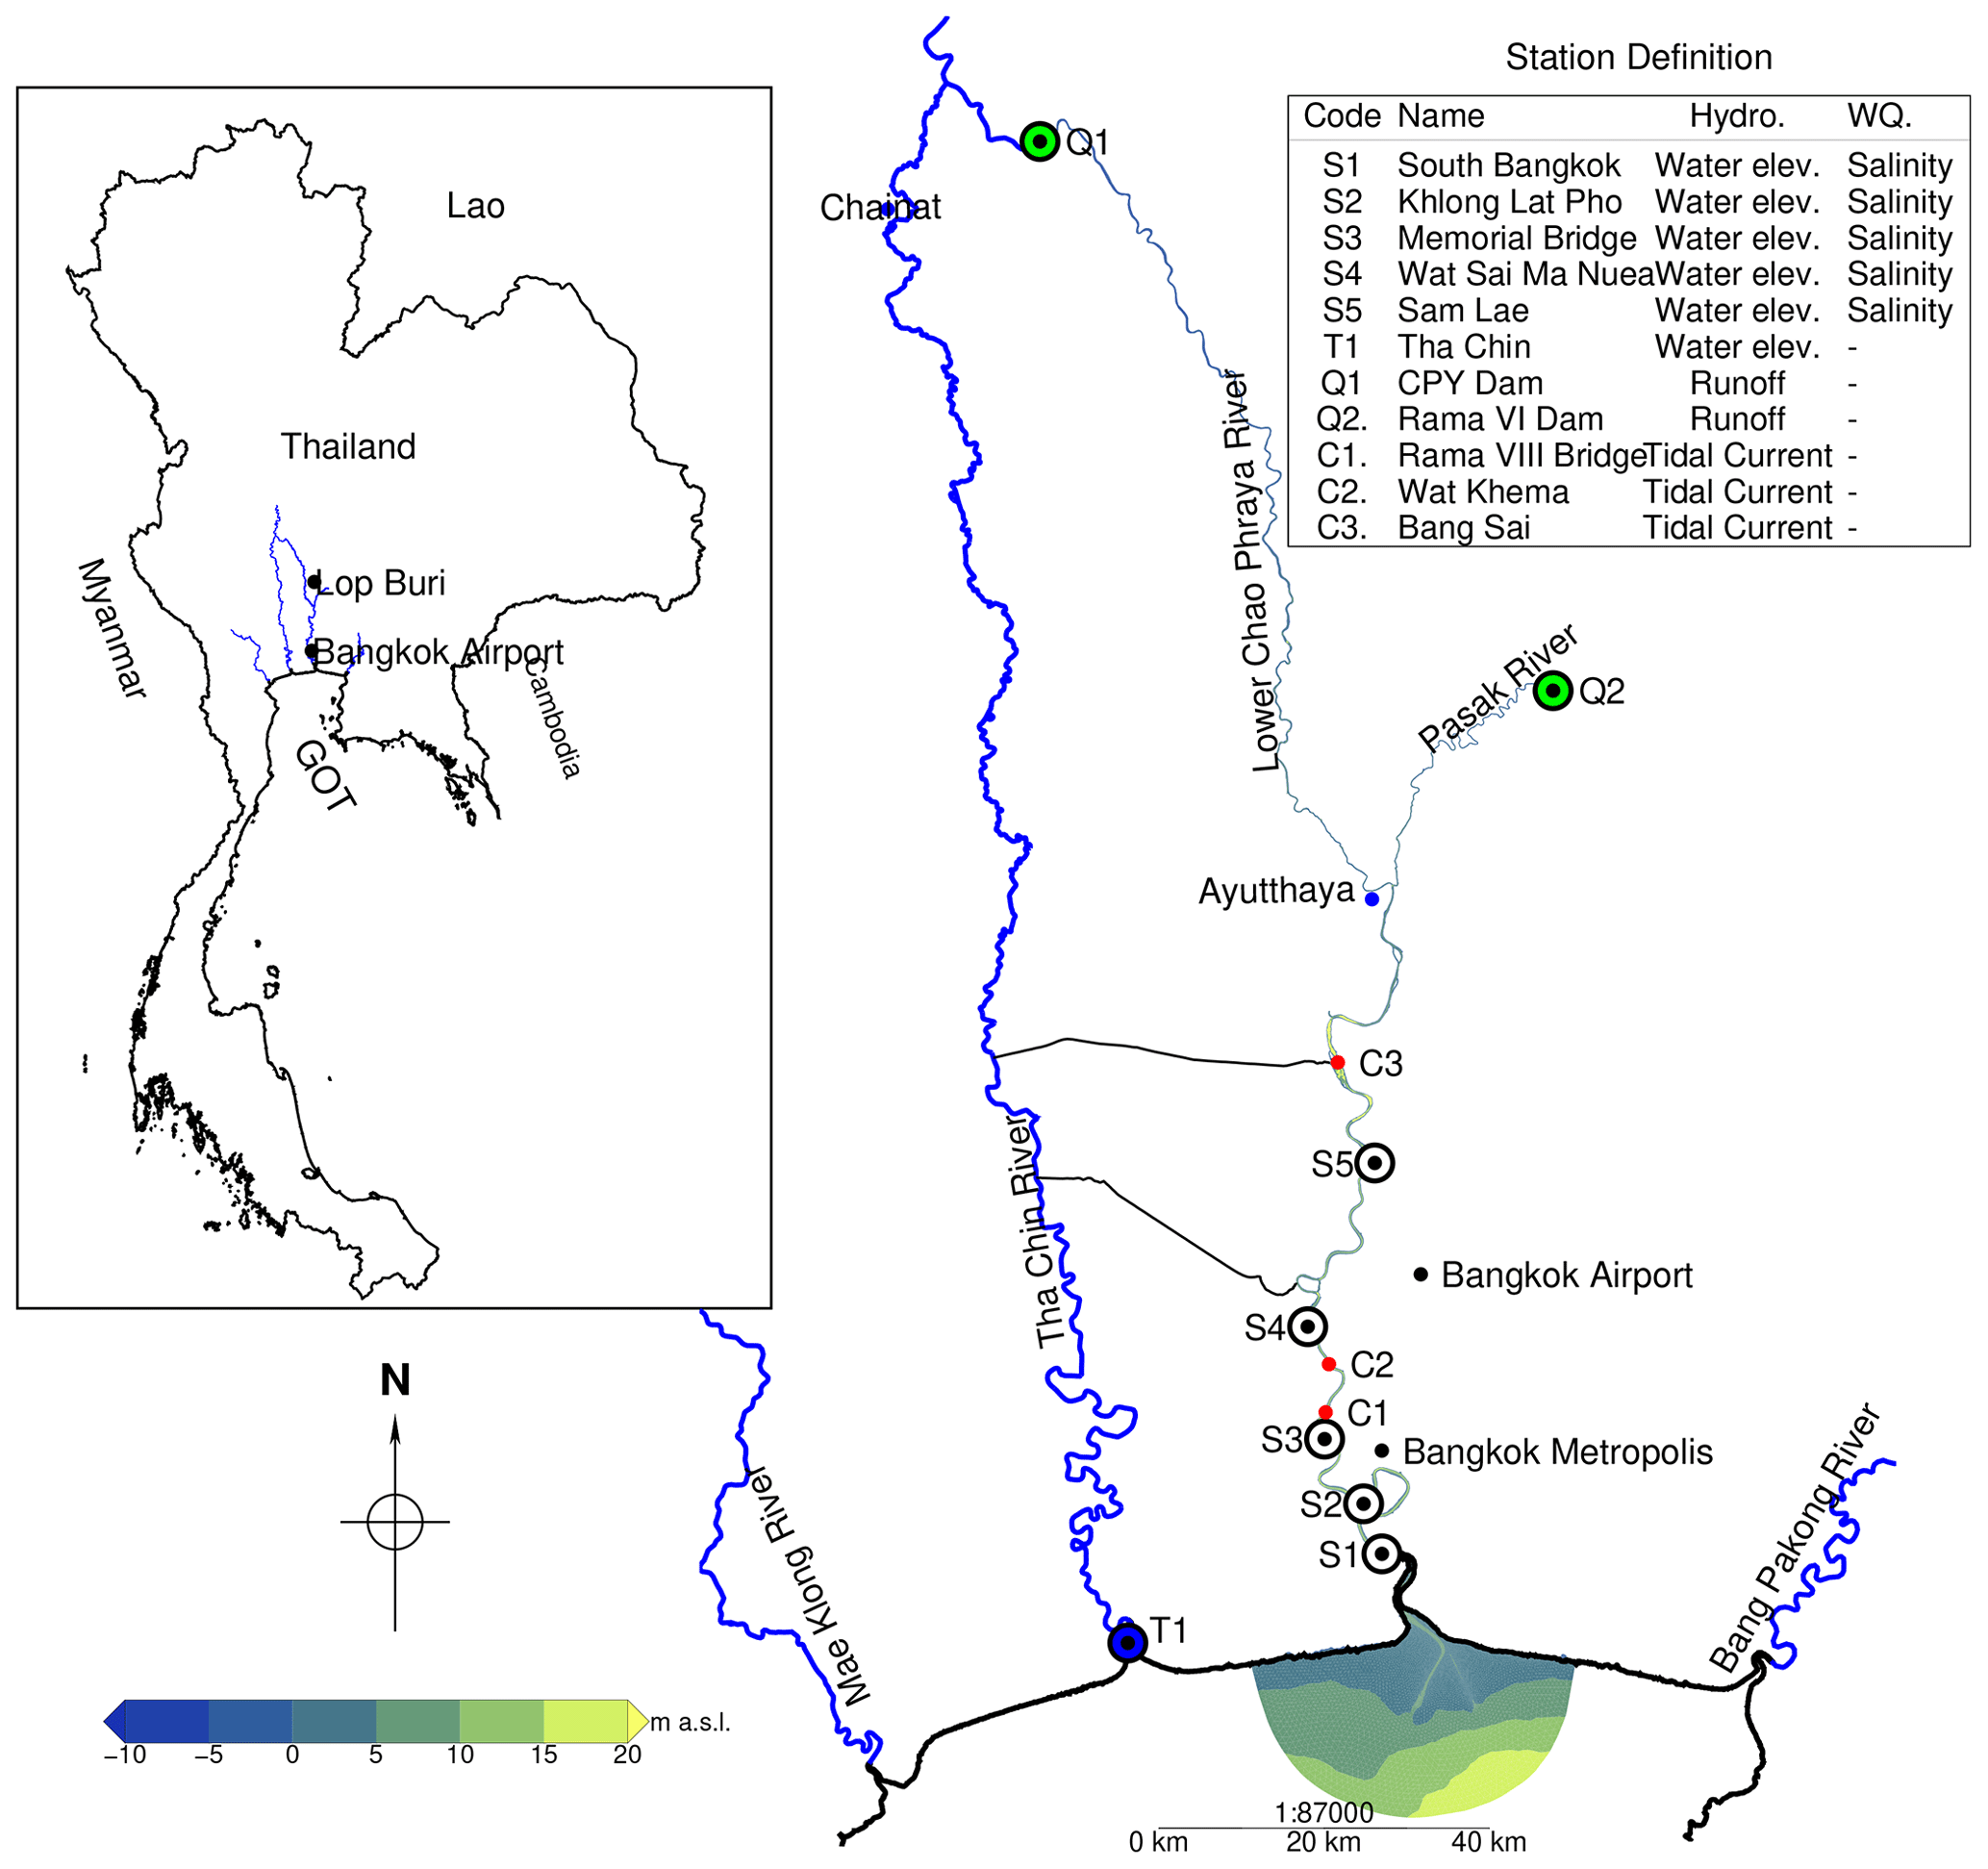
Figure 1Study area of the LCPYR. Main map: river network (blue), inner GOT shoreline, and shaded elevation (color bar, −10 to 20 (meters above sea level, m a.s.l.)). Bullseye markers mark observation sites; codes and data types are listed in the inset table. The black dots indicate rainfall stations monitored by the Thai Meteorological Department. A 40 km scale bar and north arrow give the distance and orientation. The inset map (upper left) locates the LCPYR within Thailand and its neighboring countries. Publisher's remark: please note that the above figure contains disputed territories.
Saltwater intrusion is a natural feature of meso-tidal estuaries like the LCPYR, where tidal ranges fluctuate between 2 and 4 m. The variability in saltwater levels is driven by the complex interplay of the river discharge, tidal forces, and sea-level rise (Tran Anh et al., 2018; Mulamba et al., 2019). In the nearby Mekong River Delta, for instance, severe salinity intrusion events are frequently observed during periods of reduced freshwater inflow or drought, and compounded by rising sea levels (Loc et al., 2021; Nghia et al., 2024; Vu et al., 2024). Additionally, near-surface wind has been identified as a contributing factor to these dynamics (Reyes-Merlo et al., 2013).
In the LCPYR, however, saltwater intrusion can sometimes occur independently of drought conditions, as was observed in 2019 to 2021. These anomalies have added complexity to water management strategies for responsible agencies. Previous studies have introduced salinity models for the LCPYR (Wongsa et al., 2015; Kulmart and Pochai, 2020; Othata and Pochai, 2021; Changklom et al., 2022). More recently, Chettanawanit et al. (2022) and Pokavanich and Guo (2024) have highlighted key drivers of salinity intrusion in the region. However, the intricate dynamics of saltwater intrusion, particularly in relation to drought, local factors, and mitigation efforts, still require a more thorough analysis and model evaluation, which will be addressed in detail in this study.
For example, wind-driven water-level changes have been highlighted as influential in saltwater intrusion in meso-tidal estuaries (Zhang et al., 2019). This aligns with the dynamics of the LCPYR, given its connection to the GOT, a region known for standing wave and seiche oscillation effects (Tomkratoke and Sirisup, 2020). These short-period oscillations, driven by monsoon winds and storm surges induced by tropical cyclones, may contribute to the variability of salinity levels in the LCPYR. Long-period tidal influences, such as fortnightly salinity intrusion, have also been observed in estuaries worldwide, including the LCPYR (Garcés-Vargas et al., 2020; Pokavanich and Guo, 2024).
Another local factor includes the inflows of excess rainfall or floodwaters from adjacent watersheds and retention areas, which can significantly dilute the saltwater content in the LCPYR despite a local drought condition. For instance, during the 2020 drought, floodwaters discharged from Bangkok, located at the lower end of the LCPYR, significantly reduced salinity levels in the river. Such events typically occurred during breaks in the monsoon season, when most of Thailand experienced dry conditions. Conversely, a reduction in the freshwater supply during the dry season can exacerbate saltwater intrusion. However, their impacts on the LCPYR remain undocumented.
Addressing saltwater intrusion in the LCPYR and other major rivers is of national importance to Thailand. The mechanisms explored here are equally relevant to other regions experiencing comparable coastal salinity intrusion challenges. Effective solutions require a solid scientific foundation; without it, uncertainties about the causes of intrusion and the most appropriate mitigation strategies will persist. Poor management could lead to conflicts among stakeholders. Therefore, preventing conflicts and achieving optimal solutions should be the primary goals. To this end, relevant communities must be equipped with sufficient scientific knowledge, supported by a robust prediction system capable of assisting with both short-term and long-term projections.
Therefore, this study aims to bridge the knowledge gaps concerning the hydrodynamics and salinity dynamics of the LCPYR. We conducted a comprehensive analysis of the key factors influencing salinity and developed high-accuracy numerical models. These findings are intended to support water resource management in Thailand and assist communities involved in managing water quality in urban areas.
While saltwater intrusion has been widely studied in other estuarine systems (Liu et al., 2010, 2019), this study contributes new insights specific to the LCPYR. First, we characterize the interplay between regional-scale drought conditions and salinity intrusion (drought-dependent mechanism), while also identifying periods when local hydro-climatic variability temporarily disrupts this linkage (drought-relaxation mechanism). Second, using a physically based numerical model, we pinpoint and prioritize the key drivers of salinity dynamics, including the roles of urban runoff and freshwater regulation near the river mouth. Finally, we assess the effectiveness of a freshwater redistribution strategy, “water hammer”, in mitigating salinity intrusion and provide practical recommendations tailored to the LCPYR context. These contributions extend the current understanding of salinity mechanisms and inform more adaptive and evidence-based water management strategies that are transferable to other estuarine river systems.
The rest of this paper is organized as follows: Section 2 presents the geography, climatic characteristics, and relevant datasets for the study area, the LCPYR. Section 3 outlines the methodological framework, including the wavelet-based time series analysis and hydrodynamic modeling. Section 4 presents the results and discussion. Section 5 details the model applications and mitigation‐scenario testing. Finally, Sect. 6 concludes the study and highlights key implications.
2.1 Study area
Topographically, prominent estuaries of the river deltas in Southeast Asia and East Asia, such as the Irrawaddy, Mekong, and Pearl rivers, are positioned on the windward side relative to the prevailing monsoon winds. Consequently, their seasonal flow regimes are influenced by both monsoon and synoptic weather systems (Fan and Luo, 2019; Chen et al., 2024; Besset et al., 2017; Sirisena et al., 2021; Weng et al., 2024, 2020). In contrast, the Chao Phraya River and its estuary lie on the leeward side of the mountain ranges (e.g., the Thongchai-Tenasserin and Annamite ranges) and plateau, causing the rainfall-runoff regime to be predominantly controlled by synoptic weather systems, i.e., tropical cyclones and monsoon troughs rather than direct monsoon winds (Tsai et al., 2015; Tomkratoke and Sirisup, 2022). While the CPYB dry season generally coincides with that of the broader mainland region, a unique local hydro-climatic feature is the occasional occurrence of wet episodes triggered by southerly or southeasterly winds across the inner GOT during the dry season. Although the underlying mechanisms driving this phenomenon remain understudied, it notably induces temporary wet periods that significantly accelerate the dilution of salinity levels in the LCPYR during otherwise dry conditions.
Our study focuses on the lower portion of the Chao Phraya River (Fig. 1), the largest waterway in the Chao Phraya Delta and the second-longest river in the region after the 350 km-long Tha Chin River. The LCPYR is one of Thailand's most distinctive geomorphological features, characterized by its winding course. Originating from the Chao Phraya (CPY) Dam in the Chainat Province, it flows approximately 280 km to the inner GOT. The lower reach, known as the Chao Phraya estuary, a long, narrow, meandering, and partially mixed estuary (Pokavanich and Guo, 2024), lies downstream of the Phra Nakhon Si Ayutthaya Province and is roughly 600 m wide, while the upper reach, above Phra Nakhon Si Ayutthaya Province, is about 200 m wide. The riverbed in the lower part lies 5 m below sea level (b.s.l.), whereas the upper part is 5 m above sea level (a.s.l.). The river's major tributary, the Lower Pasak River, extends from the Phra Rama VI Dam in the Phra Nakhon Si Ayutthaya Province, measuring 50 km in length and 75 m in width, with a riverbed elevation of 6 m a.s.l. The LCPYR’s low-lying, partially mixed estuary is uniquely sensitive to tidal and sea-level fluctuations: salinity intrusion and water levels here are strongly driven by coastal anomalies, a critical influence absent in purely fluvial rivers.
The total inflow to the LCPYR is primarily regulated by two major upstream dams: the CPY Dam and the Rama VI Dam. Observational data obtained from the National Hydroinformatics Data Center of Thailand (NHC; https://www.thaiwater.net, last access: 1 April 2025) indicate that the CPY Dam releases an average dry-season inflow of approximately 80 m3 s−1, which can peak at over 2000 m3 s−1 during flood events. This seasonal variation reflects the broader monsoonal influence on river discharge. Similar patterns have been reported in long-term hydrological records, such as the 70-year analysis by Bidorn et al. (2021), which highlights seasonal discharge trends and their implications for delta stability. The persistently low flows observed during dry seasons may also result from dam operation strategies intended to preserve structural integrity and ensure downstream water availability, as suggested by Molle et al. (2001).
The Rama VI Dam contributes additional discharge, ranging from approximately 20 m3 s−1 in dry conditions to as much as 800 m3 s−1 during high-flow periods. Furthermore, downstream water abstraction, especially for the municipal water supply in the Bangkok Metropolitan Region, reduces the net inflow by an average of 55 m3 s−1 (Pokavanich and Guo, 2024). Although additional lateral inflows and withdrawals exist, the lack of systematic in-situ measurements introduces uncertainty in fully quantifying the river's water balance.
Rainfall variability in the LCPYR follows the broader pattern of Thailand's mainland climate, characterized by a bimodal rainfall pattern with two distinct rainy seasons separated by a dry period (Tomkratoke and Sirisup, 2022). The monsoon break, typically occurring from mid-June to July, contributes to this variability and can lead to meteorological drought and associated water scarcity. Low rainfall usually begins in late winter (February) and continues through the pre-monsoon period (March to May). The wet season in the LCPYR is heavily influenced by synoptic-scale systems, including monsoon troughs and tropical cyclones. While some regional climate patterns and climate dynamics are well understood, others remain complex and poorly defined.
Geographically, the LCPYR is part of the GOT system, which acts as an effective oscillator for long-wave phenomena such as tidal waves and storm surges. These oscillating long waves significantly influence both the hydrodynamics and salinity levels near the river mouth and even in remote freshwater zones. Salinity in the LCPYR becomes particularly severe during prolonged drought periods, when the influence of long waves is also more pronounced, as will be shown in this paper. This covariation between salinity, tidal patterns, and storm surges highlights the importance of considering these mechanisms when analyzing the severity of saltwater intrusion. Therefore, to fully understand and accurately model the system, it is essential to analyze the relationships between salinity in the LCPYR, tides, long waves, river flows, and other important factors.
2.2 Data sources and processing methods
The analysis of this study is divided into two parts: time series analysis and numerical modeling. First, the time series analysis focuses on identifying the covariation between salinity and its environmental drivers, including oceanic factors such as tides and extreme sea levels, as well as drought-related conditions like river discharge and rainfall. Second, we develop numerical modeling processes based on the results from the first part. Below, we provide an overview of the key data and processing methods used in the time series analysis.
2.2.1 Water-level and sea-level data
Water-level measurements near the entrance and mid-sections of the LCPYR (Fig. 1), covering periods of intensified saltwater intrusion from 2015 to 2021, are obtained from the NHC (https://www.thaiwater.net, last access: 7 July 2025) and the real-time monitoring system of the Metropolitan Waterworks Authority (MWA; http://rwc.mwa.co.th/, last access: 7 August 2025). Due to significant data gaps and non-physical variations in the datasets from the Chao Phraya River mouth, data from the Tha Chin River mouth, located approximately 30 km away from the LCPYR, are used as a substitute. Since the sea-level conditions at the Tha Chin River mouth closely align with those in the GOT, this dataset is a reliable representation.
For specific statistical analyses, the water-level time series data were detrended to isolate long-term anomalies and remove seasonal or tidal influences. Detrending was performed using a locally weighted scatterplot smoothing (LOWESS) filter with a smoothing parameter of f=0.01, which corresponds to a smoothing window of approximately 25 d for the time span from 1 January 2015 to 14 May 2021. The trend component obtained from LOWESS was then subtracted from the original time series to yield the detrended signal used in further analysis.
2.2.2 River discharge data
In this study, daily river discharge measurements taken at 06:00 THA are collected from stations downstream of the CPY Dam (Q1) and the Rama VI Dam (Q2), as shown in Fig. 1. These datasets are provided by the NHC and the Royal Irrigation Department of Thailand (RID; https://www.rid.go.th, last access: 7 August 2025). The time series are used to construct the RSDA, a locally adaptive indicator of hydrological drought.
The RSDA is computed as follows:
where Q(t) is the daily streamflow on day t, is the climatological mean over the defined dry season (November–June) calculated across all dry-season days in the record, and is the rolling standard deviation computed over a 60 d window centered at t. Anchoring the mean to the dry-season climatology deliberately centers the index on the period when saltwater intrusion is most likely. As a result, the RSDA highlights flow shortfalls that matter operationally for salinity control, while wet-season fluctuations are de-emphasized.
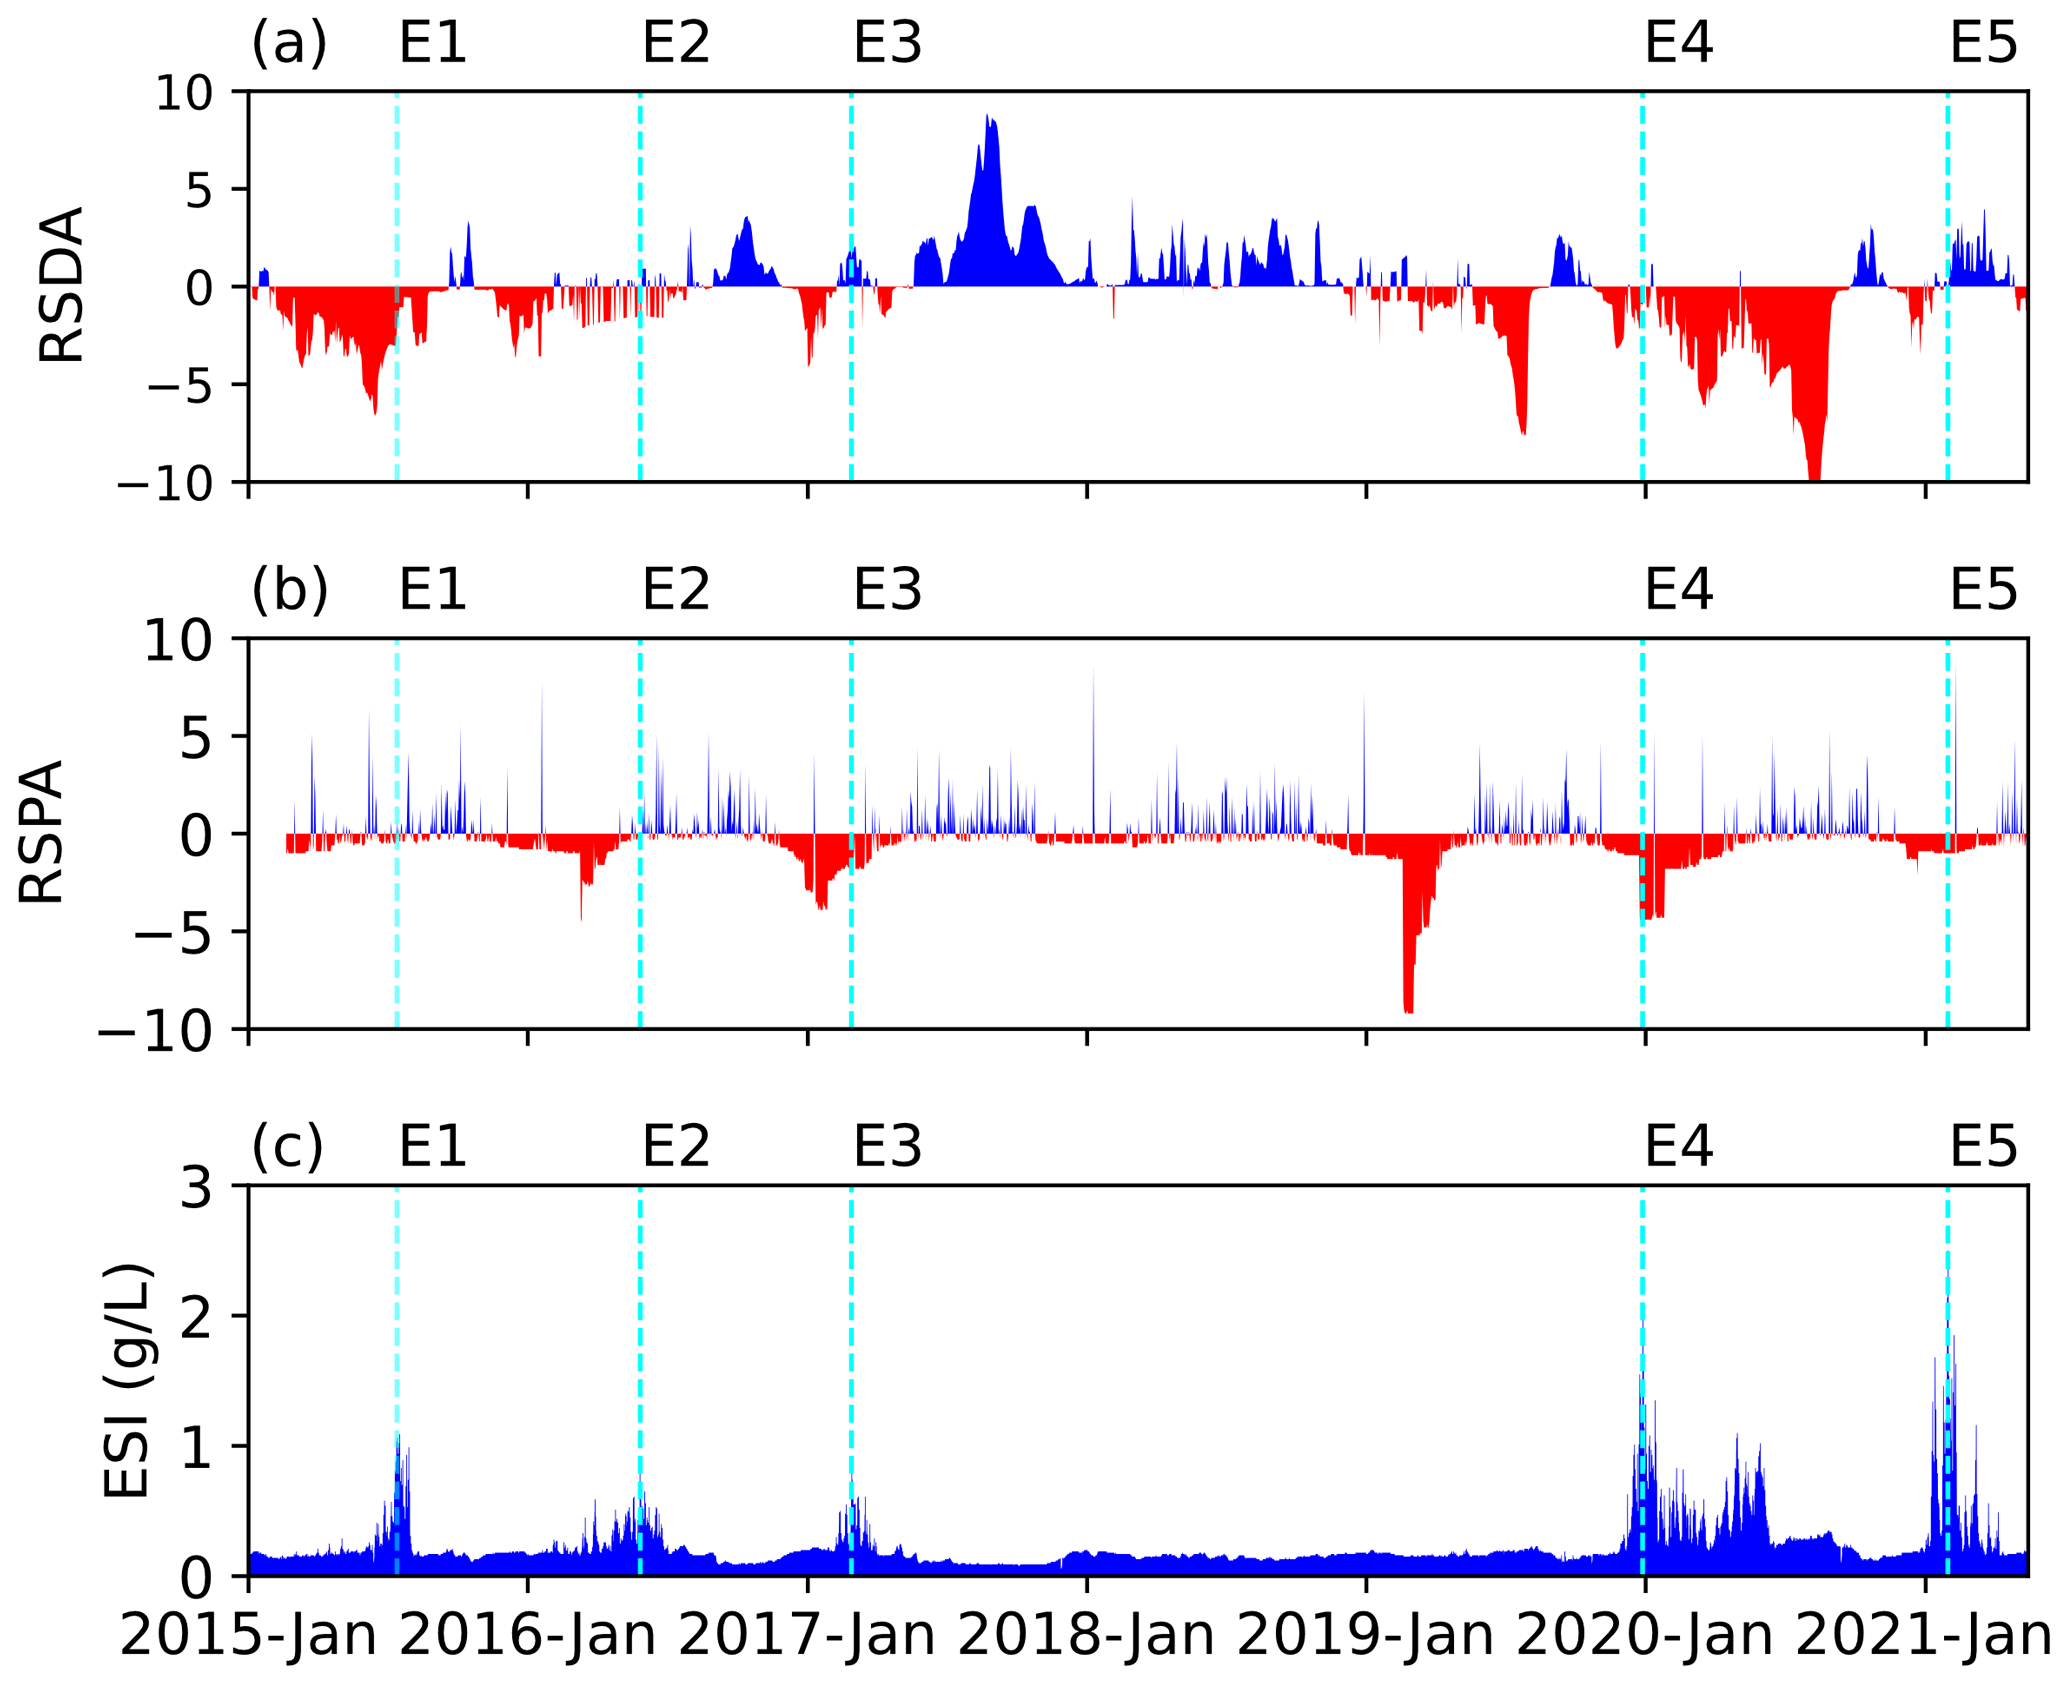
Figure 2Time series of (a) the RSDA, (b) the RSPA, and (c) the ESI from January 2015 to May 2021. The vertical dashed lines and labels (E1–E5) mark the events of extreme salinity during July 2015, May 2016, March 2017, December 2019 to January 2020, and January 2021 to May 2021, respectively.
The 60 d window, a period of about 4 spring–neap tidal cycles, is long enough to smooth synoptic noise yet short enough to resolve the sub-seasonal flow shifts that can trigger saltwater intrusion. For each day, anomalies are referenced to the fixed dry-season mean but scaled by the rolling 60 d standard deviation, so only the variance is updated locally; this captures the short-term variability while preserving a consistent seasonal baseline (Apurv and Cai, 2019; Lema et al., 2025). The rolling-window z-score indices, including the Standardized Runoff Index (Shukla and Wood, 2008) and its non-stationary extensions (Wang et al., 2020), have proved robust under non-Gaussian, non-stationary conditions and highlight departures from recent conditions rather than from a fixed long-term climatology.
Although the RSDA values are not strictly Gaussian, coupling a fixed dry-season baseline with a rolling variance keeps anomaly magnitudes comparable through time and provides a stable, context-sensitive measure of hydrological stress. The RSDA time series for 2015–2021 is shown in Fig. 2a, highlighting severe drought conditions during 2019–2021 and other notable dry spells, confirming the index's usefulness for diagnosing flow deficits that set the stage for high-salinity intrusion events.
2.2.3 Rainfall data
To assess meteorological drought, we compute the RSPA using high-resolution rainfall data. Daily rainfall measurements from 128 stations across the Bangkok Metropolitan Region are obtained from the Drainage and Sewerage Department's monitoring system (https://dds.bangkok.go.th, last access: 7 August 2025). The daily rainfall is spatially averaged to produce a single area-mean time series.
The RSPA is computed similarly to the RSDA:
where P(t) is the area-averaged daily rainfall on day t, is the dry-season mean precipitation, and is the 60 d rolling standard deviation centered at t. Using the same dry-season reference ensures that the RSPA isolates rainfall deficits (or surpluses) that coincide with the months in which the freshwater dilution capacity is most critical, making the meteorological and hydrological indices directly comparable for the saltwater intrusion analysis.
The 60 d span, set to match the discharge window, covers the typical 30–60 d timescale of a single Madden–Julian Oscillation event that modulates rainfall across both the Maritime Continent and mainland Southeast Asia (Zhang, 2005; Wheeler and Hendon, 2004). It is long enough to smooth individual storm events yet short enough to capture the multi-week rainfall deficits that condition soil moisture and subsequent low-flow periods (Vicente-Serrano et al., 2010)
Because only the variance is updated within each 60 d window, both the RSPA and its discharge counterpart, the RSDA, remain sensitive to short-term variability while preserving a fixed dry-season baseline, a configuration shown to outperform fixed-climatology indices in non-stationary settings (Hao and AghaKouchak, 2014). The resulting RSPA time series (Fig. 2b) reveals meteorological drought events and excess rainfall periods that influence salinity dilution in the LCPYR, particularly from local runoff contributions in the Bangkok area and surrounding watersheds.
2.2.4 Salinity data
The near-surface salinity measurements are collected from the Sam Lae station, provided by the MWA (http://rwc.mwa.co.th, last access: 7 August 2025). To analyze the daily covariation between salinity and its drivers, we developed the Extreme Salinity Index (ESI) by extracting the local maxima of the original salinity data. This approach preserves the extrema and emphasizes daily variations in salinity. The climatology of the ESI from 2015 to mid-2021 is shown in Fig. 2c. Qualitatively, extreme salinity events and drought magnitudes, as indicated by the RSDA and the RSPA, are well correlated, including the extreme salinity events E1 (July 2015), E2 (May 2016), E3 (March 2017), E4 (December 2019), and E5 (January 2021). However, a more comprehensive understanding of the relationships among these indices can be achieved through a robust analysis method, such as the cross-wavelet transform, which is presented in the following section.
3.1 Continuous wavelet transform and cross-wavelet analysis
Understanding the factors controlling salinity in complex estuarine systems like the LCPYR presents significant challenges. Previous studies have shown that multiple factors, often interacting subtly, influence the dynamic patterns of salinity in estuaries worldwide (Wongsa et al., 2015; Kulmart and Pochai, 2020; Chettanawanit et al., 2022; Othata and Pochai, 2021; Changklom et al., 2022; Pokavanich and Guo, 2024). To better interpret the significance of these factors, it is important to identify their periodic structures. A classical Fourier analysis, which reveals modes of variability or oscillation in periodic phenomena, is particularly useful in this regard. An extension of the Fourier analysis, which is the wavelet analysis, is frequently employed due to its ability to extract and visualize the periodic structures of time series data. This method has proven effective across fields such as hydrology, oceanography, and climatology. Continuous wavelet transform (CWT) techniques, commonly used in a wavelet analysis, are particularly advantageous because they offer both time and frequency localizations, allowing for detections of transient features and oscillations that change over time. For further mathematical details on CWT, refer to Tomkratoke and Sirisup (2022).
A cross-wavelet analysis provides additional insights when investigating relationships between two time series. Not only does it measure the strength of covariation between variables but it also tracks how these relationships evolve over time and across different frequency scales. This capability is particularly useful for detecting synchronicity or phase shifts between variables such as salinity and tidal forces, even when their interactions change over time. A cross-wavelet analysis can also identify complex, non-linear relationships that may be overlooked by traditional methods, making it well-suited for analyzing environmental systems influenced by multiple interacting factors.
In this study, we use the WaveletComp package (Rösch and Schmidbauer, 2016) to conduct both the continuous wavelet analysis on individual time series and the cross-wavelet analysis to explore the interactions between salinity and its potential drivers. This approach allows us to capture multi-timescale variations, identify the dominant forces influencing salinity dynamics, and inform the configuration of boundary conditions and parameterization in the subsequent modeling steps.
3.2 Numerical modeling
3.2.1 Hydrodynamic-mass transport model
To accurately resolve the river–ocean interactions and salinity dynamics in the study area, we employ the Semi-implicit Cross-scale Hydroscience Integrated System Model (SCHISM). SCHISM is an open-source, community-supported model designed for seamless three-dimensional baroclinic circulation simulations across various scales, ranging from creeks and rivers to estuaries, shelves, and oceans (Zhang et al., 2015, 2016). It utilizes a semi-implicit finite-element/finite-volume method combined with an Eulerian–Lagrangian algorithm to solve the Navier-Stokes equations in their hydrostatic form. This hydrostatic assumption simplifies vertical momentum calculations, assuming the pressure at any point is due to the weight of the water above, while maintaining accuracies of horizontal velocities in large estuarine systems like the LCPYR, where horizontal flows dominate over vertical accelerations.
SCHISM's hybrid σ-coordinate transformation, applied in the vertical domain, ensures accurate representation of complex riverbed and bank geometries. Its unstructured horizontal grid system, composed of triangular or quadrilateral elements, provides flexibility in capturing intricate spatial features. The model supports both Cartesian and spherical coordinate systems, adapting to various scales and regions. The numerical algorithm balances higher-order and lower-order methods to optimize stability, accuracy, and computational efficiency, while mass conservation is rigorously enforced via a finite-volume transport algorithm.
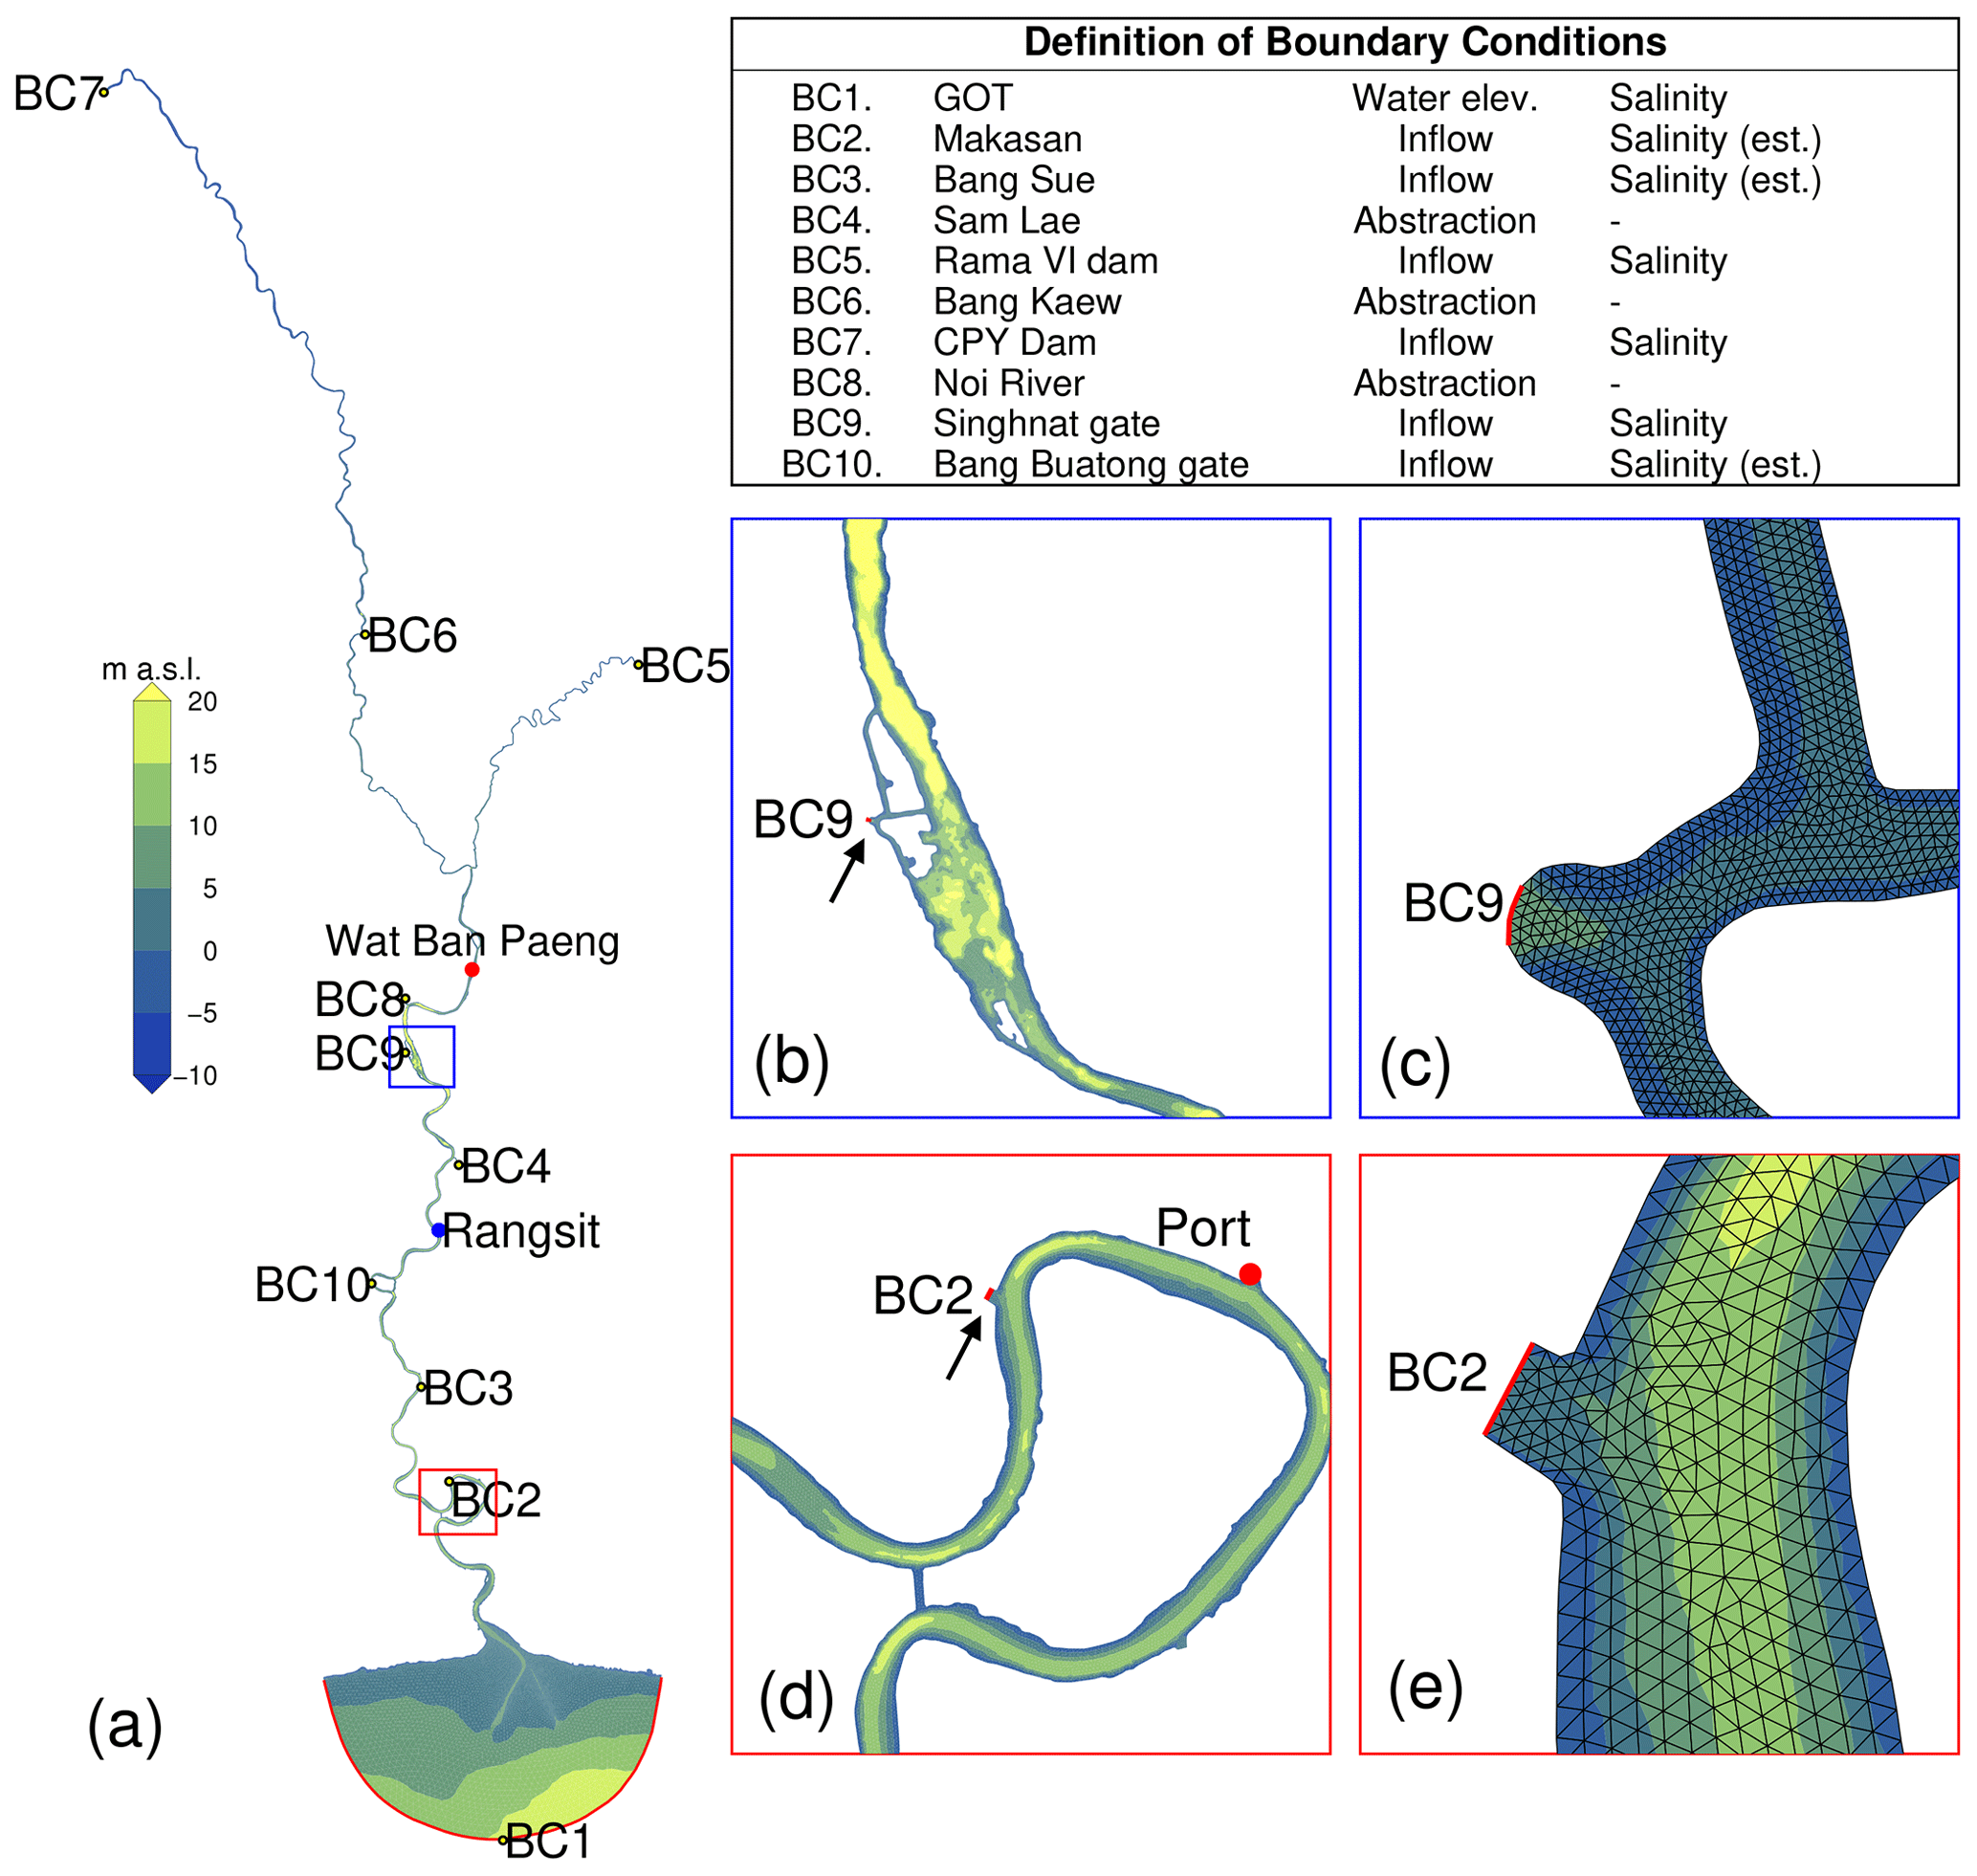
Figure 3Computational domain, bathymetry, and boundary condition positions (a) of the LCPYR and zoomed-in views highlighting the bathymetry and domain decompositions of (b–c) the Singhnat gate (BC9) and the surroundings, and (d–e) the Makasan drainage station (BC2) and the vicinity.
SCHISM's semi-implicit time-stepping approach eliminates the need for mode splitting and relaxes the Courant–Friedrichs–Lewy (CFL) stability constraints, enhancing computational efficiency for faster simulations. Additionally, the Eulerian–Lagrangian method (ELM) is employed to conserve mass and further relax stability constraints, ensuring accurate resolution of long-wave dynamics and other hydrodynamic processes. Details of the model grids and configurations are provided below.
3.2.2 Computational domain and grid design
To simulate the LCPYR, we designed a computational domain that includes the main canal and the adjacent narrow bank areas, extending from the river mouth upstream to the CPY Dam in the Chai Nat Province (BC7) and the Rama VI Dam (BC5), as shown in Fig. 3. Floodplain inundation is not considered in this study; therefore, the floodplain area is omitted from the model geometry. The geometry is discretized into triangular elements of varying sizes, depending on the river's width.
The computational domain covers the entire LCPYR. In the lower part of the domain, we employ triangular elements ranging in size from 25 to 50 m (Fig. 3e). In contrast, finer elements of approximately 10 to 15 m are used for the remaining regions (Fig. 3c). This approach results in a triangular grid network comprising of approximately 330 000 elements.
Bathymetry data for the domain are obtained from echo sounder depth measurements provided by the Marine Department of Thailand and nautical charts from the Royal Thai Navy. These data are directly incorporated into the computational domain without being spatially smoothed. The bed topography characteristics of the LCPYR are presented in Fig. 3a, b, and d.
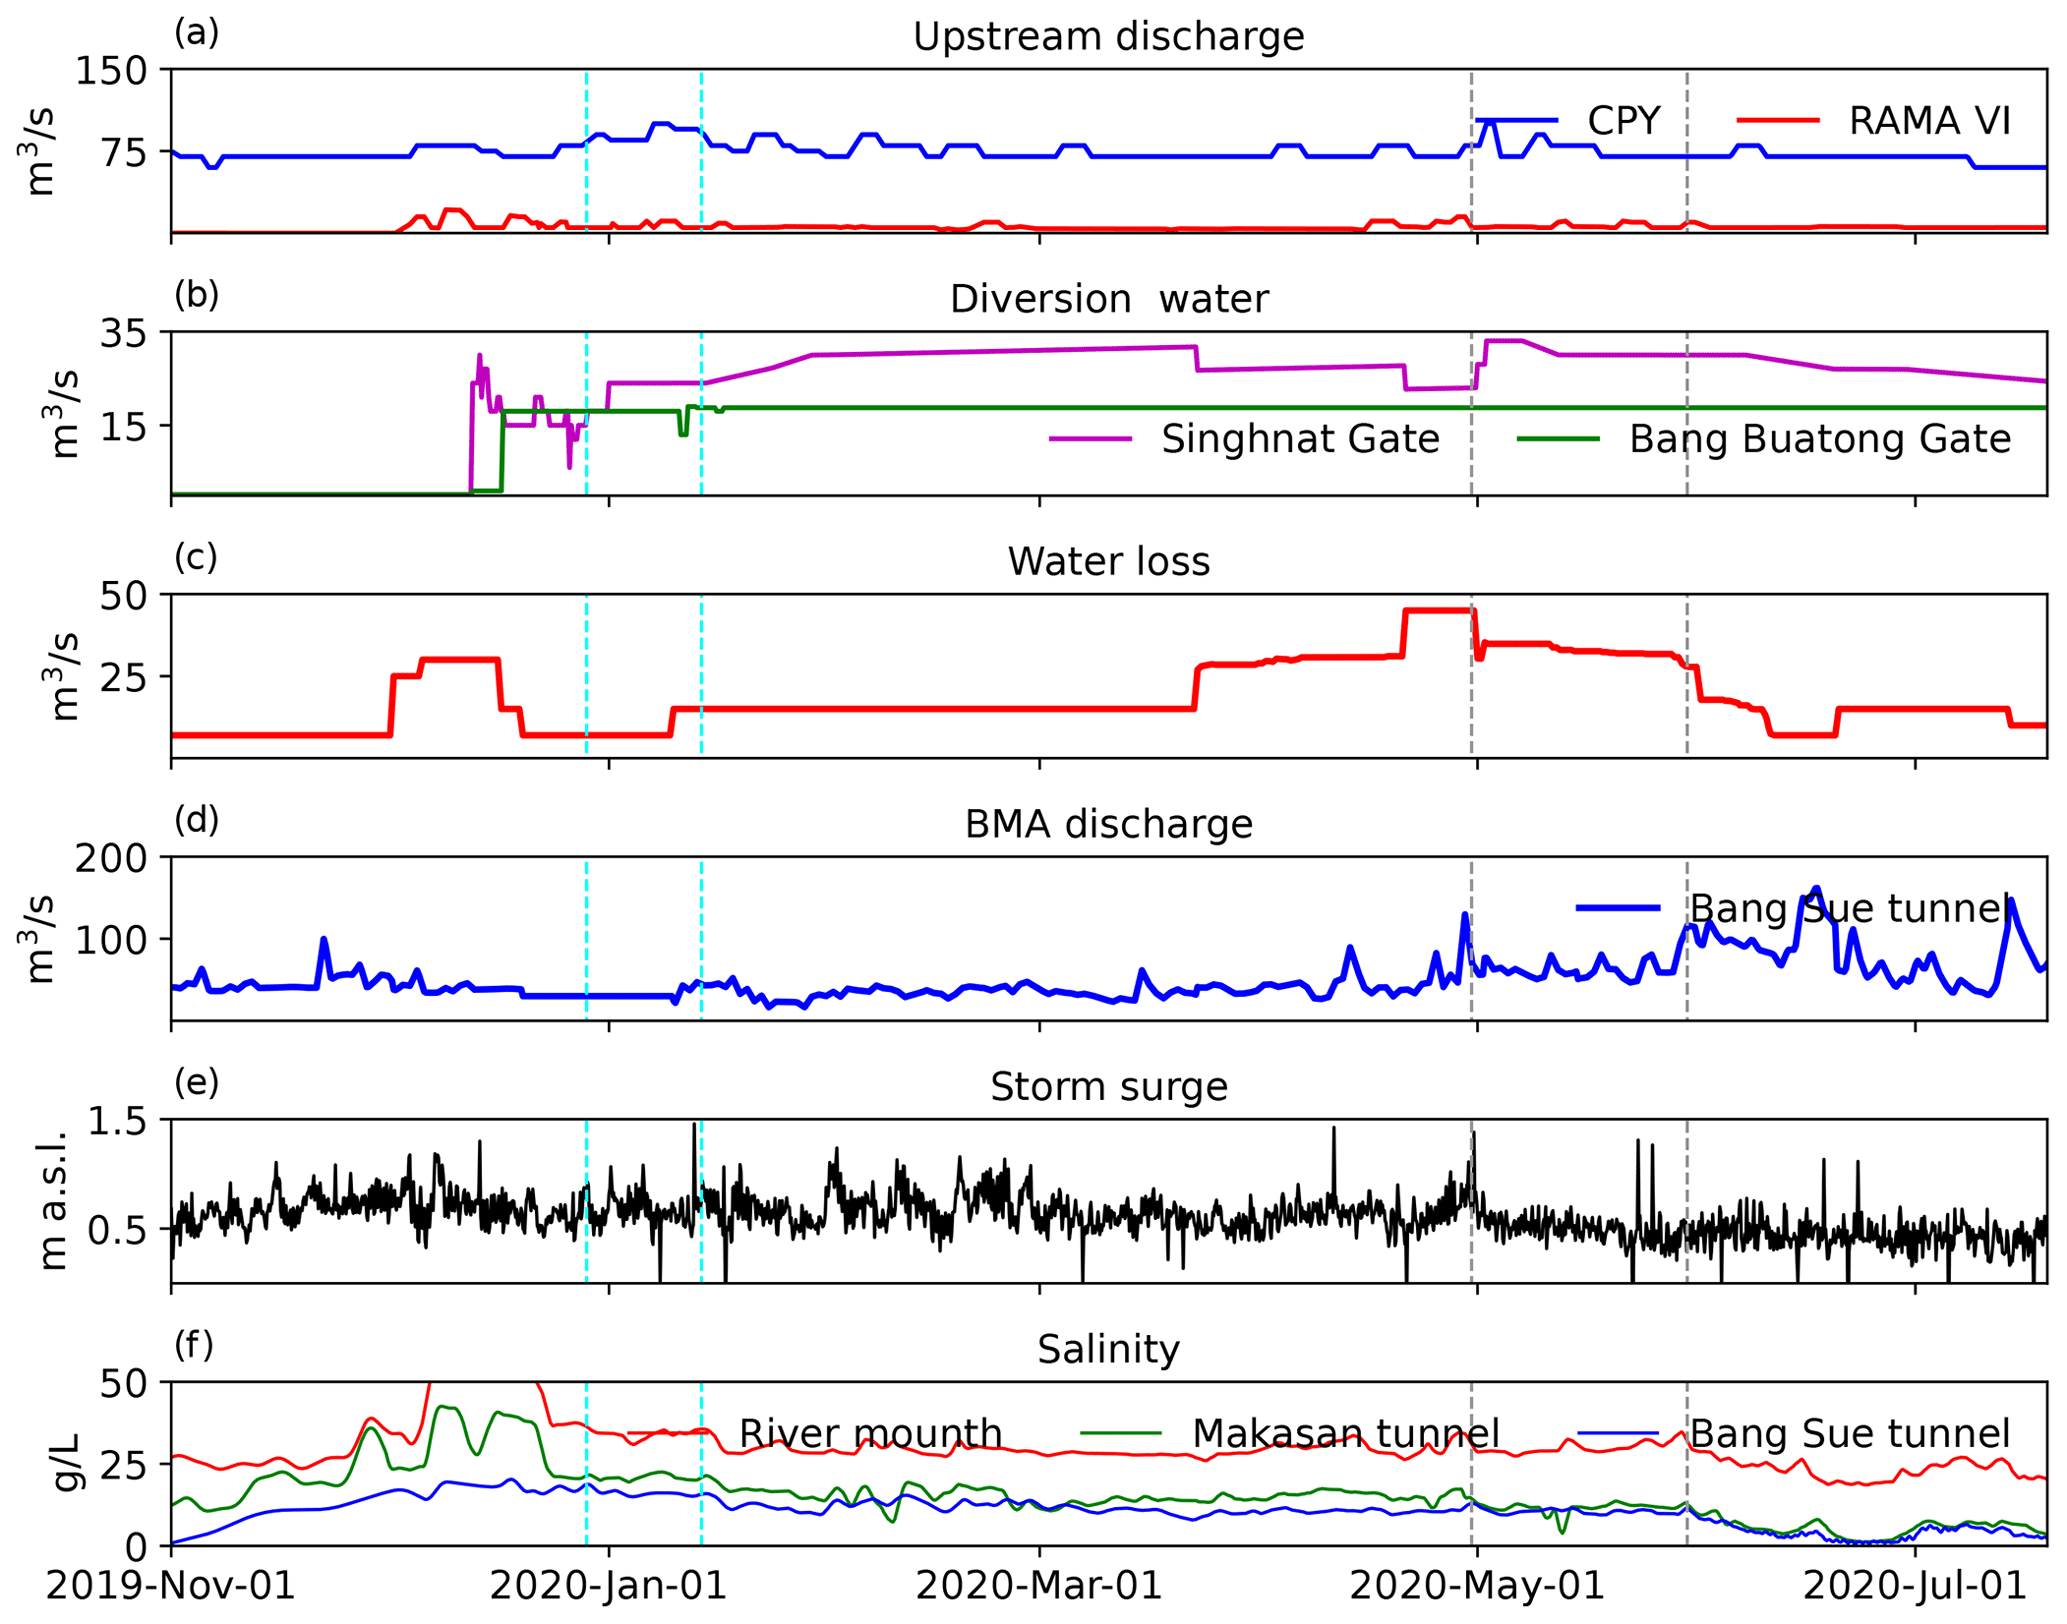
Figure 4Collected forcing data for modeling hydrodynamics and salinity in the LCPYR: (a) the upstream discharge (m3 s−1) from the CPY Dam (BC7) and Rama VI (BC5) Dam; (b) the diverting discharge water (m3 s−1) from the Singhnat (BC9) and Bang Buatong (BC10) gates; (c) the water loss (m3 s−1) at the Bang Kaew station (BC6) due primarily to agricultural withdrawals; (d) the BMA discharge (m3 s−1) at the Bang Sue tunnel (BC3); (e) the storm surge (m a.s.l.); and (f) the salinity level (g L−1). The data cover the period from 1 November 2019 to July 2020. The vertical dashed cyan and black lines indicate the extreme salinity events during the winter and summer seasons, respectively.
3.2.3 Boundary conditions
Figure 3 illustrates the boundary conditions implemented in the model to capture tidal waves, storm surges, river discharge, and salinity dynamics. Two upstream boundaries are defined at the CPY Dam (BC7) and the Rama VI Dam (BC5), with discharge data sourced from the NHC. These dams operate using the water hammer strategy (Fig. 4a), a method involving the release of water in high-volume pulses to generate hydraulic pressure, helping prevent saltwater intrusion by maintaining sufficient upstream flow.
At the downstream boundary near the GOT (BC1), mean sea levels (MSLs), tides, and storm surge conditions are applied using the processed data from the Tha Chin station. To simulate water abstraction, a constant pumping rate of 55.0 m3 s−1 is assigned at the Sam Lae station (BC4).
The Bang Kaew station (BC6) plays a crucial role by aggregating the water loss from agricultural withdrawals, as shown in Fig. 4c. These withdrawals impact the amount of freshwater available to dilute saltwater intrusion, particularly during dry seasons, underscoring the importance of managing water abstraction effectively. To reproduce salinity dynamics during the 2019–2021 drought years, side flows and excess rainfall are incorporated as key drivers influencing salinity during dry seasons. The water gates at Singhnat (BC9) and Bang Buatong (BC10) were occasionally opened to release freshwater, as observed during the extreme salinity event in early 2020. Where no data on discharges are available, small testing flows of 0.1–0.2 m3 s−1 are applied. The forcing data collected for this period is presented in the Supplement (Fig. S1).
The side flows from the Bangkok Metropolitan Administration (BMA) also play a critical role in managing salinity. During severe droughts, flows from the Bangkok catchment can reach 100.0–150.0 m3 s−1, exceeding the combined discharges from the CPY and Rama VI Dams. These side flows significantly dilute saltwater in the estuarine portion of the LCPYR. A typical dry-season flow pattern of 50.0 m3 s−1 is used to represent the baseline conditions (Fig. 4d), though flows may increase significantly with summer rainfall. Open boundary conditions are set at the Makasan drainage station (BC2) and Bang Sue station (BC3) to account for BMA side flows.
For salinity modeling, time series data from the Wat Ban Paeng station are adjusted and applied to the upstream boundaries (BC5 and BC7). Due to the lack of observed salinity data for the inner GOT, we utilize the Global Ocean Forecasting System version 3.1 (GOFS 3.1) reanalysis product, generated using the HYbrid Coordinate Ocean Model (HYCOM), to define the downstream boundary conditions (BC1). The GOFS 3.1 system provides global, high-resolution ocean analyses and forecasts, including salinity and temperature fields, which are assimilated from multiple satellite and in-situ observations. The salinity forecast data were downloaded from the official HYCOM data servers (https://www.hycom.org/dataserver/gofs-3pt1/analysis, https://www7320.nrlssc.navy.mil/GLBhycomcice1-12/, last access: 8 April 2025). In scenarios with side flows, salinity concentrations of 0.2–3.0 g L−1 are assigned at BC9 and BC10. Additionally, salinity data from the Port station (MWA) are used to adjust the Makasan (BC2) boundary.
3.2.4 Initial conditions
The initial conditions for hydrodynamics and salinity are set using the cold-start mode of the SCHISM model. The velocity fields (u, v, w) are initialized to 0. For water elevation (h), the daily water levels above MSL from the observation stations (as shown in Fig. 1) are spatially interpolated onto the computational grid as nodal values.
Setting the initial state for salinity is more challenging because an improper starting point could cause divergence in the salinity model's outputs. To ensure stability, the best approach is to begin with well-mixed and mostly uniform salinity conditions, such as those typically observed at the end of the rainy season (usually in October).
3.2.5 Model calibration and validation
Validation studies that focus on short to medium durations (e.g., 7–30 d) may capture daily or sub-daily salinity variability but often overlook long-term seasonal variations. This limitation can obscure a model's ability to fully predict the range of saltwater intrusion dynamics. For the LCPYR, seasonal variability of saltwater, especially during the dry season, is the most critical factor, as severe intrusion is not a concern during the wet season, which instead promotes the dilution process. Accurately reproducing both short-term and seasonal variations is essential for thoroughly assessing the model performance.
In this study, we focus on a long-term simulation period of 6–7 months, encompassing the dry season, when saltwater intrusion is most pronounced. This time frame is sufficient for capturing the seasonal variability and evaluating the model's performance during the critical stages of saltwater intrusion: development, peak, and recession.
To facilitate the evaluation of model performance and interpretation of errors, we divide the model results into two experiments based on different mitigation strategies:
-
Experiment A. Water hammer combined with diverting discharges (1 November 2019 to 31 July 2020).
-
Experiment B. Water hammer without diverting discharges (1 November 2020 to 5 May 2021).
These periods cover the crucial dry season, when saltwater intrusion is the most significant. The observed water level, river flow, and salinity data are used to validate the model. Stations with minimal missing data and without non-physical fluctuations are selected for validation. The selected stations are shown in Fig. 1; the Sam Lae, Wat Sai Ma Nuea, Memorial Bridge, Khlong Lat Pho, and South Bangkok stations are equipped with both salinity and water-level sensors.
For river flow validation, data from the Rama VIII Bridge (https://dds.bangkok.go.th, last access: 7 August 2025), Wat Kema (http://rwc.mwa.co.th/, last access: 7 August 2025), and Bang Sai (http://www.rid.go.th, last access: 7 August 2025) stations are used, as indicated in Fig. 1. To assess model accuracy, we calculate the model skill score (Murphy, 1988), root mean square error (RMSE), and Pearson correlation coefficient.
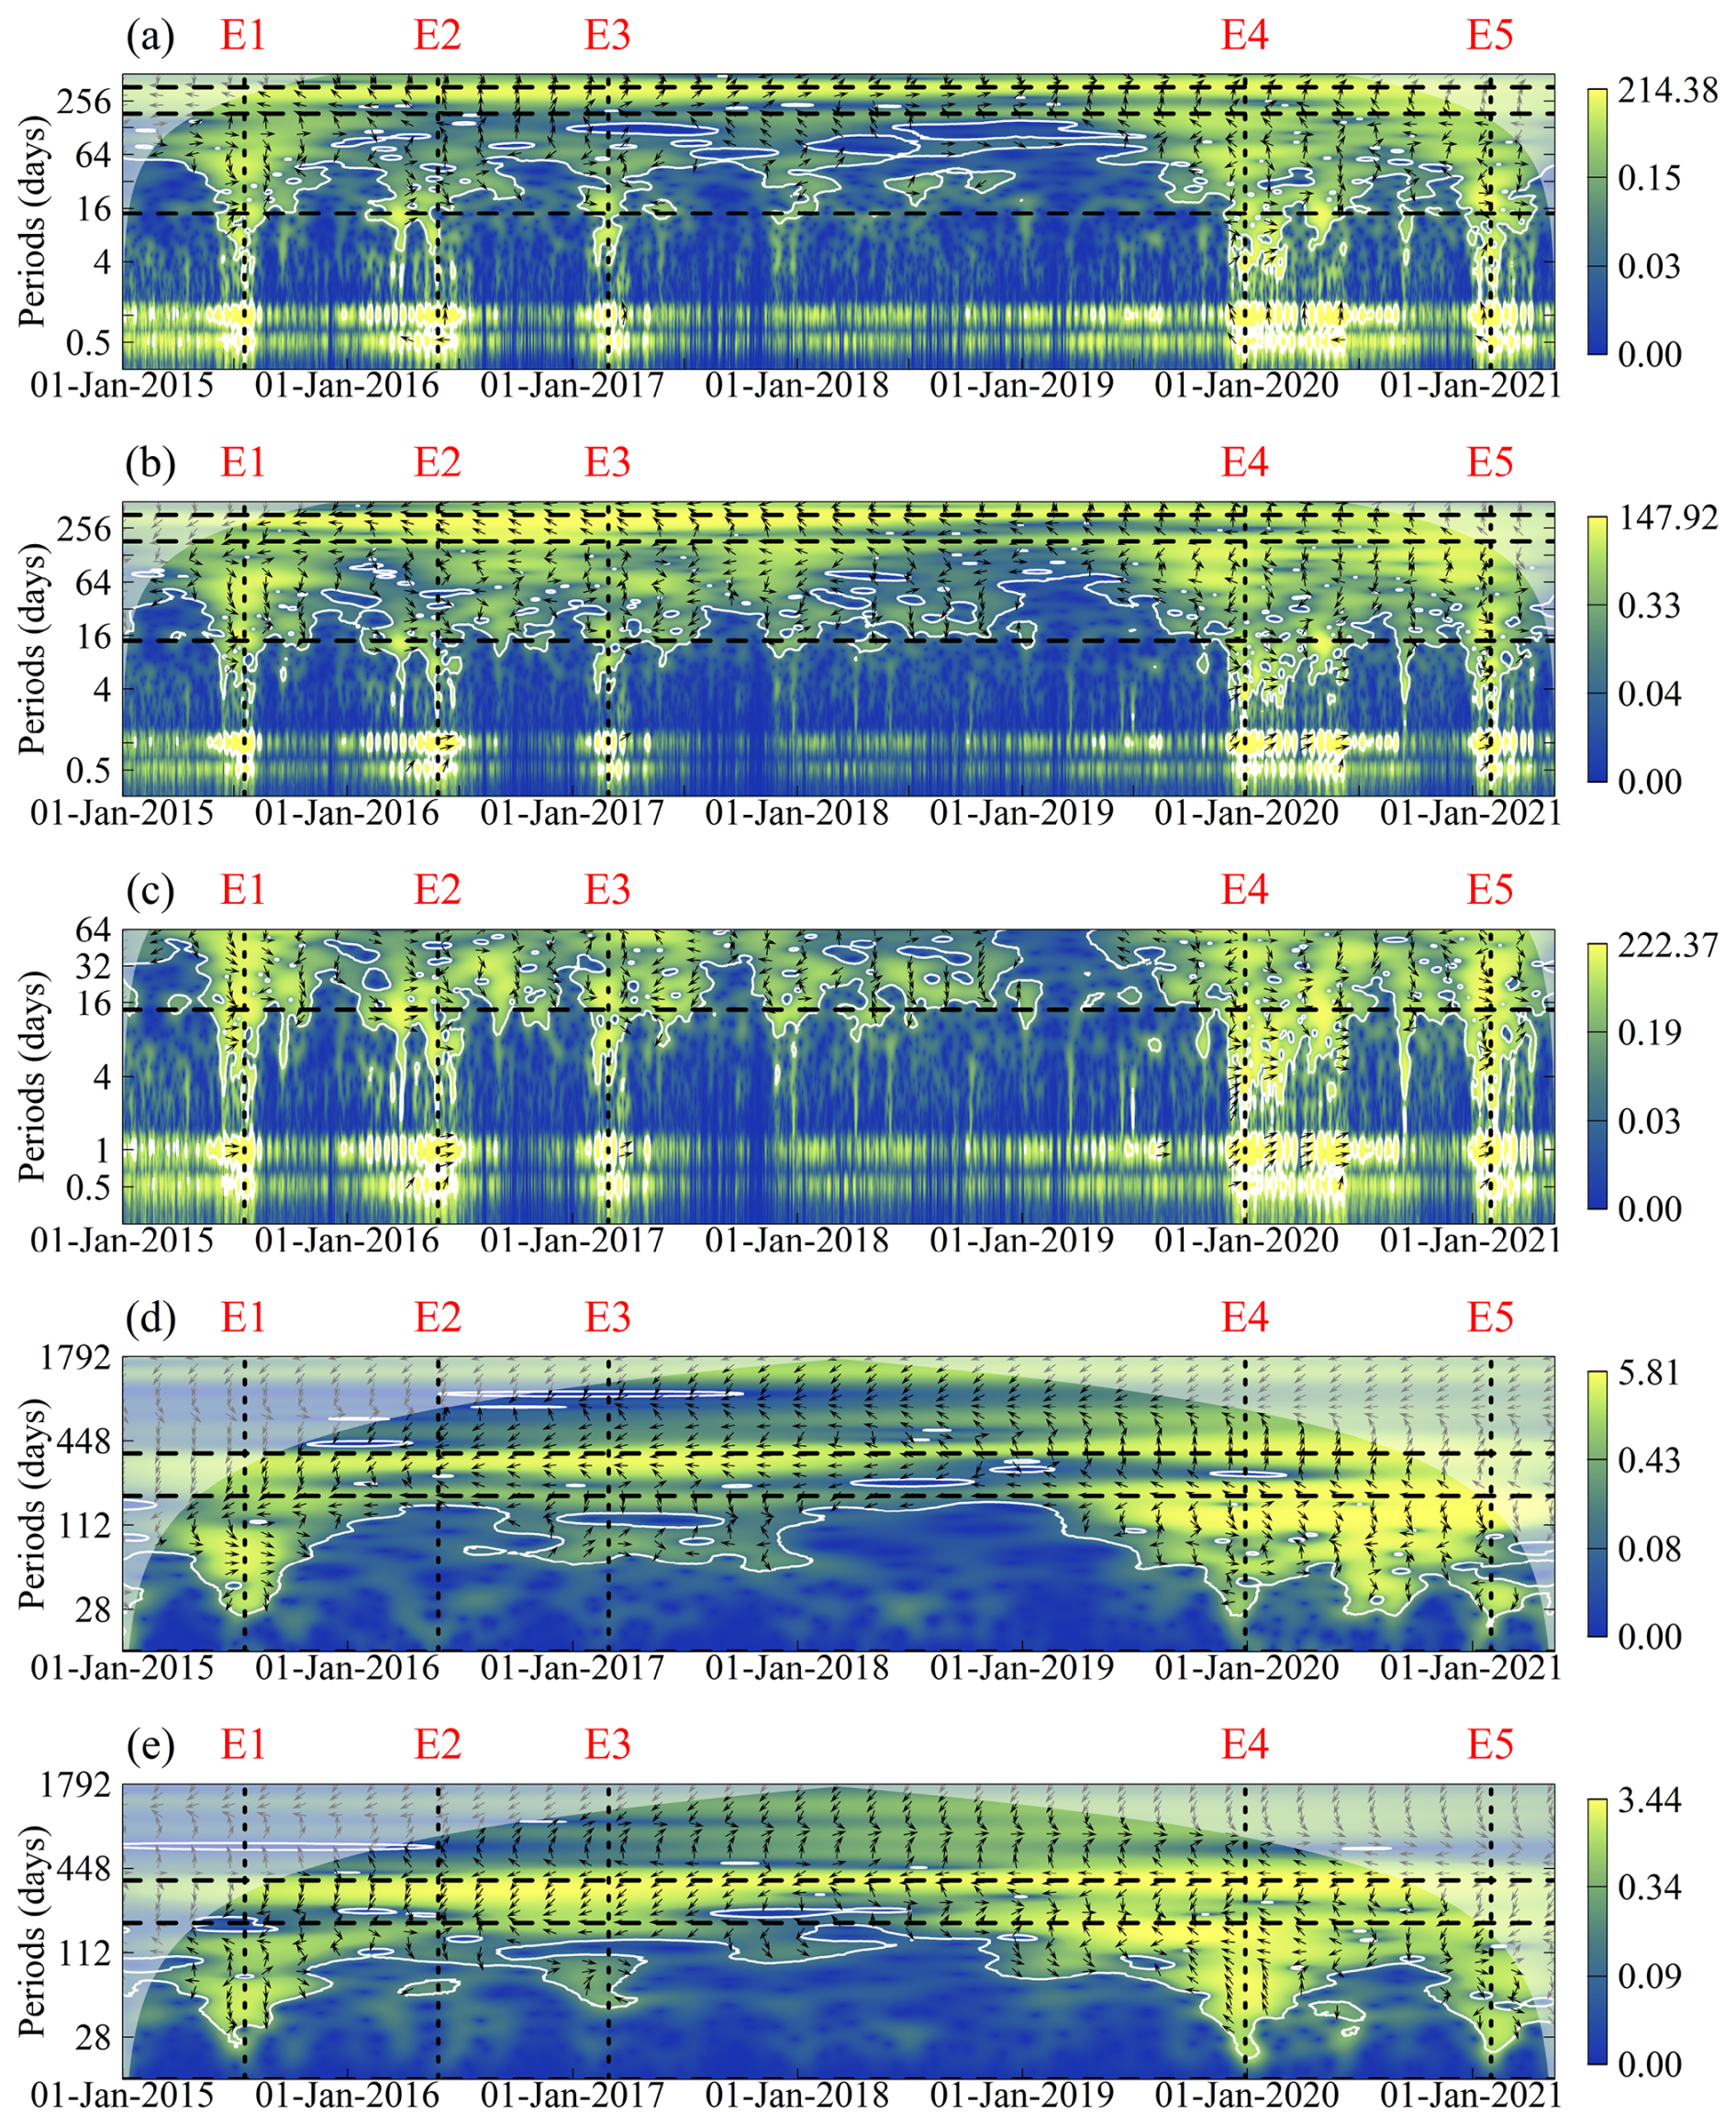
Figure 5The cross-wavelet power spectrum of paired time series displaying covariation patterns of salinity and its drivers across multiple scales: (a) water levels at the Tha Chin station (T1) and salinity at the Sam Lae station (S5). (b) Water levels and salinity observed at the Sam Lae station (S5). (c) Same as (b), but with the trend removed and zoomed into a 64 d period. (d) RSDA and ESI spectrum from 2015 to 2021. (e) RSPA and the ESI spectrum from 2015 to 2021. The horizontal black dashed lines mark periods of 14, 182, and 365 d. The vertical dashed lines and labels (E1–E5) correspond to key extreme salinity events, as indicated in Fig. 2. The arrows depict the local phase relationship between the two series: arrows pointing to the right indicate that the series are in phase; those pointing to the left indicate they are in anti-phase. Arrows directed upward mean the first series leads the second by a quarter cycle, while arrows directed downward mean the second series leads the first by a quarter cycle.
4.1 Influence of tidal and non-tidal factors on salinity variability
This section examines the relationship between water levels and salinity in the LCPYR using a cross-wavelet analysis. We analyze the water levels near the inner GOT at the Tha Chin station (T1 in Fig. 1) and salinity levels in the middle LCPYR at the Sam Lae station (S5 in Fig. 1) to understand their covariation patterns over time (Fig. 5). The cross-wavelet spectrum reveals significant covariation between salinity and both tidal components, including semi-diurnal and diurnal tides, and non-tidal influences. The periodicity structures can be broadly categorized as below:
Annual and sub-annual modes. The annual mode, characterized by a band of high spectral power surrounding the timescale of 356 d (Fig. 5a–b), is a fundamental contributor to salinity variability, persisting throughout the study period. Sub-annual modes, such as the half-year cycle, also play a significant role in intensifying covariation during drought events similar to E1, E4, and E5.
Fortnightly modes. Intermediate timescales around 14 d also show significant covariation with salinity extremes in the LCPYR. Notably, the spectral power of these modes is close to that of the tidal modes, particularly during events similar to E4 and E5. The significance of these modes becomes clearer when analyzing trend-removed water-level data (Fig. 5c).
Weekly and sub-weekly modes. Intermittent covariation at shorter timescales (4–7 d) is observed in Fig. 5c, with periods shorter than 4 d displaying more irregular patterns. These shorter-term modes also influence salinity intrusion events, particularly during E4 and E5. The significance of these modes, along with the other spectral components, underscores their role in the development of extreme salinity events in the LCPYR.
Tidal modes. The analysis in Fig. 5 also shows high spectral power centered on diurnal and semi-diurnal timescales (approximately 1.0 and 0.5 d, respectively). These active phases indicate a strong covariation between salinity and tides, with a slight phase lag of about 30 min, as indicated by the northward arrows. The covariation is most pronounced during the spring tides, with distinct active phases occurring during E1 through E5. These periods coincide with severe drought conditions, highlighting the increased influence of tides during low-flow periods. Conversely, during wetter years such as 2017 and 2018, and even most of 2019, the covariation weakens, indicating reduced tidal dependence for saltwater intrusion. When the water levels and salinity at the Sam Lae station are analyzed directly (Fig. 5b), the results display a similar periodic structure at diurnal and semi-diurnal timescales. However, more in-phase relationships emerge, as indicated by the eastward and northeastward arrows, with a shorter lag period of approximately 15 min. This observation reinforces the strong influence of tidal forces on salinity levels in the LCPYR.
The cross-wavelet analysis between water levels at the Tha Chin station and salinity at the Sam Lae station (Fig. 5a) and between water levels and salinity at the Sam Lae station (Fig. 5b), which is in the middle of the LCPYR, reveals the hidden role of oceanic long waves in driving salinity dynamics in the LCPYR. A combination of both tidal and non-tidal modes is necessary to fully explain the salinity variability. While daily and shorter-period variations are largely driven by tidal effects, longer-term sea-level fluctuations including fortnightly, sub-annual, annual modes, and others contribute significantly to the development of extreme salinity events. This finding underscores the importance of understanding salinity variability beyond just tidal influences. Further investigation into other key factors, such as drought conditions, is essential to fully comprehend the mechanisms behind salinity intrusion in the LCPYR. Evidence of these relationships will be discussed in the next section.
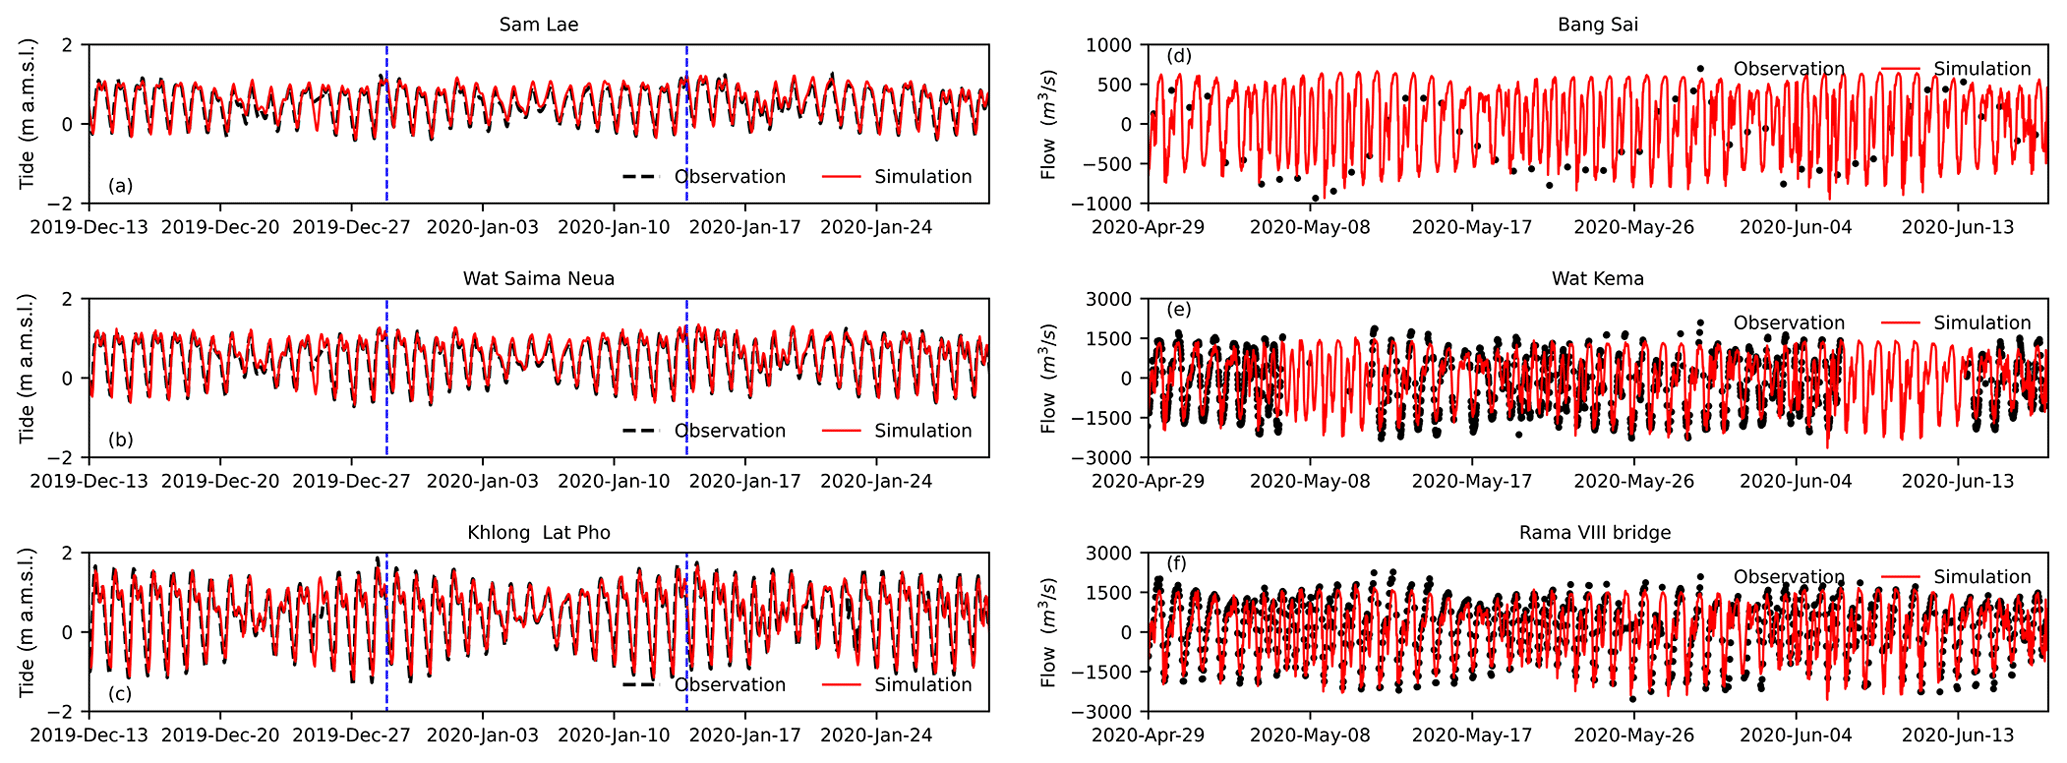
Figure 6Comparisons of the observed and modeled water levels and flow rates at key stations along the LCPYR. (a) Observed and modeled water levels at Sam Lae (S5). (b) Wat Saima Nuea (S4). (c) Khlong Lat Pho (S2). The vertical dashed blue lines mark the periods of peak salinity on 28 December 2019 and 13 January 2020. Water levels are shown in m a.s.l. (d) The observed and modeled flow rates at Bang Sai (C3). (e) Wat Kema (C2). (f) Rama VIII Bridge (C1). Flow rates are presented in cubic meters per second (m3 s−1), with black dots representing observations and red lines indicating model outputs.
4.2 Influence of hydro-meteorological drought on salinity intrusion
This section explores the variability of salinity in relation to hydrological and meteorological drought conditions. We analyze the combined discharge from the upstream CPY and Rama VI Dams, standardized as the RSDA, alongside salinity levels measured at the water abstraction unit in the middle LCPYR at the Sam Lae station, as represented by the ESI. Figure 6 presents the periodic structure of covariation between the RSDA and ESI, revealing patterns at weekly, monthly, and yearly timescales. These patterns offer insights into the origins and peak periods of saltwater intrusion events. For clarity, the periodic structures are categorized as follows:
Annual mode. In Fig. 5d, the high spectral power centered around the annual timescale shows a strong covariation between salinity and hydrological drought conditions. Initially, the phase relationship demonstrates a drought-leading characteristic (indicated by westward and southwestward arrows). However, after 2019, this shifts to a salinity-leading pattern (northward arrows), likely due to the intensification of drought conditions (RSDA below −5.0; Fig. 2a) following the extreme salinity peak in January 2020 (Fig. 2c). Events E4 and E5 appear to be driven by this drought propagation mechanism.
Sub-annual mode. High spectral power with a half-year period (182 d) and its surrounding timescales is also prominent, particularly between 2019 and 2021. As shown in Fig. 5d, the drought-leading relationship is more pronounced in this mode compared to the annual mode. Shorter timescales, around 112 d and below, exhibit intermittent significance. The intensification of spectral power around the half-year mode and shorter periods aligns with the E4 and E5 events. Possibly, these sub-annual periods and shorter timescales likely stem from dam discharge regulations, such as the water hammer effect. Despite large negative RSDA values during E4 and E5, a strong covariation with the ESI is maintained, suggesting that water management plays a significant role in handling saltwater intrusion, although other contributing factors must also be considered.
To further explore the influence of drought on salinity variability, we analyze the RSPA and how it covaries with the ESI (Fig. 5e). The annual mode remains dominant, with intermittent significance in sub-annual modes such as the half-year and shorter timescales. The phase relationship in the annual mode shows a more pronounced drought-leading pattern (westward arrows), particularly between 2019 and 2021. The weak and active phases of the half-year mode resemble those of the RSDA, but the RSPA exhibits stronger covariation at shorter timescales (shorter than 112 d), providing additional insight into extreme salinity events like E4. In contrast, the shorter timescales for the RSDA exhibit more intermittent behavior, suggesting that meteorological drought indices like the RSPA are crucial for understanding the origins of extreme salinity intrusion in the LCPYR.
The lack of correlation between salinity and the RSDA in 2020 offers critical insights into the dynamics of saltwater intrusion in the LCPYR. Despite severe drought conditions, indicated by low RSDA values in mid-June 2020 (Fig. 2a), the salinity levels at the Sam Lae station receded instead of increasing as expected. This discrepancy raises questions about whether the low discharge rates (60–65 m3 s−1) were enough to mitigate intrusion or if additional factors played a role. Possible explanations include reduced agricultural water withdrawal or successful mitigation efforts during that period. Additionally, discharges from Bangkok's catchment areas likely contributed to further salinity dilution downstream, adding complexity to the relationship between drought and salinity.
To explore these dynamics, we analyzed the rainfall variability during the salinity recession periods of 2020 and 2021 (Fig. S2). Rainfall deviated from climatological norms, especially in 2021, when rainfall over Bangkok exceeded 100 mm between April and May (Fig. S2b). Although the exact causes of these anomalies remain outside the scope of this study, we hypothesize that intensified southerly winds, transporting moisture from the GOT, may have contributed to the unusual rainfall in central Thailand, as seen in 2019 and 2020. Meteorological drought, represented by the RSPA, likely exacerbated water losses, intensifying the salinity in the freshwater zone. In contrast, anomalously high rainfall over Bangkok during these periods could explain the rapid salinity dilution. Runoff, sometimes exceeding 100 m3 s−1, was discharged into the LCPYR through drainage systems at Bang Sue and Makasan (BC3 and BC2, respectively, in Fig. 3a), further diluting the salinity downstream. These RSDA-driven rainfall patterns provide further insight into the complex salinity dynamics observed in the lower LCPYR.
Our analysis identifies key drivers of salinity intrusion during 2015–2021. Oceanic factors and drought conditions play crucial roles in modulating sub-annual salinity variability. However, the wavelet analysis does not pinpoint a definitive origin for the phenomenon. We hypothesize that hydrological drought acts as a fundamental driver by shifting the river to a tide-dominated regime, which enables non-tidal sea levels to push the saltwater into the freshwater zone. Tidal waves then amplify the salinity extremes. Increasing the upstream inflow dilutes salinity, while urban runoff significantly accelerates the dilution process. These findings will be further validated in the numerical simulations in the following section.
4.3 Numerical simulations and sensitivity analysis
In this section, we present the results of our numerical experiments conducted to support our data analysis and validate the interpretations made in earlier sections. Our goal is to deepen our understanding, ultimately facilitating the development a numerical model used for salinity prediction with high accuracy in the LCPYR. We employ the state-of-the-art SCHISM model (Zhang et al., 2015, 2016) as the primary tool for this analysis. With the SCHISM model properly configured, we accurately reconstruct the hydrodynamics and salinity dynamics during the 2019–2020 and 2020–2021 periods. The key results are presented below.
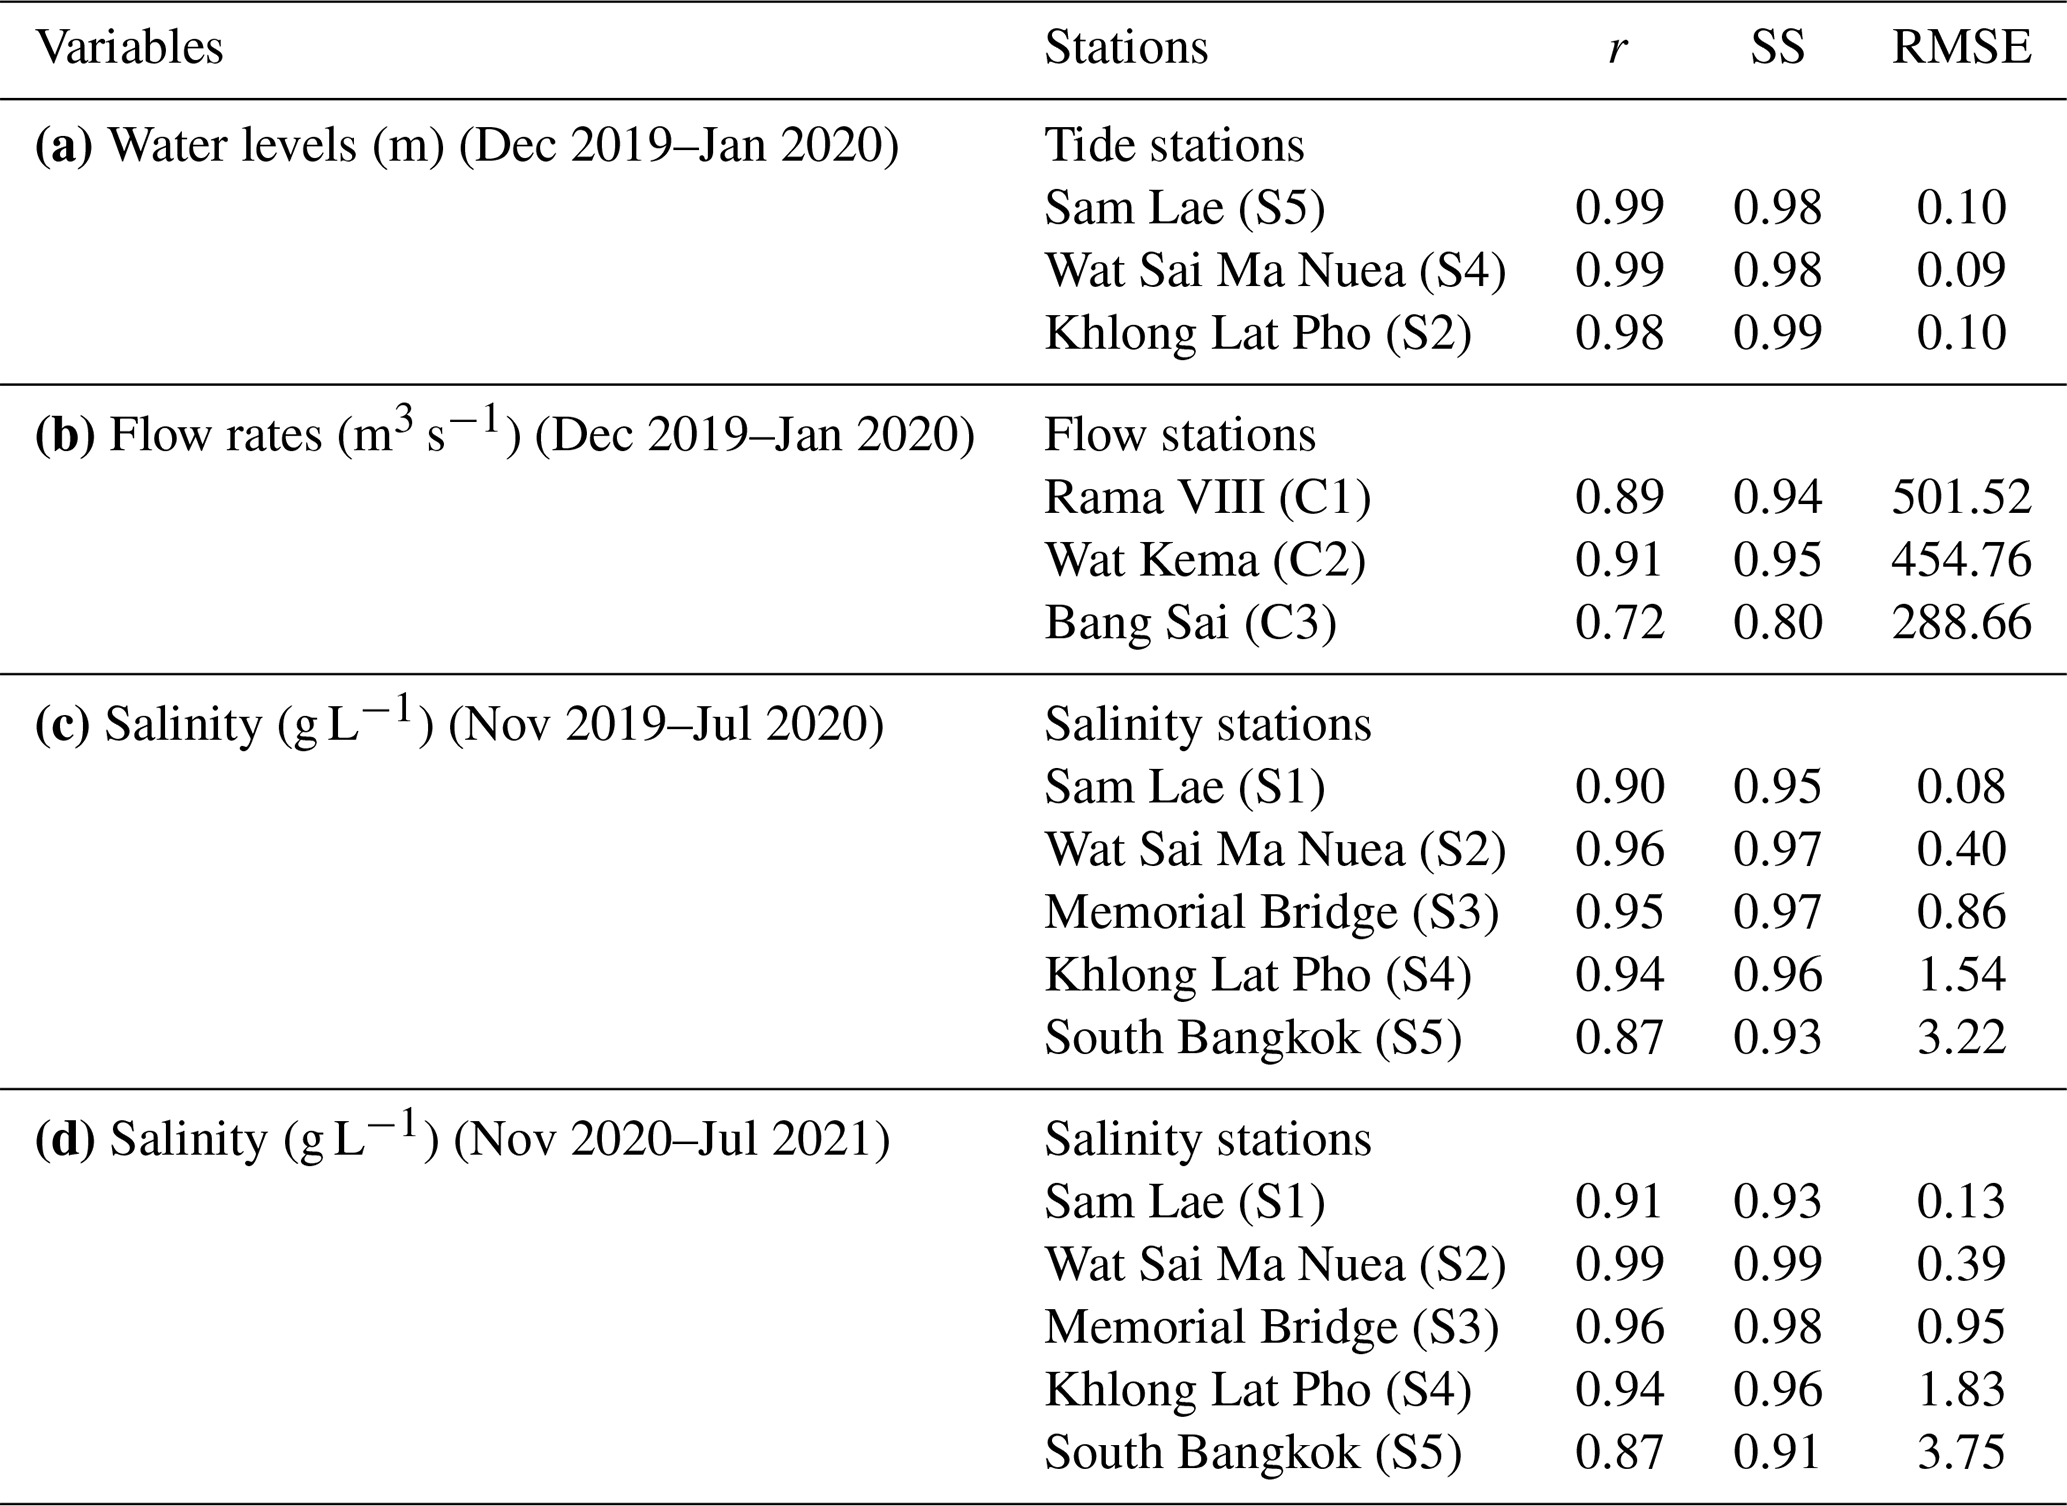
Table 1Correlation coefficients (r), model skill scores (SS), and the RMSE of the modeled (a) water levels, (b) flow rates, and (c–d) salinity, compared with the observational data at various stations.
4.3.1 Hydrodynamic and salinity model validation
Our initial focus is on modeling the hydrodynamic phenomena in the LCPYR, starting with the validation of the model during one of the most extreme salinity periods (from late 2019 to early 2020). Once the model's performance is confirmed, we proceed with modeling the salinity dynamics. Validation results for the hydrodynamic properties, including water levels from various stations along the river, are presented in Fig. 6 and Table 1.
Capturing the unique dynamic mechanism of tidal transformation highlights the model's accuracy and validates its configuration. In Fig. 6, the decrement of higher high water (HHW) is clearly visible as it progresses upstream. In contrast, the lower high water (LHW) shows the opposite behavior, increasing slightly upstream. These terms are defined as follows: HHW refers to the higher of the two daily high tides, while LHW denotes the lower of the two. This distinction is particularly relevant in semi-diurnal tidal regimes, which feature two high and two low tides each day (National Oceanic and Atmospheric Administration (NOAA), 2020).
This shift in HHW and LHW magnitudes emphasizes the intricate dynamics between tidal propagation and river flow. The model accurately captures two significant events of extreme salinity, occurring on 28 December 2019 and 13 January 2020, as marked by the blue vertical lines in Fig. 6a–c. These events are critical to understanding the extreme salinity conditions in the LCPYR. These results underscore the robustness of the SCHISM model in simulating tidal dynamics and predicting critical salinity events.
Considering the resonant properties of the GOT (Tomkratoke et al., 2015), the HHW is primarily induced by the most energetic tidal components, particularly the diurnal tides (e.g., K1 and O1 in Fig. 6 of Tomkratoke et al., 2015). In contrast, the LHW is associated with the oscillation of semi-diurnal tidal signals (e.g., S2 and M2 in Fig. 6 of Tomkratoke et al., 2015), which may be linked to the formation of the fortnightly tide inside the estuary, driven by the modulation of semi-diurnal tides (Hill, 1994; MacMahan et al., 2014). Our results demonstrate that the transformation mechanisms of tidal waves in the LCPYR are accurately resolved by the current solver. This indicates that the model’s domain design, decomposition, turbulence model configurations, numerical scheme selection, and balance between dispersion and diffusion are all properly determined. Additionally, the open boundary forcing data (ocean-side) are appropriately prescribed. Overall, the model achieves a high correlation coefficient (r) and skill score of over 0.90, with a low RMSE of 0.10 m or less at every tide station considered (Table 1a).
For tidal current validation, although limited data are available, a 54 d time series of water flow from April to June 2019 was used to validate the model results. The locations of the flow observation stations are shown in Fig. 1. Hourly flow rates are measured at two stations, Rama VIII Bridge (C1) and Wat Kema (C2), and daily flow rates, measured at 06:00 THA, is from the Bang Sai station (C3). Comparisons of the observed and modeled river flows are presented in Fig. 6d–f.
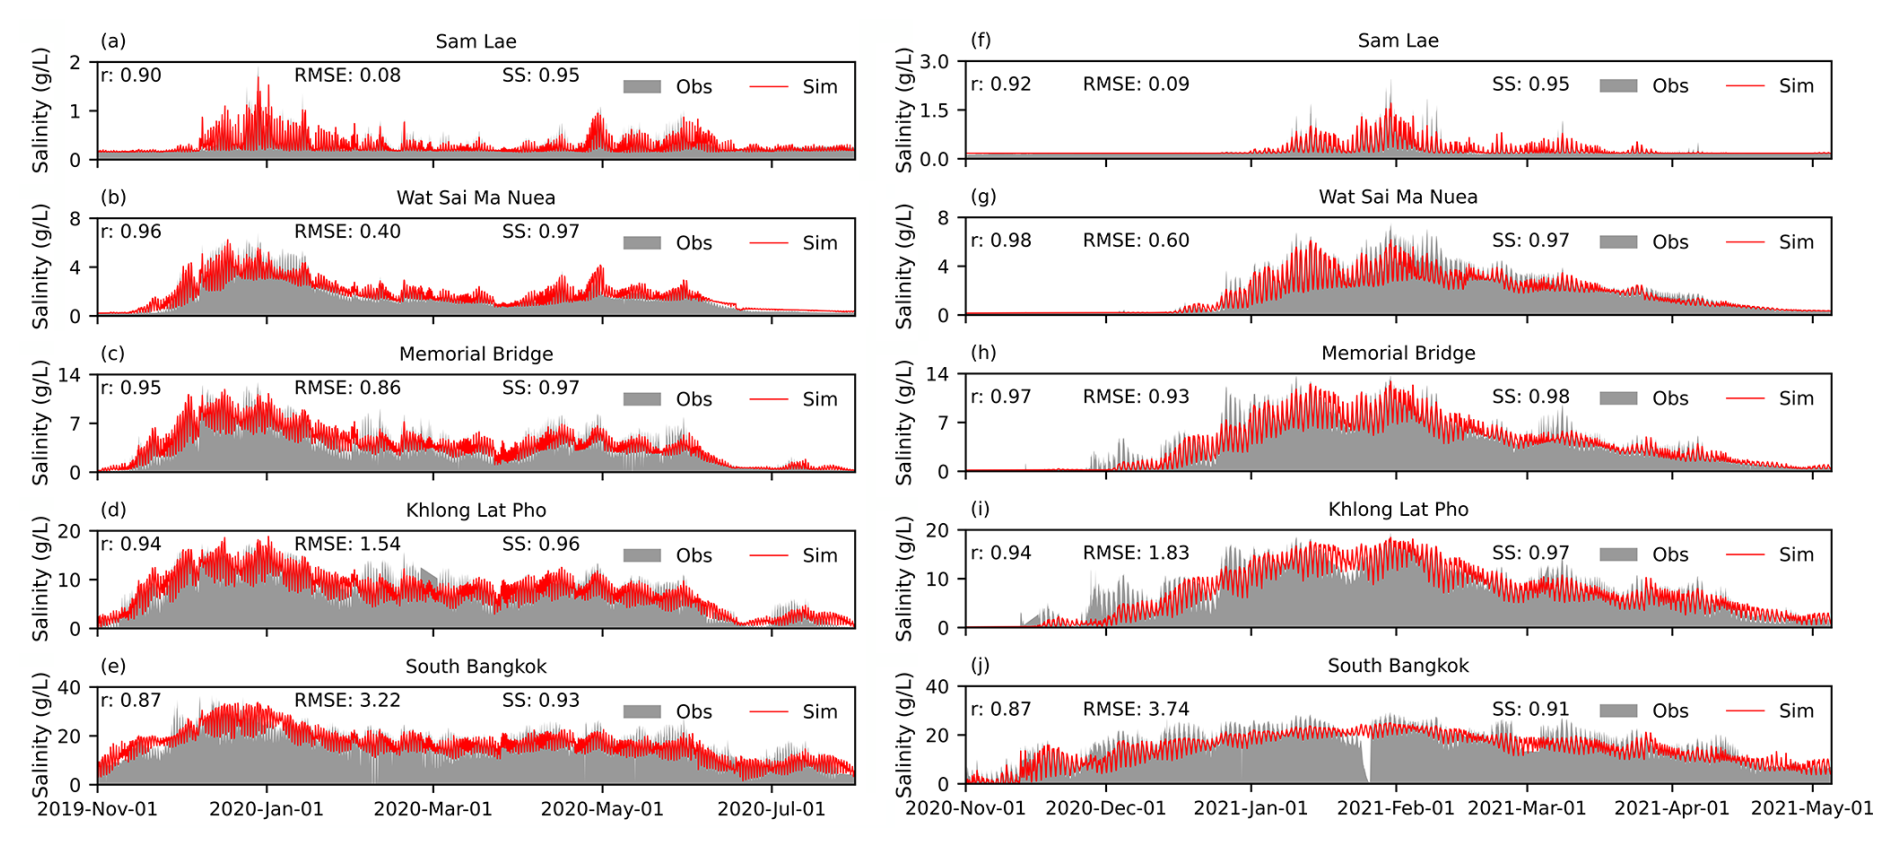
Figure 7Comparisons of the observed and modeled salinity levels across key stations for two periods. (a) Sam Lae (S5) for November 2019 to July 2020. (b) Wat Sai Ma Nuea (S4) for the same period. (c) Memorial Bridge (S3) for November 2019 to July 2020. (d) The Khlong Lat Pho station during November 2019 to July 2020. (e) South Bangkok (S1) during November 2019 to July 2020. (f–j) Same as in panels (a–e) but showing December 2020 to May 2021 for all stations. The filled gray areas represent the observed salinity in g L−1, and the red lines indicate the modeled salinity. Note: the Y-axis ranges differ between panels. The station locations are shown in Fig. 1.
As shown in Table 1b, although the model achieves good correlation coefficients (r) ranging from 0.86 to 0.89 and model skill scores between 0.7 and 0.94, it tends to underestimate the highest tidal current magnitudes. Consequently, the RMSE for the modeled tidal currents reaches 400.0–500.0 m3 s−1. We speculate that the performance of the tidal current simulation can be improved in future work, particularly by incorporating updated bathymetry data and refining the vertical layers of the model. Despite this limitation, the model successfully captures the overall dynamic behavior of the tidal currents, which is sufficient to represent the key hydrodynamic mechanisms during the tide-dominated phases in the study area. Given this balance, we accept the current level of model discrepancy and proceed with the salinity simulation.
Figure 7 compares the observed and modeled salinity, focusing on variation patterns to interpret the simulation's behavior. Daily-scale variations correspond to tide-controlled processes, while longer periods are attributed to upstream discharge effects and non-tidal influences, as discussed in the previous section on wavelet analysis.
Figure 7a–e demonstrates the model's accuracy in representing the extreme salinity intrusion from December 2019 to July 2020. The model accurately captures the tidal modes of salinity variability. Although occasional small overestimations or underestimations occur over the extended simulation period, the model resolves the long-term recession trend in salinity with high precision (Fig. S3). Table 1c shows that the correlation coefficients and model skill scores reach values as high as 0.90 for most stations. The RMSE values at the Sam Lae, Wat Sai Ma Nuea, Memorial Bridge, Khlong Lat Pho, and South Bangkok stations are 0.08, 0.40, 0.86, 1.54, and 3.22 g L−1, respectively.
One of the most extreme salinity intrusions in the last decade occurred from November 2020 to June 2021. As shown in Fig. 7f–j, the model accurately captures the dynamic behaviors at the daily timescale and demonstrates strong potential for long-term forecasting. Table 1 indicates high correlation coefficients and model skill scores for the salinity prediction, exceeding 0.90. However, in the early stages, the model slightly underperforms in capturing the salinity maxima at lower stations, resulting in a modest increase in the RMSE. As the simulation progresses over the longer time span, these discrepancies diminish. Additionally, the modeled salinity time series' recession trends closely match the observed data across all stations (Fig. S4).
During June to July 2020 and April to May 2021, the recession trends in salinity closely align with the characteristics of the BMA flood discharges, particularly the contribution from the Bang Sue tunnel (Figs. 4d and S1d). The rapid increase in the flow rate is accompanied by a significant reduction in salinity levels (Figs. 4f and S1f). This observation further supports the interpretation of the major drivers behind the periods of non-dependence between salinity and drought conditions, as discussed earlier.
4.3.2 Sensitivity analysis of the model
In this section, we investigate the sensitivity of the model's response to variations in boundary condition settings. Specifically, we focus on how changes in freshwater flux and water elevation at the boundaries affect model outputs. The aim is to assess the extent to which uncertainties or errors in these boundary conditions influence the accuracy of the model's predictions. By analyzing the model's sensitivity to different boundary condition definitions and input values, we can quantify their contributions to the overall model uncertainty. Ultimately, this sensitivity study helps identify uncertainties arising from unknown characteristics or values in the model inputs. To achieve this, we alter the boundary conditions from our best-fit setup. First, we examine the model's response to variations in freshwater fluxes prescribed at the upstream boundary conditions (Fig. 3), side-flow inputs, and water losses.
The freshwater flux magnitudes are defined as a net inflow (Qn), which represents a balance of the diverted water and water losses (Eq. 3). The diverted water includes total inflow (Qu) from upstream boundary fluxes and possibly from tributary rivers (Tf) or watersheds (BMA). Meanwhile, the water losses include major abstractions (Ma) at the Sam Lae station and local abstractions (La) along the river:
where Qn is the net inflow, Qu is the total upstream discharge from the CPY Dam (QCPY) and Pasak (Rama VI Dam; QPS) rivers, Tf represents the flows from the Tha Chin River diverted to the Singhnat (TSN) and Bang Buatong (TBBT) gates, BMA is the treated water discharge from the Bangkok Metropolitan Administration, Ma is the major abstraction at the Sam Lae station, and La represents the local abstractions.
Net inflow conditions and their role in the January 2020 high-salinity intrusion
An extreme salinity intrusion event occurred during the winter of 2020, highlighting the critical role of net freshwater inflow in regulating estuarine salinity. In January 2020, during peak salinity conditions, the estimated net inflow to the LCPYR was approximately 112.0 m3 s−1. Under typical conditions, this level of inflow would be expected to support substantial dilution. However, intrusion intensified despite this apparent buffering capacity. To understand this unexpected outcome, we examined the hydrological conditions prior to the peak event. Before 20 November 2019, the Chao Phraya Dam discharge was approximately 70.0 m3 s−1, with no side-flow contributions and water losses exceeding 10.0 m3 s−1. As previously noted, flows from the BMA are excluded from the analysis when focusing solely on the freshwater zone. At the onset of the intrusion, the net inflow fell to as low as 6.0 m3 s−1, which was insufficient to prevent saline water from the GOT from advancing into the freshwater zone. The simulation results confirm that this low inflow prior to the peak period was a critical factor contributing to the subsequent saltwater intrusion. In response to rising salinity levels, mitigation measures were implemented in January 2020. These included increased upstream discharges and water diversions from tributary rivers into the LCPYR. During this period, upstream dam discharges averaged 91.0 m3 s−1. Side-flow contributions, based on discharges from stations BC9 and BC10, added approximately 39.0 m3 s−1. The BMA contributed an average of 46.2 m3 s−1, while the model calibration suggests that the local abstraction averaged 9.4 m3 s−1. Combined, these components result in a net inflow of approximately 112.0 m3 s−1.
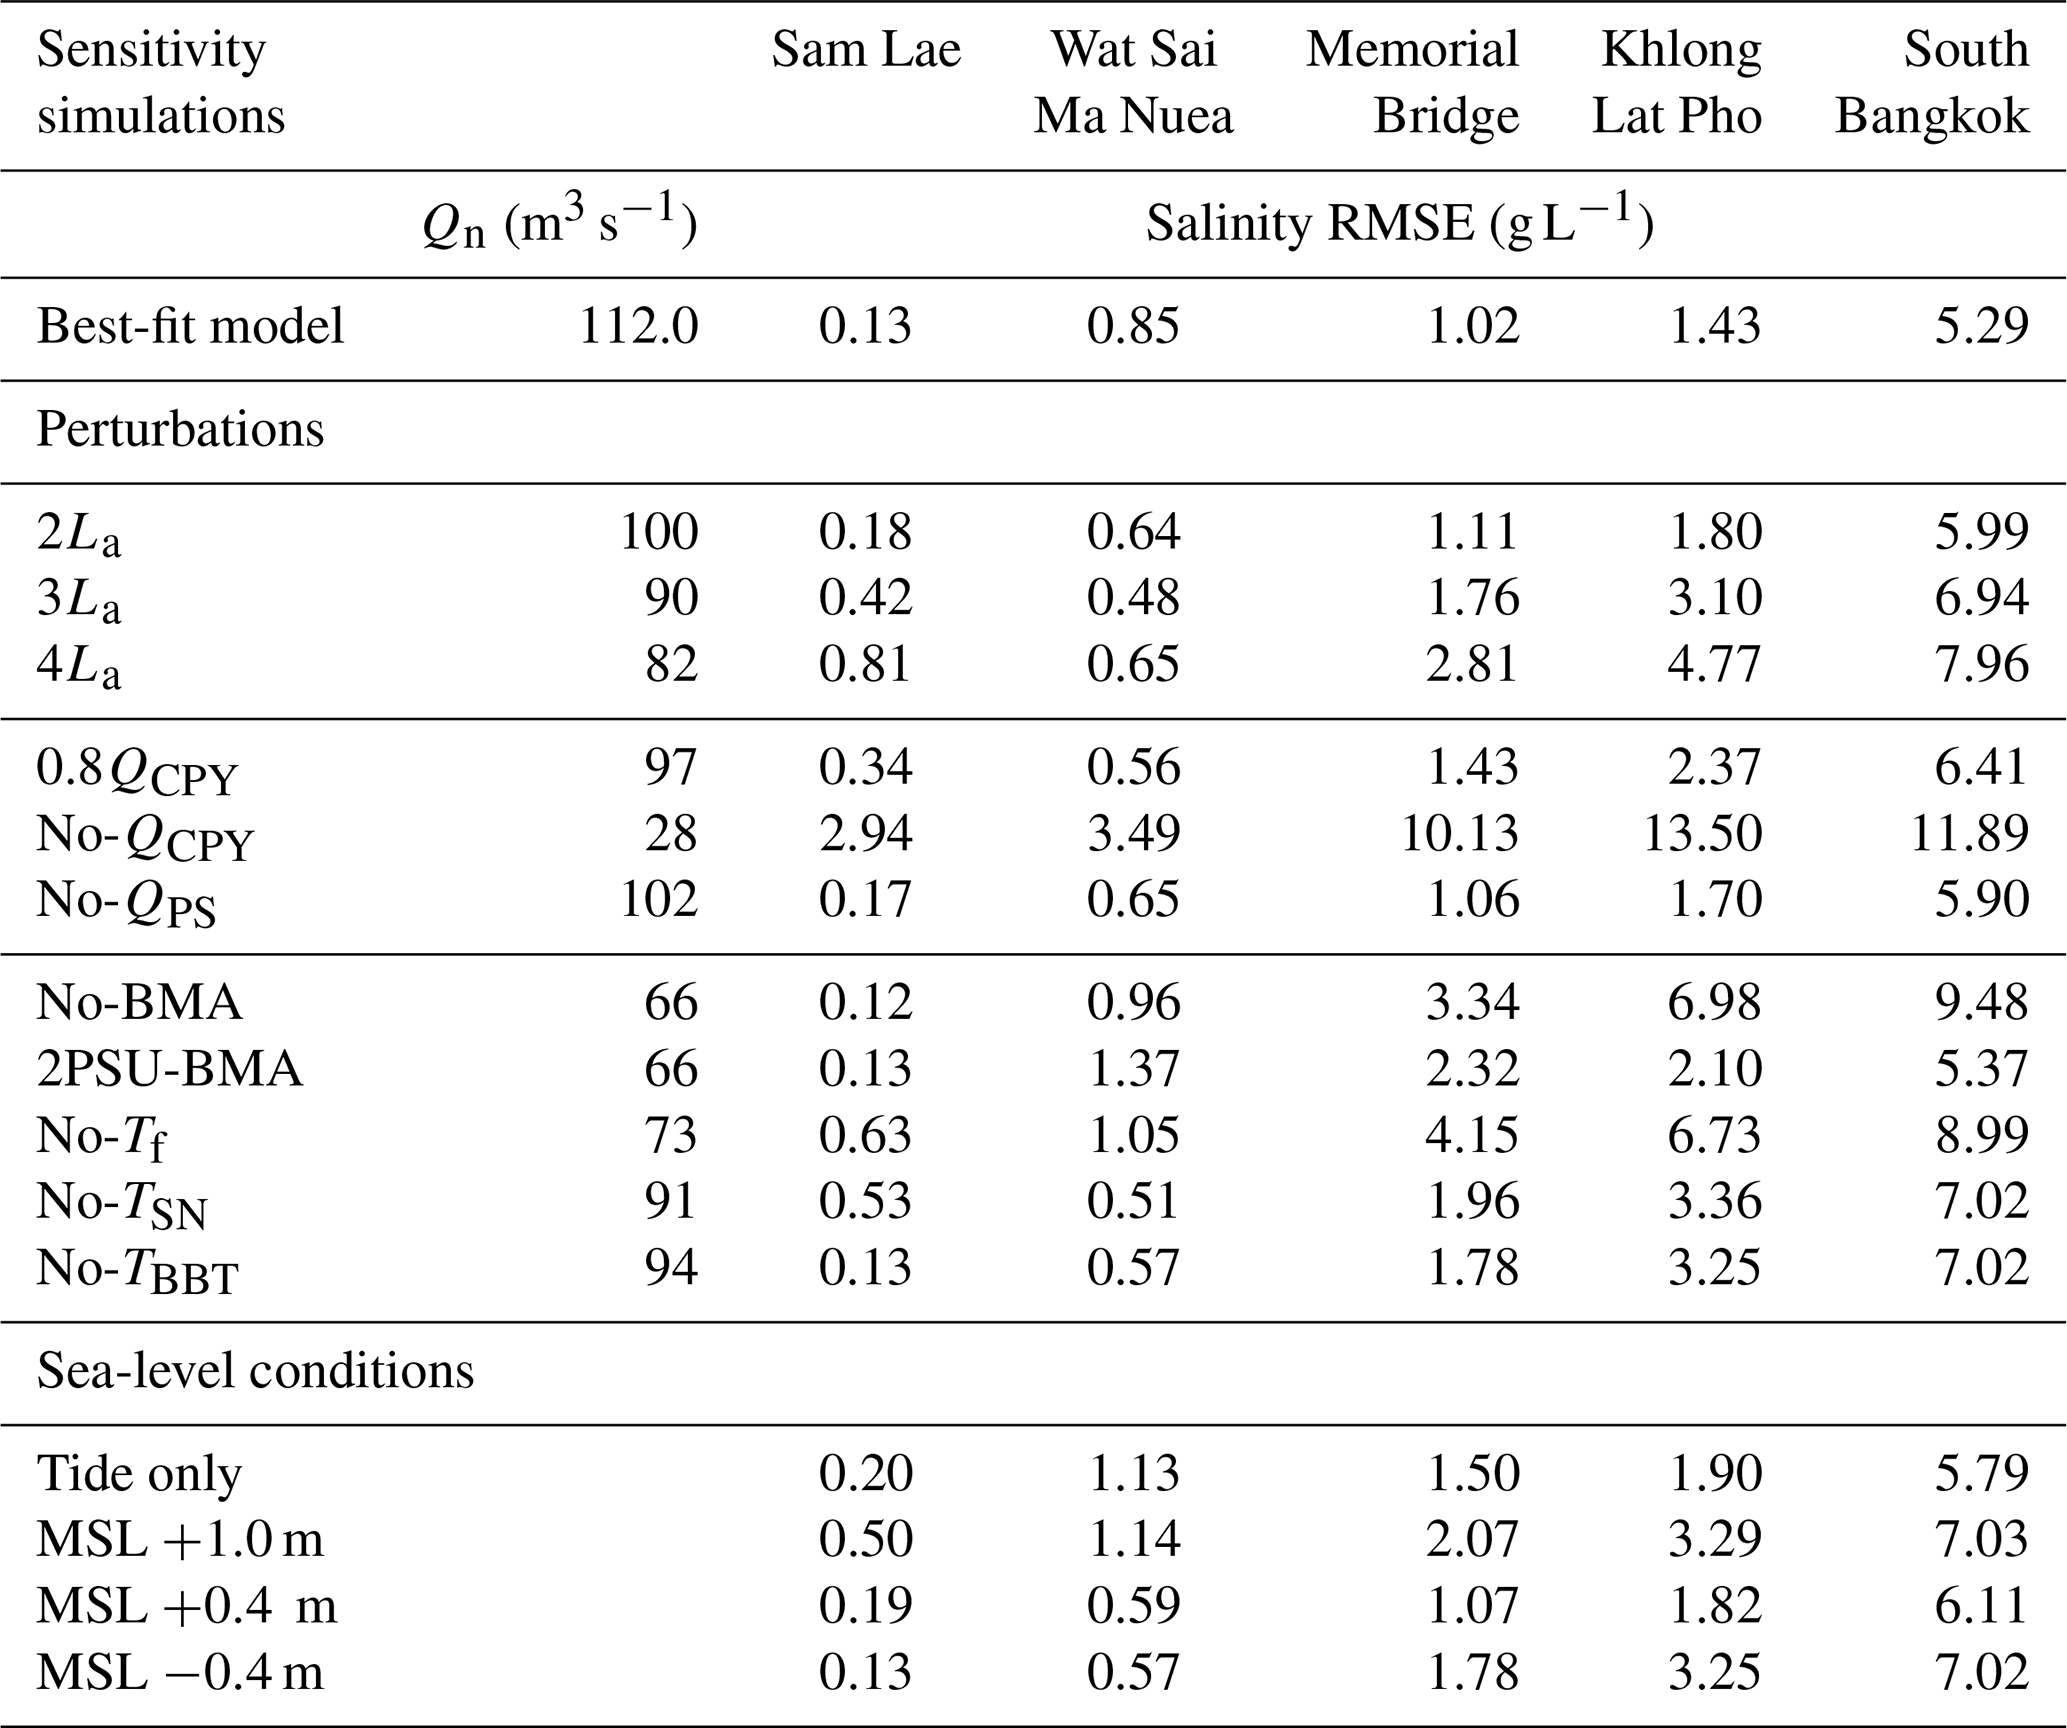
Table 2The salinity RMSE in g L−1 at five different stations for sensitivity simulations representing the extremely high salinity event in early 2020. The best-fit model is also shown for reference. For the sensitivity simulations, different inflow conditions (Qn) are achieved by perturbing various variables on the right hand side of Eq. (3): perturbing the local abstraction (La), perturbing the upstream discharge at the CPY and Pasak (PS) Dams (QCPY and QPS, respectively), perturbing the treated water discharge from the Bangkok Metropolitan Administration (BMA), and removing flows from the Tha Chin River diverted to the Singhnat (TSN) and Bang Buatong (TBBT), and both (Tf). Additionally, various sea-level conditions are also perturbed for the sensitivity test.
Sensitivity analysis and salinity modeling insights
Sensitivity to local abstraction. Local abstraction (La), although not directly measurable, was estimated through the model calibration. During the winter of 2019 to summer 2020, the best-fit simulation suggests an average abstraction of 9.4 m3 s−1, with peak values ranging from 30.0 to 48.0 m3 s−1, as shown in Fig. 4c. The sensitivity analysis was performed by increasing the abstraction rate at Bang Kaew (BC6) to two, three, and four times the baseline value. Table 2 presents the resulting RMSE values at Sam Lae. The results indicate that higher abstraction rates are associated with increased RMSE, highlighting the influence of local abstraction on salinity behavior in the freshwater zone.
Sensitivity to upstream discharge. We tested the model's sensitivity to upstream discharge by reducing the Chao Phraya Dam flow (QCPY) by 20 % and by completely removing QCPY (BC7) and the Pasak River flow (QPS at BC5). These scenarios result in substantial increases in the RMSE, particularly at Sam Lae, where the net inflow decreased to approximately 28.0 m3 s−1. In contrast, reducing QPS alone had a smaller effect. These findings confirm the dominant influence of QCPY in controlling salinity dynamics, especially under drought conditions.
Sensitivity to side flows. Perturbations to side flows, including the BMA discharge and tributary contributions from the Tha Chin River (TSN and TBBT), produced varied impacts across the estuary. Excluding Tf resulted in a fivefold increase in the RMSE at Sam Lae. Excluding the TBBT flow reduced the net inflow to 94.0 m3 s−1 but had minimal impact on salinity in the freshwater zone. Reducing the TSN inflow produced a similar net inflow but led to increased peak salinity and higher mean salinity across all stations. Omitting the flow from TBBT had little effect on the freshwater zone but increased the model error in tide-dominated regions including Memorial Bridge (S3), Khlong Lat Pho (S4), and South Bangkok (S5). Notably, reducing the BMA flow resulted in greater model error than reducing TBBT. This indicates that the BMA discharge is a critical factor in regulating salinity. Additionally, decreasing the BMA salinity concentration by 75 % increased the RMSE across most stations and intensified salinity recession trends, as shown in Fig. S6c and d.
Sensitivity to sea-level conditions. Sea level is a critical input in salinity intrusion modeling, particularly in estuarine environments. As discussed earlier, the covariation between sea level and salinity observed during the winter of 2020 indicates complex interactions (Fig. 5). To evaluate the model's sensitivity to the sea level, we conducted a series of simulations that removed storm surge components and adjusted the MSL. The results, presented in the lower section of Table 2 and in Fig. S6d, show that excluding the storm surge effects (tide-only scenario) increases the RMSE by approximately 1.5 times. Furthermore, raising the MSL by 1.0 m results in a fourfold increase in the RMSE. Although abrupt MSL adjustments of ±0.4 m cause short-term changes in salinity intrusion, they have limited impact on the long-term or mean state of salinity within the system. These results suggest that temporal variability in the sea level, such as episodic storm surges or sub-seasonal fluctuations, plays a more influential role in driving salinity dynamics than changes in the absolute sea level. This finding emphasizes the importance of incorporating real-time or high-resolution sea-level data in predictive modeling frameworks for salinity intrusion.
Summary of findings. The model's RMSE values show strong sensitivity to upstream inflow and local abstraction, affirming their importance in shaping salinity dynamics in the LCPYR. Salinity in the freshwater zone is controlled primarily by upstream inputs, specifically the discharge from the Chao Phraya Dam and the side flow TSN. While side flows from the BMA and TBBT play a greater role in tide-dominated areas, their impact on the freshwater zone is more limited. Sea-level variability at the downstream boundary, although temporary in effect, also influences model accuracy. These sensitivity analyses support the classification of salinity responses into drought-dependent and relaxation mechanisms, consistent with wavelet-based findings. The drought-dependent mechanism highlights the significance of regional scale hydro-climatic variability, while the relaxation response reflects temporary wet conditions driven by local hydro-climatic variability. The model also helps identify and rank key contributing factors to salinity intrusion. For example, local water abstraction and downstream urban runoff, which are often overlooked, were shown to be substantial influences. These factors correspond with patterns revealed by the wavelet analysis and enhance confidence in the model configuration.
Table 3An overview of scenarios for model application and testing, focusing on four approaches: (1) water abstraction locations, (2) reservoir regulation plans, (3) side-flow management strategies, and (4) the influences of non-tidal sea levels on salinity intrusion in the LCPYR. The first three approaches focus on assessing changes in the flow rates (Qn) at Sam Lae by perturbing different forcings, while the fourth approach focuses on changes in the water level (m a.s.l.) at Sam Lae when non-tidal sea levels are perturbed. Each of the initial forcings are perturbed at various locations, from BC1 through BC10 and at Rangsit, as shown in Fig. 3.
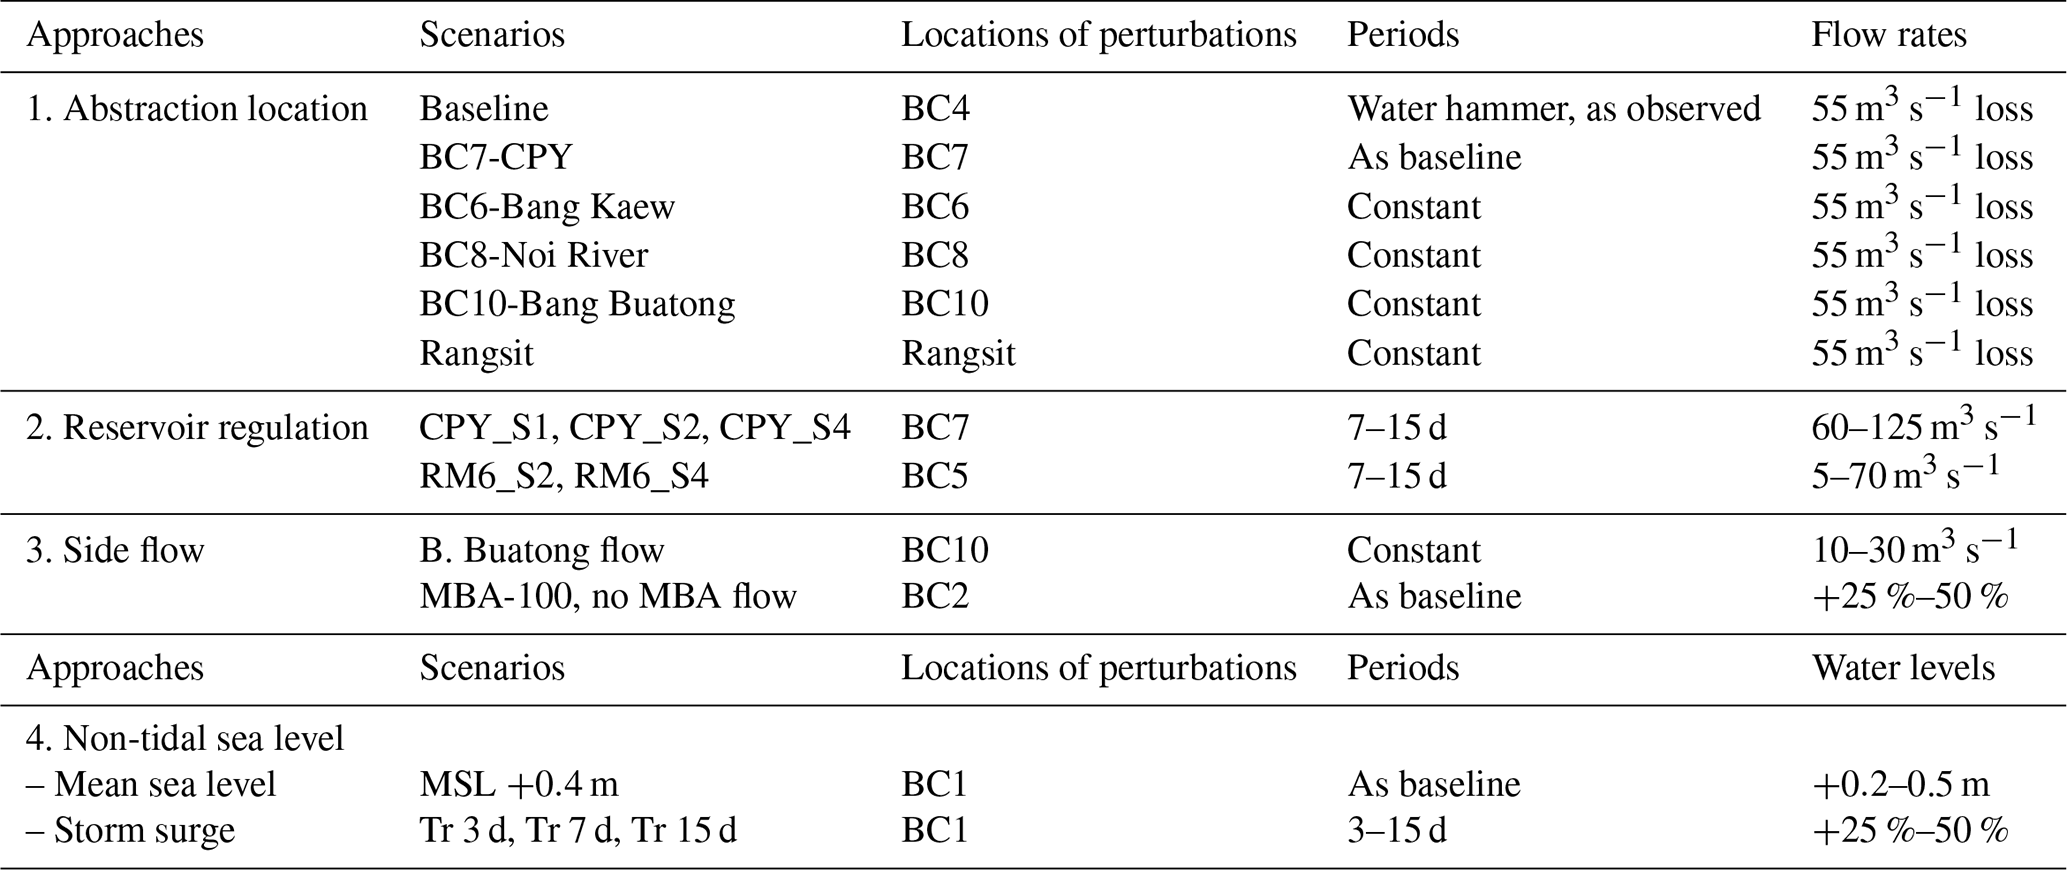
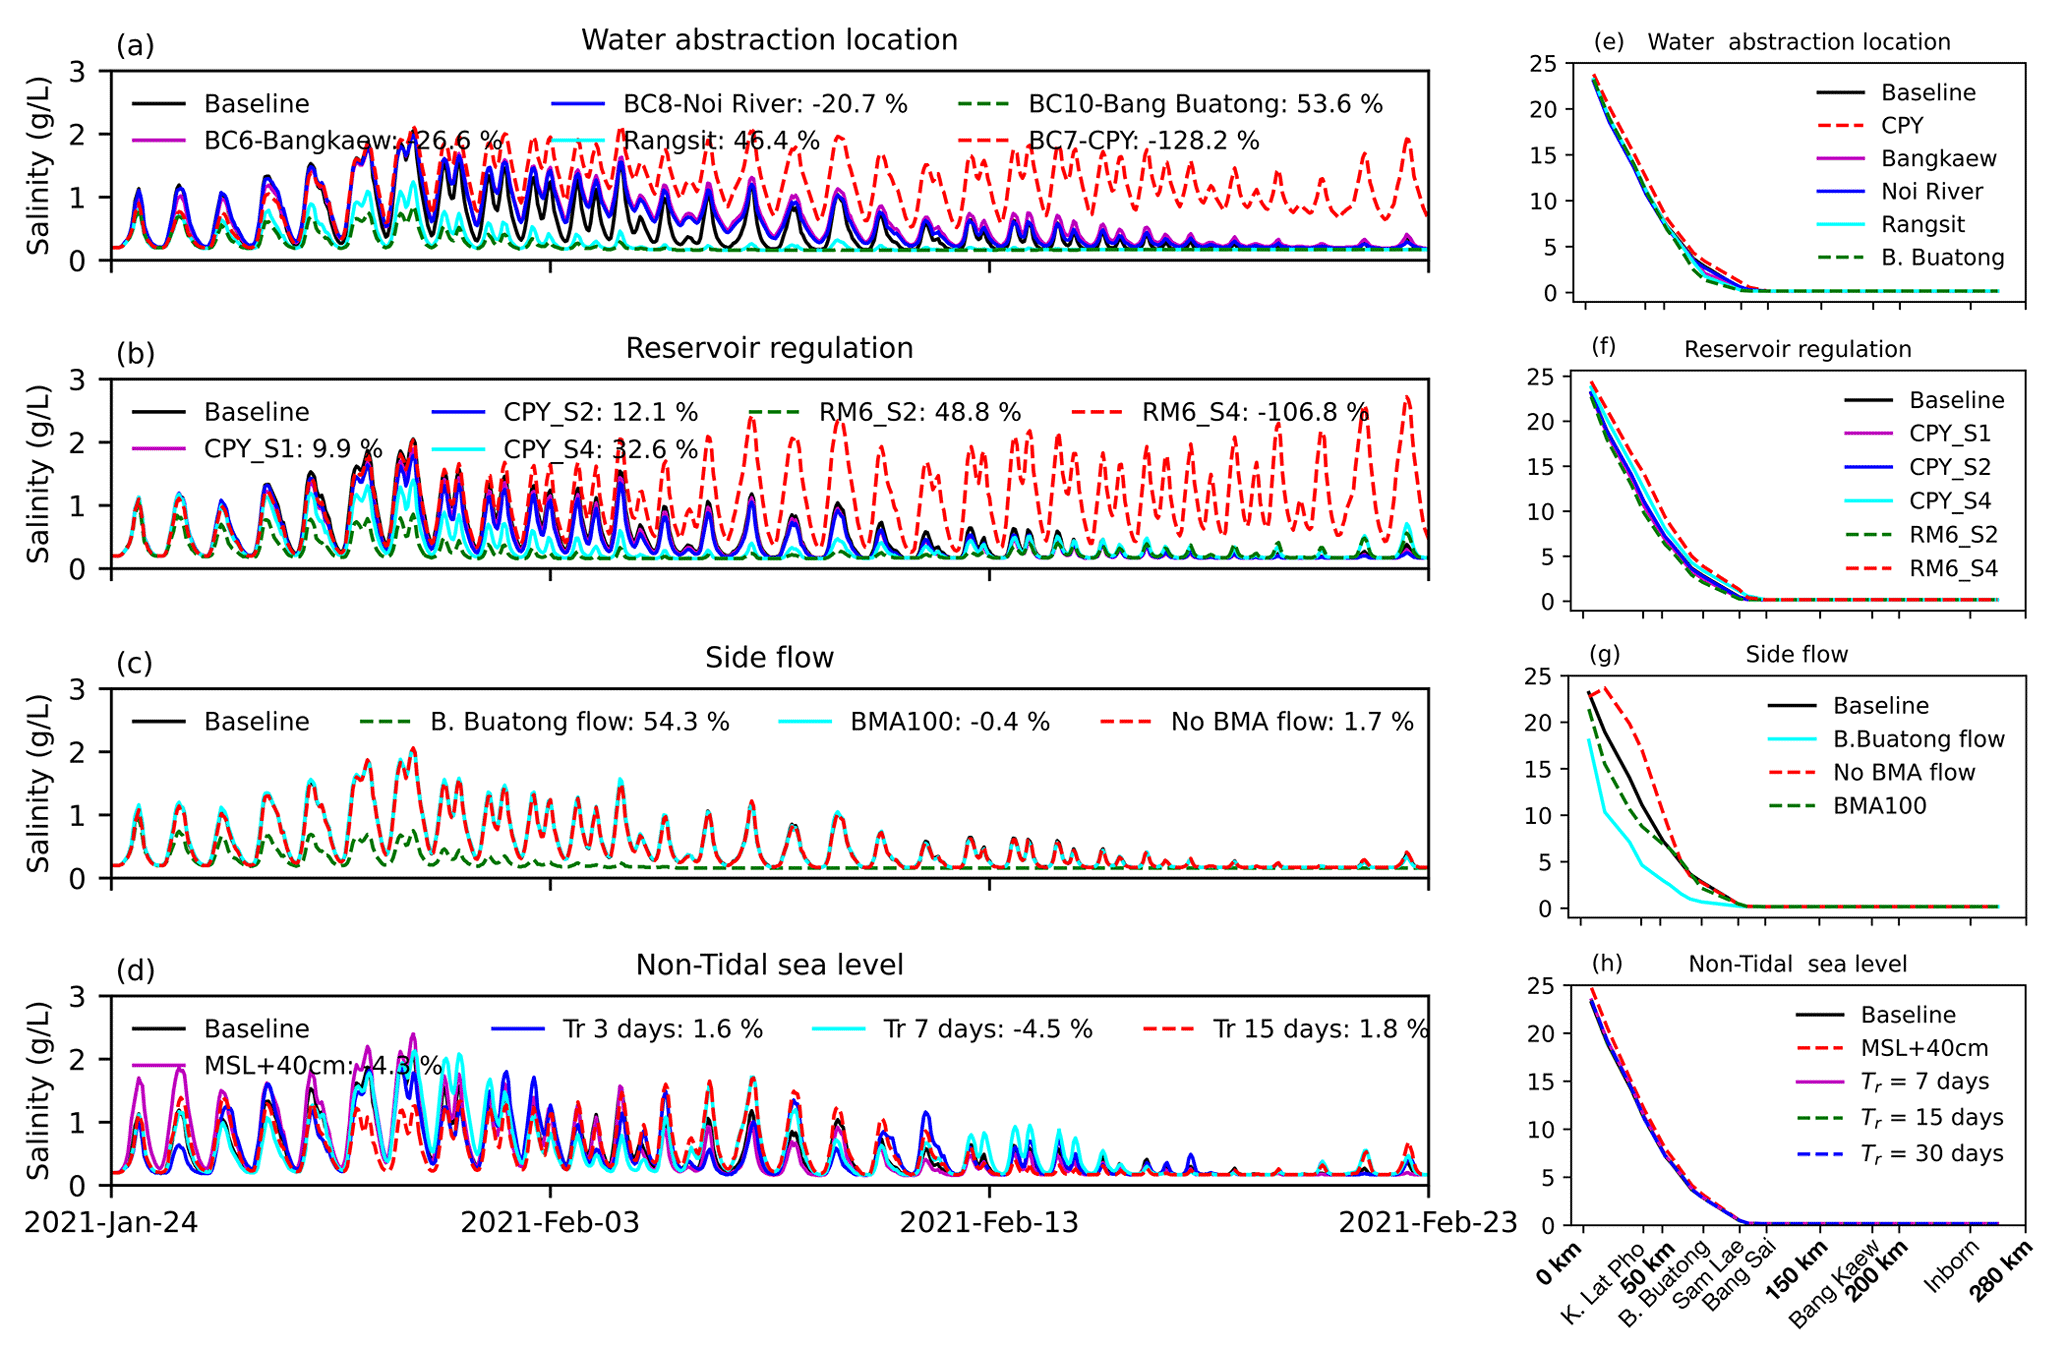
Figure 8Salinity responses at the Sam Lae station to different perturbation approaches and their spatial impact along the LCPYR. The left panels (a–d) show results for varying (a) water abstraction locations, (b) reservoir regulations, (c) side flows and diversion water, and (d) non-tidal sea-level conditions, based on an extreme event in early 2021. The right panel presents the 24 h filtered salinity (g L−1) along the LCPYR channel, highlighting the impact of sensitivity scenarios listed in Table 3. The distance runs from the river mouth (0 km) to Sam Lae (approximately 280 km).
In this section, we present scenario-based experiments to investigate strategies for efficient freshwater management and to evaluate different assumptions aimed at enhancing the understanding of salinity intrusion dynamics in the LCPYR. The scenarios, summarized in Table 3, focus on four key areas: water abstraction location, reservoir regulation, side-flow utilization, and non-tidal sea-level influences.
5.1 Scenario framework and experimental design
The baseline scenario replicates the best-fit model simulation of the salinity intrusion event observed during winter 2021. A notable feature of this baseline is the application of the water hammer technique, a controlled freshwater release strategy deployed to mitigate salinity intrusion over a 30 d period from January to February 2021, utilizing approximately 329 × 106 m3 of freshwater. Our results indicate that alternative strategies adjusting the timing and magnitude of upstream freshwater inflows have the potential to improve mitigation efficiency, significantly reducing both peak and overall salinity compared to the baseline.
We further explore the relocation of water abstraction points as a prospective mitigation measure. The outcomes suggest that shifting abstraction locations could either worsen or alleviate salinity intrusion, contingent upon the selected site. Additionally, we identify a significant correlation between intensified salinity intrusion and specific non-tidal sea-level characteristics, highlighting an important consideration for future water management decisions. Detailed results and implications of these scenarios are presented below.
Abstraction location. Before presenting the results, we outline the model configuration for the water abstraction location scenarios. The initial water abstraction rate of 55.0 m3 s−1 at boundary condition BC4 (Fig. 3) was shifted northward to locations BC6 and BC8 and southward to locations BC10 and Rangsit. Additionally, an extreme scenario involving the complete removal of water abstraction at BC7 was evaluated to assess the impact of an intensified northward shift. To further investigate the response to a southward shift, an additional boundary condition was introduced at Rangsit. The outcomes of these scenarios are depicted in Fig. 8a.
With the exception of the extreme scenario (BC7-CPY, dashed red line in Fig. 8a), the northward relocation scenarios (BC6 and BC8, indicated by purple and blue lines, respectively) exhibit only slight increases in the salinity levels recorded at Sam Lae. Likewise, the variations in mean salinity at Sam Lae and other monitoring stations along the LCPYR remain minimal (Fig. 8e). Conversely, scenarios involving southward shifts (BC10 and Rangsit, green dashed and cyan lines, respectively) demonstrate a reduction in both salinity amplitude and mean salinity levels. However, this mitigating effect remains primarily localized within approximately 50 km upstream from the river mouth to Sam Lae (Fig. 8e).
Reservoir regulation. We investigated the redistribution of the freshwater volumes originally used in the baseline scenario by considering five primary reservoir management scenarios: CPY_S1, CPY_S2, CPY_S4, RM6_S2, and RM6_S4. These scenarios varied the magnitude and timing of freshwater releases from the CPY Dam and Rama VI Dam (RM6), as detailed below:
-
The CPY scenarios applied the water hammer technique at the CPY Dam (BC7 in Fig. 3), differing notably in flow timing and magnitude (Fig. S7). Scenario CPY_S1 utilized approximately 219 × 106 m3, maintaining a high flow of 100.0 m3 s−1 for 2 d followed by a sustained lower flow of 80.0 m3 s−1 over 10 d. Scenario CPY_S2, using about 220 × 106 m3, adopted a similar flow fluctuation pattern extended over a longer period. Scenario CPY_S4, with a total volume of approximately 207 × 106 m3, featured a prolonged high flow of 110.0 m3 s−1 for 15 d, followed by a lower flow of 60.0 m3 s−1.
-
The RM6 scenarios targeted Rama VI Dam (BC5 in Fig. 3) with varying total water volumes. Scenario RM6_S2 utilized approximately 123 × 106 m3, applying a high flow of 70.0 m3 s−1 maintained for 13 d, followed by a lower flow of 20.0 m3 s−1. Scenario RM6_S4 represents a condition of significantly constrained freshwater availability, applying a much lower high flow of 20.0 m3 s−1 and a low flow of only 5.0 m3 s−1, resulting in a total volume of just 30 × 106 m3.
The results of these scenarios are presented in Fig. 8b. Scenarios CPY_S4 (cyan line) and RM6_S2 (green dashed line) effectively reduce both the peak salinity levels and the overall salinity trend at Sam Lae. The idealized water hammer approach, employing high flows of 110.0 m3 s−1 at the CPY Dam and 70.0 m3 s−1 at the Rama VI Dam, significantly mitigates salinity intrusion, especially during extreme salinity periods. These high-flow phases, occurring approximately 7 d before and after peak salinity events (Fig. S7), support the subsequent use of reduced flow rates (60.0 and 20.0 m3 s−1 for the CPY and Rama VI Dams, respectively). However, the effectiveness of these releases remains primarily limited to the tidally influenced region downstream from Sam Lae (Fig. 8f). Conversely, scenarios with lower peak flows, such as CPY_S1 and CPY_S2 (purple and blue lines, respectively), demonstrate only marginal improvement over the baseline scenario. Notably, significantly lower flows from the Rama VI Dam (scenario RM6_S4) exacerbate salinity peaks and overall trends, underscoring the importance of maintaining adequate minimum flows for effective dilution.
Additional experiments were conducted to identify optimal mitigation strategies for reducing salinity trends from the baseline scenario and to determine critical flow rates for each river branch. These experiments included modified and combined scenarios (Comb_S1, Comb_S2, and Comb_S3), as well as integrated configurations combining CPY_S4 and RM6_S2. Scenarios involving constant flow rates from the Chao Phraya and Rama VI Dams (Cnst_S1) and a revised baseline (rBaseline) were also evaluated.
Percent differences from the baseline across all mitigation scenarios are summarized in Tables S1 and S2 in the Supplement. The findings emphasize the critical role of the discharge magnitude and duration (Qu), particularly within the initial 15 d. Appropriate high-flow management within this period significantly reduces overall salinity trends, potentially allowing lower discharge rates in the subsequent 15 d. A regression analysis between Qu, total freshwater volume, and the effectiveness of salinity mitigation (Fig. S8) reveals a logarithmic relationship, suggesting that increased freshwater volume alone does not guarantee enhanced mitigation outcomes; rather, precise management of timing and magnitude is essential for optimal efficiency.
Application of side flow: Model sensitivity tests emphasized the significant influence of side flows, particularly discharge from the BMA, on salinity management within the tidal-dominated region. Additionally, we assessed the mitigation measures involving freshwater diversion from the Tha Chin River through the Bang Buatong gate (BC10). However, this measure exhibits limited dilution effectiveness, likely due to contamination by saline water from nearby channels. A potentially more effective strategy involves controlling the salinity of diverted freshwater. To examine this, we simulated a scenario with a sustained BMA discharge of 100.0 m3 s−1 (BMA-100) alongside a freshwater diversion at BC10, featuring a constant flow of 10.0 m3 s−1 at a salinity concentration of 0.2 g L−1.
As illustrated in Fig. 8c, results at Sam Lae indicate that excluding the BMA flow produces salinity trends similar to the baseline scenario. Conversely, the scenario featuring a constant BMA discharge of 100.0 m3 s−1 significantly accelerates the reduction of salinity within the tidal-dominated region (Fig. 8g), underscoring the critical role of BMA discharge in salinity mitigation. Further increasing the BMA discharge rate intensifies this beneficial trend. The freshwater diversion from the Bang Buatong gate also yields a notable effect, though its impact remains localized within the tidal region. In practical terms, the salinity concentration of the Tha Chin River discharge rarely exceeds 0.5 g L−1, even during extreme salinity intrusion events such as those observed in early 2020 and 2021. Nonetheless, contamination from adjacent saline channels continues to present a potential limitation for this mitigation strategy.
Non-tidal sea-level effects: The transient effect of elevated MSLs on salinity intrusion during early 2020 was previously highlighted. To further investigate this effect under varying upstream freshwater conditions, we performed additional scenario analyses, including an elevated MSL scenario (MSL +0.4 m) and three idealized extreme sea-level scenarios (Tr 3 d, Tr 7 d, and Tr 15 d). These extreme scenarios combine harmonic tides with synthetic storm surges having amplitudes of approximately 0.5 m and durations of 3, 7, and 15 d, respectively (Fig. S7c).
The results of these scenarios are illustrated in Fig. 8d. As expected, a pronounced correlation between storm surge events and peak salinity levels is observed, particularly evident in the 7 d surge scenario (Tr 7 d). While the impacts of storm surges remain temporary, scenarios with extended durations (Tr 7 d, Tr 15 d, and MSL +0.4 m) demonstrate a stronger capacity to sustain elevated salinity levels. Nonetheless, as shown in Fig. 8h, raising the MSL alone does not result in persistent salinity increases extending beyond approximately 50 km upstream from the river mouth toward Sam Lae.
5.2 Synthesis and recommendations for sustainable salinity management
Saltwater intrusion in estuaries, where tidal forces dominate the river flow, is a widely recognized global phenomenon. In the specific context of the LCPYR in Thailand, the origins and intensification of saltwater intrusion are particularly complex. Hydrological drought emerges as the primary driver, as reduced river discharge, exacerbated by anomalously dry conditions commonly associated with El Niño events, significantly affects freshwater availability. Insufficient runoff, compounded by uncontrolled water losses, further aggravates the situation.
While tidal variations and extreme sea levels are universally critical factors influencing saltwater intrusion severity, the LCPYR demonstrates unique characteristics. Complex interactions involving long waves, storm surges, and tidal transformations significantly amplify salinity during low-flow periods. Urban runoff, especially from Bangkok, introduces additional complexity by variably diluting or intensifying salinity levels depending on the prevailing flow conditions. Based on these insights, several recommendations are proposed for sustainable water resource management:
-
Optimizing upstream inflow management. Effective mitigation of salinity intrusion critically depends on the strategic adjustment of the timing and magnitude of upstream freshwater releases. Sustaining a consistently high discharge may provide some efficiency in reducing salinity intrusion during acute drought periods but generally demands substantial freshwater resources. Conversely, alternating periods of high and low discharge, a method analogous to a water hammer, significantly enhances freshwater utilization efficiency. Our scenario-based analysis indicates that optimized upstream inflow management employing this intermittent discharge approach achieves greater salinity reduction with reduced freshwater consumption. Additionally, reservoir release “swapping”, involving alternating water sources between dams under varying storage conditions, further supports optimized inflow management to effectively mitigate extreme salinity events
-
Relocating abstraction points for enhanced efficiency. Numerical modeling demonstrates that relocating water abstraction points away from critical freshwater zones does not inherently worsen salinity intrusion. Thus, strategic repositioning of abstraction points represents a practical and flexible management strategy, allowing water resource managers to withdraw water efficiently without adversely impacting downstream water quality or exacerbating salinity intrusion.
-
Implementing targeted water diversion strategies. Diverting freshwater from tributaries has proven effective in mitigating salinity intrusion, as demonstrated in our modeling scenarios. Optimization of the timing, volume, and location of these diversions is essential for maximizing their effectiveness. Specifically, urban runoff from the BMA emerges as a significant factor in reducing local salinity levels. However, careful regulation of the diverted water’s salinity concentration is critical to ensure the sustained effectiveness of such mitigation measures, particularly during severe drought events.
-
Developing robust prediction systems using physics-based models. Accurate physics-based numerical models are indispensable for comprehensively understanding the interactions among tides, river flows, and salinity levels. Such models facilitate the development of reliable prediction systems, which are vital for both long-term planning and real-time management decisions. Enhanced forecasting capabilities for sea-level variability, especially storm surges and wind-driven events, are essential for anticipating salinity intrusion. Building upon previous regional studies such as those by Sirisup et al. (2016) and Tomkratoke and Sirisup (2020), we advocate for the establishment of a comprehensive ocean modeling framework specifically tailored to support water resource management in the region.
-
Assessing and preparing for future climate scenarios. Climate change is expected to significantly influence the salinity dynamics in the LCPYR through increased frequency and intensity of extreme weather events, including heavy rainfall and prolonged dry periods. Advanced climate modeling indicates that global warming will amplify hydrological variability, lengthening dry spells and intensifying rainfall events (Narenpitak et al., 2024). These altered climate patterns, coupled with higher extreme sea levels and shifting wind regimes, could considerably impact the magnitude and spatial extent of salinity intrusion. Future research efforts should therefore focus on analyzing how climate-driven hydrological changes may reshape regional dynamics and develop adaptive management strategies to effectively mitigate potential impacts.
In conclusion, an integrated approach incorporating optimized upstream inflow management, strategic water diversions, adaptive abstraction policies, and advanced numerical modeling capabilities is essential for sustainable salinity management. As climate variability increases and regional water demand grows, the implementation of these comprehensive strategies will be crucial for ensuring sustainable water resource management in the LCPYR. Additionally, the model setups, findings, and recommendations presented herein provide a practical framework applicable to addressing similar challenges in estuarine systems elsewhere globally.
Saltwater intrusion in the Lower Chao Phraya River (LCPYR) is a major challenge for water resource and environmental management in Thailand. A comprehensive understanding of the factors driving this phenomenon, coupled with the development of effective prediction and decision-making tools, is essential for successful management, both now and in the future. This study examines the primary influences on saltwater intrusion in the LCPYR, employing a cross-wavelet analysis to assess tides, hydrological droughts (via the RSDA), meteorological droughts (via the RSPA), and salinity data. Numerical simulations are then conducted to validate the findings and provide a framework for future prediction systems. The key results are as follows:
Salinity variability modes. Saltwater intrusion in the LCPYR is governed by both drought-dependent and drought-relaxation mechanisms.
(i) The drought-dependent mechanism, driven by regional hydro-climatic variability and captured by the RSDA, dominates sub-annual to annual salinity variability. Extreme salinity episodes, however, are governed chiefly by sea-level oscillations, underscoring the importance of non-tidal sea-level anomalies; at still shorter timescales, diurnal, semi-diurnal, and fortnightly tides provide the immediate triggers.
(ii) The drought-relaxation mechanism is linked to transient wet periods triggered by local climate variability, as indicated by the RSPA. These episodes can temporarily reduce salinity levels, at times weakening the usual correlation between salinity and hydrological drought severity.
Numerical model performance. The numerical model based on SCHISM and developed further in this study is proven to be highly accurate in simulating both the hydrodynamics and salinity dynamics. It effectively captures the influence of hydro-climatic and oceanic factors on salinity patterns, validating the findings from the cross-wavelet analysis. The model suggests that hydrological drought conditions play a more fundamental role as a primary driver for the origination of salinity intrusion. In the end, the importance of other drivers can be proved by numerical experiments, i.e., the sensitivity studies. This model offers a robust framework for understanding salinity dynamics in the region, identifying key mechanisms behind saltwater intrusion, and regulating the dilution process.
Coupling drought indices with numerical modeling. The combined application of wavelet analysis and hydrodynamic modeling offers several new insights. Most notably, the importance of local hydro-climatic variability, especially urban runoff from nearby watersheds, can significantly enhance salinity dilution even during severe drought conditions. This phenomenon corresponds to the drought-relaxation mechanism identified in the wavelet domain and is further validated by numerical simulations. While a wavelet analysis is valuable for identifying historical patterns and drought-salinity relationships, its predictive capacity is limited by the cone of influence (COI). For early warning, the use of standardized indices such as the RSDA and RSPA for real-time monitoring of drought characteristics is therefore applicable. When integrated with numerical models or predictive frameworks, these indices can help anticipate future salinity conditions. Although additional research is needed to operationalize this approach, it provides a promising foundation for future early-warning systems in the LCPYR. These findings underscore the importance of combining robust data analysis with advanced numerical modeling to better understand and address saltwater intrusion. As the LCPYR faces increasing challenges due to climate variability and evolving water needs, the tools and strategies developed in this study offer a valuable foundation for proactive management.
Proposed mitigation strategies. Based on the successful combination of data analysis and modeling, several strategies for mitigating saltwater intrusion in the LCPYR have been proposed. Optimizing the redistribution of freshwater for dilution has emerged as a highly efficient approach for reducing salinity intrusion. Accordingly, this study provides actionable insights for both short-term operations and long-term planning. In the short term, our findings refine the application of the water hammer technique, emphasizing that the timing and volume of freshwater releases are critical for mitigating salinity during drought events. For long-term planning, we highlight the significant and often underappreciated role of urban runoff and tributary inflows in diluting salinity levels. Incorporating these local influences into management planning can improve the efficiency of freshwater allocation.
The insights gained from this study can support future prediction systems and guide management strategies for saltwater intrusion in the LCPYR, with potential applications for other estuaries in Thailand and neighboring regions. Moreover, the modeling framework and sensitivity-analysis approach are broadly applicable to any coastal or estuarine system facing similar intrusion challenges, offering a versatile tool for integrated water resource management under changing climatic and hydrological conditions.
The simulation outputs are available at https://doi.org/10.5281/zenodo.16777776 (Tomkratoke et al., 2025).
The observed hydrological, meteorological, and salinity data used in this study were obtained from the following sources:
-
Hydrological data: https://www.rid.go.th (Royal Irrigation Department of Thailand (RID), 2025), https://www.thaiwater.net (National Hydroinformatics Data Center of Thailand (NHC), 2025), https://dds.bangkok.go.th (Department of Drainage and Sewerage of Bangkok (DDS), 2025).
-
Salinity data: http://rwc.mwa.co.th (Metropolitan Waterworks Authority (MWA), 2025).
-
Meteorological data: https://tmd.go.th (Thai Meteorological Department (TMD), 2025).
The supplement related to this article is available online at https://doi.org/10.5194/hess-29-3771-2025-supplement.
SK obtained the data and developed tools for the simulations. SS and ST performed the analyses, ran the simulations, evaluated the simulation results, and contributed to the analysis design, concept development, and interpretation of results. SS, ST, and PN contributed to the writing and reviewing of the manuscript.
The contact author has declared that none of the authors has any competing interests.
Publisher's note: Copernicus Publications remains neutral with regard to jurisdictional claims made in the text, published maps, institutional affiliations, or any other geographical representation in this paper. While Copernicus Publications makes every effort to include appropriate place names, the final responsibility lies with the authors.
The authors gratefully acknowledge the Royal Irrigation Department of Thailand (RID), the National Hydroinformatics Data Center of Thailand (NHC), the Metropolitan Waterworks Authority (MWA), and the Department of Drainage and Sewerage of Bangkok (DDS) for providing and supporting the hydrological, meteorological, and salinity data used in this study. We also thank the Thai Meteorological Department (TMD) for providing the summary of rainfall characteristics in central Thailand.
This paper was edited by Nadia Ursino and reviewed by two anonymous referees.
Apurv, T. and Cai, X.: Evaluation of the Stationarity Assumption for Meteorological Drought Risk Estimation at the Multidecadal Scale in Contiguous United States, Water Resour. Res., 55, 5074–5101, https://doi.org/10.1029/2018WR024047, 2019. a
Besset, M., Anthony, E. J., Dussouillez, P., and Goichot, M.: The Impact of Cyclone Nargis on the Ayeyarwady (Irrawaddy) River Delta Shoreline and Nearshore Zone (Myanmar): Towards Degraded Delta Resilience?, C. R. Geosci., 349, 293–303, https://doi.org/10.1016/j.crte.2017.09.002, 2017. a
Bidorn, B., Sok, K., Bidorn, K., and Burnett, W.: An analysis of the factors responsible for the shoreline retreat of the Chao Phraya Delta (Thailand), Sci. Total Environ., 769, 145253, https://doi.org/10.1016/j.scitotenv.2021.145253, 2021. a
Changklom, J., Lamchuan, P., and Pornprommin, A.: Salinity Forecasting on Raw Water for Water Supply in the Chao Phraya River, Water, 14, 741, https://doi.org/10.3390/w14050741, 2022. a, b
Chen, A., Pokhrel, Y., Chen, D., Huang, H., Dai, Z., He, B., Wang, J., Li, J., Wang, H., and Liu, J.: Impact of Tropical Cyclones and Socioeconomic Exposure on Flood Risk Distribution in the Mekong Basin, Commun. Earth Environ., 5, 704, https://doi.org/10.1038/s43247-024-01868-9, 2024. a
Chettanawanit, K., Charoensuk, T., Luangdilok, N., Thanathanphon, W., Mooktaree, A., Lolupiman, T., Kyaw, K. K., and Sisomphon, P.: Simulation of Water Losses for the 1D Salinity Forecasting Model in Chao Phraya River, Engineering Access, 8, 161–166, https://doi.org/10.14456/mijet.2022.20, 2022. a, b
Department of Drainage and Sewerage of Bangkok (DDS): https://dds.bangkok.go.th, last access: 7 August 2025. a
Fan, X. and Luo, X.: Precipitation and Flow Variations in the Lancang-Mekong River Basin and the Implications of Monsoon Fluctuation and Regional Topography, Water, 11, 2086, https://doi.org/10.3390/w11102086, 2019. a
Garcés-Vargas, J., Schneider, W., Pinochet, A., Piñones, A., Olguin, F., Brieva, D., and Wan, Y.: Tidally forced saltwater intrusions might impact the quality of drinking water, the Valdivia River (40° S), Chile Estuary Case, Water, 12, 2387, https://doi.org/10.3390/w12092387, 2020. a
Hao, Z. and AghaKouchak, A.: A Nonparametric Multivariate Multi‐Index Drought Monitoring Framework, J. Hydrometeorol., 15, 89–101, https://doi.org/10.1175/JHM-D-12-0160.1, 2014. a
Hill, A.: Fortnightly tides in a lagoon with variable choking, Estuar. Coast. Shelf Sci., 38, 423–434, https://doi.org/10.1006/ecss.1994.1029, 1994. a
Kulmart, K. and Pochai, N.: Numerical simulation for salinity intrusion measurement models using the MacCormack finite difference method with lagrange interpolation, Journal of Interdisciplinary Mathematics, 23, 1157–1185, https://doi.org/10.1080/09720502.2020.1737379, 2020. a, b
Lema, F., Mendoza, P. A., Vásquez, N. A., Mizukami, N., Zambrano-Bigiarini, M., and Vargas, X.: Technical note: What does the Standardized Streamflow Index actually reflect? Insights and implications for hydrological drought analysis, Hydrol. Earth Syst. Sci., 29, 1981–2002, https://doi.org/10.5194/hess-29-1981-2025, 2025. a
Liu, B., Peng, S., Liao, Y., and Wang, H.: The characteristics and causes of increasingly severe saltwater intrusion in Pearl River Estuary, Estuar. Coasta. Shelf Sci., 220, 54–63, https://doi.org/10.1016/j.ecss.2019.02.041, 2019. a
Liu, D., Chen, X., and Lou, Z.: A Model for the Optimal Allocation of Water Resources in a Saltwater Intrusion Area: A Case Study in Pearl River Delta in China, Water Resour. Manag., 24, 63–81, https://doi.org/10.1007/s11269-009-9437-y, 2010. a
Loc, H. H., Van Binh, D., Park, E., Shrestha, S., Dung, T. D., Son, V. H., Truc, N. H. T., Mai, N. P., and Seijger, C.: Intensifying saline water intrusion and drought in the Mekong Delta: From physical evidence to policy outlooks, Sci. Total Environ., 757, 143919, https://doi.org/10.1016/j.scitotenv.2020.143919, 2021. a
MacMahan, J., van de Kreeke, J., Reniers, A., Elgar, S., Raubenheimer, B., Thornton, E., Weltmer, M., Rynne, P., and Brown, J.: Fortnightly tides and subtidal motions in a choked inlet, Estuar. Coast. Shelf Sci., 150, 325–331, https://doi.org/10.1016/j.ecss.2014.03.025, 2014. a
Metropolitan Waterworks Authority (MWA): http://rwc.mwa.co.th, last access: 7 August 2025. a
Molle, F., Chompadist, C., Srijantr, T., and Keawkulaya, J.: Dry-season water allocation and management in the Chao Phraya Delta, Tech. rep., DORAS Center, Kasetsart University, dORASDELTA Research Report, https://doi.org/10.13140/2.1.2412.4482, 2001. a
Mulamba, T., Bacopoulos, P., Kubatko, E. J., and Pinto, G. F.: Sea-level rise impacts on longitudinal salinity for a low-gradient estuarine system, Clim. Change, 152, 533–550, https://doi.org/10.1007/s10584-019-02369-x, 2019. a
Narenpitak, P., Kongkulsiri, S., Tomkratoke, S., and Sirisup, S.: Regional impacts of solar radiation modification on surface temperature and precipitation in Mainland Southeast Asia and the adjacent oceans, Sci. Rep., 14, 22713, https://doi.org/10.1038/s41598-024-73149-6, 2024. a
National Hydroinformatics Data Center of Thailand (NHC): https://www.thaiwater.net, last access: 7 August 2025. a
National Oceanic and Atmospheric Administration (NOAA): Tidal Datums and Their Applications, Tech. rep., Center for Operational Oceanographic Products and Services (CO-OPS), https://tidesandcurrents.noaa.gov/publications/tidal_datums_and_their_applications.pdf (last access: 8 April 2025), 2020. a
Nghia, B. P. Q., Pal, I., Chollacoop, N., Nguyen, L. H., Tuan, T. M., Van Tuong, N., et al.: Integrated approach for drought and saline intrusion severity assessment on the coastal Mekong Delta of Vietnam contextualizing physical change to risk management and policy development, Progress in Disaster Science, 23, 100338, https://doi.org/10.1016/j.pdisas.2024.100338, 2024. a
Othata, P. and Pochai, N.: Irrigation water management strategies for salinity control in the Chao Phraya River using Sualyev finite difference method with Lagrange interpolation technique, Engineering Letters, 29, 332–338, 2021. a, b
Pokavanich, T. and Guo, X.: Saltwater intrusion in Chao Phraya Estuary: A long, narrow and meandering partially mixed estuary influenced by water regulation and abstraction, Journal of Hydrology: Regional Studies, 52, 101686, https://doi.org/10.1016/j.ejrh.2024.101686, 2024. a, b, c, d, e
Reyes-Merlo, M. Á., Díez-Minguito, M., Ortega-Sánchez, M., Baquerizo, A., and Losada, M. Á.: On the relative influence of climate forcing agents on the saline intrusion in a well-mixed estuary: Medium-term Monte Carlo predictions, J. Coast. Res., 65, 1200–1205, https://doi.org/10.2112/SI65-203.1, 2013. a
Rösch, A. and Schmidbauer, H.: WaveletComp 1.1: A Guided Tour Through the R Package, Technical report, Munich University of Applied Sciences, http://www.hs-stat.com/projects/WaveletComp/WaveletComp_guided_tour.pdf (last access: 7 August 2025), 2016. a
Royal Irrigation Department of Thailand (RID): https://www.rid.go.th, last access: 7 August 2025. a
Shukla, S. and Wood, A. W.: Use of a Standardized Runoff Index for Characterizing Hydrologic Drought, Geophys. Res. Lett., 35, L02405, https://doi.org/10.1029/2007GL032487, 2008. a
Sirisena, T. A. J. G., Maskey, S., Bamunawala, J., and Ranasinghe, R.: Climate Change and Reservoir Impacts on 21st-Century Streamflow and Fluvial Sediment Loads in the Irrawaddy River, Myanmar, Front. Earth Sci., 9, 644527, https://doi.org/10.3389/feart.2021.644527, 2021. a
Sirisup, S., Tomkratoke, S., and Lertapisit, W.: Simulation and EOF analysis of ocean circulation in the gulf of Thailand, in: OCEANS 2016-Shanghai, 1–6, https://doi.org/10.1109/OCEANSAP.2016.7485452, 2016. a
Thai Meteorological Department (TMD): https://tmd.go.th, last access: 7 August 2025. a
Tomkratoke, S. and Sirisup, S.: Effects of tropical cyclone paths and shelf bathymetry on inducement of severe storm surges in the Gulf of Thailand, Acta Oceanol. Sin., 39, 90–102, https://doi.org/10.1007/s13131-020-1558-4, 2020. a, b
Tomkratoke, S. and Sirisup, S.: Influence and variability of monsoon trough and front on rainfall in Thailand, Int. J. Climatol., 42, 619–634, https://doi.org/10.1002/joc.7263, 2022. a, b, c
Tomkratoke, S., Sirisup, S., Udomchoke, V., and Kanasut, J.: Influence of resonance on tide and storm surge in the Gulf of Thailand, Cont. Shelf Res., 109, 112–126, https://doi.org/10.1016/j.csr.2015.09.006, 2015. a, b, c
Tomkratoke, S., Kongkulsiri, S., Narenpitak, P., and Sirisup, S.: Simulation outputs for “Drought and salinity intrusion in the Lower Chao Phraya River: variability analysis and modeling mitigation approaches”, Version v1, Zenodo [data set], https://doi.org/10.5281/zenodo.16777776, 2025. a
Tran Anh, D., Hoang, L. P., Bui, M. D., and Rutschmann, P.: Simulating future flows and salinity intrusion using combined one-and two-dimensional hydrodynamic modelling–The case of Hau River, Vietnamese Mekong delta, Water, 10, 897, https://doi.org/10.3390/w10070897, 2018. a
Tsai, C.-S., Behera, S., and Waseda, T.: Indo–China Monsoon Indices, Sci. Rep., 5, 8107, https://doi.org/10.1038/srep08107, 2015. a
Vicente-Serrano, S. M., Beguería, S., and López-Moreno, J. I.: A Multiscalar Drought Index Sensitive to Global Warming: The Standardized Precipitation Evapotranspiration Index, J. Climate, 23, 1696–1718, https://doi.org/10.1175/2009JCLI2909.1, 2010. a
Vu, M.-T., Luu, C., Bui, D.-Q., Vu, Q.-H., and Pham, M.-Q.: Simulation of hydrodynamic changes and salinity intrusion in the lower Vietnamese Mekong Delta under climate change-induced sea level rise and upstream river discharge, Regional Studies in Marine Science, 78, 103749, https://doi.org/10.2139/ssrn.4703619, 2024. a
Wang, Y., Duan, L., Liu, T., Li, J., and Feng, P.: A Non-stationary Standardized Streamflow Index for hydrological drought using climate and human-induced indices as covariates, Sci. Total Environ., 699, 134278, https://doi.org/10.1016/j.scitotenv.2019.134278, 2020. a
Weng, P., Tian, Y., Zhou, H., Zheng, Y., and Jiang, Y.: Saltwater intrusion early warning in Pearl River delta based on the temporal clustering method, J. Environ. Manage., 349, 119443, https://doi.org/10.1016/j.jenvman.2023.119443, 2024. a
Weng, Y., Guan, T., Jiang, N., and Huang, Z.: Numerical Study of the Impacts of Typhoon Parameters on the Storm Surge Based on the Hato Storm over the Pearl River Mouth, China, Regional Studies in Marine Science, 34, 101061, https://doi.org/10.1016/j.rsma.2020.101061, 2020. a
Wheeler, M. C. and Hendon, H. H.: An All-Season Real-Time Multivariate MJO Index: Development of an Index for Monitoring and Prediction, Mon. Weather Rev., 132, 1917–1932, https://doi.org/10.1175/1520-0493(2004)132<1917:AARMMI>2.0.CO;2, 2004. a
Wongsa, S. et al.: Impact of climate change on water resources management in the lower Chao Phraya Basin, Thailand, Journal of Geoscience and Environment Protection, 3, 53–58, https://doi.org/10.4236/gep.2015.310009, 2015. a, b
Zhang, C.: Madden–Julian Oscillation, Rev. Geophys., 43, RG2003, https://doi.org/10.1029/2004RG000158, 2005. a
Zhang, E., Gao, S., Savenije, H. H., Si, C., and Cao, S.: Saline water intrusion in relation to strong winds during winter cold outbreaks: North Branch of the Yangtze Estuary, J. Hydrol., 574, 1099–1109, https://doi.org/10.1016/j.jhydrol.2019.04.096, 2019. a
Zhang, Y. J., Ateljevich, E., Yu, H.-C., Wu, C. H., and Jason, C.: A new vertical coordinate system for a 3D unstructured-grid model, Ocean Model., 85, 16–31, https://doi.org/10.1016/j.ocemod.2014.10.003, 2015. a, b
Zhang, Y. J., Ye, F., Stanev, E. V., and Grashorn, S.: Seamless cross-scale modeling with SCHISM, Ocean Model., 102, 64–81, https://doi.org/10.1016/j.ocemod.2016.05.002, 2016. a, b