the Creative Commons Attribution 4.0 License.
the Creative Commons Attribution 4.0 License.
 | 08 Aug 2025
Catchment hydrological response and transport are affected differently by precipitation intensity and antecedent wetness
Julia L. A. Knapp
Wouter R. Berghuijs
Marius G. Floriancic
James W. Kirchner
Hydrological response and travel times characterise distinct catchment behaviours that have both been intensively studied but rarely together. The hydrologic response characterises how quickly, and how strongly, streamflow reacts to precipitation inputs, whereas transport characterises how quickly precipitation travels through the system to reach the stream. Here we use sub-daily time series of hydrometeorological fluxes and stable water isotopes to quantify both hydrological response and transport in two intensively studied temperate catchments. Consistent with previous studies, we find that hydrologic response is much quicker than transport. However, we also find that catchment wetness and precipitation intensity influence hydrologic response and transport in different ways. Increased antecedent wetness results in stronger runoff responses, primarily by mobilising more old water, while increased precipitation intensity results in faster propagation of the runoff response signal and delivery of greater proportions of recent precipitation to streamflow. Considered together, response times and travel times provide insights into runoff generation mechanisms, flow paths, and water sources.
- Article
(3786 KB) - Full-text XML
-
Supplement
(560 KB) - BibTeX
- EndNote


Understanding how catchments store and release water is crucial for accurate streamflow predictions, model development, and characterisation of hydrologic systems. Such understanding also plays a vital role in, e.g., managing water resources effectively (Grathwohl et al., 2013), mitigating flood risks (Peskett et al., 2023), promoting ecosystem health (Laudon and Sponseller, 2018), and anticipating the impacts of climate change (Sulis et al., 2011).
An essential aspect of catchment water dynamics is the disconnect between the relatively short timescales of hydrologic response to precipitation and the much longer timescales over which precipitation inputs are transported to the stream. As a consequence of this contrast in timescales, streamflow often responds quickly to precipitation inputs, but this streamflow is typically composed of mostly older waters released from subsurface storage, with only a minor contribution from recent rainfall (Kirchner, 2003; Neal and Rosier, 1990; Jasechko et al., 2016; Floriancic et al., 2024). This “old water paradox” has been recognised for several decades (e.g., Małoszewski and Zuber, 1982; Rodhe et al., 1996; Weiler et al., 2003; Beven, 1989) and describes the discrepancy between the fast hydrological response to precipitation and the much slower hydrogeochemical response, indicating that streamflow is primarily composed of older subsurface water rather than recent rainfall. Hydrologic response times characterise how quickly precipitation inputs result in rising streamflow, reflecting the celerity with which hydraulic potentials propagate through the catchment. Catchment travel times, by contrast, characterise how quickly precipitation itself travels through landscapes to reach the stream, reflecting the velocity of transport through the catchment and determining the age (i.e., the time since entering the catchment as precipitation) of water leaving the catchment as streamflow (McDonnell and Beven, 2014). Response times or travel times can be viewed as the path length connecting precipitation to streamflow, divided by the celerity or velocity, respectively. Response and travel times have distributions rather than single values, reflecting the many complex pathways connecting precipitation to streamflow.
Most catchment studies have focused exclusively on either hydrologic response or transport; few have considered both together. For instance, hydrologic response is typically studied in the context of flood behaviour, such as for estimating peak flows (Gericke and Smithers, 2014) or quantifying flood wave propagation (Meyer et al., 2018). Conversely, tracer-based transport studies aim to understand mixing processes (Botter, 2012; van der Velde et al., 2012; Kirchner et al., 2001, 2000), precipitation partitioning (Soulsby et al., 2011; Botter et al., 2010), and pollutant turnover (Hrachowitz et al., 2016). The few studies that have jointly assessed hydrologic response and transport have consistently found that streamflow responds to rainfall faster than rainwater itself reaches the stream (e.g., van Verseveld et al., 2017; Rasmussen et al., 2000; Seeger and Weiler, 2014; Torres et al., 1998; Weiler et al., 2003), although in-depth comparisons are rare. The starkly different timescales of streamflow response and transport of water are also neglected in most hydrological, land surface, and earth system models, which likely leads to flawed representations of water cycling. Some coupled analyses of hydrological response and transport estimated from tracer data exist (e.g. Hrachowitz et al., 2013; Birkel et al., 2016; Harman, 2015); however, most work explicitly comparing response and transport timescales has been limited to laboratory column studies and plot-scale or hillslope-scale modelling studies, due to a lack of sufficient tracer data at the catchment scale. For example, Scaini et al. (2017) assessed the relevance of preferential flow through macropores, concluding that understanding the “relationship between tracer velocities and wave or wetting front celerity is essential for understanding the complexity of flow” in soils. These findings from small-scale, controlled experiments likely also hold for the larger catchment scale, as is also suggested by the prevalence of fractal scaling in stream chemistry dynamics (Godsey et al., 2010; Kirchner and Neal, 2013; Kirchner et al., 2000). However, a comprehensive joint evaluation of hydrologic response and transport at the catchment scale is missing. Quantifying response and transport processes jointly can provide novel insights into water storage processes and may also reveal more general emergent functional behaviour and thus aid model development.
Previous work has shown that hydrologic response and transport both depend on catchment properties, ambient conditions, and event characteristics. Hydrologic responses to precipitation inputs are often affected by antecedent catchment wetness (Zehe et al., 2005), with wetter conditions typically resulting in higher event runoff ratios (Schoener and Stone, 2019) and greater event streamflow (Bennett et al., 2018). It has also been suggested that higher antecedent wetness may result in shorter response times (e.g., Mindham et al., 2023). Likewise, it has been shown that increased antecedent wetness and higher precipitation intensities can promote shorter travel times and thus quicker transport of recent precipitation to the stream (Knapp et al., 2019; Wilusz et al., 2017; Hrachowitz et al., 2009). However, little is known about how strongly antecedent wetness conditions and precipitation intensity affect the relationship between response and transport processes.
In this study, we estimate response and transport metrics using hydrometric and isotope tracer time series from the pre-Alpine Erlenbach catchment in Switzerland and from the moorland Upper Hafren catchment at Plynlimon, Wales, UK. We hypothesise that catchment wetness and precipitation intensity affect response and transport processes in different ways. We expect that transport is highly dependent on catchment wetness, as increasing catchment wetness and rising groundwater levels result in the activation of shallower flow paths that deliver larger proportions of recent precipitation to the stream. We expect precipitation intensity to affect the streamflow response more strongly than transport, because higher-intensity precipitation may lead to quicker and larger changes in subsurface water potentials, in turn resulting in a faster propagation of hydrologic signals without changing the underlying processes. We thus hypothesise that hydrologic response and transport metrics provide complementary information on the storage and release of water in catchments, allowing us to further conceptualise processes like time-variable water release, the activation of flow paths, and subsurface water storages. Contrasting hydrologic response and transport metrics under varying catchment conditions may also help to reveal how the old waters stored in catchments can be released quickly during precipitation events, providing fundamental insights into catchment functioning.
2.1 Site descriptions
The Erlenbach is a steep 0.7 km2 catchment with high drainage density in the Swiss Alptal valley (van Meerveld et al., 2018). Its bedrock is primarily composed of flysch, which consists of alternating layers of conglomerate and calcareous sandstones with schists and marlstones (Zobrist et al., 2018). The soils are predominantly Gleysols (Hagedorn et al., 2000; Schleppi et al., 1998), which have low permeability and are prone to waterlogging (Rinderer et al., 2014). More than half of the catchment is forested, particularly the steeper sections. Wet meadows cover the flatter parts of the catchment where the water table is close to the surface (van Meerveld et al., 2018; Stähli et al., 2021). Vegetation in the catchment is dominated by spruce and fir, and the meadows in the upper parts of the catchment are used for summer grazing. Annual precipitation in the area is around 2300 mm yr−1 (1980–2011), of which around one-third falls as snow in the winter months. Mean annual runoff is around 1800 mm yr−1.
The Upper Hafren is a 1.22 km2 upland catchment at Plynlimon in mid-Wales, UK. Its bedrock is primarily composed of Lower Palaeozoic mudstones and shales, which are highly fractured, enabling the storage and rapid transport of water (Shand et al., 2005). The soils in the Upper Hafren catchment are predominantly acidic, organic-rich peats and gleys of low permeability, typical of upland moorland catchments (Kirby et al., 1991). The catchment's vegetation is dominated by ferns, acidic grassland, and peaty mires (Hill and Neal, 1997), and the primary land use is sheep grazing. The catchment receives annual precipitation of approximately 2700 mm yr−1, and the mean annual runoff is around 2400 mm yr−1 (1974–2010).
2.2 Description of the data sets
Time series of hydrometeorological data, including precipitation and streamflow, along with stable water isotope tracers (deuterium and oxygen-18) were analysed at the Erlenbach and Upper Hafren catchments. To ensure comparability between our response and transport analyses, we only used hydrometeorological time series spanning the start and end dates of the tracer measurements.
In the Erlenbach catchment, hydrometeorological time series are available at 10 min intervals, but are aggregated to 30 min intervals for this analysis. Precipitation is measured at the Erlenhöhe meteorological station (1228 m a.s.l.), while streamflow is recorded at the Erlenbach outlet (1100 m a.s.l.). Stable water isotopes were measured in precipitation and streamflow at approximately hourly intervals at an in situ field laboratory located at the Erlenbach outlet (von Freyberg et al., 2017) between 1 August 2016 and 31 July 2020. The isotope time series contain occasional data gaps due to instrumentation malfunctioning, as illustrated in Fig. 1c.
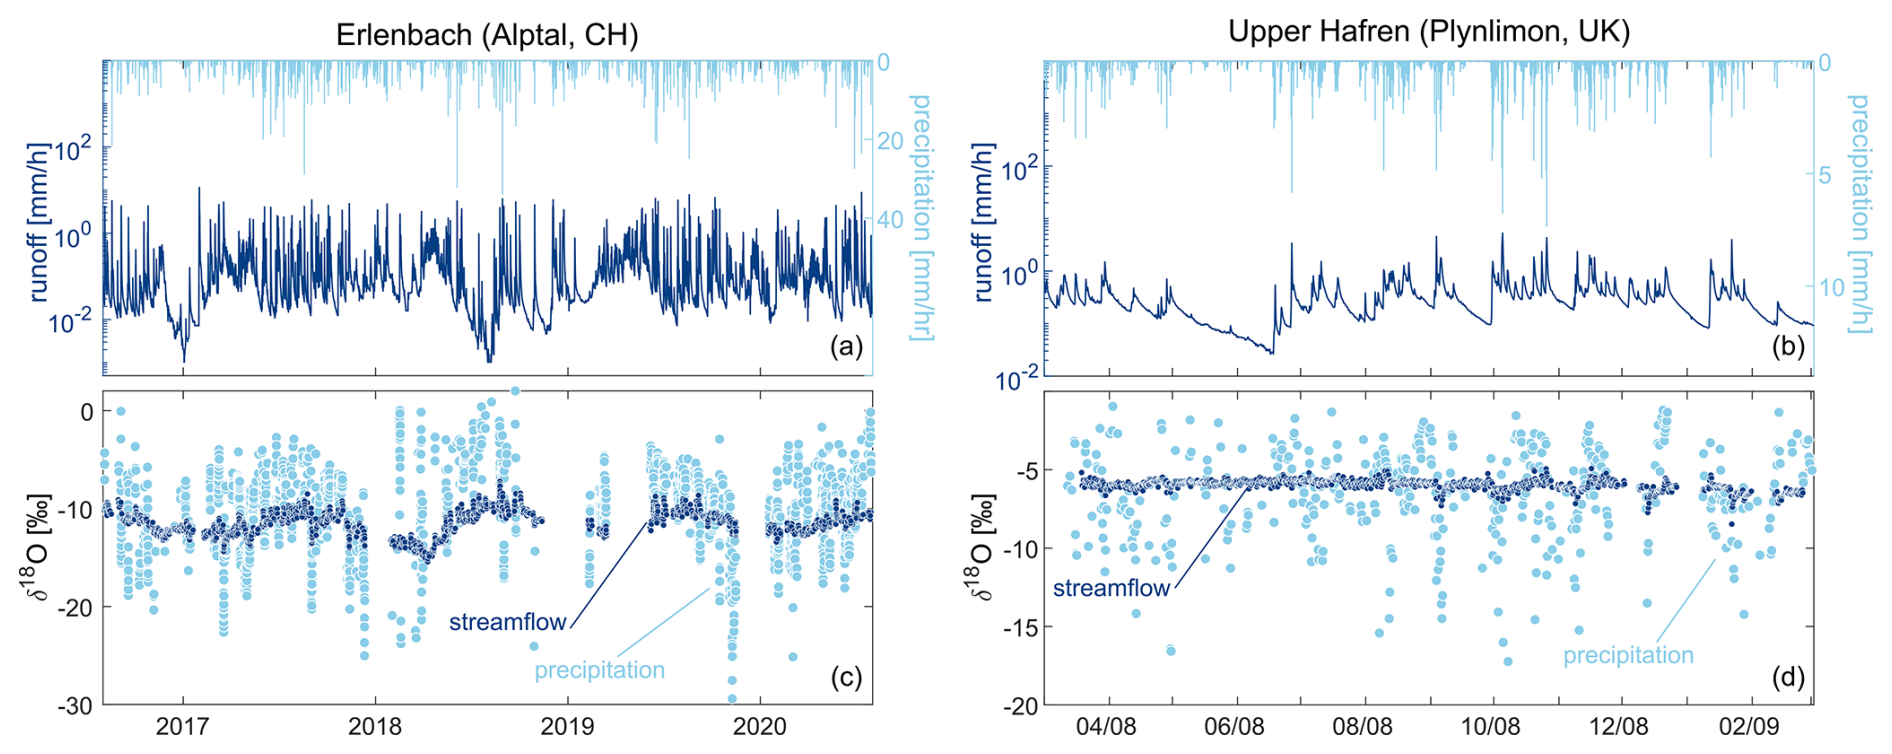
Figure 1Streamflow (dark blue) and precipitation water fluxes (light blue) as well as oxygen-18 data in streamflow (dark blue) and precipitation (light blue) at Erlenbach (Alptal – a, c) and Upper Hafren (Plynlimon – b, d).
In the Upper Hafren catchment at Plynlimon, hydrometeorological data are available at hourly resolution from the Carreg Wen meteorological station (575 m a.s.l.) and the Upper Hafren stream gauge (550 m a.s.l.). Stable water isotopes were measured at 7 h intervals in precipitation at Carreg Wen and in stream water at the Upper Hafren stream gauge from July 2007 through March 2009, but, due to a 3-month data gap between December 2007 and mid-March 2008 caused by sample loss, only data from March 2008 until March 2009 were analysed here (Fig. 1b and d).
At both sites, streamflow measurements and samples were taken instantaneously, while precipitation measurements and samples are cumulative over the respective sampling interval.
2.3 Data analysis
2.3.1 Quantification of antecedent wetness and precipitation intensity
We quantified antecedent wetness by using the stream discharge recorded one time step prior to the isotope sampling and water flux measurement (i.e., 1 and 7 h earlier, at Erlenbach and Upper Hafren, respectively), consistent with the isotope sampling frequency at each site. This approach of assessing antecedent wetness ensures that our wetness metric provides a more holistic representation of catchment-wide wetness compared to localised soil moisture variations. Precipitation intensity was calculated as the average precipitation rate during the time interval preceding each streamflow measurement.
2.3.2 Splitting criteria
We analysed the time series for different percentile ranges of antecedent wetness and precipitation intensity to evaluate how these factors affect hydrologic response and transport in the two catchments. When analysing the effect of wetness or precipitation intensity separately, we binned the 0–60th, 60th–80th, 80th–90th, 90th–95th, and 95th–100th percentiles at Erlenbach (five data bins) and the 0–55th, 55th–75th, 75th–90th, and 90th–100th percentiles at Upper Hafren (four data bins). The smaller number of data points at Upper Hafren required using larger bin sizes and consequently resulted in fewer bins.
When we split the time series by combinations of antecedent wetness and precipitation intensity, we divide both variables into their 0–60th, 60th–80th, and 80th–100th percentiles at both sites. To focus on the greatest contrasts, we selected all possible pairings of low (0–60th percentile) and high (80th–100th percentile) antecedent wetness and precipitation intensity for this analysis.
2.3.3 Ensemble approaches: ensemble rainfall–runoff analysis and ensemble hydrograph separation
The hydrometeorological and tracer time series were analysed using ensemble approaches. Unlike classical unit hydrograph analysis methods that examine individual events in isolation, ensemble approaches estimate the characteristic behaviour of collective “ensembles” of events. This allows for the determination of typical hydrologic response and transport processes under specific catchment and event conditions (here, percentiles of antecedent wetness and precipitation intensity).
Ensemble rainfall–runoff analysis quantifies the distribution of response times and provides insights into how stream discharge responds to precipitation inputs (Kirchner, 2022, 2024a). The runoff response distribution (RRD) quantifies the incremental runoff response per unit precipitation input as a function of lag time (Fig. 2a). The RRD can be converted to the actual streamflow response through multiplication with the precipitation input, yielding the nonlinear response function (Kirchner, 2024a). From the RRD, metrics describing the timing of the peak response (tpeak) and the height of the peak response (hpeak) can be derived (Fig. 2c). Both are estimated from a quadratic fit to the uppermost 20 % of the RRD. Additionally, the rainfall–runoff coefficient (C) is quantified as the integral of the RRD across the range of analysed lag times.
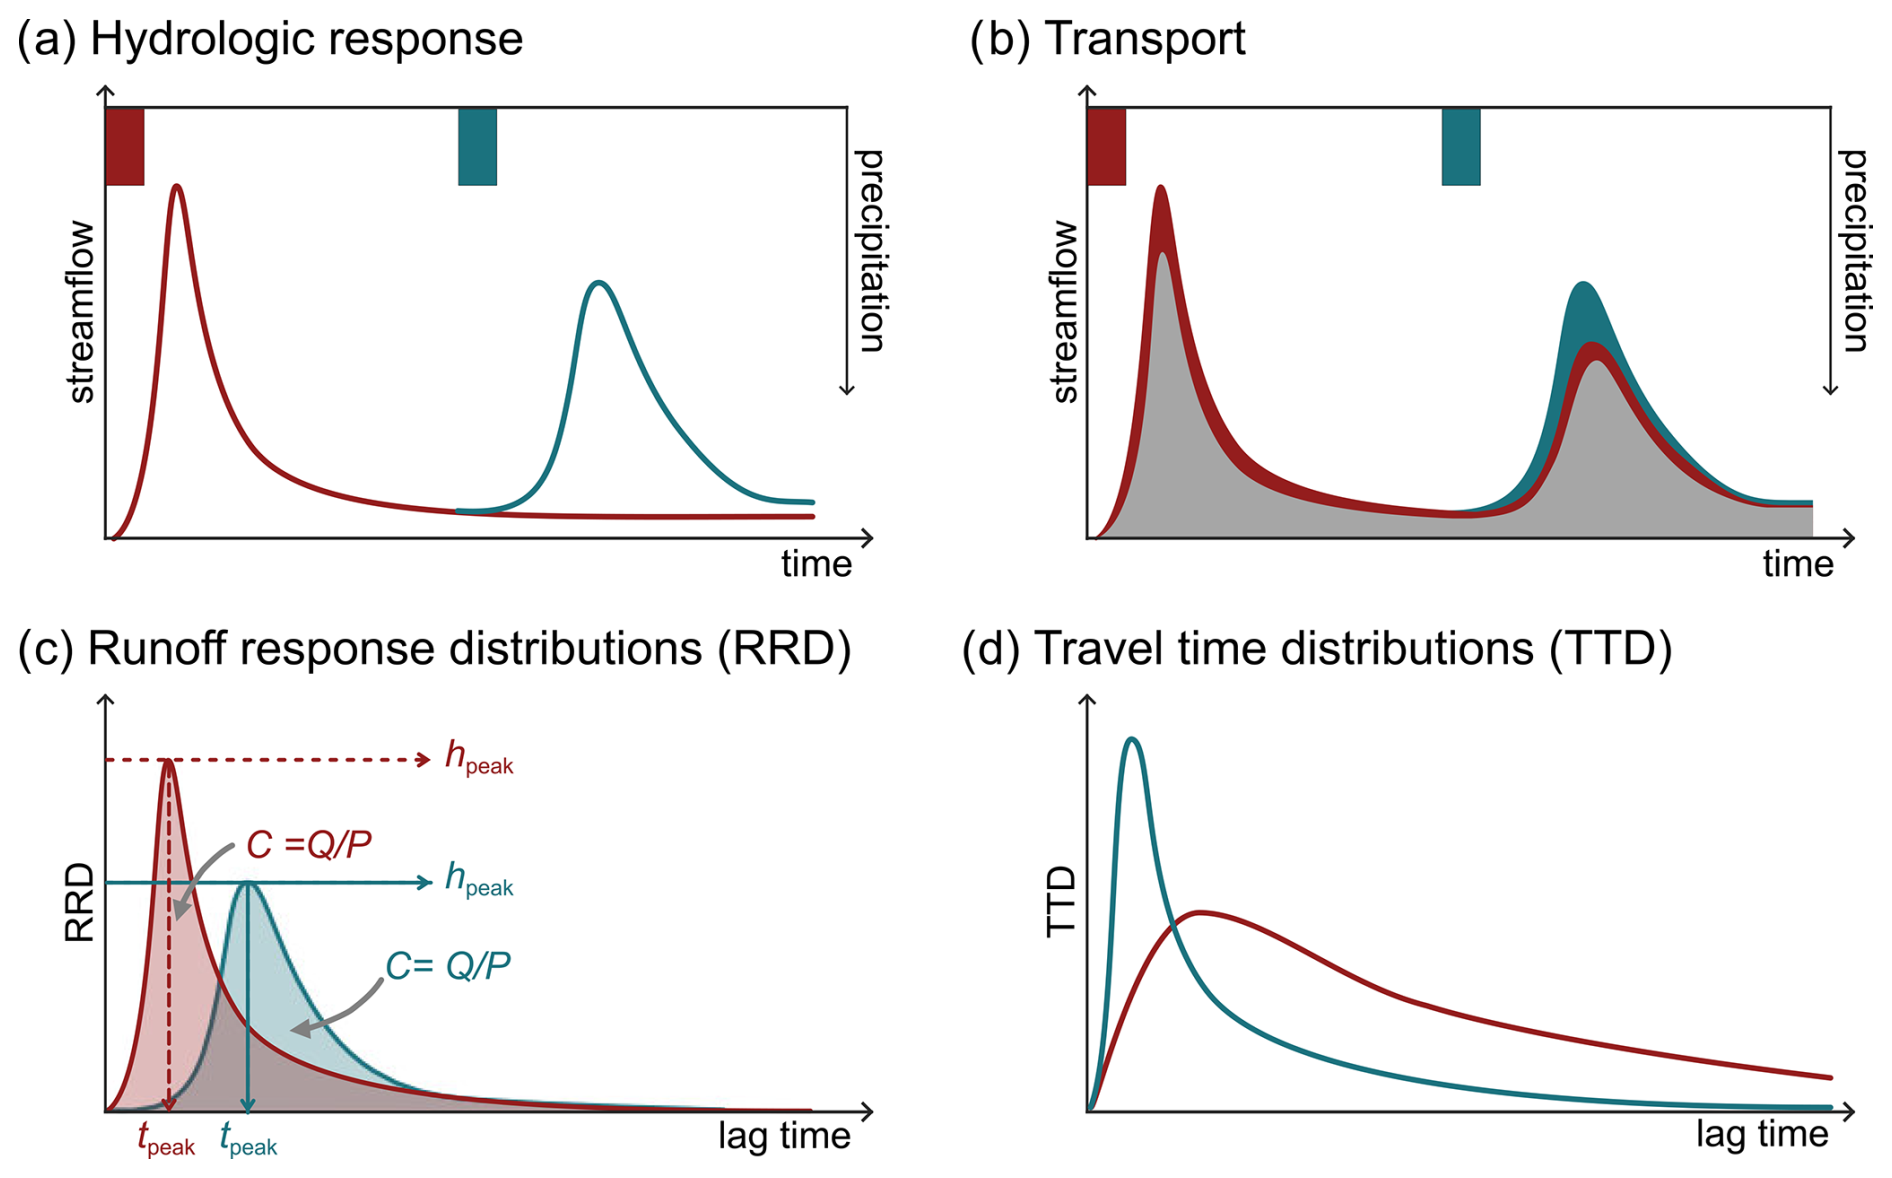
Figure 2Hydrologic response and transport exemplified across two events (red and green). Streamflow is generated in response to precipitation inputs (a), but only a fraction of the generated streamflow consists of precipitation from the most recent precipitation event (b). Runoff response distributions (RRD, c) and travel time distributions (TTD, d) shape the observed response and transport and can take many different shapes, with ensemble distributions (not shown) characterising the “typical” response under specific conditions. The RRD (c) quantifies the time that the precipitation input takes to generate streamflow, and the illustrated metrics describe runoff characteristics in response to each unit of precipitation (i.e., the peak height hpeak, the peak time tpeak, and the runoff coefficient C). The TTD (b) quantifies the time for precipitation inputs to become streamflow. New water fractions (Fnew) can be derived from the TTDs and assess the amount of precipitation contributing to streamflow that is “new” since the last sampling of streamflow.
Ensemble hydrograph separation quantifies the volume-weighted travel time distribution (TTD) and thus the transport of water from precipitation to streamflow. The forward TTD determines the relative proportion of precipitation that contributes to streamflow within specific time intervals, while the backward TTD quantifies the proportion of stream water that consists of water of different ages (Fig. 2b and d). Additional information regarding the approach can be found in Kirchner (2019), while its application is described in Knapp et al. (2019), and the associated analysis codes are presented in Kirchner and Knapp (2020a). From the TTDs, new water fractions quantifying the amount of water that is “new” since the last sampling can be extracted. We calculated the backward new water fraction for all time steps with precipitation and the forward new water fraction PFnew. Their definition corresponds to the definitions of the backward and forward TTDs, with backward new water fractions quantifying the relative amount of streamflow that consists of precipitation that is “new” during the interval since the previous water sample and forward new water fractions quantifying the proportion of precipitation that became streamflow during the same interval. These two metrics are related to each other by
where is the average runoff during the np time steps with precipitation, and is the average precipitation of all time steps n.
Together, these two ensemble analyses can provide insights into the response of streamflow to a unit of recent precipitation and the absolute and relative volumes of recent precipitation found in streamflow.
In both catchments, the hydrologic response was quicker than transport, with higher values of the runoff response distribution (RRD) compared to the travel time distribution (TTD) during the lag times considered here (10 and 48 h at Erlenbach and Upper Hafren, respectively, Fig. 3). The shorter lag times at Erlenbach indicate a flashier system compared to the Upper Hafren, where the hydrologic response and transport are much slower. This indicates that much of the quickly mobilised water during storm events consists of older water. On the other hand, the TTDs decayed more slowly than the RRDs as functions of increasing lag times, indicating greater persistence in catchment transport than in the hydrological response. These findings illustrate that the runoff response occurs on much shorter timescales than the actual transport of water through the catchment.
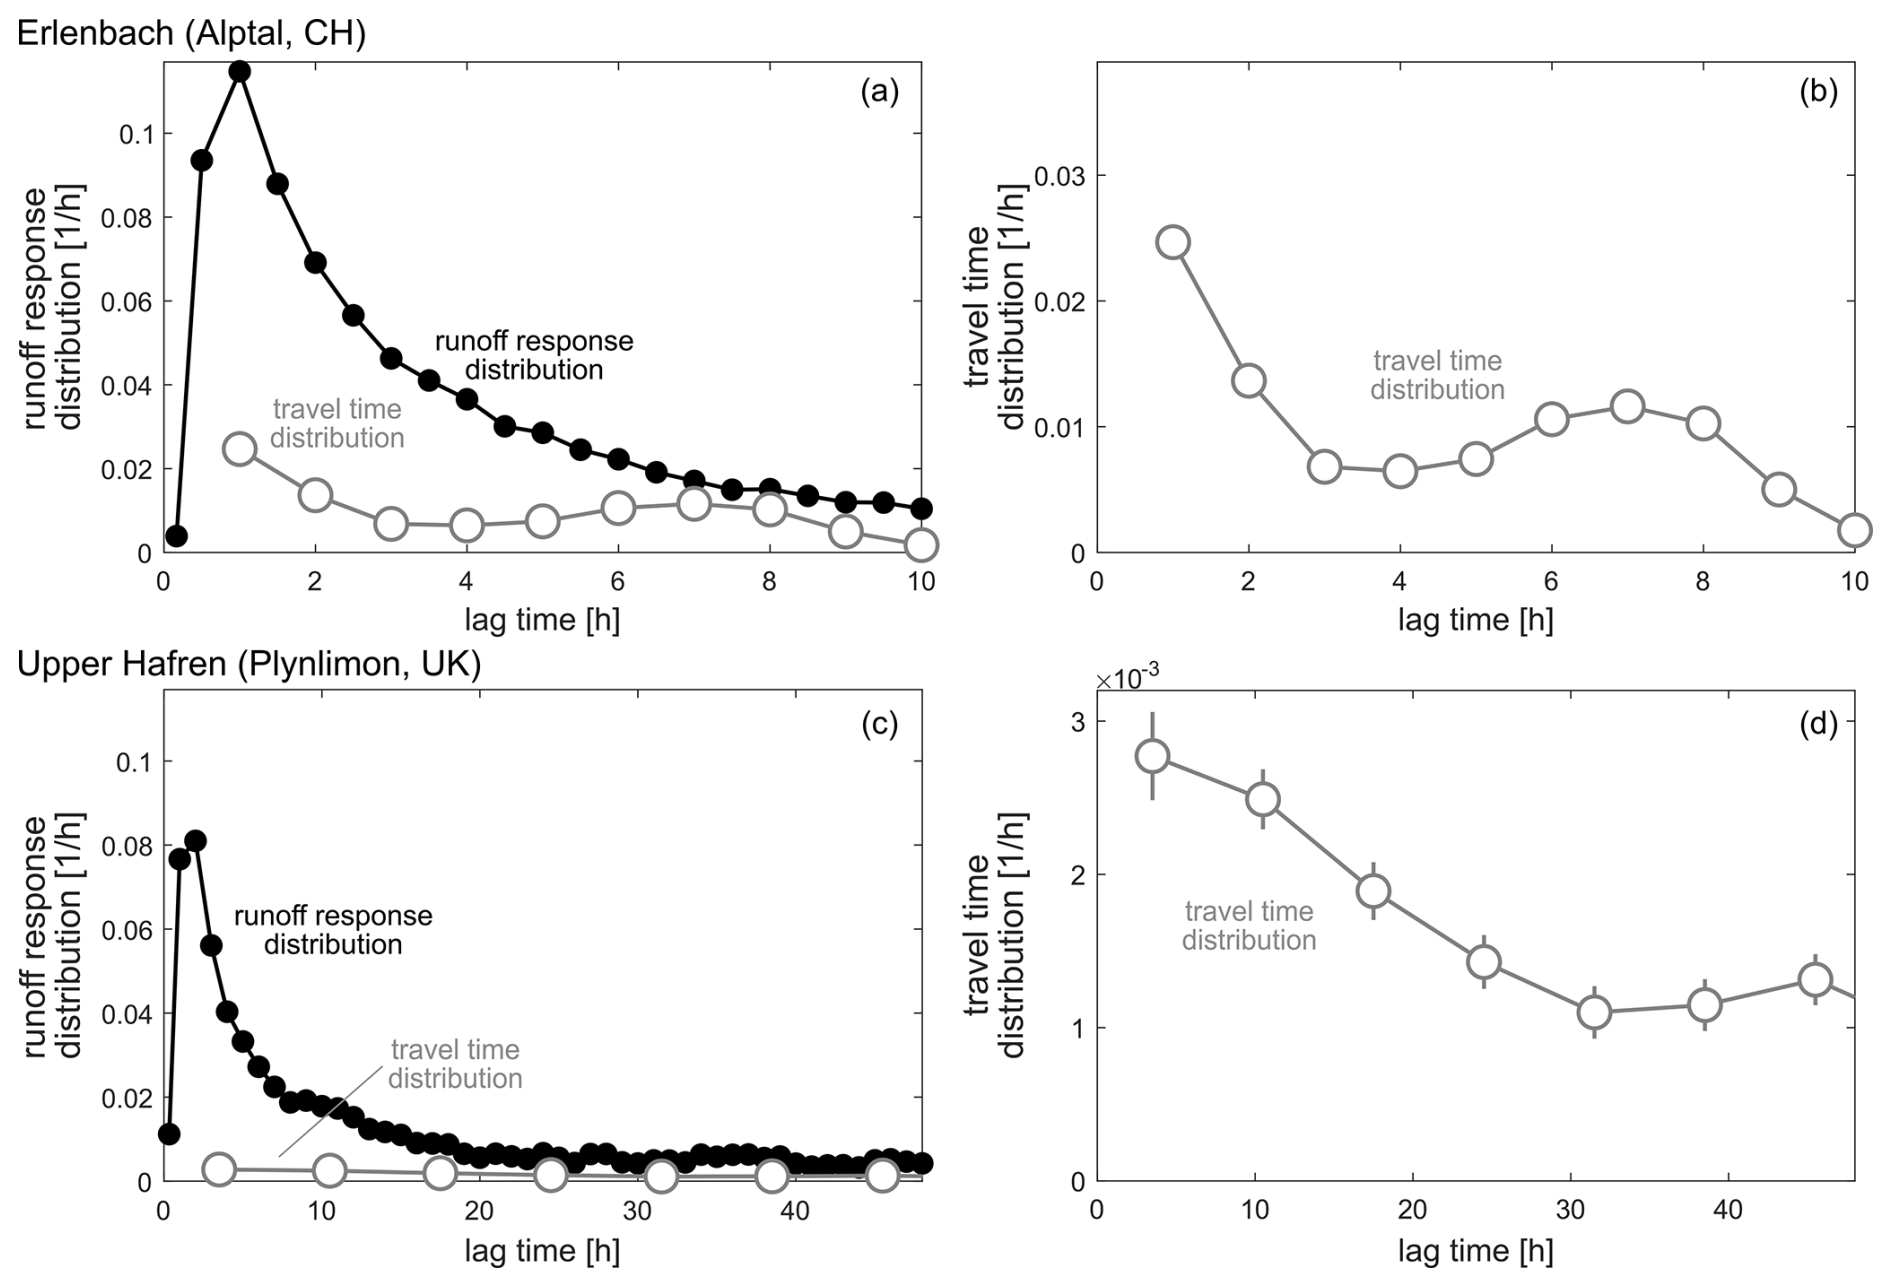
Figure 3A comparison of runoff response distributions (RRDs, black, panels a and c) and backward travel time distributions (TTDs, grey, all panels) at Erlenbach (a, b) and Upper Hafren (c, d). Note that the y axes of the TTDs are magnified by a factor of 3 for Erlenbach and a factor of 30 for Upper Hafren compared to those of the respective RRDs, because the magnitudes of the TTDs are much smaller than those of the RRDs. This is also illustrated in panels (a) and (c), with the TTDs presented in grey next to the RRDs. Error bars representing standard errors are included for all data points; however, in most cases, they are too small to be visually discernible.
3.1 Effect of antecedent wetness
Antecedent wetness affected the hydrological response and transport at both the Erlenbach and Upper Hafren catchments (illustrated in blue in Fig. 4). The peak height of the RRD hpeak and the runoff coefficient C increased with antecedent wetness, more than doubling between dry and wet conditions. This suggests a much greater response in streamflow to the same precipitation input under wetter conditions (Fig. 4a, c, i, k, m, and o), which is similar to the behaviour one would expect from a nonlinear storage–discharge relationship. Notably, the timing of the arrival of the runoff peak tpeak did not change substantially with antecedent wetness (Fig. 4e and g), suggesting that the streamflow responses occurred equally quickly during dry and wet conditions.
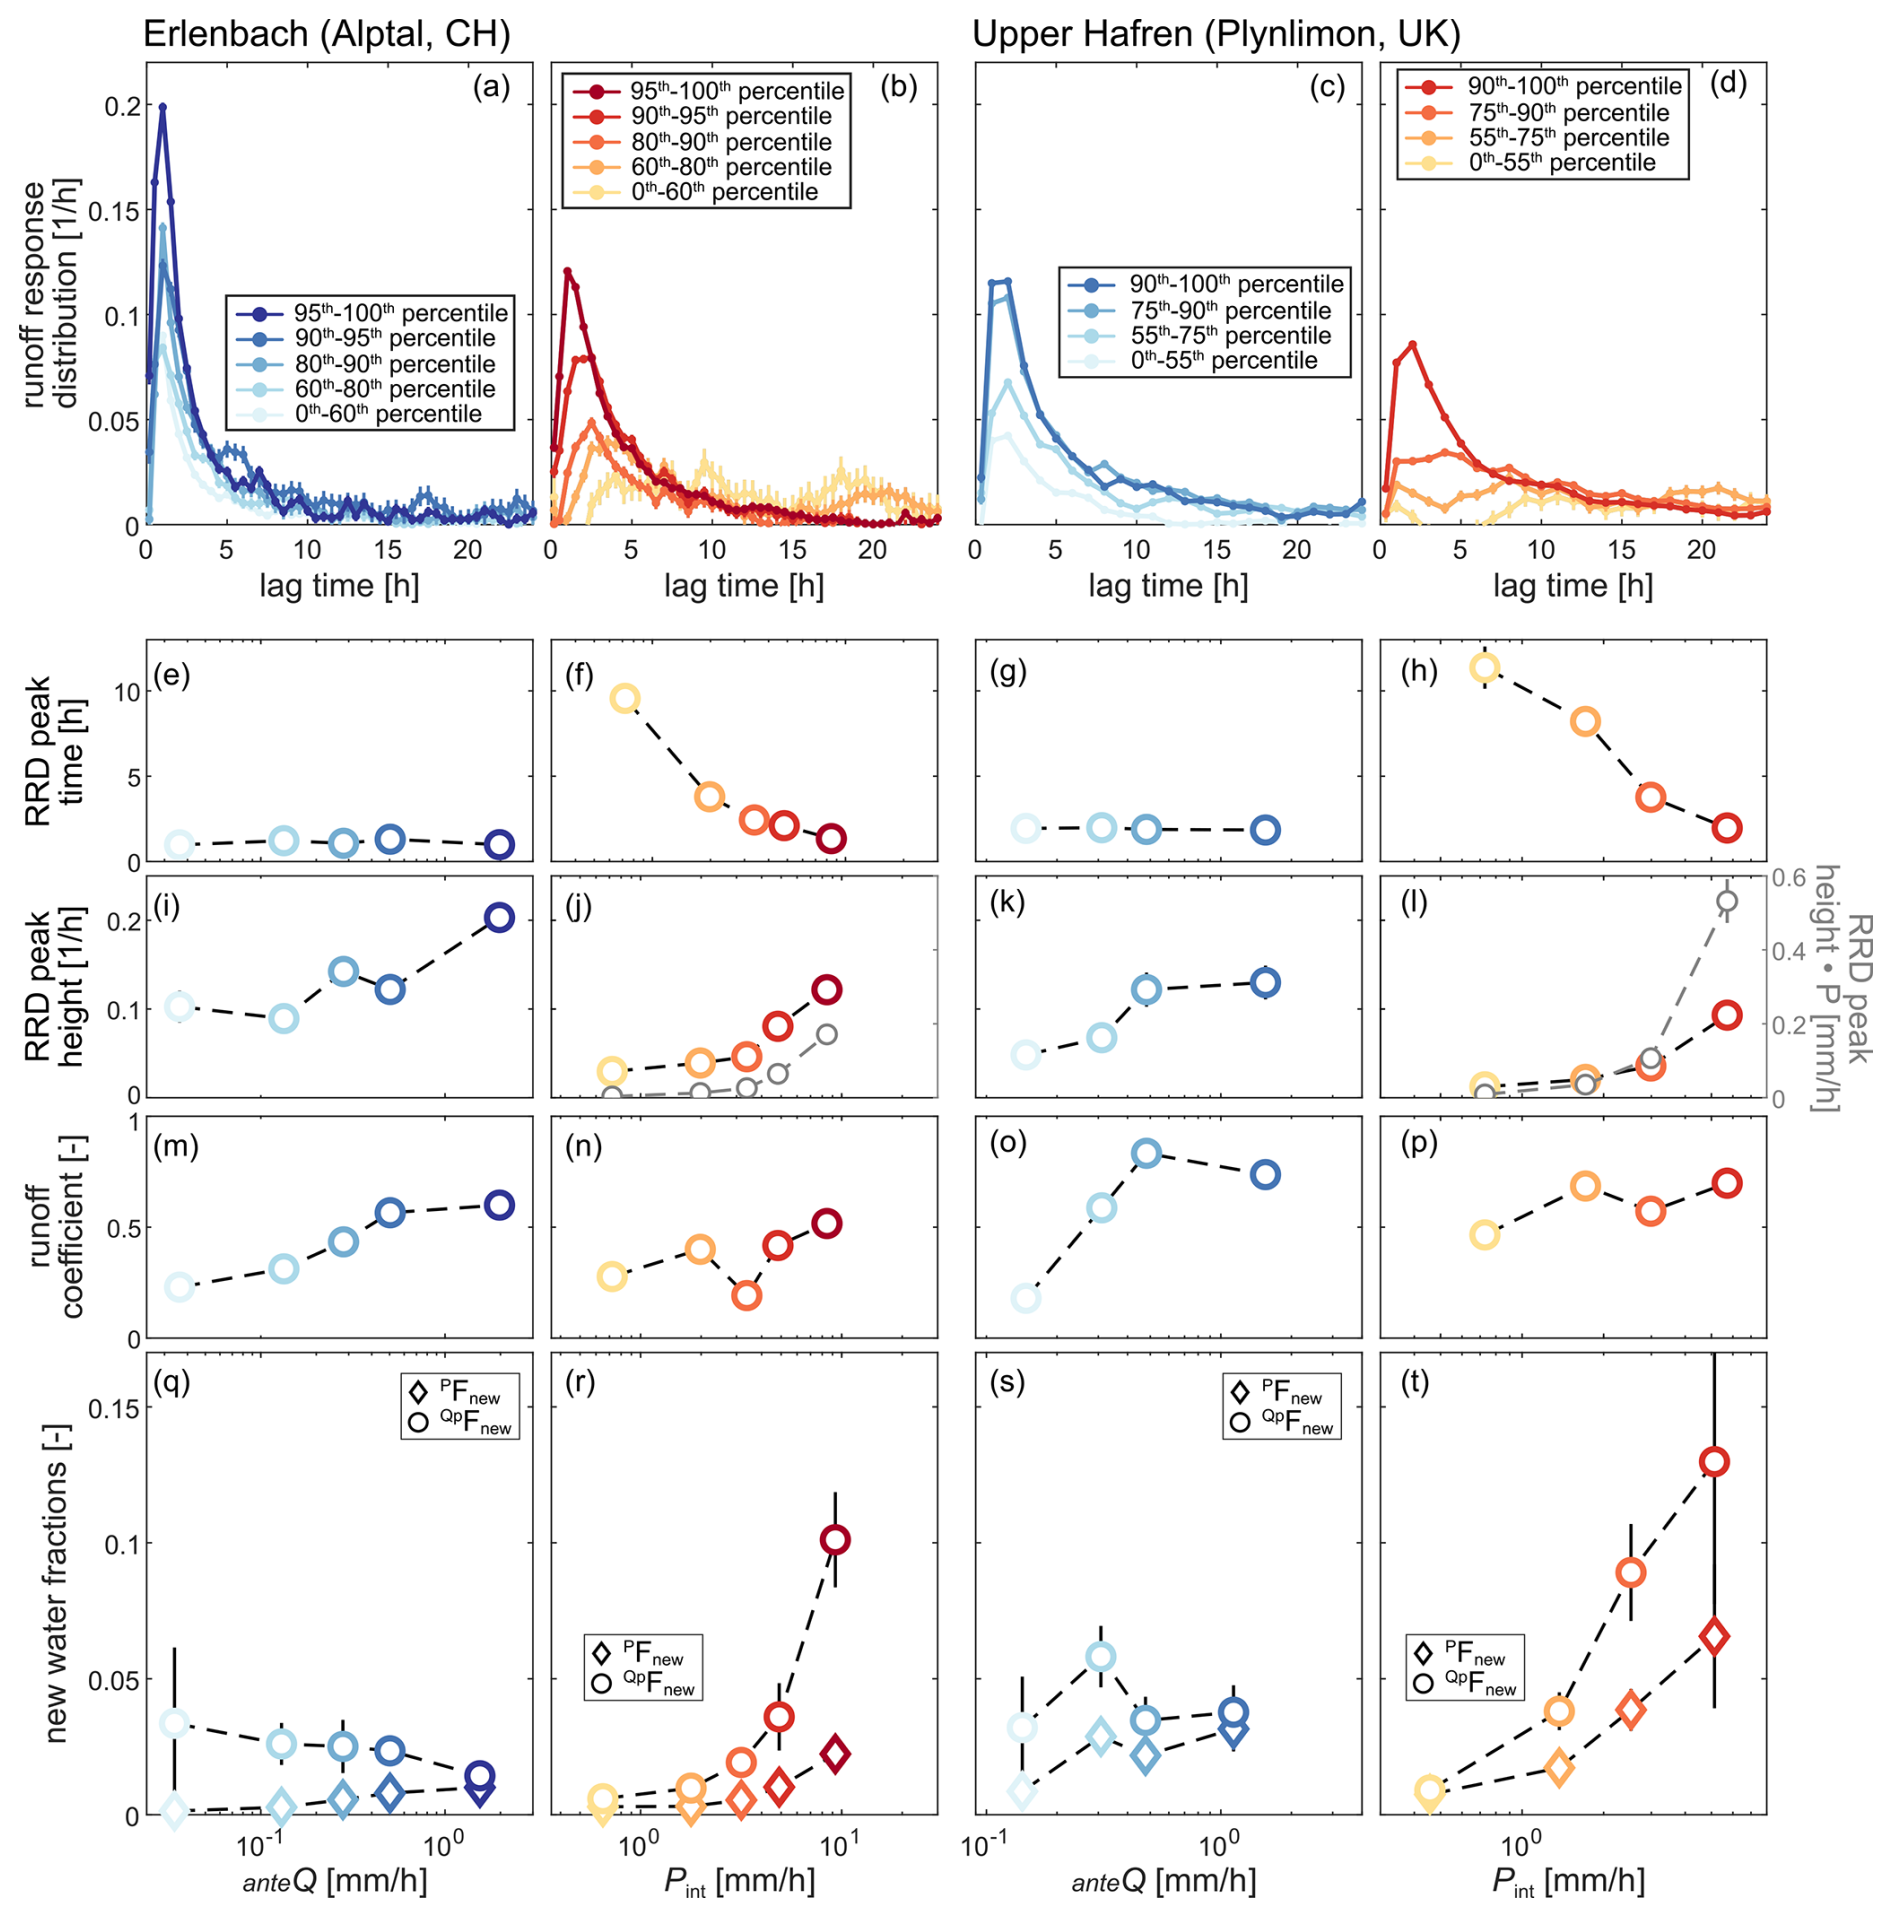
Figure 4Effect of changes in antecedent wetness (blue) and precipitation intensity (red) on runoff–response distributions (a–d) and their associated peak times (e–h), peak heights (i–l), runoff coefficients (m–p), and new water fractions (q–t, diamonds indicate forward new water fractions, circles indicate backward new water fractions). Error bars indicate standard errors, where these are larger than the plotting symbols. Both catchments exhibit stronger runoff responses under wetter antecedent conditions but with little change in the amount of recent precipitation reaching the stream. Both catchments also exhibit a stronger and faster response, as well as higher proportions of recent precipitation in streamflow, at higher precipitation intensities.
When tracking the transport of water through the catchment, we focused on transport metrics (i.e., the new water fractions and PFnew) rather than the full TTDs due to the limited number of isotope data points available. Both forward and backward new water fractions were small (around 5 %) and did not increase with greater antecedent wetness (Fig. 4q and s). We also quantified new water fractions over aggregated intervals of 21 h (Fig. S1 in the Supplement). New water fractions were larger for these longer intervals than for the original sampling intervals (1 and 7 h at Erlenbach and Upper Hafren, respectively), partly as a natural consequence of the fact that the fraction of new water will inherently grow with the interval of water age that is considered “new” (see Sect. 5.3 of Knapp et al., 2019, for a more detailed explanation). Across all time intervals, however, new water fractions exhibited similar patterns of small increases with antecedent wetness (Fig. S1).
Our findings indicate a strong dominance of older water in streamflow and show that antecedent wetness affects the transport of water through the catchment much less than it affects the streamflow response. Intriguingly, the two catchments had similar RRD and TTD metrics and similar sensitivities to antecedent wetness (Fig. 4), despite their substantial differences in topography, land cover, and geology.
3.2 Effect of precipitation intensity
The precipitation intensity affected the hydrologic response and transport in both catchments (red symbols in Fig. 4). Higher precipitation intensities shortened the RRD peak arrival time tpeak by factors of approximately 7 at Erlenbach and 6 at Upper Hafren (between the lowest and highest precipitation intensities; Fig. 4f and h). Higher precipitation intensities also increased RRD peak heights hpeak (Fig. 4j and l) and runoff coefficients C (Fig. 4n and p), approximately doubling both metrics between the lowest and highest precipitation intensities. These results suggest a stronger and quicker streamflow response to higher-intensity precipitation inputs.
Because RRDs quantify the response per unit of precipitation input, a linear system would yield RRDs that were the same at both high and low precipitation intensities. Thus, our results indicate a nonlinear system, one that reacts faster and more strongly to higher-intensity precipitation. The magnitude of the actual runoff response, obtained from multiplying the RRD by the precipitation volume (this is the nonlinear response function of Kirchner, 2024a), increases even more strongly with precipitation intensity, as illustrated in Fig. 4j and l (grey symbols).
New water fractions at both sites increased with precipitation intensity, exceeding 10 % (i.e., 0.1) for backward new water fractions, while forward new water fractions remained in the range of 2 %–6 % (Fig. 4r and t). This underscores the fact that an increasing proportion of streamflow originates from recent precipitation as precipitation intensities increase, while overall still only small fractions of recent precipitation reach the stream. New water fractions calculated for 21 h aggregations were larger than those of the shorter sampling intervals but exhibited similar relationships to precipitation intensity (Fig. S1).
Both hydrologic response and transport exhibited similar sensitivity to precipitation intensity at Erlenbach and Upper Hafren, despite their differences in topography, land cover, and geology, indicating similar responses of both catchments to variations in precipitation intensity.
3.3 Joint effects of antecedent wetness and precipitation intensity
To evaluate how antecedent wetness and precipitation intensity interact to affect hydrologic response and transport, we compared four scenarios of high/low antecedent wetness and high/low precipitation intensity (Fig. 5). Low precipitation intensities combined with dry antecedent conditions resulted in both a weak hydrologic response and negligible transport (pale yellow symbols in Fig. 5). High precipitation intensities combined with wet antecedent conditions resulted in strong and rapid hydrologic response as well as substantial transport (dark purple symbols in Fig. 5). The hydrologic response was much weaker for all other combinations of precipitation intensity and antecedent wetness (Fig. 5a and b). However, if the RRD (streamflow response per unit of precipitation) was rescaled by multiplying by the precipitation input (resulting in the nonlinear response function of Kirchner, 2024a), one sees that this response was substantial whenever precipitation intensity was high, regardless of antecedent wetness (Fig. 5c and d), whereas the response was essentially zero under all scenarios of low precipitation intensity owing to near-zero precipitation.
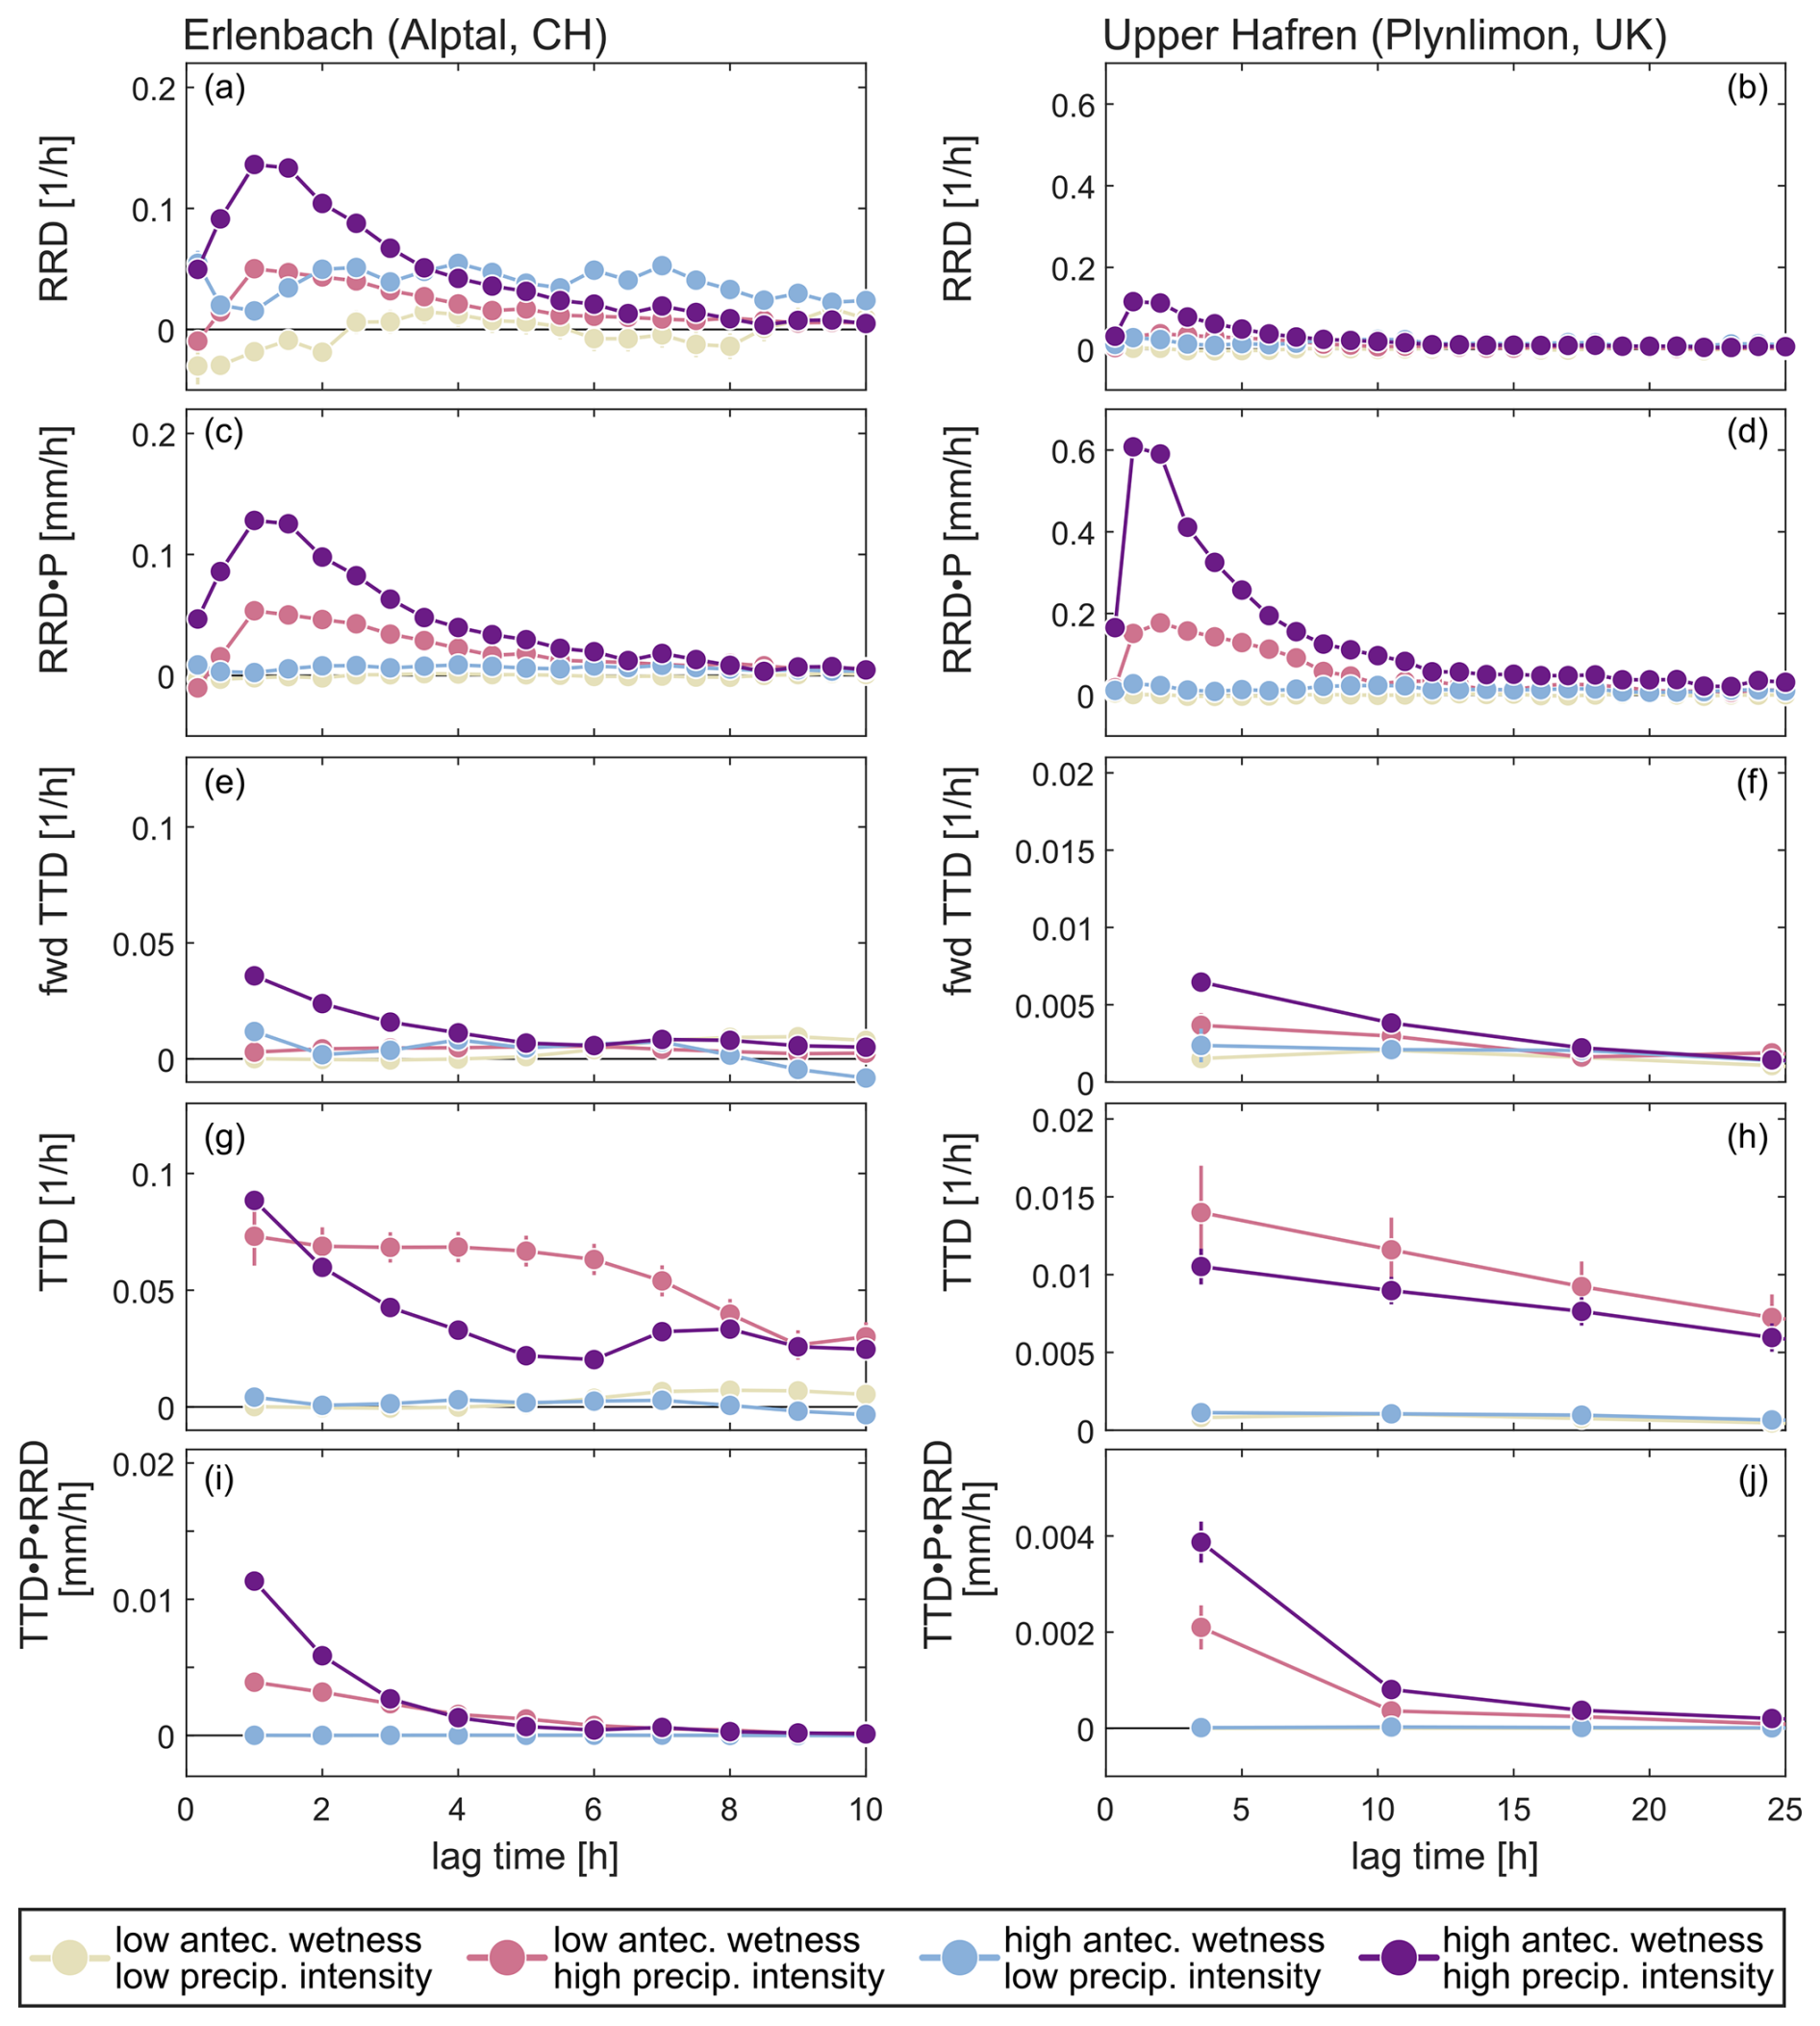
Figure 5Illustration of the combined effect of antecedent wetness and precipitation intensity at Erlenbach (left panels a, c, e, g, i) and Upper Hafren (right panels b, d, f, h, j) on the runoff–response distributions (a, b), the RRD multiplied by the precipitation input (yielding the actual runoff response: c, d), the forward (e, f) and backward (g, h) travel time distributions, and the product of the RRD, TTD, and precipitation amount (i, j). Error bars representing standard errors are included for all data points; however, in most cases, they are too small to be visually discernible. The results illustrate that the amount of recent precipitation in streamflow is usually very small, even in cases of strong hydrologic response. Only the combination of high antecedent wetness and high precipitation intensity results in a non-negligible amount of recent precipitation reaching streamflow.
The combined effect of antecedent wetness and precipitation intensity on transport behaviour differed between forward and backward TTDs. Forward TTDs (Fig. 5e and f) were generally smaller than backward TTDs (Fig. 5g and h), which can be explained by the fact that they are related to each other by the runoff coefficient (Eq. 1), which is usually smaller than 1. Forward TTDs at both sites were greatest when both antecedent wetness and precipitation intensity were high, although the effect was relatively weak. Backward TTDs, on the other hand, appeared to be most affected by precipitation intensity and less by antecedent wetness, with the highest TTDs observed for high precipitation intensity independent of antecedent wetness.
3.4 Contrasting and combining response and travel time distributions
The TTD quantifies the proportion of precipitation becoming streamflow (forward TTD) or the proportion of streamflow consisting of recent precipitation (backward TTD). To quantify the actual amounts of recent precipitation reaching the stream, we multiplied the backward TTD by the RRD (which quantifies the streamflow generated per unit of rainfall input) and the total precipitation input (Fig. 5i and j). These calculations illustrate that the only noteworthy signals of recent precipitation in streamflow occurred under conditions of high precipitation intensity, with the strongest response when high precipitation intensity was paired with high antecedent wetness (purple symbols in Fig. 5i and j). Wet antecedent conditions combined with low-intensity precipitation resulted in near-zero amounts of recent precipitation reaching the stream, indicating that wetness conditions alone played only a minor role in governing transport processes.
Our results reiterate the apparent paradox between catchment hydrologic response and transport, in which streamflow responds to precipitation inputs almost instantaneously, even though streamflow is primarily composed of old water stored in the catchment (Kirchner, 2003; Małoszewski and Zuber, 1982; Botter et al., 2010; McDonnell, 1990). However, the extent to which antecedent wetness and precipitation intensity affect streamflow responses and the transmission of recent precipitation to the stream remains poorly understood. Here we investigated how changes in antecedent wetness and precipitation intensities shape the hydrologic response and transport across two data-rich catchments. At these two sites, the “old water paradox” consistently holds true under the full spectrum of precipitation intensities and antecedent wetness conditions.
4.1 Conceptualisation of catchment functioning in response to antecedent wetness and precipitation intensity
The interplay between antecedent wetness and precipitation intensity influences hydrologic response and transport, shaping the overall system behaviour. We found that antecedent wetness and precipitation intensity had different effects on both hydrologic response and transport. Antecedent wetness primarily influenced the magnitude of the runoff response, while precipitation intensity affected both its magnitude and timing. Notably, only the combination of high precipitation intensity and wet antecedent conditions led to large runoff responses, which agrees with large-scale studies investigating flood-generating mechanisms (e.g., Berghuijs et al., 2019). Transport was also affected differently by antecedent wetness and precipitation intensity: new water fractions were largely unaffected by changes in wetness but increased with increasing precipitation intensity.
Combining hydrologic response and transport information under various conditions of antecedent wetness and precipitation intensity can shed light on runoff generation mechanisms and flow paths (Fig. 6). Higher catchment wetness resulted in larger hydrologic responses, but the fraction of recent precipitation reaching streamflow did not increase (Fig. 6a and b vs. 6c and d). Hence, increasing antecedent wetness generates more streamflow by mobilising more old water. This indicates that – contrary to our original hypothesis – changes in antecedent wetness do not result in greater activation of shallower pathways that deliver more new water to the stream. Instead, increased catchment wetness may increase hydrologic connectivity throughout the catchment, enhancing the connection of stored older waters to the stream, and thus amplifying hydrologic response under wetter conditions. The spatial scales of these processes may depend on catchment characteristics, such as slope and topography. Previous studies highlighted the importance of antecedent wetness in controlling runoff generation (e.g., Penna et al., 2011; James and Roulet, 2007; Detty and McGuire, 2010; Staudinger et al., 2025), but few were able to assess how much recent precipitation is contained in this runoff.
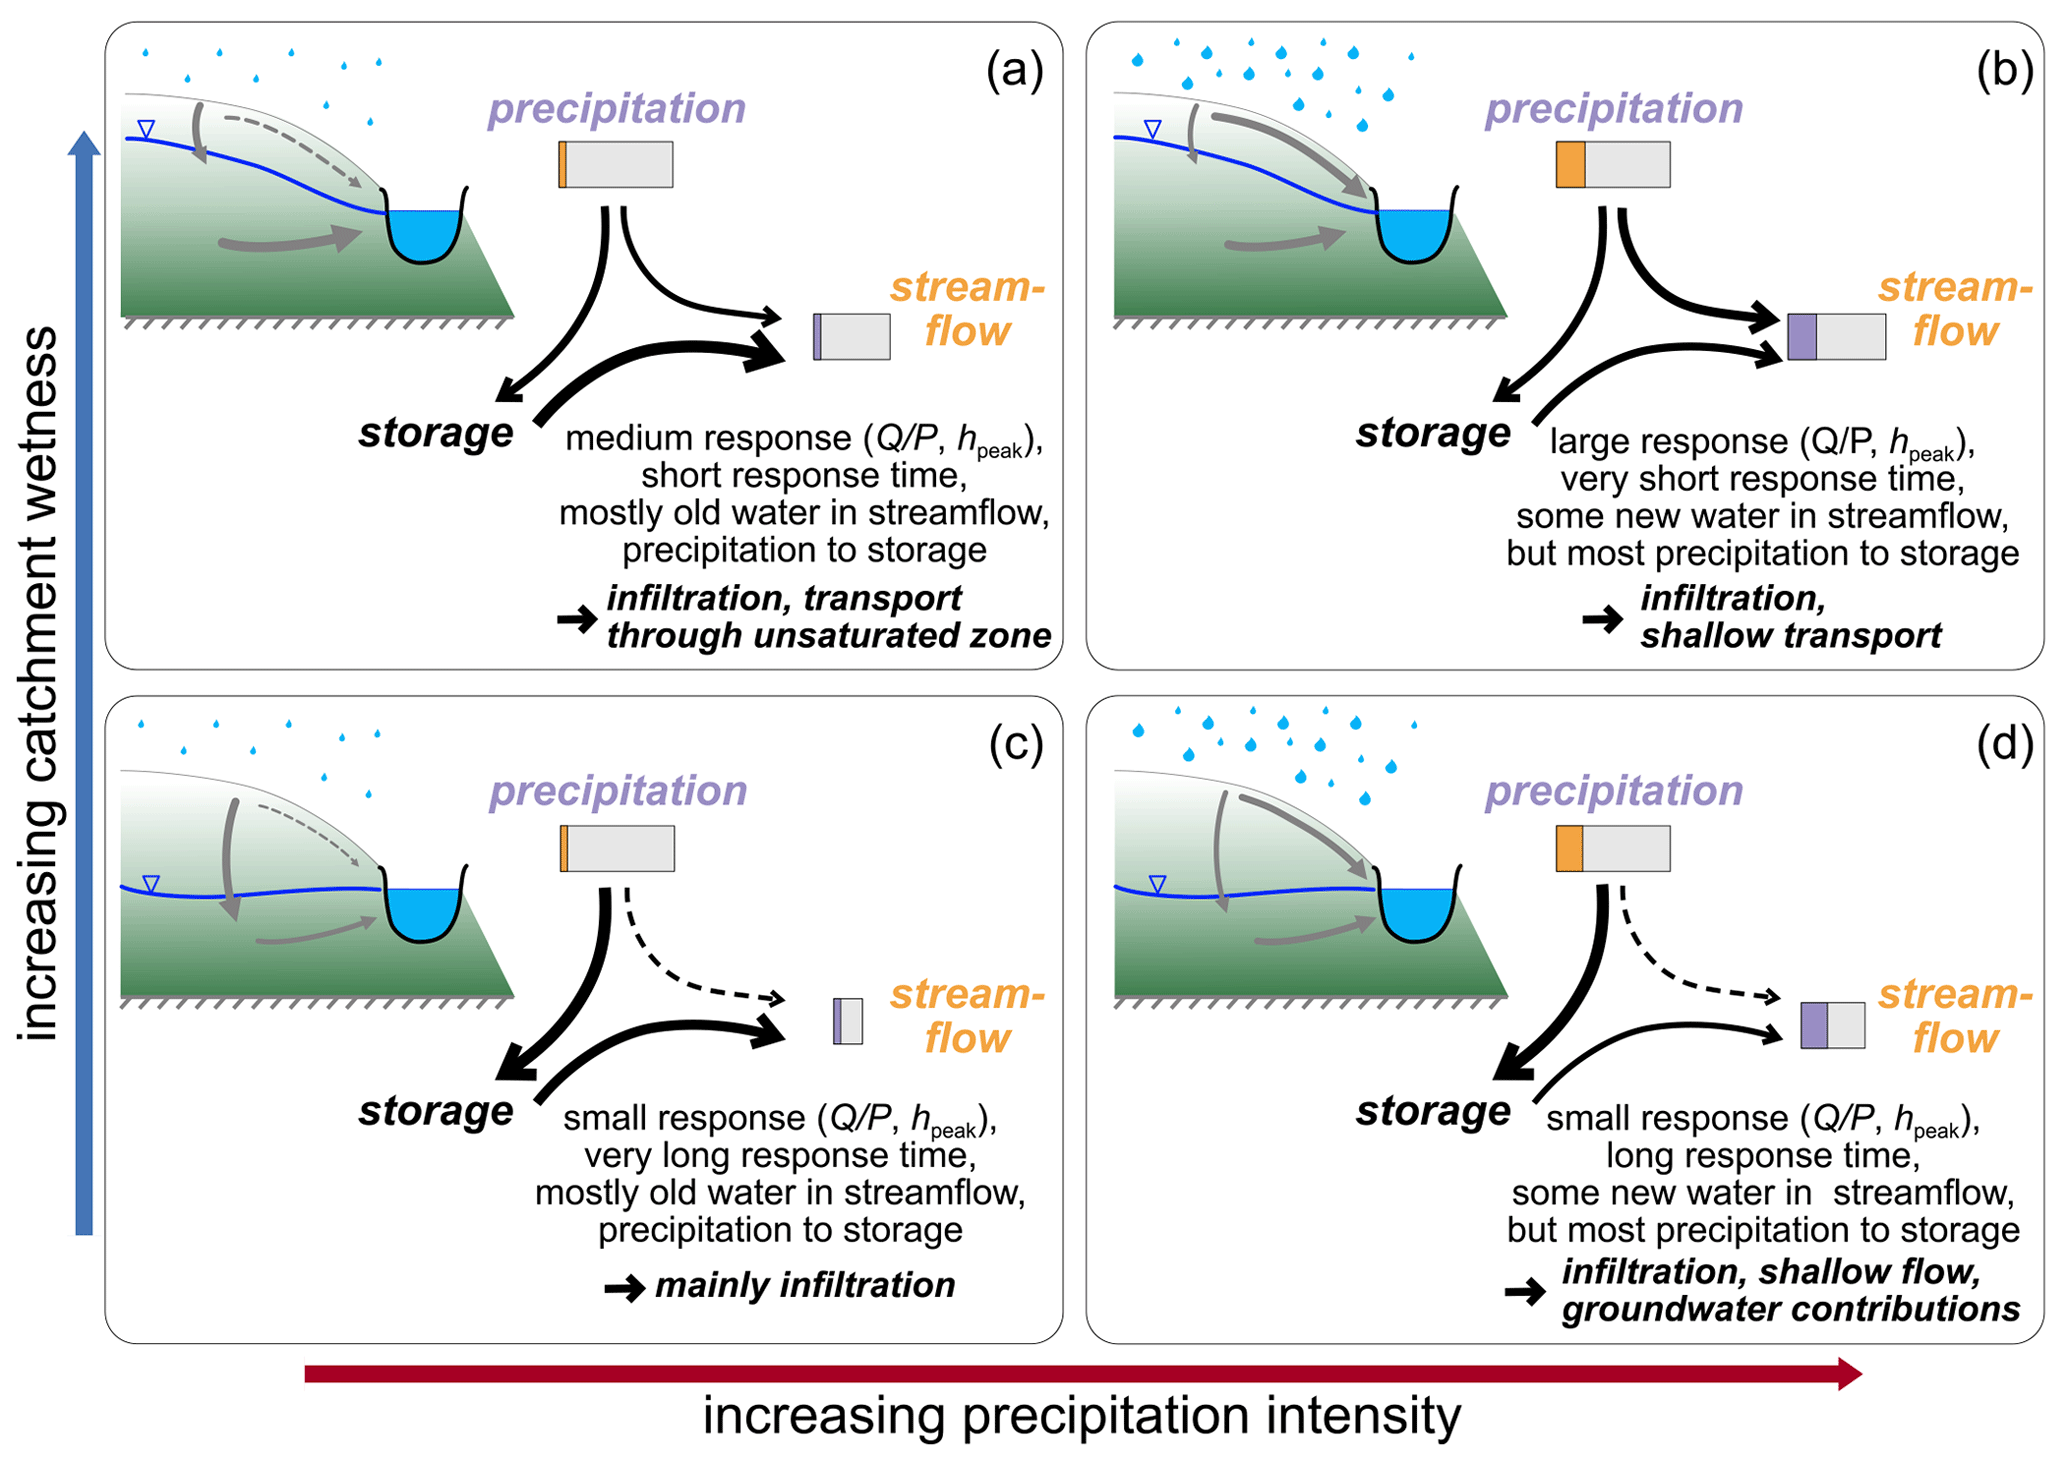
Figure 6Schematic illustration of potential storage and release processes in catchments as functions of high (a, b) and low (c, d) antecedent wetness and low (a, c) and high (b, d) precipitation intensity, as inferred from RRD and TTD metrics. We assume here that larger proportions of recent precipitation in streamflow (i.e., larger new water fractions) imply enhanced transport via shallow subsurface pathways. Larger amounts of older water in streamflow (i.e., smaller new water fractions) are assumed to imply greater contributions from subsurface storage, e.g., groundwater. Widths of arrows indicate the approximate importance of the various pathways, and the relative lengths of the grey bars for precipitation and streamflow indicate the runoff coefficient (i.e., how much streamflow is produced per unit of precipitation input). The coloured segments of the grey bars indicate how much precipitation promptly becomes streamflow (i.e., forward new water fractions, shown in orange) or which proportion of streamflow is made up of recent precipitation (i.e., backward new water fraction, shown in purple). Per definition, the areas of the orange and purple sections are identical but may represent different proportions of precipitation and streamflow, because they illustrate the same new water from two different perspectives. Wetter antecedent conditions increase the magnitude of streamflow response, but most of this streamflow is composed of older water. Conversely, higher precipitation intensity increases the magnitude of streamflow response, reduces response times, and enables the transport of larger amounts of recent precipitation to the stream.
On the other hand, increasing precipitation intensity not only amplifies the runoff response but also changes the age composition of the water that is being mobilised. This results in a greater (but overall still small) amount of recent precipitation contributing to streamflow at higher precipitation intensities (Fig. 6a and c vs. 6b and d), as was previously also noted by, e.g., Kirchner (2019) and Knapp et al. (2019). Additionally, the hydrologic response is propagated faster through the system under more intense precipitation, similar to findings by, e.g., Mindham et al. (2023). Our findings regarding the timing and composition of generated runoff indicate that higher precipitation intensity may result in a pronounced activation of shallower flow paths, ultimately resulting in a stronger and faster streamflow response that is composed of more recent precipitation.
While many studies have investigated hydrologic response and transport separately, the joint representation of hydrologic response and transport provides a more comprehensive picture. Combining information on response and transport allows us to infer the composition of generated runoff under varying conditions of catchment wetness and precipitation intensity. This combined approach also yields potential insights about flow paths that would not have been achieved by examining hydrologic response and transport in isolation.
4.2 The role of wetness and precipitation intensity across catchments
The two catchments investigated in this study have markedly different soil types, topography, and vegetation. Despite these different physical properties, the two catchments exhibited similar patterns in hydrologic response and transport, suggesting that these patterns of behaviour may not be site-specific but may instead be more broadly applicable in diverse landscapes. However, further research is needed to confirm the generality of these findings across a wider range of catchments and environmental conditions. At present, however, these two sites are (to our knowledge) the only ones with sufficiently detailed long-term, high-frequency isotope measurements to facilitate such systematic analyses of the effects of antecedent wetness and precipitation intensity on hydrologic response and transport. Thus, this study highlights the importance of making long-term, high-frequency tracer measurements more widely available.
Many previous studies have related catchment response times to physical properties of the basin (Carrillo et al., 2011; Post and Jakeman, 1996; Nippgen et al., 2011); however, our results demonstrate that the dynamics of runoff response and transport are also strongly dependent on antecedent wetness and precipitation intensity. While catchment-specific characteristics like land use and geology do modulate system behaviour and the activation of flow paths, our findings underscore the fundamental role of antecedent wetness and precipitation intensity in determining the nature and the dynamics of hydrologic response and transport.
This study builds on previous research by providing a more detailed view of hydrological and transport dynamics across a large number of events. Our findings highlight how catchment wetness, flow pathways, and solute transport vary under different conditions, offering a more nuanced understanding of catchment responses. Our study shows that antecedent wetness and precipitation intensity have substantial, yet distinctly different, effects on hydrologic response and transport processes. Increases in both antecedent wetness and precipitation intensity result in substantially stronger runoff responses but through different mechanisms. While higher catchment wetness largely mobilises more old water, more intense precipitation mobilises more water of all ages and increases the proportion of recent precipitation reaching the stream. Integrating information on hydrologic response and transport thus improves our understanding of relevant catchment processes.
Our investigation of changes in hydrologic response and transport as functions of antecedent wetness and precipitation intensity yields a conceptual picture of system behaviour that could potentially be applicable beyond the specific catchments studied here. However, further research across a wider range of catchments would be required to test this. The effects of changes in wetness and precipitation intensity on transport are not included in many large-scale models, and their effects on hydrologic response often remain poorly constrained. Thus, our results reveal key behaviours that could be integrated into models to make them more realistic.
Many water resource challenges not only require the accurate estimation of water fluxes but also require catchment transport processes to be captured correctly. Improving our understanding of how different subsurface pathways respond to climatic shifts or land use changes might enable more accurate and realistic predictions of the effect of wetter catchment conditions and intensified precipitation on water resources and their quality, with shorter travel times potentially leading to accelerated pollutant transport (Li et al., 2024). We suggest that the joint consideration of hydrologic response and transport processes may contribute to more accurate water quality and quantity assessments. Such analyses could be relevant both for data-driven analyses and model development.
Isotope and streamflow data from Upper Hafren, Plynlimon, are available at https://doi.org/10.16904/envidat.82 (Kirchner et al., 2019). Erlenbach data (isotopes and streamflow records) are available from the authors upon reasonable request. MATLAB and R codes used to calculate transport via ensemble hydrograph separation are available at https://doi.org/10.16904/envidat.182 (Kirchner and Knapp, 2020b). The R code used to calculate hydrologic response via ensemble rainfall–runoff analysis is available at https://doi.org/10.16904/envidat.529 (Kirchner, 2024b).
The supplement related to this article is available online at https://doi.org/10.5194/hess-29-3673-2025-supplement.
JLAK and JWK conceived the study. JLAK analysed the data and wrote the first draft of the manuscript. All authors contributed to the interpretation of the data and the editing of the paper.
At least one of the (co-)authors is a member of the editorial board of Hydrology and Earth System Sciences. The peer-review process was guided by an independent editor, and the authors also have no other competing interests to declare.
Publisher's note: Copernicus Publications remains neutral with regard to jurisdictional claims made in the text, published maps, institutional affiliations, or any other geographical representation in this paper. While Copernicus Publications makes every effort to include appropriate place names, the final responsibility lies with the authors.
The authors received no specific funding for this work. The authors are grateful to Raphaël Miazza for pointing out a small, but consequential, error in wording.
This paper was edited by Markus Weiler and reviewed by Markus Hrachowitz and one anonymous referee.
Bennett, B., Leonard, M., Deng, Y., and Westra, S.: An empirical investigation into the effect of antecedent precipitation on flood volume, J. Hydrol., 567, 435–445, https://doi.org/10.1016/j.jhydrol.2018.10.025, 2018. a
Berghuijs, W. R., Harrigan, S., Molnar, P., Slater, L. J., and Kirchner, J. W.: The Relative Importance of Different Flood-Generating Mechanisms Across Europe, Water Resour. Res., 55, 4582–4593, https://doi.org/10.1029/2019WR024841, 2019. a
Beven, K.: Interflow, Springer Netherlands, Dordrecht, 191–219, https://doi.org/10.1007/978-94-009-2352-2_7, 1989. a
Birkel, C., Geris, J., Molina, M. J., Mendez, C., Arce, R., Dick, J., Tetzlaff, D., and Soulsby, C.: Hydroclimatic controls on non-stationary stream water ages in humid tropical catchments, J. Hydrol., 542, 231–240, https://doi.org/10.1016/j.jhydrol.2016.09.006, 2016. a
Botter, G.: Catchment mixing processes and travel time distributions, Water Resour. Res., 48, 5545, https://doi.org/10.1029/2011WR011160, 2012. a
Botter, G., Bertuzzo, E., and Rinaldo, A.: Transport in the hydrologic response: Travel time distributions, soil moisture dynamics, and the old water paradox, Water Resour. Res., 46, 3514, https://doi.org/10.1029/2009WR008371, 2010. a, b
Carrillo, G., Troch, P. A., Sivapalan, M., Wagener, T., Harman, C., and Sawicz, K.: Catchment classification: hydrological analysis of catchment behavior through process-based modeling along a climate gradient, Hydrol. Earth Syst. Sci., 15, 3411–3430, https://doi.org/10.5194/hess-15-3411-2011, 2011. a
Detty, J. M. and McGuire, K. J.: Threshold changes in storm runoff generation at a till-mantled headwater catchment, Water Resour. Res., 46, 7525, https://doi.org/10.1029/2009WR008102, 2010. a
Floriancic, M. G., Stockinger, M. P., Kirchner, J. W., and Stumpp, C.: Monthly new water fractions and their relationships with climate and catchment properties across Alpine rivers, Hydrol. Earth Syst. Sci., 28, 3675–3694, https://doi.org/10.5194/hess-28-3675-2024, 2024. a
Gericke, O. J. and Smithers, J. C.: Revue des méthodes d'évaluation du temps de réponse d'un bassin versant pour l'estimation du débit de pointe, Hydrolog. Sci. J., 59, 1935–1971, https://doi.org/10.1080/02626667.2013.866712, 2014. a
Godsey, S. E., Aas, W., Clair, T. A., de Wit, H. A., Fernandez, I. J., Kahl, J. S., Malcolm, I. A., Neal, C., Neal, M., Nelson, S. J., Norton, S. A., Palucis, M. C., Skjelkvåle, B. L., Soulsby, C., Tetzlaff, D., and Kirchner, J. W.: Generality of fractal scaling in catchment tracer time series, and its implications for catchment travel time distributions, Hydrol. Process., 24, 1660–1671, https://doi.org/10.1002/hyp.7677, 2010. a
Grathwohl, P., Rügner, H., Wöhling, T., Osenbrück, K., Schwientek, M., Gayler, S., Wollschläger, U., Selle, B., Pause, M., Delfs, J. O., Grzeschik, M., Weller, U., Ivanov, M., Cirpka, O. A., Maier, U., Kuch, B., Nowak, W., Wulfmeyer, V., Warrach-Sagi, K., Streck, T., Attinger, S., Bilke, L., Dietrich, P., Fleckenstein, J. H., Kalbacher, T., Kolditz, O., Rink, K., Samaniego, L., Vogel, H. J., Werban, U., and Teutsch, G.: Catchments as reactors: A comprehensive approach for water fluxes and solute turnover, Environ. Earth Sci., 69, 317–333, https://doi.org/10.1007/s12665-013-2281-7, 2013. a
Hagedorn, F., Schleppi, P., Waldner, P., and Flühler, H.: Export of dissolved organic carbon and nitrogen from Gleysol dominated catchments – The significance of water flow paths, Biogeochemistry, 50, 137–161, https://doi.org/10.1023/A:1006398105953, 2000. a
Harman, C. J.: Time-variable transit time distributions and transport: Theory and application to storage-dependent transport of chloride in a watershed, Water Resour. Res., 51, 1–30, https://doi.org/10.1002/2014WR015707, 2015. a
Hill, T. and Neal, C.: Spatial and temporal variation in pH, alkalinity and conductivity in surface runoff and groundwater for the Upper River Severn catchment, Hydrol. Earth Syst. Sci., 1, 697–715, https://doi.org/10.5194/hess-1-697-1997, 1997. a
Hrachowitz, M., Soulsby, C., Tetzlaff, D., Dawson, J. J., Dunn, S. M., and Malcolm, I. A.: Using long-term data sets to understand transit times in contrasting headwater catchments, J. Hydrol., 367, 237–248, https://doi.org/10.1016/j.jhydrol.2009.01.001, 2009. a
Hrachowitz, M., Savenije, H., Bogaard, T. A., Tetzlaff, D., and Soulsby, C.: What can flux tracking teach us about water age distribution patterns and their temporal dynamics?, Hydrol. Earth Syst. Sci., 17, 533–564, https://doi.org/10.5194/hess-17-533-2013, 2013. a
Hrachowitz, M., Benettin, P., van Breukelen, B. M., Fovet, O., Howden, N. J., Ruiz, L., van der Velde, Y., and Wade, A. J.: Transit times–the link between hydrology and water quality at the catchment scale, Wiley Interdisciplinary Reviews: Water, 3, 629–657, https://doi.org/10.1002/wat2.1155, 2016. a
James, A. L. and Roulet, N. T.: Investigating hydrologic connectivity and its association with threshold change in runoff response in a temperate forested watershed, Hydrol. Process., 21, 3391–3408, https://doi.org/10.1002/hyp.6554, 2007. a
Jasechko, S., Kirchner, J. W., Welker, J. M., and McDonnell, J. J.: Substantial proportion of global streamflow less than three months old, Nat. Geosci., 9, 126–129, https://doi.org/10.1038/ngeo2636, 2016. a
Kirby, C., Newson, M., and Gilman, K. (Eds.): Plynlimon research: The first two decades. Wallingford, Institute of Hydrology, 188 pp., IH Report No.109, ISBN 0948540273, 1991. a
Kirchner, J. W.: A double paradox in catchment hydrology and geochemistry, Hydrol. Process., 17, 871–874, https://doi.org/10.1002/hyp.5108, 2003. a, b
Kirchner, J. W.: Quantifying new water fractions and transit time distributions using ensemble hydrograph separation: theory and benchmark tests, Hydrol. Earth Syst. Sci., 23, 303–349, https://doi.org/10.5194/hess-23-303-2019, 2019. a, b
Kirchner, J. W.: Impulse Response Functions for Nonlinear, Nonstationary, and Heterogeneous Systems, Estimated by Deconvolution and Demixing of Noisy Time Series, Sensors, 22, 3291, https://doi.org/10.3390/s22093291, 2022. a
Kirchner, J. W.: Characterizing nonlinear, nonstationary, and heterogeneous hydrologic behavior using ensemble rainfall–runoff analysis (ERRA): proof of concept, Hydrol. Earth Syst. Sci., 28, 4427–4454, https://doi.org/10.5194/hess-28-4427-2024, 2024a. a, b, c, d
Kirchner, J. W.: ERRA – an R script for Ensemble Rainfall-Runoff Analysis, EnviDat [code], https://doi.org/10.16904/envidat.529, 2024b. a
Kirchner, J. W. and Knapp, J. L. A.: Technical note: Calculation scripts for ensemble hydrograph separation, Hydrol. Earth Syst. Sci., 24, 5539–5558, https://doi.org/10.5194/hess-24-5539-2020, 2020a. a
Kirchner, J. W. and Knapp, J. L. A.: Ensemble hydrograph separation scripts, EnviDat [code], https://doi.org/10.16904/envidat.182, 2020b. a
Kirchner, J. W. and Neal, C.: Universal fractal scaling in stream chemistry and its implications for solute transport and water quality trend detection, P. Natl. Acad. Sci. USA, 110, 12213–12218, https://doi.org/10.1073/pnas.1304328110, 2013. a
Kirchner, J. W., Feng, X., and Neal, C.: Fractal stream chemistry and its implications for contaminant transport in catchments, Nature, 403, 524, https://doi.org/10.1038/35000537, 2000. a, b
Kirchner, J. W., Feng, X., and Neal, C.: Catchment-scale advection and dispersion as a mechanism for fractal scaling in stream tracer concentrations, J. Hydrol., 254, 82–101, https://doi.org/10.1016/S0022-1694(01)00487-5, 2001. a
Kirchner, J. W., Knapp, J. L. A., Schlumpf, A., Neal, C., and Neal, M.: Stable water isotopes in precipitation and streamflow at Plynlimon, Wales, UK, EnviDat [data set], https://doi.org/10.16904/envidat.82, 2019. a
Knapp, J. L. A., Neal, C., Schlumpf, A., Neal, M., and Kirchner, J. W.: New water fractions and transit time distributions at Plynlimon, Wales, estimated from stable water isotopes in precipitation and streamflow, Hydrol. Earth Syst. Sci., 23, 4367–4388, https://doi.org/10.5194/hess-23-4367-2019, 2019. a, b, c, d
Laudon, H. and Sponseller, R. A.: How landscape organization and scale shape catchment hydrology and biogeochemistry: insights from a long-term catchment study, Wiley Interdisciplinary Reviews: Water, 5, e1265, https://doi.org/10.1002/wat2.1265, 2018. a
Li, L., Knapp, J. L. A., Lintern, A., Ng, G.-H. C., Perdrial, J., Sullivan, P. L., and Zhi, W.: River water quality shaped by land–river connectivity in a changing climate, Nat. Clim. Change, 14, 225–237, https://doi.org/10.1038/s41558-023-01923-x, 2024. a
Małoszewski, P. and Zuber, A.: Determining the turnover time of groundwater systems with the aid of environmental tracers: 1. Models and their applicability, J. Hydrol., 57, 207–231, https://doi.org/10.1016/0022-1694(82)90147-0, 1982. a, b
McDonnell, J. J.: A Rationale for Old Water Discharge Through Macropores in a Steep, Humid Catchment, Water Resour. Res., 26, 2821–2832, https://doi.org/10.1029/WR026i011p02821, 1990. a
McDonnell, J. J. and Beven, K.: Debates–The future of hydrological sciences: A (common) path forward? A call to action aimed at understanding velocities, celerities and residence time distributions of the headwater hydrograph, Water Resour. Res., 50, 5342–5350, https://doi.org/10.1002/2013WR015141, 2014. a
Meyer, A., Fleischmann, A. S., Collischonn, W., Paiva, R., and Jardim, P.: Empirical assessment of flood wave celerity–discharge relationships at local and reach scales, Hydrolog. Sci. J., 63, 2035–2047, https://doi.org/10.1080/02626667.2018.1557336, 2018. a
Mindham, D., Beven, K., and Chappell, N.: Rainfall–streamflow response times for diverse upland UK micro-basins: quantifying hydrographs to identify the nonlinearity of storm response, Hydrol. Res., 54, 233–244, https://doi.org/10.2166/nh.2023.115, 2023. a, b
Neal, C. and Rosier, P. T. W.: Chemical studies of chloride and stable oxygen isotopes in two conifer afforested and moorland sites in the British uplands, J. Hydrol., 115, 269–283, https://doi.org/10.1016/0022-1694(90)90209-G, 1990. a
Nippgen, F., McGlynn, B. L., Marshall, L. A., and Emanuel, R. E.: Landscape structure and climate influences on hydrologic response, Water Resour. Res., 47, 12528, https://doi.org/10.1029/2011WR011161, 2011. a
Penna, D., Tromp-van Meerveld, H. J., Gobbi, A., Borga, M., and Dalla Fontana, G.: The influence of soil moisture on threshold runoff generation processes in an alpine headwater catchment, Hydrol. Earth Syst. Sci., 15, 689–702, https://doi.org/10.5194/hess-15-689-2011, 2011. a
Peskett, L. M., Heal, K. V., MacDonald, A. M., Black, A. R., and McDonnell, J. J.: Land cover influence on catchment scale subsurface water storage investigated by multiple methods: Implications for UK Natural Flood Management, J. Hydrol. Regional Studies, 47, 101398, https://doi.org/10.1016/j.ejrh.2023.101398, 2023. a
Post, D. A. and Jakeman, A. J.: Relationships between catchment attributes and hydrological response characteristics in small Australian Mountain Ash catchments, Hydrol. Process., 10, 877–892, https://doi.org/10.1002/(SICI)1099-1085(199606)10:6<877::AID-HYP377>3.0.CO;2-T, 1996. a
Rasmussen, T. C., Baldwin, R. H., Dowd, J. F., and Williams, A. G.: Tracer vs. Pressure Wave Velocities through Unsaturated Saprolite, Soil Sci. Soc. Am. J., 64, 75–85, https://doi.org/10.2136/SSSAJ2000.64175X, 2000. a
Rinderer, M., van Meerveld, H. J., and Seibert, J.: Topographic controls on shallow groundwater levels in a steep, prealpine catchment: When are the TWI assumptions valid?, Water Resour. Res., 50, 6067–6080, https://doi.org/10.1002/2013WR015009, 2014. a
Rodhe, A., Nyberg, L., and Bishop, K.: Transit Times for Water in a Small Till Catchment from a Step Shift in the Oxygen 18 Content of the Water Input, Water Resour. Res., 32, 3497–3511, https://doi.org/10.1029/95WR01806, 1996. a
Scaini, A., Audebert, M., Hissler, C., Fenicia, F., Gourdol, L., Pfister, L., and Beven, K. J.: Velocity and celerity dynamics at plot scale inferred from artificial tracing experiments and time-lapse ERT, J. Hydrol., 546, 28–43, https://doi.org/10.1016/j.jhydrol.2016.12.035, 2017. a
Schleppi, P., Muller, N., Feyen, H., Papritz, A., Bucher, J. B., and Flühler, H.: Nitrogen budgets of two small experimental forested catchments at Alptal, Switzerland, Forest Ecol. Manag., 101, 177–185, https://doi.org/10.1016/S0378-1127(97)00134-5, 1998. a
Schoener, G. and Stone, M. C.: Impact of antecedent soil moisture on runoff from a semiarid catchment, J. Hydrol., 569, 627–636, https://doi.org/10.1016/j.jhydrol.2018.12.025, 2019. a
Seeger, S. and Weiler, M.: Reevaluation of transit time distributions, mean transit times and their relation to catchment topography, Hydrol. Earth Syst. Sci., 18, 4751–4771, https://doi.org/10.5194/hess-18-4751-2014, 2014. a
Shand, P., Haria, A. H., Neal, C., Griffiths, K. J., Gooddy, D. C., Dixon, A. J., Hill, T., Buckley, D. K., and Cunningham, J. E.: Hydrochemical heterogeneity in an upland catchment: further characterisation of the spatial, temporal and depth variations in soils, streams and groundwaters of the Plynlimon forested catchment, Wales, Hydrol. Earth Syst. Sci., 9, 621–644, https://doi.org/10.5194/hess-9-621-2005, 2005. a
Soulsby, C., Piegat, K., Seibert, J., and Tetzlaff, D.: Catchment-scale estimates of flow path partitioning and water storage based on transit time and runoff modelling, Hydrol. Process., 25, 3960–3976, https://doi.org/10.1002/hyp.8324, 2011. a
Stähli, M., Seibert, J., Kirchner, J. W., von Freyberg, J., and van Meerveld, I.: Hydrological trends and the evolution of catchment research in the Alptal valley, central Switzerland, Hydrol. Process., 35, e14113, https://doi.org/10.1002/hyp.14113, 2021. a
Staudinger, M., Kauzlaric, M., Mas, A., Evin, G., Hingray, B., and Viviroli, D.: The role of antecedent conditions in translating precipitation events into extreme floods at the catchment scale and in a large-basin context, Nat. Hazards Earth Syst. Sci., 25, 247–265, https://doi.org/10.5194/nhess-25-247-2025, 2025. a
Sulis, M., Paniconi, C., Rivard, C., Harvey, R., and Chaumont, D.: Assessment of climate change impacts at the catchment scale with a detailed hydrological model of surface-subsurface interactions and comparison with a land surface model, Water Resour. Res., 47, 1513, https://doi.org/10.1029/2010WR009167, 2011. a
Torres, R., Dietrich, W. E., Montgomery, D. R., Anderson, S. P., and Loague, K.: Unsaturated zone processes and the hydrologic response of a steep, unchanneled catchment, Water Resour. Res., 34, 1865–1879, https://doi.org/10.1029/98WR01140, 1998. a
van der Velde, Y., Torfs, P. J., van der Zee, S. E., and Uijlenhoet, R.: Quantifying catchment-scale mixing and its effect on time-varying travel time distributions, Water Resour. Res., 48, W06536, https://doi.org/10.1029/2011WR011310, 2012. a
van Meerveld, H. J., Fischer, B. M. C., Rinderer, M., Stähli, M., and Seibert, J.: Runoff generation in a pre-alpine catchment: a discussion between a tracer and a shallow groundwater hydrologist, Cuadernos de Investigación Geográfica, 44, 429–452, https://doi.org/10.18172/cig.3349, 2018. a, b
van Verseveld, W. J., Barnard, H. R., Graham, C. B., McDonnell, J. J., Brooks, J. R., and Weiler, M.: A sprinkling experiment to quantify celerity–velocity differences at the hillslope scale, Hydrol. Earth Syst. Sci., 21, 5891–5910, https://doi.org/10.5194/hess-21-5891-2017, 2017. a
von Freyberg, J., Studer, B., and Kirchner, J. W.: A lab in the field: high-frequency analysis of water quality and stable isotopes in stream water and precipitation, Hydrol. Earth Syst. Sci., 21, 1721–1739, https://doi.org/10.5194/hess-21-1721-2017, 2017. a
Weiler, M., McGlynn, B. L., McGuire, K. J., and McDonnell, J. J.: How does rainfall become runoff? A combined tracer and runoff transfer function approach, Water Resour. Res., 39, 1315, https://doi.org/10.1029/2003WR002331, 2003. a, b
Wilusz, D. C., Harman, C. J., and Ball, W. P.: Sensitivity of Catchment Transit Times to Rainfall Variability Under Present and Future Climates, Water Resour. Res., 53, 10231–10256, https://doi.org/10.1002/2017WR020894, 2017. a
Zehe, E., Becker, R., Bárdossy, A., and Plate, E.: Uncertainty of simulated catchment runoff response in the presence of threshold processes: Role of initial soil moisture and precipitation, J. Hydrol., 315, 183–202, https://doi.org/10.1016/j.jhydrol.2005.03.038, 2005. a
Zobrist, J., Schoenenberger, U., Figura, S., and Hug, S. J.: Long-term trends in Swiss rivers sampled continuously over 39 years reflect changes in geochemical processes and pollution, Environ. Sci. Pollut. R., 25, 16788–16809, https://doi.org/10.1007/s11356-018-1679-x, 2018. a