the Creative Commons Attribution 4.0 License.
the Creative Commons Attribution 4.0 License.
Leveraging a time-series event separation method to disentangle time-varying hydrologic controls on streamflow – application to wildfire-affected catchments
Belize Lane
Colin B. Phillips
Brendan P. Murphy
Increasing watershed disturbance regimes, such as from wildfire, are a growing concern for natural resource managers. However, the influence of watershed disturbances on event-scale rainfall–runoff patterns has proved challenging to disentangle from other hydrologic controls. To better isolate watershed disturbance effects, this study evaluates the influence of several time-varying hydrologic controls on event-scale rainfall–runoff patterns, including water year type, seasonality, and antecedent precipitation. To accomplish this, we developed the Rainfall–Runoff Event Detection and Identification (RREDI) toolkit, an automated time-series event separation and attribution algorithm that overcomes several limitations of existing techniques. The RREDI toolkit was used to generate a dataset of 5042 rainfall–runoff events from nine western US watersheds. By analyzing this large dataset, water year type and season were identified as significant controls on rainfall–runoff patterns, whereas antecedent moisture was pinpointed as a limited control. Specific effects of wildfire disturbance on runoff response were then demonstrated for two burned watersheds by first grouping rainfall–runoff events based on identified hydrologic controls, such as wet versus dry water year types. The role of water year type and season should be considered in future hydrologic analysis to better isolate the increasing and changing effects of wildfires on streamflow. The RREDI toolkit could be readily applied to investigate the influence of other hydrologic controls and watershed disturbances on rainfall–runoff patterns.
- Article
(7651 KB) - Full-text XML
-
Supplement
(2359 KB) - BibTeX
- EndNote
Watershed disturbances can have broad, long-lasting, and variable impacts on watershed hydrology (Ebel and Mirus, 2014). A range of disturbances including wildfire, drought, flood, insect infestation, invasive species, agriculture, urbanization, mining, and forest management have been observed to alter streamflow (Adams et al., 2012; Brantley et al., 2013; Ebel and Mirus, 2014; Goeking and Tarboton, 2020; Hopkins et al., 2015; Kelly et al., 2017; Miller and Zégre, 2016). Wildfire is particularly impactful: since 2000, an average of 7.0×10⁶ acres (28 000 km2) has burned annually in the US (Hoover and Hanson, 2020). Further, with a changing climate, the observed occurrence and severity of wildfire has increased in the western US in recent decades, presenting growing challenges for human and water security (Abatzoglou et al., 2021; Abatzoglou and Williams, 2016; Hallema et al., 2018; Murphy et al., 2018; Robinne et al., 2021). Distilling the influence of watershed disturbance from the natural variability within streamflow has proved challenging across disturbance regimes (Beyene et al., 2021; Biederman et al., 2022; Hallema et al., 2017; Kinoshita and Hogue, 2015; Long and Chang, 2022; Newcomer et al., 2023; Saxe et al., 2018; Wine et al., 2018; Wine and Cadol, 2016). A better understanding of hydrologic controls that vary in time in disturbed watersheds is critical for watershed management resiliency in the face of increasing disturbance regimes (Mirus et al., 2017).
Time-varying hydrologic controls including water year type (WYT), seasonality, and antecedent precipitation have been found to influence event runoff response. Different WYTs associated with differences in annual snowpack (Cayan, 1995) or the occurrence and intensity of precipitation from monsoons or atmospheric rivers (Arriaga-Ramierez and Cavazos, 2010; Pascolini-Campbell et al., 2015) may alter runoff response (Biederman et al., 2022; Null and Viers, 2013). Observed seasonal differences in rainfall–runoff patterns have been attributed to precipitation type, rainfall properties (intensity or depth), water balance, and antecedent wetness conditions (Berghuijs et al., 2014; Merz et al., 2006; Merz and Blöschl, 2009; Norbiato et al., 2009; Tarasova et al., 2018b; Zheng et al., 2023; Jahanshahi and Booij, 2024). Antecedent moisture – and the more widely available proxy of antecedent precipitation – have also been found to alter event runoff response (Jahanshahi and Booij, 2024; Merz et al., 2006; Merz and Blöschl, 2009; Tarasova et al., 2018b; Zheng et al., 2023). Despite their established influence on event runoff response, these time-varying hydrologic controls are inconsistently considered in hydrologic disturbance studies.
Large-sample hydrology studies are frequently used to investigate time-varying and static watershed controls on event-scale rainfall–runoff patterns. The rainfall–runoff event scale enables a process-based understanding of driving hydrologic processes in catchment hydrology (Gupta et al., 2014; Sivapalan, 2009). Large-sample investigations into event-scale controls in Europe have found that time-varying hydrologic controls influence event runoff ratios (Merz et al., 2006; Merz and Blöschl, 2009; Norbiato et al., 2009; Tarasova et al., 2018a; Tarasova et al., 2018b; Zheng et al., 2023). A similar event-scale large-sample study of 432 US watersheds evaluated only static controls on event runoff response and identified aridity, topographic slope, soil permeability, rock type, and vegetation density as significant factors (Wu et al., 2021). None of these studies considered the separate impact of watershed disturbance. Conversely, the body of wildfire-disturbed streamflow change literature has sporadically and inconsistently considered these time-varying hydrologic controls (e.g., Balocchi et al., 2020; Beyene et al., 2021; Biederman et al., 2022; Hallema et al., 2017; Kinoshita and Hogue, 2015; Long and Chang, 2022; Saxe et al., 2018; Wine et al., 2018; Wine and Cadol, 2016). Long and Chang (2022) considered WYT and antecedent precipitation while investigating the influence of wildfire disturbance on event runoff response. However, they analyzed only a small sample of rainfall–runoff events from 2 years, 1 year pre- and 1 year post-fire, in a sample of six watersheds in Oregon (US).
Investigating large samples of rainfall–runoff events requires automated, transferable methods for time-series event separation. Common rainfall–runoff event separation techniques rely on established baseflow methods to isolate event flow (e.g., Chapman and Maxwell, 1996; Duncan, 2019; Eckhardt, 2005; Xie et al., 2020). Runoff events are then identified where baseflow diverges from total flow (Long and Chang, 2022; Mei and Anagnostou, 2015; Merz et al., 2006; Merz and Blöschl, 2009; Tarasova et al., 2018b). Giani et al. (2022b) identified the need for increased method transferability across watersheds, as the baseflow separation methods require multiple calibrated parameters in each watershed. To increase transferability, separation methods use fewer modifying watershed parameters (Blume et al., 2007; Nagy et al., 2022) or time-series signal processing to identify rainfall–runoff events (Giani et al., 2022b; Patterson et al., 2020). The commonly used separation methods are not able to identify sub-daily rainfall–runoff events, as many are developed or calibrated to use only daily streamflow (Long and Chang, 2022; Mei and Anagnostou, 2015; Merz et al., 2006; Merz and Blöschl, 2009; Tarasova et al., 2018b). These methods cannot capture the sub-daily rainfall–runoff events that may result from convective rainfall events in mountainous watersheds (Kampf et al., 2016). Further, there are limitations in the existing available separation methods, including the lack of identification of rainfall events with no runoff response and the filtering of diurnal-cycling-influenced runoff events, that have limited the application of the available methods in snow-dominated watersheds.
The objectives of this paper were twofold: the first was to describe and evaluate the performance of the Rainfall–Runoff Event Detection and Identification (RREDI) toolkit, an automated time-series event separation method (Canham and Lane, 2022), and the second was to apply the RREDI toolkit to investigate the influence of time-varying hydrologic controls including WYT, season, antecedent precipitation, and wildfire on event runoff response. The specific research aims were to (1) evaluate rainfall–runoff patterns, (2) identify significant time-varying hydrologic controls on event runoff response across nine western US watersheds, and (3) use the findings from (1) and (2) to explore the effects of wildfire in two burned case study watersheds. The resulting hydrologic patterns and time-varying controls are expected to reflect broader trends across western US watersheds and provide foundational methods and understanding related to watershed disturbances.
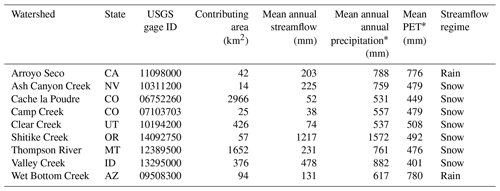
Nine watersheds in the western US were selected for this analysis (Fig. 1a) to span a wide range of watershed properties and streamflow regimes (Table 1). Watersheds were required to have at least 20 years of continuous 15 min streamflow records comprising at least 10 years of undisturbed streamflow records including from wildfire (MTBS, 2023; Falcone, 2011). Study watershed contributing areas ranged 3 orders of magnitude, from 14 km2 (Ash Canyon Creek) to 2966 km2 (Cache la Poudre River). The mean annual streamflow ranged from 38 mm (Camp Creek) to 1217 mm (Shitike Creek). The mean annual precipitation ranged from 531 mm (Cache la Poudre River) to 1572 mm (Shitike Creek) (Falcone, 2011), while the mean annual potential evapotranspiration ranged from 401 mm (Valley Creek) to 780 mm (Wet Bottom Creek) (Falcone, 2011). Seven of the selected watersheds had snowmelt-dominated flow regimes with average annual peak flows between April and June and two watersheds had wet-season-rain-dominated regimes with average annual peak flows between January and February.
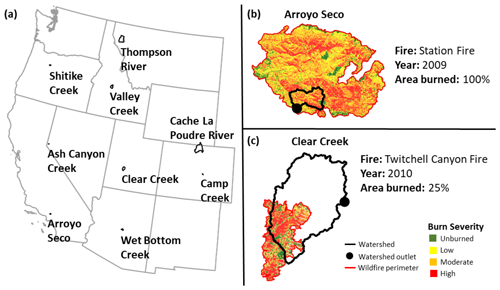
Figure 1Panel (a) presents the nine selected watersheds (labeled) used in the study. Panels (b) and (c) display the respective Arroyo Seco and Clear Creek burned watersheds used as case studies. Shown are watersheds (black), fire perimeters (red), and burn severity mosaics (MTBS, 2023).
Table 1Watershed characteristics of the study watersheds. PET denotes potential evapotranspiration.
* Falcone (2011).
Two of the nine study watersheds were selected for a more in-depth exploration of wildfire effects: Arroyo Seco and Clear Creek (Fig. 1b and c, respectively). These watersheds both experienced high-severity wildfires that burned a substantial portion of the watershed. The Station Fire (2009) burned 100 % of Arroyo Seco (78 % high and moderate burn severity) and the Twitchell Canyon Fire (2010) burned 25 % of Clear Creek (15 % high and moderate severity) (MTBS, 2023). Arroyo Seco and Clear Creek also present an interesting comparison, as they have very different contributing areas; a nearly 3-fold difference in mean annual streamflow; and are rain- and snowmelt-dominated regimes, respectively.
Hydrologic data inputs
Streamflow and precipitation data were obtained for each study watershed as follows. Daily and 15 min streamflow records were retrieved from the US Geological Survey (USGS) National Water Information System and used to calculate total annual streamflow data. Streamflow was defined as undisturbed before or more than 6 years post-fire, whereas streamflow was defined as disturbed for a period of 6 years post-fire (Ebel et al., 2022; Wagenbrenner et al., 2021). The total annual precipitation at the centroid of each study watershed over the same period was retrieved from the Parameter-elevation Regressions on Independent Slopes Model (PRISM) gridded annual precipitation dataset (PRISM Climate Group, 2022). Hourly precipitation time series were obtained for the watershed centroid from the Analysis of Record Calibration (AORC) 4 km2 resolution data product for water years 1980 to 2022 (Fall et al., 2023). Linear interpolation was used to develop an instantaneous precipitation record at the AORC resolution of 1 mm by identifying uniform sub-time steps within the hour time-step resolution. For example, hourly precipitation of 2 mm depth was uniformly spread over the hour with two timestamps of 1 mm each. The AORC data product was selected because of the hourly temporal resolution and comparable or higher correlation between the AORC data product and rain gage measurements compared with other gridded precipitation data products in studies in a mountainous area in Colorado, Louisiana, and the Great Lakes basins (Hong et al., 2022; Kim and Villarini, 2022; Partridge et al., 2024).
We describe the four key steps of the RREDI toolkit in Sect. 3.1 (Fig. 2) and provide additional in-depth details in Sect. S1 in the Supplement. A rainfall–runoff event dataset (Table S4 in the Supplement) was created by applying the RREDI toolkit to nine western US watersheds. This dataset was then used to explore rainfall–runoff event patterns, identify significant time-varying hydrologic controls, and evaluate the influence of these controls on rainfall–runoff patterns (Fig. 2). The hydrologic conditions associated with each time-varying hydrologic control were identified and assigned for each rainfall–runoff event (as described in Sect. 3.2). The assigned rainfall–runoff events were then sorted by hydrologic condition and explored (as described in Sect. 3.3). Trends in rainfall–runoff event patterns were identified, and inferential statistics were used to test the significance of the hydrologic conditions to identify significant time-varying hydrologic controls for generalized runoff metric groups. The influence of wildfire was then evaluated relative to undisturbed significant condition group rainfall–runoff trends in two burned watersheds.
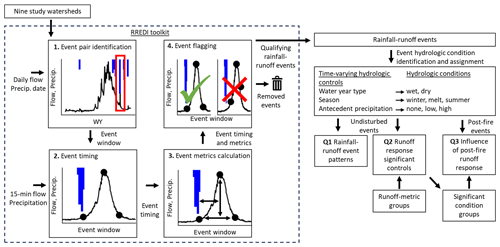
Figure 2The workflow to explore the influence of time-varying hydrologic controls on rainfall–runoff event patterns. The four key steps of the RREDI toolkit (dashed black box) are outlined: Step 1 – event pair identification; Step 2 – event timing; Step 3 – event metrics calculation; Step 4 – event flagging. Major connections between workflow steps and research aims (Q) are shown.
3.1 RREDI toolkit
The RREDI toolkit was developed to automatically separate rainfall–runoff events for any watershed using time-series signal processing in four steps (Canham and Lane, 2022) (Fig. 2). Given the inherent challenges of deterministically identifying rainfall–runoff events from only streamflow and precipitation data, we took a time-series signal-processing approach that relies in part on expert understanding to define “accurate” rainfall–runoff events like numerous other large-sample hydrology studies, including Patterson et al. (2020), Tarasova et al. (2018b), and Giani et al. (2022b). Additional in-depth descriptions of each step are included in Sect. S1 (Figs. S1–S5 in the Supplement). All watershed-specific and calibrated parameters used are also documented (Tables S1 and S2 in the Supplement). Signal-processing theory provided techniques, including data smoothing, peak detection, and window processing, that were used to automate detection of features from a time series (Patterson et al., 2020). The RREDI toolkit was fully automated using the open-source Python language.
In Step 1 of the RREDI toolkit, rainfall–runoff event pairs and the associated event window were identified using daily streamflow and precipitation data based on the co-occurrence of separately identified rainfall and runoff events by separating precipitation time series into storms and runoff into events using signal-processing theory from the overlapping period of record (Fig. 2). Rainfall events were characterized by their duration, depth, and 60 min intensity. For each rainfall–runoff event pair, the window from the start of rainfall to the end of runoff was determined. In Step 2, the runoff event start, peak, and end timing and magnitude and the runoff event volume were then identified within that time window using 15 min streamflow data and 60 min rainfall intensity (Figs. 2 and 3). For each rainfall–runoff event, a set of 17 runoff metrics were calculated using the identified rainfall and runoff timings in Step 3 (Fig. 2). Metrics fell within four groups: runoff volume, runoff magnitude, runoff duration, and rainfall–runoff timing metrics (Fig. S4 and Table S3 in the Supplement). The selected metrics in each respective group that were utilized further in this study were as follows (Fig. 3b): event volume; runoff peak, defined by the runoff peak magnitude; event duration, calculated as the difference between the runoff event start and end times; and response time, calculated as the difference between the rainfall start time and the runoff start time. Metrics were also normalized by their respective watershed contributing area to facilitate comparison between study watersheds. Finally, in Step 4, event flagging was performed to remove incorrectly identified rainfall–runoff events falling within four event identification issues: gaps in 15 min streamflow data; diurnal cycling identified by regular daily rises and falls of flow, commonly due to irrigation or snowmelt cycles (Fig. S5 in the Supplement); duplicate rainfall–runoff events; and no identified runoff event end time (Fig. 2 and Fig. S3 in the Supplement). From a time-series analysis perspective, these misidentified rainfall–runoff events were very similar in appearance to true rainfall–runoff events but were functionally driven by different or uncertain processes that were not applicable to the application of the RREDI toolkit and thus removed.
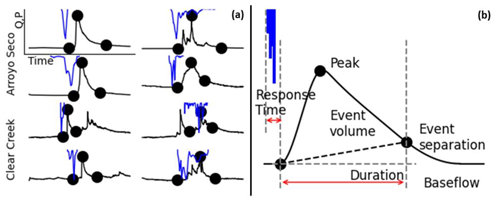
Figure 3RREDI toolkit rainfall–runoff event examples and metrics. Panel (a) presents eight example rainfall–runoff events identified using the RREDI toolkit. Shown are the rainfall event (blue); the paired runoff event hydrograph (black); and the identified runoff start, peak, and end times and magnitudes (black dots). Panel (b) provides an example rainfall–runoff event showing relevant event metrics, including runoff event volume, peak, duration, and response time. Separation (dashed black line) between the runoff event volume and baseflow is shown.
A visual assessment of the RREDI toolkit performance was iteratively completed for all identified rainfall–runoff events within the wettest, mean, and driest water years for each study watershed. These years were selected based on the watershed-average total precipitation from PRISM (PRISM Climate Group, 2022). For each rainfall–runoff event, the runoff start, peak, and end timing and magnitude identified by the RREDI toolkit were visually compared with the same metrics independently identified by manual inspection, similar to the performance assessment in other event separation methods (Giani et al., 2022b; Patterson et al., 2020; Tarasova et al., 2018b). A rainfall–runoff event was determined to be accurately identified by the RREDI toolkit if the runoff start, peak, and end magnitude and timing of each rainfall–runoff event were sufficiently similar to those timings identified through independent visual assessment such that the rise in runoff from the start to the peak and the runoff duration were considered reasonable. In this manner, we visually assessed 11 % of rainfall–runoff events used in this study (774 rainfall–runoff events) that spanned a range of watersheds, watershed wetness conditions, and seasons. RREDI toolkit performance assessment results were summarized for each study watershed and across study watersheds (Sect. 4.1). Performance results included the percent of RREDI-identified rainfall–runoff events within the wettest, mean, and driest water years with accurately identified timing output from the RREDI toolkit, the percent of rainfall–runoff events flagged in Step 4, and the percent of rainfall–runoff events retained after the removal of flagged rainfall–runoff events.
3.2 Hydrologic condition identification and assignment
Hydrologic conditions were identified and assigned for each rainfall–runoff event with respect to three time-varying hydrologic controls: WYT, season, and antecedent precipitation. Water year type was assigned as wet or dry following Biederman et al. (2022) (Fig. 4a and Fig. S6 in the Supplement). Plots of annual cumulative runoff versus precipitation over the undisturbed period of record were used to visually identify pronounced annual precipitation break points above which streamflow increased linearly with precipitation. Years (both undisturbed and disturbed) with annual precipitation above or below the threshold were then classified as wet or dry, respectively. For watersheds where no break point was identified, the driest third of years (both undisturbed and disturbed) by annual precipitation were considered dry. Alternative methods such as change point detection may be able to more objectively identify that break point, but automating water year or season identification was beyond the study scope. Winter, melt, and summer hydrologic seasons were identified for each watershed based on inspection of the average annual hydrograph and the earliest and latest mean (2001–2018) snow-off dates within the watershed (O'Leary III et al., 2020) (Fig. 4b and Fig. S7 in the Supplement). The start of the winter season was uniformly set as 1 November to capture the change in precipitation pattern and type between summer and winter. The melt season started the month after the earliest snow-off date in the watershed, while the summer season started the month after the latest snow-off date to account for the lagged streamflow response to snowmelt. Watersheds with less than 10 % area with an identified snowmelt date were considered to have no melt season (i.e., only winter and summer). In watersheds with no melt season, the summer season started the month that baseflow dominated over winter rainfall peaks in the mean annual hydrograph. Event-scale antecedent precipitation was assigned as none (<1 mm), low (1–25 mm), or high (>25 mm) based on cumulative precipitation over the 6 d prior to the rainfall event start time (Long and Chang, 2022; Merz et al., 2006; Merz and Blöschl, 2009; Tarasova et al., 2018b) (Fig. 4c). When evaluating antecedent moisture to isolate the influence of soil moisture on runoff rather than snowmelt and rain-on-snow influences, only snow-off rainfall–runoff events were considered, including only summer events in watersheds with a melt season and all events in watersheds without a melt season. We do not expect that using alternative available methods to assign rainfall–runoff events to hydrologic conditions would substantially alter the proposed approach or findings in this study.
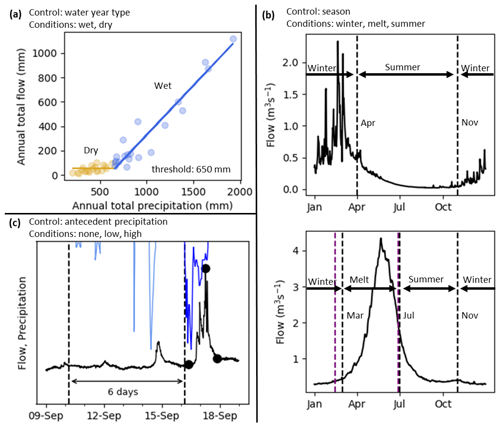
Figure 4Example hydrologic condition identification for time-varying hydrologic controls. Panel (a) presents the water year type – wet (blue) and dry (orange) years – for Arroyo Seco. The ordinary least-squares linear regression lines for above and below the threshold are shown. Panel (b) shows the seasons (vertical dashed lines) delineated from the undisturbed average annual hydrograph for a no-snow watershed (top panel) for winter and summer (Arroyo Seco) and a snow-dominated watershed (bottom panel) for winter, melt, and summer (Clear Creek). The minimum and maximum snowmelt dates are shown consecutively (dashed purple line). Panel (c) presents the 6 d prior to rainfall start – the antecedent precipitation period (between the dashed lines) – for an example rainfall–runoff event (rainfall is dark blue and runoff is black). Shown are all rainfall events that were summed within the antecedent precipitation period (light blue).
3.3 Statistical assessment of rainfall–runoff patterns
Several statistical methods were used to investigate the influence of the time-varying controls and wildfire disturbance on event runoff response. Trends in undisturbed rainfall–runoff event patterns were first evaluated using a locally weighted scatterplot smoothing (LOWESS) curve (Q1; Fig. 2). Inferential statistics and the kernel density estimation (KDE) distributions were used to assess the effects of time-varying hydrologic conditions on undisturbed rainfall–runoff event metrics (Q2; Fig. 2). A nonparametric Mann–Whitney U test was used to evaluate the effect of WYT, and nonparametric Kruskal–Wallis and Dunn tests were used to evaluate the effect of season and antecedent precipitation, all at a 95 % confidence level. The null hypothesis for all tests was that hydrologic conditions did not impact rainfall–runoff event metrics (Table S3 in the Supplement). The effect size was calculated using the Glass biserial rank correlation coefficient for Mann–Whitney U test results and the Eta-squared test for Kruskal–Wallis test results (Tables S7–S9 in the Supplement).
The statistical test results for all area-normalized metrics were summarized into relative significance rates for each of four runoff metric groups across and within study watersheds to facilitate comparisons. The use of relative significance rates reduced the issue of multiple comparisons and reduced the emphasis on specific metric calculation methods. For each runoff metric group and hydrologic condition, the relative significance rate was calculated, either across all study watersheds or for an individual watershed, by dividing the number of statistically significant rainfall–runoff event metrics in the category by the number of metrics in the runoff metric group. The relative importance of each time-varying hydrologic control was assessed by comparing the significance rates for each watershed and runoff metric group.
3.4 Wildfire effects on rainfall–runoff patterns
Additional analysis was performed for two contrasting burned study watersheds, Arroyo Seco and Clear Creek (Fig. 1b and c, respectively, and Table 1), to explore the influence of wildfire relative to other time-varying hydrologic controls (Q3; Fig. 2). Significant hydrologic condition groups were identified for the rainfall depth versus runoff peak relationship. To do this, the undisturbed rainfall–runoff events in each watershed were sorted into hydrologic condition permutations of the significant hydrologic controls for peak runoff. A power trend was fit to each permutation using ordinary least-squares regression. The significant condition groups were identified by combining the permutations with similar power trends. An updated power trend was fit to each significant condition group.
Considering the runoff peak metric, the influence of wildfire on event runoff response was then evaluated relative to each significant condition group undisturbed trend and standard deviation. The percentage of post-fire rainfall–runoff events falling above and over 1 standard deviation above the significant condition group trend was calculated for all post-fire years combined and individually. The calculated percentages were compared to the expected 50 % above the trend line and 16 % above 1 standard deviation.
4.1 RREDI toolkit performance
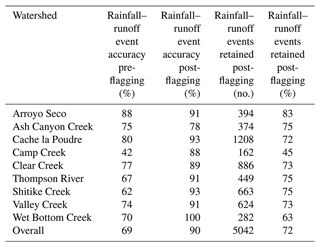
The RREDI toolkit resulted in a dataset of 5042 rainfall–runoff events across the nine study watersheds (Table S4 in the Supplement). A total of 7026 rainfall–runoff events were initially identified after Step 2. Of these, 774 rainfall–runoff events (11 % of the total events or 5 %–34 % of events by watershed) were inspected for runoff event timing and flagging accuracy (Table 2). Rainfall–runoff events were identified at a 69 % accuracy rate pre-flagging (Step 2) and a 90 % accuracy rate after flagging (Step 4). The occurrence rates for each of the four known issues across watersheds were 2 % for 15 min streamflow data gaps, 13 % for diurnal cycling, 4 % for duplicate rainfall–runoff events, and 15 % for rainfall–runoff events with no identified end time (Table S5 in the Supplement). The total rainfall–runoff event retention rate after flagging was 72 %, with the highest retention rate of 83 % in Arroyo Seco and the lowest retention rate of 45 % in Camp Creek. The rainfall–runoff event dataset generated by the RREDI toolkit was sufficiently large to allow for the use of the described inferential statistical methods (Table S6 in the Supplement).
4.2 Undisturbed rainfall–runoff patterns
Across watersheds, the event runoff peak generally increased with rainfall depth (Fig. 5). A break point in these relationships was visually identified at approximately 10 mm rainfall depth, above which the runoff peak increased more rapidly with increasing rainfall depth. The break point was most apparent in Arroyo Seco, Shitike Creek, and Wet Bottom Creek. Arroyo Seco, Cache la Poudre River, Camp Creek, and Wet Bottom Creek had larger spreads in the LOWESS curve residuals compared with the other five watersheds.
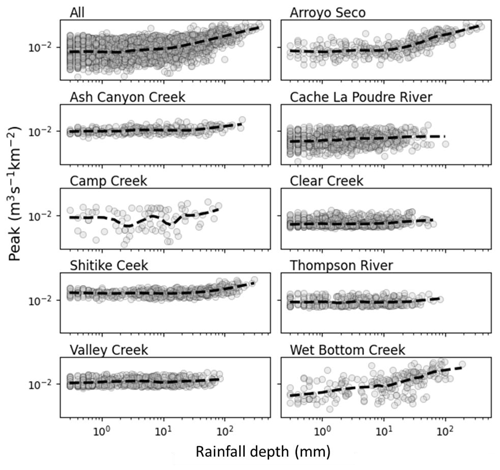
Figure 5The relationship between rainfall depth (mm) and runoff peak (m3 s−1 km−2) for undisturbed rainfall–runoff events in all study watersheds and each individual watershed. Dashed black lines are LOWESS curves.
Differences were apparent in four selected undisturbed runoff event metric distributions based on WYT, season, and antecedent precipitation. In both the Arroyo Seco and Clear Creek watersheds, wet years exhibited higher median values than dry years for runoff volume, peak, duration, and response time metrics (Fig. 6). Winter had higher median values than summer for runoff volume, peak, and response time metrics in Arroyo Seco, but directional shifts were less consistent in Clear Creek. The highest median peak runoff and shortest median response time occurred under high-antecedent-precipitation conditions in both watersheds.
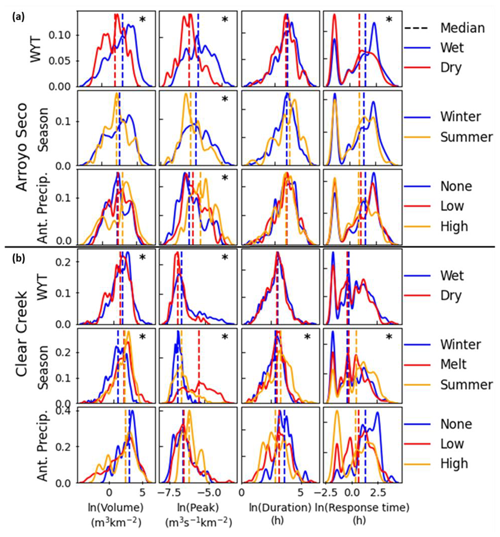
Figure 6Undisturbed rainfall–runoff event KDE distributions for hydrologic conditions for natural-log-transformed WYT, season, and antecedent precipitation in (a) Arroyo Seco and (b) Clear Creek for four selected runoff metrics: volume, peak, duration, and response time. Distributions are color-coded by hydrologic condition. The median value of each distribution is shown (dashed line). Significant differences between distributions are indicated (*). Note there is no melt season in Arroyo Seco.
In Arroyo Seco and Clear Creek, all three time-varying hydrologic controls were significant with respect to the undisturbed rainfall–runoff events, but relative significance rates varied by runoff metric and watershed (Fig. 6 and Table 3). Water year type was the most often significant hydrologic control across the four selected runoff metrics in Arroyo Seco, while season was the most often significant control in Clear Creek (Fig. 6 and Table 3). Antecedent precipitation had the lowest relative significance rates in both watersheds and exhibited the most variation by runoff metric. Peak runoff was the most often significant runoff metric across study watersheds and hydrologic controls (Tables S7–S9 in the Supplement) and was significant across all hydrologic controls in both Arroyo Seco and Clear Creek except during the antecedent precipitation period in Clear Creek (Fig. 6 and Table 3). Conversely, the least frequently significant runoff metric varied across hydrologic controls, including runoff duration and response time for WYT, runoff duration for season, and runoff volume for antecedent precipitation (Tables S7–S9 in the Supplement). Even so, WYTs exhibited significant differences in runoff response time in Arroyo Seco and seasons exhibited significant differences in runoff duration in Clear Creek (Fig. 6 and Table 3).
Table 3Undisturbed rainfall–runoff event hydrologic condition statistical test p-value results for the Mann–Whitney U test (WYT) and Kruskal–Wallis and Dunn tests (season and antecedent precipitation) for Arroyo Seco and Clear Creek for four selected area-normalized runoff event metrics. Bold indicates rejection of the null hypothesis at a significance level of 0.05. In bolded cells, an indicator marks the significantly different condition from the Dunn test, whereas no indicator means that all conditions were significantly different.
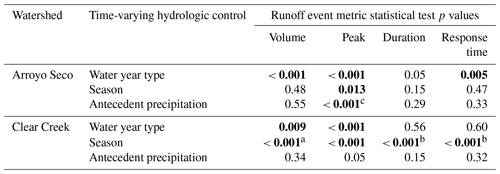
The seasons are as follows: a winter; b summer. Antecedent precipitation is as follows: c high.
Water year type and season differentiate runoff event metrics (>50 % relative significance rate; Fig. 7), but results vary across watersheds and runoff metric groups. For example, in Arroyo Seco, the relative significant rate was 100 % for the WYT runoff volume metric group (both runoff volume and runoff ratio were significant; Tables S3 and S7 in the Supplement) but only 33 % for the WYT runoff duration metric group. When averaging across watersheds, the runoff duration and magnitude metric groups were differentiated with respect to both WYT and season (Fig. 7a). The relative significance rates of most metric groups in Arroyo Seco (Fig. 7b) and Clear Creek (Fig. 7c) exceeded the watershed-average rates. Compared with the watershed-average total precipitation, WYT was generally more differentiating of runoff response in Arroyo Seco, Ash Canyon Creek, Camp Creek, and Shitike Creek; less differentiating in Clear Creek, Valley Creek, and Wet Bottom Creek; and similarly important in Cache la Poudre River and Thompson River (Fig. S8 in the Supplement). By contrast, compared with the watershed-average total precipitation, season was generally more differentiating of runoff response in Cache la Poudre River, Clear Creek, Thompson River, and Valley Creek; less differentiating in Ash Canyon Creek and Camp Creek; and similarly differentiating in Arroyo Seco, Shitike Creek, and Wet Bottom Creek (Fig. 7b and Fig. S8 in the Supplement).
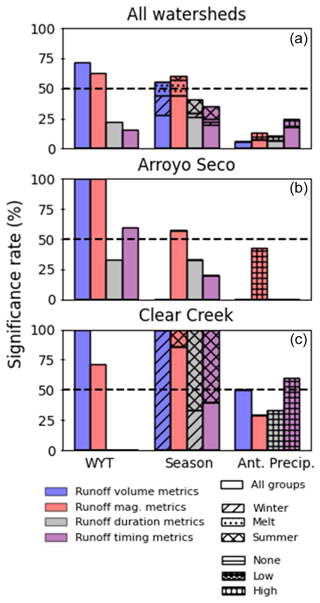
Figure 7Summary plots of the relative significance rates of four runoff event metric groups (colored bars) with respect to three time-varying hydrologic controls (x axis) for (a) all watersheds, (b) Arroyo Seco, and (c) Clear Creek under undisturbed conditions. The 50 % relative significance rate is indicated (dashed black lines). Hatching within the season and antecedent precipitation bars represents statistically different hydrologic conditions from the Dunn test, whereas no hatching indicates that all conditions were different.
Compared with WYT and season, antecedent precipitation did a poor job of differentiating event runoff response across watersheds (Fig. 7). Compared with the watershed-average total precipitation, antecedent precipitation better differentiated runoff magnitude metrics in Arroyo Seco (Fig. 7b) and all runoff metric groups in Clear Creek (Fig. 7c); was generally less differentiating of runoff response in Camp Creek, Shitike Creek, and Valley Creek; and similarly differentiated runoff magnitude metrics in Cache la Poudre River, Thompson River, and Wet Bottom Creek (Fig. S8 in the Supplement).
4.3 Wildfire effects on rainfall–runoff patterns
Several significant condition groups and trends emerged for the undisturbed rainfall depth versus peak runoff relationship in Arroyo Seco and Clear Creek (Fig. 8). The watershed-specific significant condition groups were identified from eight and six hydrologic condition permutations of the watershed-specific significant hydrologic controls in the respective aforementioned regions (Fig. S9 in the Supplement). The three significant condition groups in Arroyo Seco were (1) wet none + low, (2) wet high, and (3) dry. The four significant condition groups in Clear Creek were (1) summer, (2) winter, (3) wet melt, and (4) wet dry. Significant condition group trends were only assessed above a 10 mm rainfall depth in Arroyo Seco, consistent with the rainfall depth threshold observed in this watershed (Fig. 5). Each significant condition group's power trend fell within a different portion of the full rainfall–runoff event distribution (Fig. 8 and Table S10 in the Supplement).
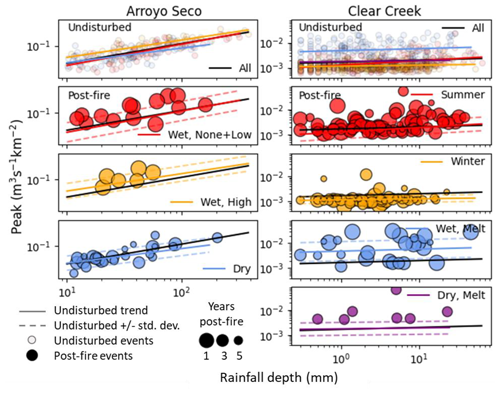
Figure 8Significant condition groups for event runoff peak (m3 s−1 km−2) in Arroyo Seco and Clear Creek. Shown for the rainfall depth versus runoff peak relationship are the undisturbed trends (black lines) and significant condition group trends (colored lines) and their standard deviation bounds (dashed lines). The undisturbed (top panel) and post-fire rainfall–runoff events within each significant condition group are plotted.
For the rainfall depth versus runoff peak relationship, the portion of post-fire rainfall–runoff events that plotted both above and 1 standard deviation above the significant condition group undisturbed trends was generally greater than undisturbed expectations (Fig. 8 and Table S11 in the Supplement). In Arroyo Seco, post-fire events plotted above the significant condition group trend more than 50 % of the time for all groups and above 1 standard deviation more than 16 % of the time for all groups except dry. In Clear Creek, post-fire events plotted above 1 standard deviation from the undisturbed trend more than expected for all groups except winter. In general, the percentage of post-fire rainfall–runoff events above the significant condition group trend and 1 standard deviation decreased with increasing time since fire (as illustrated in Fig. 8 by a decreasing point size).
5.1 RREDI toolkit
The RREDI toolkit automatically separated covarying streamflow and precipitation time series into rainfall–runoff events using an approach that was transferable across watersheds. The RREDI toolkit had an overall accuracy rate of 90 %, ranging from 78 % to 100 % across study watersheds. There were no clear watershed characteristics influencing performance. Lower rainfall–runoff event accuracy rates in Ash Canyon Creek, Camp Creek, and Clear Creek may be associated with factors including poor quantification of rainfall timing, water withdrawals, temporally aggregated streamflow, and extended periods of diurnal cycling. Accuracy increased after the removal of flagged rainfall–runoff events for all study watersheds. Rainfall–runoff event retention rates were below average in Camp Creek and Wet Bottom Creek, but post-flagging accuracy rates were near average and 100 %, respectively. Both watersheds have flashy hydrology and substantial periods of low-flow diurnal cycling that resulted in several identified rainfall–runoff event pairs where no event runoff response was identified.
The event identification performance was affected by precipitation data processing challenges, particularly the accurate identification of rainfall timing. A gridded precipitation data product was used to overcome sparse rain gage density and limited or sporadic periods of record in the mountainous western US. The rainfall measured in valleys, where long-term rain gages are more common (such as the NOAA Cooperative Observer Program, COOP, network), often diverges from mountain rainfall characteristics due to orographic gradients (Roe, 2005). Differences in rain gage distance to the watershed and watershed outlet also complicated inter-watershed comparison. Using gridded precipitation allowed for a spatially consistent precipitation time series to be created for all study watersheds. The centroid of the watershed was used to extract precipitation as the best available method given the large computational requirement for additional watershed analysis, but future work could incorporate watershed-average precipitation or other methods to better capture spatial variability (Giani et al., 2022a; Kampf et al., 2016; Wang et al., 2023). The high spatial and temporal resolution of the AORC data product performed well compared to rain gage measurements (Hong et al., 2022; Kim and Villarini, 2022; Partridge et al., 2024). However, the hourly temporal resolution did result in some loss of information related to short-duration, high-intensity rainfall events as precipitation was linearly interpolated across the time step.
The RREDI toolkit time-series event separation method improves on existing methods by being readily transferable across diverse watersheds and implementing an event-flagging algorithm. Watershed transferability, a need identified by Giani et al. (2022b), was accomplished here using time-series signal processing and only two watershed parameters. By using 15 min streamflow time series, the RREDI toolkit could identify and characterize sub-daily rainfall–runoff events, a critical limitation in many other time-series separation methods (Long and Chang, 2022; Mei and Anagnostou, 2015; Merz et al., 2006; Merz and Blöschl, 2009; Tarasova et al., 2018b). The use of time-series signal processing also allowed for the identification of rainfall events with no runoff response, providing more information about precipitation thresholds and antecedent wetness conditions required for runoff generation. An algorithm to remove diurnal cycling events was also implemented, something not previously addressed.
The time-series event separation method introduced in this study allowed for large-sample hydrologic analysis to investigate event-scale rainfall–runoff patterns and controls. Future work could expand this analysis to a larger set of watersheds and potential controls (Gupta et al., 2014). The RREDI toolkit could also be applied to address other pressing event-scale hydrologic challenges, including the influence of other watershed disturbances (e.g., urbanization, forest treatments, or insect infestation) (Ebel and Mirus, 2014; Goeking and Tarboton, 2020), evaluation of design rainfall events, flood prediction, or event recurrence interval analysis. Beyond rainfall–runoff event analysis, the RREDI toolkit could be used to identify paired rainfall–runoff events in other rainfall-peaking time-series data relationships, such as water quality events (e.g., turbidity) or soil moisture events.
5.2 Undisturbed rainfall–runoff patterns
Differences in the significance of time-varying hydrologic controls between study watersheds correspond with the findings of other large-sample rainfall–runoff analysis (Jahanshahi and Booij, 2024; Merz et al., 2006; Merz and Blöschl, 2009; Norbiato et al., 2009; Tarasova et al., 2018a, b; Wu et al., 2021; Zheng et al., 2023). Variability in the significance of runoff metrics within a watershed underlines the importance of comparing similar metrics between watersheds and studies to assess event runoff response. Differences between event runoff response in wet and dry years were significant across the runoff metrics in six of the seven watersheds where a WYT precipitation threshold was identified (Fig. 7 and Fig. S8 in the Supplement). This aligns with the finding of Biederman et al. (2022) that the threshold between wet and dry years was important in event runoff response in semiarid watersheds. Differences in rainfall–runoff processes between wet and dry years, such as the interaction between soil drainage and vegetation rooting depth, may drive these observed differences in runoff response (Bart, 2016; Biederman et al., 2022). High interannual variation in snowpack (Cayan, 1995) may be a driver of WYT significance identified in six of the seven snow-dominated watersheds. Water year type was significant for one of the two rain-dominated watersheds, Arroyo Seco, which may be explained by the extreme interannual variability in the frequency and intensity of atmospheric rivers that generate most of the precipitation (Lamjiri et al., 2018). Surprisingly, WYT was not significant in Wet Bottom Creek, despite interannual variation in the summer North American monsoon in this watershed (Arriaga-Ramierez and Cavazos, 2010; Pascolini-Campbell et al., 2015). This may be because, despite the monsoon influence, most of the watershed precipitation instead comes from winter rainfall events (Arriaga-Ramierez and Cavazos, 2010).
Seasonal differences in event runoff response were significant across the runoff metrics in seven watersheds including both snow- and rain-dominated systems (Fig. 7 and Fig. S8 in the Supplement). Similar patterns have been observed across other watersheds spanning a range of precipitation and streamflow regimes and catchment properties (Jahanshahi and Booij, 2024; Merz et al., 2006; Merz and Blöschl, 2009; Norbiato et al., 2009; Tarasova et al., 2018a; Zheng et al., 2023). In snow-dominated watersheds, observed seasonality has been attributed to differences in precipitation type (Merz et al., 2006; Merz and Blöschl, 2009; Tarasova et al., 2018b), seasonal water balance (Berghuijs et al., 2014; Merz et al., 2006; Tarasova et al., 2018a), and the influence of snow on antecedent moisture conditions (Hammond and Kampf, 2020; Jahanshahi and Booij, 2024; Merz et al., 2006; Merz and Blöschl, 2009; Norbiato et al., 2009). Seasonality in rain-dominated watersheds has been attributed to differences in rainfall properties (intensity and depth) and antecedent moisture driven by seasonal water balance (Berghuijs et al., 2014; Jahanshahi and Booij, 2024; Merz and Blöschl, 2009; Tarasova et al., 2018b). In fact, seasonal water balance has been identified as more important than topography in event runoff response differences between watersheds (Merz et al., 2006). As rainfall properties were separately accounted for in this analysis by evaluating the event runoff response with respect to specific rainfall metrics (e.g., rainfall depth), the significance of seasonality is likely associated with seasonal differences in evapotranspiration and soil moisture.
Antecedent precipitation was only significant across the runoff metrics in one very arid watershed, Clear Creek (Fig. 7 and Fig. S8 in the Supplement). These findings contrast with our expectation that antecedent precipitation, as a proxy for antecedent soil moisture, would be a control on rainfall–runoff patterns. Antecedent precipitation has been used has a proxy for antecedent soil moisture in several studies (Jahanshahi and Booij, 2024; Long and Chang, 2022; Merz et al., 2006; Tarasova et al., 2018b) and in the Soil Conservation Service (SCS) curve method for runoff generation (Mishra and Singh, 2003). Past studies have found conflicting results in the significance of antecedent precipitation. Both 10 d antecedent precipitation (Merz et al., 2006) and antecedent soil moisture in Italy (Merz and Blöschl, 2009; Tarasova et al., 2018b) and 5 d antecedent precipitation in Iran (Jahanshahi and Booij, 2024) have been found to influence event runoff response. However, 10 d antecedent precipitation in Germany (Tarasova et al., 2018b) and 3 d antecedent precipitation in Oregon (US; Long and Chang, 2022) were not significant controls at the event scale. A possible reason why antecedent precipitation was not significant in most study watersheds may be the dominance of the seasonal water balance (Jahanshahi and Booij, 2024; Merz et al., 2006), which may not be captured in short-window (<10 d) antecedent precipitation (Tarasova et al., 2018b). To mitigate this, Tarasova et al. (2018b) suggested applying a longer antecedent precipitation window (30–60 d) to better account for seasonal changes in the water balance.
5.3 Wildfire effects on rainfall–runoff patterns
Consideration of WYT and seasonality was critical to discerning the influence of wildfire disturbance on event runoff response. The influence of wildfire was most apparent in winter in Arroyo Seco and in summer in Clear Creek (Fig. 8). The differences in the post-fire response between Arroyo Seco and Clear Creek are consistent with the large range of post-fire responses observed across western US watersheds (Hallema et al., 2017; Saxe et al., 2018). In Arroyo Seco, for each year post-fire, the event runoff peak magnitudes were greater than expected based on the undisturbed rainfall–runoff event distribution. This post-fire increase in the runoff peak is consistent with previously observed increases in total annual flow in the watershed (Bart, 2016; Beyene et al., 2021). In Arroyo Seco, the first 2 years post-fire were wet and the subsequent years were dry. Without considering the dry years separately, the influence of the fire would have been obscured within the full undisturbed rainfall–runoff event distribution. Distilling the disturbed event runoff response from natural WYT variability has been identified as a challenge by other studies (Biederman et al., 2022; Hallema et al., 2017; Long and Chang, 2022; Mahat et al., 2016; Newcomer et al., 2023; Owens et al., 2013). Without consideration of WYT, interannual hydrologic variability may obscure changes in post-fire rainfall–runoff patterns (Mahat et al., 2016; Newcomer et al., 2023; Owens et al., 2013) or falsely exaggerate the impact of wildfire if, for example, a fire is followed by very wet years, as occurred in Arroyo Seco and Clear Creek.
Altered post-fire rainfall–runoff patterns also appear to be seasonal (Fig. 8). In Clear Creek, the post-fire peak runoff was greater than expected every year in summer, but the trend was inconsistent in the winter and melt seasons. Biederman et al. (2022) similarly observed greater post-fire changes in summer compared with winter in watersheds in the southwest US. Wildfire has also been found to influence snow accumulation and melt timing (Ebel et al., 2012; Gleason et al., 2019; Kampf et al., 2022; Maina and Siirila-Woodburn, 2020). However, less wildfire influence on event runoff response in the winter and melt seasons in snow-dominated watersheds like Clear Creek makes sense, as snow accumulation and melt dynamics likely dominate runoff response during these periods. The altered post-fire summer rainfall–runoff events would have been obscured by the larger snowmelt events without considering seasonality in Clear Creek. In Oregon, where Long and Chang (2022) found no significant change between pre- and post-fire rainfall–runoff patterns despite comparing 2 dry years, seasonality may have similarly obscured post-fire effects.
This study presents and utilizes the RREDI toolkit, an automated and transferable time-series signal-processing event separation and attribution algorithm, to disentangle the influence of time-varying hydrologic controls on event runoff response. A dataset of 5042 rainfall–runoff events was generated by applying the RREDI toolkit to nine study watersheds in the western US. This dataset was used to investigate rainfall–runoff event patterns, identify significant time-varying hydrologic controls by watershed and runoff metric group, and evaluate how the identified controls influence event runoff response and the effects of wildfire in two case study burned watersheds. Water year type and season were generally found to be significant hydrologic controls, but results varied between watersheds and runoff metrics. Antecedent precipitation was generally less significant, indicating a more complex influence on runoff response, consistent with the literature. In Arroyo Seco and Clear Creek, post-fire rainfall–runoff events generally exhibited a higher peak runoff for a given rainfall depth than expected based on the undisturbed trends. Grouping rainfall–runoff events into significant hydrologic condition groups helped to reveal the effects of wildfire on the event runoff response. Study findings improve the fundamental understanding of multiple, confounding controls on event rainfall–runoff patterns and emphasize the need to consider the influence of interannual and seasonal variability to better isolate watershed disturbance effects. Better understanding the effects of watershed disturbances on streamflow patterns is critical to managing our natural resources under increasing disturbance regimes.
All code for data processing and visualization is available upon request from the corresponding author. The RREDI toolkit Python code and documentation for the creation of the rainfall–runoff event dataset used in this study can be accessed via HydroShare at https://www.hydroshare.org/resource/797fe26dfefb4d658b8f8bc898b320de/ (Canham and Lane, 2022). Streamflow data from the USGS are publicly available at https://waterdata.usgs.gov/nwis (USGS, 2024), and the AORC precipitation gridded dataset is publicly available at Fall et al. (2023). Wildfire perimeters and burn severity mosaics are available at https://www.mtbs.gov/ (MTBS, 2023), and PRISM gridded precipitation data are available at https://www.prism.oregonstate.edu (PRISM Climate Group, 2022).
The supplement related to this article is available online at: https://doi.org/10.5194/hess-29-27-2025-supplement.
HAC and BL designed the study. HAC performed the analyses with input from BL, CBP, and BPM. The first draft of the paper was written by HAC and BL and reviewed by all co-authors.
The contact author has declared that none of the authors has any competing interests.
Publisher's note: Copernicus Publications remains neutral with regard to jurisdictional claims made in the text, published maps, institutional affiliations, or any other geographical representation in this paper. While Copernicus Publications makes every effort to include appropriate place names, the final responsibility lies with the authors.
We would like to thank the reviewers whose thoughtful input improved the manuscript.
This research has been supported by the National Science Foundation (RAPID grant no. 203212) and the Utah Water Research Laboratory.
This paper was edited by Marnik Vanclooster and reviewed by two anonymous referees.
Abatzoglou, J. T. and Williams, A. P.: Impact of anthropogenic climate change on wildfire across western US forests, Earth Atmos. Planet. Sci., 113, 11770–11775, https://doi.org/10.1073/pnas.1607171113, 2016.
Abatzoglou, J. T., Battisti, D. S., Williams, A. P., Hansen, W. D., Harvey B. J., and Kolden C. A.: Projected increases in western US forest fire despite growing fuel constraints, Commun. Earth Environ., 2, 227, https://doi.org/10.1038/s43247-021-00299-0, 2021.
Adams, H. D., Luce, C. H., Breshears, D. D., Allen, C. D., Weiler, M., Hale, V. C., Smith, A. M., and Huxman, T. E.: Ecohydrological consequences of drought- and infestation-triggered tree die-off: Insights and hypotheses, Ecohydrology, 5, 145–159, https://doi.org/10.1002/eco.233, 2012.
Arriaga-Ramierez, S. and Cavazos, T.: Regional trends of daily precipitation indices in northwest Mexico and southwest United States, J. Geophys. Res., 115, D14111, https://doi.org/10.1029/2009JD013248, 2010.
Balocchi, F., Flores, N., Neary, D., White, D. A., Silberstein, R., and Ramírez De Arellano, P.: The effect of the `Las Maquinas' wildfire of 2017 on the hydrologic balance of a high conservation value Hualo (Nothofagus glauca (Phil.) Krasser) forest in central Chile, Forest Ecol. Manage., 477, 118482., https://doi.org/10.1016/j.foreco.2020.118482, 2020.
Bart, R.: A regional estimate of postfire streamflow change in California, Water Resour. Res., 52, 1465–1478, https://doi.org/10.1002/2014WR016553, 2016.
Berghuijs, W. R., Sivapalan, M., Woods, R. A., and Savenije, H. H. G.: Patterns of similarity of seasonal water balances: A window into streamflow variability over a range of time scales, Water Resour. Res., 50, 5638–5661, https://doi.org/10.1002/2014WR015692, 2014.
Beyene, M. T., Leibowitz, S. G., and Pennino, M. J.: Parsing Weather Variability and Wildfire Effects on the Post-Fire Changes in Daily Stream Flows: A Quantile-Based Statistical Approach and Its Application, Water Resour. Res., 57, e2020WR028029, https://doi.org/10.1029/2020WR028029, 2021.
Biederman, J. A., Robles, M. D., Scott, R. L., and Knowles, J. F.: Streamflow Response to Wildfire Differs With Season and Elevation in Adjacent Headwaters of the Lower Colorado River Basin, Water Resour. Res., 58, e2021WR030687, https://doi.org/10.1029/2021WR030687, 2022.
Blume, T., Zehe, E., and Bronstert, A.: Rainfall–Runoff response, event-based runoff coefficients and hydrograph separation, Hydrolog. Sci. J., 52, 843–862, https://doi.org/10.1623/hysj.52.5.843, 2007.
Brantley, S., Ford, C. R., and Vose, J. M.: Future species composition will affect forest water use after loss of eastern hemlock from southern Appalachian forests, Ecol. Appl., 23, 777–790, https://doi.org/10.1890/12-0616.1, 2013.
Canham, H. A. and Lane, B.: Rainfall-runoff event detection and identification (RREDI) toolkit, Hydroshare [code], https://www.hydroshare.org/resource/797fe26dfefb4d658b8f8bc898b320de/ (last access: 1 February 2024), 2022.
Cayan, D. R.: Interannual Climate Variability and Snowpack in the Western United States, J. Climate, 9, 928–948, https://doi.org/10.1175/1520-0442(1996)009<0928:ICVASI>2.0.CO;2, 1995.
Chapman, T. G. and Maxwell, A. I.: Baseflow Separation – Comparison of Numerical Methods with Tracer Experiments, in: Hydrology and Water Resources Symposium 1996: Water and the Environment, Institute of Engineers, Australia, 539–545, https://doi.org/10.3316/informit.360361071346753, 1996.
Duncan, H. P.: Baseflow separation – A practical approach, J. Hydrol., 575, 308–313, https://doi.org/10.1016/j.jhydrol.2019.05.040, 2019.
Ebel, B. A. and Mirus, B. B.: Disturbance hydrology: Challenges and opportunities, Hydrol. Process., 28, 5140–5148, https://doi.org/10.1002/hyp.10256, 2014.
Ebel, B. A., Hinckley, E. S., and Martin, D. A.: Soil-water dynamics and unsaturated storage during snowmelt following wildfire, Hydrol. Earth Syst. Sci., 16, 1401–1417, https://doi.org/10.5194/hess-16-1401-2012, 2012.
Ebel, B. A., Wagenbrenner, J. W., Kinoshita, A. M., and Bladon, K. D.: Hydrologic recovery after wildfire: A framework of approaches, metrics, criteria, trajectories, and timescales, J. Hydrol. Hydromech., 70, 388–400, https://doi.org/10.2478/johh-2022-0033, 2022.
Eckhardt, K.: How to construct recursive digital filters for baseflow separation, Hydrol. Process., 19, 507–515, https://doi.org/10.1002/hyp.5675, 2005.
Falcone, J. A.: GAGES-II: Geospatial Attributes of Gages for Evaluating Streamflow, USGS Publications Warehouse [data set], https://doi.org/10.3133/70046617, 2011.
Fall, G., Kitzmiller D., Pavlovic S., Zhang Z., Patrick, N., St. Laurent, M., Trypaluk, C., Wu, W., and Miller, D.: The Office of Water Prediction's Analysis of Record for Calibration, version 1.1: Dataset description and precipitation evaluation, J. Am. Water Resour. Assoc., 59, 1246–1272, https://doi.org/10.1111/1752-1688.13143, 2023.
Giani, G., Rico-Ramirez, M. A., and Woods, R. A.: Are moments of rainfall spatial variability useful for runoff modelling in operational hydrology?, Hydrolog. Sci. J., 67, 1466–1479, https://doi.org/10.1080/02626667.2022.2092405, 2022a.
Giani, G., Tarasova, L., Woods, R. A., and Roco-Ramirez, M. A.: An Objective Time-Series-Analysis Method for Rainfall-Runoff Event Identification, Water Resour. Res., 58, e2021WR031283, https://doi.org/10.1029/2021WR031283, 2022b.
Gleason, K. E., McConnel, J. R., Arienzo, M. M., Chellman, N., and Calvin, W. M.: Four-fold increase in solar forcing on snow in western U.S. burned forests since 1999, Nat. Commun., 10, 2026, https://doi.org/10.1038/s41467-019-09935-y, 2019.
Goeking, S. A. and Tarboton, D. G.: Forests and Water Yield: A Synthesis of Disturbance Effects on Streamflow and Snowpack in Western Coniferous Forests, J. Forest., 118, 172–192, https://doi.org/10.1093/jofore/fvz069, 2020.
Gupta, H. V., Perrin, C., Blöschl, G., Montanari, A., Kumar, R., Clark, M., and Andréassian, V.: Large-sample hydrology: A need to balance depth with breadth, Hydrol. Earth Syst. Sci., 18, 463–477, https://doi.org/10.5194/hess-18-463-2014, 2014.
Hallema, D. W., Sun, G., Caldwell, P. V., Norman, S. P., Cohen, E. C., Liu, Y., Ward, E. J., and McNulty, S. G.: Assessment of wildland fire impacts on watershed annual water yield: Analytical framework and case studies in the United States, Ecohydrology, 10, e1794, https://doi.org/10.1002/eco.1794, 2017.
Hallema, D. W., Robinne, F.-N., and Bladon, K. D.: Reframing the Challenge of Global Wildfire Threats to Water Supplies, Earth's Future, 6, 772–776, https://doi.org/10.1029/2018EF000867, 2018.
Hammond, J. C. and Kampf, S. K.: Subannual Streamflow Responses to Rainfall and Snowmelt Inputs in Snow-Dominated Watersheds of the Western United States, Water Resour. Res., 56, e2019WR026132, https://doi.org/10.1029/2019WR026132, 2020.
Hong, Y., Xuan Do, H., Kessler, J., Fry, L., Read, L., Rafieei Nasab, A., Gronewold, A. D., Mason, L., and Anderson, E. J.: Evaluation of gridded precipitation datasets over international basins and large lakes, J. Hydrol., 607, 127507, https://doi.org/10.1016/j.jhydrol.2022.127507, 2022.
Hoover, K. and Hanson, L. A.: Wildfire Statistics (IF10244), Congressional Research Service, https://crsreports.congress.gov/product/pdf/IF/IF10244/45 (last access: 20 December 2024), 2020.
Hopkins, K. G., Morse, N. B., Bain, D. J., Bettez, N. D., Grimm, N. B., Morse, J. L., Palta, M. M., Shuster, W. D., Bratt, A. R., and Suchy, A. K.: Assessment of Regional Variation in Streamflow Responses to Urbanization and the Persistence of Physiography, Environ. Sci. Technol., 49, 2724–2732, https://doi.org/10.1021/es505389y, 2015.
Jahanshahi, A. and Booij, M. J.: Flood process types and runoff coefficient variability in climatic regions of Iran, Hydrolog. Sci. J., 69, 241–258, https://doi.org/10.1080/02626667.2024.2302420, 2024.
Kampf, S. K., Brogan, D. J., Schmeer, S., MacDonald, L. H., and Nelson, P. A.: How do geomorphic effects of rainfall vary with storm type and spatial scale in a post-fire landscape?, Geomorphology, 273, 39–51, https://doi.org/10.1016/j.geomorph.2016.08.001, 2016.
Kampf, S. K., McGrath, D., Sears, M. G., Fassnacht, S. R., Kiewiet, L., and Hammond, J. C.: Increasing wildfire impacts on snowpack in the western U.S., Earth Atmos. Plant. Sci., 119, e2200333119, https://doi.org/10.1073/pnas.2200333119, 2022.
Kelly, S. A., Takbiri, Z., Belmont, P., and Foufoula-Georgiou, E.: Human amplified changes in precipitation–runoff patterns in large river basins of the Midwestern United States, Hydrol. Earth Syst. Sci., 21, 5065–5088, https://doi.org/10.5194/hess-21-5065-2017, 2017.
Kim, H. and Villarini, G.: Evaluation of the Analysis of Record for Calibration (AORC) Rainfall across Louisiana, Remote Sens., 14, 3284, https://doi.org/10.3390/rs14143284, 2022.
Kinoshita, A. M. and Hogue, T. S.: Increased dry season water yield in burned watersheds in Southern California, Environ. Res. Lett., 10, 014003, https://doi.org/10.1088/1748-9326/10/1/014003, 2015.
Lamjiri, M., Dettinger, M., Ralph, F. M., Oakley, N., and Rutz, J.: Hourly Analyses of the Large Storms and Atmospheric Rivers that Provide Most of California's Precipitation in Only 10 to 100 Hours per Year, San Francisco Estuary and Watershed Science, 16, 1, https://doi.org/10.15447/sfews.2018v16iss4art1, 2018.
Long, W. B. and Chang, H.: Event Scale Analysis of Streamflow Response to Wildfire in Oregon, 2020, Hydrology, 9, 157, https://doi.org/10.3390/hydrology9090157, 2022.
Mahat, V., Silins, U., and Anderson, A.: Effects of wildfire on the catchment hydrology in southwest Alberta, Catena, 147, 51–60, https://doi.org/10.1016/j.catena.2016.06.040, 2016.
Maina, F. Z. and Siirila-Woodburn, E. R.: Watersheds dynamics following wildfires: Nonlinear feedbacks and implications on hydrologic responses, Hydrol. Process., 34, 33–50, https://doi.org/10.1002/hyp.13568, 2020.
Mei, Y. and Anagnostou, E. N.: A hydrograph separation method based on information from rainfall and runoff records, J. Hydrol., 523, 636–649, https://doi.org/10.1016/j.jhydrol.2015.01.083, 2015.
Merz, R. and Blöschl, G.: A regional analysis of event runoff coefficients with respect to climate and catchment characteristics in Austria, Water Resour. Res., 45, W01405, https://doi.org/10.1029/2008WR007163, 2009.
Merz, R., Blöschl, G., and Parajka, J.: Spatio-temporal variability of event runoff coefficients, J. Hydrol., 331, 591–604, https://doi.org/10.1016/j.jhydrol.2006.06.008, 2006.
Miller, A. and Zégre, N.: Landscape-Scale Disturbance: Insights into the Complexity of Catchment Hydrology in the Mountaintop Removal Mining Region of the Eastern United States, Land, 5, 22, https://doi.org/10.3390/land5030022, 2016.
Mirus, B. B., Ebel, B. A., Mohr, C. H., and Zegre, N.: Disturbance Hydrology: Preparing for an Increasingly Disturbed Future, Water Resour. Res., 53, 10007–10016, https://doi.org/10.1002/2017WR021084, 2017.
Mishra, S. K. and Singh, V.: Soil Conservation Service Curve Number (SCS-CN) Methodology, in: Water Science and Technology Library, Springer Science and Business Media, https://doi.org/10.1007/978-94-017-0147-1, 2003.
MTBS – Monitoring Trends in Burn Severity: MTBS burn severity data, https://www.mtbs.gov/ (last access: 7 October 2022), 2023.
Murphy, B. P., Yocom, L. L., and Belmont, P.: Beyond the 1984 Perspective: Narrow Focus on Modern Wildfire Trends Underestimates Future Risks to Water Security, Earth's Future, 6, 1492–1497, https://doi.org/10.1029/2018EF001006, 2018.
Nagy, E. D., Szilagyi, J., and Torma, P.: Estimation of catchment response time using a new automated event-based approach, J. Hydrol., 613, 128355, https://doi.org/10.1016/j.jhydrol.2022.128355, 2022.
Newcomer, M. E., Underwood, J., Murphy, S. F., Ulrich, C., Schram, T., Maples, S. R., Peña, J., Siirila-Woodburn, E. R., Trotta, M., Jasperse, J., Seymour, D., and Hubbard, S. S.: Prolonged Drought in a Northern California Coastal Region Suppresses Wildfire Impacts on Hydrology, Water Resour. Res., 59, e2022WR034206, https://doi.org/10.1029/2022WR034206, 2023.
Norbiato, D., Borga, M., Merz, R., Blöschl, G., and Carton, A.: Controls on event runoff coefficients in the eastern Italian Alps, J. Hydrol., 375, 312–325, https://doi.org/10.1016/j.jhydrol.2009.06.044, 2009.
Null, S. E. and Viers, J. H.: In bad waters: Water year classification in nonstationary climates: Water Year Classification in Nonstationary Climates, Water Resour. Res., 49, 1137–1148, https://doi.org/10.1002/wrcr.20097, 2013.
O'Leary III, D., Hall, D. K., Medler, M., Matthews, R., and Flower, A.: Snowmelt Timing Maps Derived from MODIS for North America, Version 2, 2001–2018, ORNL DAAC [data set], https://doi.org/10.3334/ORNLDAAC/1712, 2020.
Owens, P. N., Giles, T. R., Petticrew, E. L., Leggat, M. S., Moore, R. D., and Eaton, B. C.: Muted responses of streamflow and suspended sediment flux https://doi.org/10.1016/j.geomorph.2013.01.001, 2013.
Partridge, T. F., Johnson, Z. C., Sleeter, R. R., Qi, S. L., Walvoord, M. A., Murphy, S. F., Peterman-Phipps, C., and Ebel, B. A.: Opportunities and challenges for precipitation forcing data in post-wildfire hydrologic modeling applications, WIREs Water, 11, e1728, https://doi.org/10.1002/wat2.1728, 2024.
Pascolini-Campbell, M. A., Seager, R., Gutzler, D. S., Cook, B. I., and Griffin, D.: Causes of interannual to decadal variability of Gila River streamflow over the past century, J. Hydrol.: Reg. Stud., 3, 494–508, https://doi.org/10.1016/j.ejrh.2015.02.013, 2015.
Patterson, N. K., Lane, B. A., Sandoval-Solis, S., Pasternack, G. B., Yarnell, S. M., and Qiu, Y.: A hydrologic feature detection algorithm to quantify seasonal components of flow regimes, J. Hydrol., 585, 124787, https://doi.org/10.1016/j.jhydrol.2020.124787, 2020.
PRISM Climate Group: PRISM Gridded Climate Data, Oregon State University, https://www.prism.oregonstate.edu (last access: 7 October 2022), 2022.
Robinne, F., Hallema, D. W., Bladon, K. D., Flannigan, M. D., Boisramé, G., Bréthaut, C. M., Doerr, S. H., Di Baldassarre, G., Gallagher, L. A., Hohner, A. K., Khan, S. J., Kinoshita, A. M., Mordecai, R., Nunes, J. P., Nyman, P., Santín, C., Sheridan, G., Stoof, C. R., Thompson, M. P., Waddington, J. M., and Wei, Y.: Scientists' warning on extreme wildfire risks to water supply, Hydrol. Process., 35, e14086, https://doi.org/10.1002/hyp.14086, 2021.
Roe, G. H.: Orographic Precipitation, Annu. Rev. Earth Planet. Sci., 33, 645–671, https://doi.org/10.1146/annurev.earth.33.092203.122541, 2005.
Saxe, S., Hogue, T. S., and Hay, L.: Characterization and evaluation of controls on post-fire streamflow response across western US watersheds, Hydrol. Earth Syst. Sci., 22, 1221–1237, https://doi.org/10.5194/hess-22-1221-2018, 2018.
Sivapalan, M.: The secret to `doing better hydrological science': Change the question!, Hydrol. Process., 23, 1391–1396, https://doi.org/10.1002/hyp.7242, 2009.
Tarasova, L., Basso, S., Poncelet, C., and Merz, R.: Exploring Controls on Rainfall-Runoff Events: 2. Regional Patterns and Spatial Controls of Event Characteristics in Germany, Water Resour. Res., 54, 7688–7710, https://doi.org/10.1029/2018WR022588, 2018a.
Tarasova, L., Basso, S., Zink, M., and Merz, R.: Exploring Controls on Rainfall-Runoff Events: 1. Time Series-Based Event Separation and Temporal Dynamics of Event Runoff Response in Germany, Water Resour. Res., 54, 7711–7732, https://doi.org/10.1029/2018WR022587, 2018b.
USGS – US Geological Survey: National Water Information System (NWIS) https://waterdata.usgs.gov/nwis (last access: 7 October 2022), 2024.
Wagenbrenner, J. W., Ebel, B. A., Bladon, K. D., and Kinoshita, A. M.: Post-wildfire hydrologic recovery in Mediterranean climates: A systematic review and case study to identify current knowledge and opportunities, J. Hydrol., 602, 126772, https://doi.org/10.1016/j.jhydrol.2021.126772, 2021.
Wang, H.-J., Merz, R., Yang, S., Tarasova, L., and Basso, S.: Emergence of heavy tails in streamflow distributions: The role of spatial rainfall variability, Adv. Water Resour., 171, 104359, https://doi.org/10.1016/j.advwatres.2022.104359, 2023.
Wine, M. L. and Cadol, D.: Hydrologic effects of large southwestern USA wildfires significantly increase regional water supply: Fact or fiction?, Environ. Res. Lett., 11, 085006, https://doi.org/10.1088/1748-9326/11/8/085006, 2016.
Wine, M. L., Makhnin, O., and Cadol, D.: Nonlinear Long-Term Large Watershed Hydrologic Response to Wildfire and Climatic Dynamics Locally Increases Water Yields, Earth's Future, 6, 997–1006, https://doi.org/10.1029/2018EF000930, 2018.
Wu, S., Zhao, J., Wang, H., and Sivapalan, M.: Regional Patterns and Physical Controls of Streamflow Generation Across the Conterminous United States, Water Resour. Res., 57, 997–1006, https://doi.org/10.1029/2020WR028086, 2021.
Xie, J., Liu, X., Wang, K., Yang, T., Liang, K., and Liu, C.: Evaluation of typical methods for baseflow separation in the contiguous United States, J. Hydrol., 583, 124628, https://doi.org/10.1016/j.jhydrol.2020.124628, 2020.
Zheng, Y., Coxon, G., Woods, R., Li, J., and Feng, P.: Controls on the Spatial and Temporal Patterns of Rainfall-Runoff Event Characteristics – A Large Sample of Catchments Across Great Britian, Water Resour. Res., 59, e2022WR33226, https://doi.org/10.1029/2022WR033226, 2023.


