the Creative Commons Attribution 4.0 License.
the Creative Commons Attribution 4.0 License.
 | 19 Jun 2025
Does peatland rewetting mitigate flooding from extreme rainfall events?
Shirin Karimi
Virginia Mosquera
Eliza Maher Hasselquist
Järvi Järveoja
Hjalmar Laudon
Pristine peatlands are believed to play an important role in regulating hydrological extremes because they can act as reservoirs for rainwater and release it gradually during dry periods. Rewetting of drained peatlands has therefore been considered an important strategy to reduce the catastrophic effects of flooding. With the anticipation of more frequent extreme rainfall events in the future due to a changing global climate, the importance of peatland rewetting in flood mitigation becomes even more important. To date, however, empirical data showing that rewetting of drained peatlands actually restores their hydrological function similar to pristine peatlands are largely lacking, particularly for boreal fens. To assess whether peatland rewetting can mitigate flooding from extreme rainfall events and ensure water security in a future climate, we measured event-based runoff responses before and after rewetting using a BACI approach (before–after and control–impact) within a replicated, catchment-scale study at the Trollberget Experimental Area in northern Sweden. High-resolution hydrological field observations, including groundwater level (GWL), discharge, and rainfall data, were collected over 4 years, allowing us to detect and analyze 17 rainfall-runoff events before and 30 events after rewetting. We found that the rewetted sites experienced an increase in the GWL following rewetting and that this was consistently observed across all distances from the blocked ditch within the peatland. Our rainfall-runoff analysis revealed that rewetting significantly decreased peak flow and the runoff coefficient and reduced the overall flashiness of hydrographs, making the rewetted sites function more like the pristine control peatland. However, “lag time”, which was already similar to pristine conditions, was pushed farther away from pristine conditions following rewetting. Yet, our results showed that the effectiveness of ditch blocking in flood moderation was strongly influenced by the initial condition and the catchment percentage of restoration, as one of our two rewetted peatlands did not show significant change, attributed to it being already similar to the pristine site, suggesting less treatment effect, and the other catchment, with higher restoration percentage, had a better response to treatment. In summary, our findings suggest that peatland rewetting has the potential to mitigate flood responses; however, further research over a longer time period is needed, as peat properties and the peatland vegetation will develop and change over time.
- Article
(3912 KB) - Full-text XML
-
Supplement
(679 KB) - BibTeX
- EndNote


Pristine peatlands are the predominant wetland type in the boreal biome. They encompass 15 % of the boreal land surface area and serve as significant carbon sinks and methane sources, playing a crucial role in regulating the global climate (Helbig et al., 2020). In recent years, there has been an increased recognition of the importance of peatlands in carbon capture, flood management, water quality, and biodiversity (Holden et al., 2017). Regrettably, these valuable ecosystems have undergone substantial human-induced damage, with more than half of the total pristine peatlands in Europe estimated to have been impacted by drainage for agriculture, forestry, or peat extraction (Andersen et al., 2017). Drained peatlands cannot sustain critical ecosystem services, such as climate regulation through long-term carbon sequestration or buffering extreme hydrological events, imposing a significant cost on society – a burden that could be alleviated through appropriate rewetting measures (Loisel and Gallego-Sala, 2022). Additionally, there are growing concerns surrounding climate change projections for the Northern Hemisphere, indicating an expected increase in more frequent extreme precipitation events, along with extended dry periods (Aghakouchak et al., 2020; Hawcroft et al., 2018).
Pristine peatlands function as significant water reservoirs, efficiently storing substantial amounts of water during periods of high rainfall (Acreman and Holden, 2013). As extreme rainfall events are anticipated to become more frequent in the evolving global climate, understanding the role of peatland rewetting in flood mitigation is increasingly vital. Rewetting projects typically involve physical interventions such as ditch blocking or infilling, aiming to increase groundwater level (GWL). Moreover, the blocking of ditches cuts off preferential pathways along open drains and when combined with pooling behind dams, has the potential to act as a buffer during peak flow events, slowing water release and mitigating the flashiness of the discharge response (Holden, 2006; Holden and Burt, 2003). Therefore, by reducing peak flows, peatland rewetting can also contribute to natural flood management by attenuating downstream flow and diminishing flood risk. Furthermore, the reduction of peak flows could play an important role in mitigating further erosion of peatlands and minimizing sediment production, as well as carbon loss (Shuttleworth et al., 2015).
In Sweden, peatlands cover approximately 6.56×10⁴ km2 (16 % of the Swedish land area) and are predominantly located within boreal regions (Franzen et al., 2012; Montanarella et al., 2006). The historical practice of draining peatlands began in the early 18th century for agricultural purposes and later in the 19th century for forestry, resulting in the excavation of over 1×10⁶ km of ditches, primarily dug by hand (Laudon et al., 2022). Consequently, the rewetting of degraded peatlands in Sweden has become a pressing priority to enhance the hydrological functioning of these ecosystems (Bring et al., 2022). As a response, several national programs for peatland rewetting have emerged, with a primary emphasis on reintroducing essential ecosystem services, notably flood control. In a significant move, in 2018, EUR 27 million was allocated to facilitate peatland rewetting in Sweden. However, the empirical underpinning supporting the desired outcomes of peatland rewetting is still largely lacking.
The effect of peatland rewetting on hydrological responses during rainfall events has received scientific attention over the past decades (Gatis et al., 2023; Goudarzi et al., 2021; Ketcheson and Price, 2011; Menberu et al., 2018; Shuttleworth et al., 2019). Event-based analysis of stream hydrographs by employing various metrics related to hydrograph magnitude and timing is a common approach for investigating dominant runoff generation processes in catchments and understanding how quickly water is mobilized from the landscape (Haque et al., 2022; Ketcheson and Price, 2011; Kirchner et al., 2023). These response metrics provide valuable insights into catchment storage and release mechanisms (Blume et al., 2007). One widely acknowledged aspect is the impact of rewetting on the event runoff coefficient, which represents the ratio of event runoff depth to event rainfall depth (Evans et al., 1999; Shuttleworth et al., 2019). Therefore, comparing event characteristics before and after rewetting offers a means to understand hydrological processes and runoff generation mechanisms at the catchment scale, thereby improving our understanding of flood estimation during extreme events.
A common limitation in the current literature is the predominant focus on event characteristics in natural or relatively unimpacted catchments, with few studies addressing rewetted peatlands. Therefore, the extent of hydrological changes due to rewetting is not well understood. Some studies highlight the positive impact of peatland rewetting on flood moderation, with a reduction of peak storm flow (Gatis et al., 2023; Javaheri and Babbar-Sebens, 2014; Shuttleworth et al., 2019; Wilson et al., 2011); however, there are differences in the extent of the flood moderation. For example, Gatis et al. (2023) reported a 49 % reduction in peak storm flow after rewetting, while Shuttleworth et al. (2019) found a 24 % reduction in peak storm flows and a 94 % extension in lag times without a change in runoff coefficients. The challenges in understanding the effects of rewetting at the catchment scale are further underscored by the inherent high spatial variability of peatland hydrology and physical characteristics (Evans et al., 1999). The apparent discrepancies in study outcomes, coupled with significant variations among different research sites, highlight the importance of addressing this through further in-depth investigations for developing effective strategies in peatland management, especially given the evolving trend in climate change.
Moreover, a recent meta-analysis conducted by Bring et al. (2020) has brought further attention to a noteworthy knowledge gap in understanding the impact of rewetting on GWL changes at different distances from the intervention (i.e., blocked ditches). While existing studies have contributed valuable data on the overall hydrological effects of peatland rewetting, a comprehensive spatial analysis of groundwater changes following rewetting remains inadequately explored. Despite this shortage, some studies suggest that the impact of rewetting, especially through ditch blocking, is localized, resulting in more pronounced GWL rise in close proximity to the ditch (Armstrong et al., 2010; D'Acunha et al., 2018; Haapalehto et al., 2014; Wilson et al., 2010). In a prior study (Karimi et al., 2024) in the same catchments as reported below, the overall effect of rewetting on hydrological functioning was found, including a significant rise in GWL post-rewetting. However, a thorough examination of groundwater changes at varying distances from the ditch, considering its important role in discharge regulation, is essential to enhance our mechanistic understanding of flow generation after rewetting. Without such monitoring, the estimation and extrapolation of discharge responses across the landscape become more uncertain. Therefore, a more detailed spatial analysis of GWL changes is crucial for those involved in managing these peatlands.
Given that there have been inconsistent reports in the literature on the extent to which rewetted peatlands will affect hydrological functioning, particularly with regard to natural flood management, we build on methods used to examine the effect of pristine peatlands on flood attenuation (Karimi et al., 2024), to assess that of the rewetting's impact on hydrological functioning. We used a hydro-climate dataset comprised of 1-year pre- and 3-year post-rewetting and incorporated two control catchments to ensure the robustness of our findings. The primary objective of this paper was to test whether peatland rewetting has any natural flood management effect. We hypothesized that rewetting leads to a reduction in peak flow, runoff coefficient, hydrograph shape index (HSI), and an increase in lag time, resulting in a generally less flashy hydrograph. Moreover, as GWL is an important indicator of the amount of water stored in the peatland and the effect of the rewetting, we asked how far from the ditch GWL was increased by the ditch blocking. We hypothesized that the areas closest to the ditch would increase more than the areas farther away from the blocked ditch.
2.1 Study sites
This study took place in the Trollberget Experimental Area (TEA), situated approximately 50 km northwest of Umeå (TEA; 64.181550° N, 19.835378° E) (Fig. 1). The TEA's peatland is an oligotrophic minerogenic fen. Prior to rewetting, the peatland was dominated by Sphagnum spp., complemented by sparse sedges, dwarf shrubs, and sparse tree canopy (basal area = 2.6 m2 ha−1) of slow-growing Scots pine (Pinus sylvestris). The underlying soils consist mainly of humic podzol, with some drier areas featuring humo-ferric podzol and wetter regions comprising Histosols. Peat depth is on average 2.41 m (Laudon et al., 2023). The bulk density of the drained peatland varied between 0.05 and 0.13 g cm−3 within the top 55 cm of the peat profile. The bulk density generally increased with distance from the central ditch and with peat depth (Casselgård, 2020). The climate of the area is classified as cold temperate humid, characterized by a mean average temperature of 2.4 °C and annual precipitation of 623 mm (approximately 30 % as snow), based on data collected from 1980 to 2020 at the nearby Svartberget Climate Station (Laudon et al., 2021).
The peatland at TEA was drained by manual ditch-digging in the early 1920s primarily for forestry purposes; however because of nutrient limitation, the peatland remained unproductive with sparse tree cover (Laudon et al., 2023). The peatland is divided into two catchments, draining in two directions, referred to here as R1 and R2, with drainage areas of 33 and 60 ha, respectively (Fig. 1). Both catchments are similar in topography and vegetation; however, R1 had an open-water pond shown in historic maps pre-drainage. In the 1930s, the uplands of the peatland were also drained, leading to 1152 m of ditches in R1 and 5189 m of ditches in R2 (Laudon et al., 2021). In November 2020, the peatland was rewetted by filling and blocking all the ditches in the peatland, whereas ditches in the surrounding non-peat areas were left unmanaged. As a result of these efforts, 59 % of the ditches of R1 and 16 % of the ditches of R2 were blocked. The ditches were filled using peat from the site, with additional dams built at regular intervals using the tree logs harvested from the site. The logs were placed horizontally, except at the two outlet locations where the logs were inserted vertically into the peat and layered additionally with geotextiles. To protect the soil characteristics as much as possible, the heavy machinery (i.e., excavators) used movable log mats while moving on the mire. Additionally, the sparse tree cover that grew on the peatland was cut to reduce evapotranspiration and complement the ditch blocking (Karimi et al., 2024). Finally, after restoration, the open-water pond at R1 re-appeared ca. 100 m upstream of the sampling location (Fig. 1b).
2.2 The Degerö Stormyr
This study leveraged available data from a nearby natural fen, Degerö Stormyr (273 ha catchment), located approximately 24 km from the TEA, at the Kulbäcksliden Research Infrastructure (KRI, Noumonvi et al., 2023) (64.182029° N, 19.556543° E) to serve as the control for the rewetted peatland R1 and R2 catchments. Degerö Stormyr is characterized as an acidic, oligotrophic, minerogenic, mixed mire system. This intensively studied peatland complex exhibits varying vegetation compositions, predominantly featuring Sphagnum moss and sedges. The depth of the peat has an average thickness of ∼ 3 m (Noumonvi et al., 2023). The bulk density of the peatland varied between 0.02 and 0.06 g cm−3 within the top 34 cm of the peat profile (Fig. 2 in Casselgård, 2020).
2.3 C4 (Kallkälsmyren)
The second control catchment, C4 (Kallkälsmyren), is situated within the Krycklan Catchment Study (KCS) (64.260722° N, 19.770339° E). C4 is a nutrient-poor, minerogenic fen located approximately 10 km from the rewetted catchment. It encompasses a catchment area of 18 ha, with 40 % covered by peatlands and the remainder by forest (Laudon et al., 2021). Similar to TEA, the climate is characterized as a cold temperate humid type with persistent snow cover during the winter season. The peat vegetation cover is dominated by Sphagnum spp.
2.4 Data collection
At the TEA, GWL was measured between 2019 and 2023 at an hourly resolution using 30 dipwells. Half of these dipwells were continuously monitored for GWL using data loggers (Levelogger 5, Solinst, Canada), while the remaining ones were manually measured every 2 weeks during the snow-free season. Dipwells were distributed along five transects. Each transect consisted of six wells with increasing distances of approximately 10, 50, and 100 m from the main ditch (Fig. 1). For the Degerö Stormyr control site, GWL data for the corresponding period were obtained from four wells that are part of the ICOS database (https://www.icos-sweden.se/data, last access: 15 March 2024). Due to technical issues with the groundwater loggers, no groundwater data were available for the C4 control catchment in recent years.
The discharge data at two TEA mire outlets were collected between 2019 and 2023 at an hourly resolution using 90° sharp-crested V-notches with connected data loggers for continuous water level measurements (TruTrack WT-HR, Intech Instruments Ltd, Australia). Automatic observations were not possible year-round as there was no heating in place, which limited data collection during the winter low flow periods. Manual water level measurements were taken twice a month to calibrate automatic water level data, and stage–discharge relationships were defined using manual flow gauging. Specific discharge (discharge per unit catchment area) was calculated using catchment areas derived from the deterministic 8 (D8) algorithm based on a 2×2 m resolution DEM, in which we first burned the ditches into the digital elevation model (DEM) to the depth of 0.5 m (Whitebox GAT 3.3) (Laudon et al., 2021). For this study, we only utilized discharge data from the C4 control site due to its proximity to the rewetted site. At C4, the outlet is equipped with a similar V-notch weir situated within a heated dam house, facilitating continuous stage height monitoring year-round. Discharge measurements and calibrations followed the same protocol and interval as those implemented at TEA (Laudon et al., 2021).
Rainfall data were acquired from a reference climate station at Svartberget Research Station (64.244376° N, 19.766378° E; 225 m a.s.l.) (Laudon et al., 2021). Rainfall measurements were logged every 10 min using a tipping-bucket rain gauge (ARG 100, EML, UK). The climate station is integral to the reference climate monitoring program at Vindeln experimental forests, adhering to the World Meteorological Organization (WMO) standard for meteorological measurements (Karlsen et al., 2019).
2.5 GWL analysis
First, the hourly groundwater data were examined for outliers, and any gaps were filled using the Generalized extreme Studentized deviate (ESD) filter (Rosner, 1983). The algorithm processes a time-series dataset by calculating a rolling mean and standard deviation with a window size of 6 h. Outliers were identified by comparing each data point to the moving average, and values exceeding the 3-standard-deviation threshold were identified as outliers and subsequently removed from the dataset. Subsequently, the data were gap-filled using the Spline interpolation method, an advanced form of interpolation that utilizes piecewise polynomial functions to estimate data between two known points. The data were aggregated to daily timescales. For our analysis, we used the GWL data from 1 June to the end of October, as our study focused on rainfall events; outside this period, precipitation often occurs as snow and dipwells could be frozen. For each catchment R1 and R2, the GWL data were averaged, and pairwise comparison tests were conducted to assess if there were any significant differences between pre-rewetting and multiple post-rewetting years. As the data were not normally distributed and we were interested in the distribution of the data and not the means, the non-parametric Wilcoxon tests were used. Then, a Bonferroni–Holm correction was applied to adjust for multiple comparisons. The differences were considered significant when p<0.05. Moreover, to examine the impact of rewetting on GWL at all distances from the main ditch, data were disaggregated based on distances of 10, 50, and 100 m to the main ditch. It is noteworthy that additional side ditches existed in the proximity of some of the dipwells, indicating a potential limitation in the study design.
2.6 Rainfall-runoff-event detection
As a first step, we segmented the 2020–2023 summer–autumn precipitation record into distinct rainfall events using the inter-event time definition (IETD) via the IETD R package (Duque, 2022). The IETD establishes a minimum dry period between independent rainfall events as a criterion for grouping them. To distinguish independent rainfall events from continuous precipitation, we set a minimum threshold of 0.1 mm h−1 at the start of an event. Events were considered distinct if they were separated by at least 12 h without rainfall. The methodology for identifying runoff events was based on the framework outlined by Luscombe (2014) and was further adapted to the specific characteristics of our study area. Runoff events were defined as periods during which the observed discharge exhibited significant deviations from the baseflow. Rainfall events were matched with the runoff events that followed within a specified time window (12.5 h). We calculated rolling quantiles for this time window (12.5 h) at the 30th and 95th percentile (Q30th and Q95th, respectively). A rolling quantile for the 70th percentile for a 1-month period was also calculated (MQ90). Where (Q95th–Q30th) > MQ90, the flow was considered to be elevated and any fluctuation in flow was driven by precipitation; therefore, measured discharge was used (Gatis et al., 2023; Puttock et al., 2021). A final, visual inspection of the time series with detected events was used to quality control these data and ensure that all significant rainfall and flow events were extracted from the dataset.
2.7 Flood mitigation effects
To evaluate the flood mitigation effect of peatland rewetting and determine its impact, we employed a set of response metrics to characterize hydrologic responses during events following the rewetting process. These response metrics included event duration, rainfall volume, peak flow, runoff coefficient, lag time, and HSI. We calculated these response metrics for both the rewetted and control sites. The selection of these response metrics was based on their widespread use in hydrological comparison studies (Edokpa et al., 2022; Wilson et al., 2011). Peak flow response was computed as the maximum discharge observed during each event. Runoff coefficient was determined as the ratio of total event runoff to total event rainfall. Lag time was calculated as the time between peak rainfall and peak discharge in each event. HSI, defined as the ratio of peak storm discharge to total storm discharge, was used to provide a straightforward measure of the overall hydrograph shape (Shuttleworth et al., 2019). The response metrics for the rewetted catchment R2 and the control site were derived using the start and end times of rainfall-runoff events identified at the R1 catchment.
2.8 Statistical analyses
The statistical design used in this study focuses on the BACI approach (before–after and control–impact) as used previously in hydrological studies (Holden et al., 2017; Laudon et al., 2023; Menberu et al., 2018; Shuttleworth et al., 2019). We standardized the response metrics derived from the two catchments (R1 and R2) of the rewetted site against the control catchment (treatment minus control) to distinguish responses resulting from rewetting treatment from natural variation, changes over time, and seasons. Due to variations in the frequency of events between the pre- and post-rewetting periods, and the non-normal distribution of response metrics, a non-parametric test was employed. Specifically, the Wilcoxon test was conducted to investigate statistically significant changes in the distribution of data for each catchment (R1 and R2) of the rewetted site before and after rewetting, with a focus on understanding the extremes, rather than solely examining means (Shuttleworth et al., 2019). Significance was determined at p<0.05. Additionally, we aggregated all years post-rewetting together due to the highly variable number of events occurring during each year post-rewetting. Statistical analysis was undertaken in R version 4.1.2. (R Core Team, 2021), with data processing, summary statistics, and plotting undertaken using the R package tidyverse (Wickham, 2016).
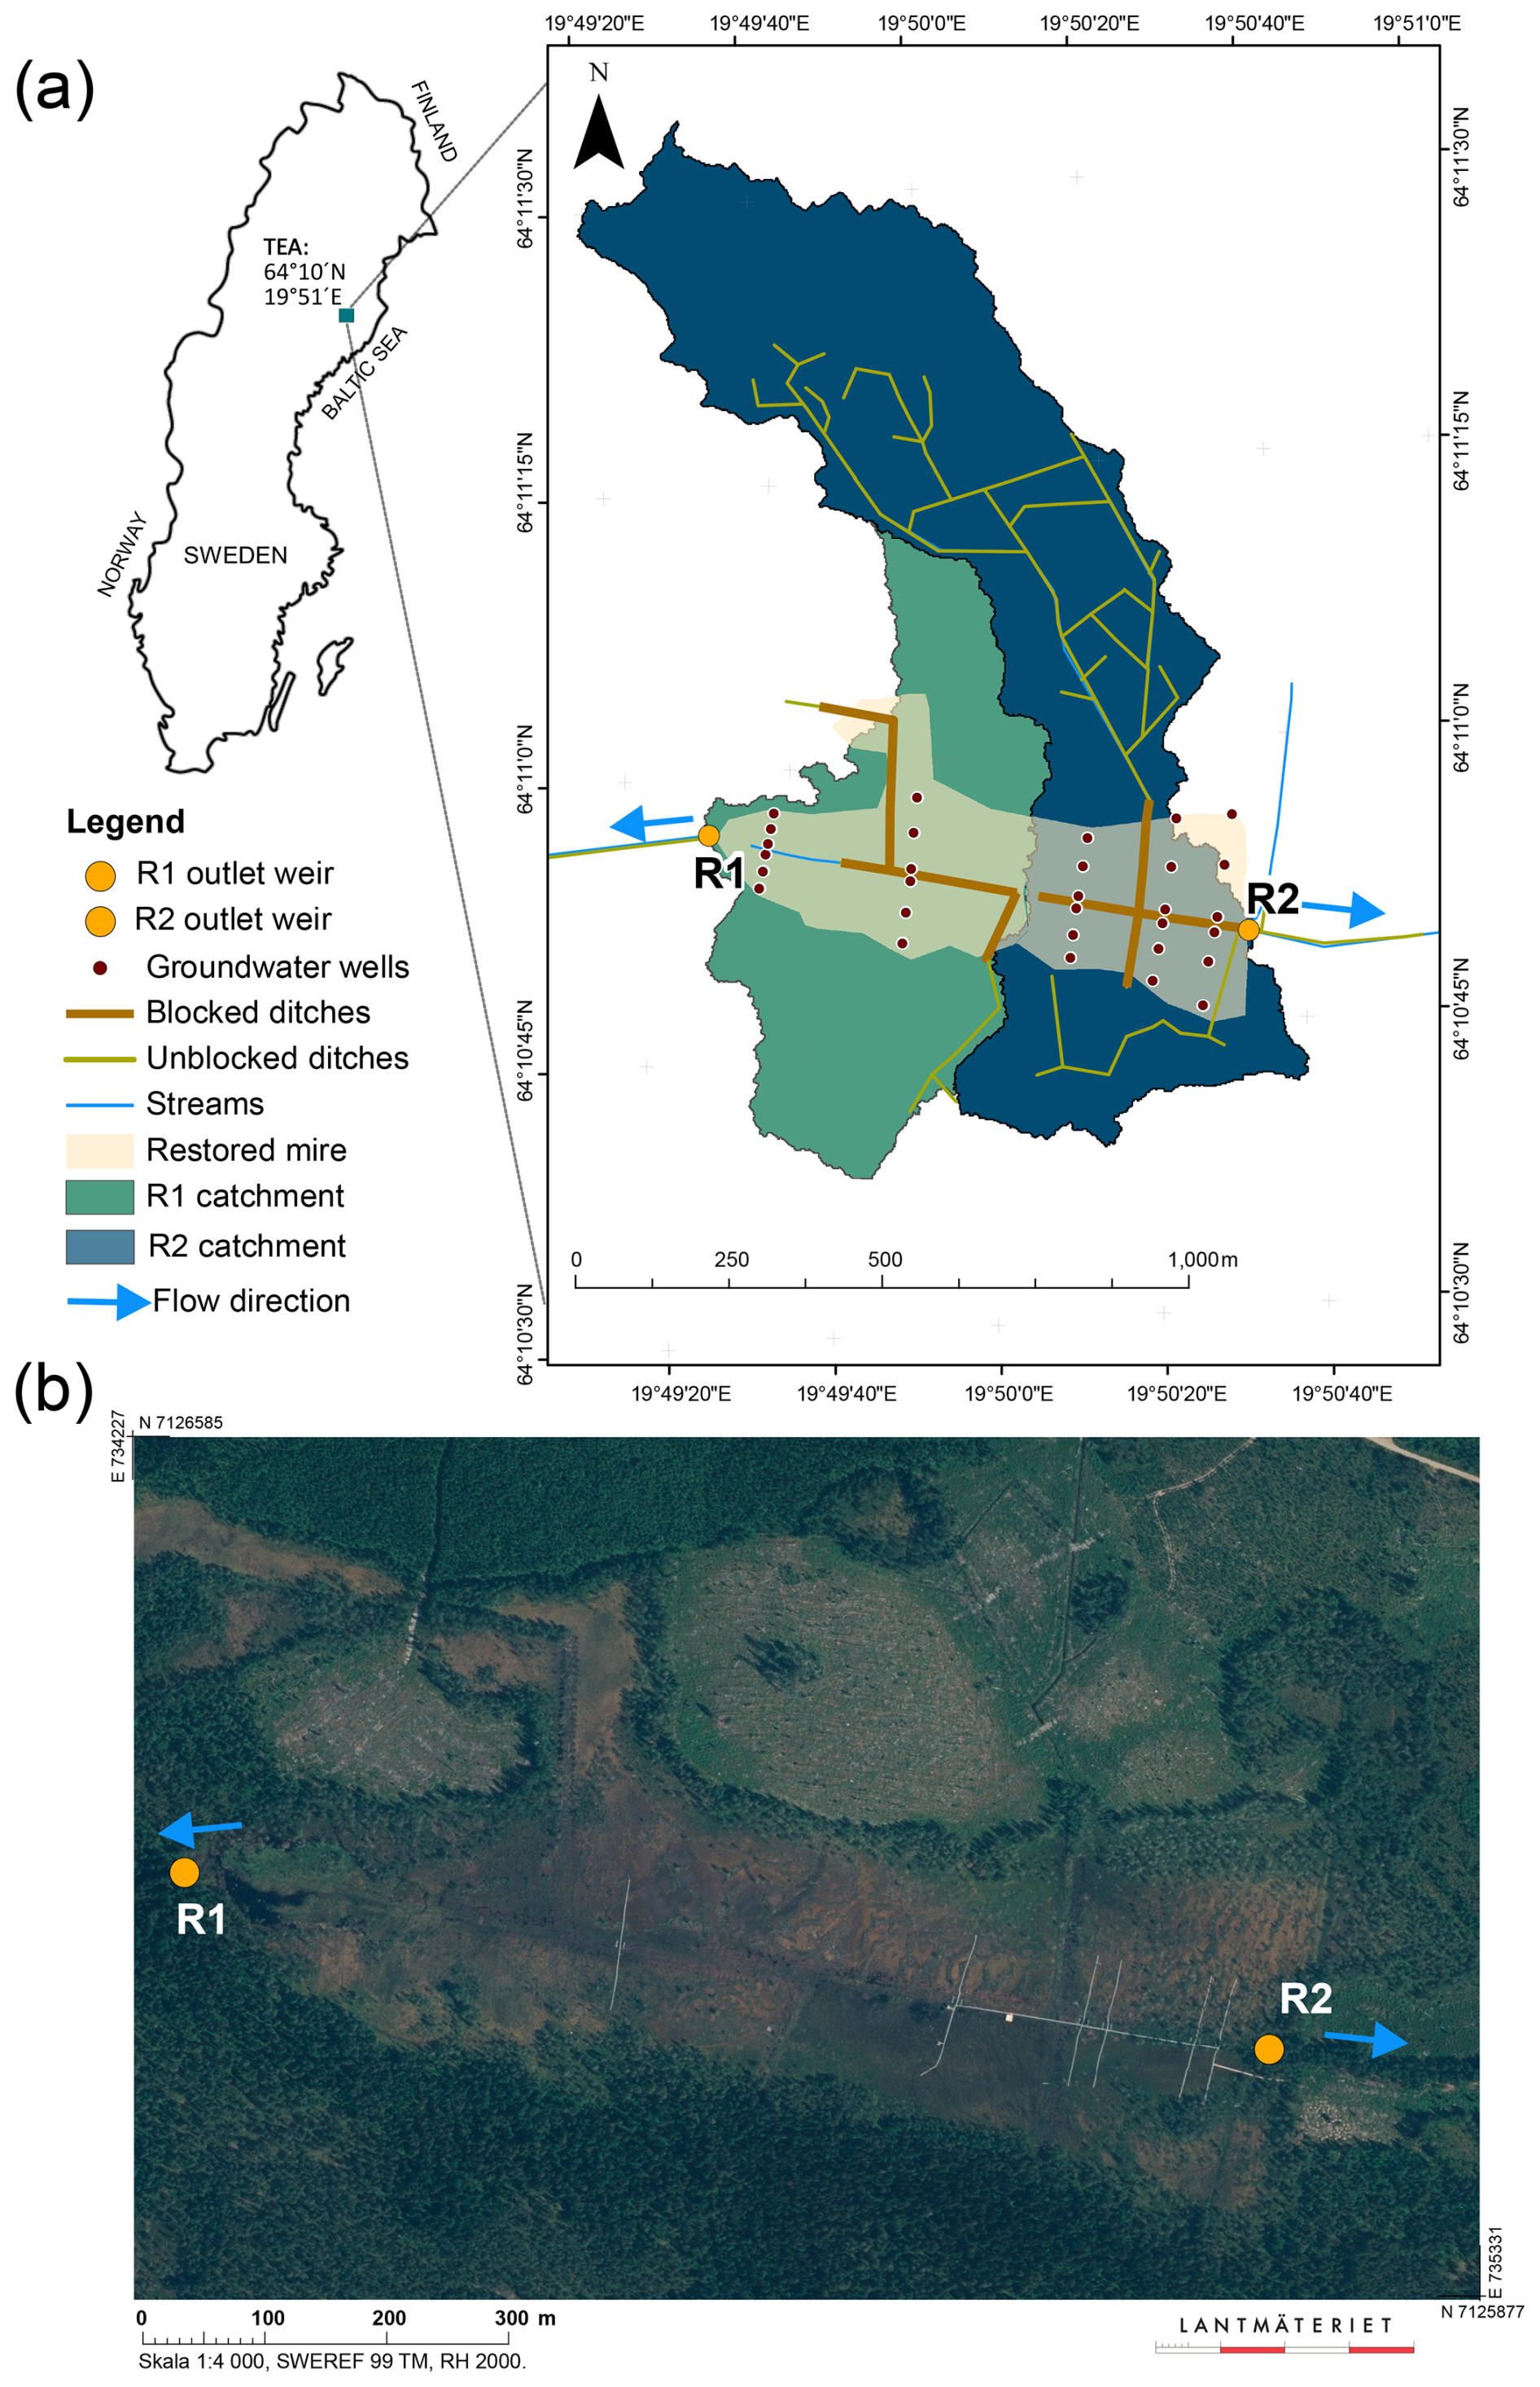
Figure 1Trollberget Experimental Area (TEA) catchments with monitoring locations (a). Yellow circles show the locations of the outlets of the catchment areas for R1 and R2 (weir locations) of the rewetted peatland. Red small circles designate groundwater dipwells. Note that in R1, 59 % of the ditches were blocked, while in R2, only 16 % of the ditches were blocked. Aerial view of the rewetted peatland with boardwalks visible as white lines (b) (aerial map from Lantmäteriet).
3.1 The impact of rewetting on GWL variation
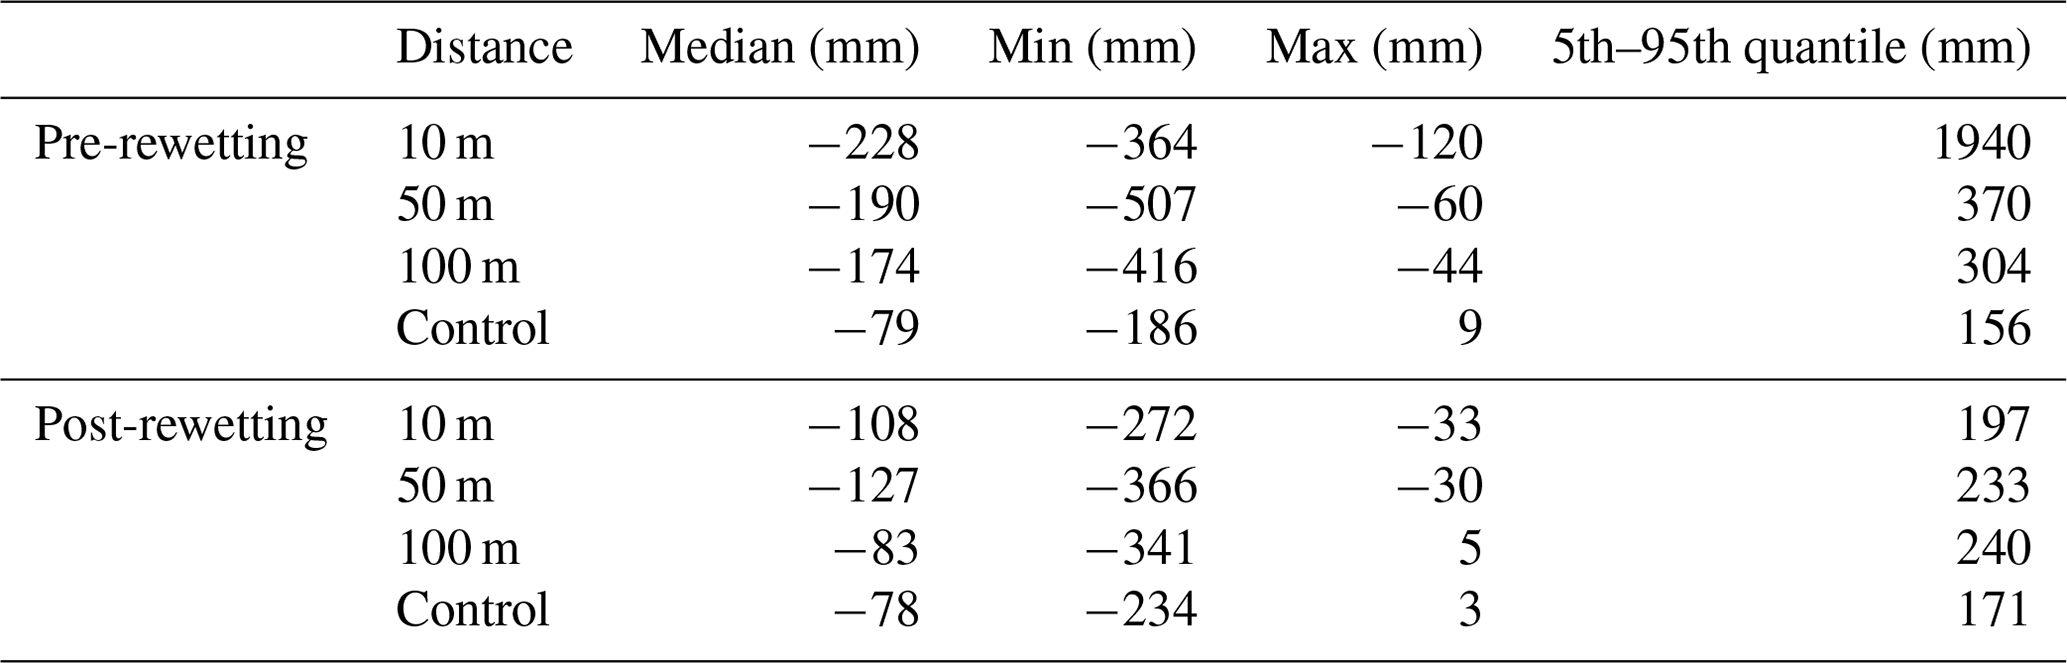
Peatland rewetting led to a significant increase in GWL at the two rewetted catchments (R1 and R2) compared to the control site (Fig. 2a). The relative difference in GWL between the rewetted and control sites (treatment minus control) at varying distances from the ditch also showed a significant decrease after rewetting (Fig. 2b). Interestingly, this impact demonstrated variability depending on the distance from the ditch, with wells located closest to the ditch showing a more pronounced response compared to those farther away. Prior to rewetting, the median GWL was significantly (p<0.05) lower next to the ditch (−228 mm) compared to the furthest distance away (−174 mm). Furthermore, GWL exhibited greater variability in the middle of the transect (50 m from the ditch), reaching a minimum of 507 mm from the ground. After rewetting, the largest median GWL change was observed at a distance of 10 m, with an increase of 119 mm. This was followed by a median 91 mm increase at a distance of 100 m and a median 62 mm increase at a distance of 50 m. The median GWL at the control sites was similar during the pre- and post-rewetting periods (−79 and −78 mm, respectively). Finally, GWL at the three different distances from the ditch significantly increased in the first year after rewetting, significantly increased further in the second year, and significantly decreased in the third year; however, it remained significantly higher than the pre-rewetting and first year post-rewetting GWL.
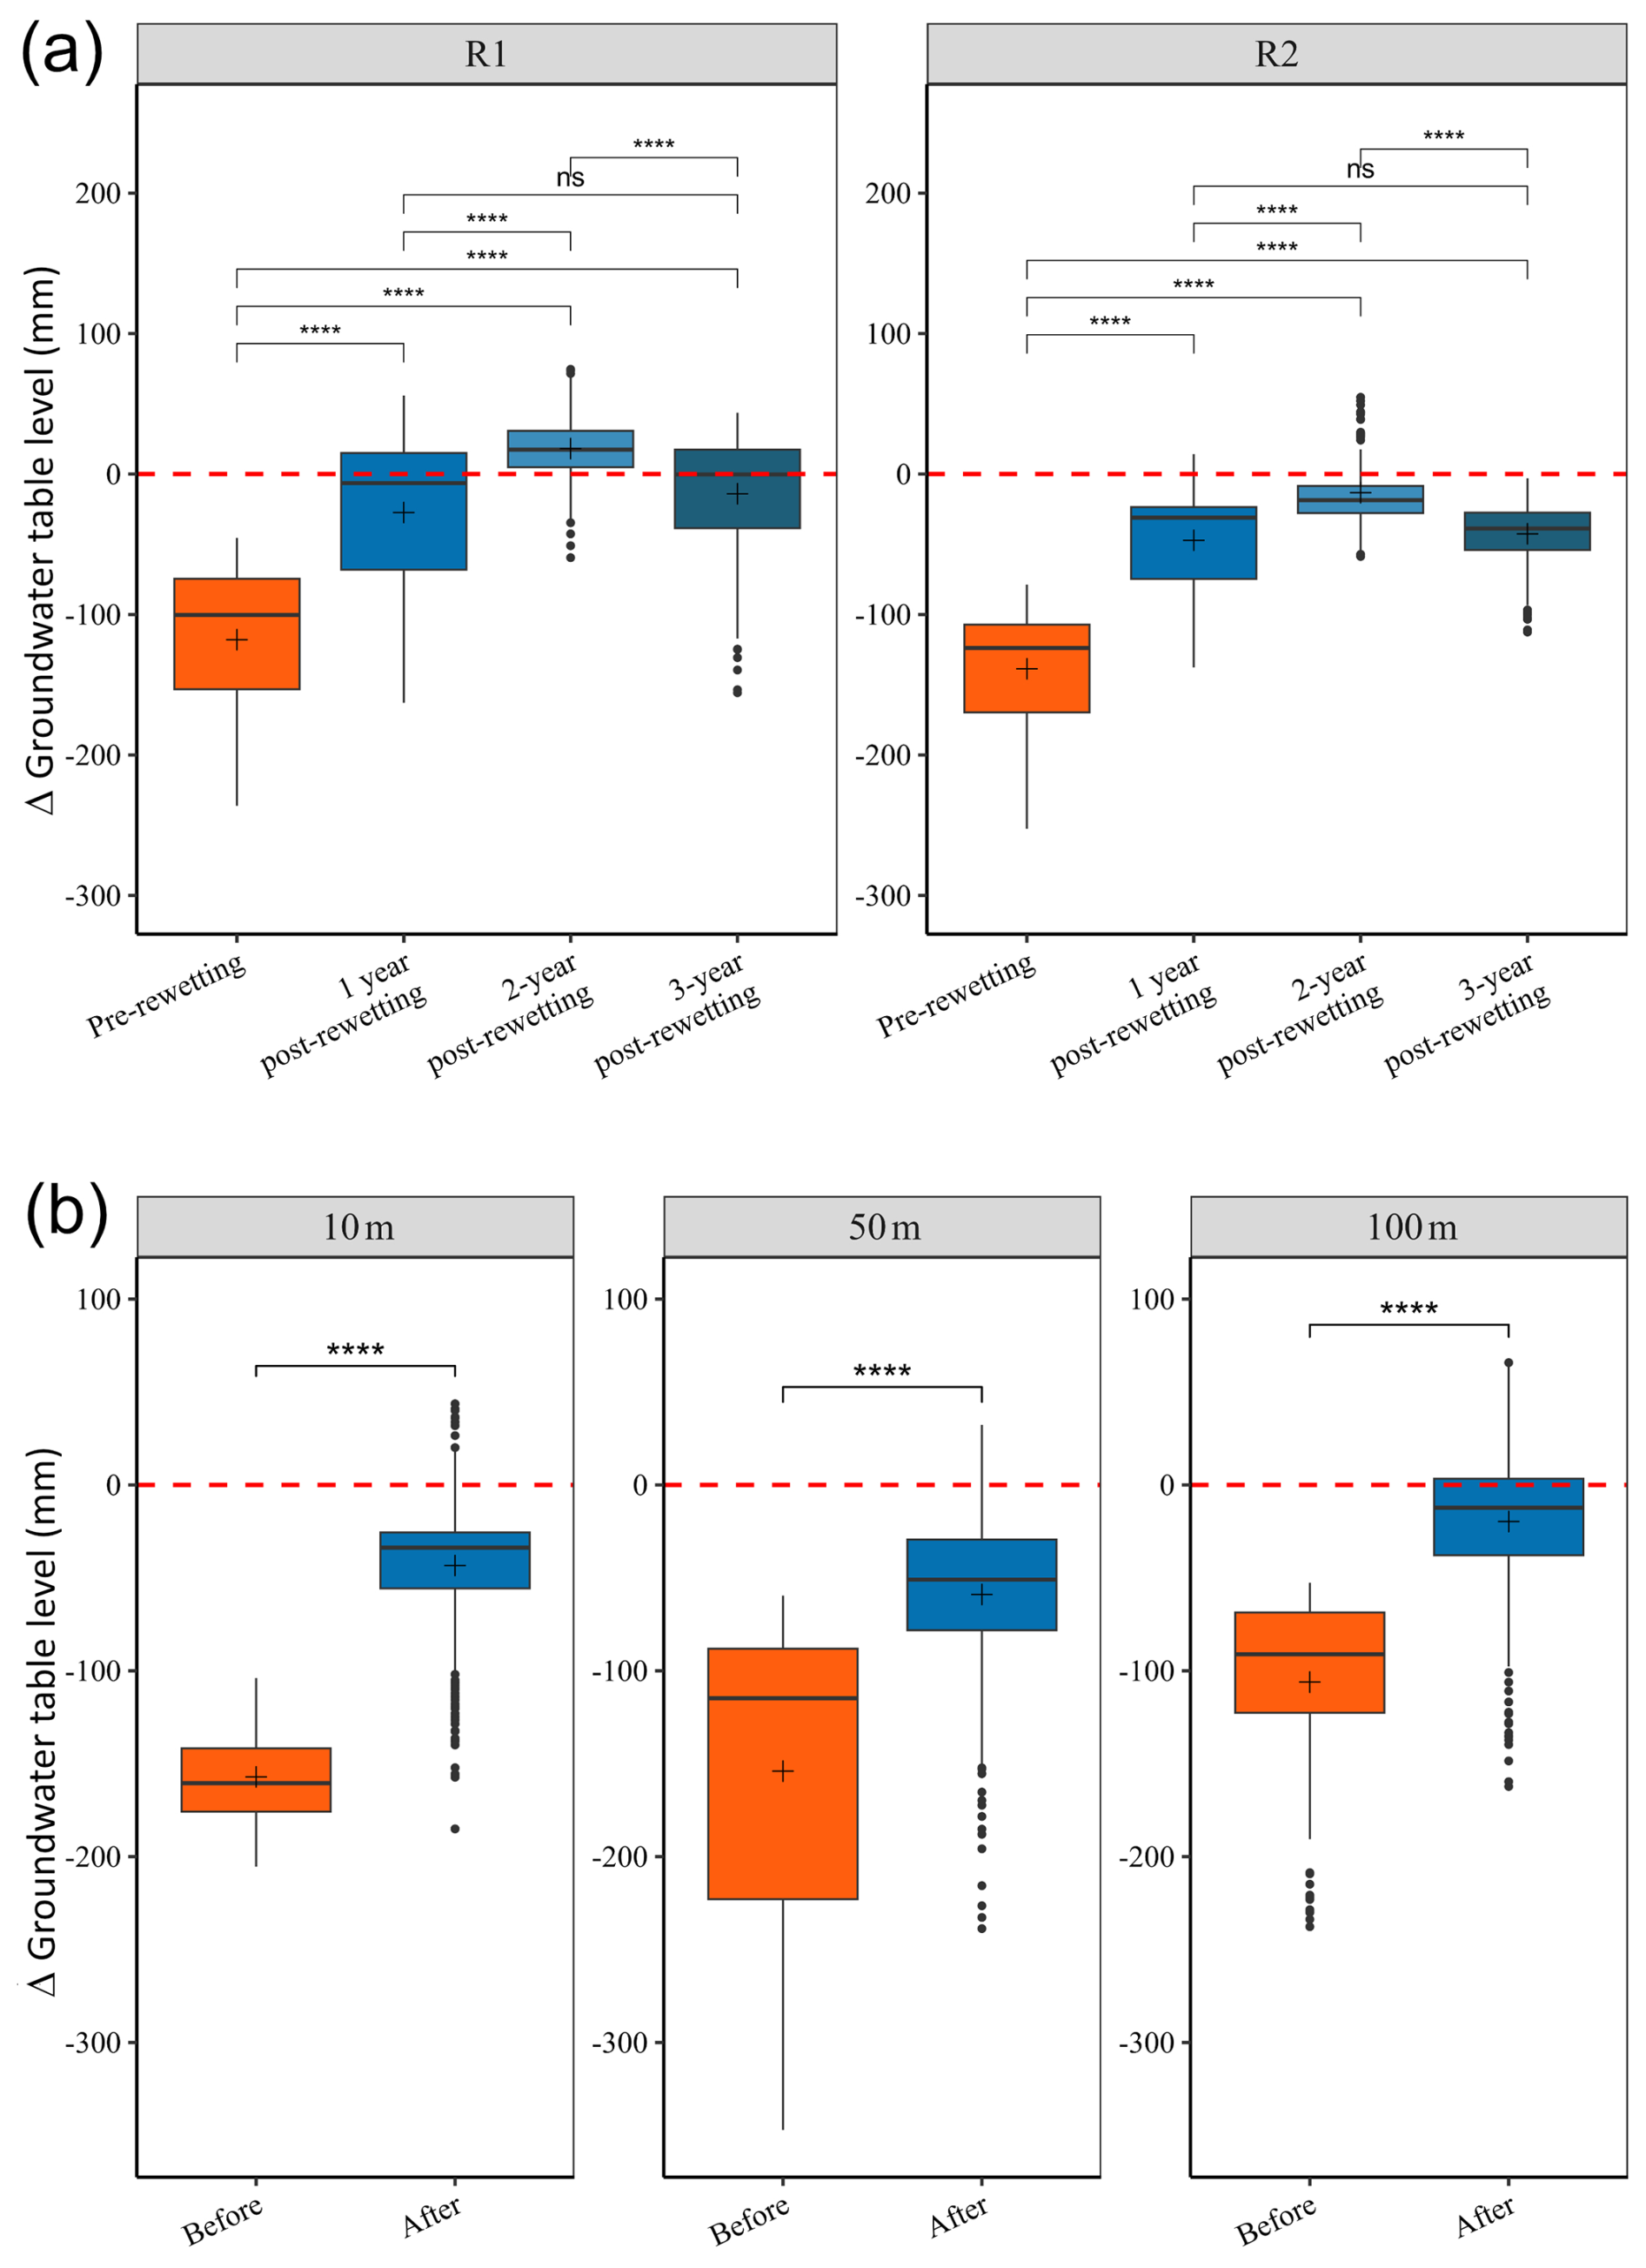
Figure 2(a) Difference (treatment–control) in groundwater table level (GWL) at the two rewetted catchments (R1 and R2) based on daily data gathered between June and October in the years 2020 (pre-rewetting) and 2021, 2022, and 2023 (3 years post-rewetting) regardless of distance to the ditch. (b) Relative difference in GWL based on varying distances to the main ditch (i.e., 10, 50, and 100 m); all years post-rewetting are combined (sample sizes for pre-rewetting and post-rewetting were 153 and 428, respectively). The dashed red line indicates the GWL of the control site; positive values indicate that the GWL is higher at the rewetted site than at the control, while negative GWL indicates the opposite. The box plots show the minimum, first quartile, median, third quartile, and maximum, with outliers as dots. The stars indicate the levels of significant difference between the marked comparisons as determined using a Wilcoxon test ( p≤0.0001).
Table 1Median, minimum (min), maximum (max), and 5th–95th quantile of groundwater level (GWL) change pre- and post-rewetting for different distances to the ditch (i.e., 10, 50, and 100 m) and the control site.
3.2 The impact of rewetting on runoff responses
Based on the response at R1, 17 rainfall-runoff events before and 30 events after rewetting were extracted and analyzed (Fig. 3). The impact of rewetting on runoff responses during rainfall-runoff events is depicted through examples of event-scale hydrographs (Fig. 4, Table S1). The illustrations display the variation in discharge response across the control and the two rewetted catchments (R1 and R2) for different event sizes and antecedent GWL conditions, during both pre- and post-rewetting periods. In the pre-rewetting period, despite the control site having the shallowest GWL at −15 mm, it exhibited the smallest peak flow of 0.29 mm h−1. In contrast, the rewetted site R1, with an antecedent GWL of −82 mm h−1, reached a peak of 0.93 mm h−1. A period of 1 and 2 years after rewetting, R1 still had the highest peak flows at 0.71 and 0.61 mm h−1, respectively, while the rewetted catchment R2 showed similarities to the control site (Fig. 2). However, 3 years after rewetting, although R1 had the shallowest antecedent GWL at −5.15 mm, the peak flow was almost half of the peak in the control catchment (0.14 and 0.26 mm h−1, respectively).
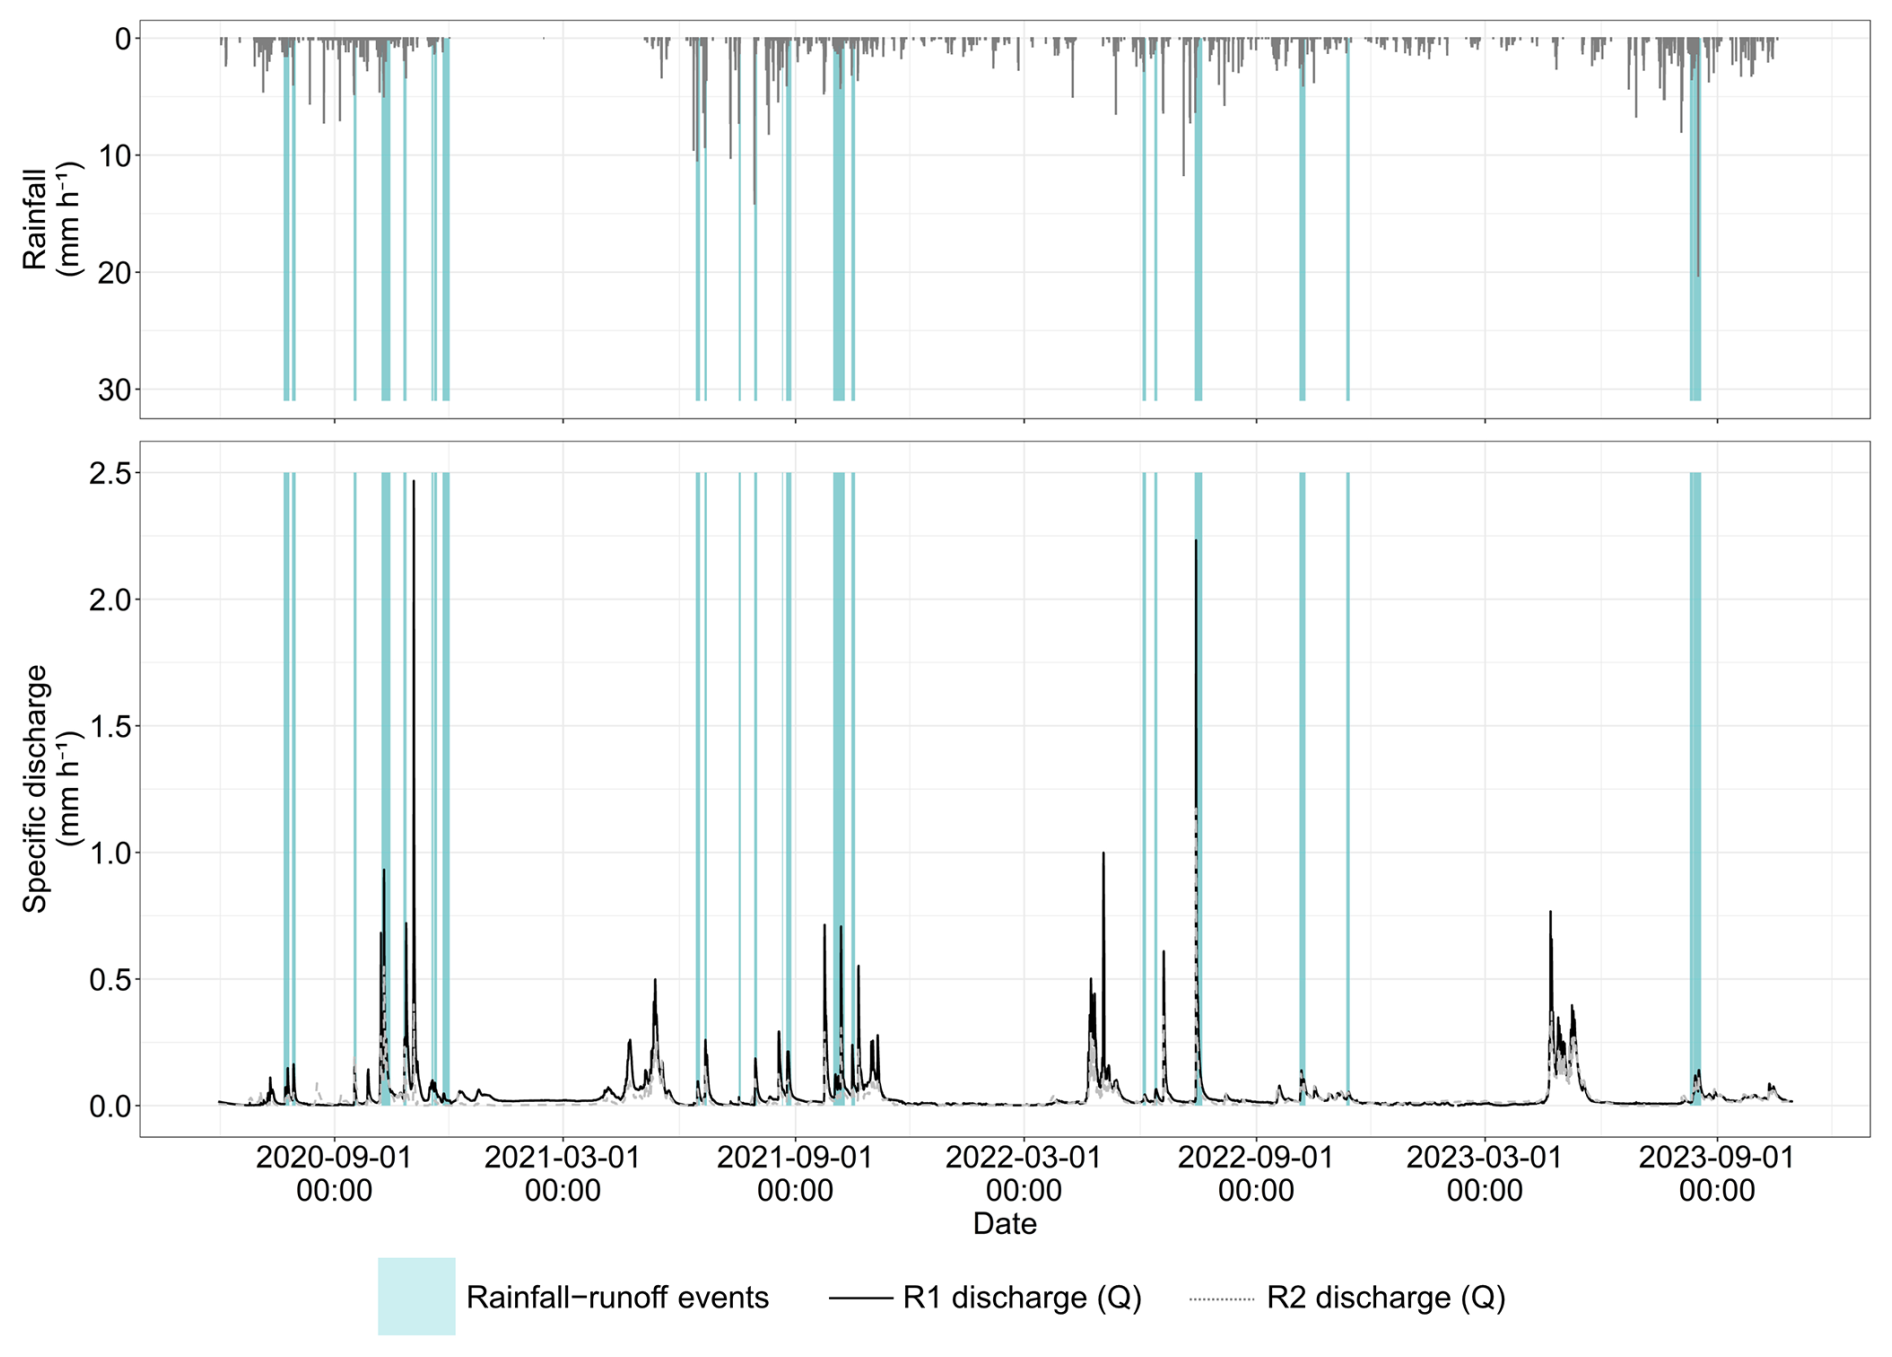
Figure 3Identified rainfall-runoff events using discharge measured at the rewetted catchment R1 across the entire study period (black line). The same rainfall-runoff events identified using R1 discharge are shown for R2 (grey line).
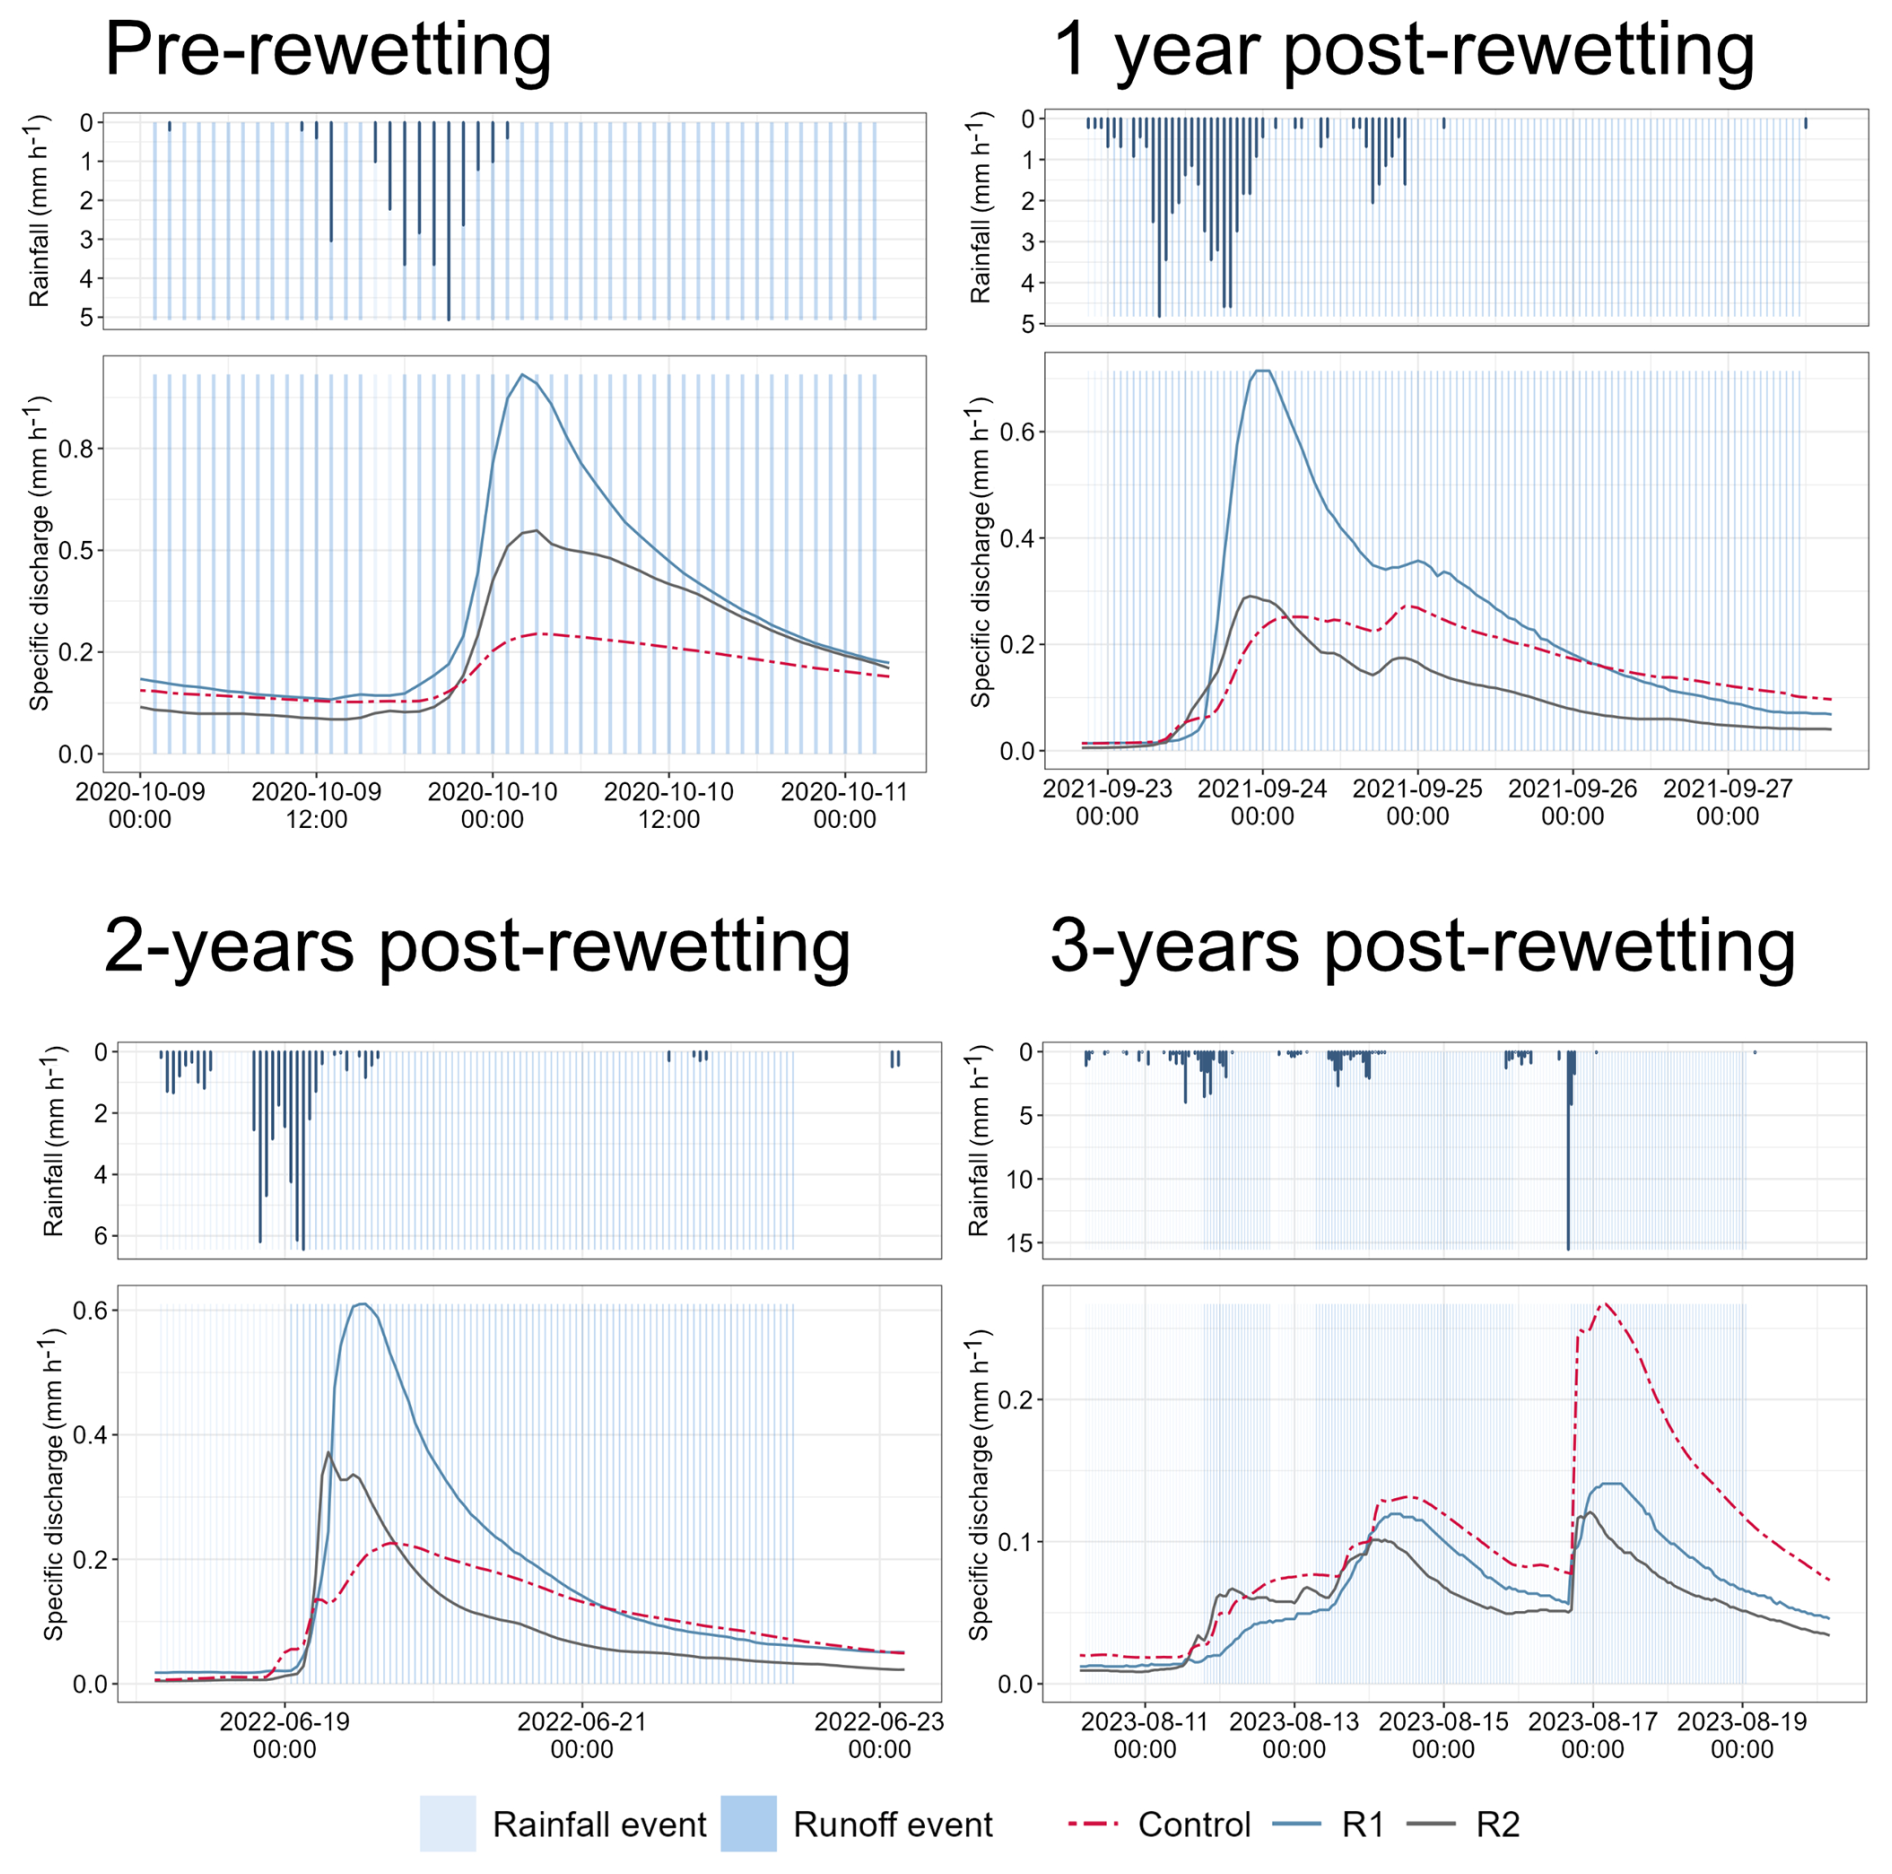
Figure 4Examples of runoff responses of the control and the two catchments (R1 and R2) of the rewetted site during rainfall-runoff events for each of the 4 pre- and post-rewetting years. Note that the scales for the y axes show different magnitudes of specific discharge.
3.3 Flood mitigation effects of rewetting
The magnitude of the effects of peatland rewetting was investigated for 47 rainfall-runoff events (17 events before rewetting and 30 events after rewetting) to test whether the rewetting effects were significant under a larger number of events. Storm magnitudes ranged between 5 and 50 mm in total precipitation before rewetting and between 2 and 63 mm after rewetting. The relative differences between the two catchments (R1 and R2) of the rewetted site and control sites (rewetted minus control) for each metric are shown in Fig. 5.
The analysis of rainfall-runoff events revealed a reduction in relative peak flow at the two catchments (R1 and R2) of the rewetted site following rewetting (Fig. 5a). However, the reduction was significant only at R1. Specifically, the median peak flow at R1 decreased from 0.14 to 0.10 mm h−1 post-rewetting. In contrast, at R2, there was an increase from 0.04 to 0.08 mm h−1 post-rewetting. Interestingly, the control site experienced a rise in median peak flow from 0.05 to 0.12 mm h−1 during the post-rewetting period.
The median runoff coefficient in the two catchments of the rewetted site showed an increase from 0.36 to 0.40 and from 0.14 to 0.20 at R1 and R2, respectively, after rewetting. The runoff coefficient at the control site increased from 0.17 before rewetting to 0.40 after rewetting. Relative to the control site, both restored sites, R1 and R2, experienced a decline in runoff coefficients during the post-rewetting phase. Notably, this reduction was statistically significant solely at R1 (p<0.01) (Fig. 5b).
After rewetting, the median lag time in the two catchments (R1 and R2) of the rewetted site decreased by 0.5 and 7 h, reaching 15 and 10 h for R1 and R2, respectively. In contrast, the control catchment exhibited an increase in median lag time from 14 to 23 h during the post-rewetting period. However, pairwise test results indicated that there was no statistically significant change at either of the rewetted catchments (R1 and R2) following rewetting (Fig. 5c).
The median HSI values for both catchments (R1 and R2) of the rewetted site and control sites decreased after the rewetting period, shifting from 0.023 to 0.021, 0.034 to 0.025, and 0.027 to 0.026 at control, R1, and R2, respectively (Fig. 5d). The effect of rewetting in reducing HSI was significant only at R1 (p<0.0001). Prior to rewetting, the relative HSI at R1 was 0.012, and after rewetting, it decreased to 0.003. The relative HSI also experienced a decline at R2, dropping from 0.006 pre-rewetting to 0.004 after rewetting. However, this decrease was not statistically significant.

Figure 5Differences between the rewetted and control sites pre- and the combined 3 years of post-rewetting period for (a) peak flow, (b) runoff coefficient, (c) lag time, and (d) hydrograph shape index. The relative difference was computed as treatment minus control, and the dashed red line indicates the value of the control site; thus, positive values indicate that the hydrological response is greater at the treatment site than at the control site, while negative values indicate the opposite. The box plots show the minimum, first quartile, median, third quartile, and maximum, with outliers as points. The stars indicate the levels of significance in the Wilcoxon test ( p≤0.01; p≤0.001; “ns” denotes not significant).
Despite significant interest in peatland rewetting, there has been limited research on its effects on hydrological functioning and the scale of these impacts. We found that peatland rewetting on nutrient-poor minerogenic fens, one of the most common peatland types in Fennoscandia, was generally positive for use as natural flood management. Rewetting has begun to influence GWL, runoff responses during rainstorms, and flood mitigation (though the latter was observed in only one of the two study catchments), while also shifting these hydrological characteristics closer to pristine conditions by increasing water storage in the peatland. However, special attention should be given to the diverse characteristics of peatlands in the boreal biome before generalizing the effect of peatland rewetting on hydrological functioning.
4.1 The impact of rewetting on GWL
Using the BACI experimental approach, we found that the mean GWL of the rewetted sites rose rather rapidly after ditch blocking at both R1 and R2 to the near pristine levels of our control site. Our results align broadly with several other studies, mainly from Finland, Canada, and the UK, that found that peatland rewetting raised GWL to near pristine levels (Armstrong et al., 2022; Dixon et al., 2014; Haapalehto et al., 2014; Howie et al., 2009; Menberu et al., 2016; Shuttleworth et al., 2019; Soomets et al., 2023). Notably, GWL rose in all studies, despite variation in the extent of recovery; climate; and drainage conditions, such as age, depth, and pattern of ditching. Nevertheless, peatland type is likely to have a major impact on the time taken to increase GWL to pristine-like levels after ditch blocking. For example, fen peatlands, such as our system, with a rather flat or slightly domed surface and slow lateral movement of water, could have a faster response to ditch blocking compared to blanket bogs, which may exist even on slopes of 20 to 25° (Laine et al., 2011). Furthermore, our results also revealed that the median GWL at R1 closely resembled that of the control site after rewetting. However, at R2, the median GWL remained slightly lower post-rewetting. This difference may be attributed to the presence of shrubs and sparse tree cover (higher water uptake) on the mire at R2, as well as a lower proportion of blocked ditches within the catchment. However, as found by Howie et al. (2009) in Southwestern British Columbia, the difference between the effect of rewetting on GWL between the two catchments could also be attributed to differences in the drying of the peatland. This, coupled with shrinkage and subsidence of the peat, could lead to a reduction in hydraulic conductivity, possibly hindering the effectiveness of restoration efforts in reversing the impacts of drainage.
Our results addressed a gap in the existing literature by examining the spatial variability of GWL recovery at different distances from the ditch, a factor largely neglected in prior research, particularly within the context of boreal ecosystems (Bring et al., 2022). After rewetting, our results show a significant increase in GWL at all distances from the ditch. However, with spatial variation, these detailed spatial results of GWL increase at different distances to the ditches show that all of the locations in the mire had undergone rewetting, and any observed differences in event runoff responses could be attributed to changes in GWL and water storage within the full extent of the peatland. Furthermore, we found that after rewetting, significant differences persisted between locations, with the highest GWL found at the furthest distance (i.e., 100 m), contrary to most other published studies that have found that the impact of rewetting on GWL diminishes with increasing distance from the main ditch (Bring et al., 2022). This difference in GWL between distances from the ditch might be a topographic effect, where peat surfaces could be at higher elevations at the farther distance due to long-term consolidation of the peat near ditches, and therefore the absolute GWL was also higher at the farther distance (Holden et al., 2017). Either way, our results showed that rewetting was successful in returning the pristine-like patterns of higher GWL; however, restoration must also intend to reach an even GWL throughout the mire, which we expect to see with time (Haapalehto et al., 2014; Laine et al., 2011). Furthermore, our data serve as a valuable resource for peatland managers, especially in boreal ecosystems, helping to gain a better understanding of site-specific changes in hydrology and the associated ecosystem services that result from the rewetting of peatlands.
4.2 The impact of rewetting on runoff responses
Event-based analysis of discharge responses provides important information on treatment effects on the hydrological functionality. Relying solely on daily discharge analysis does not offer much insight into discharge responses to precipitation, including the lag time to peak flow. For instance, examining the hourly hydrograph revealed that discharge responses at R1 exhibited flashier characteristics with higher peaks compared to those at R2, yet R2 did not show a significant difference in the overall decrease in relative peak flow after rewetting. This discrepancy could possibly be attributed to the smaller increase in GWL of R2 compared to R1, likely influenced by a lower proportion of blocked ditches in the catchment, the re-creation of the open-water pond in R1, or the fact that the relative peak flow at R2 before rewetting was already similar to the control peatland. Specifically, the re-creation of the old open-water pond ca. 100 m from R1 outlet after rewetting could potentially be functioning as a “natural peatland pool”, hence influencing runoff responses (Arsenault et al., 2019). Nonetheless, 3 years after ditch blocking, both catchments showed attenuated hydrograph shapes during most storm events. These changes in the hydrograph characteristics following rewetting indicate that hydrological restoration positively affects overall flow regimes, influencing flow pathways and water storage within the peat, leading to reduced peak flow and increased hydrological residence time in the peatland (Gatis et al., 2023). However, the scarcity of continuous, prolonged datasets from rewetted peatlands, particularly for boreal minerogenic fens, poses a significant challenge in conducting comprehensive comparisons across various peatland sizes, types, and rewetting durations, as most rewetting projects have only recently commenced. Therefore, a more extended period of post-rewetting monitoring is necessary to fully understand how the discharge patterns of drained peatlands evolve after rewetting.
4.3 Flood mitigation effects of rewetting
Rewetting resulted in a significant reduction in event peak flow response at R1. It is noteworthy that, although there was a significant decrease, the median relative peak flow at R1 after rewetting was still higher than the control. This is in contrast to R2, where the decrease in peak flow was not significant but where the median peak flow started out similar to the control mire but decreased to be somewhat lower than the control after rewetting. Our findings align with the results observed by Wilson et al. (2011), where they showed peak flow hydrographs from ditches with considerable change after rewetting, with lower peak flow rates, less runoff, and rainwater being released during events. In contrast, Shantz and Price (2006) evaluated the hydrological characteristics of a restored peatland in Quebec, Canada, and observed higher discharge peaks during summer at the restored site compared to the control site. They attributed this to wetter antecedent conditions and faster drainage response following rainfall. Conversely, our research reveals that, despite observing a rise in GWL after rewetting, rewetted peatlands can exhibit less intense flood responses and offer improved retention of rainfall. Moreover, although reduced runoff rate following restoration inevitably increases the chances of overland flow, this pathway is considerably slower than flow through the drainage networks, and therefore, restoration may lead to a reduction in peak flow magnitude (Grand-Clement et al., 2013). Here, the old open-water pond, functioning as a peatland pool, could potentially increase runoff detention and therefore reduce peak flow (Arsenault et al., 2019; Kløve, 2000). Finally, it is noteworthy that, even before rewetting, our system was already dominated by Sphagnum spp.; therefore, compared to other degraded (especially bare) peatlands, our system had a higher potential for reducing sheet erosion and downstream flood peaks after rewetting (Holden et al., 2008). Either way, our results suggest that, contrary to conclusions drawn in many previous studies (Holden et al., 2004; Holden and Burt, 2003), the rewetted peatlands in our study exhibited more controlled and resilient hydrological behavior, delivering “natural flood management” by attenuating downstream flow and reducing flood risk. Yet, our results could be affected by the short time period since rewetting. With time, the peatland might respond differently depending on the type of newly established vegetation and initial moisture conditions, where rainfall events could trigger rapid and concentrated runoff and discharge (Holden and Burt, 2003).
Runoff coefficient is another key indicator for flood mitigation and corresponds to catchment storage capacity. Specifically, a reduction in runoff coefficient indicates a gain in storage capacity either behind the dam in the blocked ditches or due to increased surface roughness, which then reduces the drainage efficiency, thereby increasing water storage capacity (Menberu et al., 2016). Our results showed that the reduction in runoff coefficient was significant at R1, showing less runoff being exported with rainfall events after rewetting. Yet again, this reduction was not significant at R2, and the same patterns follow, where the initial condition of the runoff coefficient of R2 was lower than the control mire before rewetting, and after rewetting the coefficient decreased even further. In line with our results, the reduction in runoff coefficient after peatland rewetting has been reported in many studies (Ketcheson and Price, 2011; Shantz and Price, 2006; Wilson et al., 2011), in some to the extent of being the most significant hydrological effect of peatland rewetting (Ketcheson and Price, 2011). However, caution is needed in interpreting some of these results due to the potential influence of the relatively short time series during which the peatland could still have been undergoing filling (Ketcheson and Price, 2011) or an eventual increase in the runoff coefficient due to a declining efficiency of the ditch blocking (Menberu et al., 2018).
An increasing lag time traditionally serves as a positive indicator for flood modification, as downstream flow becomes less “flashy”. Contrary to expectations, the lag time between the initiation of a rainfall event and the peak discharge decreased after rewetting in both rewetted catchments. However, it is important to note that this decrease, while observed, was not statistically significant for either catchment. A shorter lag time may support the interpretation that flow peaks observed after rewetting originated from the near vicinity of the monitoring site, while water from upstream areas was attenuated before reaching the outlet (Gatis et al., 2023). These explanations could be further supported by coupling these results with the positive effect on base flow that has been seen in our study site (Karimi et al., 2024). Finally, HSI, which serves as a direct indicator of system flashiness, exhibited a notable decrease at the R1 catchment following rewetting. Unlike the pattern observed in R2's response to other hydrological factors, the HSI at R2 was higher than that of the control site. Although R2 showed a non-significant reduction after rewetting, it remained consistently higher than the control. This reduction seems to be a combined effect of ditch blocking and the presence of vegetation, as other studies have shown that ditch blocking by itself does not appear to alter the “flashiness” of stormflow (Shuttleworth et al., 2019).
The significant decreases in peak flow, runoff coefficient, and HSI observed at R1, compared to the non-significant changes at R2, can be attributed to several factors. Firstly, the BACI analysis indicated that, prior to rewetting, R1 had flashier hydrological responses. Moreover, R2's responses were already more similar to the control site, suggesting less potential to observe a significant post-rewetting effect. Additionally, a smaller portion of R2 catchment was restored compared to R1, which could mean that the overall water storage at R2 remained lower than at R1. Consequently, water may still drain more quickly at R2, leading to less noticeable impacts from the rewetting efforts. Furthermore, as mentioned above, the differences in responses could, in part, be due to the recreation of the peatland pool that likely influences runoff detention. All in all, the diverse responses observed in flood response characteristics, both in our study and other investigations, raise questions regarding the overall effectiveness of peatland rewetting, at least in the short term. While it appears successful in reducing peak flow, runoff coefficient, and overall flashiness of hydrographs (as shown by HSI), our results suggest it might not be as effective in increasing lag time from peak rainfall to peak flow occurrence. This limitation could potentially be attributed to the need for new peat formation before becoming fully hydrologically restored. Hence, a crucial question regarding the duration of these effects and the time necessary for lag time recovery remains unanswered.
The effectiveness of ditch blocking in flood moderation is influenced by various factors, including the initial condition of a drained peatland, the extent of peat degradation, and restoration, and changes in its properties (Menberu et al., 2016). Furthermore, there may be a delayed effect in the peatland's response to ditch blocking, and the corresponding flood mitigation may progressively change over time in the years following the blocking of ditches due to changes in peat properties and vegetation cover. Overall, our rewetted sites, having been drained for a century, still may not function as a natural peatland, and a full hydrological recovery will take substantially longer than the recovery period we measured here. Several factors linked to prolonged drainage could contribute to a long recovery period. For instance, peat oxidation and compaction may lead to increased bulk density, which, in turn affects the ability of the site to effectively retain and release water (Liu and Lennartz, 2019). Hence, our 3-year post-rewetting monitoring period, while longer than many other studies, still offers rather limited insight into the impact of rewetting on flood moderation under extreme storm events, especially in more severe future climatic conditions. Therefore, further monitoring is required to understand the influence of restoration practices on peatland hydrological functioning.
Our results showed that the effect of rewetting on flow moderation from rainfall events is not as simple as restoring GWL. This gradual and evolving process of peatland hydrological functioning, due to a long history of peat compaction and decomposition, then the subsequent re-establishment of peat-forming vegetation after rewetting, emphasizes the importance of sustained long-term monitoring to fully understand the outcomes of rewetting. Moreover, our findings indicate that peatland rewetting has the potential for flood mitigation and, in some cases, the ability to mitigate runoff from rainfall events better than pristine sites. This was supported by reductions in peak flow, runoff coefficient, and less flashy hydrograph responses (HSI). However, the results showed that peatland rewetting does not necessarily increase the lag time between the peak of a rainfall event and peak discharge. Significant changes were only observed at one of the two restored peatlands. These differences seem to be attributed to (1) a higher percentage of the ditches in the catchment being restored and (2) the non-affected site already being similar to the pristine site, suggesting less potential for changes post-rewetting. Nevertheless, uncertainties remain in our understanding of the contribution of peatland rewetting to natural flood management over longer timescales or during large historical flood events. Therefore, we emphasize the significance of long-term monitoring, combined with hydrological modeling, to determine whether peatlands will consistently mitigate floods as climate change intensifies.
All data used in this study are freely available. The discharge data can be obtained from https://data.fieldsites.se/portal/ (Svartberget Research Station, 2024). The GWL data up to October 2023 are available from the corresponding author. The original R codes for extracting rainfall-runoff events are available from Gatis et al. (2023) at https://ore.exeter.ac.uk/repository/handle/10871/134028.
The supplement related to this article is available online at https://doi.org/10.5194/hess-29-2599-2025-supplement.
HL, EMH, and JJ built the TEA research infrastructure and determined the research goals. SK, VM, EMH, JJ, and HL installed, collected, and analyzed all the hydrological and GWL data. SK and VM wrote the paper with important contributions from all the other authors.
The contact author has declared that none of the authors has any competing interests.
Publisher's note: Copernicus Publications remains neutral with regard to jurisdictional claims made in the text, published maps, institutional affiliations, or any other geographical representation in this paper. While Copernicus Publications makes every effort to include appropriate place names, the final responsibility lies with the authors.
We would like to thank all the skilled and dedicated field personnel at the Svartberget research station.
The TEA infrastructure was initiated and co-funded by the European Union GRIP on LIFE IP project (LIFE16IPE SE009 GRIP) led by the Västerbotten Administration Board and Swedish Forest Agency, with additional financial infrastructure and research support from The Kempe Foundation and the Swedish Research Council Formas (grant no. 2018-00723 (to Eliza Maher Hasselquist), grant no. 2018-02780 (to Hjalmar Laudon), grant no. 2020-01372 (to Hjalmar Laudon), grant no. 2021-02114 (to Hjalmar Laudon)), and by the Knut and Alice Wallenberg Foundation (grant nos. 2018.0259 and 2023.0245). The KCS/KFI infrastructure and long-term data collection have been funded by the Swedish Research Council VR (SITES, grant no. 2021-00164).
The publication of this article was funded by the Swedish Research Council, Forte, Formas, and Vinnova.
This paper was edited by Nunzio Romano and reviewed by two anonymous referees.
Acreman, M. and Holden, J.: How wetlands affect floods, Wetlands, 33, 773–786, https://doi.org/10.1007/s13157-013-0473-2, 2013
Aghakouchak, A., Chiang, F., Huning, L. S., Love, C. A., Mallakpour, I., Mazdiyasni, O., Moftakhari, H., Papalexiou, S. M., Ragno, E., and Sadegh, M.: Climate Extremes and Compound Hazards in a Warming World, Annu. Rev. Earth Pl. Sc., 48, 519–548, https://doi.org/10.1146/annurev-earth-071719-055228, 2020.
Andersen, R., Farrell, C., Graf, M., Muller, F., Calvar, E., Frankard, P., Caporn, S., and Anderson, P.: An overview of the progress and challenges of peatland restoration in Western Europe, Restor. Ecol., 25, 271–282, https://doi.org/10.1111/rec.12415, 2017.
Armstrong, A., Holden, J., Kay, P., Francis, B., Foulger, M., Gledhill, S., McDonald, A. T., and Walker, A.: The impact of peatland drain-blocking on dissolved organic carbon loss and discolouration of water; results from a national survey, J. Hydrol., 381, 112–120, https://doi.org/10.1016/j.jhydrol.2009.11.031, 2010.
Armstrong, L., Peralta, A., Krauss, K. W., Cormier, N., Moss, R. F., Soderholm, E., McCall, A., Pickens, C., and Ardón, M.: Hydrologic Restoration Decreases Greenhouse Gas Emissions from Shrub Bog Peatlands in Southeastern US, Wetlands, 42, 81, https://doi.org/10.1007/s13157-022-01605-y, 2022.
Arsenault, J., Talbot, J., Moore, T. R., Beauvais, M. P., Franssen, J., and Roulet, N. T.: The Spatial Heterogeneity of Vegetation, Hydrology and Water Chemistry in a Peatland with Open-Water Pools, Ecosystems, 22, 1352–1367, https://doi.org/10.1007/s10021-019-00342-4, 2019.
Blume, T., Zehe, E., and Bronstert, A.: Rainfall-runoff response, event-based runoff coefficients and hydrograph separation, Hydrol. Sci. J., 52, 843–862, https://doi.org/10.1623/hysj.52.5.843, 2007.
Bring, A., Rosén, L., Thorslund, J., Tonderski, K., Åberg, C., Envall, I., and Laudon, H.: Groundwater storage effects from restoring, constructing or draining wetlands in temperate and boreal climates: a systematic review protocol, Environ. Evid., 9, 1–11, https://doi.org/10.1186/s13750-020-00209-5, 2020.
Bring, A., Thorslund, J., Rosén, L., Tonderski, K., Åberg, C., Envall, I., and Laudon, H.: Effects on groundwater storage of restoring, constructing or draining wetlands in temperate and boreal climates: a systematic review, Environ. Evid., 11, 38, https://doi.org/10.1186/s13750-022-00289-5, 2022.
Casselgård, M.: Effects of 100 years of drainage on peat properties in a drained peatland forests in northern Sweden Examensarbeten 2020: 4 Fakulteten för skogsvetenskap Institutionen för skogens ekologi och skötsel, https://stud.epsilon.slu.se (last access: 15 March 2024), 2020.
D'Acunha, B., Lee, S. C., and Johnson, M. S.: Ecohydrological responses to rewetting of a highly impacted raised bog ecosystem, Ecohydrology, 11, 1–12, https://doi.org/10.1002/eco.1922, 2018.
Dixon, S. D., Qassim, S. M., Rowson, J. G., Worrall, F., Evans, M. G., Boothroyd, I. M., and Bonn, A.: Restoration effects on water table depths and CO2 fluxes from climatically marginal blanket bog, Biogeochemistry, 118, 159–176, https://doi.org/10.1007/s10533-013-9915-4, 2014.
Duque, L.: IETD: Inter-Event Time Definition. R package version 1.0.0, https://cran.r-project.org/web/packages/IETD (last access: 15 March 2024), 2020.
Edokpa, D., Milledge, D., Allott, T., Holden, J., Shuttleworth, E., Kay, M., Johnston, A., Millin-Chalabi, G., Scott-Campbell, M., Chandler, D., Freestone, J., and Evans, M.: Rainfall intensity and catchment size control storm runoff in a gullied blanket peatland, J. Hydrol., 609, 127688, https://doi.org/10.1016/j.jhydrol.2022.127688, 2022.
Evans, M. G., Burt, T. P., Holden, J., and Adamson, J. K.: Runoff generation and water table fluctuations in blanket peat: Evidence from UK data spanning the dry summer of 1995, J. Hydrol., 221, 141–160, https://doi.org/10.1016/S0022-1694(99)00085-2, 1999.
Franzen, L. G., Lindberg, F., Viklander, V., and Walther, A.: The potential peatland extent and carbon sink in Sweden, as related to the Peatland/Ice Age Hypothesis, Mines Peat, 10, 1–19, 2012.
Gatis, N., Benaud, P., Anderson, K., Ashe, J., Grand-Clement, E., Luscombe, D. J., Puttock, A., and Brazier, R. E.: Peatland restoration increases water storage and attenuates downstream stormflow but does not guarantee an immediate reversal of long-term ecohydrological degradation, Sci. Rep. [Code], University of Exeter, https://doi.org/10.24378/exe.4844, 2023.
Goudarzi, S., Milledge, D. G., Holden, J., Evans, M. G., Allott, T. E. H., Shuttleworth, E. L., Pilkington, M., and Walker, J.: Blanket Peat Restoration: Numerical Study of the Underlying Processes Delivering Natural Flood Management Benefits, Water Resour. Res., 57, e2020WR029209, https://doi.org/10.1029/2020WR029209, 2021.
Grand-Clement, E., Anderson, K., Smith, D., Luscombe, D., Gatis, N., Ross, M., and Brazier, R. E.: Evaluating ecosystem goods and services after restoration of marginal upland peatlands in South-west England, J. Appl. Ecol., 50, 324–334, https://doi.org/10.1111/1365-2664.12039, 2013.
Haapalehto, T., Kotiaho, J. S., Matilainen, R., and Tahvanainen, T.: The effects of long-term drainage and subsequent restoration on water table level and pore water chemistry in boreal peatlands, J. Hydrol., 519, 1493–1505, https://doi.org/10.1016/j.jhydrol.2014.09.013, 2014.
Haque, A., Ali, G., and Badiou, P.: Event-based analysis of wetland hydrologic response in the Prairie Pothole Region, J. Hydrol., 604, 127237, https://doi.org/10.1016/j.jhydrol.2021.127237, 2022.
Hawcroft, M., Walsh, E., Hodges, K., and Zappa, G.: Significantly increased extreme precipitation expected in Europe and North America from extratropical cyclones, Environ. Res. Lett., 13, 124006, https://doi.org/10.1088/1748-9326/aaed59, 2018.
Helbig, M., Waddington, J. M., Alekseychik, P., Amiro, B. D., Aurela, M., Barr, A. G., Black, T. A., Blanken, P. D., Carey, S. K., Chen, J., Chi, J., Desai, A. R., Dunn, A., Euskirchen, E. S., Flanagan, L. B., Forbrich, I., Friborg, T., Grelle, A., Harder, S., Heliasz, M., Humphreys, E., Ikawa, H., Isabelle, P., Iwata, H., Jassal, R., Korkiakoski, M., Kurbatova, J., Kutzbach, L., Lindroth, A., Löfvenius M.O., Lohila, A., Mammarella, I., Marsh, P., Maximov, T., Melton, J. R., Moore, P. A., Nadeau, D. F., Nicholls, E. M., Nilsson, M. B., Ohta, T., Peichl, M., Petrone, R. M., Petrov, R., Prokushkin, A., Quinton, W. L., Reed, D. E., Roulet, N. T., Runkle, B. R., Sonnentag, O., Strachan, I. B., Taillardat, P., Tuittila, E., Tuovinen, J., Turner, J., Ueyama, M., Varlagin, A., Wilmking, M., Wofsy, S., and Zyrianov, V.: Increasing contribution of peatlands to boreal evapotranspiration in a warming climate, Nat. Clim. Change, 10, 555–560, https://doi.org/10.1038/s41558-020-0763-7, 2020.
Holden, J.: Chap. 14, Peatland hydrology, in: Developments in Earth Surface Processes, edited by: Martini, I. P., Cortizas, A. M., and Chesworth, W., Vol. 9, 319–346, https://doi.org/10.1016/S0928-2025(06)09014-6, 2006.
Holden, J. and Burt, T. P.: Runoff production in blanket peat covered catchments, Water Resour. Res., 39, 1191, https://doi.org/10.1029/2002WR001956, 2003.
Holden, J., Chapman, P. J., and Labadz, J. C.: Artificial drainage of peatlands: Hydrological and hydrochemical process and wetland restoration, Prog. Phys. Geogr., 28, 95–123, https://doi.org/10.1191/0309133304pp403ra, 2004.
Holden, J., Kirkby, M. J., Lane, S. N., Milledge, D. G., Brookes, C. J., Holden, V., and McDonald, A. T.: Overland flow velocity and roughness properties in peatlands, Water Resour. Res., 44, 1–11, https://doi.org/10.1029/2007WR006052, 2008.
Holden, J., Green, S. M., Baird, A. J., Grayson, R. P., Dooling, G. P., Chapman, P. J., Evans, C. D., Peacock, M., and Swindles, G.: The impact of ditch blocking on the hydrological functioning of blanket peatlands, Hydrol. Process., 31, 525–539, https://doi.org/10.1002/hyp.11031, 2017.
Howie, S. A., Whitfield, P. H., Hebda, R. J., Munson, T. G., Dakin, R. A., and Jeglum, J. K.: Water table and vegetation response to ditch blocking: Restoration of a raised bog in southwestern british columbia, Can. Water Res. J., 34, 381–392, https://doi.org/10.4296/cwrj3404381, 2009.
Javaheri, A. and Babbar-Sebens, M.: On comparison of peak flow reductions, flood inundation maps, and velocity maps in evaluating effects of restored wetlands on channel flooding, Ecol. Eng., 73, 132–145, https://doi.org/10.1016/j.ecoleng.2014.09.021, 2014.
Karimi, S., Hasselquist, E., Salimi, S., Järveoja, J., and Laudon, H.: Rewetting impact on the hydrological function of a drained peatland in the boreal landscape, J. Hydrol., 641, 131729, https://doi.org/10.1016/j.jhydrol.2024.131729, 2024.
Karlsen, R. H., Bishop, K., Grabs, T., Ottosson-Löfvenius, M., Laudon, H., and Seibert, J.: The role of landscape properties, storage and evapotranspiration on variability in streamflow recessions in a boreal catchment. J. Hydrol., 570, 315–328, https://doi.org/10.1016/j.jhydrol.2018.12.065, 2019.
Ketcheson, S. J. and Price, J. S.: The impact of peatland restoration on the site hydrology of an abandoned block-cut bog, Wetlands, 31, 1263–1274, https://doi.org/10.1007/s13157-011-0241-0, 2011.
Kirchner, J. W., Benettin, P., and Van Meerveld, I.: Instructive Surprises in the Hydrological Functioning of Landscapes, Annu. Rev. Earth Pl. Sc., 51, 277–299, https://doi.org/10.1146/annurev-earth-071822-100356, 2023.
Kløve, B.: Retention of suspended solids and sediment bound nutrients from peat harvesting sites with peak runoff control, constructed floodplains and sedimentation ponds, Boreal Environ. Res., 5, 81–94, 2000.
Laine, A. M., Leppälä, M., Tarvainen, O., Päätalo, M. L., Seppänen, R., and Tolvanen, A.: Restoration of managed pine fens: Effect on hydrology and vegetation, Appl. Veg. Sci., 14, 340–349, https://doi.org/10.1111/j.1654-109X.2011.01123.x, 2011.
Laudon, H., Hasselquist, E. M., Peichl, M., Lindgren, K., Sponseller, R., Lidman, F., Kuglerová, L., Hasselquist, N. J., Bishop, K., Nilsson, M. B., and Ågren, A.: Northern landscapes in transition: Evidence, approach and ways forward using the Krycklan Catchment Study, Hydrol. Process., 35, 1–15, https://doi.org/10.1002/hyp.14170, 2021.
Laudon, H., Lidberg, W., Sponseller, R. A., Maher Hasselquist, E., Westphal, F., Östlund, L., Sandström, C., Järveoja, J., Peichl, M., and Ågren, A.: Emerging technology can guide ecosystem restoration for future water security, Hydrol. Process., 36, 1–5, https://doi.org/10.1002/hyp.14729, 2022.
Laudon, H., Mosquera, V., Eklöf, K., Järveoja, J., Karimi, S., Krasnova, A., Peichl, M., Pinkwart, A., Tong, C. H. M., Wallin, M. B., Zannella, A., and Hasselquist, E. M.: Consequences of rewetting and ditch cleaning on hydrology, water quality and greenhouse gas balance in a drained northern landscape, Sci. Rep., 13, 20218. https://doi.org/10.1038/s41598-023-47528-4, 2023.
Liu, H. and Lennartz, B.: Hydraulic properties of peat soils along a bulk density gradient – A meta study, Hydrol. Process., 33, 101–114, https://doi.org/10.1002/hyp.13314, 2019.
Loisel, J. and Gallego-Sala, A.: Ecological resilience of restored peatlands to climate change, Commun. Earth Environ., 3, 1–8, https://doi.org/10.1038/s43247-022-00547-x, 2022.
Luscombe, D. J. Understanding the ecohydrology of shallow, drained and marginal blanket peatlands University of Exeter (United Kingdom), PhD thesis, 2014.
Menberu, M. W., Tahvanainen, T., Marttila, H., Irannezhad, M., Ronkanen, A.-K. A., Penttinen, J., and Kløve, B.: Water-table-dependent hydrological changes following peatland forestry drainage and restoration: Analysis of restoration success, Water Resour. Res., 52, 3742–3760, https://doi.org/10.1002/2015WR018578, 2016.
Menberu, M. W., Haghighi, A. T., Ronkanen, A. K., Marttila, H., and Kløve, B.: Effects of Drainage and Subsequent Restoration on Peatland Hydrol. Process. at Catchment Scale, Water Resour. Res., 54, 4479–4497, https://doi.org/10.1029/2017WR022362, 2018.
Montanarella, L., Jones, R. J. A., and Hiederer, R.: The distribution of peatland in Europe, Mires Peat, 1, 1–10, http://hdl.handle.net/1826/3415 (last access: 15 March 2024), 2006.
Noumonvi, K. D., Ågren, A., Ratcliffe, J. L., Öquist, M. G., Ericson, L., Tong, C. H. M., Järveoja, J., Zhu, W., Osterwalder, S., Peng, H., Erefur, C., Bishop, K., Laudon, H., Nilsson, M. B., and Peichl, M.: The Kulbäcksliden Research Infrastructure: a unique setting for northern peatland studies, Front. Earth Sci., 11, 1194749, https://doi.org/10.3389/feart.2023.1194749, 2023.
Puttock, A., Graham, H. A., Ashe, J., Luscombe, D. J., and Brazier, R. E.: Beaver dams attenuate flow: A multi-site study, Hydrol. Process., 35, e14017, https://doi.org/10.1002/hyp.14017, 2021.
R Core Team: A language and environment for statistical computing (version 4.1.2), 2021.
Rosner, B.: Percentage points for a generalized esd many-outlier procedure, Technometrics, 25, 165–172, https://doi.org/10.1080/00401706.1983.10487848, 1983.
Shantz, M. A. and Price, J. S.: Characterization of surface storage and runoff patterns following peatland restoration, Quebec, Canada, Hydrol. Process., 20, 3799–3814, https://doi.org/10.1002/hyp.6140, 2006.
Shuttleworth, E. L., Evans, M. G., Hutchinson, S. M., and Rothwell, J. J.: Peatland restoration: Controls on sediment production and reductions in carbon and pollutant export, Earth Surf. Proc. Land., 40, 459–472, https://doi.org/10.1002/esp.3645, 2015.
Shuttleworth, E. L., Evans, M. G., Pilkington, M., Spencer, T., Walker, J., Milledge, D., and Allott, T. E. H.: Restoration of blanket peat moorland delays stormflow from hillslopes and reduces peak discharge, J. Hydrol., 2, 100006, https://doi.org/10.1016/j.hydroa.2018.100006, 2019.
Soomets, E., Lõhmus, A., and Rannap, R.: Restoring functional forested peatlands by combining ditch-blocking and partial cutting: An amphibian perspective, Ecol. Eng., 192, 106968, https://doi.org/10.1016/j.ecoleng.2023.106968, 2023.
Svartberget Research Station: Water balance – stream water level and discharge from Krycklan, Swedish Infrastructure for Ecosystem Science (SITES) [data set], https://hdl.handle.net/11676.1/QCGbar0r4DXpGWZoOvLFSn1b (last access: 15 March 2024), 2024
Wickham, H.: ggplot: Elegant Graphics for Data Analysis (Version 3.4.2) [R package], Springer-Verlag, https://cran.r-project.org/web/packages/ggplot2/index.html (last access: 1 March 2024), 2016.
Wilson, L., Wilson, J., Holden, J., Johnstone, I., Armstrong, A., and Morris, M.: Recovery of water tables in Welsh blanket bog after drain blocking: Discharge rates, timescales and the influence of local conditions, J. Hydrol., 391, 377–386, https://doi.org/10.1016/j.jhydrol.2010.07.042, 2010.
Wilson, L., Wilson, J., Holden, J., Johnstone, I., Armstrong, A., and Morris, M.: The impact of drain blocking on an upland blanket bog during storm and drought events, and the importance of sampling-scale, J. Hydrol., 404, 198–208, https://doi.org/10.1016/j.jhydrol.2011.04.030, 2011.