the Creative Commons Attribution 4.0 License.
the Creative Commons Attribution 4.0 License.
 | 18 Jun 2025
Implementation of global soil databases in the Noah-MP model and the effects on simulated mean and extreme soil hydrothermal changes
Kazeem Abiodun Ishola
Gerald Mills
Ankur Prabhat Sati
Benjamin Obe
Matthias Demuzere
Deepak Upreti
Gourav Misra
Paul Lewis
Daire Walsh
Tim McCarthy
Soil properties and their associated hydrophysical parameters represent a significant source of uncertainty in land surface models (LSMs), with consequent effects on simulated sub-surface thermal and moisture characteristics, surface energy exchanges, and turbulent fluxes. These effects can result in large model differences, particularly during extreme events. As is typical of many model-based approaches, spatial soil information such as the location, extent, and depth of soil textural classes is derived from coarse-scale soil information and employed largely due to its being readily availability rather than its suitability. However, the use of a particular spatial soil dataset can have important consequences for many of the processes simulated within an LSM. This study investigates model uncertainty in the Noah-MP model in simulating soil moisture (expressed as a ratio of water to soil volume, m3 m−3) and soil temperature changes, associated with two widely used global soil databases (STATSGO and SoilGrids). Both soil datasets produced significant dry biases in loam soils of 0.15 and 0.10 m3 m−3 during a wet and dry period, respectively. The spatial disparities between STATSGO and SoilGrids also influenced the simulated regional soil hydrothermal changes and extremes. SoilGrids was found to intensify drought characteristics – shifting low and moderate drought areas into the extreme and exceptional classifications – relative to STATSGO. Our results demonstrate that the coarse STATSGO performs as well as the fine-scale SoilGrids soil database, though the latter represents the soil moisture dynamics better. However, the results underscore the need for greater collaborative efforts to develop more detailed regionally derived soil texture characteristics and to improve pedotransfer function (PTF) parameterizations for better representations of soil properties in LSMs. Enhancing these soil property representations in LSMs is essential for improving operational modeling and forecasting of hydrological processes and extremes.
- Article
(15150 KB) - Full-text XML
- BibTeX
- EndNote


The pedosphere (or soil) is an important component of the Earth system and plays a critical role in energy, water, and biogeochemical exchanges that occur at the land–atmosphere interface (Dai et al., 2019a, b). The accurate description and representation of soil textural categories and/or soil hydrophysical properties are fundamental in developing and enhancing the capacity of Earth system models (ESMs) in predicting land surface exchanges at different scales (Luo et al., 2016; Dai et al., 2019a, b). This information is incorporated via the respective land surface model (LSM), the only physical boundary in an ESM and a key component of any ESM framework (Fisher and Koven, 2020; Blyth et al., 2021). However, accurate descriptions of soil properties in LSMs are difficult to obtain due to the limited availability of high-resolution global-scale soil texture measurements or the lack of regionally specific measured soil properties (e.g., Kishné et al., 2017; Dennis and Berbery, 2021, 2022). This represents a key limitation and is a source of model uncertainty in current LSMs (Li et al., 2018; Zhang et al., 2023) and, consequently, in weather and climate models.
In many LSMs, soil hydrothermal properties such as soil thermal and hydraulic conductivity and diffusivity, porosity, field capacity, wilting point, and saturated-soil matric potential are linked to soil textural classes and/or compositions in one of two ways. Typically, models employ a model-prescribed look-up table, with values that are derived from often limited (e.g., geographically limited and data-limited) in situ soil surveys, to associate mean or typical soil properties with each soil category. The soil categories are identified by grouping soil samples with similar properties using particle size analysis (e.g., Gee and Bauder, 2018). While this option is computationally efficient, it relies on the assumption that the derived values are transferable; this is not likely to be realistic as soil properties vary depending on parent materials, climate, age, management, etc. This approach is also dependent on having access to soil texture maps, the accuracy, scale, and extent of which vary between different soil databases (Zhao et al., 2018; Dai et al., 2019a, b; Dennis and Berbery, 2022). In spite of this, the use of readily available global soil texture maps, in combination with model look-up tables, is a standard practice in ESM research.
As an alternative, new state-of-the-art global soil information datasets are being explored to constrain and potentially improve the representation of soil processes within LSMs (e.g., de Lannoy et al., 2014; Shangguan et al., 2014; Hengl et al., 2017; Looy et al., 2017; Dennis and Berbery, 2021, 2022; Xu et al., 2023). For example, soil hydrothermal properties can be estimated from a set of equations known as pedotransfer functions (PTFs) that require information on soil such as sand, silt, and clay composition and organic matter content (Looy et al., 2017; Dai et al., 2019a, b). PTFs have been derived based on a variety of different approaches (Looy et al., 2017), including physically based relationships or advanced statistical approaches using machine learning, random forest, and neural networks (Lehmann et al., 2018; Zhang et al., 2018; Or and Lehmann, 2019; Szabó et al., 2019), and vary in complexity. While the choice of PTFs partly depends on the availability of inputs (Weihermüller et al., 2021), they have been reported to impact soil moisture simulations, with consequent effects on the surface energy and water fluxes, land–atmosphere coupling, atmospheric moisture budget, boundary layer evolution, and simulation of regional climates (e.g., Dennis and Berbery, 2021, 2022; Weihermüller et al., 2021; Xu et al., 2023; Zhang et al., 2023).
Moreover, as soil moisture affects land–atmosphere interactions, largely through its control over the evaporative fraction (e.g., Seneviratne et al., 2010; Ishola et al., 2022), soil hydrophysical properties play an important role in determining the land surface response to climate extremes (e.g., droughts) (He et al., 2023; Zhang et al., 2023). Weihermüller et al. (2021), using the Hydrus-1D model, reported that soil hydraulic properties estimated from different PTFs resulted in substantial variability in model-estimated water fluxes. In this context, Dennis and Berbery (2021) and Dennis and Berbery (2022) employed soil properties derived from STATSGO and the Global Soil Dataset for Earth System Modeling (GSDE) as used in both the Weather and Research Forecasting (WRF) model and the Community Land Model (CLM). They found soil-texture-related differences in the surface fluxes that could lead to differences in the evolution of the boundary layer thermodynamic structure and in the development of precipitation, findings consistent with those of Zhang et al. (2023). The use of new soil information, such as from POLARIS and the 250 m SoilGrids database, has been found to improve the performance of LSMs (Xu et al., 2023), but this is based on a limited number of studies.
Zhang et al. (2023) were among the first to implement SoilGrids in the coupled WRF Hydrological Modeling System (WRF-Hydro), of which Noah-MP is the land surface model, to evaluate the role of four different global soil datasets in land–atmosphere interactions over southern Africa. While Zhang et al. (2023) found that the ensemble of model simulations, based on the different soil data inputs, was able to reasonably reproduce the spatial and spatio-temporal patterns of the surface hydrometeorological fields investigated, soil texture differences, specifically those associated with differences in soil properties, were found to directly impact model-estimated soil moisture, with associated impacts on skin and air temperature and sensible heat fluxes. Importantly, for the study and domain outlined here, the effects of different soil texture datasets on soil moisture were found to decrease with increasing aridity (Zheng and Yang, 2016; Zhang et al., 2023). Consequently, the authors highlighted the need to consider study location and background climate in addition to the different schemes for estimating soil hydrothermal processes. While it is widely recognized that LSMs will respond to changes in other drivers, such as vegetation (e.g., albedo, surface roughness length) and meteorological forcing (Arsenault et al., 2018; Hosseini et al., 2022), it is critical to understand the role of soil properties in model sensitivity.
Here, we focus on the response of the Noah-MP LSM specifically, without an atmospheric model component (i.e., WRF), to two different types of soil data and to schemes for calculating soil parameters with the objective of evaluating the model estimation of the land surface fields. Our study, while complementary to Zhang et al. (2023), seeks to expand the discussion by focusing on a region that is typically energy, rather than water, limited; has intensively managed landscapes; and is under a very contrasting climate regime. Additionally, we employ an alternative approach to derive model-relevant soil parameters using pedotransfer functions and incorporate additional data sources for evaluation of the model responses. Critically, we focus on 2 contrasting years during which model differences are likely to be largest.
Due to its maritime climate, Ireland lies in a temperate region with cool temperatures year-round and no marked seasonality with regard to precipitation. As a consequence, growing conditions are near optimal, particularly for agricultural or managed grasslands, which account for almost 60 % of the total land area. The country has relatively young (<12–15 kyr) and heavily managed soils that are very heterogeneous over small spatial scales. In spite of the maritime climate, variations in the dominant soil categories across the country mean that some locations experience periodic or seasonal soil moisture deficits, particularly in the sandy soils located to the southeast of the island, which experience typically drier and sunnier summer periods relative to the rest of the country. To the north and west, soils tend to have higher clay contents, which can act as a buffer to prolonged periods of reduced precipitation or become waterlogged during wet periods. The complexity of Ireland's soil landscapes and climatological regime provides new impetus to test the impact of different soil data representations on LSM simulations, particularly within the context of understanding how projected future changes in the frequency and intensity of drought events may spatially impact maritime temperate locations, such as Ireland.
2.1 Background context of Ireland
The climate in Ireland is predominantly influenced by the moist mid-latitude westerlies that blow off the North Atlantic Ocean and occasional incursions of cold air masses during winter (Peel et al., 2007). The long-term (1981–2010) average daily maximum temperature is between 18 and 20 °C in summer and 8 °C in winter. Occasionally, the daily mean temperature drops below 0 °C in autumn and winter. Rainfall is distributed throughout the year, with a mean annual value of 1200 mm. The west of Ireland typically experiences higher rainfall amounts (1000–1400 mm), and this can exceed 2000 mm in upland areas. Conversely, the east experiences lower rainfall amounts, between 750 and 1000 mm. More detailed information on the background climate of Ireland is provided in Walsh (2012). Although these are typical climatic conditions in Ireland, the country is also prone to extreme weather events. For instance, the summer of 2018 was an exceptionally warm and dry period, associated with a weakened jet stream and a persistent region of high pressure over northwestern Europe; this was followed by a return to normal conditions in 2019.
In relation to the general soil information (Fig. 1a), the southeast is characterized as having relatively free-draining sandy soils; peat soils dominate the mountains, hills, and western edge of the country, while limestone-rich soils dominate the midlands and the south (Creamer et al., 2014). Among the land use types (Fig. 1b), agricultural grassland dominates the total land area in Ireland, accounting for an estimated 59 % of the total land use. The temperate climate, in combination with fertile soils, provides conditions that are favorable for nearly year-round grass growth, particularly in the coastal margins and along the southern coast. However, cooler temperatures and heavy clay (wet) soils limit the grass-growing season (early to middle March) in the uplands, midlands, and north of the country (Keane and Collins, 2004).

Figure 1(a) Geographical locations of the selected in situ grassland sites overlaid onto Ireland's map of soil drainage categories. (b) Refined map of 2018 CORINE and MODIS land cover classes for the study domain.
2.2 Model description
Here, we employ the advanced community Noah-MP land surface model, with improved representation of physical processes (Chen et al., 1996; Niu et al., 2011). The model can be run in uncoupled mode, with the capacity to simulate land state variables (e.g., soil moisture) and land energy, water, and carbon fluxes. It also represents an LSM that is coupled with numerous atmospheric and hydrological models, including the community-based Weather Research and Forecasting (WRF) model (Barlage et al., 2015). Due to the potential for selecting and combining multi-physics options, the model has been widely used for a range of different research applications, including natural hazards, drought and wildfire monitoring, land–atmosphere interactions, sensitivity and uncertainty quantification, biogeochemical processes, water dynamics, dynamic crop growth modeling, and soil hydrothermal processes (e.g., Zhuo et al., 2019; Kumar et al., 2020; Chang et al., 2022; Hosseini et al., 2022; Nie et al., 2022; Warrach-Sagi et al., 2022; Hu et al., 2023).
In Noah-MP, the major improvements in terms of the mechanisms relevant to soil processes are (1) the ability to distinguish the low- and high-permeability frozen soil fractions, (2) the introduction of an alternative lower boundary soil temperature that is based on zero heat flux from the deep soil bottom, (3) the addition of TOPMODEL and SIMGM for runoff and groundwater physics options (Niu et al., 2007), and (4) the inclusion of an unconfined aquifer beneath the 2 m bottom of the soil layer to account for water transport between the soil and aquifer. Similarly to other LSMs, the Noah-MP model framework is typical in terms of its ability to define soil properties either by using the dominant soil texture class (e.g., USDA), linked to laboratory-derived or empirically derived soil parameter values, or by using soil texture (proportions) in combination with PTFs (e.g., Saxton and Rawls, 2006). Of these, the former is most commonly employed, in combination with readily available global soil information.
The prognostic equations from Mahrt and Pan (1984) are used to describe soil moisture and soil temperature in the model (Chen et al., 1996):
where θ is the soil moisture; C is the volumetric heat capacity; T is the soil temperature; and K and Kt are the hydraulic and thermal conductivities, respectively. D is the soil diffusivity, and Fθ denotes the sinks and sources of soil water, that is, evaporation and precipitation. C, D, K, and Kt are functions of soil texture and soil moisture.
2.3 Gridded data
Meteorological variables required as initial and forcing conditions were obtained from the European Centre for Medium-Range Weather Forecasting (ECMWF) database. We employ the state-of-the-art ECMWF ERA5-Land global reanalysis product that provides data at 0.1° (∼ 9 km) spatial and hourly temporal resolution (Muñoz-Sabater et al., 2021). The required forcing variables include total precipitation, incident shortwave and longwave radiation, 2 m air temperature, 10 m zonal and meridional wind components, surface pressure, and specific humidity. For initialization, the model also requires initial values of soil temperature, surface skin temperature, canopy water, and snow water equivalent to be specified for the first time step. The hourly data for all variables were obtained for the period of 2009–2022.
The Noah-MP model also requires geographical data (e.g., soil texture and land use) and time-varying vegetation products (e.g., leaf area index (LAI) and fraction of green vegetation (FVEG)). We use the STATSGO gridded soil category map provided at 5 arcmin resolution (∼ 6 km at 52° N) (FAO, 2003) and the International Soil Reference and Information Centre (ISRIC) global SoilGrids data (Hengl et al., 2017; Poggio et al., 2021). The latter is available at 250 m resolution and six standard soil depths; however, sand and clay proportions are currently available at four depth layers as part of the WRF geographical data fields. Preprocessing of the data was undertaken in the WRF Preprocessing System (WPS) (Skamarock et al., 2021).
2.4 Model simulations
We employed the offline version of the Noah-MP model (version 4.3) within the framework of the High-Resolution Land Data Assimilation System (HRLDAS) (Chen et al., 2007). Using the WPS system, the model domain is set up with a 1 km grid covering the island of Ireland and including the western coast of the United Kingdom (Fig. 1). We incorporated a high-resolution land use dataset based on the 100 m raster CORINE Land Cover dataset for 2018 (CLC 2018). The 44 CORINE land cover classes were initially reclassified into 20 categories to match the default modified IGBP MODIS 20-category land use dataset (Fig. 1b). The data were then resampled to 250 m using a majority rule. To generate the required geographic files for input into Noah-MP, the CLC 2018 was converted into binary format, which was then used as input into the WPS, which generates the gridded geographic format required to run the Noah-MP model. Other geographical data used in this study, such as topography, green-vegetation fraction, and surface albedo, are derived from the model's default datasets as provided by the Research Application Laboratory of the National Center for Atmospheric Research (RAL/NCAR).
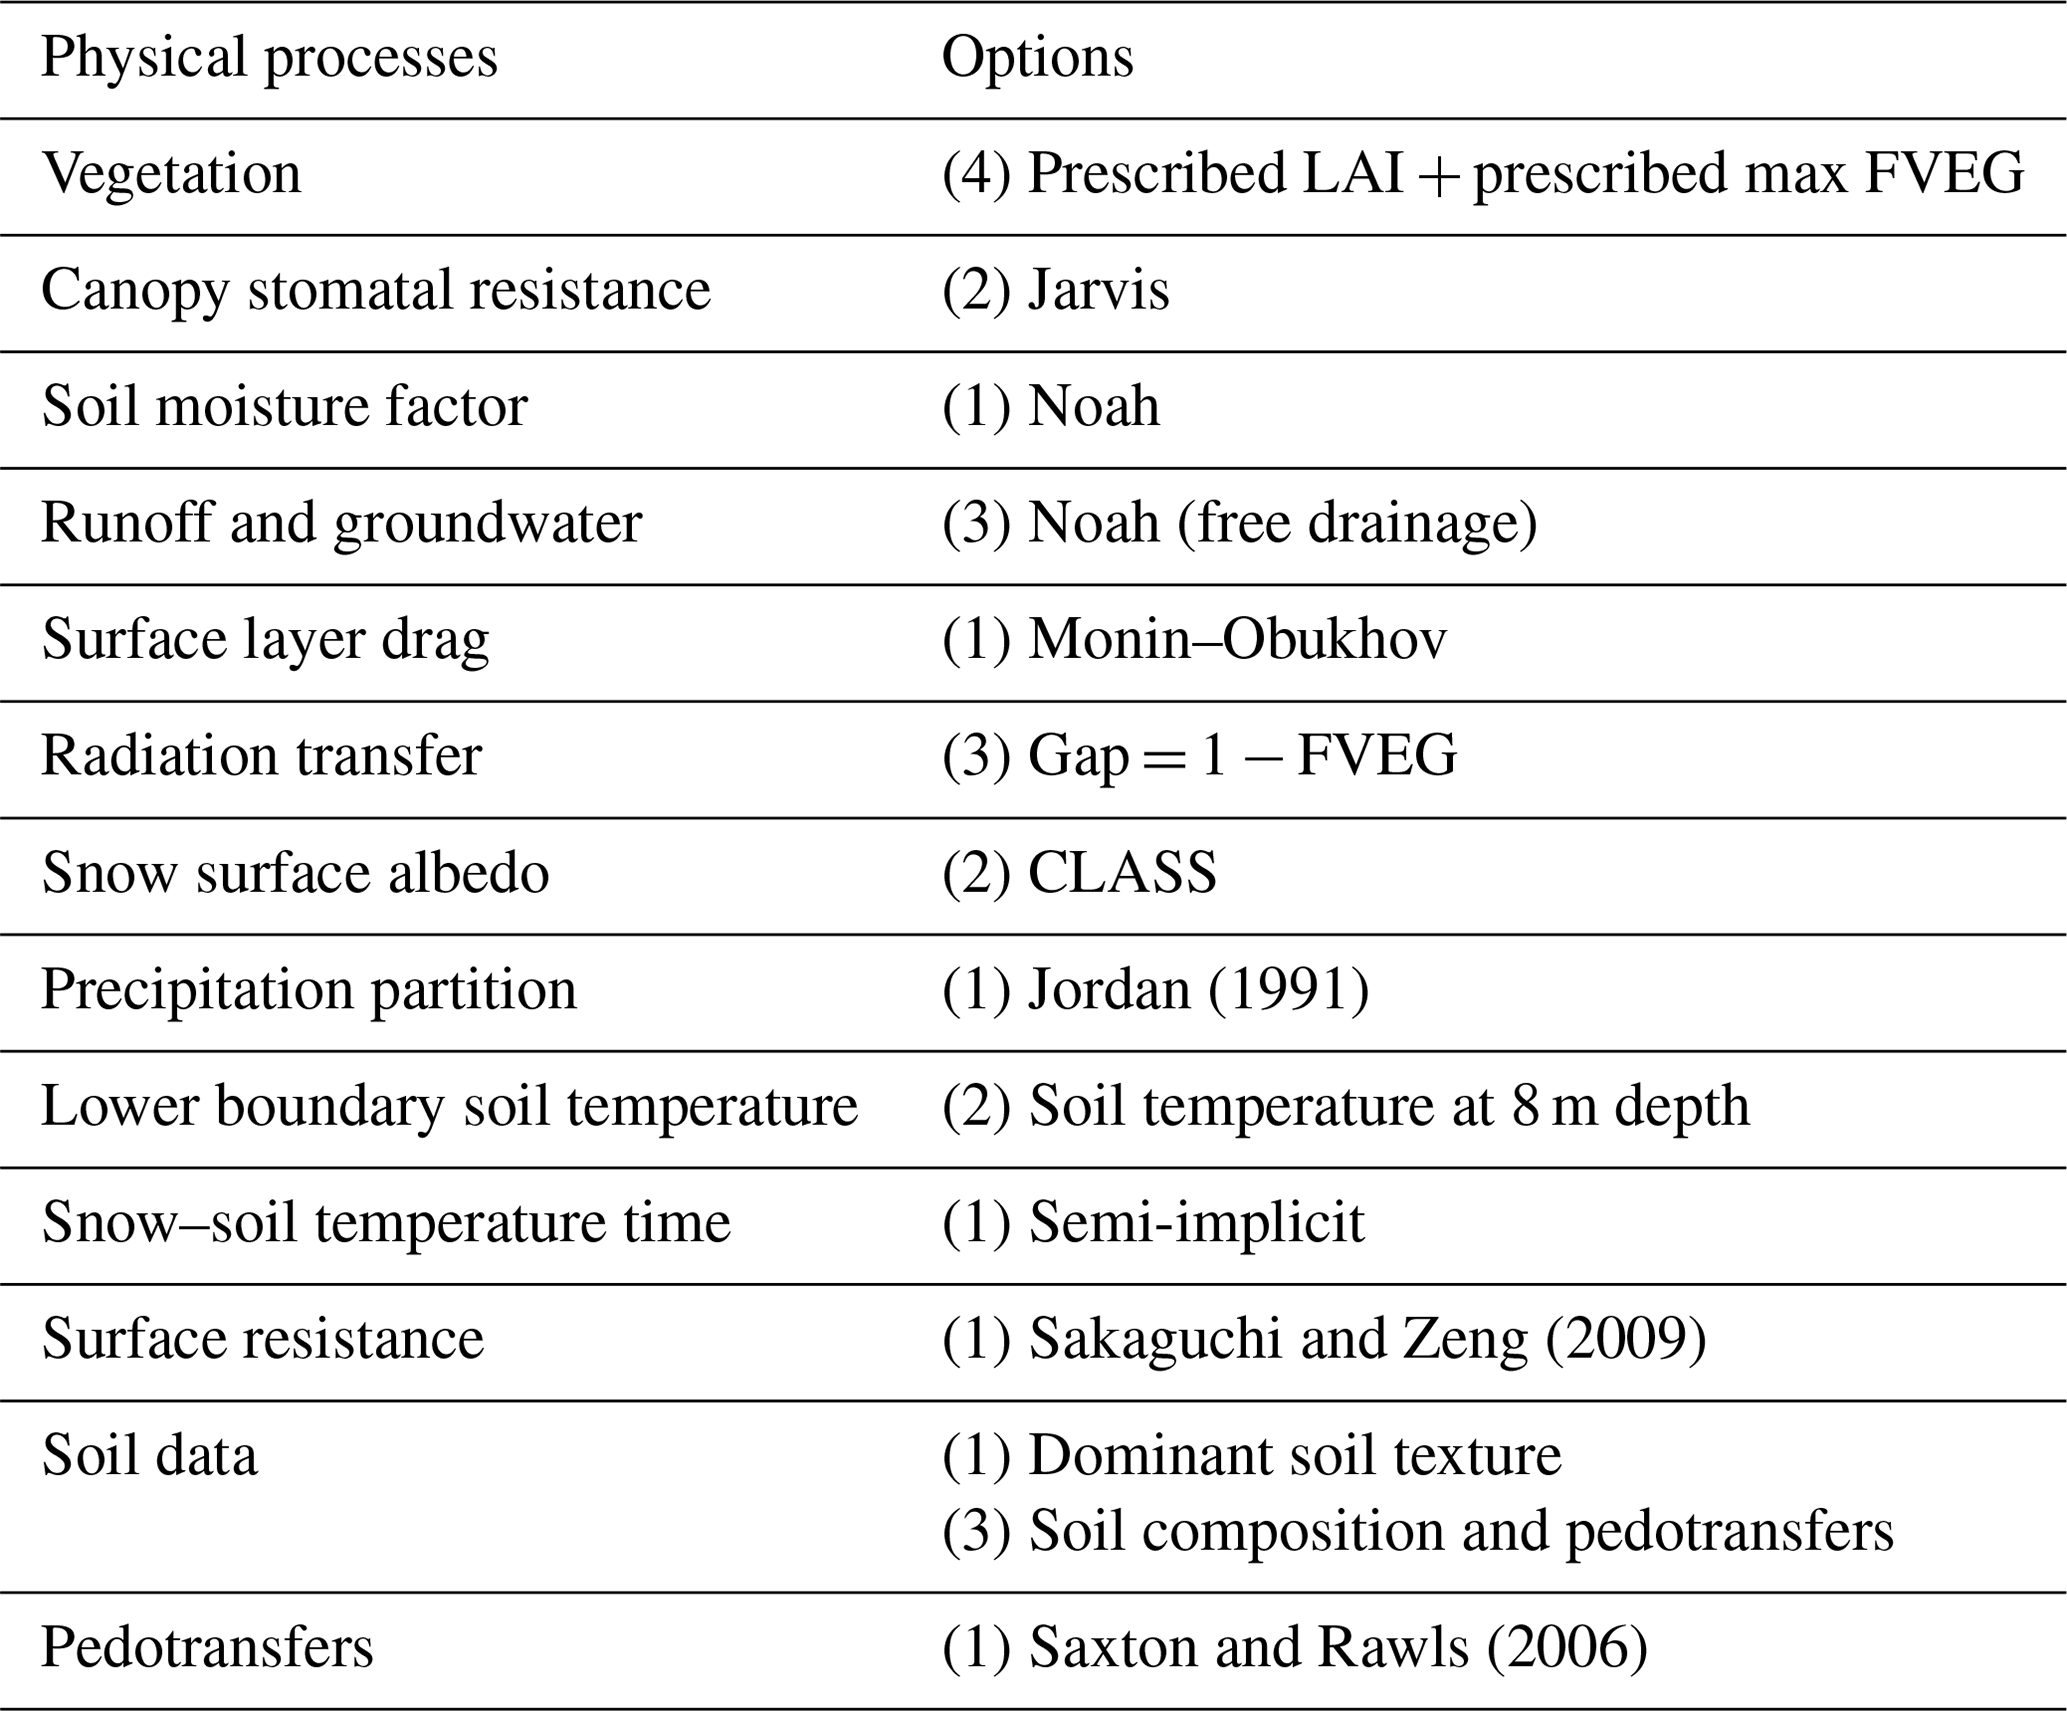
To investigate the effect of soil hydrophysical properties on model-estimated soil moisture and soil temperature, we configure two experiments that are based on different soil data options, namely, (1) dominant soil texture categories used as the default in WRF/Noah-MP and (2) soil texture properties (e.g., sand, silt, clay) in combination with PTFs (PTFs based on Saxton and Rawls, 2006). The dominant soil texture option uses the baseline FAO/STATSGO dataset, with the empirically derived soil properties obtained from the model look-up table, while the PTF-derived soil properties use the fine-scale SoilGrids sand and clay proportions as input into the PTF equations. The dominant topsoils across the domain are broadly classified into four and two categories based on STATSGO and SoilGrids, respectively (Fig. 2). While loam and sandy loam soil textures cover the largest area in both data sources (Table 2), the extent to which the differences in the soil data (e.g., spatial extent of textural classes, soil hydrophysical parameters) contribute to model uncertainty in the Noah-MP model is evaluated. Other Noah-MP physics options used are outlined in Table 3.
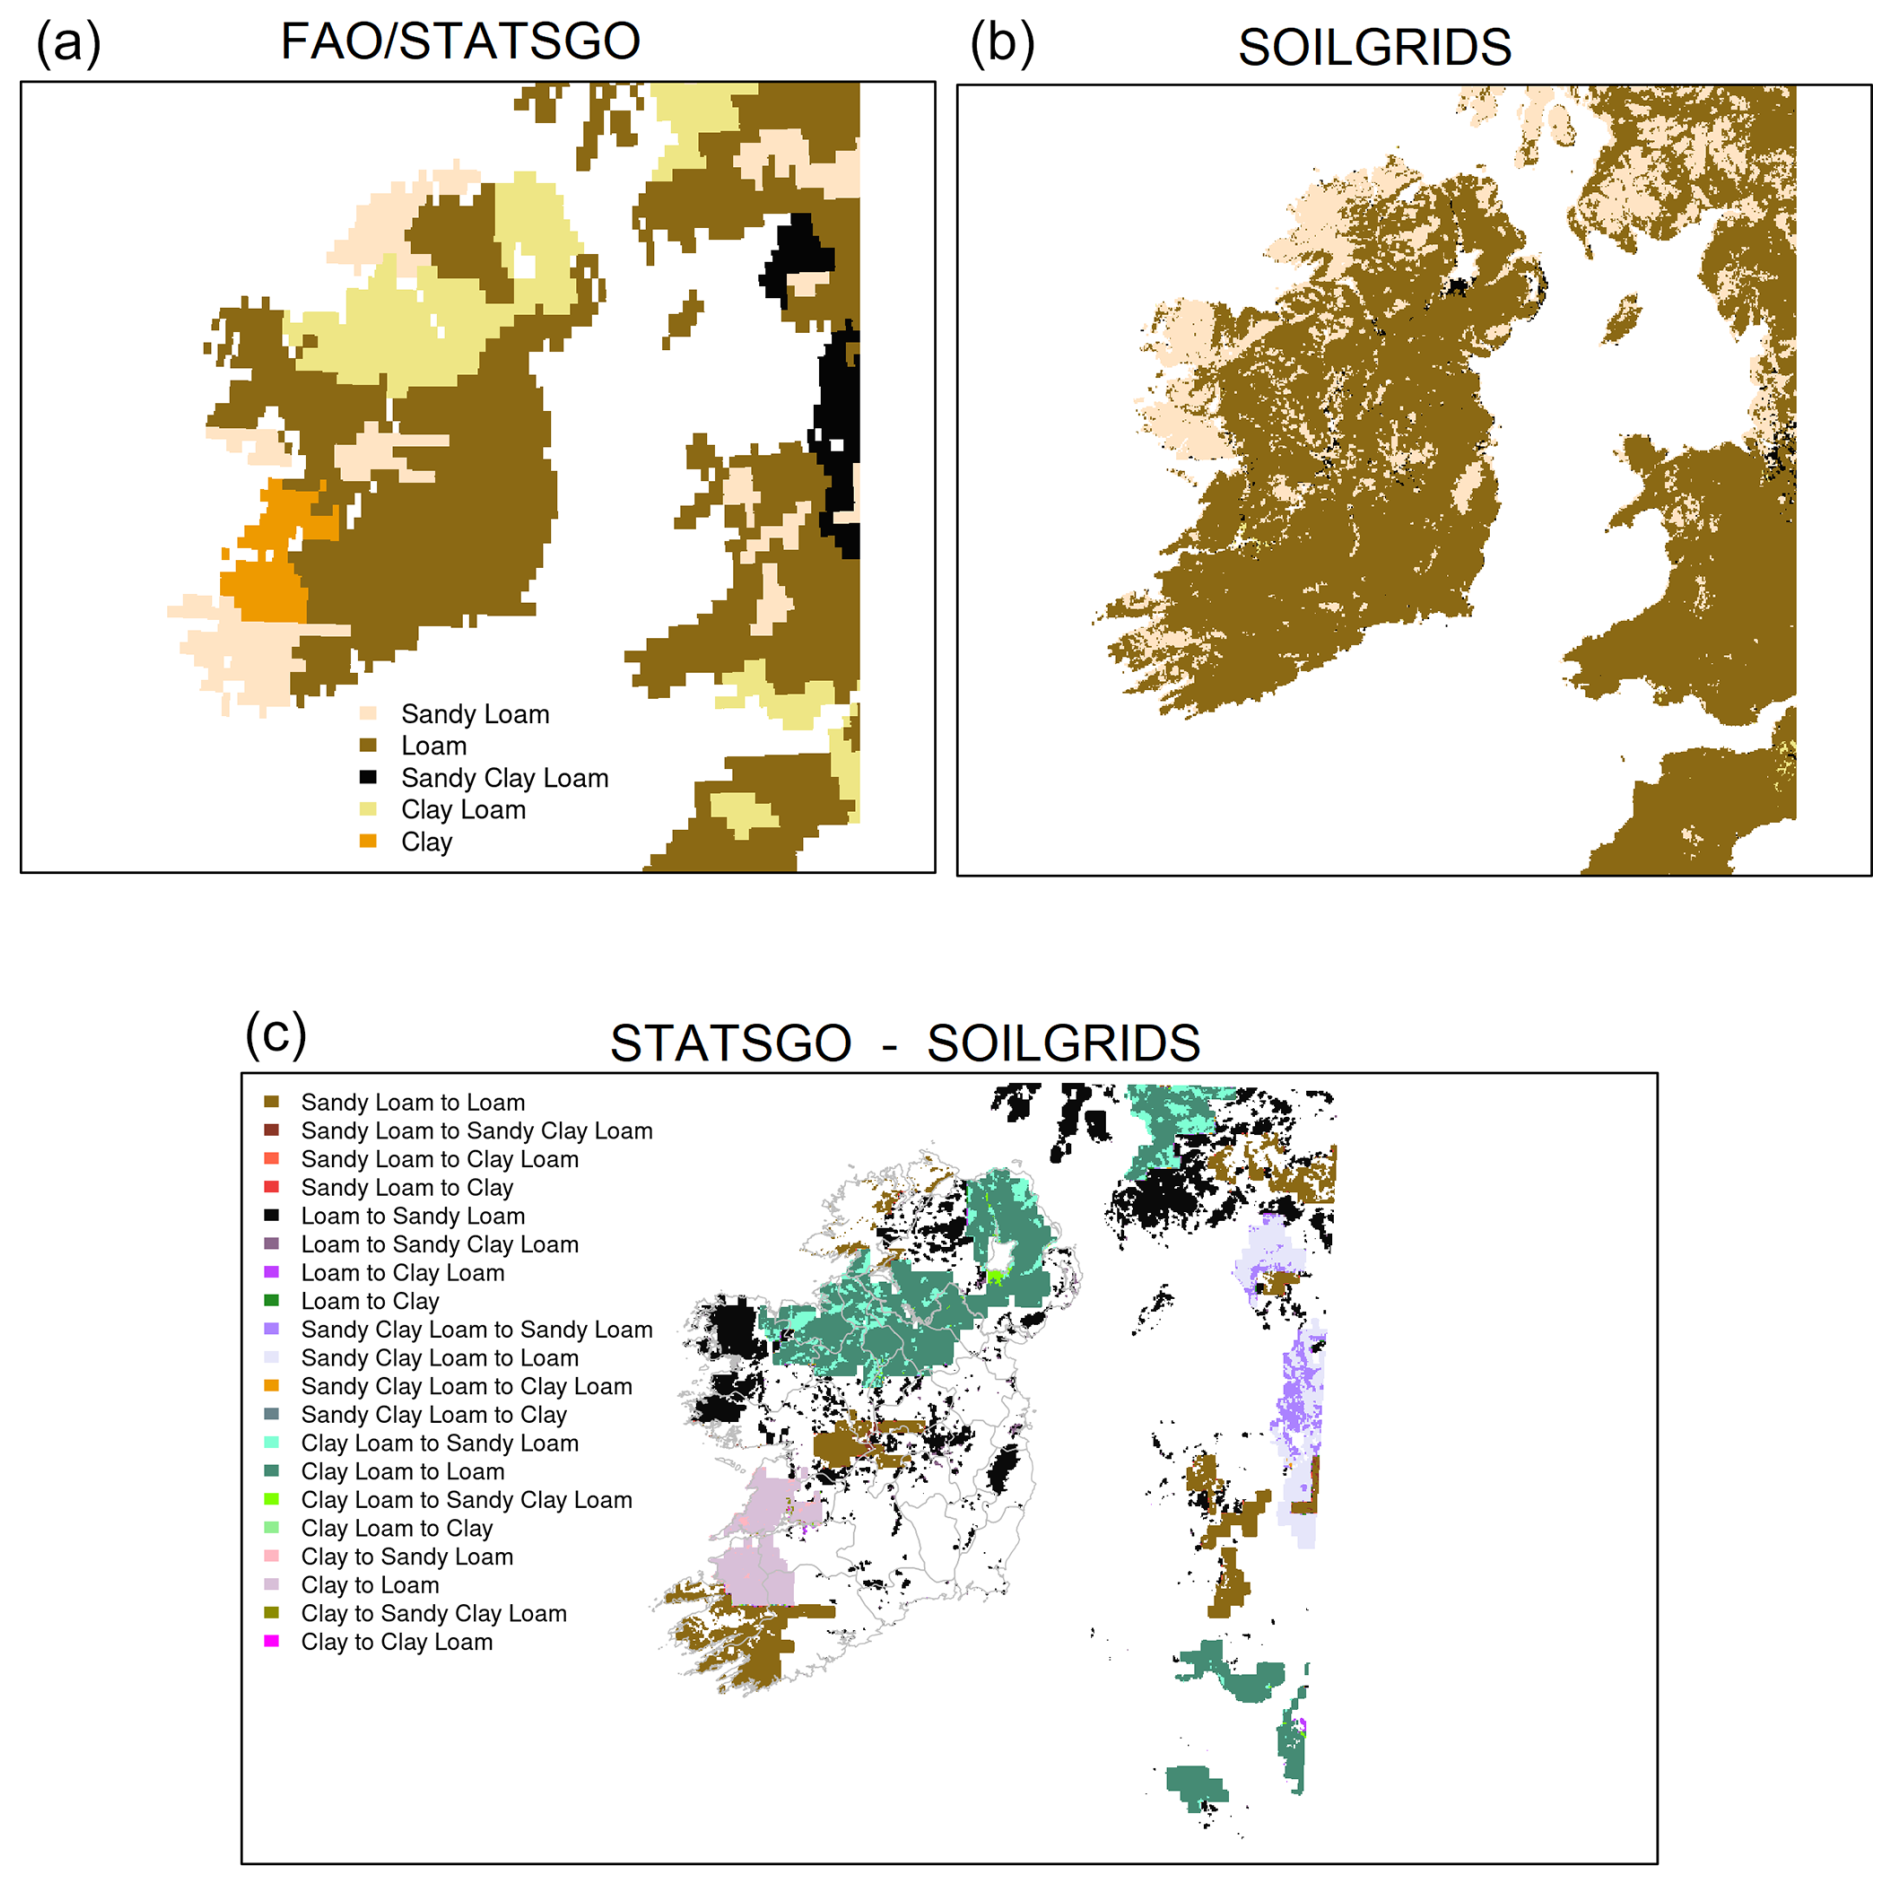
Figure 2(a–b) Soil textural classes for the study domain based on global soil databases, namely FAO/STATSGO and SoilGrids. (c) Spatial differences in the soil texture categories between STATSGO and SoilGrids, indicating increasing or decreasing soil grain size.
For the numerical experiments, soil layer thicknesses of 0.07, 0.21, 0.72, and 1.55 m are used, with a cumulative soil depth of 2.55 m. The thicknesses are selected to match the layers of initial soil input fields from ERA5-Land to minimize the effects of interpolation of the boundary data inputs on the model simulation. The model is spun up over 10 years for each experiment using the climatology of the hourly ERA5-Land for the period of 2009–2022 to bring the soils to thermal and hydrologic equilibrium with the atmosphere. We employ a climatology, rather than preceding meteorology (e.g., 2000–2009), to limit the impacts of unusual or extreme weather events on the estimation of the model stores. After spin-up, the model stores are assumed to be stable and are used as input to initialize the simulations which are reported on here using the hourly meteorological forcing from 2009 to 2022.
2.5 Station data
Profile measurements of soil temperature and volumetric water content (VWC) are obtained from two established eddy covariance flux sites located over grass land cover at Johnstown Castle and Dripsey (Kiely et al., 2018; Murphy et al., 2022), located in the south of the island. In addition, we employed five new sites (deployed as part of a new national network of monitoring sites – Terrain-AI) which are co-located with existing national meteorological sites, namely Athenry, Ballyhaise, Claremorris, Dunsany, and Valentia, and which are distributed across the island (Fig. 1a).
The selected sites are characterized as having either loam or sandy loam soils (Table 1), representative of the top two dominant soil texture categories in STATSGO and SoilGrids (Table 2), and have contrasting soil water regimes (Fig. 1a). For example, Johnstown Castle is characterized as having imperfectly drained sandy loam soils and a measured field capacity of 0.32, while Dripsey is classified as having loam soil and a measured field capacity of 0.42 (e.g., Peichl et al., 2012; Kiely et al., 2018; Ishola et al., 2020; Murphy et al., 2022) and is classed as being poorly drained as it is dominated by heavy soils that retain water throughout the year.
Table 1Summary of locations of in situ measurements. The station elevation data are obtained from Met Éireann. The station soil texture data for Johnstown Castle and Dripsey are obtained from previous work (Kiely et al., 2018; Murphy et al., 2022), and soil texture maps from the Irish Soil Information System (Creamer et al., 2014) are used for the in situ Terrain-AI sites. The soil drainage classes are also obtained from the Irish Soil Information System.
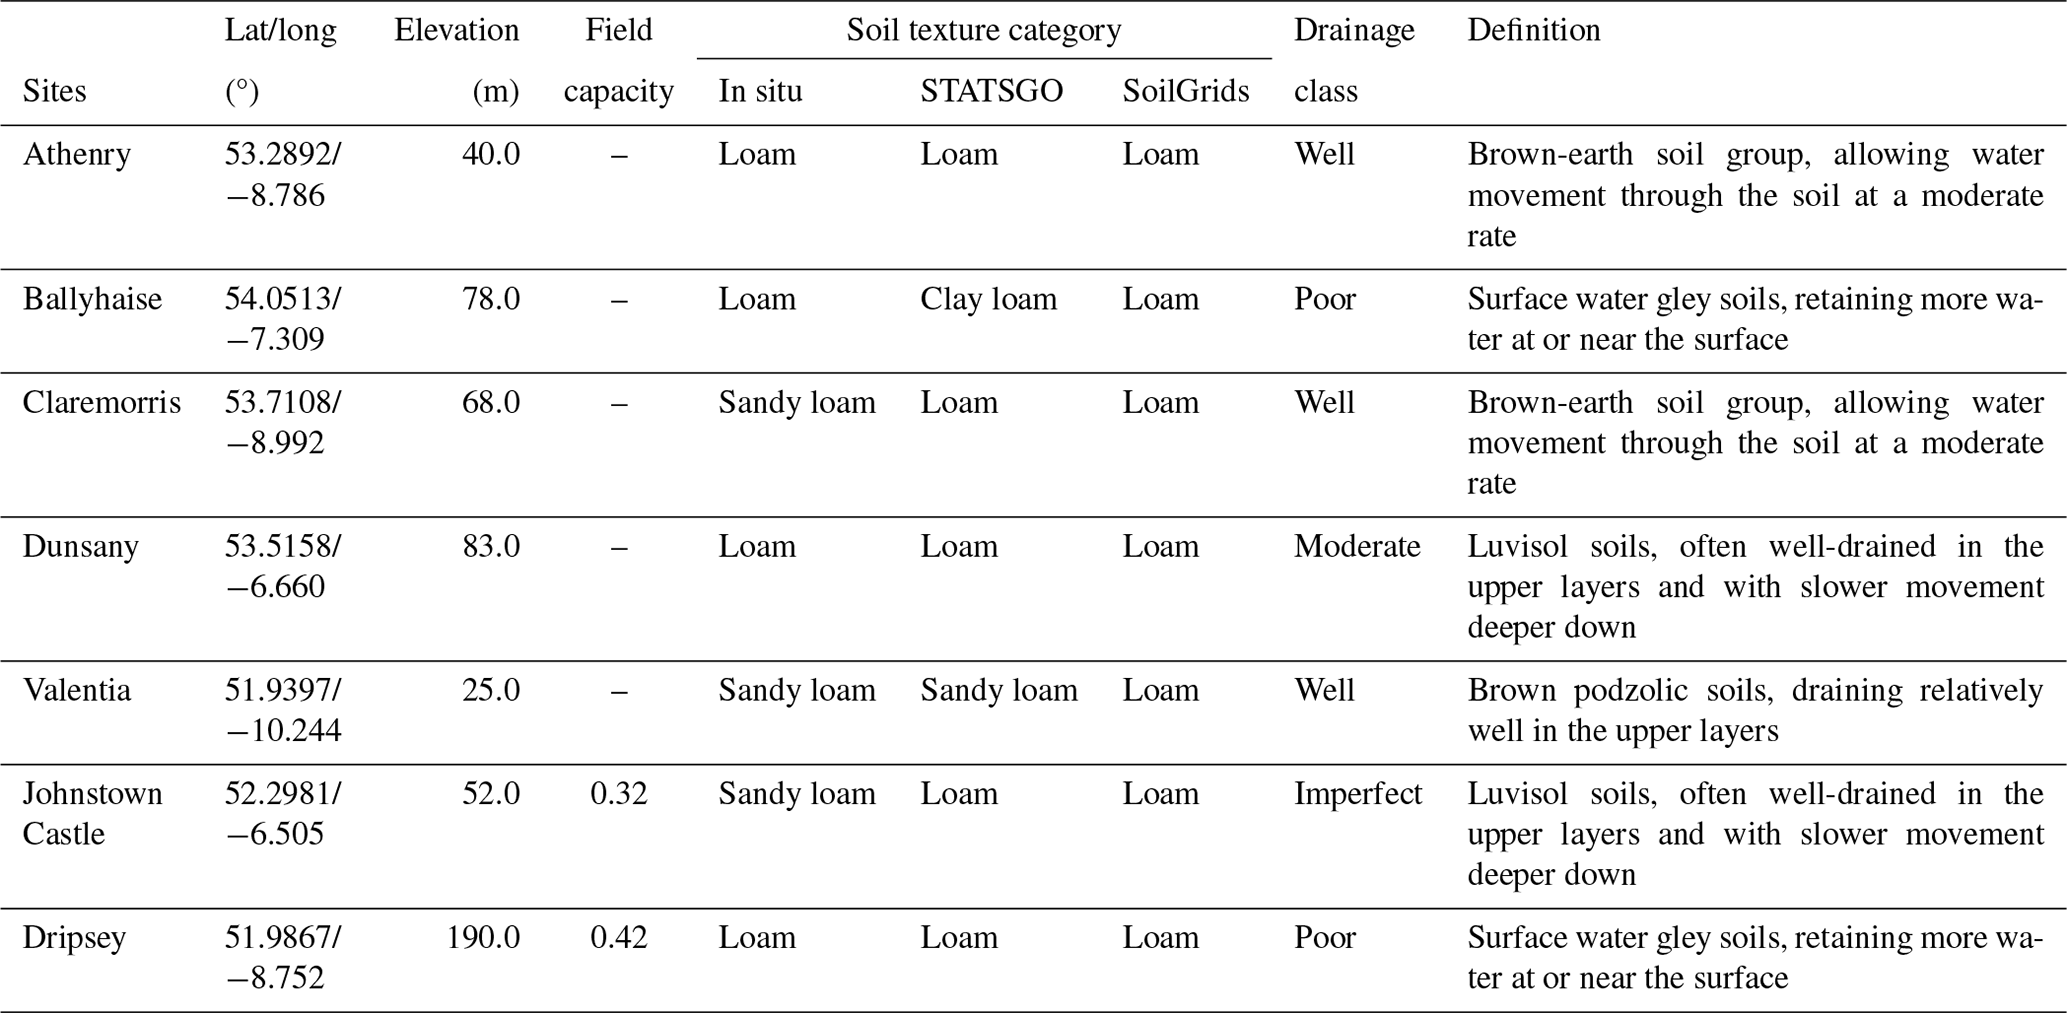
Table 2Percentage proportion of grids covered by soil texture categories from the STATSGO and SoilGrids databases used.
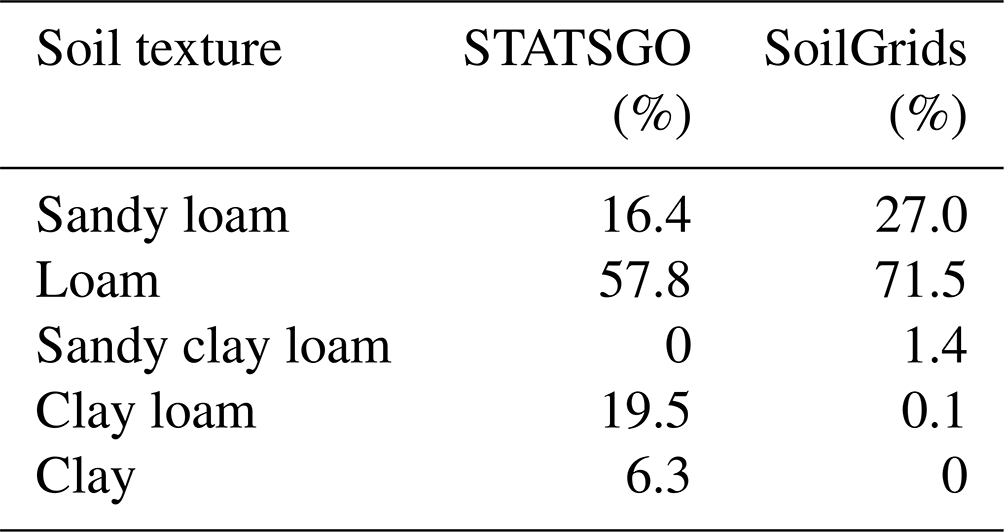
Table 3Summary of Noah-MP physical options used in this study.
Note that the flux sites' VWC values are measured in the top 20 cm soil layer, while the Terrain-AI sites are measured at fixed depths down the soil profile (e.g., 5, 10, 20, 30, 40, 50, 60, 75, and 100 cm). The Terrain-AI network is part of a wider recent national initiative to establish a long-term network of soil moisture monitoring sites across Ireland. It measures in situ soil moisture content using a time domain reflectometry (TDR) profile sensor (Campbell Scientific CS615/CS616). Given that the Terrain-AI sites are relatively new, starting from 2022, the VWC measurements used here are limited to a year and may be prone to outliers as the TDR probes require some time for the soil to settle around the sensor. However, there is no evidence of TDR sensor decay in the measured VWC when the 2022 values are compared with the patterns found in the more recent data (2023–present) at the 5 and 20 cm soil depths (Fig. A1 in the Appendix). Soil temperature measurements recorded at 5, 10, and 20 cm depths were obtained from Met Éireann, the national meteorological agency, for the same sites as the soil moisture measurements.
Half-hourly or hourly measurements are available for the period from 2009 to 2012 for Dripsey; for 2018 (measurements available from the second half of the year), 2019, and 2021 for Johnstown Castle; and for the year 2022 for the Terrain-AI and meteorological sites, representing different measurement periods and, hence, different data availabilities at the sites. Metadata for each station, outlining soil type, land cover, and altitude, are provided in Table 1.
2.6 Satellite products
Global satellite soil moisture datasets (e.g., ESA-CCI, SMAP, SMOS, and ASCAT) are often used to evaluate LSMs at large spatial scales. Many of these products differ in terms of the satellite sensors and start of operations and are subject to data gaps, cloud coverage, coarse resolutions, and limited time coverage (Beck et al., 2021). We employ the Soil Water Index (SWI) product (soil moisture expressed in percentage degree of saturation), derived from the fusion of Sentinel-1 C-SAR (1 km) and Metop ASCAT (25 km) sensors, to evaluate the Noah-MP model at grid scales (Bauer-Marschallinger et al., 2018). The product is derived from the ASCAT surface soil moisture (SSM) data using a two-layer water balance model that estimates the surface and profile soil moisture as a function of time (Wagner et al., 1999; Albergel et al., 2008). The operational ASCAT SWI data are provided for eight different time characteristics (taken as soil depths), at 1 km resolution, and with daily mean values from 2015 to 2022. The product is archived by the Copernicus Land Service and has been validated in previous studies (e.g., Albergel et al., 2012; Paulik et al., 2014; Beck et al., 2021).
To evaluate our model at grid scales, we employ the characteristic time lengths of T2, representative of the near-surface soil layer (0–10 cm), and T10, representative of the sub-surface soil layer (10–30 cm). We choose the ASCAT 1 km SWI as the reference satellite product as it provides data at different depth layers; matches the Noah-MP model grid resolution (e.g., 1 km); and has been found to out-perform other similar products, such as the ESA-CCI SSM and the physics-informed machine learning GSSM 1 km product (Han et al., 2023), when evaluated against available ground measurements (Figs. A2–A3).
2.7 Analysis
2.7.1 Model evaluation using in situ data
The half-hourly or hourly station data and model outputs for each grid cell are aggregated to daily averages for consistency. For each validation site, variable, and available time period, the daily mean values from the respective model grid cell are extracted at the model resolution (1 km). The daily values of topsoil (0–7 cm) temperature and of topsoil and sub-surface (7–28 cm) volumetric water content are compared against the available in situ measurements. The model-estimated values are then evaluated using the root mean square deviation (RMSD), the percent bias (PBIAS), and Pearson's Correlation Coefficient (R).
2.7.2 Model evaluation using satellite data
Given the limited number of in situ sites and the scale differences between point observations and the model grid resolution, the general interpretation of model performance across landscapes should be treated with care. However, the use of satellite data is a standard and pragmatic way of evaluating model outputs of soil moisture over large spatial scales (He et al., 2023), notwithstanding the inherent uncertainty (e.g., coarse resolution and data gaps) of the satellite products. We evaluate Noah-MP estimated soil moisture against the ASCAT SWI (Figs. A2–A3) for the surface and sub-surface layers. To ensure that the Noah-MP soil moisture is comparable with the ASCAT SWI at the grid scale, we derive a standardized relative soil moisture (RSM) index, which varies between 0 for wilting point and 1 for saturation (e.g., Samaniego et al., 2018), as follows:
where is the simulated volumetric water content, and θsat and θwilt are the soil moisture at saturation and wilting point, respectively (Fig. 3). We obtain RSM values for both the surface and sub-surface soil layers. For the surface layer, ASCAT SWI-002 data, which imply surface soil moisture conditions, are compared against the model-derived RSM values for the topmost model soil layer (0–7 cm). For the sub-surface, RSM values are taken as the mean aggregated values over the three topmost model soil layers and are evaluated against the ASCAT SWI-100. Similar metrics are used for the point-scale evaluation (see Sect. 2.7.1) and are also calculated at the grid scale based on the reference datasets and model outputs for selected dry (2018) and normal (2019) years.
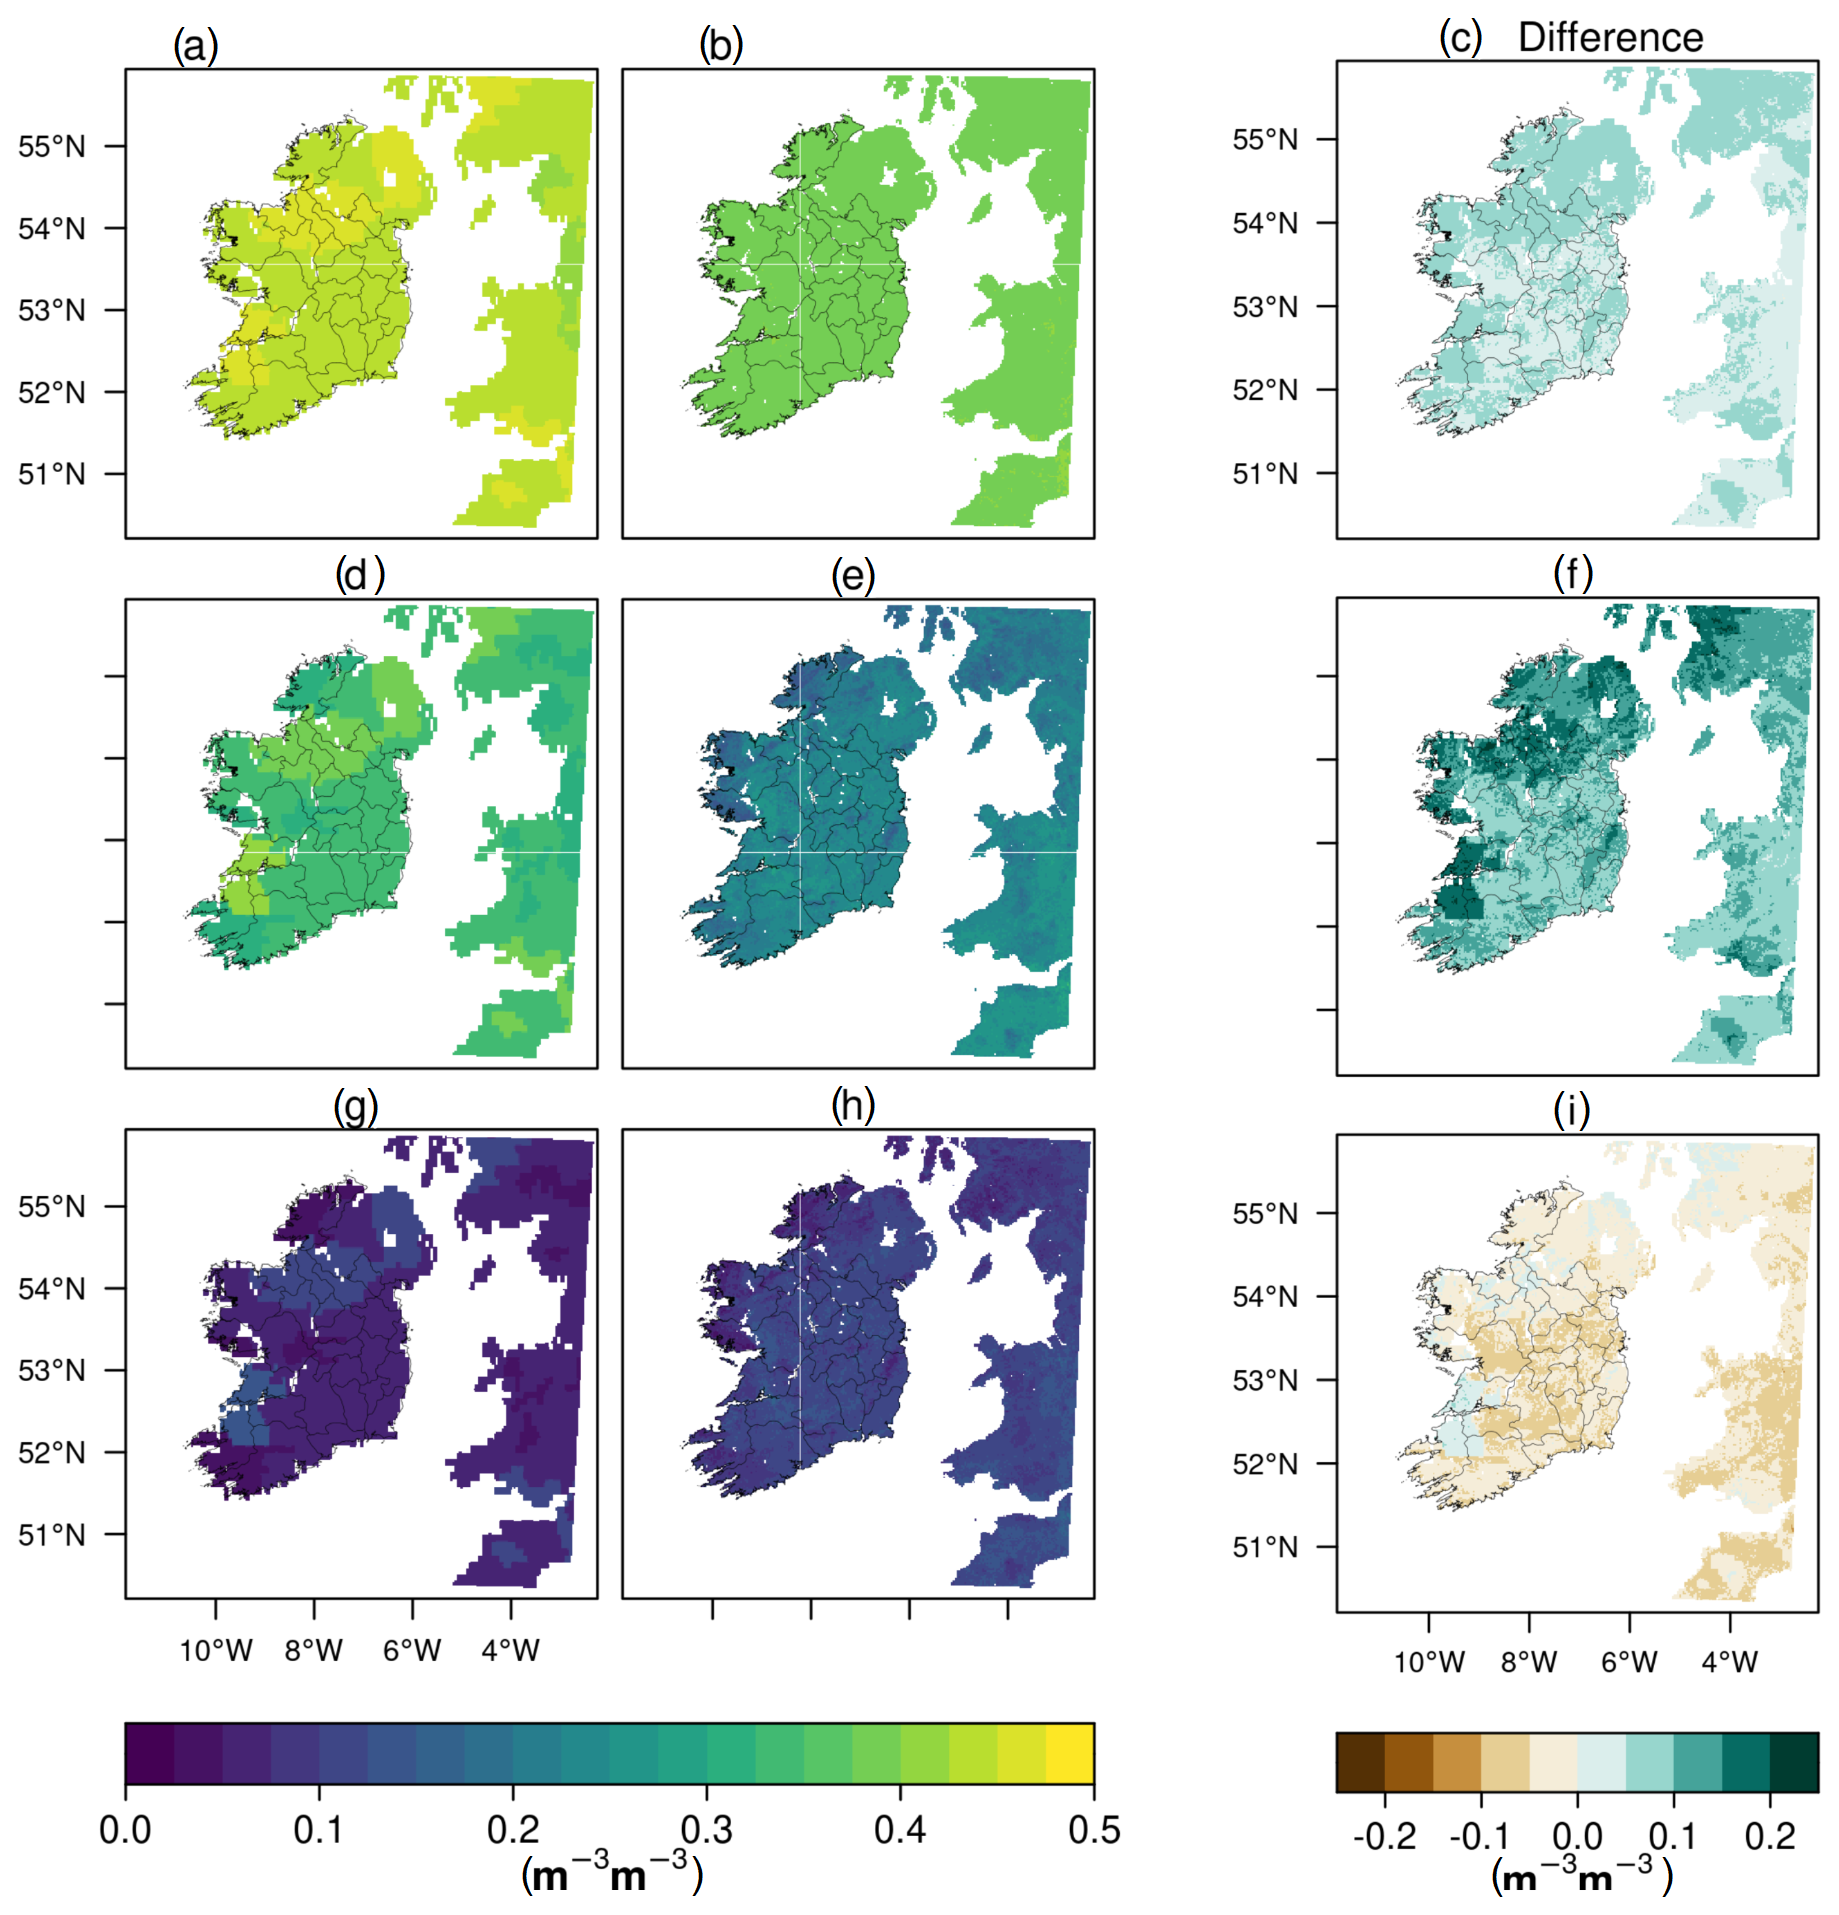
Figure 3Spatial characteristics of difference in absolute values between STATSGO and SoilGrids for (a–c) soil porosity, (d–f) field capacity, and (g–i) wilting point.
Additionally, differences between the near-surface soil moisture simulations are quantified for each grid (i,j) using the standard deviation difference (Δσ) as a measure of spread between the two soil datasets.
In the above, θ is the VWC value at time k, and n is the total number of daily soil moisture values from 2009 to 2022.
2.7.3 Transition from energy-limited to water-limited regime
We also analyze the potential of Noah-MP for simulating the evolution of an agricultural drought across the domain. Since the west-central European summer drought of 2018 was an exceptional event in terms of hydrological extremes across Ireland (Met Éireann Report, 2018; Falzoi et al., 2019; Moore, 2020; Ishola et al., 2022), we evaluated the model over this period. We apply grid-scale cumulative RSM values integrated over the three topmost soil layers (0–100 cm) (Sect. 2.7.2) due to their simplicity and ease of use in quantifying and interpreting available soil water data. Additionally, the RSM metric reduces the impact of systematic biases in absolute values and/or the impact of transient errors associated with short-term fluctuations in absolute VWC values. In principle, RSM is an important drought indicator, particularly at short timescales, and is analogous to the widely used Soil Moisture Index (SMI) for drought monitoring (Samaniego et al., 2018; Grillakis, 2019). To characterize decreasing soil moisture during a drought period, percentiles of RSM values per grid cell are calculated based on 7 d moving windows from June to August for the climatological period of 2009–2022. This amounts to 98 samples (7 d × 14 years) as inputs per window. For individual model experiments with STATSGO and SoilGrids, the derived spatial RSM percentiles per day in each window are then classified into different drought categories ranging from least to most severe (Table 4), following Xia et al. (2014). These categories are currently employed by the US Drought Monitor (USDM) for operational and regionally specific drought monitoring (Svoboda et al., 2002).
Table 4Definitions of drought categories based on relative soil moisture (RSM) percentiles.
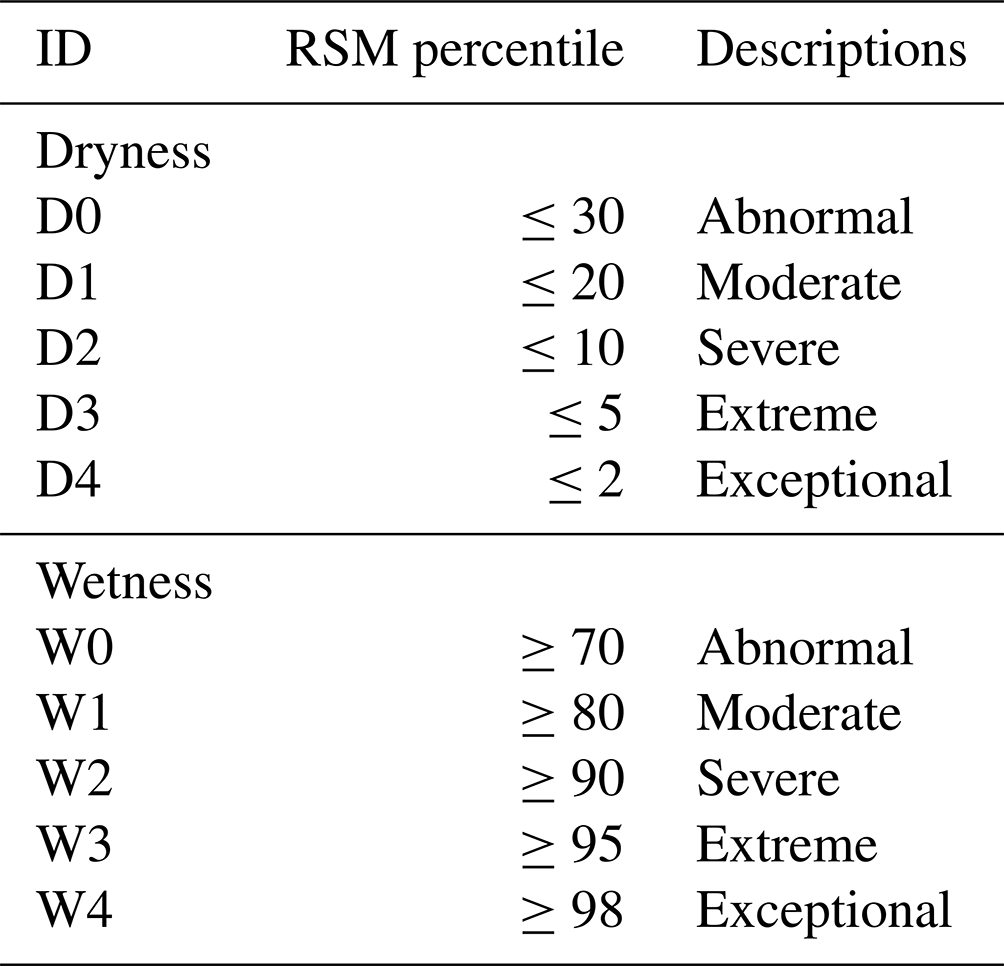
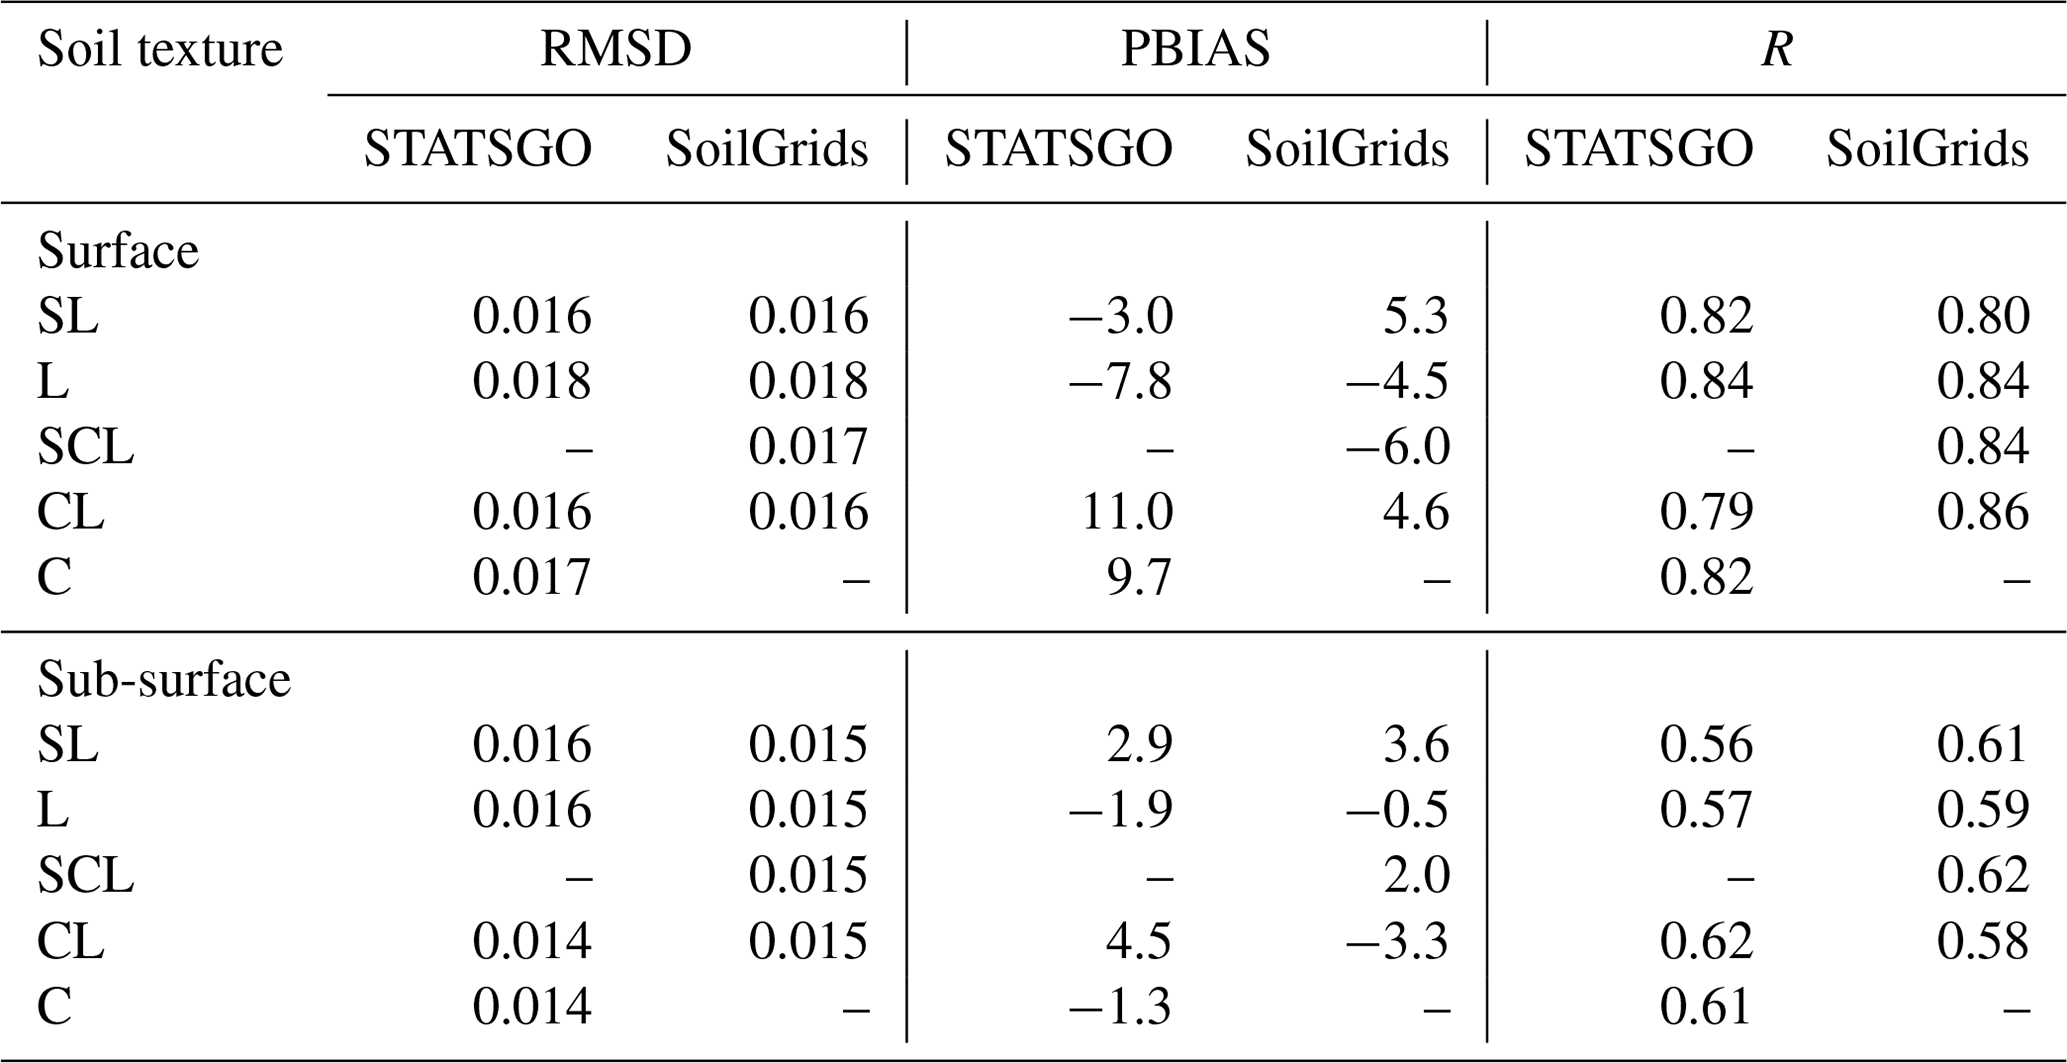
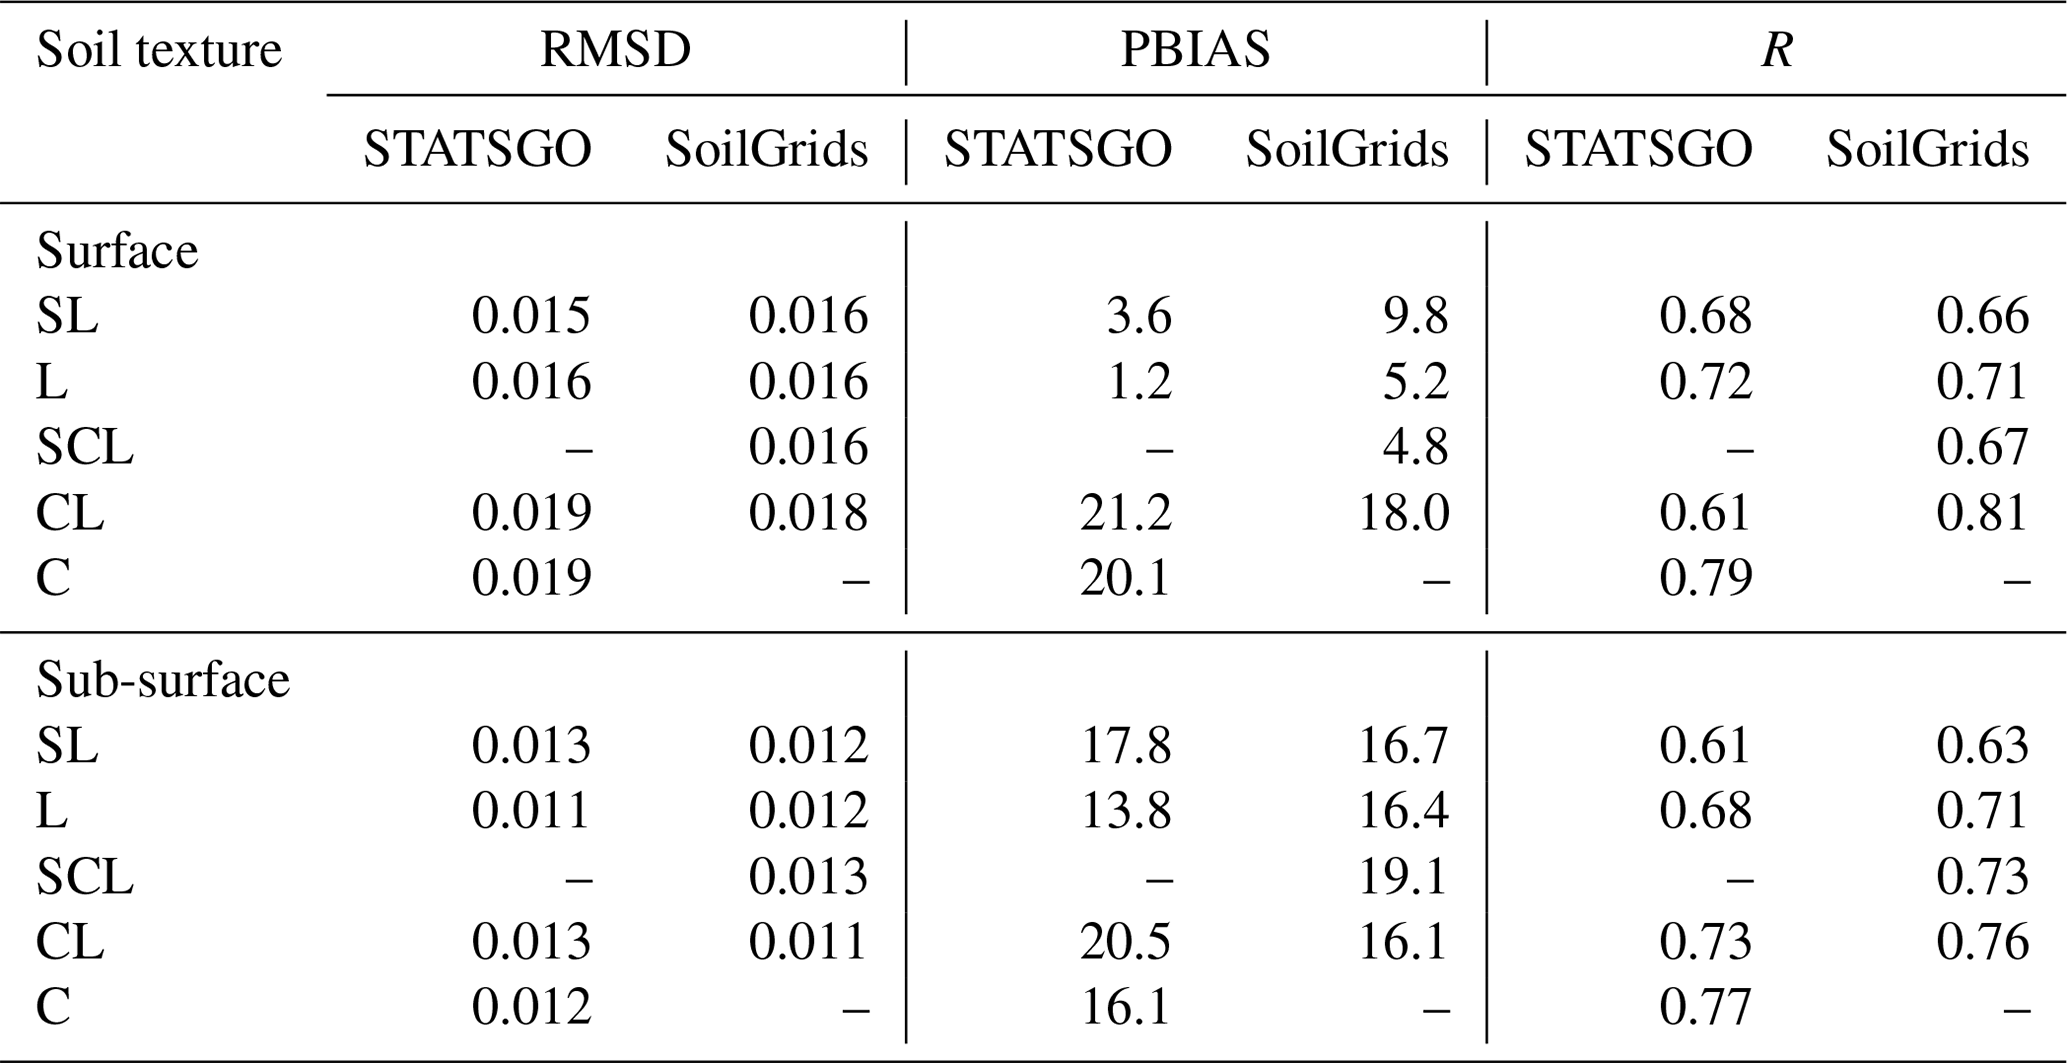
Table 5Performance statistics of relative soil moisture (RSM) for various soil texture categories in the topsoil (0–10 cm) and sub-surface (0–100 cm) layers in STATSGO and SoilGrids for the year 2018. The errors are the median grid values. SL denotes sandy loam, L denotes loam, SCL denotes sandy clay loam, CL denotes clay loam, and C denotes clay.
First, we present a comparison of the ERA5-Land total annual precipitation against station data to identify any significant differences between the observed and input meteorology during the respective measurement periods. Figure 4 shows that the total cumulative precipitation over the periods of interest are well replicated in the ERA5-Land precipitation data across the selected stations, including during the extended period of no rainfall during the summer months of 2018 (Fig. 4f).
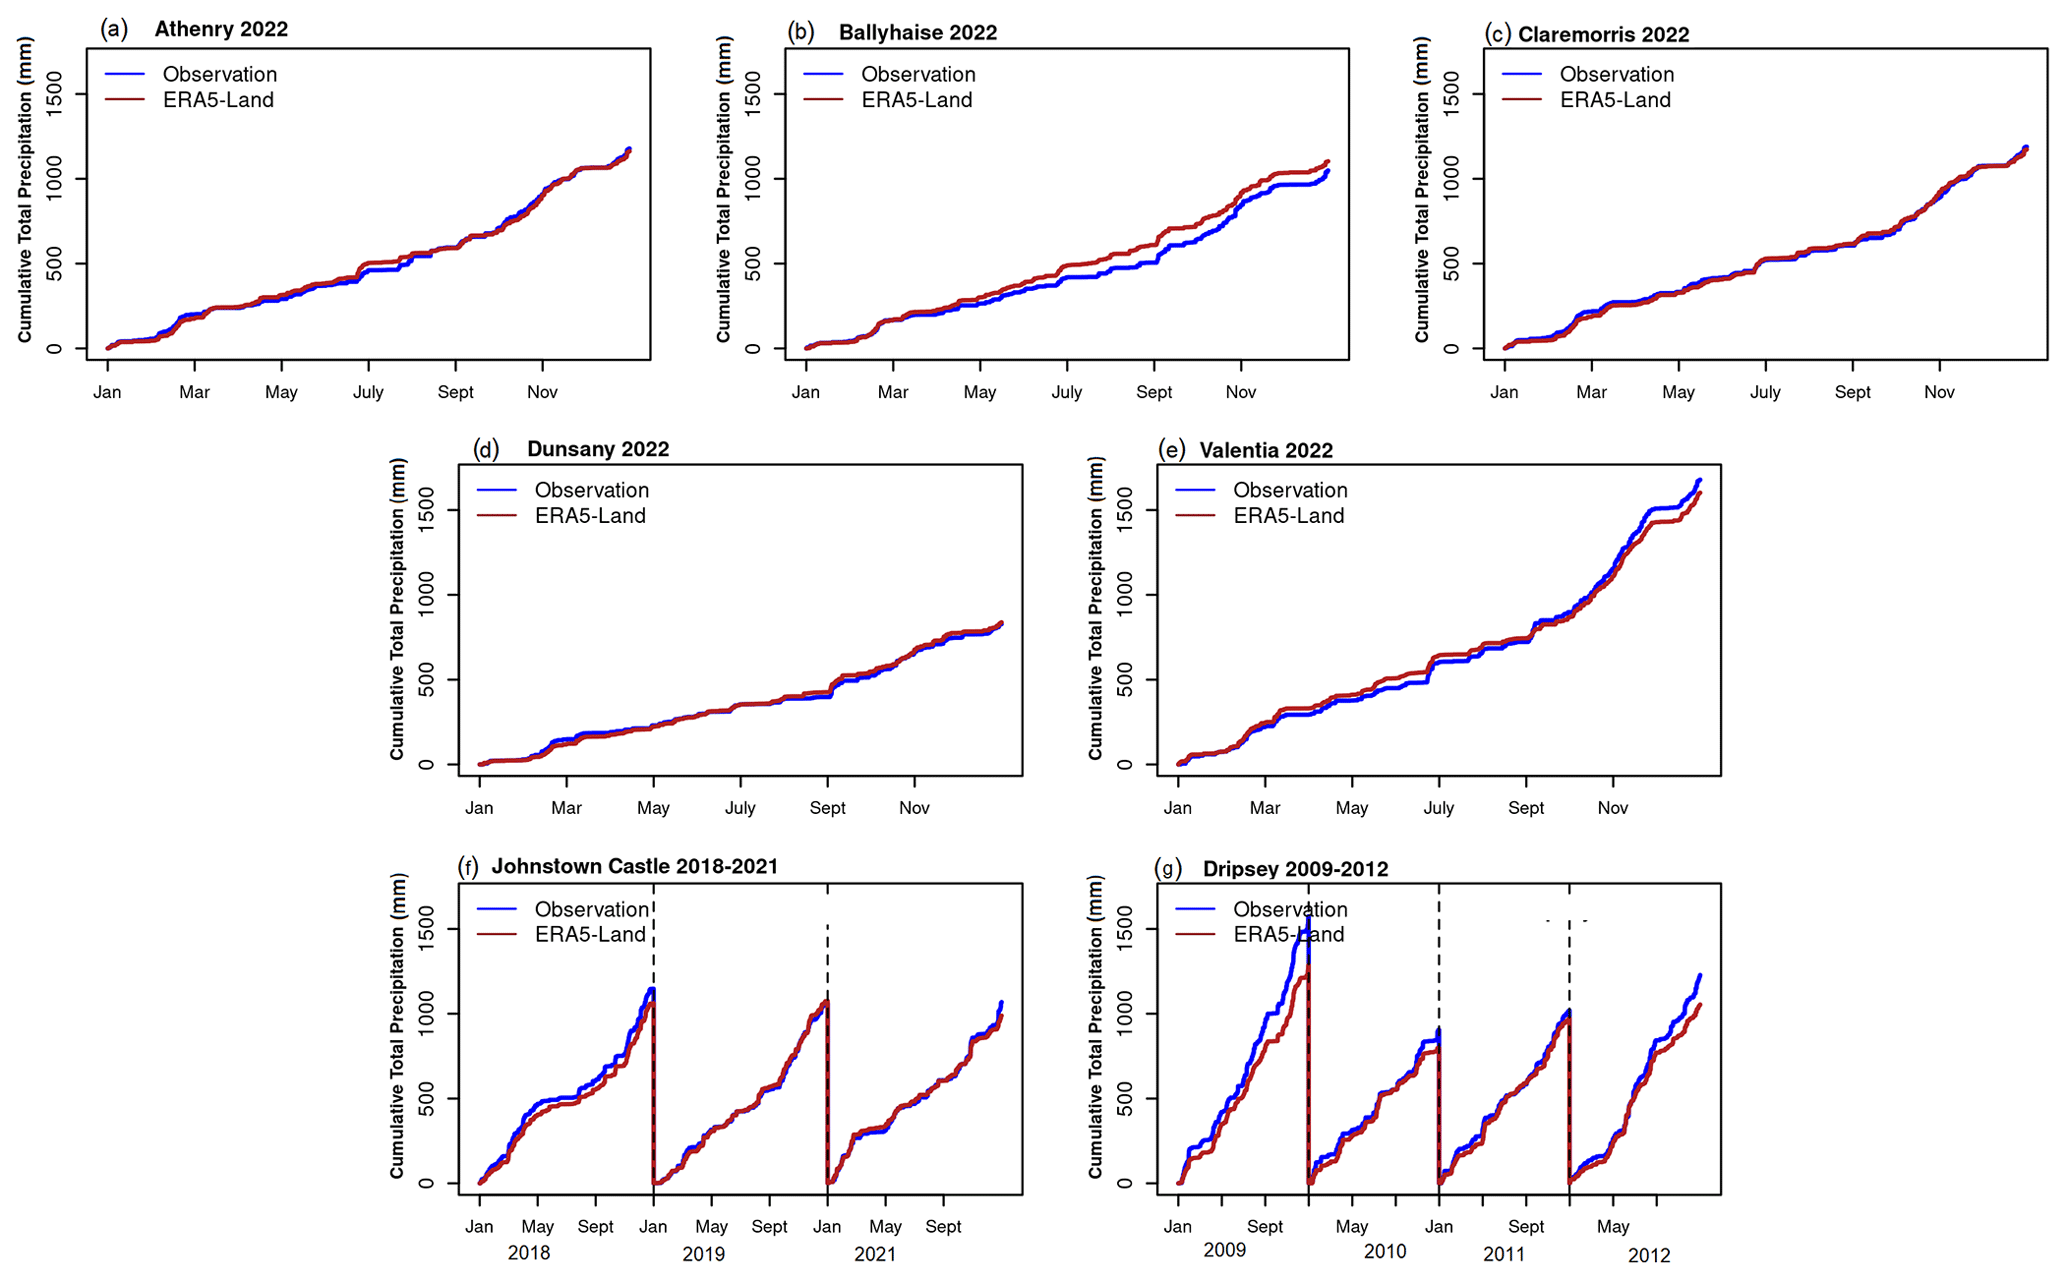
Figure 4Temporal comparisons of observed total annual cumulative precipitation at the selected reference stations against the ERA5-Land colocated grids.
3.1 Model evaluation: soil moisture
3.1.1 Station observations
The results of model simulations of near-surface and sub-surface volumetric water content (VWC, in m3 m−3) for both STATSGO and SoilGrids are presented for the periods when measurements are available at the selected sites. Figures 5 and A4 illustrate the comparisons and error statistics of near-surface VWC between the measured (0–5 cm) and modeled (0–7 cm) layers, while the sub-surface VWC is illustrated in Fig. A5. It is important to note that we are comparing a 1 km model grid (areal) and a measurement point, which are assumed to be equivalent. Also, we are evaluating the model simulations of the top 20 cm VWC values at Johnstown Castle and Dripsey, the two flux sites, in the absence of near-surface (0–5 cm) VWC data for these locations.
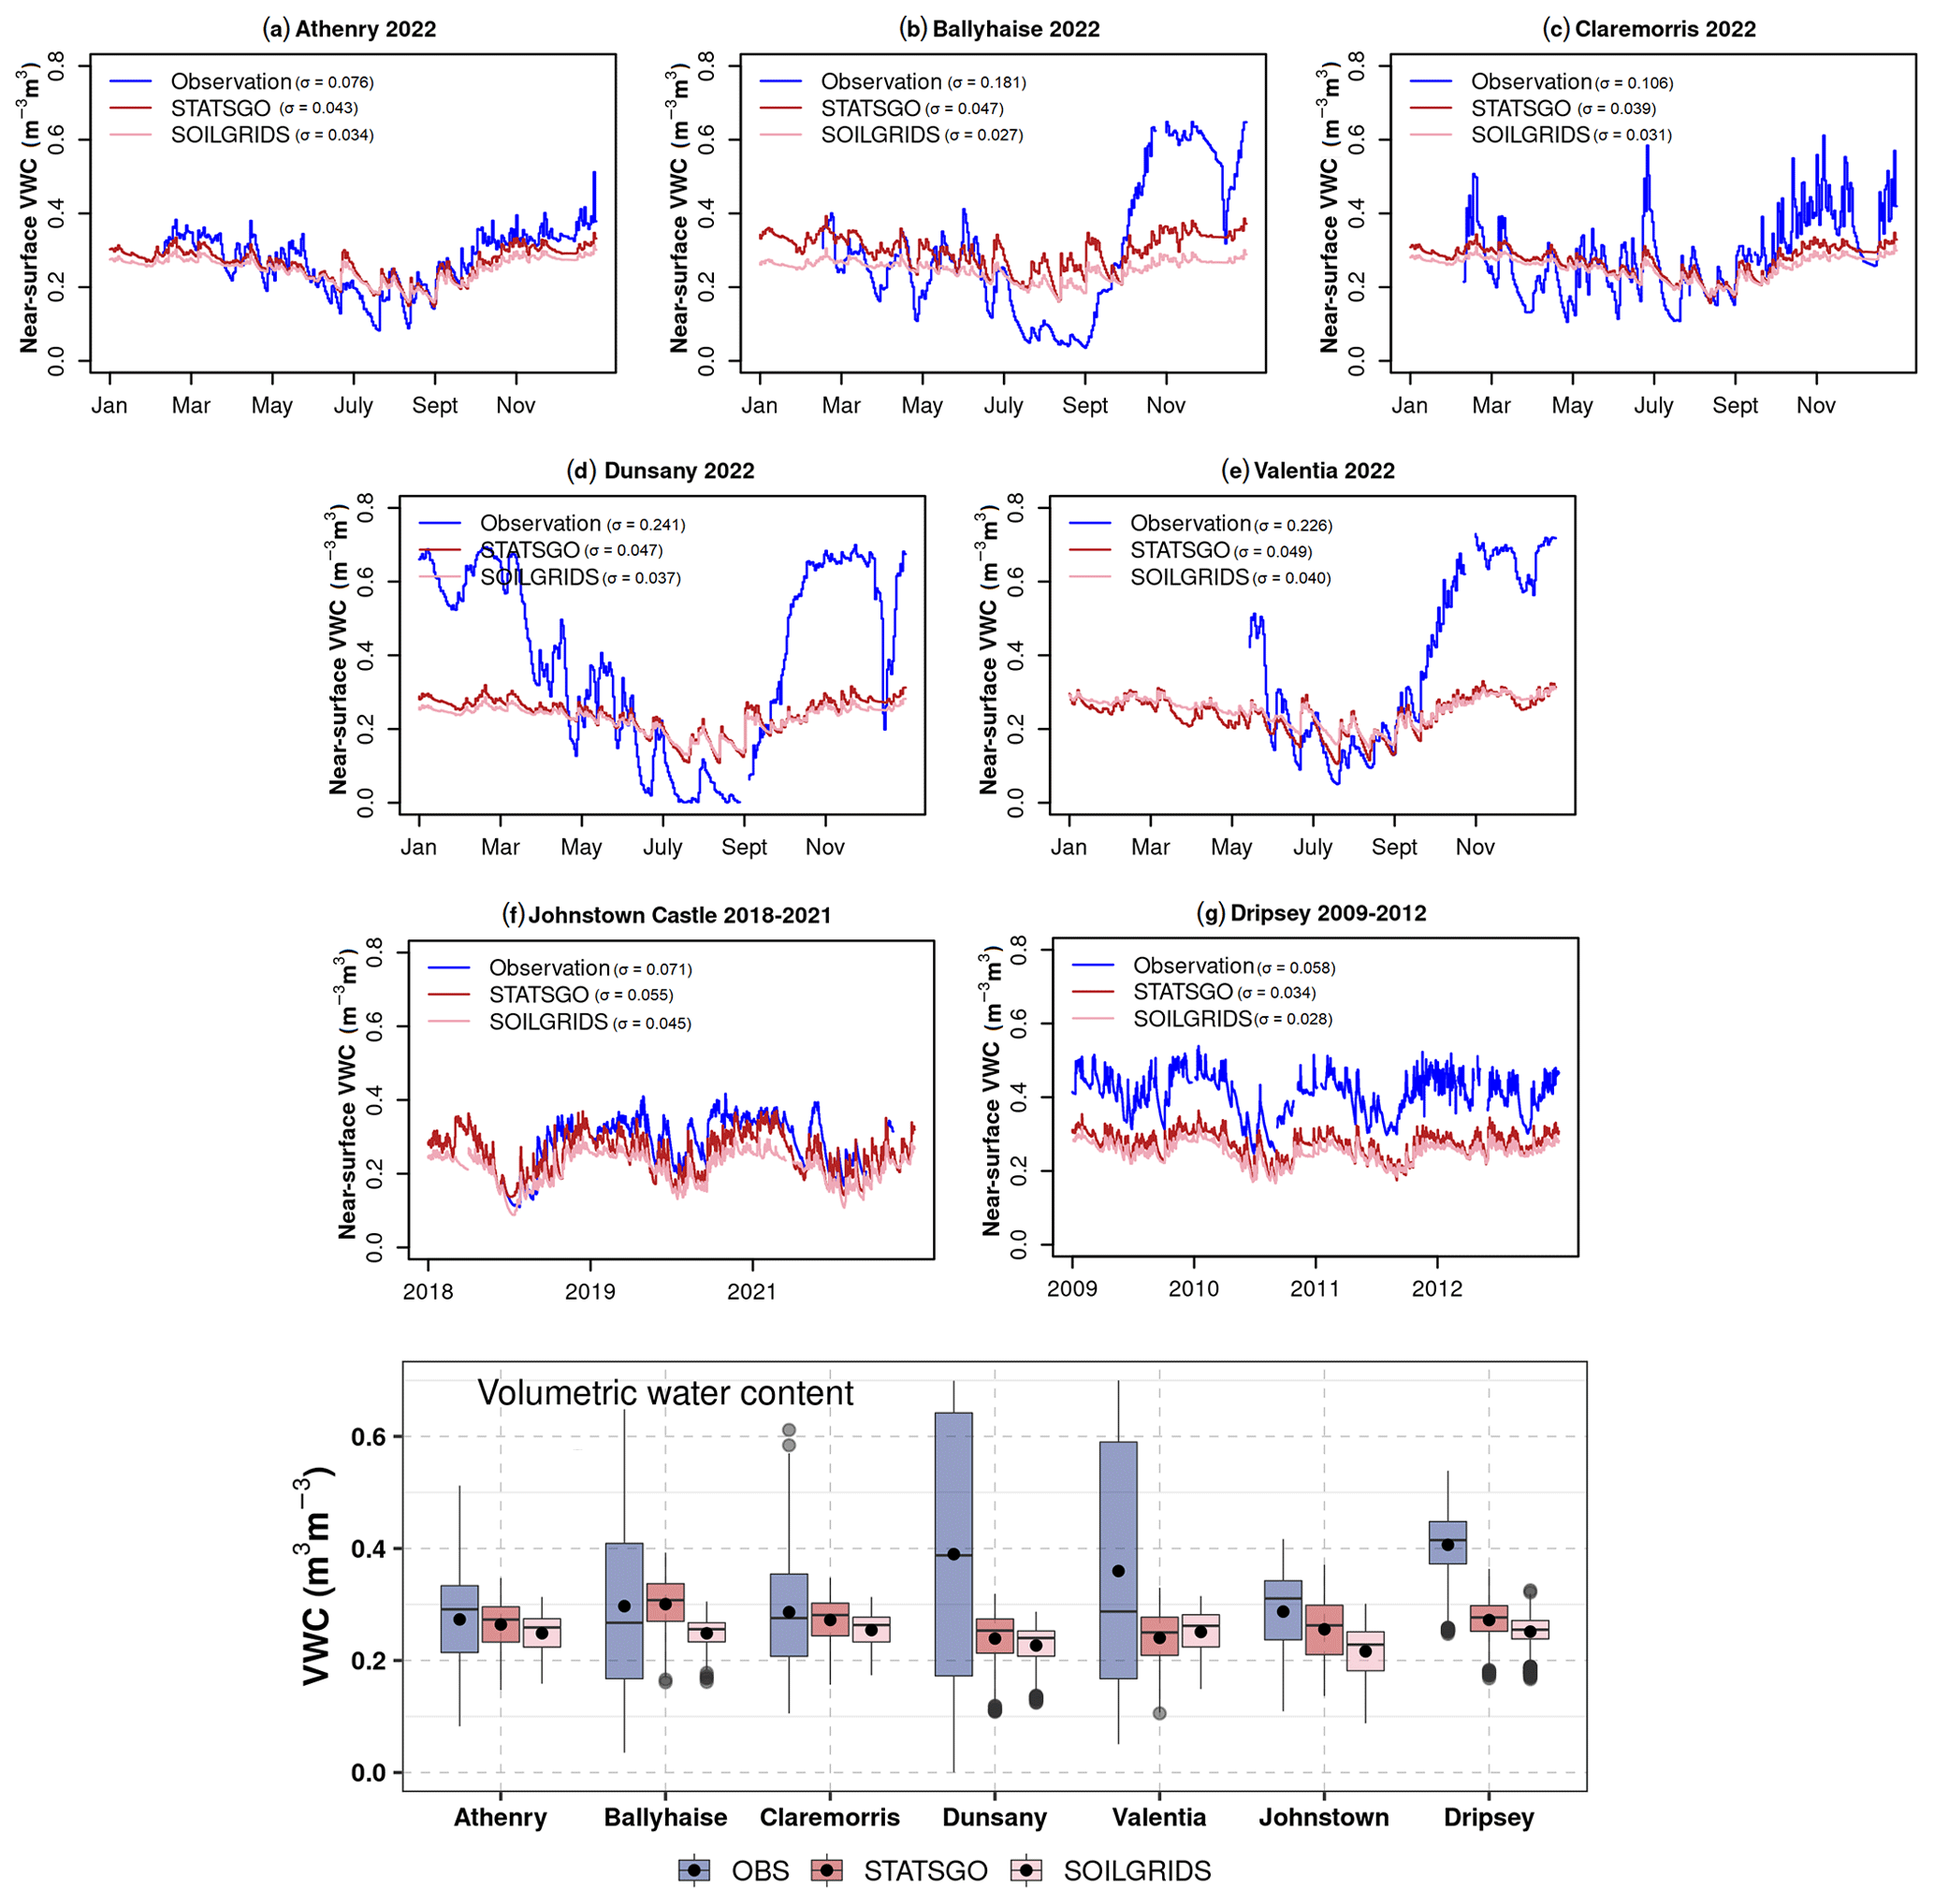
Figure 5(a–g) Temporal comparisons of near-surface volumetric water content and boxplots of data distribution between observations at 5 cm and simulated values at 0–7 cm for the selected reference stations. For Johnstown Castle and Dripsey (f–g), the model simulations are evaluated against the available observations in the top 20 cm. The black dots in the boxes represent the mean values.
Based on the analysis, the near-surface simulations are in closer agreement with the observed VWC at Athenry, Claremorris, and Johnstown Castle, with the lowest error statistics (RMSD ≈0.1 m3 m−3 and PBIAS <∼ 25 %) relative to other stations (Fig. A4). While the model outputs appear to more closely match the observations during the summer months at Valentia (Fig. 5e), the model significantly underestimates the measured VWC outside of these months, impacting the overall model performance at the station (Fig. A4). The Pearson's correlation is generally high, above 0.8, across the measurement sites, with the exception of Ballyhaise (>0.71) and Claremorris (>0.63). The lowest model performance in terms of RMSD and PBIAS occurs at Dunsany, Valentia, and Dripsey, with RMSD >0.15 m3 m−3 and PBIAS >30 % (Fig. A4).
Model simulations with both soil datasets broadly underestimate the observed VWC values in the autumn and winter months, but the model bias is lower in the STATSGO experiment compared to the SoilGrids experiments, a finding that is broadly consistent across the stations (Fig. A4). Dry biases (0.15–0.4 m3 m−3) are evident in autumn and winter, during which time the measured VWC values are higher (Fig. 5a–e), except at Dripsey, where a systematic dry bias is evident throughout the entire simulation period (Fig. 5g). Conversely, during summer, when soil moisture conditions tend to dry in response to atmospheric forcing (e.g., higher global solar radiation and evaporation), VWC temporal patterns are reasonably captured by both model experiments (biases are less than 0.1 m3 m−3), including during 2018, which experienced exceptionally dry soil moisture contents during the summer months (Fig. 5f). The differences between STATSGO and SoilGrids are relatively small (<0.05 m3 m−3) across the year(s); however, seasonal differences are evident at some sites, likely due to the generally higher soil porosity and FC values in STATSGO relative to SoilGrids (Fig. 3a–f).
Interestingly, both model experiments are capable of broadly replicating the measured near-surface VWC values at Athenry (well-drained), Claremorris (well-drained), and Johnstown Castle (imperfectly drained), where the soils are classified as either well-drained or imperfectly drained (Fig. 1a; Table 1), but the simulations underestimate the variability (Fig. 5a, c, and f). In contrast, for locations classified as poorly drained, namely Ballyhaise, Dunsany, and Dripsey (Fig. 5b, d, and g), the model does not perform well. The model appears to be able to replicate measured VWC during the summer months at Valentia, which is classified as well-drained, but performs poorly for the remaining months (Fig. 5e). Figure 5 (boxplot) further illustrates the summary statistics of and spread in the model-simulated and observed VWC. The mean observed VWC (≈0.3 m3 m−3), calculated over the available measurement periods, is better captured in STATSGO than in SoilGrids, particularly at Athenry, Ballyhaise, Claremorris, and Johnstown Castle. However, where the mean observed VWC exceeds this value (e.g., >≈0.3 m3 m−3), both experiments lead to a significant underestimation of VWC, as is evident at Dunsany, Valentia, and Dripsey.
3.1.2 Model comparison with reference ASCAT satellite SWI data
While the selected measurement stations are well distributed and represent different soil moisture regimes across Ireland (Fig. 1a), given the relatively small number of stations, generalizing the results to the entire domain may not be justified. To address this, we evaluated all model grid cells individually against the reference ASCAT satellite data. Prior to undertaking the grid-based analysis, we compared the ASCAT SWI, rescaled to match the mean and standard deviation of the measured values at the site of interest, to the available measured data at the sites. The ESA-CCI SM is also included in the figures; however, the ESA-CCI SM product reports absolute values of VWC (m−3 m−3) for the top layer at 0.25° resolution. On the basis of the rescaled values, the ASCAT SWI is shown to largely reproduce the temporal variability of the measured values, indicating its suitability for use across the domain (Figs. A2–A3). Figure 6 shows the results of the whole-island grid-scale evaluation (n=131 000 grid values), which compares daily RSM values, derived from the STATSGO and SoilGrids simulations, against the reference ASCAT SWI at the surface and sub-surface for the 2018 dry year and the 2019 normal year. Median metrics for each soil texture category in STATSGO and SoilGrids are presented in Tables 5 and 6.
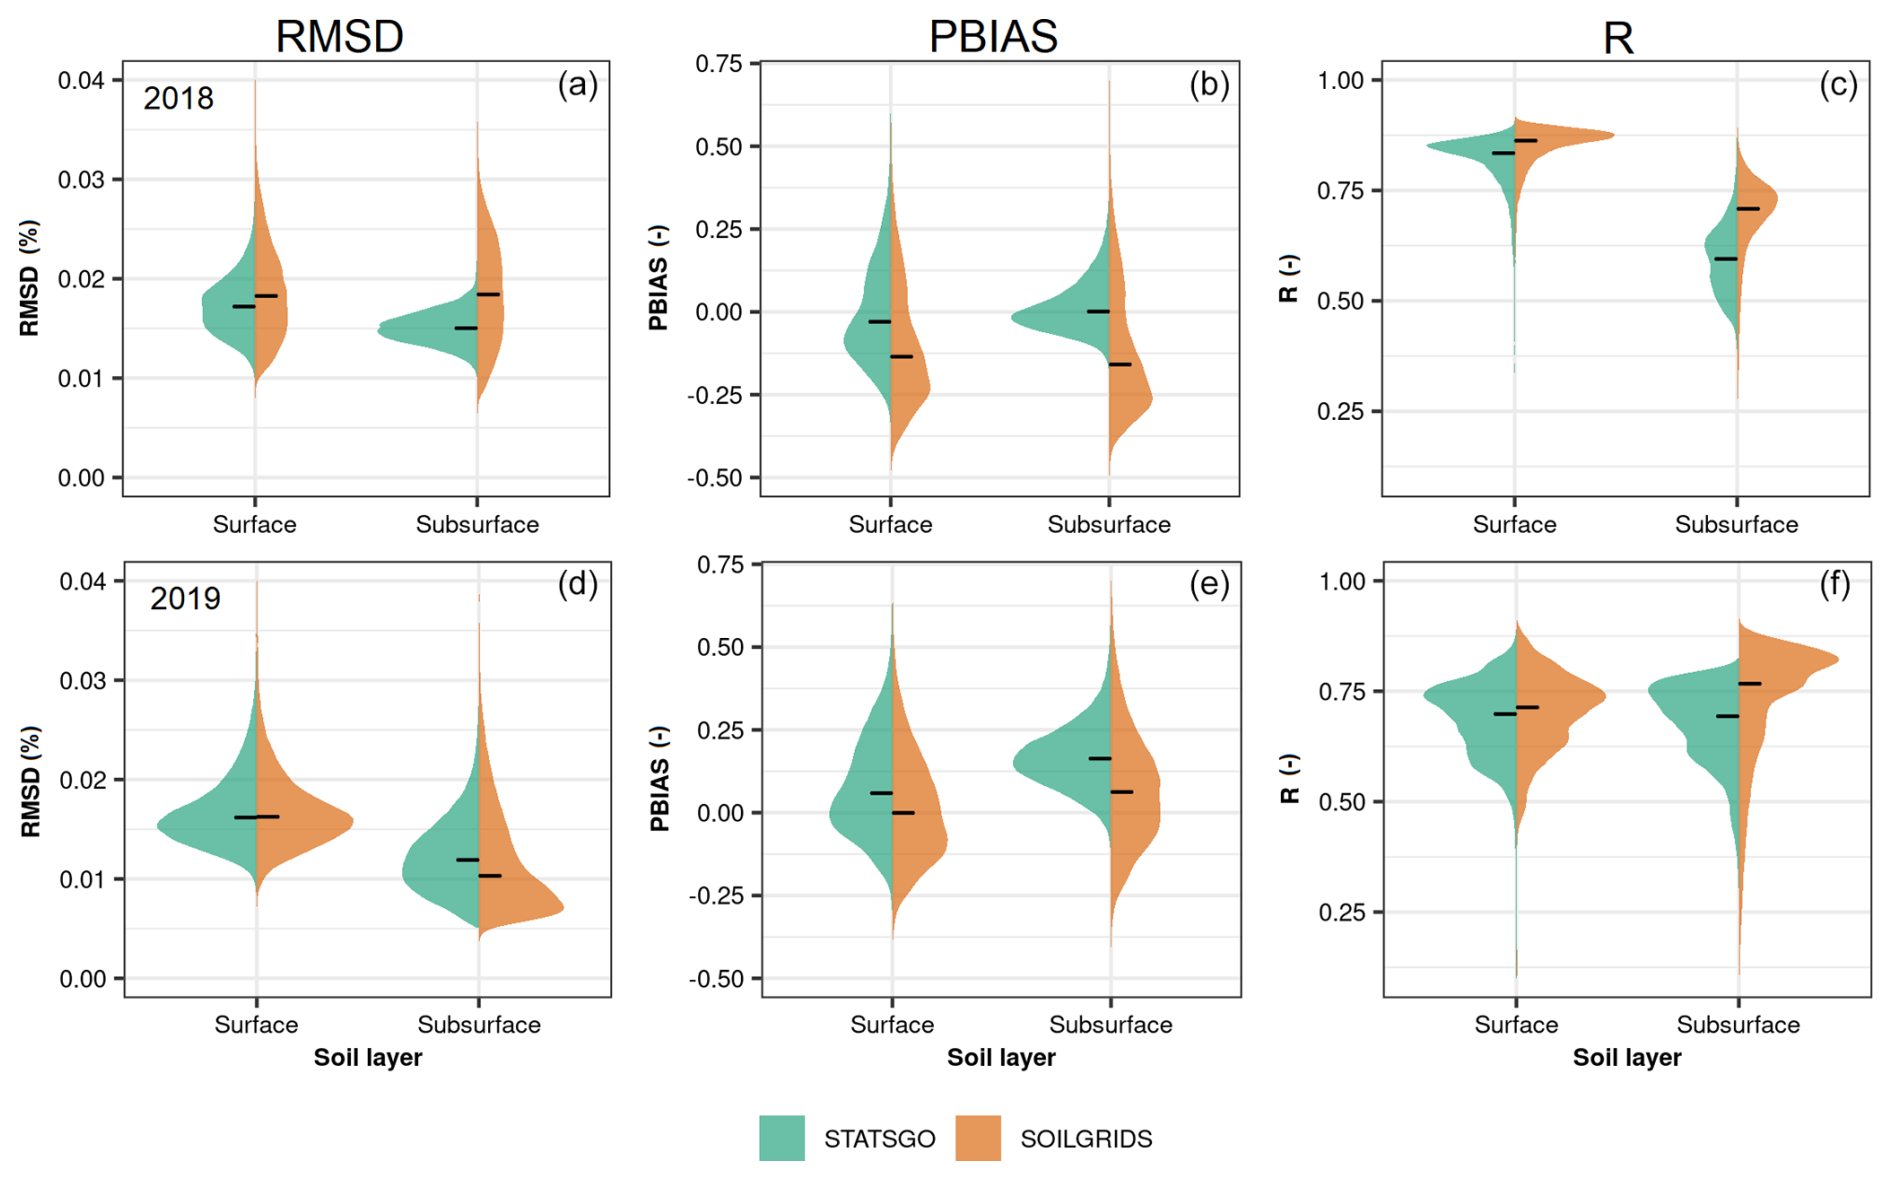
Figure 6Performance statistics for STATSGO and SoilGrids relative soil moisture (RSM) values in the topsoil layer (0–7 cm) and sub-surface soil layer (0–100 cm) compared to satellite-based ASCAT Soil Water Index (SWI) for 2018 (a–c) and 2019 (d–f). N = 131 000 cells. The black crossbars are the median values.
Table 6Performance statistics of relative soil moisture (RSM) for various soil texture categories in the topsoil (0–10 cm) and sub-surface soil (0–100 cm) in STATSGO and SoilGrids for the year 2019. The errors are the median grid values. SL denotes sandy loam, L denotes loam, SCL denotes sandy clay loam, CL denotes clay loam, and C denotes clay.
As shown in Fig. 6 (top) for the 2018 dry year, the median statistics indicate that STATSGO has lower RMSD values compared to SoilGrids for both the surface and sub-surface layers and PBIAS values that lie closer to 0. While the Pearson's R statistics (median around 0.85) for STATSGO and SoilGrids are comparable for the surface layer, the SoilGrids experiment produces a higher R value in the sub-surface layer during the dry year. For the 2019 normal year (Fig. 6, bottom), SoilGrids displays equivalent or lower error statistics for the surface layer, with a median RMSD of 0.016 %, PBIAS of around 1 % (6 % for STATSGO), and R of 0.73. For the sub-surface layer, SoilGrids produces better results than STATSGO, with lower RMSD (0.01 %) and PBIAS (6%) and a higher R value (median of approximately 0.76).
The extended tails (positive or negative in PBIAS and lower or higher in RMSD and R) in the density distribution indicate the spread in RMSD, PBIAS, and R values. Given the fact that the loam (L) and sandy loam (SL) soils represent the largest proportion of grid cells across the study domain and are relatively comparable in terms of spatial coverage in STATSGO and SoilGrids (Table 2), the error statistics for these soil texture categories are further explored here. For 2018, results show that both experiments produce lower RMSD error statistics for SL than for L at the surface layer, while STATSGO has lower PBIAS for SL than for L (Table 5). For the sub-surface layer, both soil datasets have similar RMSDs and lower PBIAS for L compared to for SL. For the 2019 normal year (Table 6), both STATSGO and SoilGrids show improved PBIAS for L compared to for SL in both the surface and sub-surface layers. STATSGO has equivalent or lower RMSD and lower PBIAS error statistics than SoilGrids at the surface layer. The RMSD and R statistics are relatively comparable in both the surface and the sub-surface layers for both the STATSGO and SoilGrids simulations and for the L and SL soil categories. However, STATSGO produces lower PBIAS statistics than SoilGrids for SL in 2018 (surface and sub-surface) and for SL (surface) and L (surface and sub-surface) in 2019. For 2019, these findings are in contrast with those of the previous analysis based on all grid cells and independent of soil texture class (Fig. 6).
The spatial characteristics of the ASCAT SWI and model-derived surface RSM values are shown in Fig. 7a–j, along with their differences, for the years 2018 and 2019. The long-term seasonal differences in the surface VWC between both experiments are also shown in Figs. A7–A8. For the surface VWC, both simulations largely exhibit a dry bias, increasing from the northwest to the southeast of the country; higher biases are evident in the eastern and southern parts of the country in SoilGrids relative to STATSGO (Fig. 7). The higher (dry) biases in both STATSGO and SoilGrids occur in regions that are largely classified as the L soil texture class in both soil datasets. The dry bias is larger in 2019 compared in to 2018 (dry year) and is higher for SoilGrids than for STATSGO. For the sub-surface values (Fig. A6), wet biases are evident in the northwest, west, and southwest, which are characterized as SL and clay loam in STATSGO and SL in SoilGrids. Toward the south and southeast of the domain, the results shift toward a dry bias, mostly in areas represented by L soils; more spatially extensive wet biases are evident in the normal year of 2019 compared to in 2018. While the spatial patterns in the wet and dry biases are broadly consistent for both experiments and years, the dry bias in both years is more pronounced in SoilGrids than in STATSGO, consistently with the surface layer. Conversely, the wet bias in the sub-surface layer is more widespread in STATSGO than in SoilGrids. While both soil datasets show the largest difference between the modeled and ASCAT SWI surface layers in the southeastern part of the country, this region displays the smallest between-model differences (<0.05 m−3 m−3) on a seasonal basis (Fig. A7). As expected, the largest differences between the model-estimated VWC are located in regions where the soil datasets have different soil texture classes (Fig. 2c) and, hence, different associated soil properties. For example, STATSGO has a region of clay loam (CL) soils to the northwest and a region of clay (C) soils on the west coast, which is in contrast to the SoilGrids L class, with different soil properties being associated with these classes (Fig. 3); the largest differences between the model runs (STATSGO − SoilGrids) are associated with the STATSGO clay loam locations, with STATSGO indicating generally wetter soils associated with both the clay loam and clay texture classes. While the wilting points are similar between both datasets, STATSGO has higher field capacity and soil porosity for these textural classes (C, CL) (Fig. 3). Both soil datasets have SL classes located along the western seaboard; however, STATSGO estimates lower VWC compared to SoilGrids in these regions (Fig. A7).
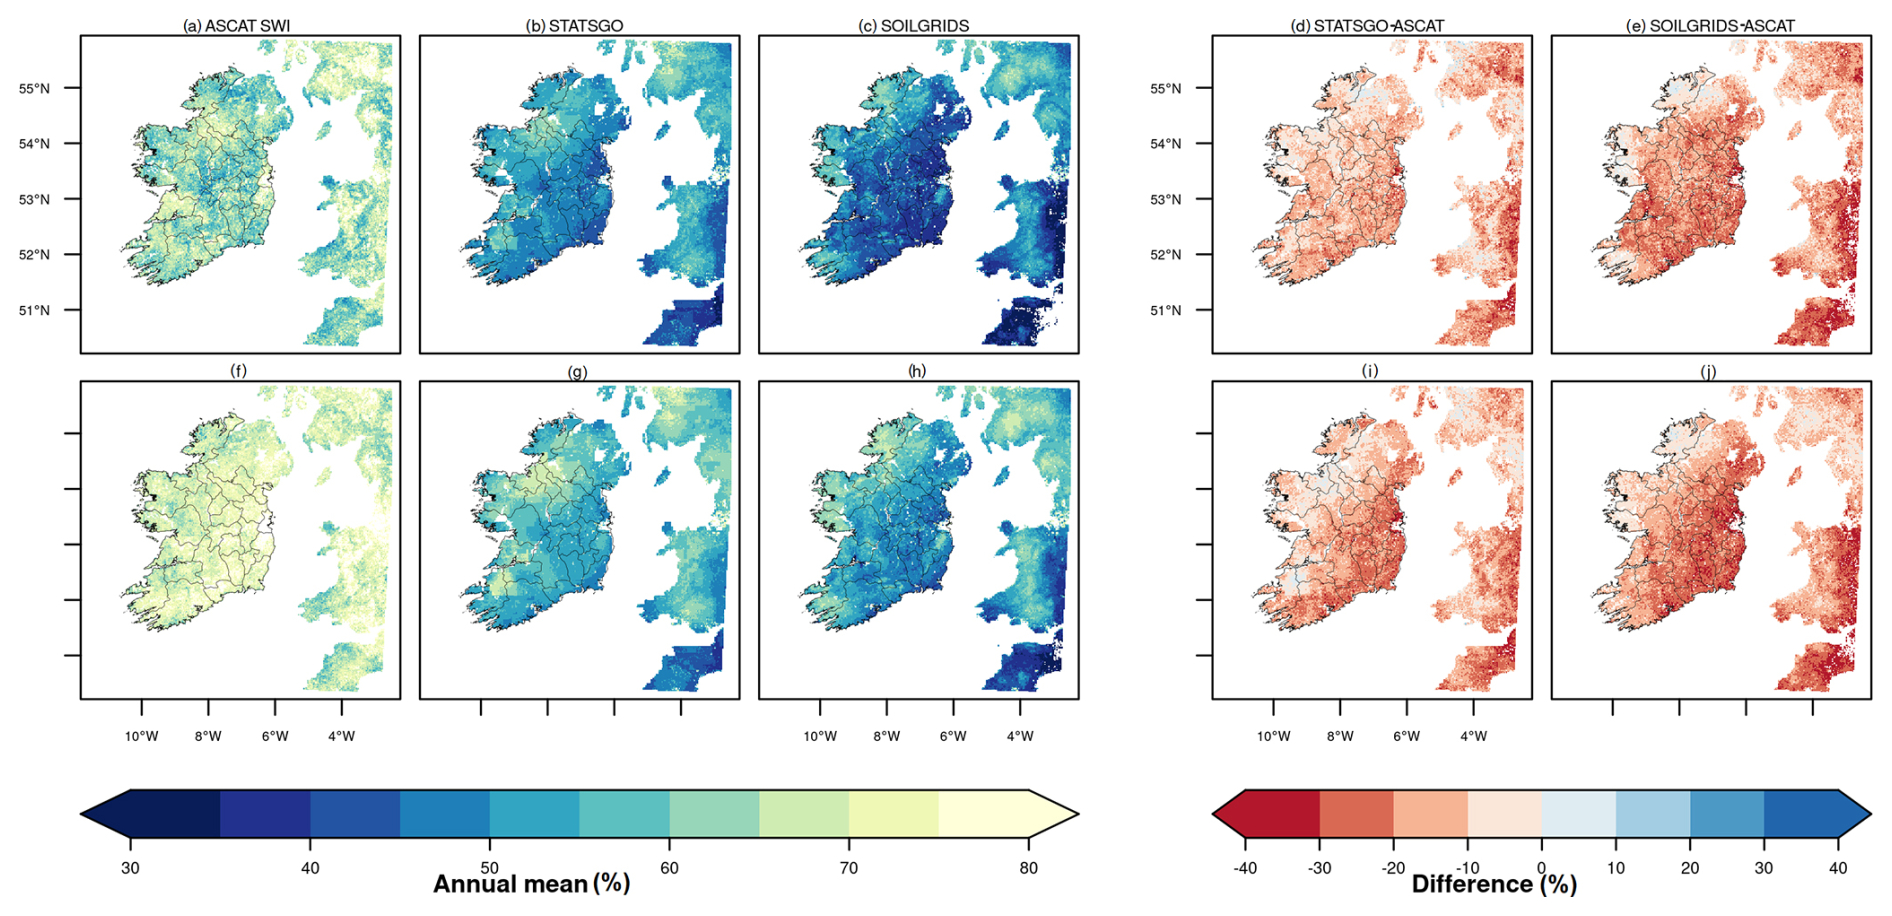
Figure 7Spatial characteristics of difference between satellite-based annual ASCAT Soil Water Index (SWI) and model-derived annual mean relative soil moisture (RSM) at the surface for (a–e) 2018 and (f–j) 2019.
3.2 Model evaluation: soil temperature
Figure 8a–g illustrate model comparisons against the reference station measurements of topsoil (0–5 cm) temperature, while Fig. A9 shows the associated evaluation results. Generally, the error statistics (RMSD and PBIAS) for both the STATSGO and SoilGrids experiments are low, and R values are high (above 0.9 across all sites). The model is closer to the observations for Athenry, Dunsany, Valentia, and Johnstown Castle (RMSD <3 K and PBIAS <1 %) compared to those for Ballyhaise, Claremorris, and Dripsey, where the errors exceeded these values. Comparatively, SoilGrids leads to a slightly better model performance than STATSGO across the sites.
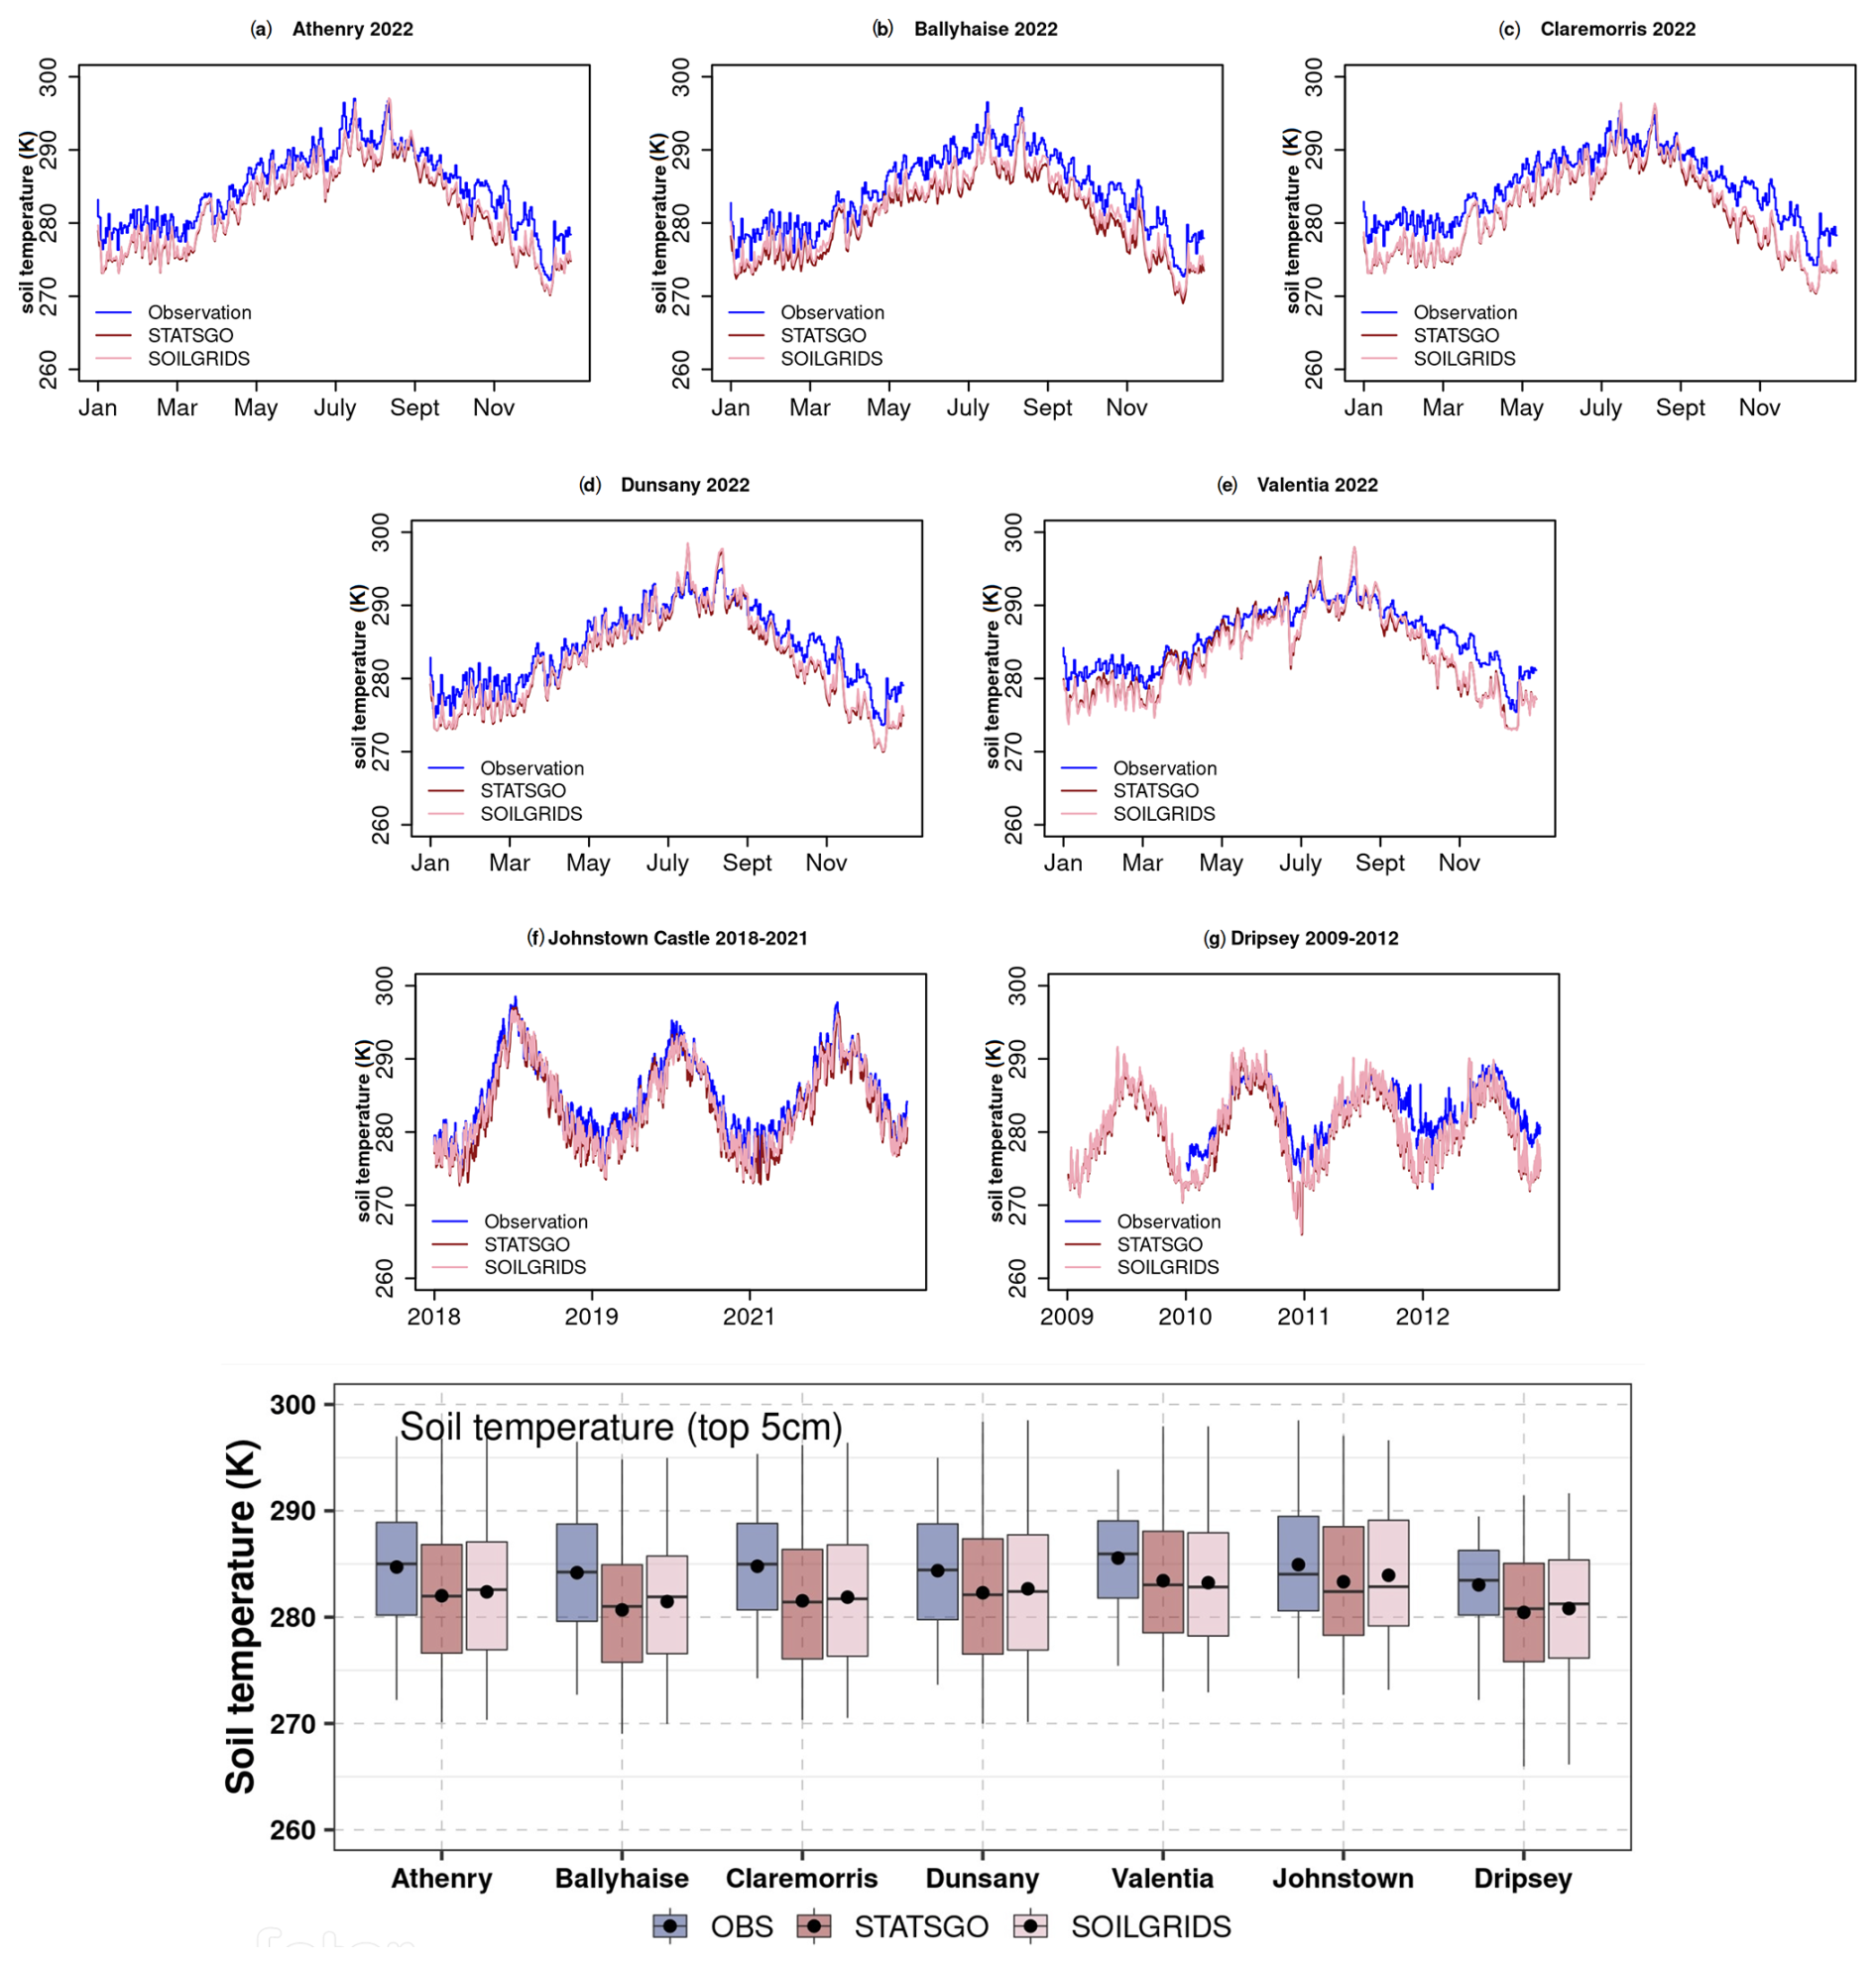
Figure 8(a–g) Temporal comparisons of soil temperature and boxplots of data distribution between observations and simulated values for the selected reference stations. The black dots in the boxes represent the mean values.
The spread of the observed soil temperatures is reasonably replicated in both experiments and for the selected year(s) across locations (Fig. 8, bottom). On the other hand, the mean of the observed soil temperature, which is approximately 285 K, is systematically underestimated by between 1 to 3 K across stations; however, the peak values in the mid-summer months are well captured by both experiments (Fig. 8a–g). Overall, both STATSGO and SoilGrids produce co-varying soil temperature profiles, but the differences between the measured and simulated values are statistically significant (p value ) for all sites.
Given the reasonable model performance across the selected locations, the grid-scale model differences in soil temperature between STATSGO and SoilGrids are examined further (Fig. 9). The spatial differences in terms of surface soil temperature are based on the seasonal climatology from 2009 to 2022. In response to seasonal variations in global solar radiation and VWC, winter shows the lowest soil temperatures (Fig. 9a and e), whereas summer is characterized as having the highest soil temperatures (Fig. 9c and g), widespread mostly over loam soil in the south and southeast of the study domain. The south and east are seasonally drier, experiencing lower rainfall and soil water deficits during the summer months (Figs. 1a and A7). The spatio-temporal evolution of the soil temperature characteristics is consistent in both STATSGO and SoilGrids throughout the year. Both soil datasets produce soil temperature differences that are low or negligible in the south and southeast, which are dominated by loam soils (Fig. 9i–l). However, STATSGO exhibits colder soil temperatures in clay and clay loam soils and warmer sandy loam soils in the north and southwest compared to SoilGrids. These areas, exhibiting differences in terms of cold and warm soil temperatures between STATSGO and SoilGrids, coincide with regions exhibiting wet and dry VWC biases (Fig. A7).
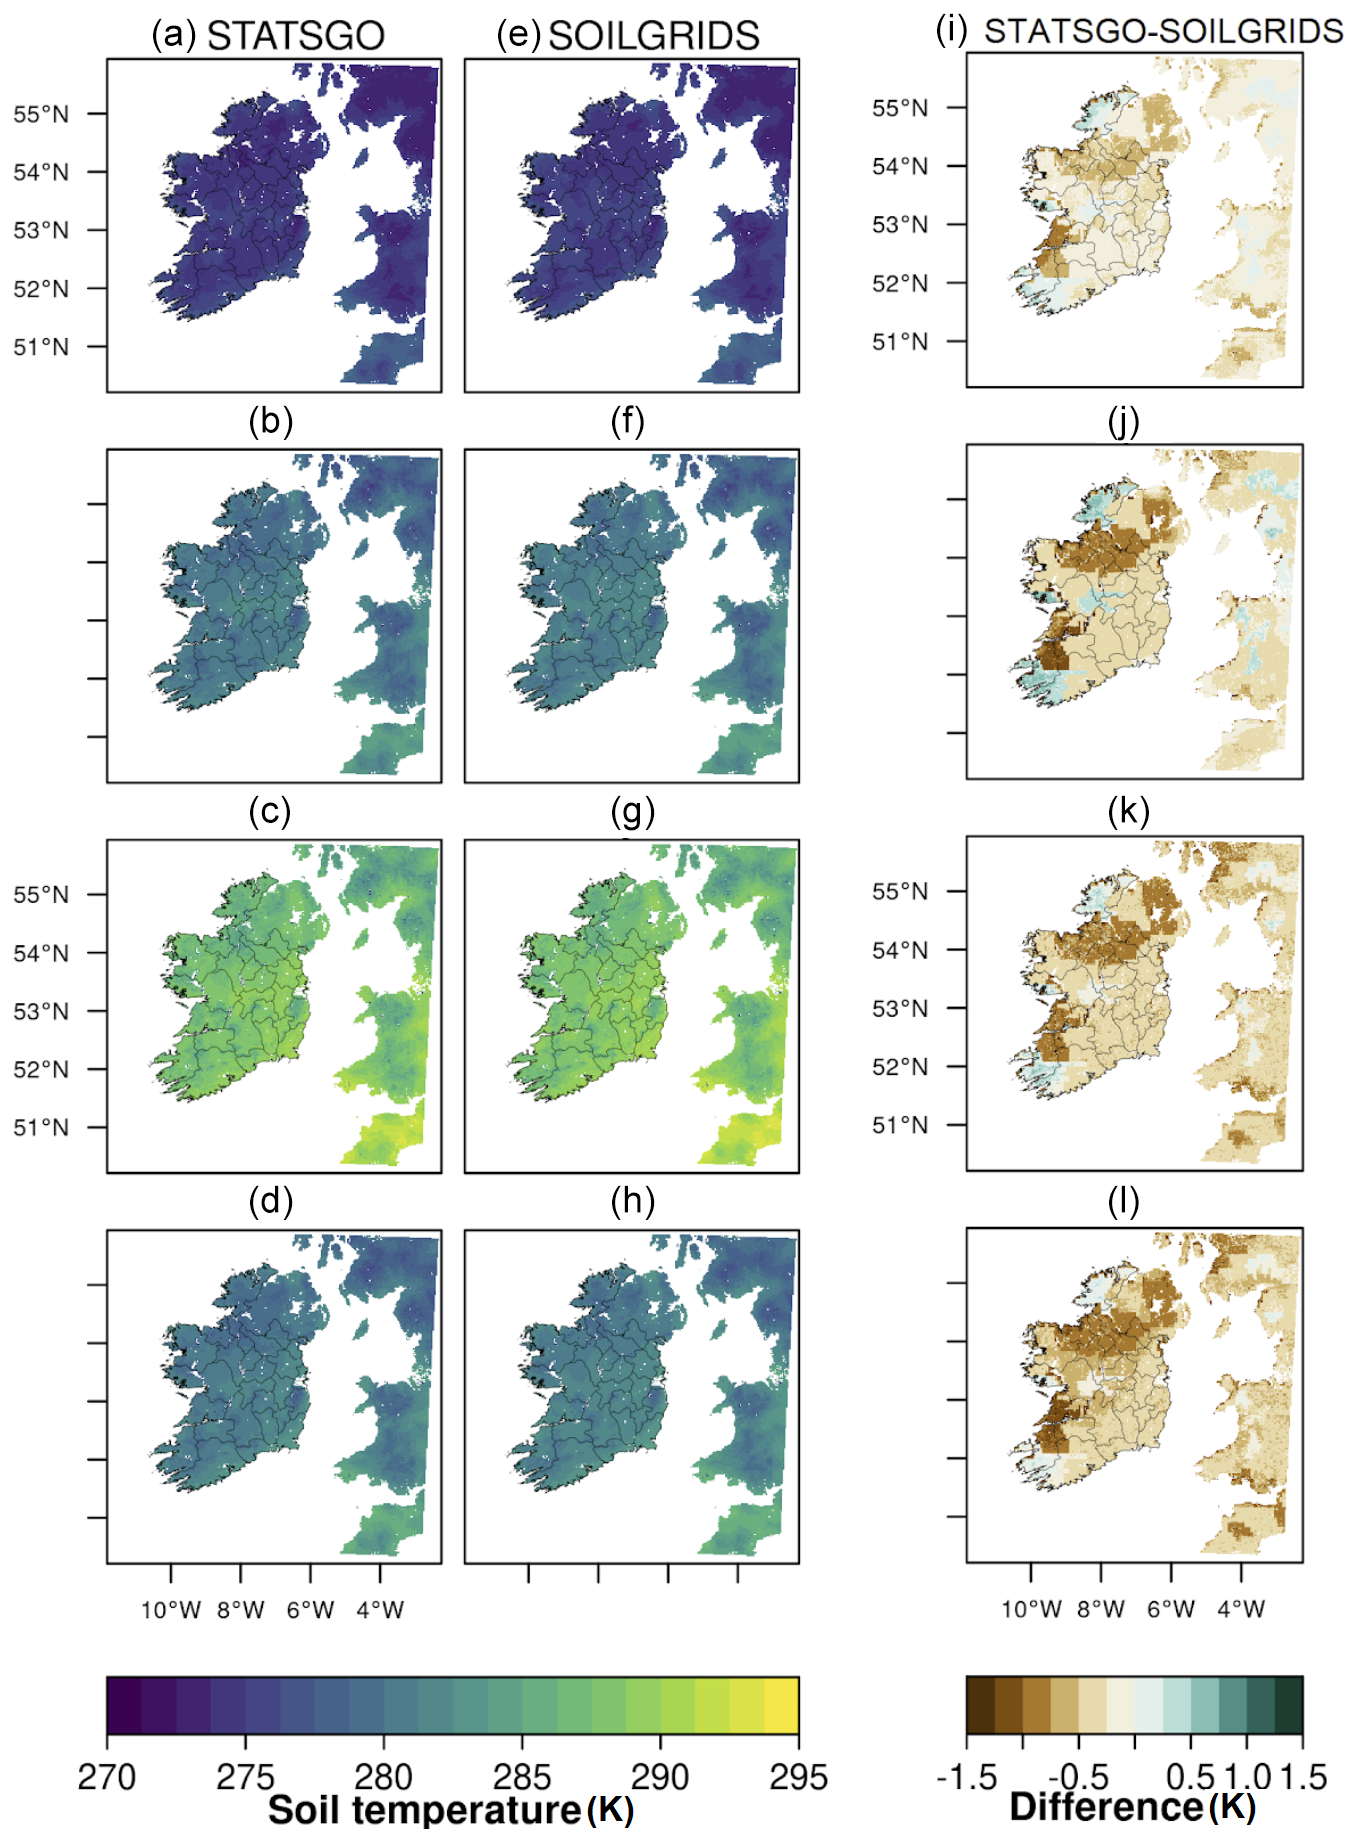
Figure 9Spatial and seasonal characteristics of simulated topsoil (0–7 cm) temperature using STATSGO (a–d) and SoilGrids (e–h), as well as the difference (i–l), for the period 2009–2022. Rows 1–4 represent the winter to autumn seasons, in that order.
3.3 Spatial and temporal evolution of soil moisture drought
Figure 10 illustrates the spatial characteristics of the 0–100 cm RSM percentiles for selected days during the summer of 2018. The selected dates denote the start, peak, and end of the summer water deficits (Fig. 4f) experienced during that year. For the first 7 d window ending on 7 June, the southeast and east of Ireland show low drought intensity (D0–D1, abnormal to moderate) in STATSGO compared to in SoilGrids, which exhibits values in the severe drought category (D2). During this build-up period, there are notable spatial differences between STATSGO and SoilGrids, with the latter exhibiting a more spatially extensive region for the D0 and D1 categories.
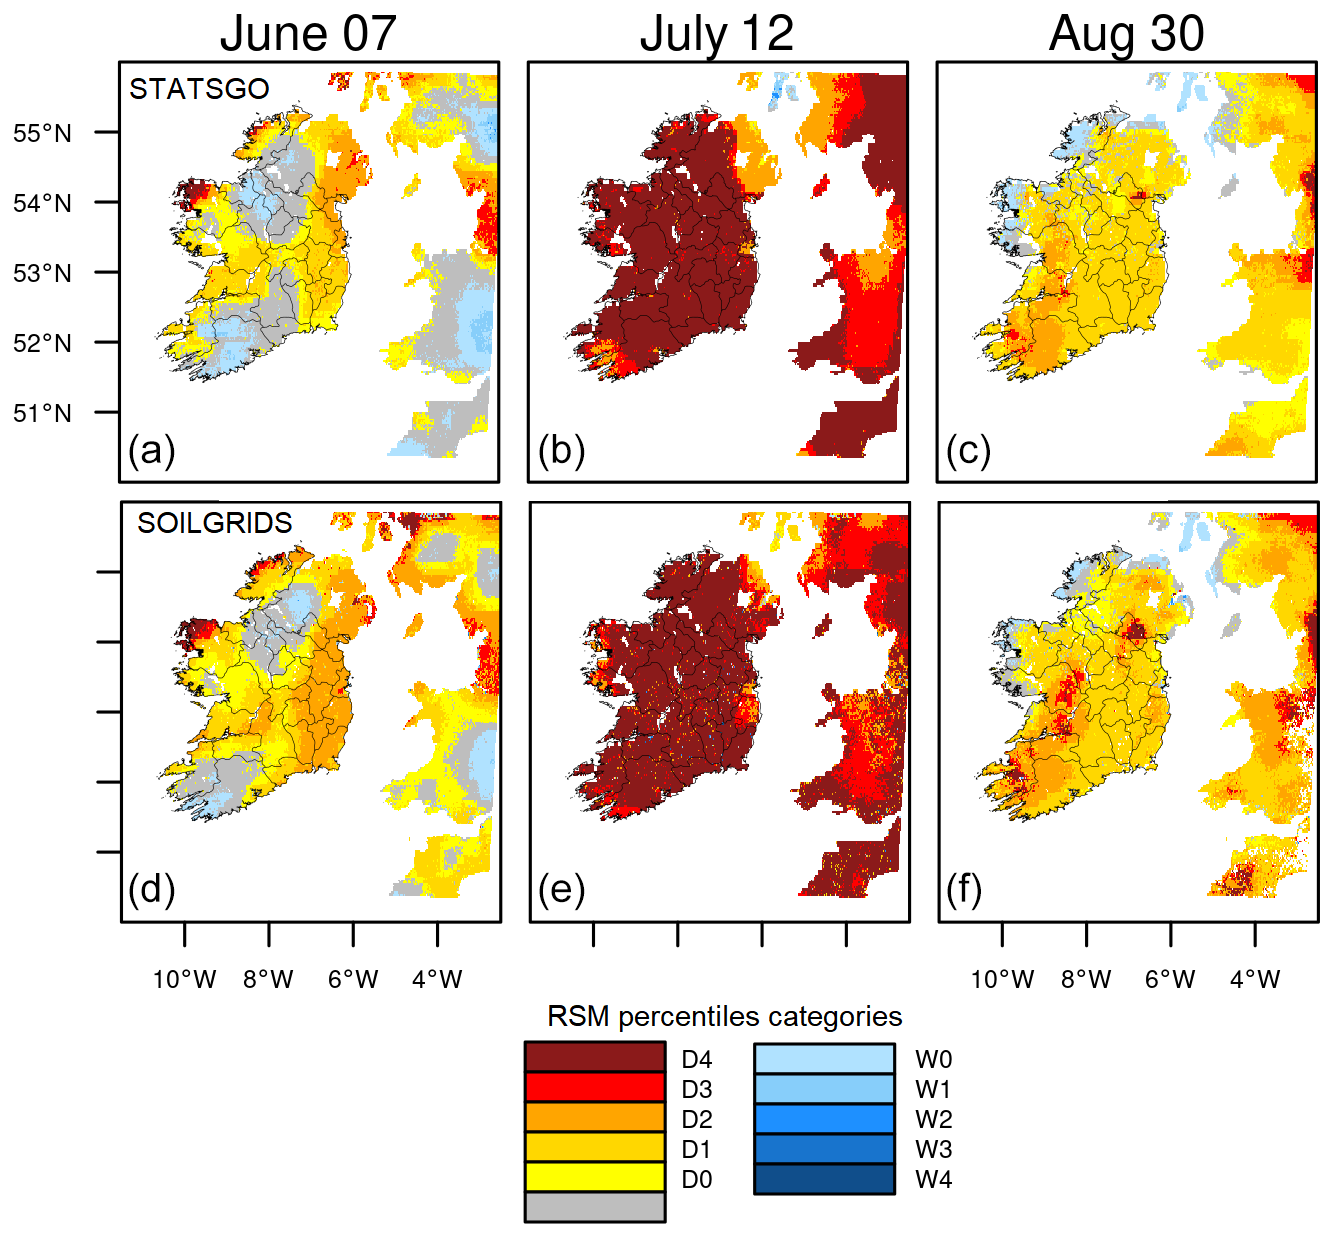
Figure 10Spatial characteristics of soil moisture drought categories derived using 0–100 cm Relative Soil Moisture percentiles for STATSGO (a–c) and SoilGrids (d–f) for 2018 summer. D0–D4 represents abnormally dry, moderate, severe, extreme and exceptional droughts, while W0–W4 is the corresponding wetness categories.
By the middle of summer 2018 (sixth week, ending on 12 July), almost the entire island is dominated by the exceptional drought category (D4) in STATSGO, except for areas in the extreme northeast and southwest, which are classified as falling into the D2 and D3 categories. These patterns are broadly consistent in SoilGrids, except for small areas falling under higher-intensity drought classes. For example, the drought category in the northeast of the island shifts from D2 to D3–D4 (extreme and exceptional) in STATSGO, and, in the southwest and east of Ireland, it shifts from D2–D3 (severe and extreme) to D3–D4 in SoilGrids. It is notable that these regions in the southwest and east are associated with high topography.
Whereas the soil water deficits appear to have improved by the end of summer (week 13, ending on 30 August), the landscape experiences different levels of soil water deficits. For example, in STATSGO, the moderate drought category (D1) broadly dominates the loam areas in the midlands and in the south and southeast of Ireland, while a mix of D1–D4 categories dominates the west and southwest of the country. These patterns are consistent in SoilGrids, but D3–D4 drought categories remain more extensive in the north, west, and southwest in SoilGrids compared to in STATSGO.
Figure 11 illustrates the time–areal coverage of the drought categories over the domain during the summer period of 2018 based on RSM percentiles. While the landscapes already experience soil water deficits by the start of June, the largest areal coverage (about 70 % in STATSGO and 80 % in SoilGrids) is dominated by low drought intensities (D0–D2). Approximately 10 % of the domain is characterized by extreme and exceptional drought (D3–D4) up to the end of June. The drought intensifies effectively from late June, with higher areal coverage evident in the D4 category (more than 80 %), extending over several days in STATSGO (10–15 July). Over the same period, the D4 category in SoilGrids is less extensive and lasts for a shorter period than in STATSGO, but the transition to less severe categories is slower than in STATSGO. At the start of August, there is a brief interlude with a reduction in the areal extent of the high-intensity drought (D3–D4) that is evident in both SoilGrids and STATSGO, transitioning to the less severe categories (D0–D2). By the last week of August, the peak of the drought has passed, and the landscape begins to recover.
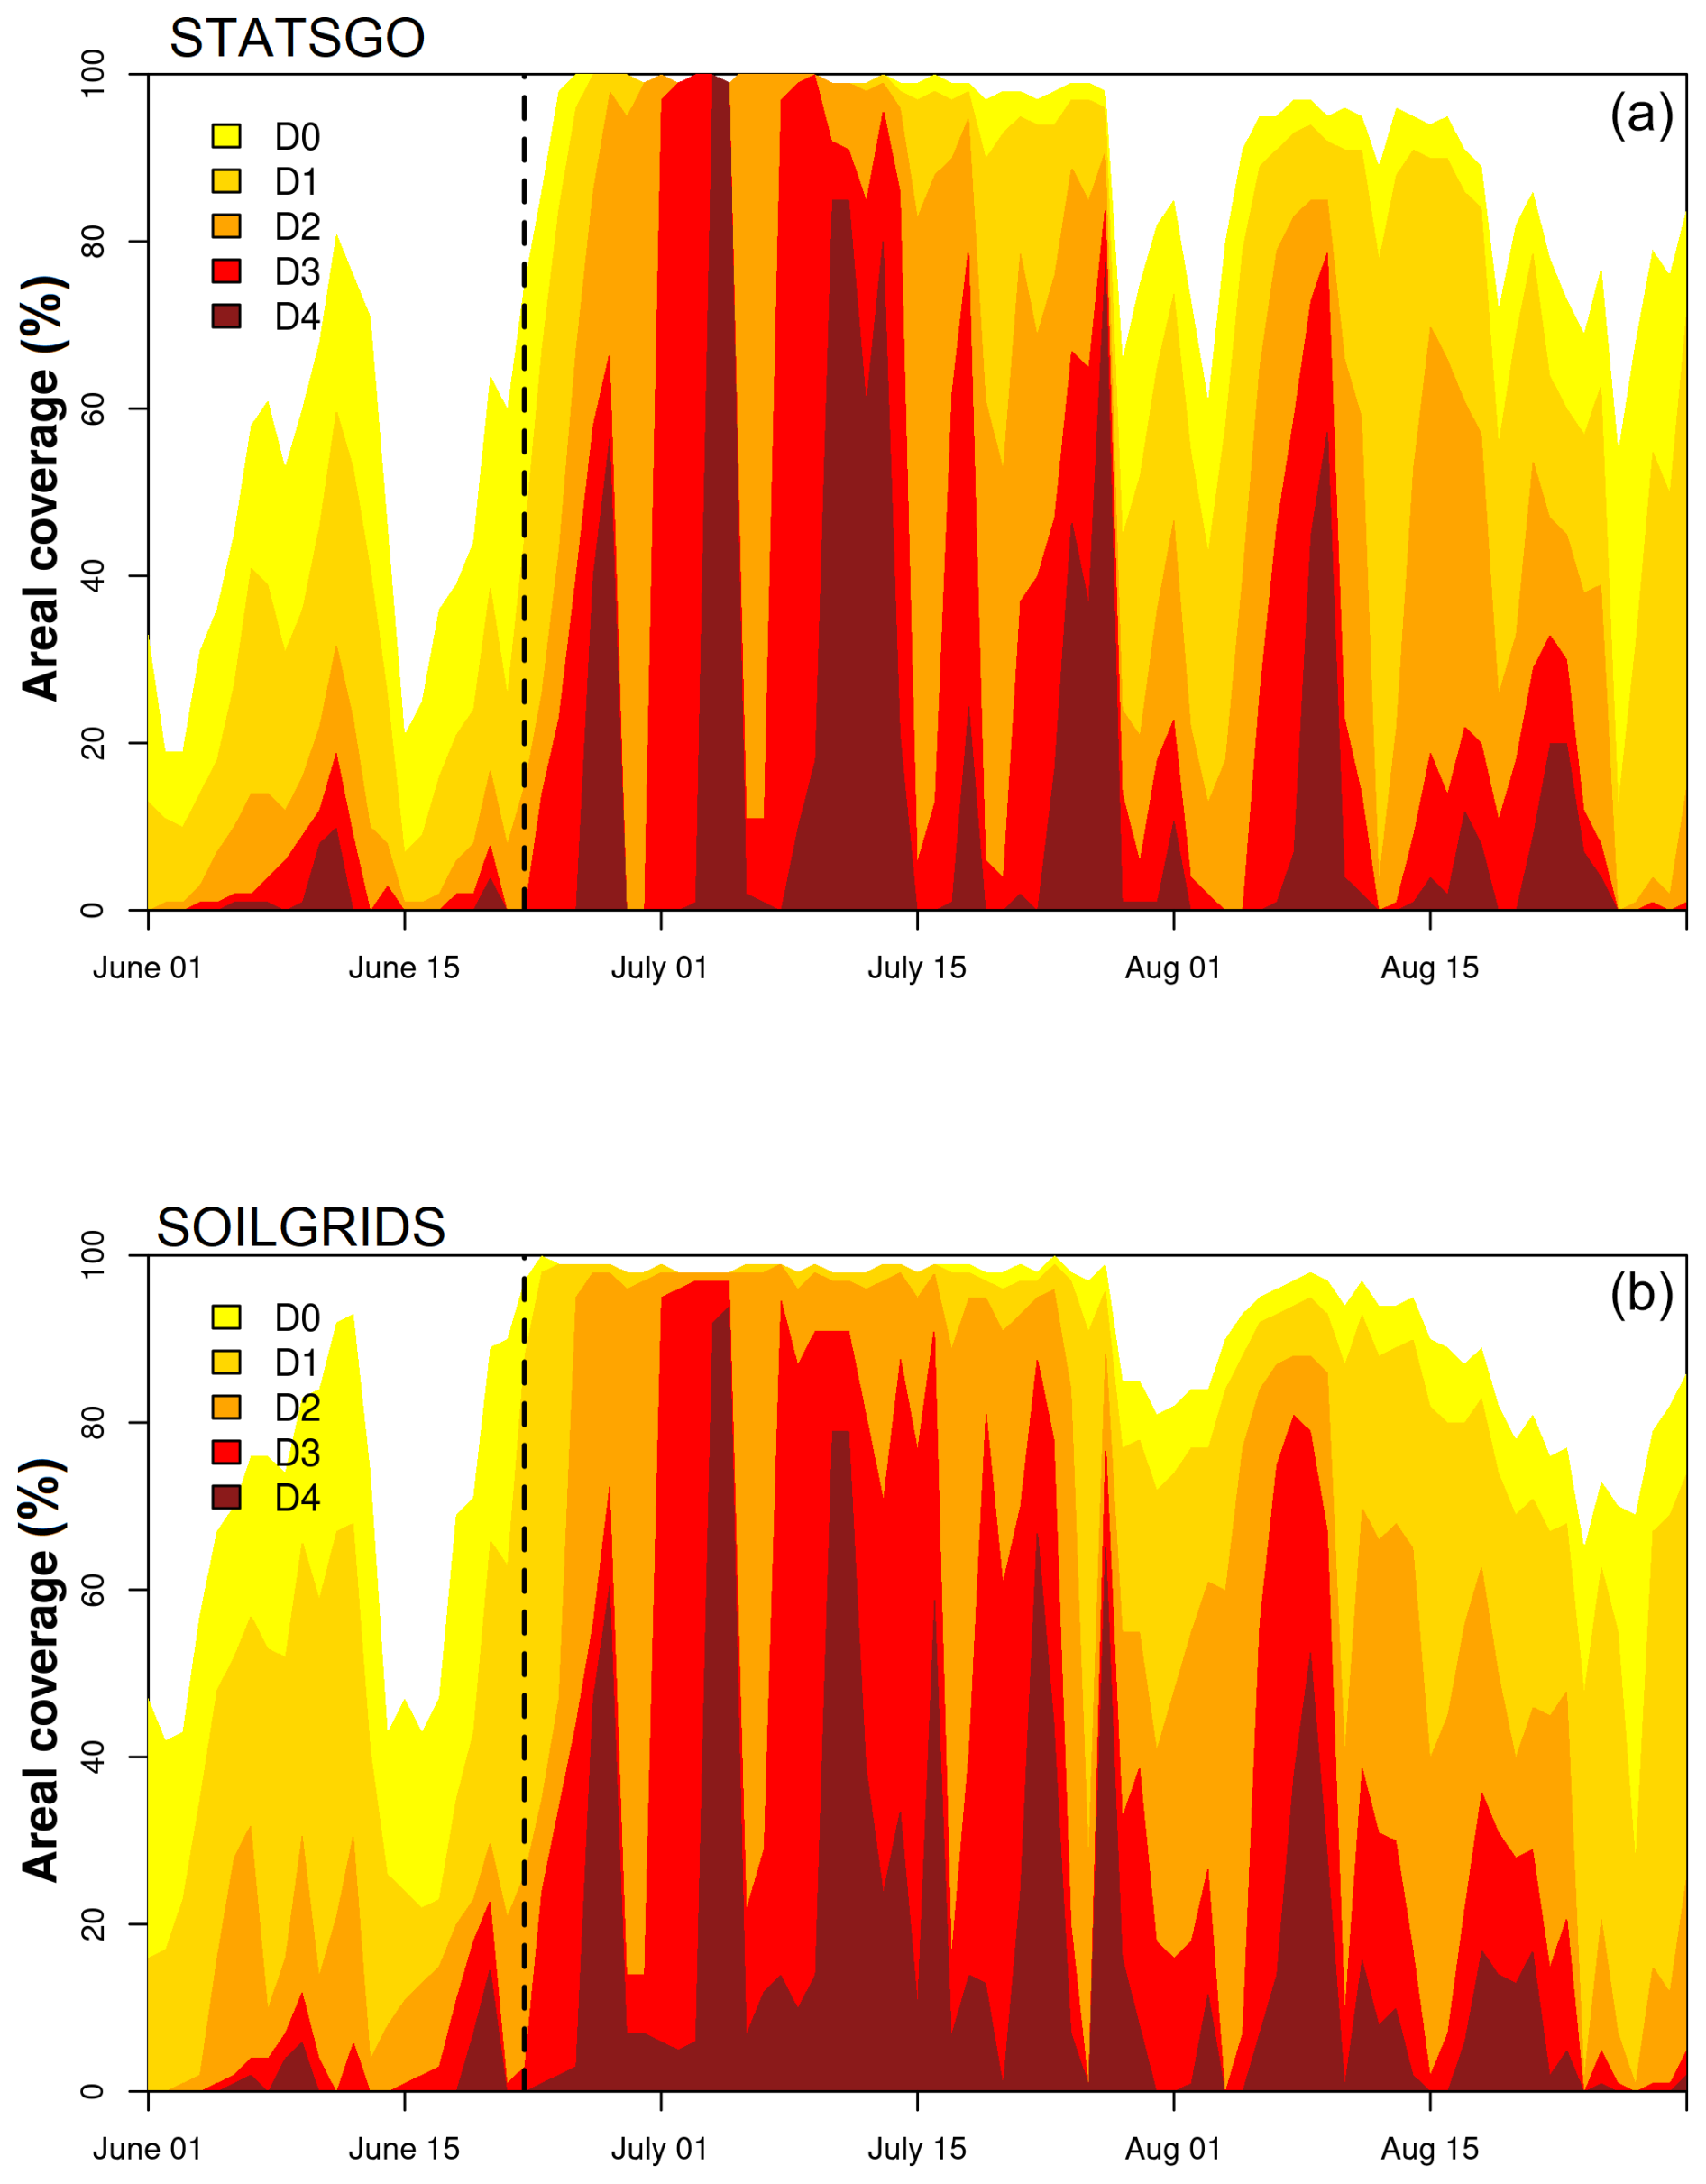
Figure 11Time–areal coverage cross-section of drought evolution based on daily 0–100 cm relative soil moisture (RSM) percentiles during the summer of 2018 for STATSGO (a) and SoilGrids (b). D0–D4 represent abnormally dry, moderate, severe, extreme, and exceptional droughts. The vertical dashed lines represent the effective start of severe to exceptional droughts.
4.1 Effects of soil hydrophysical properties on simulated soil hydrothermal regimes
In this study, we investigated the differences between two global soil texture datasets currently implemented in the Noah-MP land surface model for simulated soil hydrothermal properties. In addition to using the default look-up table in combination with the STATSGO soil information, which is perhaps the most widely used or typical approach, we employed pedotransfer functions (PTFs), in combination with the SoilGrids soil information, to explore the impact of different soil datasets and, hence, their associated soil properties (e.g., porosity, field capacity, wilting point, hydraulic conductivity) on the simulated surface and sub-surface soil hydrothermal parameters during a normal (2019) and extremely dry (2018) year. The roles of these properties, particularly the field capacity (a measure of water retained in the soil at a pressure of −0.33 bar after excess rainwater has drained away), are critical in correctly simulating soil hydrophysical processes and have consequent impacts on the subsequent interactions between the land surface and the overlying atmosphere (Dennis and Berbery, 2021, 2022; Zhang et al., 2023; Zheng and Yang, 2016).
Initially, we compared the model-simulated values at grid scale with available in situ data for a selection of sites distributed across the island and representative of the dominant soil textural properties (Table 1). In general, both the STATSGO and SoilGrids model simulations resulted in an underestimation in the modeled variance at all sites compared to the measured values. With the exception of STATSGO at Ballyhaise, both model simulations underestimated the mean observed values, which was particularly marked at three sites; seasonal differences were also evident (Fig. 5). With the exception of Valentia, SoilGrids estimated lower mean values compared to STATSGO (Fig. 5h). At two sites, Ballyhaise and Dunsany, both soil datasets resulted in an overestimation of VWC during the drier summer months, for which time the measured values indicate that the soils were close to or at wilting point. The largest differences between the modeled and measured VWC occurred at sites where the soils appear to have a larger water-holding capacity, namely Dunsany, Valentia, and Dripsey (Fig. 5, boxplot). Despite the misrepresentation of the soil texture class and the difference in soil depths between the measured and simulated VWC at Johnstown Castle (Table 1), the model performs reasonably well at this site. However, for a relatively wet site (e.g., Dripsey), where the soil textural class is correctly represented in both soil databases, the model simulations systematically underestimate soil moisture content (Figs. 5g and A4). This suggests that the soil-induced model uncertainty, which is often linked to misrepresentation of soil texture class (e.g., Zheng and Yang, 2016) and, hence, misspecification of hydrophysical parameters, can arise due to other factors (e.g., model physics, incorrect hydrophysical parameters).
We also compared the ASCAT SWI with the measured VWC at the selected sites and, subsequently, the RSM derived from the model-simulated VWC. Based on the rescaled SWI, derived using the mean and standard deviation of the measured values, the ASCAT SWI is shown to largely replicate the temporal variability of the measured values at the selected sites, particularly the seasonal evolution of soil moisture. With regard to the comparison between the ASCAT SWI and the model-derived RSM, we found that, while the median correlation between SWI and RSM was higher for SoilGrids than for STATSGO for both the surface and sub-surface layers, STATSGO performed better in terms of the error statistics in the dry year (2018), while SoilGrids performed better in the normal year (2019) (Fig. 6). While both the SWI and RSM are based on relative rather than absolute values, the calculated correlation coefficients (R values) indicate that the model is able to capture at least some of the temporal evolution (covariation) of soil moisture in both a dry (2018) and normal year (2019) and, importantly, suggest that the model soil physics are functioning correctly or, at least, in a way that is temporally consistent with the independently derived ASCAT SWI data. However, while both STATSGO and SoilGrids produce similar estimates of VWC where textural classes are in common (Fig. A7), both STATSGO and SoilGrids systematically underestimate VWC when compared to the ASCAT SWI, particularly for the loam textural class (Figs. 2 and 7); SoilGrids shows a larger underestimation compared to STATSGO (Figs. 7 and A7), most markedly in winter, spring, and autumn (Fig. A7). From Fig. 3, it is clear that STATSGO has higher field capacity and wilting-point values associated with loam soils compared to SoilGrids, which may explain the lower bias in STATSGO relative to SoilGrids.
The assessment of the model against the measured values (Fig. 5) and the ASCAT SWI (Figs. 6 and 7) highlights the potential impact of the prescribed soil hydrophysical parameters, specifically FC and WP, in limiting the model's ability to accurately simulate absolute values of soil moisture content within the model soil layers. To test this, we focus on two sites for which measured FC is available, namely Johnstown Castle and Dripsey. The measured field capacity (FC) in the top 20 cm at Johnstown Castle is 0.32 m3 m−3 (Table 1) (Peichl et al., 2012), which lies close to the representative FC value employed in both STATSGO and SoilGrids for this location. However, the measured FC in the top 20 cm at Dripsey is 0.42 m3 m−3 (Table 1), higher than the respective FC value of ∼ 0.31 m3 m−3 prescribed by STATSGO via the look-up table and the value from SoilGrids using the PTFs for this location (Figs. 3 and 5, boxplot). While the model-estimated VWC at Johnstown Castle lies close to the measured values at this site, the model systematically underestimates VWC at Dripsey. Ultimately, a lower FC limits the ability of the soil to increase the memory of the stores, resulting in a systematic bias in the simulated VWC. To illustrate the role of the prescribed FC value at Dripsey, the simulated VWC for a neighboring grid cell with an FC of 0.412 m3 m−3 and which experiences similar weather conditions is plotted against the measured VWC at Dripsey (Fig. 12). A higher FC clearly results in higher VWC values, significantly reducing the systematic bias (RMSD and PBIAS) between observations and STATSGO by more than 50 % of the FC value employed by the model at Dripsey. In contrast, the maximum FC derived from SoilGrids across the domain is 0.34 m3 m−3 (Fig. 3), which lies around the default value and is not in a proximal grid location in relation to the Dripsey site. Hence, using the same grid cell as above, SoilGrids, with PTFs, falls short of this and consequently fails to improve the simulated VWC.
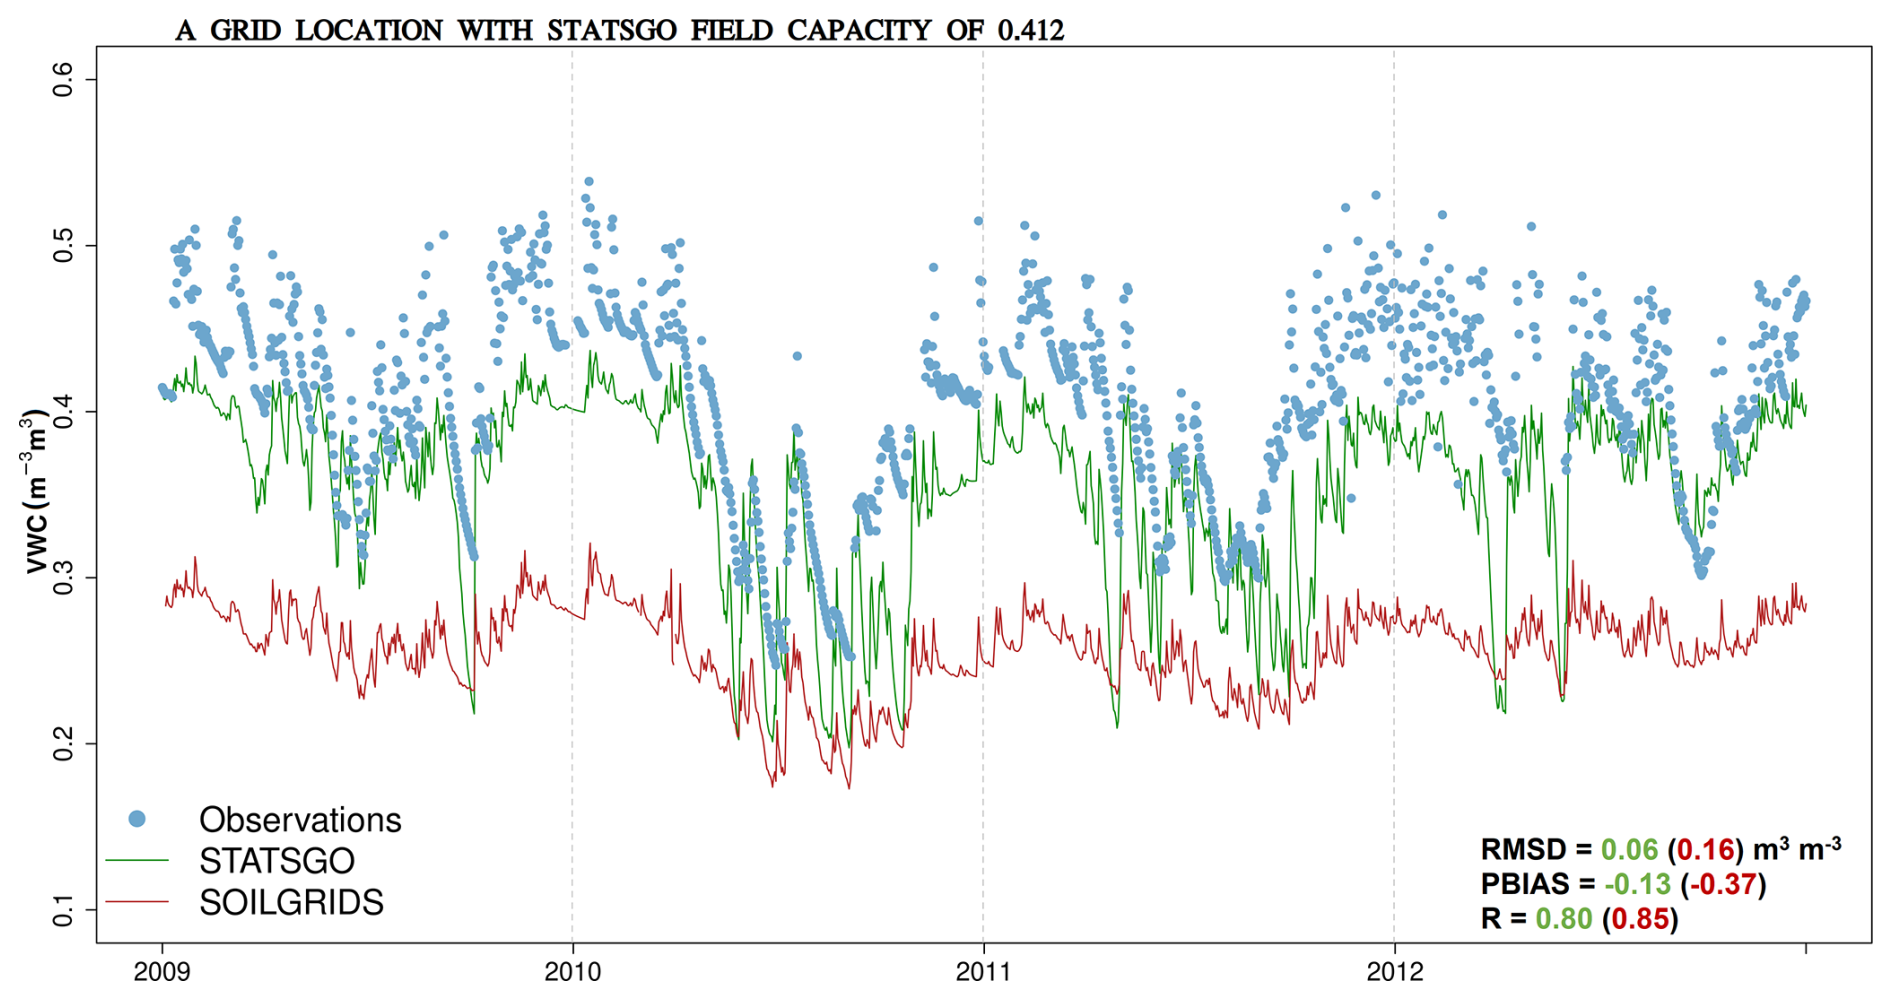
Figure 12Temporal comparisons of observed volumetric water content (VWC) at Dripsey site against the simulated values for a nearby grid location with field capacity of 0.412 m3 m−3.
While the choice of PTFs is critical in model simulations of soil water fluxes (Weihermüller et al., 2021), the default Saxton and Rawls (2006) PTFs produce properties that lie close to the look-up table in the Noah-MP model. One reason for this similarity is that, in general, the SoilGrids sand and clay compositions produce similar spatial distributions in the loam and sandy loam soil texture classes that coincide with the locations of the FAO/STATSGO classes (Fig. 2 and Table 2). Another reason for similar soil properties between the PTFs and the look-up table is that the default PTF coefficients are derived based on USDA soil samples (Saxton and Rawls, 2006) and are therefore not likely to be representative of soil processes and, consequently, properties in a different study domain; the empirically derived look-up table values are also based on soil samples from the US. The net effect of similar but inaccurate soil properties is the significant under-representation of soil hydrothermal regimes in wet soils, as illustrated in Figs. 5 and 7. This aligns with the findings of Vereecken et al. (2010), who demonstrated that PTFs are highly accurate over the areas for which they have been developed but have limited accuracy if transferred outside of these areas. Weber et al. (2024) also noted that the divergence between the scale of derivation from laboratory experimental data and the regional and/or global scale of application is a fundamental shortcoming for PTFs.
In situations where the model systematically underestimates or overestimates soil moisture, the impacts on the surface exchanges with the atmosphere may be more limited (e.g., Dripsey; see Fig. 5g); however, for locations with a high water table and/or that are subject to seasonal drying (e.g., Dunsany, Ballyhaise; see Fig. 5b and d), deficiencies in the model-estimated timing and extent of soil moisture deficits are likely to result in large seasonal biases in the simulated surface fluxes. However, further work is required to understand the simulated soil moisture response at these locations, but this is likely to be due to a combination of the hydrothermal parameters.
With regard to the model-simulated soil temperature, both the STATSGO and SoilGrids inputs were able to reasonably replicate the measured surface soil temperature at the selected sites, albeit with a tendency to systematically underestimate the measured values (Fig. 8). Only minor, insignificant differences were evident between the two simulated soil temperature series. In contrast, spatial differences between the STATSGO and SoilGrids data were evident, particularly in the north, west, and southwest of Ireland (Fig. 9), and are largely coincident with the differences in the spatial distribution and extent of selected hydrothermal parameters between both datasets (Fig. 3). Notably, the STATSGO data represent smaller soil grain sizes in most of these areas relative to SoilGrids. This results in higher values of soil hydrophysical properties in STATSGO, including porosity and field capacity, and lower saturated hydraulic conductivity (Figs. 3 and A9). The increasing grain size leads to wetter and colder soils in STATSGO relative to SoilGrids in the top 30 cm layer (Figs. 7, 9, and A6–A7). Similarly to our results, it has been demonstrated that a reduction in soil grain size (e.g., loam to sandy loam) leads to dry and hot soil differences (decrease in latent heat flux and increase in sensible heat flux) between two global soil datasets (Dennis and Berbery, 2021).
Overall, the results shown here support previous findings that indicate that soil hydrophysical parameters directly impact the model-simulated soil moisture, while the spatial distribution of soil textural classes impacts soil thermal properties. In contrast to our expectations, the model-estimated VWC values were close to the measured values at Johnstown Castle, a site that experiences seasonal or periodic soil moisture deficits and/or drought due to a combination of meteorology and soil type (e.g., imperfectly drained). The model performed poorly with respect to the measured VWC at Valentia (southwestern coast – well drained), Ballyhaise (north – poorly drained), and Dunsany (east – moderately drained) but highlighted that impacts are likely to be more pronounced at relatively wet sites and at sites that experience a marked seasonal contrast in terms of soil moisture, which represents a new contribution to the discussion.
4.2 Sources of uncertainties
With regard to model uncertainty, the Noah-MP model's reliance on default look-up tables for STATSGO and on more sophisticated PTFs for SoilGrids introduces systematic biases, particularly when the respective parameterizations do not represent the local soil conditions accurately. For instance, a mismatch in FC values at Dripsey results in a significant underestimation of soil water retention capacity, which directly affects soil moisture, with biases exceeding 50 % of the employed FC value. In essence, the mismatch in terms of spatial scale between the parameterization of soil properties and their application in a global model introduces significant uncertainties into soil moisture simulations, particularly in regions with distinct soil properties (Vereecken et al., 2010; Weber et al., 2024). As a consequence, the impact may directly affect the soil moisture coupling with the atmosphere through surface energy fluxes, leading to uncertainties in surface exchanges.
With regard to the soil dataset uncertainty, the magnitude of the impact of soil dataset uncertainty is particularly pronounced when it comes to the parameterization of critical soil hydrophysical parameters like field capacity (FC) and wilting point (WP). As shown in this study (Fig. 12), a small difference in FC values (e.g., 0.31 m3 m−3 vs. 0.42 m3 m−3) can significantly alter the simulated volumetric water content (VWC), leading to a systematic bias in the model outputs. At sites like Dripsey, where the field capacity was significantly underestimated, the model consistently underestimated soil moisture. This bias was reduced when using a higher FC value for a neighboring grid cell, demonstrating that even small changes in soil property inputs can have substantial impacts on model outputs. Additionally, regional differences in soil properties, linked to divergences in grain size representation between STATSGO and SoilGrids (Figs. 2–3), affect simulations by 10 %–30 %, depending on the soil textural class and climatic conditions. This is evident in regions with high water tables or in areas subject to seasonal drying (Fig. A7), where the model's inability to accurately simulate soil moisture deficits may potentially propagate through hydrological and thermal cycles, mischaracterizing droughts or waterlogging events and affecting surface energy partitioning and land–atmosphere interactions (Dennis and Berbery, 2021, 2022; Zhang et al., 2023).
With regard to observation uncertainty, this also arises, particularly in terms of the spatial variability and accuracy of in situ measurements used for model evaluation. The precision and accuracy of the new Terrain-AI TDR measurements used in this study depend on the sensor installation and performance (Briciu-Burghina et al., 2022). The Terrain-AI network has followed and used the standard, custom-designed installation and calibration tools recommended by the manufacturers; thus, we do not observe sensor decay or random errors in the soil moisture measurements, given that the 2022 pattern is temporally consistent with more recent measurements (Fig. A1). The observed standard error in the measurements is generally less than 0.01 m3 m−3, which is consistent with the recommended optimal accuracy for TDR sensors (e.g., Blonquist et al., 2005). However, we acknowledge that the presence of air gaps between the soil and sensor contact during installation may introduce errors, particularly at the start of sensor measurement. The time for the soil to properly settle around the sensor depends on soil condition, which constitutes a common error for newly installed soil moisture sensors (Briciu-Burghina et al., 2022). Despite this, we believe that the impacts on the overall uncertainties in our model evaluation may be relatively small given the observed sensor accuracy across sites.
The in situ soil moisture measurements, though accurate, are point-based and may not represent grid-scale heterogeneity. For example, discrepancies between measured and simulated volumetric water content (VWC) at Johnstown Castle and Dripsey highlight this limitation (Fig. 5). Differences between the measurement depth (e.g., 5 cm and top 20 cm) and model representation (0–7 cm) exacerbate observational uncertainty. For example, model biases at Valentia and Dripsey partly stem from mismatches in vertical soil layering, with the shallower model soil depth expected to be wetter between rainfall events and drier in response to atmospheric conditions. The point-to-grid biases and soil depth mismatches contribute to about 5 %–20 % errors in validation results, which can distort the interpretation of model accuracy and reliability.
The use of ASCAT's characteristic time length (e.g., T2) to represent soil depths without accounting for soil textural class or properties may also influence the model results as the optimal characteristic time lengths differ for different soil texture categories (de Lange et al., 2008). The ASCAT SWI replicates the covariation in the measured soil moisture well (Figs. A2–A3) but struggles with accurately predicting the absolute moisture content. The correlation between the model RSM and the ASCAT SWI was generally higher for SoilGrids compared to for STATSGO, particularly in a normal year (2019), whereas STATSGO performed better in the dry year (2018) (Fig. 6). This indicates that, while the model physics and soil properties function reasonably well in simulating temporal variations, issues remain with regard to absolute soil moisture content.
Overall, global soil datasets may be relevant for weather and climate modeling, assuming the soil water physics are functioning correctly and that the model-simulated soil water changes result in the correct partitioning of energy; however, numerous authors (e.g., Dennis and Berbery, 2021, 2022; Zhang et al., 2023) have found that flux partitioning is negatively impacted by the simulated soil moisture. Also, for operational purposes, for estimating soil moisture, more refined national-level soil data should be considered. Such efforts, as previously attempted in studies like Reidy et al. (2016), could be expanded to generate more detailed and region-specific soil property datasets.
4.3 Implications for regional drought monitoring
Soil moisture content is an essential variable in many hydrological applications and in understanding the evolution and characteristics of extreme climate events such as droughts. Instead of heatwaves, the study domain is subject to rainfall extremes (Noone et al., 2017), a precursor of soil water deficits and droughts, the intensity and frequency of which have been projected to increase globally and in the study domain by the end of the century (Seneviratne et al., 2012; Fealy et al., 2018).
In this study, the drought analysis is based on the cumulative RSM percentiles aggregated over the three uppermost soil layers (0–100 cm) for 2018 summer hydrological extremes for STATSGO and SoilGrids (Figs. 10–11). The 0–100 cm depth is sufficient for drought assessment since the root zone of many crops grown across the world does not surpass 1.0 m in depth (Fan et al., 2016; Grillakis, 2019).
Both STATSGO and SoilGrids are largely consistent in terms of the peak of soil moisture drought in space and time. However, SoilGrids exhibits higher and wider drought intensity in many areas during the build-up and recovery phases relative to STATSGO. This suggests that there is sensitivity during the build-up to the drought and to the rewetting of the soils after peak droughts. Similar results were found in the study of Zheng and Yang (2016), where, regardless of soil type, soils tended to dry up with increasing aridity so that the difference in soil moisture between two soil datasets tends toward zero. The higher drought intensity of SoilGrids is associated with underrepresented soil hydrophysical properties and simulated VWC, as previously highlighted (Figs. 3 and A7).
During the summer of 2018, particularly from late May to late July, Ireland was reported to have experienced different degrees of meteorological droughts (rainfall deficits) (Fig. 4f), ranging from dry spells to absolute droughts (Met Éireann Report, 2018; Falzoi et al., 2019; Moore, 2020). Meteorological droughts precede soil moisture and/or agricultural droughts through a reduction in soil water storage and in water available for plant uptake; our results indicate that extreme to exceptional soil moisture droughts are only effective from the last week in June, covering the large part of the domain by mid-July (Fig. 11). During August, rainfall improved soil water stores (Fig. 4f) and weakened drought conditions across much of the country, particularly in the north and west (Met Éireann Report, 2018; Moore, 2020).
Overall, the discrepancies between STATSGO and SoilGrids impact drought characteristics, mostly in space, with SoilGrids shifting the abnormal, moderate, and severe droughts in STATSGO to extreme and exceptional droughts. These discrepancies underscore the sensitivity of soil information to drought events, which is critical in improving our understanding of the consequences on ecosystems with regard to predicting their responses and productivity as drought stress has been highlighted as the primary factor limiting ecosystem responses and productivity (De Boeck et al., 2011).
In this study, the usability of two global soil datasets for representing soil processes in the Noah-MP model and for simulating soil hydrothermal variations and associated extremes has been evaluated across all of Ireland. Specifically, FAO/STATSGO dominant soil texture categories linked to soil hydrophysical properties empirically derived from a look-up table (default in WRF) are compared with pedotransfer functions (PTFs) that take as input alternative SoilGrids sand and clay compositions at four soil layers. Through temporal comparison with in situ soil moisture and soil temperature observations, it has been found that both soil datasets can fairly replicate the general soil hydrothermal variations for stations with moderate spikes. However, they under-represent the soil properties (e.g., field capacity) in wet loam soil, leading to systematic dry biases in soil moisture. The results have further shown that there is no distinct difference between the soil physics applied to the same soil texture category in both STATSGO and SoilGrids. However, the disparities and sensitivity to soil physics increase for different soil texture categories between the datasets.
Through spatial comparison with the satellite-based ASCAT SWI, the sub-surface dry bias is more pronounced and widespread in the midlands, south, and east in SoilGrids, while a wet bias dominates the west and north. As a consequence, 2018 summer soil moisture droughts are, broadly, more intensified in SoilGrids, indicating higher sensitivity during transitions to and from peak drought than in STATSGO. This heightened sensitivity could suggest that SoilGrids captures finer details in terms of soil moisture variability; however, the disparities could result in inconsistencies in terms of drought response and increase the risk of over-preparation due to overly sensitive model results. Climate change is expected to drive greater fluctuations in soil wetting and drying in Ireland and other regions. This highlights the importance of addressing inconsistencies between soil datasets, not only to better understand the sensitivity of soil information to drought conditions but also to ensure careful interpretation of soil moisture data. Additionally, adopting ensemble approaches could offer a more balanced perspective.
Uncertainties in soil moisture simulations are found to be largely linked to soil properties, particularly the field capacity, wilting point, and saturation, derived from different soil physics. Overall, the study highlights the shortcomings of global soil databases in simulating soil hydrothermal changes and underscores the need to optimize and improve global soil hydrophysical properties that are input into LSMs for better performance. Developing detailed regional soil texture properties may be more realistic and may enable more improvement in model simulations. Ultimately, this would advance the understanding of the role of soil processes in the hydrologic cycle, ecosystem productivity, drought evolution, land–atmosphere interactions, and regional climate.
A number of initiatives (e.g., Terrain-AI) have been developed to deploy soil-moisture-measuring networks across Ireland to address the lack of soil moisture observations. A significant conclusion of this study is that the Noah-MP model has shown an excellent capacity to use as input better alternative soil texture data to reduce the model biases relating to soil hydrothermal changes and the evolution of soil moisture drought. Therefore, it can be applied to augment the current network of sites across the country for operational modeling and real-time forecasting of soil moisture conditions and drought across the domain. This will support hydrometeorological monitoring similarly to the Global Flood Awareness System (GloFAS) and NASA's Short-term Prediction Research and Transition Center with the Land Information System (SPoRT-LIS).
To evaluate the ASCAT SWI, we rescaled the units in percent to match the observed VWC and other products (in m3 m−3) used . To achieve this, we used the variance-matching approach (Eq. A1) so that the linearly transformed SWI∗ data would have the same mean (μ) and standard deviation (σ) as the ground VWC measurements (Paulik et al., 2014; Bauer-Marschallinger et al., 2018).
As demonstrated in Figs. A2–A3 for near-surface and sub-surface VWC, the ASCAT SWI∗ generally yields better performance than the ESA-CCI 25 km SSM and GSSM 1 km products, though the latter products show higher temporal dynamics, as shown by the higher temporal correlations with the ground observations. The rising and falling trends are also better captured by ASCAT. Compared to ASCAT, the ESA-CCI SSM and GSSM show fewer fluctuations in VWC, appearing to be very close to the sub-surface VWC profiles (e.g., Fig. A2f). While the uncertainty in GSSM products is likely to be linked to the lack of training data from Ireland, the biases in the ESA-CCI SSM may be attributed to its native grid resolution, which is too coarse to effectively represent the soil heterogeneity and/or differences in soil depths.
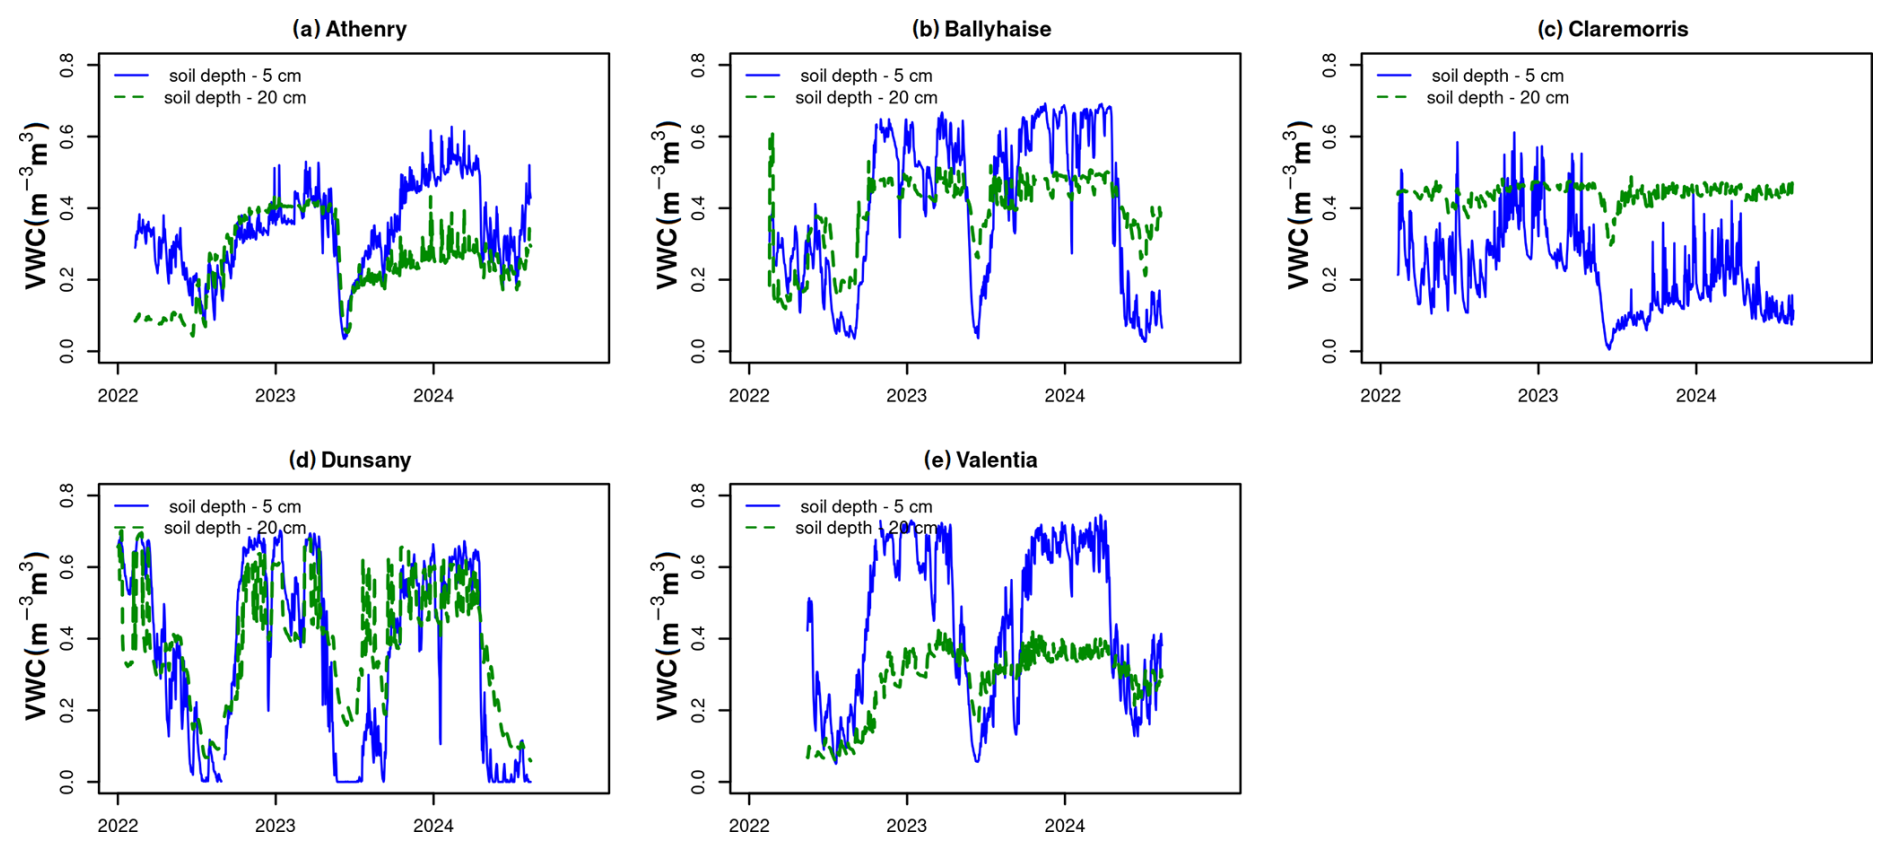
Figure A1Observed 5 and 20 cm depth TDR soil moisture from 2022 to present across the Terrain-AI stations.
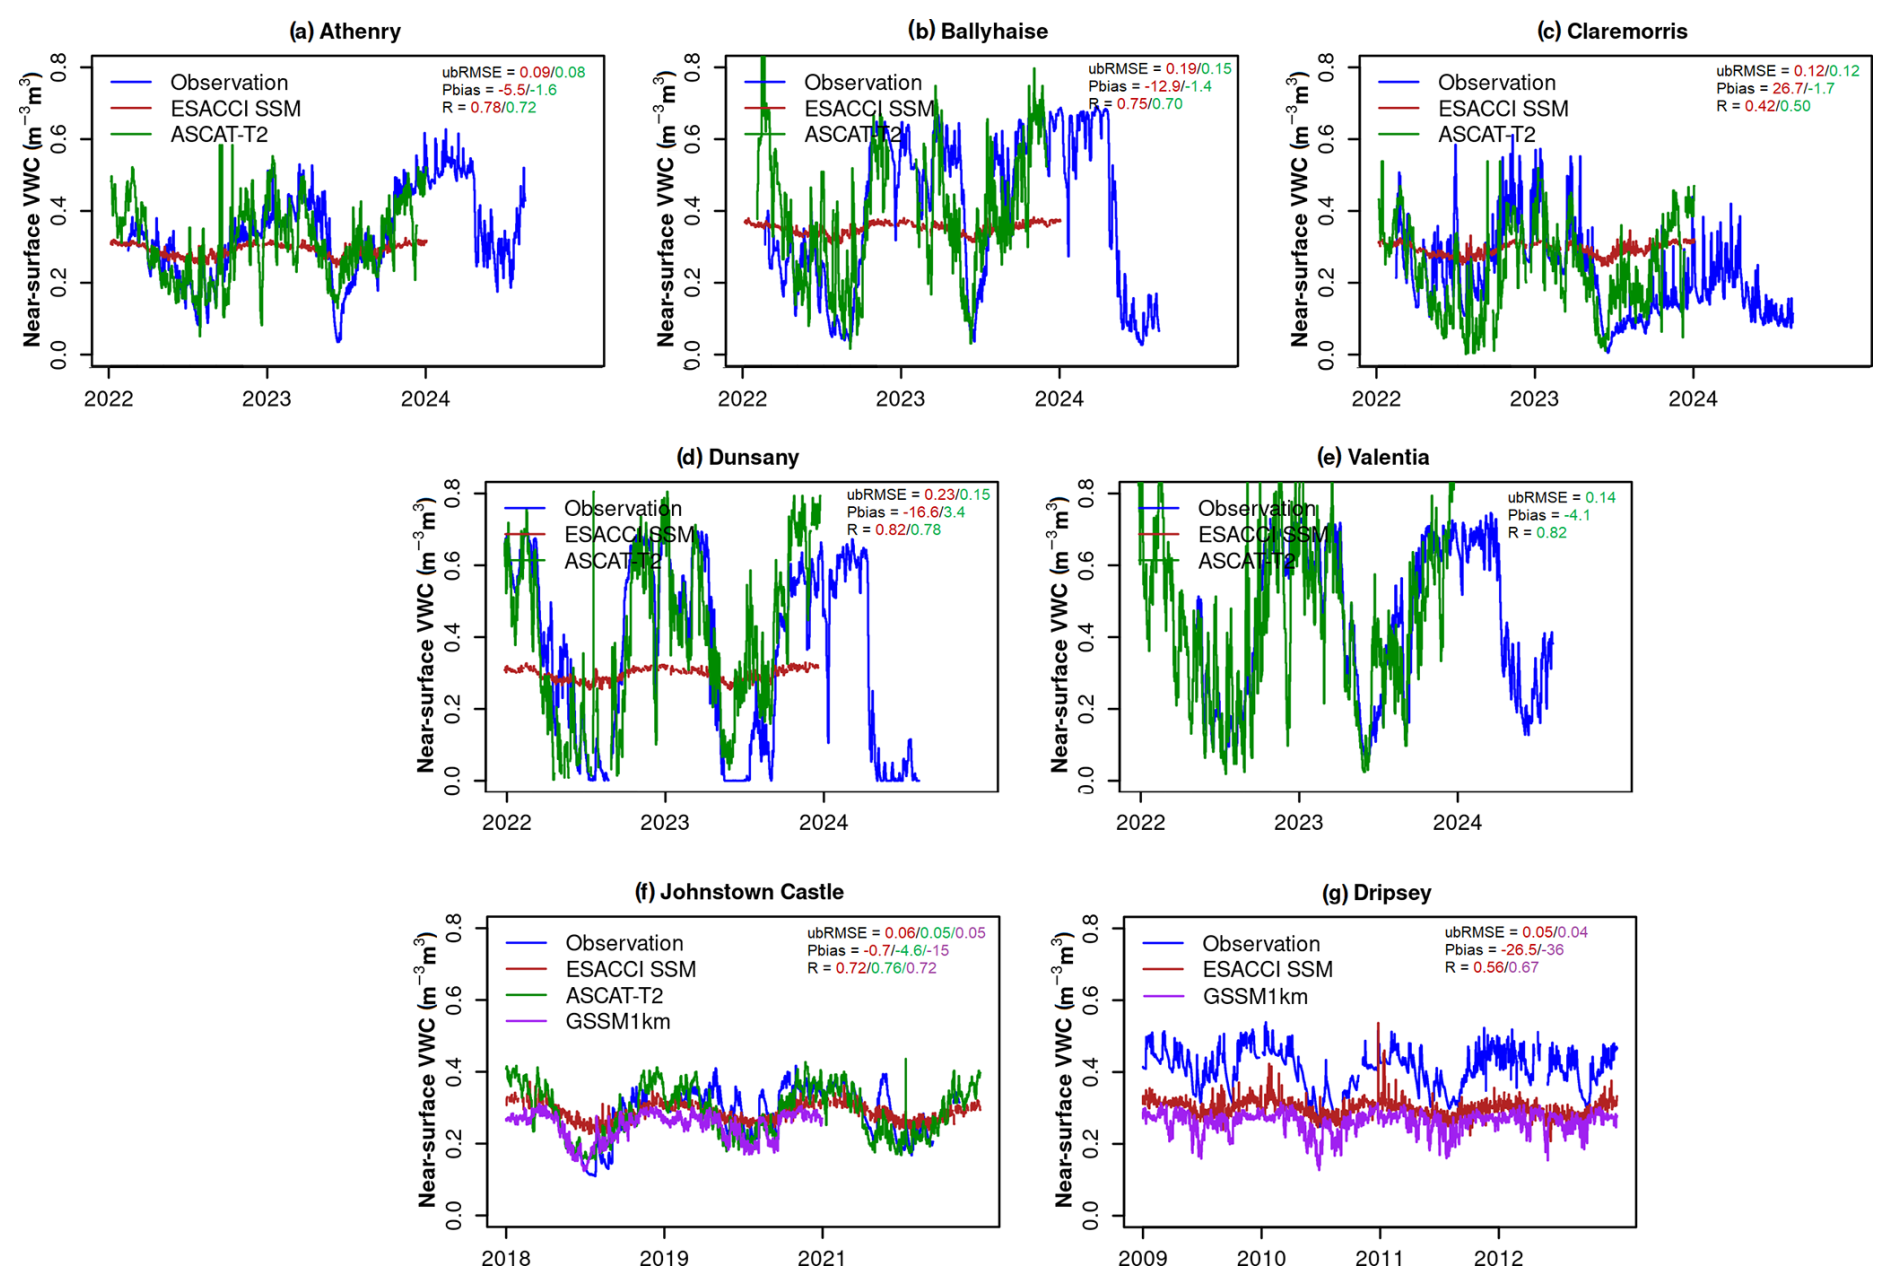
Figure A2Evaluation of satellite-derived 1 km ASCAT-T2 (0–10 cm), 1 km GSSM (0–5 cm), and 25 km ESA-CCI near-surface soil moisture against the station observations. There are no available ESA-CCI SSM grid values for Valentia, and, due to ASCAT's later year of operation, in 2015, no ASCAT values are available for Dripsey.
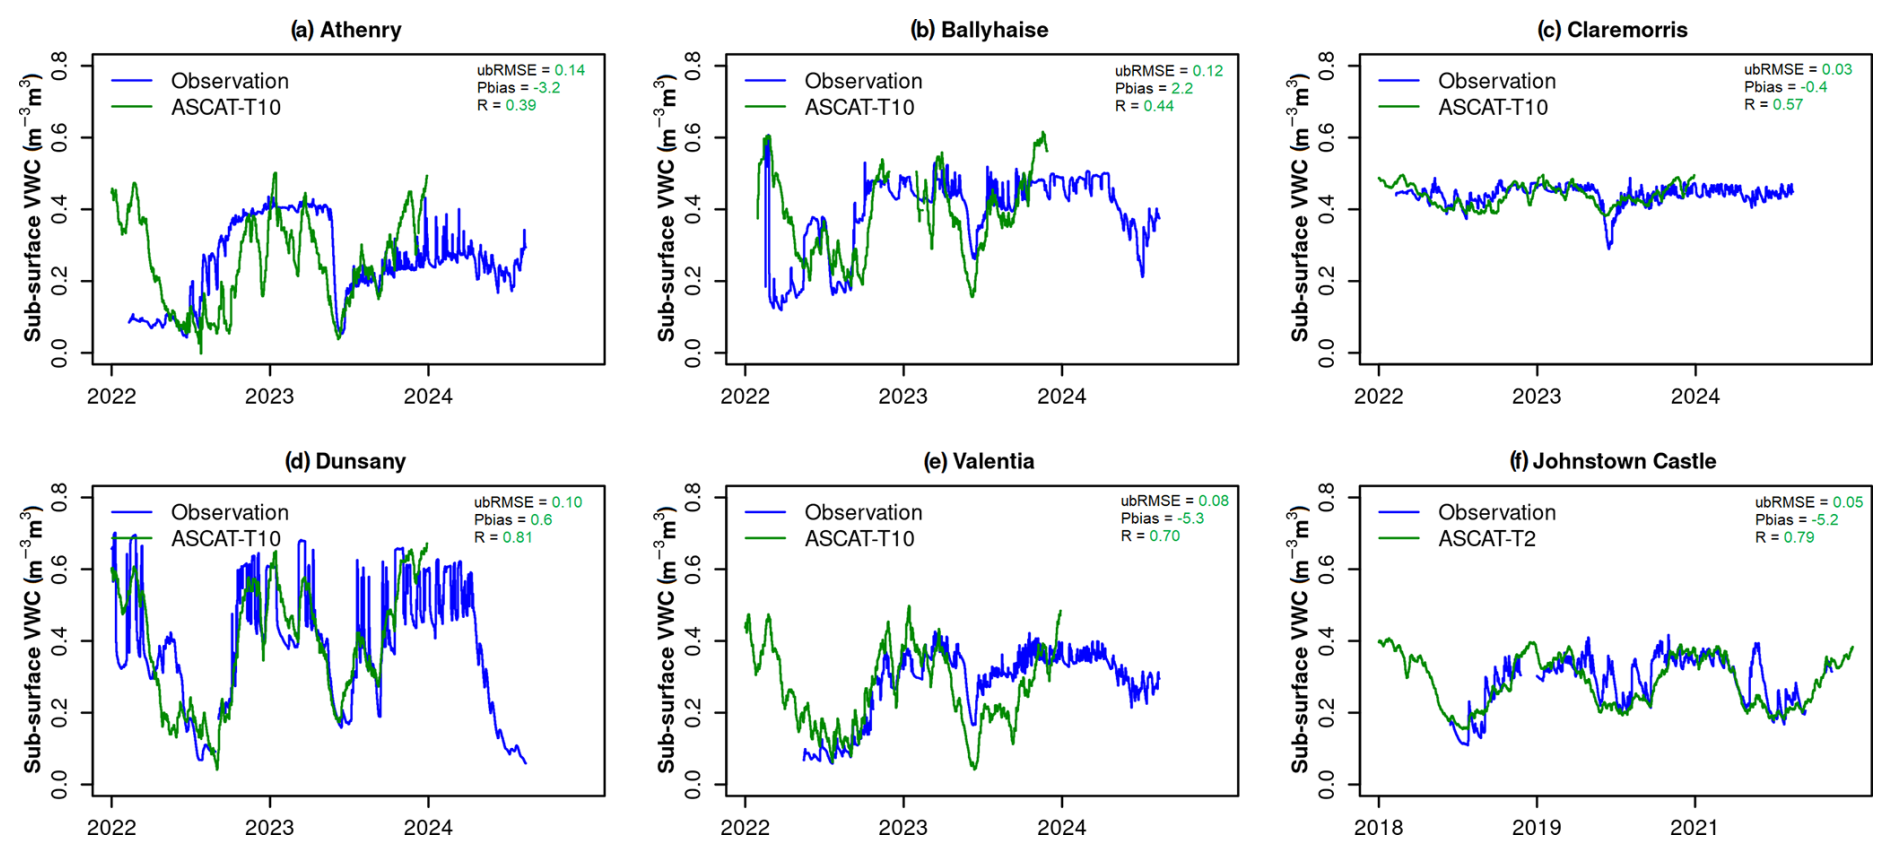
Figure A3Evaluation of satellite-derived 1 km ASCAT-T10 (10–30 cm) sub-surface soil moisture against the station observations (20 cm). No sub-surface values are available for ESA-CCI and GSSM products.
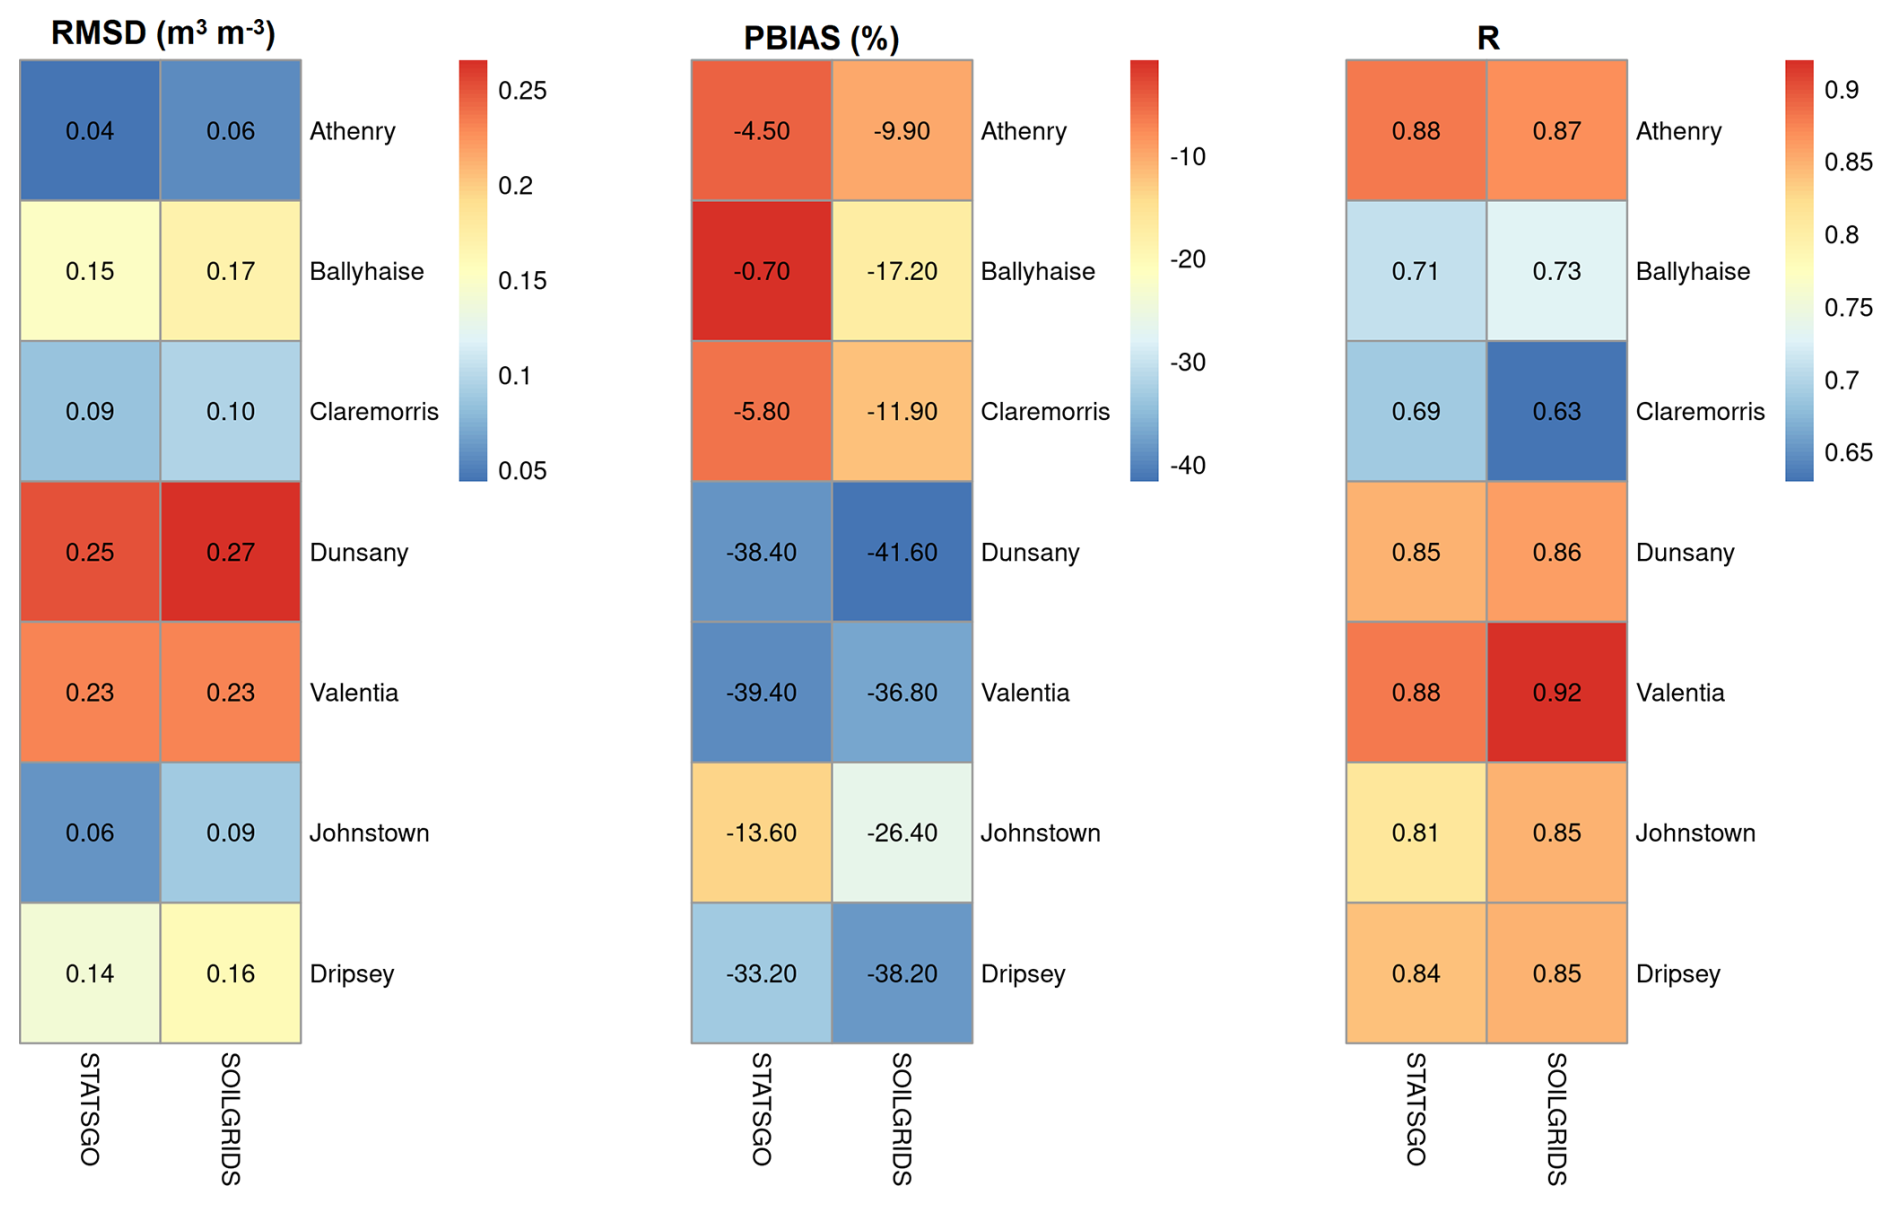
Figure A4Error statistics of volumetric water contents between observations and model experiments for the selected reference stations.
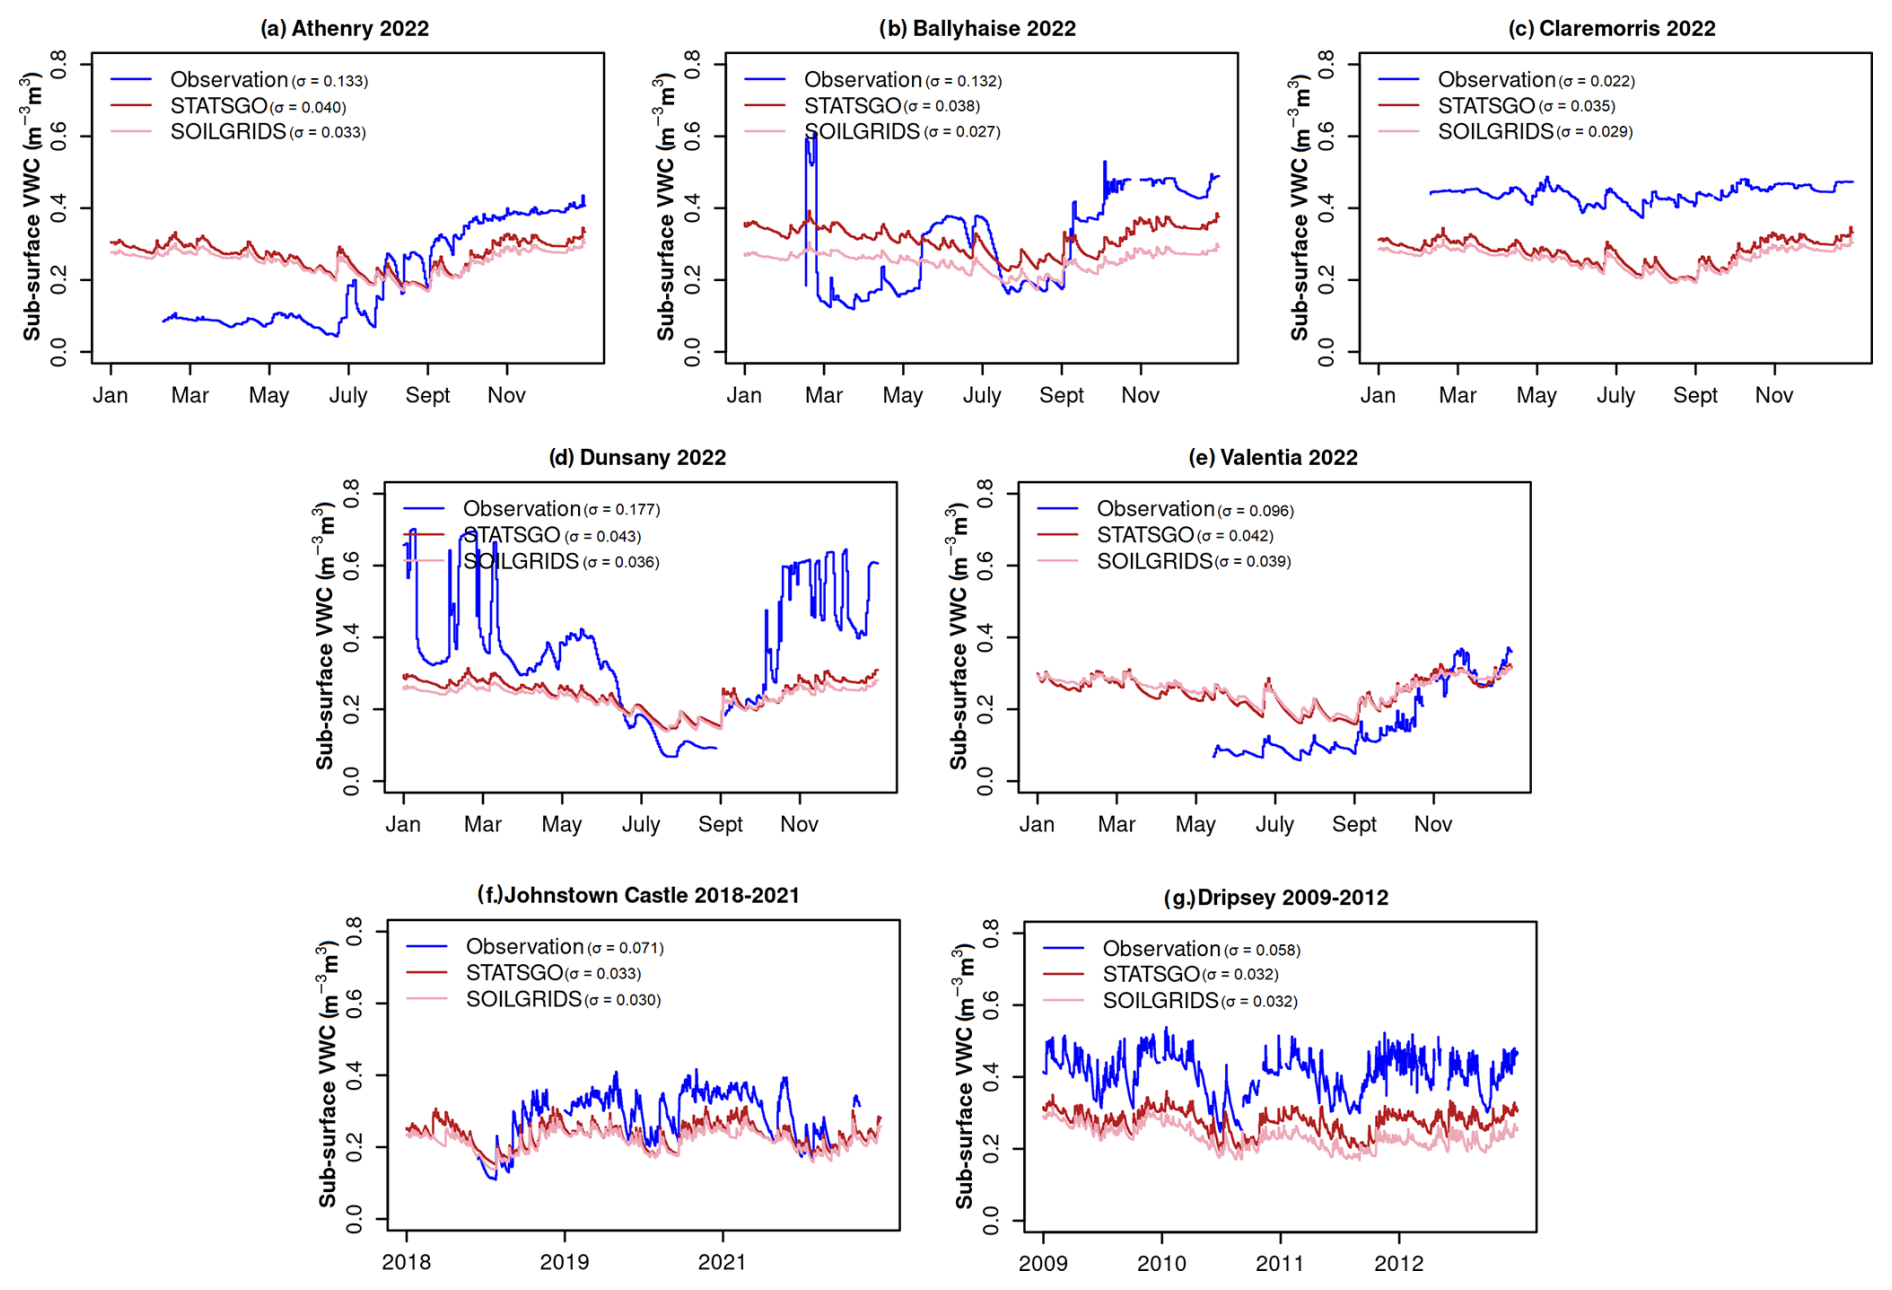
Figure A5(a–g) Temporal comparisons of sub-surface volumetric water contents between observations at 20 cm depth and simulated values at 7–21 cm layer for the selected reference stations.
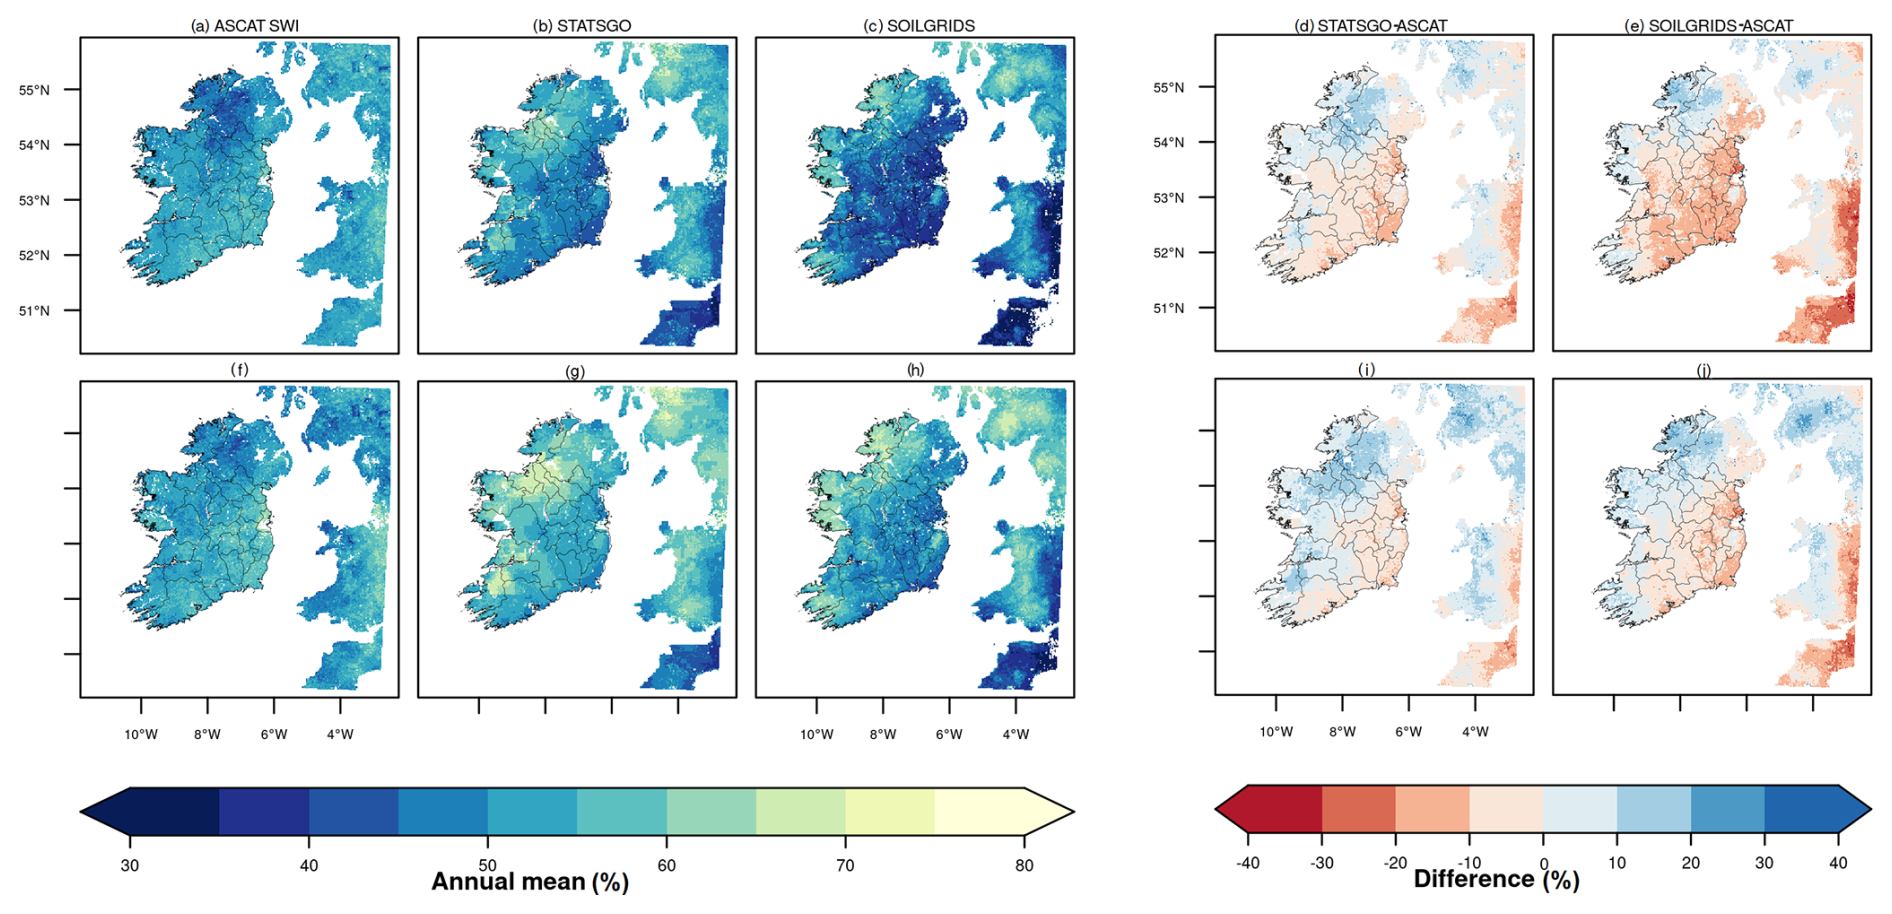
Figure A6Spatial characteristics of difference between satellite-based annual ASCAT Soil Water Index (SWI) and model-derived annual mean relative soil moisture (RSM) at the sub-surface for (a–e) 2018 and (f–j) 2019.
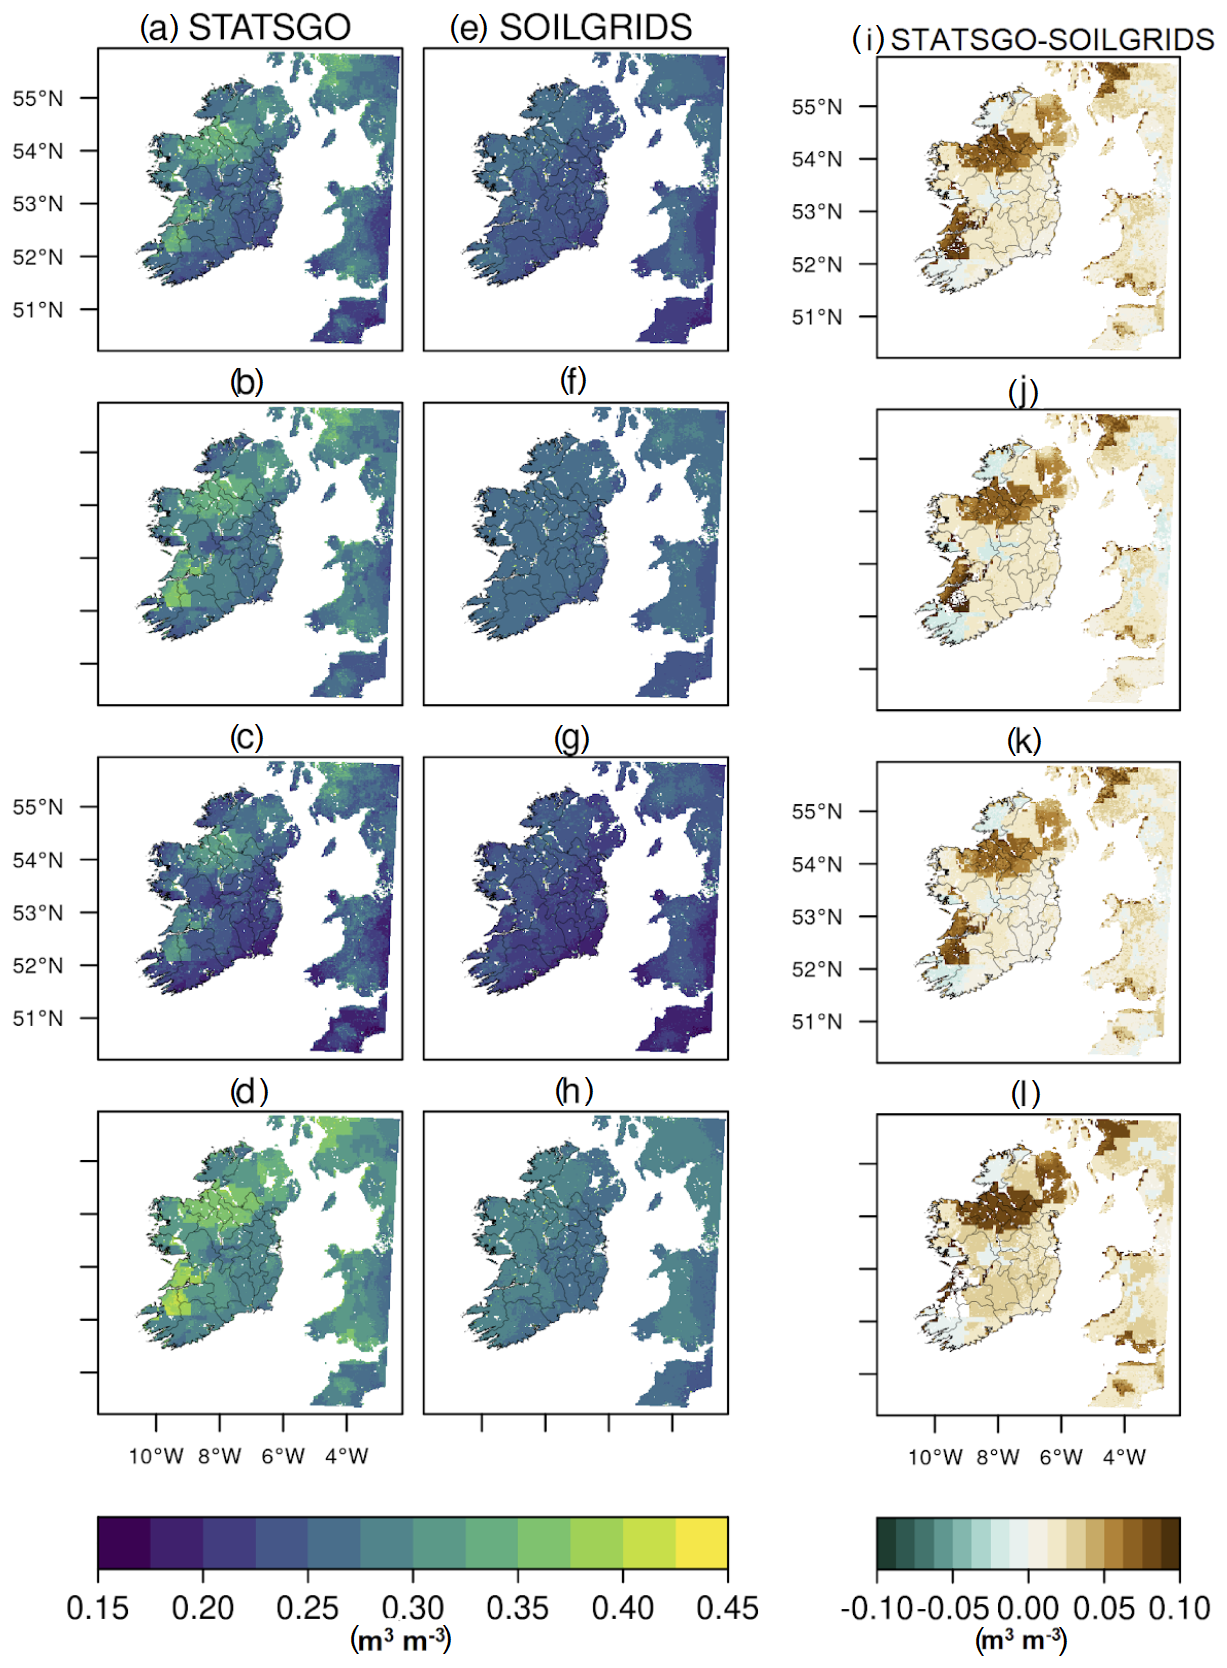
Figure A7Spatial and seasonal characteristics of simulated topsoil (0–7 cm) volumetric water content (VWC) using STATSGO and (a–d) SoilGrids (e–h), as well as the difference (i–l), for the period of 2009–2022. Rows 1–4 represent the winter to autumn seasons, in that order.
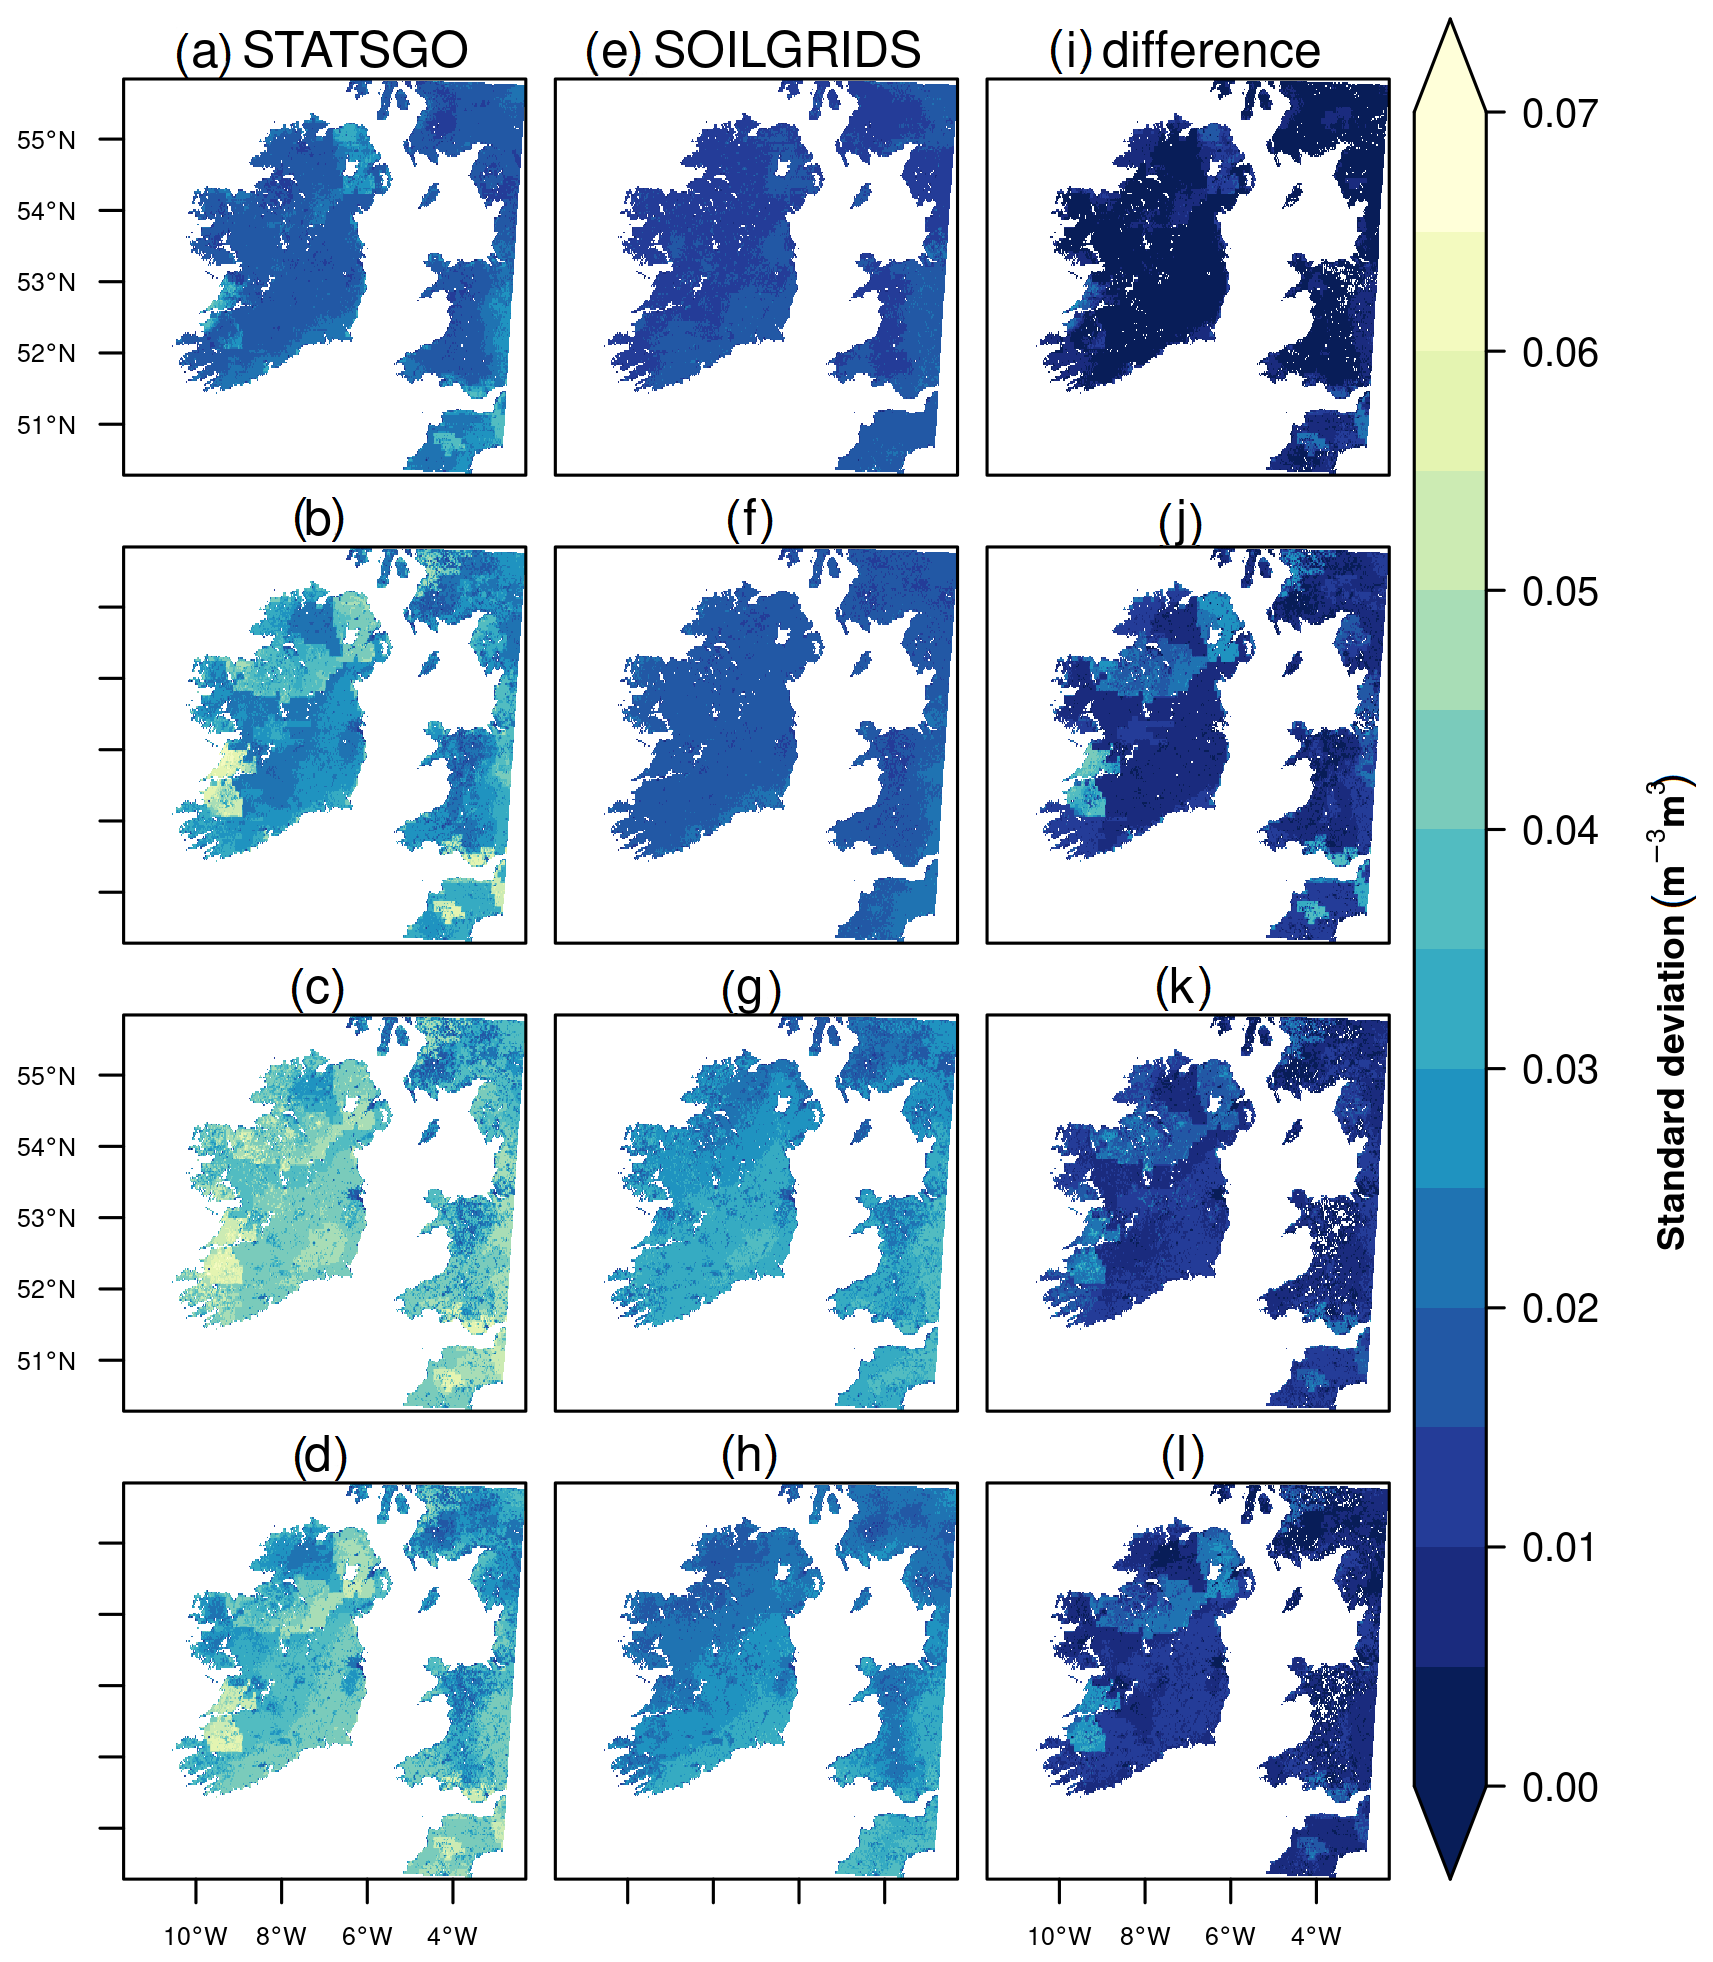
Figure A8Spatial and seasonal characteristics of simulated long-term variability in topsoil (0–7 cm) volumetric water content (VWC) using STATSGO (a–d) and SoilGrids (e–h), as well as the difference (i–l), for the period of 2009–2022. Rows 1–4 represent the winter to autumn seasons, in that order.
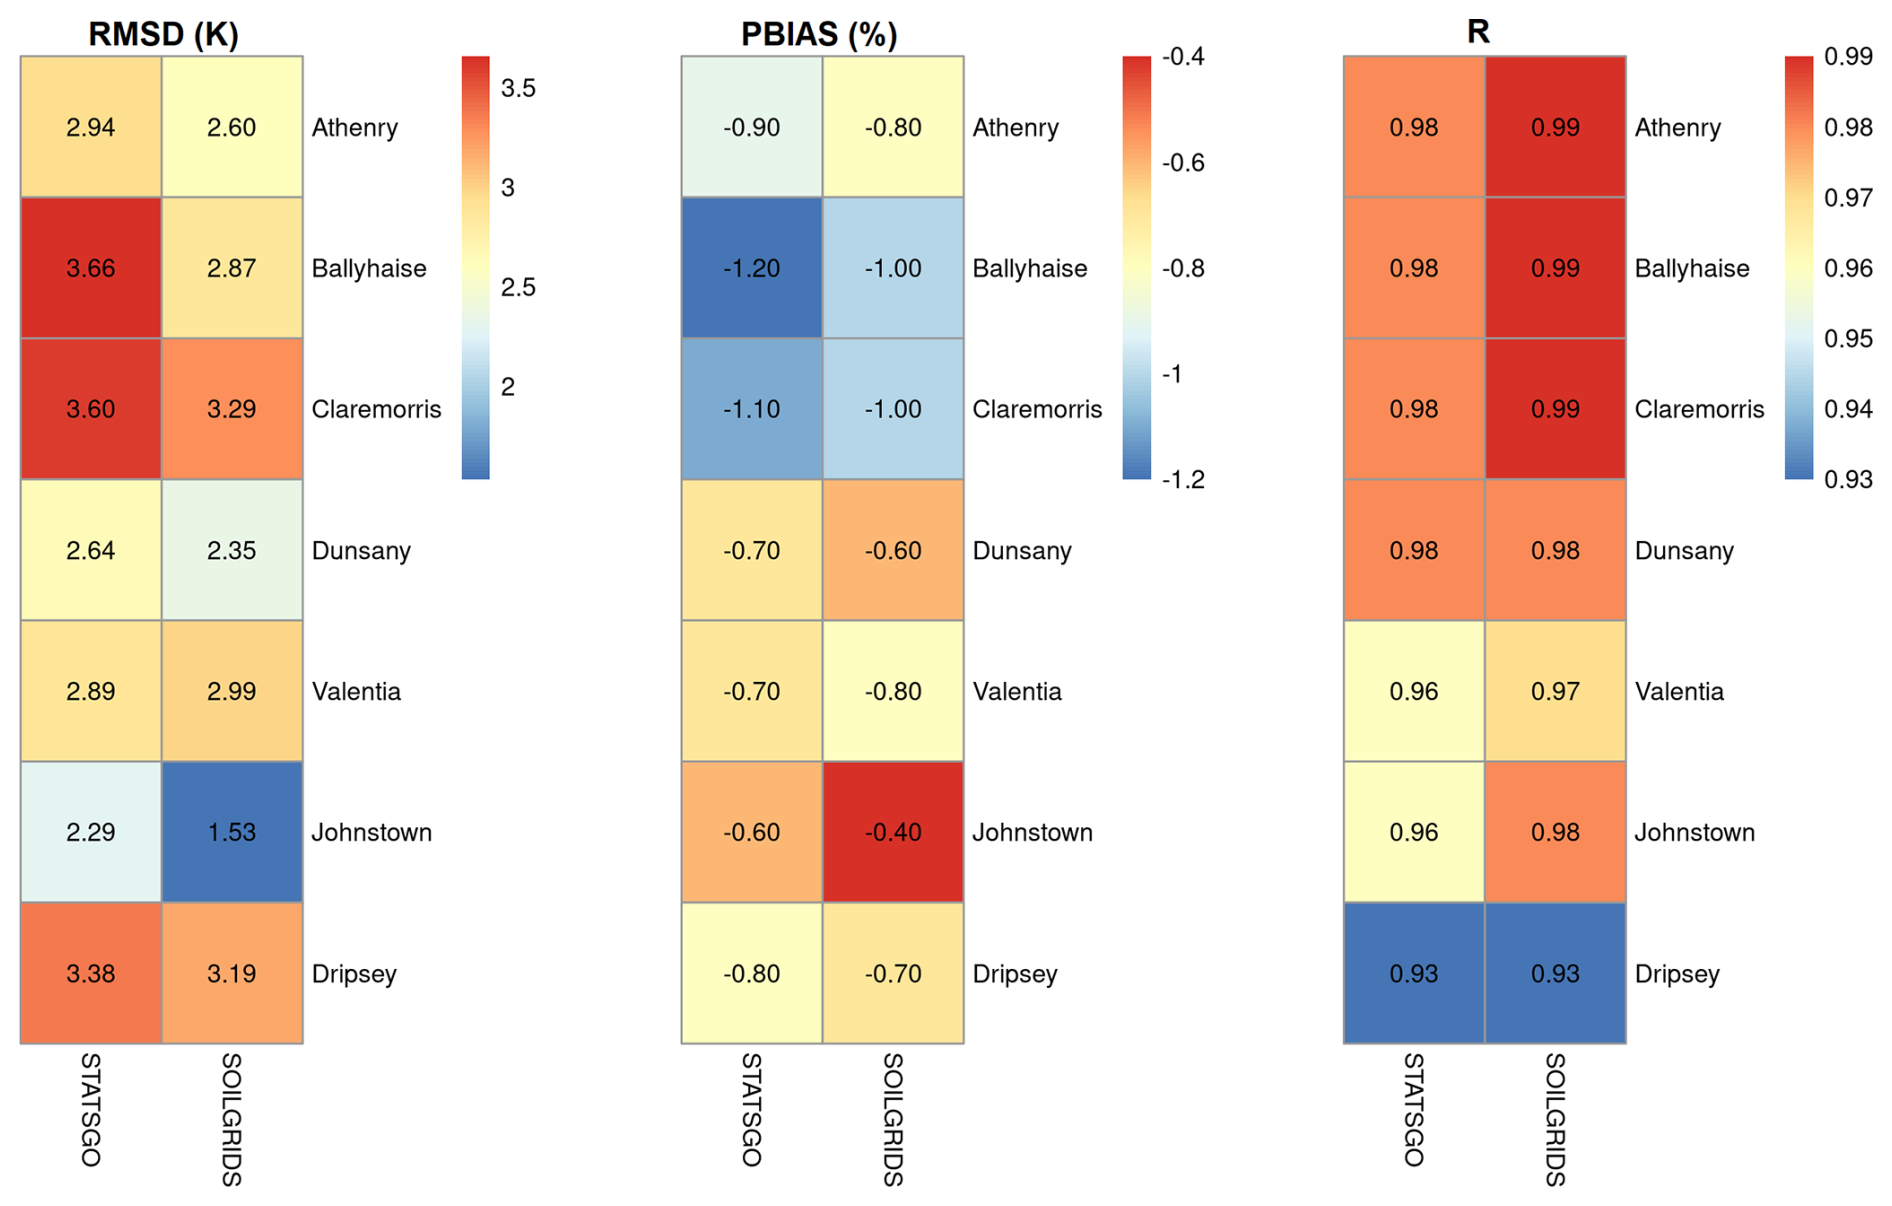
Figure A9Error statistics of soil temperature between observations and model experiments for the selected reference stations.
The open-source HRLDAS/Noah-MP model code (https://doi.org/10.5281/zenodo.7901868, He et al., 2023) is available at https://github.com/NCAR/hrldas (last access: 25 October 2021). The ECMWF ERA5-Land hourly input meteorological forcing data (Muñoz-Sabater et al., 2021) were downloaded from the Climate Data Store at https://doi.org/10.24381/cds.e2161bac (Muñoz Sabater, 2019). The WPS geographical data are freely provided by the NCAR Mesoscale and Microscale Meteorology Lab, geographical static data: https://www2.mmm.ucar.edu/wrf/users/download/get_sources_wps_geog.html (WRF Users Page, 2022). The CORINE Land Cover 2018 data are freely provided by the European Union's Copernicus Land Monitoring Service Information, CORINE Land Cover 2018 (vector/raster 100 m), Europe, 6-yearly: https://doi.org/10.2909/960998c1-1870-4e82-8051-6485205ebbac (EEA, 2020). ASCAT Soil Water Index data are freely available at https://doi.org/10.2909/0929daf7-a0a3-4428-9bc1-cec6691e85d8 (EEA, 2019). Weather station data are freely provided by Met Éireann, Ireland, Historical Data: https://www.met.ie/climate/available-data/historical-data (MET Éireann, 2022). Flux site soil moisture and soil temperature data are available from the European Fluxes Database Cluster: http://www.europe-fluxdata.eu/home/data/request-data (last access: 2 March 2019).
Conceptualization: KAI and RF. Methodology: KAI and RF. Software: KAI and RF, with contributions by PL and DW. Validation: KI. Formal analysis: KI. Investigation: KI. Resources: KAI and RF. Data curation: KI. Writing (draft preparation and review): led by KAI, GM, MD, and RF, with contributions from all of the co-authors. Visualization: KAI. Supervision: RF and GM. Project administration: RF and TM. Funding acquisition: RF and TM.
The contact author has declared that none of the authors has any competing interests.
Publisher’s note: Copernicus Publications remains neutral with regard to jurisdictional claims made in the text, published maps, institutional affiliations, or any other geographical representation in this paper. While Copernicus Publications makes every effort to include appropriate place names, the final responsibility lies with the authors.
We thank Gary Lanigan for granting us access to the measurements from Johnstown Castle. Computing resources for model runs in this work were provided by the Microsoft Azure high-performance computers. This research under the Terrain-AI project (grant no. SFI 20/SPP/3705) has been supported by the Science Foundation Ireland Strategic Partnership Programme and co-funded by Microsoft.
This research has been supported by the Science Foundation Ireland (grant no. SFI 20/SPP/3705) and Microsoft (grant no. SFI 20/SPP/3705).
This paper was edited by Thom Bogaard and reviewed by two anonymous referees.
Albergel, C., Rüdiger, C., Pellarin, T., Calvet, J.-C., Fritz, N., Froissard, F., Suquia, D., Petitpa, A., Piguet, B., and Martin, E.: From near-surface to root-zone soil moisture using an exponential filter: an assessment of the method based on in-situ observations and model simulations, Hydrol. Earth Syst. Sci., 12, 1323–1337, https://doi.org/10.5194/hess-12-1323-2008, 2008.
Albergel, C., de Rosnay, P., Gruhier, C., Muñoz-Sabatera, J., Hasenauer, S., Isaksen, L., Kerr, Y., and Wagner, W.: Evaluation of remotely sensed and modelled soil moisture products using global ground-based in situ observations, Remote Sens. Environ., 118, 215–226, https://doi.org/10.1016/j.rse.2011.11.017, 2012.
Arsenault, K. R., Nearing, G. S., Wang, S., Yatheendradas, S., and Peters-Lidard, C. D.: Parameter sensitivity of the Noah-MP land surface model with dynamic vegetation, J. Hydrometeorol., 19, 815–830, https://doi.org/10.1175/jhm-d-17-0205.1, 2018.
Barlage, M., Tewari, M., Chen, F., Miguez-Macho, G., Yang, Z.-L., and Niu, G.-Y.: The effect of groundwater interaction in North American regional climate simulations with WRF/Noah-MP, Climatic Change, 129, 485–498, https://doi.org/10.1007/s10584-014-1308-8, 2015.
Bauer-Marschallinger, B., Paulik, C., Hochstöger, S., Mistelbauer, T., Modanesi, S., Ciabatta, L., Massari, C., Brocca, L., Wagner, W. Soil Moisture from Fusion of Scatterometer and SAR: Closing the Scale Gap with Temporal Filtering, Remote Sensing, 10, 1030, https://doi.org/10.3390/rs10071030, 2018.
Beck, H. E., Pan, M., Miralles, D. G., Reichle, R. H., Dorigo, W. A., Hahn, S., Sheffield, J., Karthikeyan, L., Balsamo, G., Parinussa, R. M., van Dijk, A. I. J. M., Du, J., Kimball, J. S., Vergopolan, N., and Wood, E. F.: Evaluation of 18 satellite- and model-based soil moisture products using in situ measurements from 826 sensors, Hydrol. Earth Syst. Sci., 25, 17–40, https://doi.org/10.5194/hess-25-17-2021, 2021.
Blonquist, J. M., Jones, S. B., and Robinson, D. A.: Standardizing characterization of electromagnetic water content sensors: Part 2. Evaluation of seven sensing systems, Vadose Zone J., 4, 1059–1069, https://doi.org/10.2136/vzj2004.0141, 2005.
Blyth, E. M., Arora, V. K., Clark, D. B., Dadson, S. J., De Kauwe, M. G., Lawrence, D. M., Melton, J. R., Pongratz, J., Turton, R. H., Yoshimura, K., and Yuan, H.: Advances in Land Surface Modelling, Curr. Clim. Change Rep., 7, 45–71, https://doi.org/10.1007/s40641-021-00171-5, 2021.
Briciu-Burghina, C., Zhou, J., Ali, M. I., and Regan, F.: Demonstrating the Potential of a Low-Cost Soil Moisture Sensor Network, Sensors, 22, 987, https://doi.org/10.3390/s22030987, 2022.
Chang, M., Cao, J., Zhang, Q., Chen, W., Wu, G., Wu, L., Wang, W., and Wang, X.: Improvement of stomatal resistance and photosynthesis mechanism of Noah-MP-WDDM (v1.42) in simulation of NO2 dry deposition velocity in forests, Geosci. Model Dev., 15, 787–801, https://doi.org/10.5194/gmd-15-787-2022, 2022.
Chen, F., Mitchell, K., Schaake, J., Xue, Y., Pan, H. L., Koren, V., Duan, Q. Y., Ek, M., and Betts, A.: Modeling of land surface evaporation by four schemes and comparison with FIFE observations, J. Geophys. Res., 101, 7251–7268, https://doi.org/10.1029/95JD02165, 1996.
Chen, F., Manning, K. W., Lemone, M. A., Trier, S. B., Alfieri, J. G., Roberts, R., Tewari, M., Niyogi, D., Horst, T. W., Oncley, S. P., Basara, J. B., and Blanken, P. D.: Description and evaluation of the characteristics of the NCAR high-resolution land data assimilation system, J. Appl. Meteorol. Clim., 46, 694–713, https://doi.org/10.1175/JAM2463.1, 2007.
Creamer, R. E., Simo, I., Reidy, Carvalho, J., Fealy, R., Hallett, S., Jones, R., Holden, A., Holden, N., Hannam, J., Massey, P., Mayr, T., McDonald, E., O'Rourke, S., Sills, P., Truckell, I., Zawadzka, J., and Schulte, R. P. O.: Irish Soil Information System, Synthesis Report (2007-S-CD-1-S1), EPA STRIVE Programme, Wexford, https://www.epa.ie/publications/research/land-use-soils-and-transport/research-130-irish-soils-information-system.php (last access: 23 April 2019), 2014.
Dai, Y., Shangguan, W., Wei, N., Xin, Q., Yuan, H., Zhang, S., Liu, S., Lu, X., Wang, D., and Yan, F.: A review of the global soil property maps for Earth system models, SOIL, 5, 137–158, https://doi.org/10.5194/soil-5-137-2019, 2019a.
Dai, Y., Xin, Q., Wei, N., Zhang, Y., Shangguan, W., Yuan, H., Zhang, S., Liu, S., and Lu, X.: A global high-resolution data set of soil hydraulic and thermal properties for land surface modeling, J. Adv. Model. Earth Sy., 11, 2996–3023, https://doi.org/10.1029/2019MS001784, 2019b.
De Boeck, H. J., Dreesen, F. E., Janssens, I. A., and Nijs, I.: Whole-system responses of experimental plant communities to climate extremes imposed in different seasons, New Phytol., 189, 806–817, https://doi.org/10.1111/j.1469-8137.2010.03515.x, 2011.
de Lange, R., Beck, R., van de Giesen, N., Friesen, J., de Wit, A., and Wagner, W.: Scatterometer-Derived Soil Moisture Calibrated for Soil Texture with a One-Dimensional Water-Flow Model, IEEE T. Geosci. Remote, 46, 4041–4049, https://doi.org/10.1109/TGRS.2008.2000796, 2008.
de Lannoy, G. J. M., Koster, R. D., Reichle, R. H., Mahanama, S. P. P., and Liu, Q.: An updated treatment of soil texture and associated hydraulic properties in a global land modeling system, J. Adv. Model. Earth Sy., 6, 957–979, https://doi.org/10.1002/2014MS000330, 2014.
Dennis, E. J. and Berbery, E. H.: The role of soil texture in local land surface-atmosphere coupling and regional climate, J. Hydromet., 22, 313–330, https://doi.org/10.1175/JHM-D-20-0047.1, 2021.
Dennis, E. J. and Berbery, E. H.: The effects of soil representation in WRF-CLM on the atmospheric moisture budget, J. Hydromet., 23, 681–696, https://doi.org/10.1175/JHM-D-21-0101.1, 2022.
EEA: Soil Water Index 2015–present (raster 1 km), Europe, daily – version 1, EEA [data set], https://doi.org/10.2909/0929daf7-a0a3-4428-9bc1-cec6691e85d8, 2019.
EEA: CORINE Land Cover 2018 (raster 100 m), Europe, 6-yearly – version 2020_20u1, May 2020, EEA [data set], https://doi.org/10.2909/960998c1-1870-4e82-8051-6485205ebbac, 2020.
Falzoi, S., Gleeson, E., Lambkin, K., Zimmermann, J., Marwaha, R., O'Hara, R., Green, S., and Fratianni, S.: Analysis of the severe drought in Ireland in 2018, Weather, 74, 368–373, https://doi.org/10.1002/wea.3587, 2019.
Fan, J., McConkey, B., Wang, H., and Janzen, H.: Root distribution by depth for temperate agricultural crops, Field Crop Res., 189, 68–74, https://doi.org/10.1016/J.FCR.2016.02.013, 2016.
FAO: Digital soil map of the world and derived soil properties, FAO, Land and Water Digital Media Series, CD-ROM, ISBN 978-92-3-103889-1, 92-3-103889-3, https://unesdoc.unesco.org/ark:/48223/pf0000130133 (last access: 10 March 2022), 2003.
Fealy, R., Bruyére, C., and Duffy, C.: Regional Climate Model Simulations for Ireland for the 21st Century, Final Report, Environmental Protection Agency, Co. Wexford, 1–137, https://www.epa.ie/publications/research/climate-change/research-244-regional-climate-model-simulations-for-ireland-for-the-21st-century.php (last access: 15 September 2020), 2018.
Fisher, R. A. and Koven, C. D.: Perspectives on the Future of Land Surface Models and the Challenges of Representing Complex Terrestrial Systems, J. Adv. Model. Earth Sys., 12, e2018MS001453, https://doi.org/10.1029/2018MS001453, 2020.
Gee, G. W. and Bauder, J. W.: Particle-size Analysis, in: SSSA Book Series, edited by: Klute, A., Soil Science Society of America, American Society of Agronomy, Madison, WI, USA, 383–411, https://doi.org/10.2136/sssabookser5.1.2ed.c15, 2018.
Grillakis, M. G.: Increase in severe and extreme soil moisture droughts for Europe under climate change, Sci. Total Environ., 660, 1245–1255, https://doi.org/10.1016/j.scitotenv.2019.01.001, 2019.
Han, Q., Zeng, Y., Zhang, L., Wang, C., Prikaziuk, E., Niu, Z., and Su, B.: Global long term daily 1 km surface soil moisture dataset with physics informed machine learning, Sci. Data, 10, 101, https://doi.org/10.1038/s41597-023-02011-7, 2023.
He, C., Barlage, M., Zhang, Z., xutr-bnu, Mocko, D., and Chen, F.: NCAR/hrldas: Release of v5.0.0, Zenodo [code], https://doi.org/10.5281/zenodo.7901868, 2023.
He, Q., Lu, H., and Yang, K.: Soil Moisture Memory of Land Surface Models Utilized in Major Reanalyses Differ Significantly from SMAP Observation, Earth's Future, 11, e2022EF003215, https://doi.org/10.1029/2022EF003215, 2023.
Hengl, T., Mendes de Jesus, J., Heuvelink, G. B. M., Ruiperez Gonzalez, M., Kilibarda, M., Blagotic, A., Shangguan, W., Wright, M. N., Geng, X., Bauer-Marschallinger, B., Guevara, M. A., Vargas, R., MacMillan, R. A., Batjes, N. H., Leenaars, J. G. B., Ribeiro, E., Wheeler, I., Mantel, S., and Kempen, B.: SOILGRIDS250m: global gridded soil information based on Machine Learning, PLOS One, 12, e0169748, https://doi.org/10.1371/journal.pone.0169748, 2017.
Hosseini, A., Mocko, D. M., Brunsell, N. A., Kumar, S. V., Mahanama, S., Arsenault, K., and Roundy, J. K.: Understanding the impact of vegetation dynamics on the water cycle in the NOAH-MP model, Front. Water, 4, 2022, https://doi.org/10.3389/frwa.2022.925852, 2022.
Hu, W., Ma, W., Yang, Z.-L., Ma, Y., and Xie, Z.: Sensitivity analysis of the Noah-MP land surface model for soil hydrothermal simulations over the Tibetan Plateau, J. Adv. Model. Earth Sy., 15, e2022MS003136, https://doi.org/10.1029/2022MS003136, 2023.
Ishola, K. A., Mills, G., Fealy, R. M., Ní, C. Ó., and Fealy, R.: Improving a land surface scheme for estimating sensible and latent heat fluxes above grassland with contrasting soil moisture zones, Agr. Forest Meteorol., 294, 108151, https://doi.org/10.1016/j.agrformet.2020.108151, 2020.
Ishola, K. A., Mills, G., Fealy, R. M., and Fealy, R.: A model framework to investigate the role of anomalous land surface processes in the amplification of summer drought across Ireland during 2018, Int. J. Climatol., 43, 480–498, https://doi.org/10.1002/joc.7785, 2022.
Jordan, R.: A one-dimensional temperature model for a snow cover: Technical documentation for SNTHERM 89, US Army Cold Regions Research and Engineering Laboratory Special Report, 91–16, 49, https://hdl.handle.net/11681/11677 (last access: 22 September 2023), 1991.
Keane, T. and Collins, J. F. (Eds.): Climate, Weather and Irish Agriculture, AGMET, UCD, Belfield, Dublin, 4, https://agmet.ie/publications/agmet-publications/ (last access: 17 May 2019), 2004.
Kiely, G., Leahy, P., Lewis, C., Sottocornola, M., Laine, A., and Koehler, A.-K.: GHG Fluxes from Terrestrial Ecosystems in Ireland, Research report No. 227, EPA Research Programme, Wexford, https://www.epa.ie/pubs/reports/research/climate/Research_Report_227.pdf (last access: 10 September 2023), 2018.
Kishné, A. S., Yimam, Y. T., Morgan, C. L. S., and Dornblaser, B. C.: Evaluation and improvement of the default soil hydraulic parameters for the Noah land surface model, Geoderma, 285, 247–259, https://doi.org/10.1016/j.geoderma.2016.09.022, 2017.
Kumar, S. V., Holmes, T. R., Bindlish, R., de Jeu, R., and Peters-Lidard, C.: Assimilation of vegetation optical depth retrievals from passive microwave radiometry, Hydrol. Earth Syst. Sci., 24, 3431–3450, https://doi.org/10.5194/hess-24-3431-2020, 2020.
Lehmann, P., Merlin, O., Gentine, P., and Or, D.: Soil texture effects on surface resistance to bare-soil evaporation, Geophys. Res. Lett., 45, 10398–10405, https://doi.org/10.1029/2018GL078803, 2018.
Li, J., Chen, F., Zhang, G., Barlage, M., Gan, Y., Xin, Y., and Wang, C.: Impacts of land cover and soil texture uncertainty on land model simulations over the Central Tibetan Plateau, J. Adv. Model. Earth Sy., 10, 2121–2146, https://doi.org/10.1029/2018MS001377, 2018.
Looy, K. V., Bouma, J., Herbst, M., Koestel, J., Minasny, B., Mishra, U., Montzka, C., Nemes, A., Pachepsky, Y. A., Padarian, J., Schaap, M. G., Tóth, B., Verhoef, A., Vanderborght, J., Ploeg, M. J., Weihermüller, L., Zacharias, S., Zhang, Y., and Vereecken, H.: Pedotransfer Functions in Earth System Science: Challenges and Perspectives, Rev. Geophys., 55, 1199–1256, https://doi.org/10.1002/2017RG000581, 2017.
Luo, Y., Ahlström, A., Allison, S. D., Batjes, N. H., Brovkin, V., Carvalhais, N., Chappell, A., Ciais, P., Davidson, E. A., Finzi, A., Georgiou, K., Guenet, B., Hararuk, O., Harden, J. W., He, Y., Hopkins, F., Jiang, L., Koven, C., Jackson, R. B., Jones, C. D., Lara, M. J., Liang, J., McGuire, A. D., Parton, W., Peng, C., Randerson, J. T., Salazar, A., Sierra, C. A., Smith, M. J., Tian, H., Todd-Brown, K. E. O., Torn, M., van Groenigen, K. J., Wang, Y. P., West, T. O., Wei, Y., Wieder, W. R., Xia, J., Xu, X., Xu, X., and Zhou, T. C. G. B.: Toward more realistic projections of soil carbon dynamics by Earth system models, Global Biogeochem. Cy., 30, 40–56, https://doi.org/10.1002/2015gb005239, 2016.
Mahrt, L. and Pan, H.: A two-layer model of soil hydrology, Bound.-Lay. Meteorol., 29, 1–20, https://doi.org/10.1007/BF00119116, 1984.
MET Éireann: Historical Data, MET Éireann [data set], https://www.met.ie/climate/available-data/historical-data, last access: 23 October 2022.
Met Éireann Report: A summer of heatwaves and droughts, https://www.met.ie/cms/assets/uploads/2018/09/summerfinal3.pdf (last access: 5 November 2019), 2018.
Moore, P.: Summer 2018, https://www.met.ie/cms/assets/uploads/2020/06/Summer2018.pdf (last access: 23 February 2021), 2020.
Murphy, R. M., Saunders, M., Richards, K. G., Krol, D. J., Gebremichael, A. W., Rambaud, J., Cowan, N., and Lanigan, G. J.: Nitrous oxide emission factors from an intensively grazed temperate grassland: A comparison of cumulative emissions determined by eddy covariance and static chamber methods, Agric. Ecosys. Environ., 324 107725, https://doi.org/10.1016/j.agee.2021.107725, 2022.
Muñoz Sabater, J.: ERA5-Land hourly data from 1950 to present, Copernicus Climate Change Service (C3S) Climate Data Store (CDS) [data set], https://doi.org/10.24381/cds.e2161bac, 2019.
Muñoz-Sabater, J., Dutra, E., Agustí-Panareda, A., Albergel, C., Arduini, G., Balsamo, G., Boussetta, S., Choulga, M., Harrigan, S., Hersbach, H., Martens, B., Miralles, D. G., Piles, M., Rodríguez-Fernández, N. J., Zsoter, E., Buontempo, C., and Thépaut, J.-N.: ERA5-Land: a state-of-the-art global reanalysis dataset for land applications, Earth Syst. Sci. Data, 13, 4349–4383, https://doi.org/10.5194/essd-13-4349-2021, 2021.
Nie, W., Kumar, S. V., Arsenault, K. R., Peters-Lidard, C. D., Mladenova, I. E., Bergaoui, K., Hazra, A., Zaitchik, B. F., Mahanama, S. P., McDonnell, R., Mocko, D. M., and Navari, M.: Towards effective drought monitoring in the Middle East and North Africa (MENA) region: implications from assimilating leaf area index and soil moisture into the Noah-MP land surface model for Morocco, Hydrol. Earth Syst. Sci., 26, 2365–2386, https://doi.org/10.5194/hess-26-2365-2022, 2022.
Niu, G.-Y., Yang, Z.-L., Dickinson, R. E., Gulden, L. E., and Su, H.: Development of a simple groundwater model for use in climate models and evaluation with Gravity Recovery and Climate Experiment data, J. Geophys. Research, 112, D07103, https://doi.org/10.1029/2006JD007522, 2007.
Niu, G.-Y., Yang, Z.-L., Mitchell, K. E., Chen, F., Ek, M. B., Barlage, M., Kumar, A., Manning, K., Niyogi, D., Rosero, E., Tewari, M., and Xia, Y.: The community Noah land surface model with multiparameterization options (Noah-MP): 1. Model description and evaluation with local-scale measurements, J. Geophys. Res.-Atmos., 116, D12110, https://doi.org/10.1029/2010JD015139, 2011.
Noone, S., Broderick, C., Duffy, C., Matthews, T., Wilby, R. L., and Murphy, C.: A 250-year drought catalogue for the Island of Ireland (1765–2015), Int. J. Climatol., 37, 239–254, 2017.
Or, D. and Lehmann, P.: Surface evaporative capacitance: How soil type and rainfall characteristics affect global-scale surface evaporation, Water Resour. Res., 55, 519–539, https://doi.org/10.1029/2018WR024050, 2019.
Paulik, C., Dorigo, W., Wagner, W., and Kidd, R.: Validation of the ASCAT Soil Water Index using in situ data from the International Soil Moisture Network, Int. J. Appl. Earth Obs., 30, 1–8, https://doi.org/10.1016/j.jag.2014.01.007, 2014.
Peel, M. C., Finlayson, B. L., and McMahon, T. A.: Updated world map of the Köppen-Geiger climate classification, Hydrol. Earth Syst. Sci., 11, 1633–1644, https://doi.org/10.5194/hess-11-1633-2007, 2007.
Peichl, M., Carton, O., and Kiely, G.: Management and climate effects on carbon dioxide and energy exchanges in a maritime grassland, Agr. Ecosyst. Environ., 158, 132–146, https://doi.org/10.1016/j.agee.2012.06.001, 2012.
Poggio, L., de Sousa, L. M., Batjes, N. H., Heuvelink, G. B. M., Kempen, B., Ribeiro, E., and Rossiter, D.: SoilGrids 2.0: producing soil information for the globe with quantified spatial uncertainty, SOIL, 7, 217–240, https://doi.org/10.5194/soil-7-217-2021, 2021.
Reidy, B., Simo, I., Sills, P., and Creamer, R. E.: Pedotransfer functions for Irish soils – estimation of bulk density (ρb) per horizon type, SOIL, 2, 25–39, https://doi.org/10.5194/soil-2-25-2016, 2016.
Sakaguchi, K. and Zeng, X.: Effects of soil wetness, plant litter, and under-canopy atmospheric stability on ground evaporation in the Community Land Model (CLM3.5), J. Geophys. Res.,114, D01107, https://doi.org/10.1029/2008JD010834, 2009.
Samaniego, L., S. Thober, R. Kumar, Wanders, N., Rakovec, O., Pan, M., Zink, M., Sheffield, J., Wood, E. F., and Marx, A.: Anthropogenic warming exacerbates European soil moisture droughts, Nat. Clim. Change, 8, 421–426, https://doi.org/10.1038/s41558-018-0138-5, 2018.
Saxton, K. E. and Rawls, W. J.: Soil water characteristic estimates by texture and organic matter for hydrologic solutions, Soil Sci. Soc. Am. J., 70, 1569–1578, https://doi.org/10.2136/sssaj2005.0117, 2006.
Seneviratne, S. I., Corti, T., Davin, E. L., Hirschi, M., Jaeger, E. B., Lehner, I., Orlowsky, B., and Teuling, A. J.: Investigating soil moisture–climate interactions in a changing climate: a review, Earth-Sci. Rev., 99, 125–161, 2010.
Seneviratne, S. I., Nicholls, N., Easterling, D., Goodess, C. M., Kanae, S., Kossin, J., Luo, Y., Marengo, J., McInnes, K., Rahimi, M., Reichstein, M., Sorteberg, A., Vera, C., and Zhang, X.: Changes in climate extremes and their impacts on the natural physical environment, in: Managing the Risks of Extreme Events and Disasters to Advance Climate Change Adaptation, edited by: Field, C. B., Barros, V., Stocker, T. F., Qin, D., Dokken, D. J., Ebi, K. L., Mastrandrea, M. D., Mach, K. J., Plattner, G.-K., Allen, S. K., Tignor, M., and Midgley, P. M., A Special Report of Working Groups I and II of the Intergovernmental Panel on Climate Change, Cambridge University Press, Cambridge, United Kingdom and New York, NY, USA, 109–230, ISBN 9781107607804, https://doi.org/10.1017/CBO9781139177245.006, 2012.
Shangguan, W., Dai, Y., Duan, Q., Liu, B., and Yuan, H.: A global soil data set for earth system modeling, J. Adv. Model. Earth Sy., 6, 249–263, https://doi.org/10.1002/2013MS000293, 2014.
Skamarock, W., Klemp, J., Dudhia, J., Gill, D. O., Liu, Z., Berner, J., Wang, W., Powers, J. G., Duda, M. G., Barker, D., and Huang, X.-Y.: A Description of the Advanced Research WRF Model Version 4.3, UCAR/NCAR [data set], https://doi.org/10.5065/1dfh-6p97, 2021.
Svoboda, M., LeComte, D., Hayes, M., Heim, R., Gleason, K., Angel, J., Rippey, B., Tinker, R., Palecki, M., Stooksbury, D., Miskus, D., and Stephens, S.: The Drought Monitor, B. Am. Meteorol. Soc., 83, 1181–1190, https://doi.org/10.1175/1520-0477-83.8.1181, 2002.
Szabó, B., Szatmári, G., Takács, K., Laborczi, A., Makó, A., Rajkai, K., and Pásztor, L.: Mapping soil hydraulic properties using random-forest-based pedotransfer functions and geostatistics, Hydrol. Earth Syst. Sci., 23, 2615–2635, https://doi.org/10.5194/hess-23-2615-2019, 2019.
Vereecken, H., Weynants, M., Javaux, M., Pachepsky, Y., Schaap, M. G., and van Genuchten, M. T.: Using pedotransfer functions to estimate the Van Genuchten-Mualem soil hydraulic properties – A review, Vadose Zone J., 9, 795–820, https://doi.org/10.2136/vzj2010.0045, 2010.
Wagner, W., Lemoine, G., and Rott, H.: A method for estimating soil moisture from ERS scatterometer and soil data, Remote Sens. Environ., 70, 191–207, 1999.
Walsh, S.: A summary of climate averages for Ireland, 1981–2010, MET Eireann CLIMATOLOGICAL NOTE No. 14, Dublin, https://www.met.ie/climate-ireland/SummaryClimAvgs.pdf (last access: 19 October 2023), 2012.
Warrach-Sagi, K., Ingwersen, J., Schwitalla, T., Troost, C., Aurbacher, J., Jach, L., Berger, T., Streck, T., and Wulfmeyer, V.: Noah-MP with the generic crop growth model Gecros in the WRF model: Effects of dynamic crop growth on land-atmosphere interaction, J. Geophys. Res.-Atmos., 127, e2022JD036518, https://doi.org/10.1029/2022JD036518, 2022.
Weber, T. K. D., Weihermüller, L., Nemes, A., Bechtold, M., Degré, A., Diamantopoulos, E., Fatichi, S., Filipović, V., Gupta, S., Hohenbrink, T. L., Hirmas, D. R., Jackisch, C., de Jong van Lier, Q., Koestel, J., Lehmann, P., Marthews, T. R., Minasny, B., Pagel, H., van der Ploeg, M., Shojaeezadeh, S. A., Svane, S. F., Szabó, B., Vereecken, H., Verhoef, A., Young, M., Zeng, Y., Zhang, Y., and Bonetti, S.: Hydro-pedotransfer functions: a roadmap for future development, Hydrol. Earth Syst. Sci., 28, 3391–3433, https://doi.org/10.5194/hess-28-3391-2024, 2024.
Weihermüller, L., Lehmann, P., Herbst, M., Rahmati, M., Verhoef, A., Or, D., Jacques, D., and Vereecken, H.: Choice of pedotransfer functions matters when simulating soil water balance fluxes, J. Adv. Model. Earth Sy., 13, e2020MS002404M, https://doi.org/10.1029/2020MS002404, 2021.
WRF Users Page: WPS V4 Geographical Static Data Downloads Page, WRF Users Page [data set], https://www2.mmm.ucar.edu/wrf/users/download/get_sources_wps_geog.html, last access: 4 April 2022.
Xia, Y., Ek, M. B., Peters-Lidard, C. D., Mocko, D., Svoboda, M., Sheffield, J., and Wood, E. F.: Application of USDM statistics in NLDAS-2: Optimal blended NLDAS drought index over the continental United States, J. Geophys. Res.-Atmos., 119, 2947–2965, https://doi.org/10.1002/2013JD020994, 2014.
Xu, C., Torres-Rojas, L., Vergopolan, N., and Chaney, N. W.: The benefits of using state-of-the-art digital soil properties maps to improve the modeling of soil moisture in land surface models, Water Resour. Res., 59, e2022WR032336, https://doi.org/10.1029/2022WR032336, 2023.
Zhang, Y., Schaap, M. G., and Zha, Y.: A high-resolution global map of soil hydraulic properties produced by a hierarchical parameterization of a physically based water retention model, Water Resour. Res., 54, 9774–9790, https://doi.org/10.1029/2018WR023539, 2018.
Zhang, Z., Laux, P., Baade, J., Arnault, J., Wei, J., Wang, X., Liu, Y., Schmullius, C., and Kunstmann, H: Impact of alternative soil data sources on the uncertainties in simulated land-atmosphere interactions, Agric. Fores. Meteor., 339, 109565, https://doi.org/10.1016/j.agrformet.2023.109565, 2023.
Zhao, H., Zeng, Y., Lv, S., and Su, Z.: Analysis of soil hydraulic and thermal properties for land surface modeling over the Tibetan Plateau, Earth Syst. Sci. Data, 10, 1031–1061, https://doi.org/10.5194/essd-10-1031-2018, 2018.
Zheng, H. and Yang, Z.-L.: Effects of soil-type datasets on regional terrestrial water cycle simulations under different climatic regimes, J. Geophys. Res.-Atmos., 121, 14387–14402, https://doi.org/10.1002/2016JD025187, 2016.
Zhuo, L., Dai, Q., Han, D., Chen, N., and Zhao, B.: Assessment of simulated soil moisture from WRF Noah, Noah-MP, and CLM land surface schemes for landslide hazard application, Hydrol. Earth Syst. Sci., 23, 4199–4218, https://doi.org/10.5194/hess-23-4199-2019, 2019.