the Creative Commons Attribution 4.0 License.
the Creative Commons Attribution 4.0 License.
 | 12 May 2025
CONCN: a high-resolution, integrated surface water–groundwater ParFlow modeling platform of continental China
Chen Yang
Zitong Jia
Wenjie Xu
Zhongwang Wei
Xiaolang Zhang
Jeffrey McDonnell
Laura Condon
Yongjiu Dai
Large-scale hydrologic modeling at the national scale is an increasingly important effort worldwide to tackle ecohydrologic issues induced by global water scarcity. In this study, a surface water–groundwater integrated hydrologic modeling platform was built using ParFlow, covering the entirety of continental China with a resolution of 30 arcsec. This model, CONCN 1.0, offers a full treatment of 3D variably saturated groundwater by solving Richards' equation, along with the shallow-water equation at the ground surface. The performance of CONCN 1.0 was rigorously evaluated using both global data products and observations. RSR values (the ratio of the root mean squared error to the standard deviation of observations) show satisfying performance with regard to streamflow, yet the streamflow is lower in the endorheic, Hai, and Liao rivers due to uncertainties in potential recharge. RSR values also indicate satisfying performance in terms of the water table depth of the CONCN model. This is an intermediate performance compared to two global groundwater models, highlighting the uncertainties that persist in current large-scale groundwater modeling. Our modeling work is also a comprehensive evaluation of the current workflow for continental-scale hydrologic modeling using ParFlow and could be a good starting point for modeling in other regions worldwide, even when using different modeling systems. More specifically, the vast arid and semi-arid regions in China with substantial sinks (i.e., the endpoints of endorheic rivers) and the large uncertainties in potential recharge pose challenges for the numerical solution and model performance, respectively. Incompatibilities between data and the model, such as the mismatch of spatial resolutions between models and products and the shorter, less frequent observation records, necessitate further refinement of the workflow to enable fast modeling. This work not only establishes the first integrated hydrologic modeling platform in China for efficient water resources management but will also benefit the improvement of next-generation models worldwide.
- Article
(13448 KB) - Full-text XML
- BibTeX
- EndNote


China has been facing a persistent water crisis due to rapid socio-economic development and population growth (Jiang, 2009), resulting in the second lowest per inhabitant water supply among all countries worldwide (Pietz, 2017). The increasing water demand in China has been further exacerbated by more frequent hydrologic extremes, such as droughts and floods, driven by climate change and human activities. Water availability in China not only affects the nation's development trajectory but also influences the global food and supply chain (Collins and Reddy, 2022). Therefore, it is pressing to develop a consistent hydrologic modeling platform at the national scale for water resources management, water quality control, and decision-making. Some work has begun in this regard. A national-scale groundwater model with a 10 km resolution based on MODFLOW has been built (Lancia et al., 2022), and nationwide natural streamflow was reconstructed using the variable infiltration capacity (VIC) model with a 0.25° resolution (Miao et al., 2022). Additionally, regional groundwater models or hydrologic models with a groundwater component have been developed for focus areas, such as the North China Plain (Cao et al., 2013; Yang et al., 2020; Yang et al., 2023a), the Heihe River basin (Hu et al., 2016; Tian et al., 2015), the Pearl River basin (Wang et al., 2023; Yu et al., 2022), and the Jianghan Plain in the central Yangtze River (Jiang et al., 2022). These advances in China's modeling community are valuable for quantifying the fluxes, storage, and quality of streamflow and groundwater, thereby supporting the sustainable development of the country.
There is an increasing number of national and global modeling platforms worldwide for surface water, groundwater, or a combination of both. National-scale models include the US NOAA National Water Model (NWM) (Cosgrove et al., 2024); the USGS National Hydrologic Model (NHM) (Regan et al., 2019); the ParFlow (Parallel Flow) CONUS modeling platform (Maxwell et al., 2015; Yang et al., 2023b); the Canada National Water Model (Canada1Water) (Chen et al., 2020); the British Groundwater Model (BGWM) (Bianchi et al., 2024); and the national-scale models from Germany (Belleflamme et al., 2023; Hellwig et al., 2020), France (Vergnes et al., 2023), Denmark (Henriksen et al., 2003), the Netherlands (Delsman et al., 2023), and New Zealand (Westerhoff et al., 2018). Global models include the hydrologic model WaterGap and its groundwater component G3M (Reinecke et al., 2019; Müller Schmied et al., 2021), the hydrologic model PCR-GLOBWB and its associated groundwater models (Sutanudjaja et al., 2018; Verkaik et al., 2024; de Graaf et al., 2015, 2017; Hoch et al., 2023), and Fan's global groundwater model (Fan et al., 2013, 2017).
How to build a large-scale hydrologic model that balances high performance with the trade-off between resolution and computational efficiency is a critical issue in the hydrologic modeling community, especially in groundwater modeling or in modeling with a full treatment of groundwater. However, it remains an open question since the subsurface is largely unseen. Reinecke et al. (2020) compared the performance of several popular global groundwater models in New Zealand, along with the New Zealand national groundwater model (Westerhoff et al., 2018). Reinecke et al. (2020) attributed the departure of simulations from observations to model resolution, but Yang et al. (2023b) suggested that the model's structure and parameters also play a role. Significant progresses have been achieved in community discussions regarding model parameterization, evaluation, calibration, and intercomparison (Gleeson et al., 2021; Condon et al., 2021; O'neill et al., 2021; Tijerina et al., 2021). Yet, building a large-scale, high-resolution hydrologic model with satisfying performance remains a challenging task (Reinecke et al., 2024; Devitt et al., 2021).
The most recent ParFlow CONUS 2.0 (Yang et al., 2023b) surface water–groundwater integrated hydrologic model demonstrates excellent performances in terms of both streamflow and water table depth when compared with substantial observations collected from the US Geological Survey (USGS) and other sources. However, the feasibility of its modeling workflow in other regions in the world has not yet been evaluated. Here, we use the CONUS 2.0 workflow as a starting point to build the modeling platform of continental China (CONCN). China has contrasting climatic conditions, including large arid and semi-arid areas in the northwest, with annual potential evapotranspiration up to ∼ 1400 mm (Li et al., 2014), and extremely wet conditions in the southeast, with annual precipitation exceeding 2000 mm (Han et al., 2023). The landforms are diverse, encompassing snowpacks, wetlands, deserts, and plains. The topographic relief is dramatic, ranging from the world's highest mountain ranges in Tibet to the sea level in coastal plains. All these factors make China a favorable test bed for the CONUS 2.0 workflow, yet they also introduce new challenges into the modeling. Additionally, the US has databases of meteorology, hydrology, topography, soil, and geology, along with relatively mature systems of data management and sharing. In contrast, the existence and accuracy of some necessary data in China remain uncertain. These differences challenge the transferability of the CONUS 2.0 workflow, necessitating modifications during the CONCN modeling process. Hence, building the CONCN model is not only essential for achieving national-scale consistent management of water resources but also important for identifying the strengths and limitations of the workflow. This will help improve the performance of next-generation models at larger or global scales.
In the following sections, we first introduce the structure and parameters of CONCN 1.0, including the construction of hydrologically consistent topography, hydrostratigraphy, and potential recharge, which are the key components of the ParFlow model. We highlight the challenges in building the CONCN 1.0 model and describe the strategies to overcome these obstacles. We then evaluate the performances of the CONCN model in terms of streamflow and water table depth compared to both global data products and observations. The comparisons of CONCN model with other model products are intended not to determine which model is better but rather to identify the common problems faced by the modeling community. At the end of the paper, we also discuss the challenges and opportunities in integrated hydrologic modeling for communities in China.
Note that all performance evaluations in this paper are based on the RSR value, which is the ratio of the root mean squared error to the standard deviation of observations. In this study, we expect a satisfying performance, with an RSR value of less than 1.0, where 0.5 is preferable (O'neill et al., 2021). However, the performances defined here are only for the comparison in this study, indicating the capabilities of the model relative to the benchmark we used (i.e., global products or observations). RSR values for different variables in this study (i.e., drainage area, streamflow, water table depth) are not comparable. RSR values are generally not comparable to those in other case studies using different models. Even for the same models used in this study, different observations and different simulation periods represent different benchmarks and different system dynamics, respectively, so it is hard to say if the same RSR value represents the same performance of a model (Moriasi et al., 2007; Schaefli and Gupta, 2007; Knoben et al., 2019).
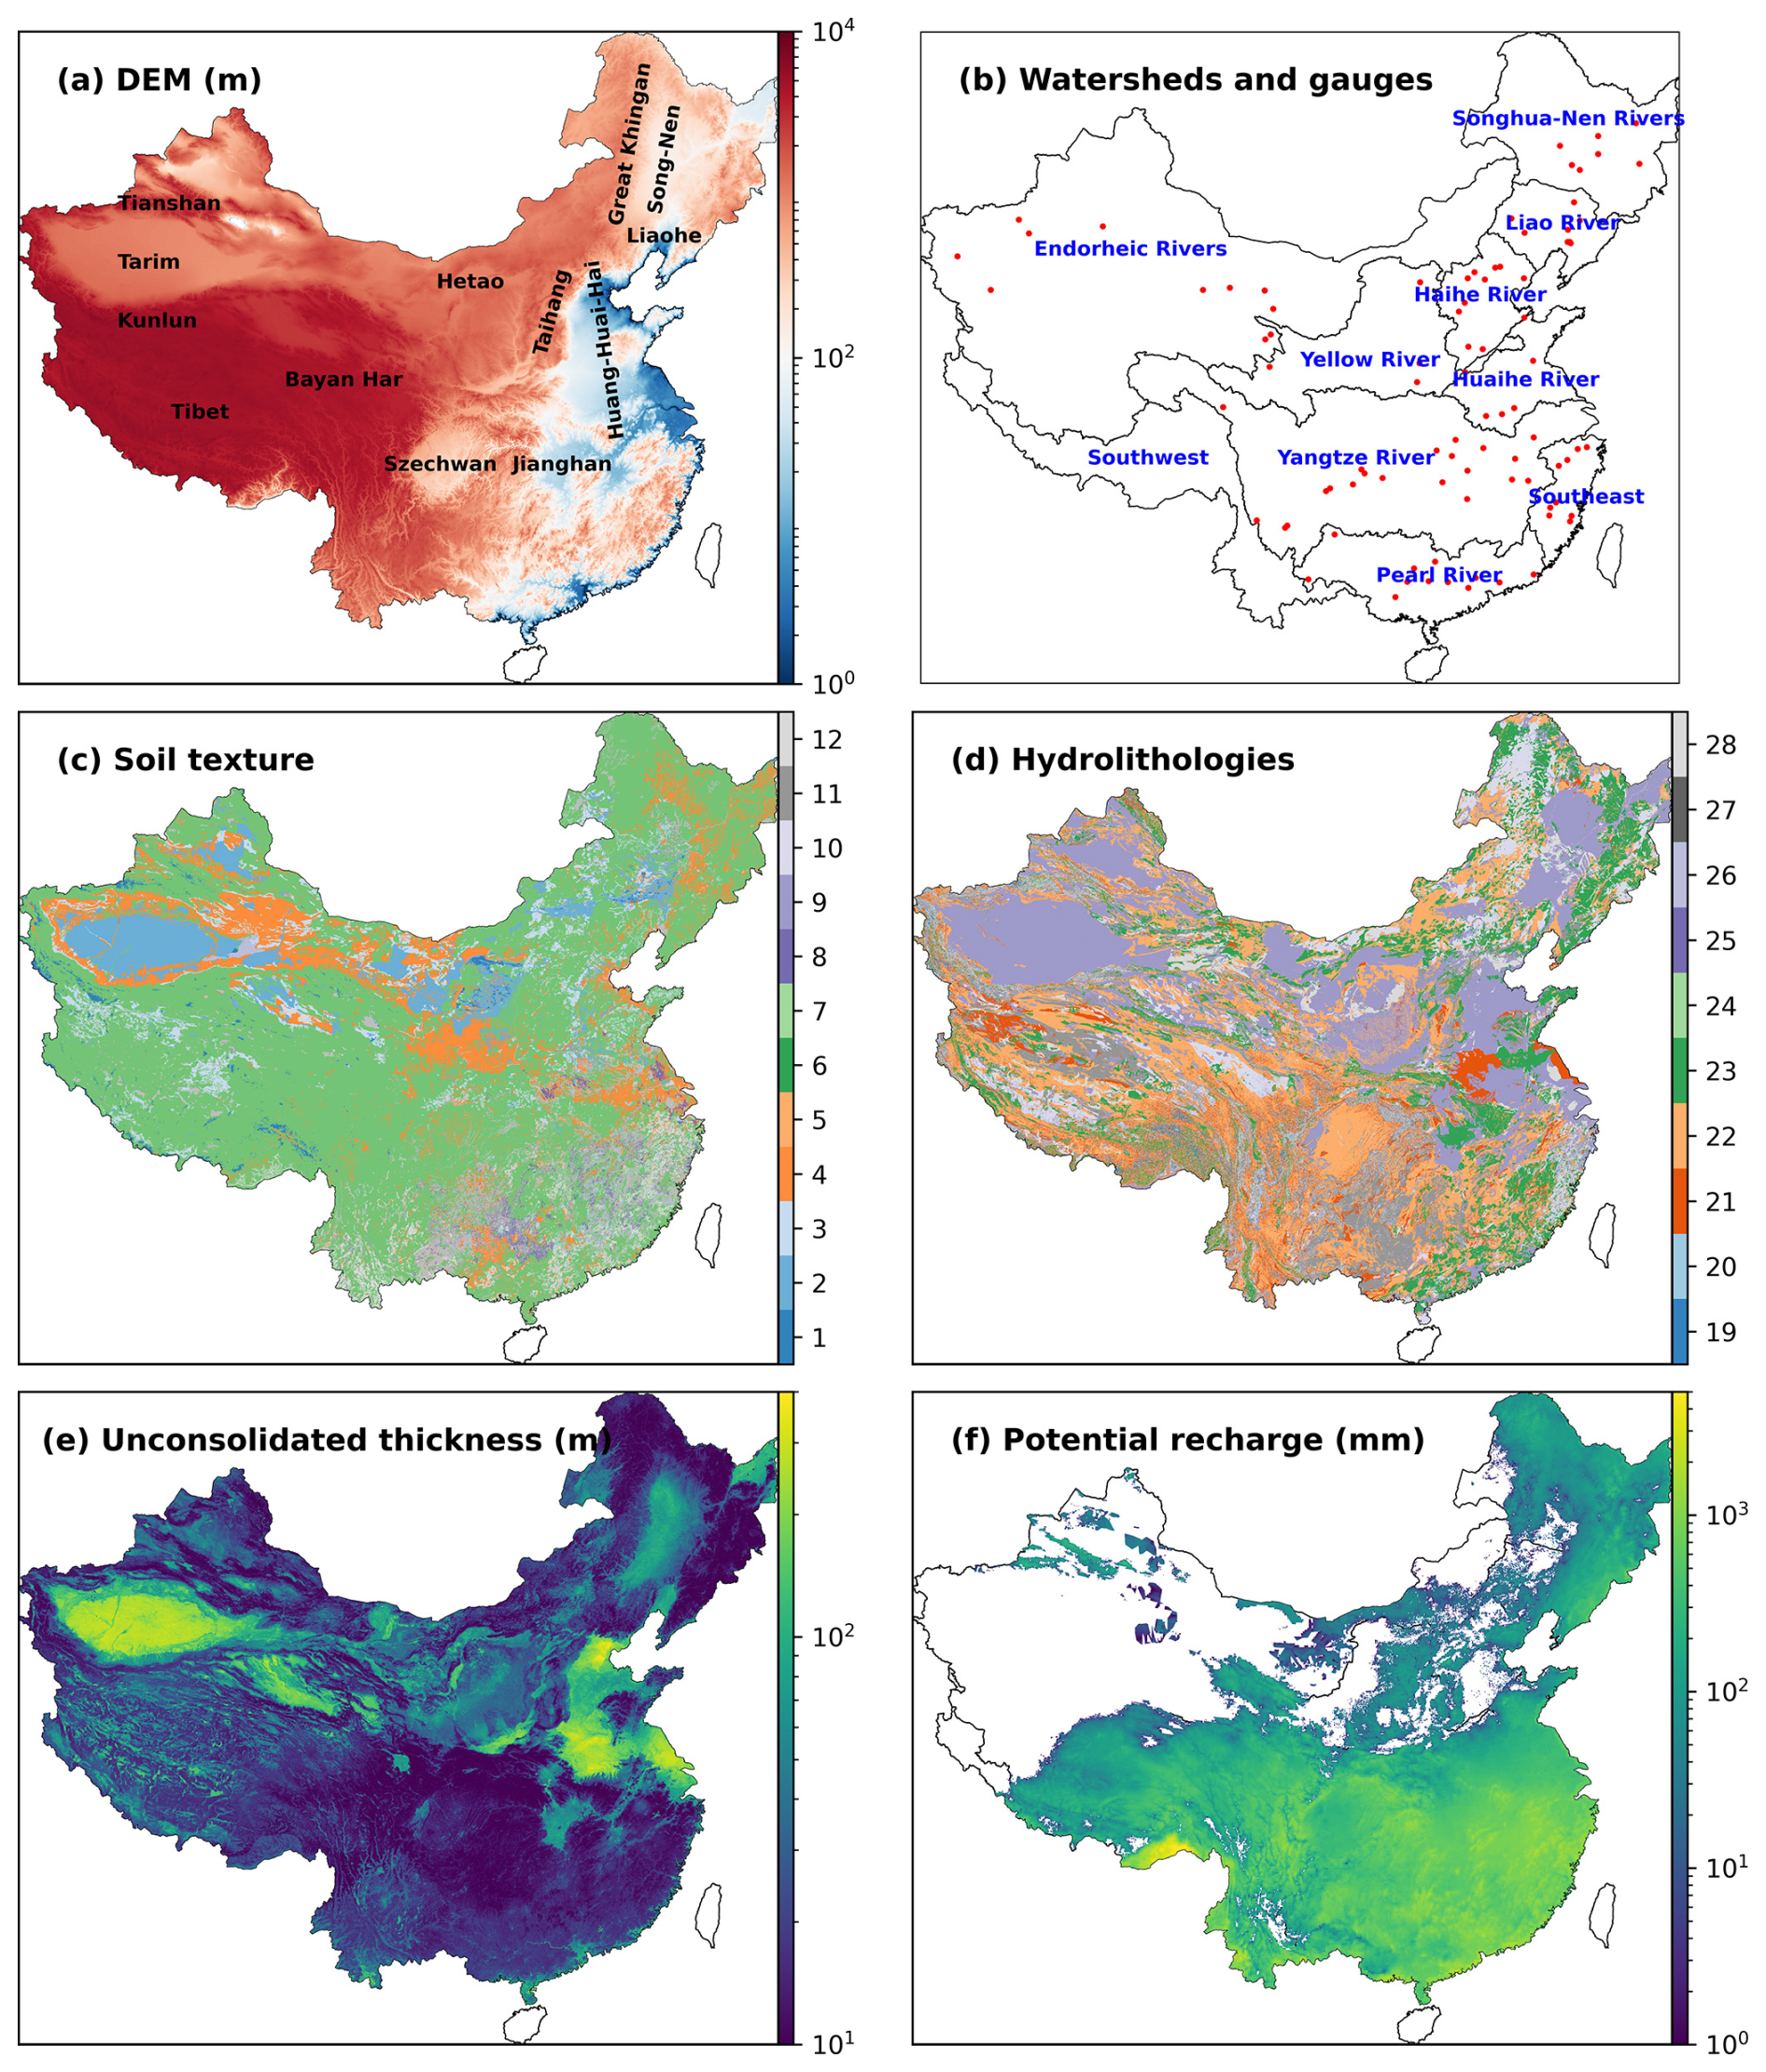
Figure 1DEM processed by PriorityFlow and labeled with major basins, plains, and mountain ranges (a); major watersheds and streamflow gauges (red points) (b); soil texture of the top soil layer (the first layer from top to bottom) (c); hydrolithologies of the top layer (the fifth layer from top to bottom) (d); unconsolidated thickness (e); and annual potential recharge (f). The empty areas in (f) have potential recharge of zero in the model. Indicators of soil texture: (1) sand, (2) loamy sand, (3) sandy loam, (4) silt loam, (5) silt, (6) loam, (7) sandy clay loam, (8) silty clay loam, (9) clay loam, (10) sandy clay, (11) silty clay, (12) clay. Indicators of hydrolithologies: (19) bedrock 1, (20) bedrock 2, (21) f.g. sil. sedimentary, (22) sil. sedimentary, (23) crystalline, (24) f.g. unconsolidated, (25) unconsolidated, (26) c.g. sil sedimentary, (27) carbonate, (28) c.g. unconsolidated. Note that f.g., sil., and c.g. represent fine-grained, siliciclastic sedimentary, and coarse-grained, respectively.
The CONCN 1.0 model covers the entirety of continental China (Fig. 1a) with a horizontal resolution of 30 arcsec (∼ 1 km at the Equator). Vertically, the CONCN model is composed of 10 layers with thicknesses of 300, 100, 50, 25, 10, 5, 1, 0.6, 0.3, and 0.1 m from bottom to top. This structure results in 4865 and 3927 grid cells in x and y directions, respectively, and a total of 98.8 million active grid cells. Although we used the CONUS 2.0 workflow as a starting point for CONCN 1.0, modifications to the workflow are necessary, as mentioned in the Introduction. One reason is primarily due to the data availability in China. This does not mean that the relevant data are completely missing but rather that the data are not readily available for modeling purposes or that the quality of the data is uncertain. Another reason is due to the scientific progress that has occurred since the development of the CONUS 2.0 model. For example, the total model depth of CONCN 1.0 (492 m) is deeper than the depth of CONUS 2.0 (392 m). The increased model depth better closes the terrestrial hydrologic cycle as groundwater contributes to global streamflow to a depth of ∼ 500 m (Ferguson et al., 2023). The details of these modifications are discussed in the following sections.
2.1 Topographic processing
The two most important components of a ParFlow model are the topographic inputs and the hydrostratigraphy, which largely determine the model's performances in terms of streamflow and groundwater, respectively. Since this is a surface water–groundwater integrated hydrologic model, topographic inputs may also influence the potential recharge to groundwater, while hydrostratigraphy is crucial for accurate simulations of baseflow. Topographic inputs refer to slopes in the x and y directions, which are calculated using a digital elevation model (DEM) (Fig. 1a). This DEM has been processed to ensure the D4 connectivity of the drainage network; D4 connectivity means that, within each grid cell, streamflow is only allowed in east–west and north–south directions and is not allowed in diagonal directions. The original DEM used in this study is a data product with a resolution of 30 arcsec (Eilander et al., 2021), which was upscaled from the MERIT Hydro DEM with a resolution of 3 arcsec (∼ 90 m at the Equator) (Yamazaki et al., 2019) using an iterative hydrographic upscaling approach (hereafter abbreviated as IHU DEM). The IHU DEM was processed using PriorityFlow, which was developed during the CONUS 2.0 modeling (Condon and Maxwell, 2019). Note that the horizontal resolution of the CONCN 1.0 model (i.e., 30 arcsec) is set to be consistent with the resolution of this IHU DEM.
Reference stream networks are preferred as inputs in PriorityFlow to improve the drainage performance. The challenge is that we do not have a consistent gridded stream network at the national scale with a resolution close to that of CONCN 1.0, whereas a network with 250 m resolution from the National Water Model (NWM) is available for CONUS 2.0 (Zhang et al., 2021). As a replacement, we generated stream networks from the IHU flow direction of D8 connectivity. Then we checked the generated networks with the vector networks generated from the 3 arcsec MERIT Hydro flow direction (Lin et al., 2019). The initial threshold of the drainage area used to generate the input networks from the IHU flow direction was set to 300 km2. During the processing using PriorityFlow, we refined some input networks locally by gradually decreasing the threshold. Such refinements are necessary in areas with flat topographies (e.g., the Huang–Huai–Hai plains and coastal plains in Fig. 1a), where flow directions are difficult to identify without additional reference networks. Endorheic rivers are common in northern and northwestern China. Sinks, the endpoints of these endorheic rivers, are also important to constrain flow directions and thus to generate accurate D4 stream networks. Manual refinements of input networks, including the sinks, were iterative processes until the networks generated by PriorityFlow appeared to be consistent with the vector networks and there were no obvious ponding cells in runoff simulations. A total of 924 sinks were identified in CONCN 1.0 compared to only 131 sinks in CONUS 2.0, which increases the difficulty of the numerical solution as ParFlow currently does not handle such waterbodies.
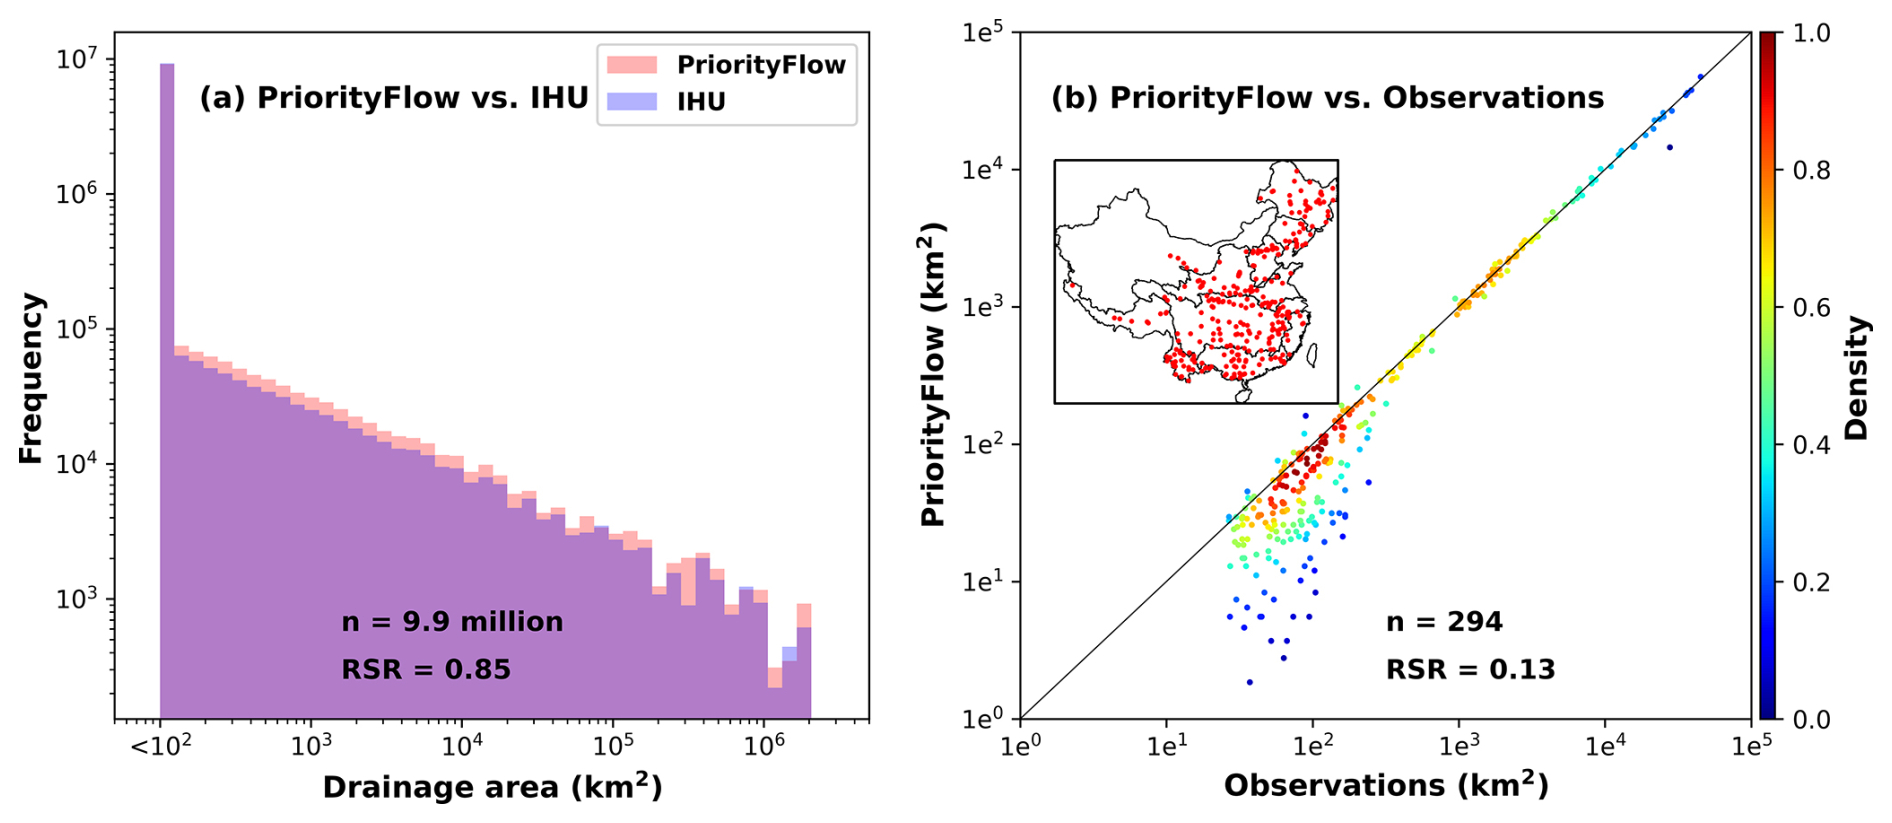
Figure 2Evaluating the drainage performance of the topography processed by PriorityFlow using (a) IHU drainage areas and (b) observations collected from the literature.
In addition to the qualitative evaluation described above, we also compared the drainage areas generated by PriorityFlow with those in IHU and with 294 observations collected from the literature (Yin et al., 2024). Increasing performance was observed during the iterative processing, and the final performances are shown in Fig. 2. The PriorityFlow and IHU drainage areas match well, with an RSR value of less than 1, indicating a satisfying performance (Fig. 2a). An additional interesting finding is the scaling relationship between drainage areas and frequencies. The comparison with observations shows a much better performance as the RSR value is less than 0.5 (Fig. 2b). Deviations from the 1:1 line were observed for drainage areas smaller than 100 km2 as we focused more on drainage areas larger than 100 km2 during the processing.
2.2 Hydrostratigraphy
The general structure of the hydrostratigraphy is composed of shallow soils and deeper hydrolithologies. The latter include both unconsolidated and consolidated sediments (Fan et al., 2007; Huscroft et al., 2018). The details of the implementation are as follows: the top 2 m consists of four soil layers (0.1, 0.3, 0.6, and 1.0 m from top to bottom). The relative percentages of sand, clay, and silt in each layer were derived from a global dataset of soil hydraulic properties (Dai et al., 2019) with a 30 arcsec resolution. A total of 12 soil textures (Fig. 1c) were then built from these percentages based on the soil classification defined by the US Department of Agriculture. Hydrolithologic categories (Fig. 1d) were reclassified from the permeabilities of GLHYMPS 1.0 (Gleeson et al., 2014), which was built by categorizing lithologies in the global lithology map, GLiM. GLiM was compiled by using the geologic map of China with a scale of 1:2.5 million by the China Geological Survey in 2001 (Hartmann and Moosdorf, 2012). Then e folding, representing variations in hydraulic conductivity with depth and terrain slope, was applied to each of the six deep layers (Fan et al., 2007; Tijerina-Kreuzer et al., 2023). Flow barriers (Fig. 1e) were implemented at the interfaces between unconsolidated and consolidated sediments via multiplying the hydraulic conductivities by 0.001 to represent a potential confining layer (de Graaf et al., 2020; Huscroft et al., 2018). This concept represents the lumped effects of low-permeability sedimentary materials in the unconsolidated layer. The dataset we used to represent the interface depths was specifically developed for China (Yan et al., 2020) and is more accurate than the global version used in CONUS 2.0 (Shangguan et al., 2017).
We adopted this hydrostratigraphy as it is the most convincing scheme from CONUS 2.0, selected through rigorous hydrologic modeling tests from hundreds of combinations of different components, such as the distribution of hydrolithologic categories, anisotropy of some categories, implementation of confining layers, e folding of the hydraulic conductivities, total model depth, and constant or variable depths of confining layers (i.e., flow barriers) (Swilley et al., 2023; Tijerina-Kreuzer et al., 2023). The hydraulic parameters for each soil texture and hydrolithologic category (e.g., hydraulic conductivity, porosity, specific yield, and parameters of the van Genuchten model) were adopted from Schaap and Leij (1998) and Gleeson et al. (2014), with slight calibrations in the CONUS models (Maxwell et al., 2015; Yang et al., 2023b). The parameter configuration assumes that each soil texture or hydrolithologic category has a set of representative, scale-independent hydraulic parameters.
2.3 Potential recharge
The construction of potential recharge used to drive the model is the most challenging part in this modeling work. Here, potential recharge refers to the multi-year averaged precipitation (P) minus evapotranspiration (ET), i.e., P − ET. The uncertainties of such hydrometeorological variables are always high. For example, the relative standard deviation (standard deviation relative to the mean) of the annual mean ET from 12 global products using different approaches reaches 50 % (Jiménez et al., 2011). Given this issue, the P and ET datasets selected for CONUS 2.0 were generated from a VIC modeling framework (Livneh et al., 2015), which adjusts P for orographic effects and ensures closure of the land surface water budget. Therefore, the uncertainties of all the hydrologic variables were constrained within a consistent modeling system. However, datasets of P and ET in China generated by various approaches have inconsistent uncertainties, and a closed water balance for all hydrologic components is absent. Uncertainties in P − ET may further accumulate during data processing (e.g., resampling, interpolations, and transforms) due to differences in the spatiotemporal resolutions of the P and ET products and the CONCN model. Additionally, the record lengths and data quality of some datasets are hard to balance, also challenging the accurate representation of a long-term average state of the pre-development condition. We collected four precipitation products and five ET products generated based on (1) interpolation of the measurements (Han et al., 2023); (2) models including the Penman–Monteith equation (Running et al., 2021), the complementary relationship model (Ma et al., 2019), and the land surface model (Muñoz-Sabater et al., 2021); and (3) model–data fusion (Huang et al., 2014; Peng, 2020; Niu et al., 2020; Zhang et al., 2019).
An accurate evaluation of different products was not conducted as it is beyond the scope of this study. More importantly, it will take time for the community to gradually improve the quality of these datasets. We roughly evaluated the products using prior knowledge of some focus areas. For example, we randomly selected several locations and compared the multi-year average levels of P or ET with the commonly known levels. We used the same approach to evaluate the P − ET generated by combining different P and ET datasets. For example, P − ET showed negative values in some arid and semi-arid regions in northwestern China where P − ET should be a dominant source for known rivers. Although ERA5-Land products also provide P and ET datasets under a consistent modeling framework with a high enough resolution (∼ 9 km at the Equator), the precipitation dataset is obviously lower than that constructed using interpolation of substantial measurements in Han et al. (2023). The best combination of P (Han et al., 2023) and ET (Niu et al., 2020) in the evaluations was selected to create the average state of potential recharge from 1981 to 2010 (Fig. 1f). However, errors induced by uncertainties from P and ET – especially from ET – are still evident in some regions, such as the Tarim River basin, the Heihe River basin, and the Haihe River basin (i.e., the North China Plain). The inaccuracy estimation of potential recharge would affect the simulated groundwater and streamflow as discussed in the following sections.
2.4 Manning's roughness coefficients
The Moderate Resolution Imaging Spectroradiometer (MODIS) Land Cover Type (MCD12Q1) version 6.1 data product with a 500 m resolution (Friedl and Sulla-Menashe, 2022) was used to build the distribution of Manning's roughness coefficients, which are necessary for calculating streamflow and will also be required by the Common Land Model (CLM) (Dai et al., 2003) in the future transient ParFlow-CLM model (Kollet and Maxwell, 2008). The land cover types in this product follow the International Geosphere-Biosphere Programme (IGBP) classification, which is consistent with the classification required by ParFlow-CLM. In the modeling of CONUS 2.0, a land cover map with a higher resolution of 30 m was reclassified according to the IGBP classification. Some products with resolutions higher than 500 m are also available in China (Yang and Huang, 2021), but their coarse classifications prevented us from reclassifying the types to subtypes. Stream networks were generated using PriorityFlow with a threshold drainage area of 50 km2, and stream orders were calculated based on the Strahler stream order (Strahler, 1957). Manning's roughness coefficients were set to vary by land cover type and were further adjusted in stream channels, decreasing in value with increasing stream order. The values of Manning's roughness coefficient for each land cover type and each stream order were adapted from the National Water Model (Gochis et al., 2015) and a previous study (Foster et al., 2020).
ParFlow simulates the movement of 3D variably saturated groundwater and 2D surface water simultaneously by solving Richards' equation with the shallow-water equation as the top boundary (Kollet and Maxwell, 2006). CONCN 1.0 uses a terrain-following grid, which significantly reduces the computational load compared to an orthogonal grid (Maxwell, 2013). The model was initialized with a uniform water table depth (WTD) of 2 m and was driven by the average potential recharge of 1981–2010 to achieve a quasi-steady state for evaluations in following sections. All faces of the model, except the top boundary, are no-flow boundaries. We ran the model using the seepage face boundary condition on top of the model until the total storage change was less than 1 % of the potential recharge. This is to form the topography-driven patterns of the water table. Afterward, the overland kinematic boundary condition was enabled to generate river systems. The spinup continued until the total storage change was less than 3 % of the potential recharge. River systems quickly reached a quasi-steady state in groundwater convergence areas, which had already been identified in the first stage. This two-phase spinup process omitted unnecessary surface water–groundwater interactions during the early stage to improve computational efficiency. Although the dimension of CONCN 1.0 is comparable to CONUS 2.0, CONCN 1.0 required more time for spinup because rivers in arid and semi-arid regions take longer to reach a quasi-steady state as the river water is limitedly recharged by local precipitation but is sourced from the faraway upstream of the river.
The Newton–Krylov approach is employed to solve this large nonlinear system, which is discretized on a finite-difference grid in an implicit manner. Parallel scalability of the model is ensured by using a multi-grid preconditioner. Thresholds of nonlinear and linear iterations are 1e−5 and 1e−10, respectively, to ensure proper convergence. The model was run on Princeton Della GPU cluster using four 80 GB NVIDIA A100 GPU cards or on the NCAR Derecho supercomputer using 4096 processor cores across 32 nodes. Each node on Derecho is equipped with 3rd Gen AMD EPYC™ 7763 Milan CPUs.
The simulated streamflow and WTD are shown in Fig. 3. Patterns of streamflow (Fig. 3a) reveal a contrast between wet and dry regions, generally consistent with the monsoon and non-monsoon regions. Large river systems in the monsoon region are well represented, such as the Yellow River in northern China; the Yangtze River and the Pearl River in southern China; and the Songhua, Nen, and Liao Rivers in northeastern China. During the spinup, we observed that the Yellow River is primarily recharged by water sourced from the Bayan Har Mountain ranges and by a small amount of local groundwater. The number of river segments recharged by precipitation increases downstream of the Hetao Plain. River systems in northwestern China are also visible, though future work is needed to improve the accuracy by reducing uncertainties in potential recharge. The WTD (Fig. 3b) presents topography-driven patterns, showing shallow water tables in the Huang–Huai–Hai Plain, the Jianghan Plain, the Liaohe basin, and the Songnen Plain. The water table is also shallow inside the Tarim basin, where the terrain is flat, even though annual precipitation there is lower than 50 mm. Deep water tables are distributed along the Tianshan and Kunlun mountain ranges and the Taihang–Greater Khingan mountain ranges and along the transition area from the Tibet Plateau to the Szechwan basin.
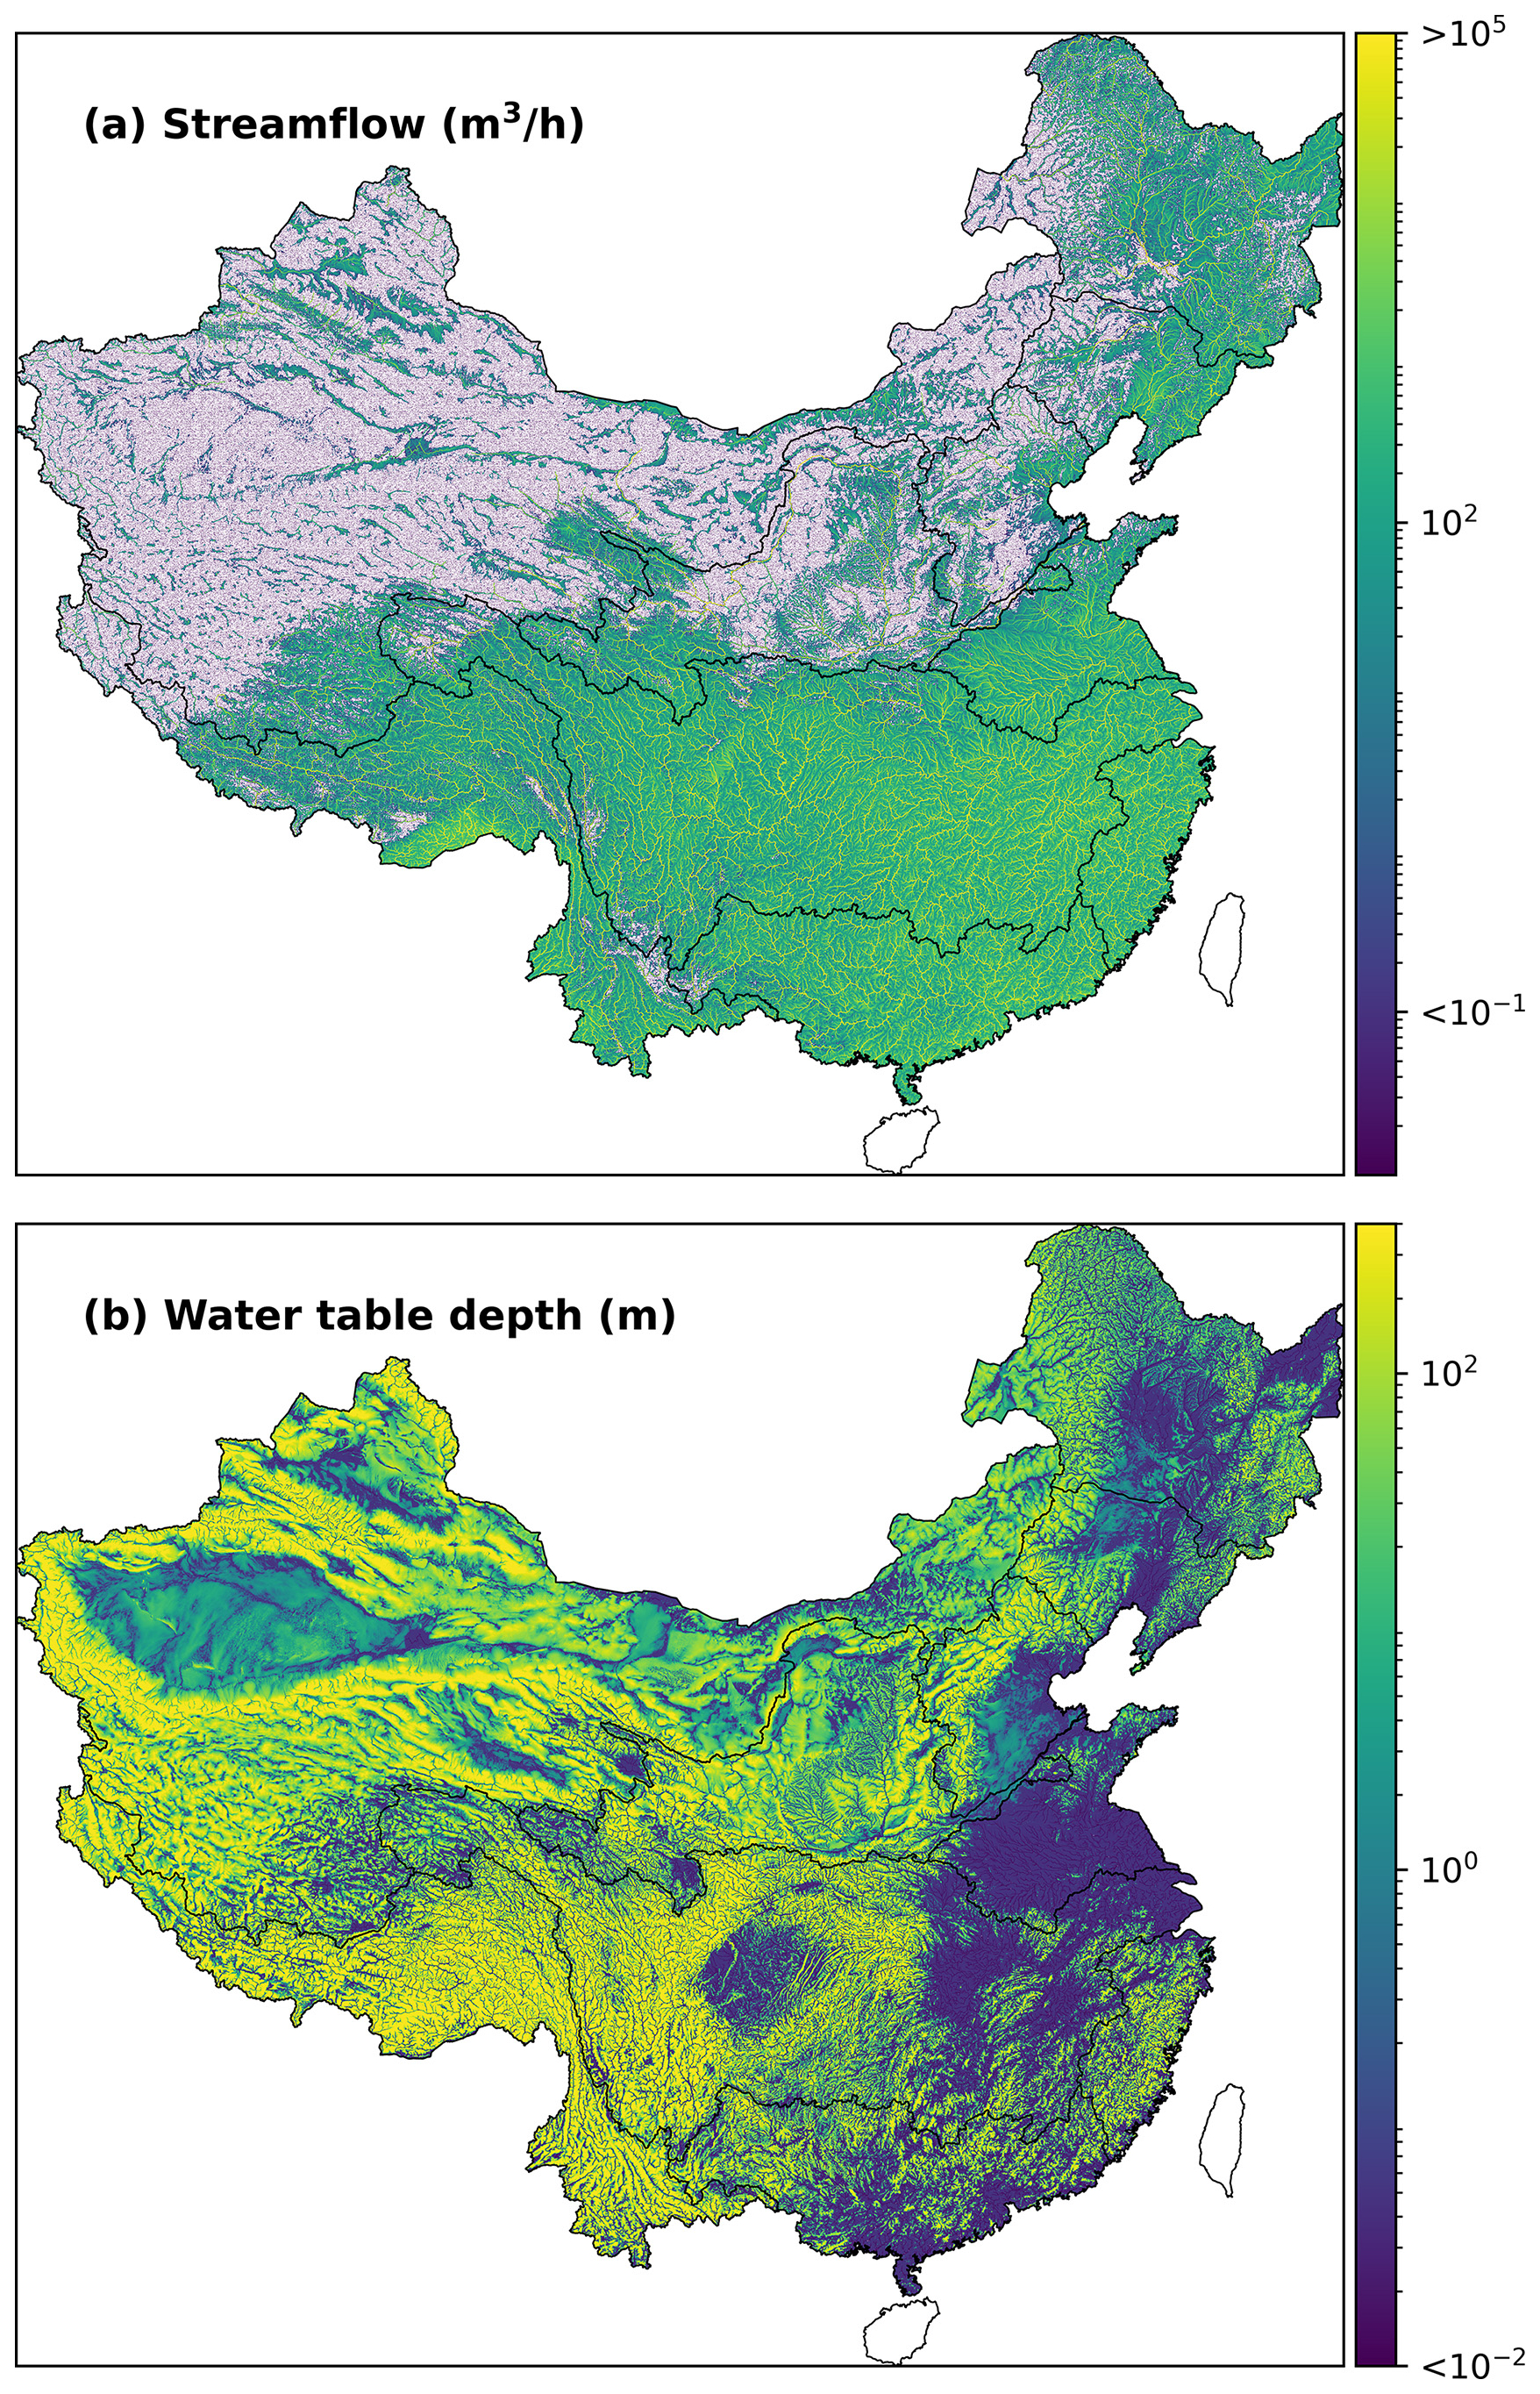
Figure 3Simulated streamflow and water table depth by CONCN 1.0, representing the average state from 1981 to 2010.
The performance of CONCN 1.0 was comprehensively evaluated by both data products and observations. In the evaluation using measured observations, it is difficult to ensure that the duration of the records is consistent with that of the potential recharge (1981–2010) as streamflow or groundwater observations earlier than 2000 are hard to collect. This mismatch between the simulation and observation periods may cause discrepancies between simulated and observed values due to the different drivers resulting from interannual variations in P and ET. This highlights a new challenge relative to the CONUS 2.0 modeling as publicly accessible observations in the US date back to 1900 or even earlier.
4.1 Evaluation of streamflow
We compared the simulations of CONCN 1.0 with a global streamflow dataset, GRADES-hydroDL (Yang et al., 2023c). The daily streamflow from 1980 to present is estimated for 2.94 million river reaches by applying a long short-term memory (LSTM) model on a 0.25° grid, developed following Feng et al. (2020), and then coupling the LSTM model with a river routing model (RAPID) (David et al., 2011). River reaches with drainage areas larger than 1000 km2 were selected, and those with drainage areas larger than 120 % or smaller than 80 % of the PriorityFlow drainage areas were further filtered out. For each of the selected 23 609 reaches, streamflow during the potential recharge period (1981 to 2010) was averaged and compared with the simulation of CONCN 1.0. Locations of the selected reaches and a scatterplot of simulations vs. GRADES-hydroDL are shown in Fig. 4. Overall, we see comparable performances of CONCN 1.0 and GRADES-hydroDL, with an RSR value close to 1. Smaller streamflow values are more scattered in the plot due to the uncertainties associated with smaller drainage areas.
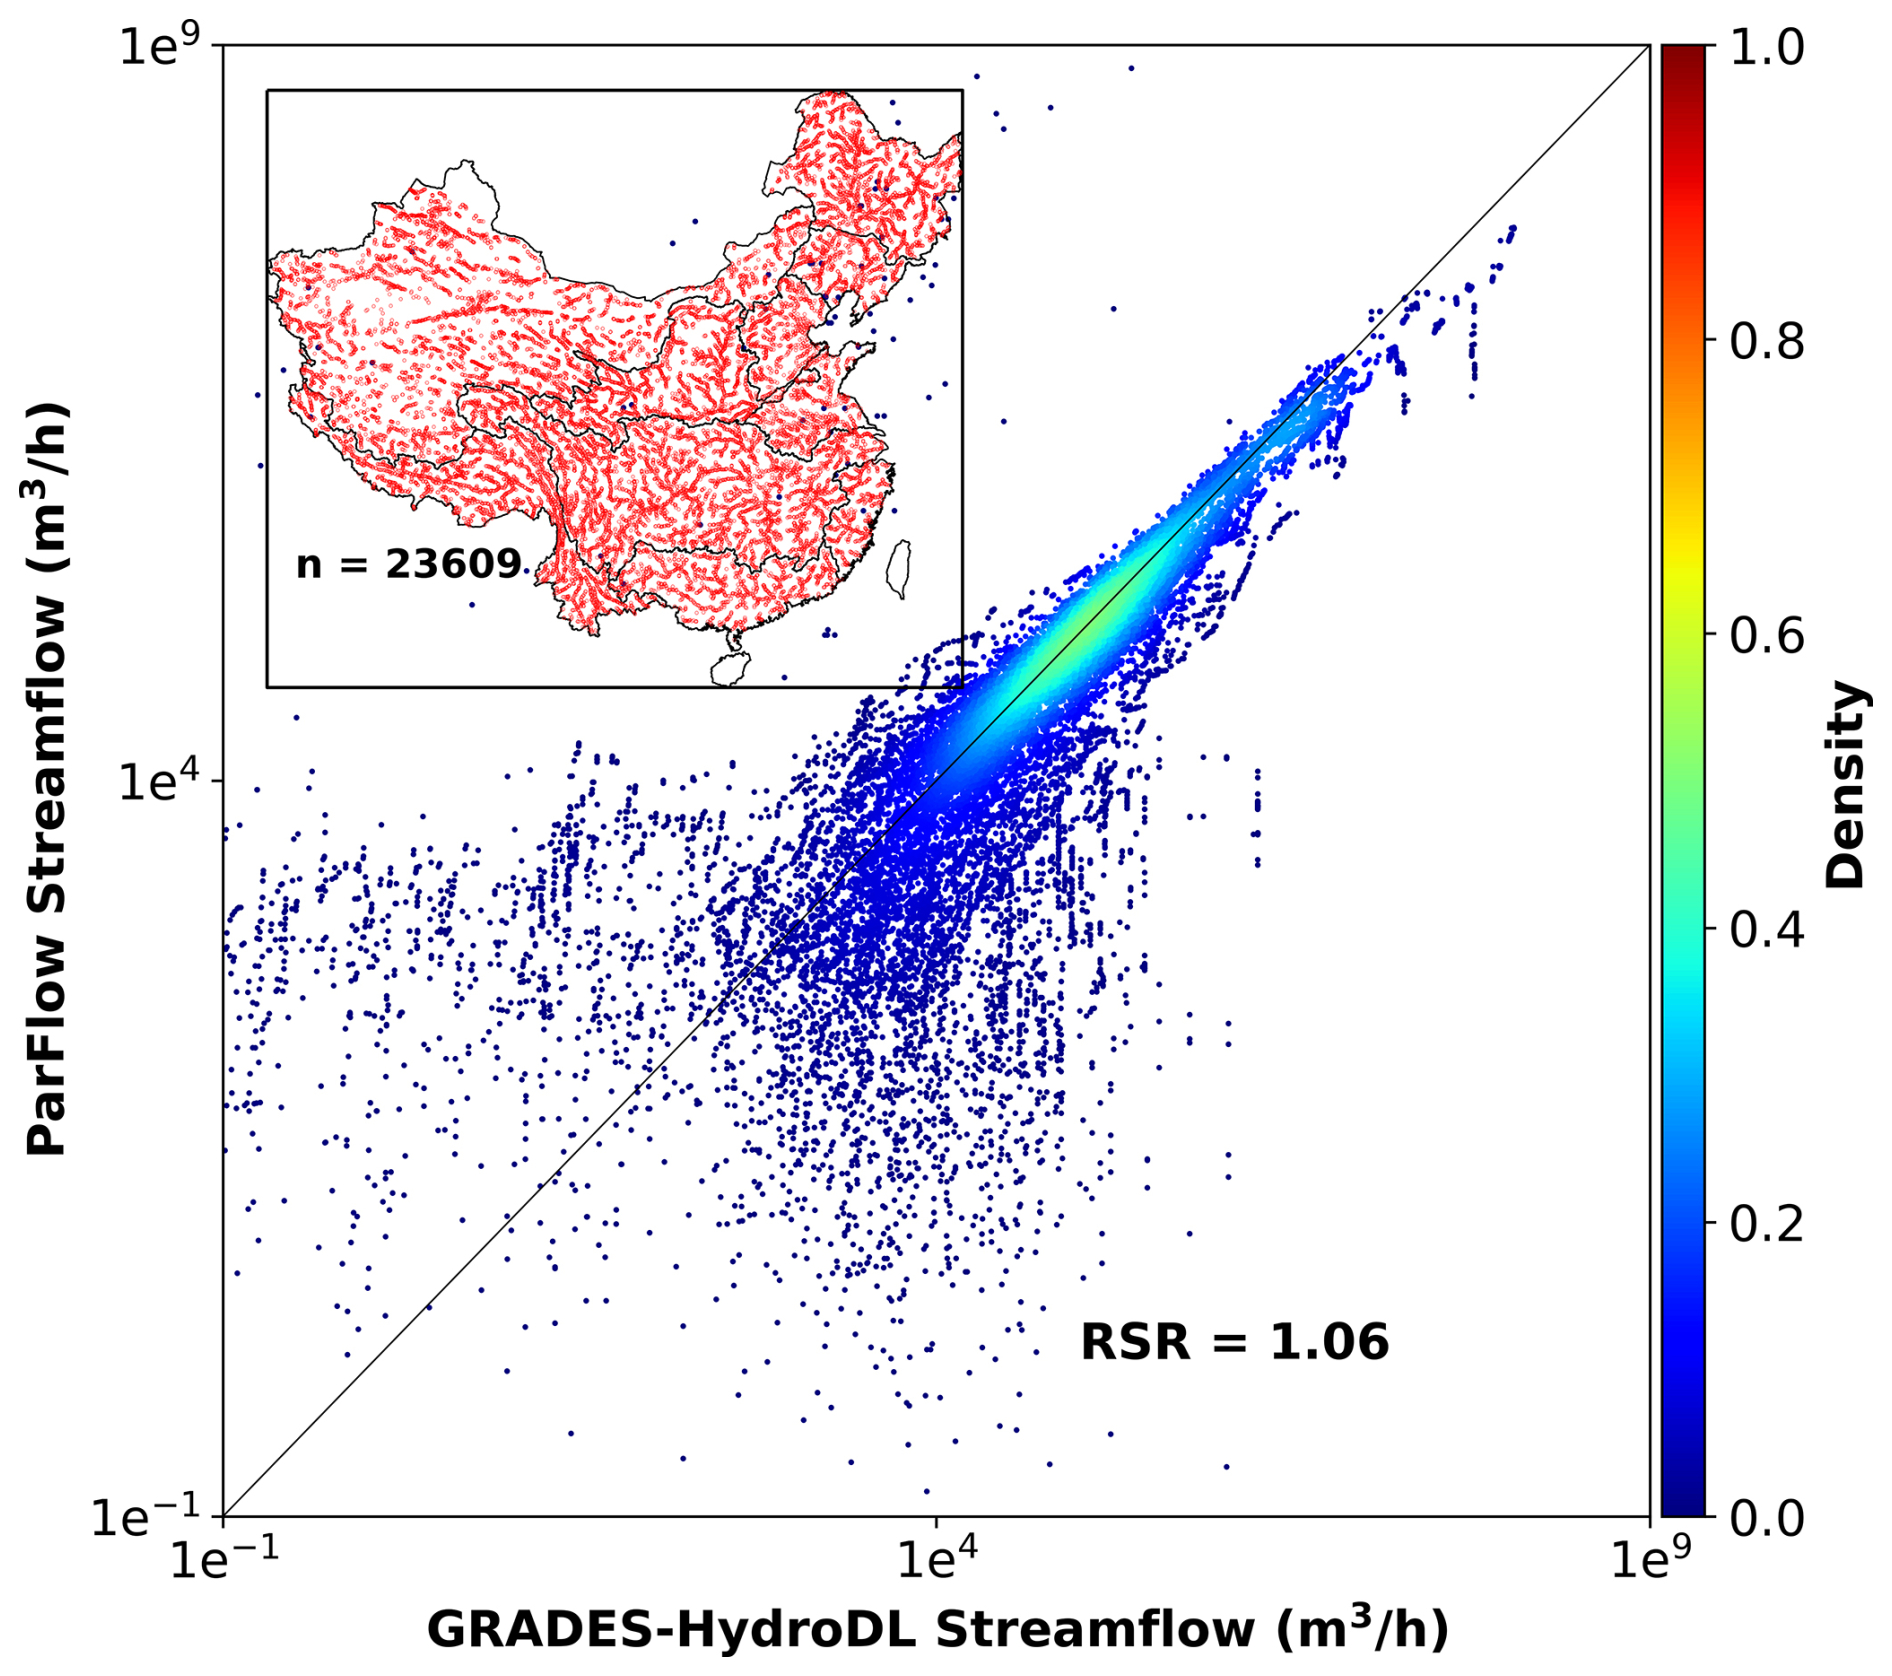
Figure 4Scatterplot of simulated streamflow vs. GRADES-hydroDL. Locations of the selected reaches for comparison are shown in the upper-left corner.
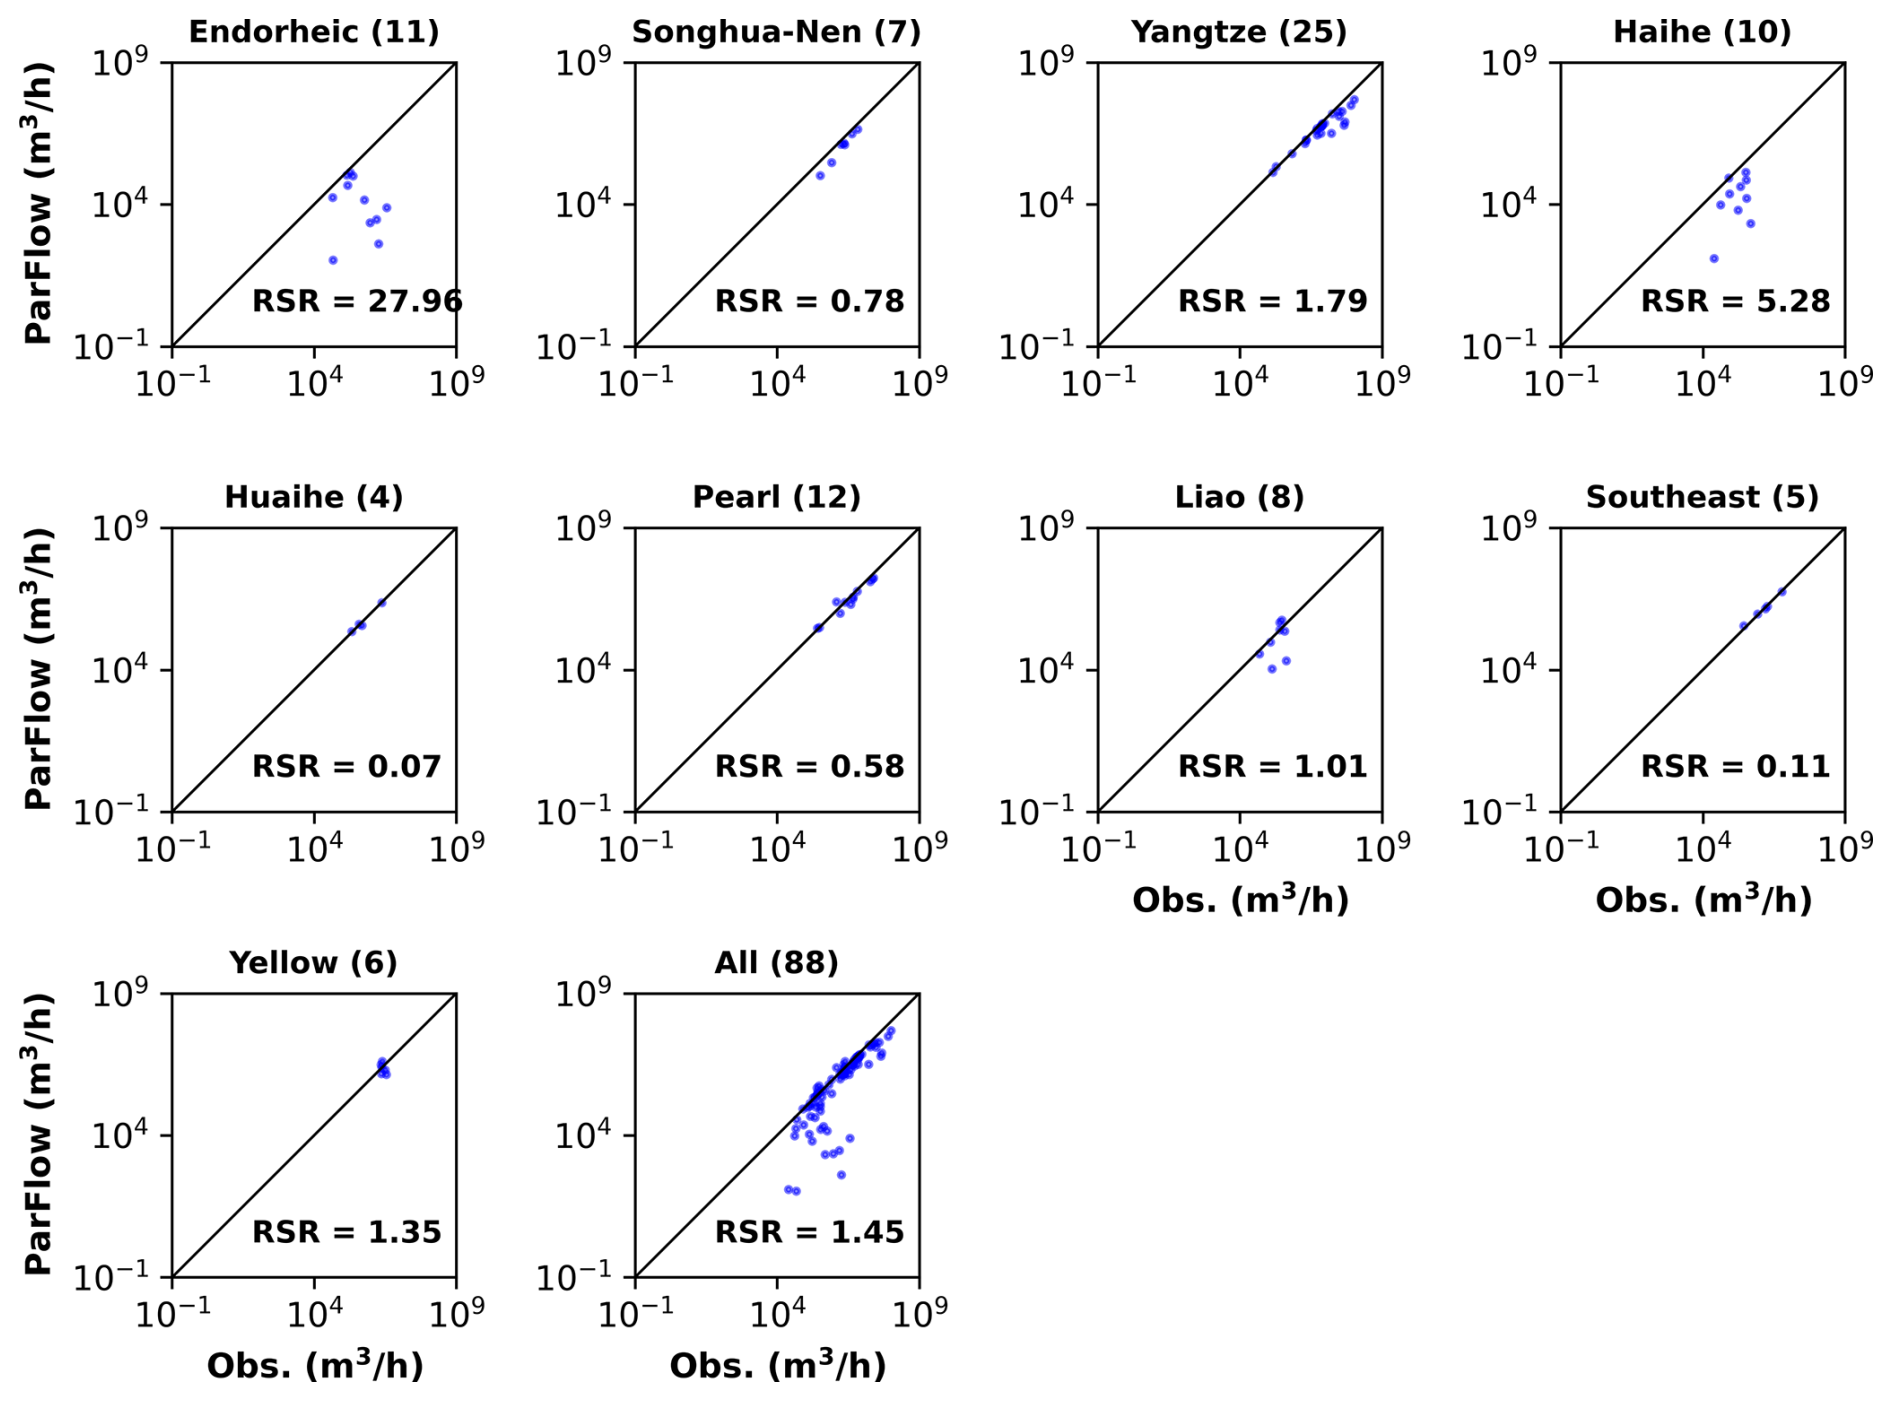
Figure 5Scatterplots of simulated vs. observed streamflow for basins in Fig. 1b and the entire CONCN 1.0 domain.
We collected streamflow observations at 95 gauges from the annual River Sediment Bulletin of China, with 88 gauges available for evaluation. Five gauges were removed because we could not find their locations (i.e., latitude and longitude) in the lookup table of national gauges, one of two very close gauges was also removed, and one gauge in Hainan Province was excluded as it is outside of the modeling domain. The locations of the 88 gauges are shown in Fig. 1b, covering most of the modeling domain to ensure an impartial evaluation. However, the number of gauges is obviously limited, and augmenting the database for this modeling platform will take time. The observations include monthly records spanning from 2002 to 2021. Although most gauges do not have a complete 20-year record, each gauge has at least a 2-year record. Scatterplots of simulations vs. observations are shown in Fig. 5. Most basins show satisfying performances, with RSR values close to 1.0 or smaller than 0.5. Simulated streamflow of the endorheic and Haihe rivers and part of the Liao River is much lower than observed. This is likely due to uncertainties in potential recharge, as discussed in Sect. 2.3, and the fact that simulations at these gauges are mainly baseflow sourced from groundwater. Slight deviations are also seen along the main stream of the Yangtze and Yellow rivers, likely caused by hydraulic engineering, such as dam operations.
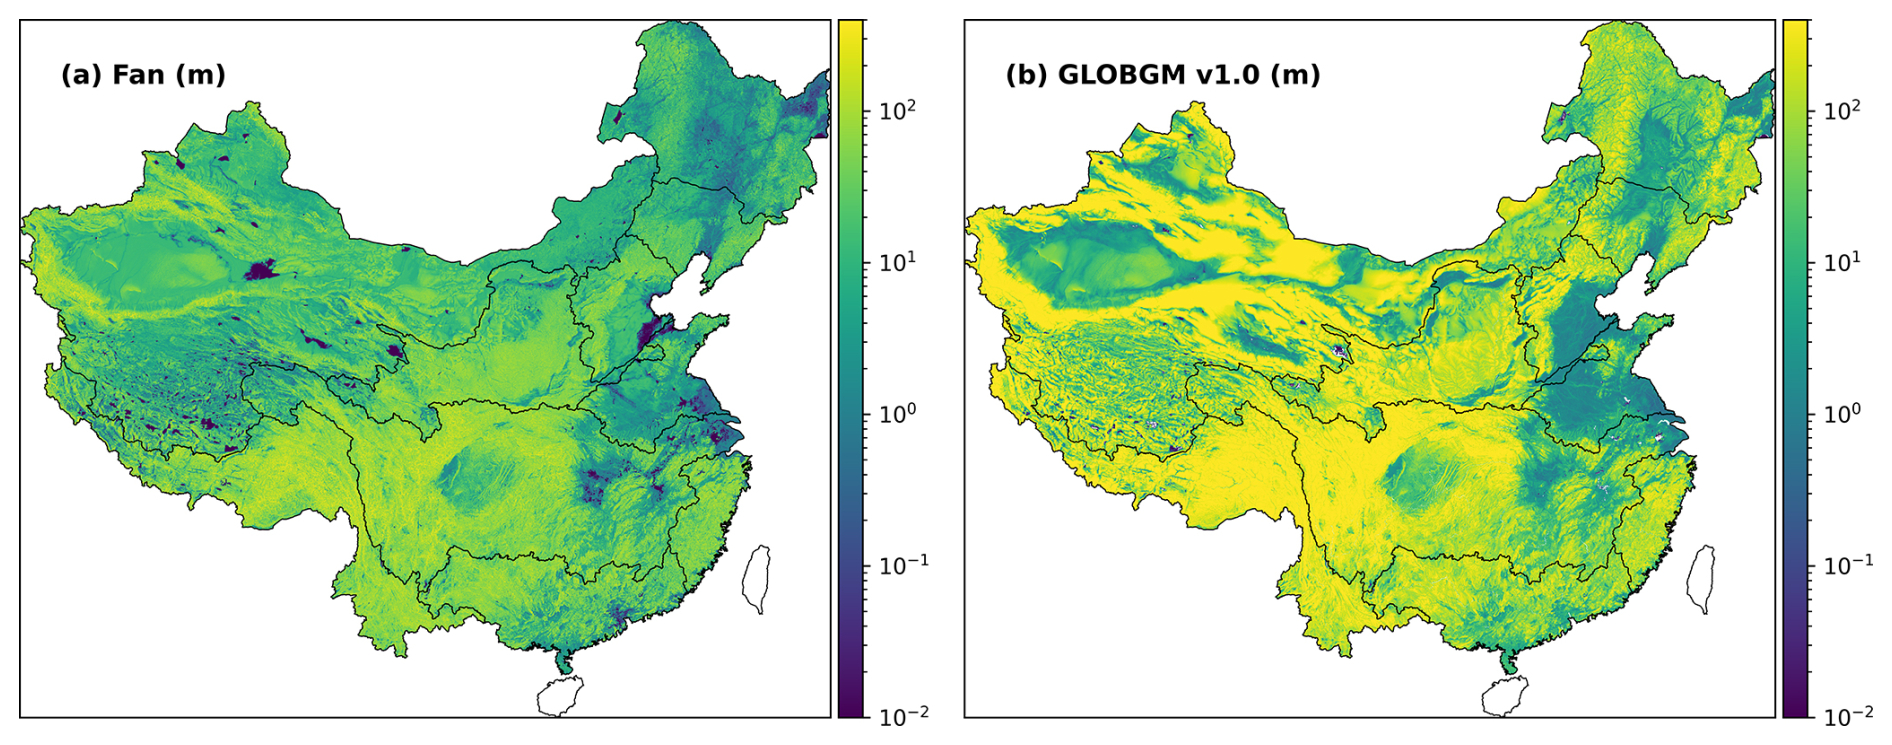
Figure 6Water table depths from two global models in CONCN 1.0 domain: (a) Fan's model and (b) GLOBGM v1.0.
4.2 Evaluation of water table depth
WTDs generated by two global groundwater models were collected (Fig. 6a and b). Both models have a horizontal resolution of 30 arcsec, but their formulations and vertical structures differ significantly from CONCN 1.0. The first model is a horizontal, two-dimensional groundwater model of 40 layers. It describes 1D soil water movement within each column using Richards' equation and 2D lateral flow among columns using Darcy's law under the Dupuit–Forchheimer assumption. It is an inverse modeling approach originally developed by Fan et al. (2017) and later updated in 2020 (as with eLetters in Fan et al., 2013). The water table in Fig. 6a is the average of hourly dynamics from 2004 to 2014. The second model, GLOBGM v1.0, is a three-dimensional groundwater model with two layers, driven by outputs from PCR-GLOBWB (Verkaik et al., 2024). GLOBGM v1.0 here is a steady-state model representing the average state for the period 1958–2015. It is a refined version of the 5 arcmin PCR-GLOBWB-MODFLOW model (de Graaf et al., 2015, 2017). Though GLOBGM v1.0 is not calibrated, its predecessor (de Graaf et al., 2017) was calibrated.
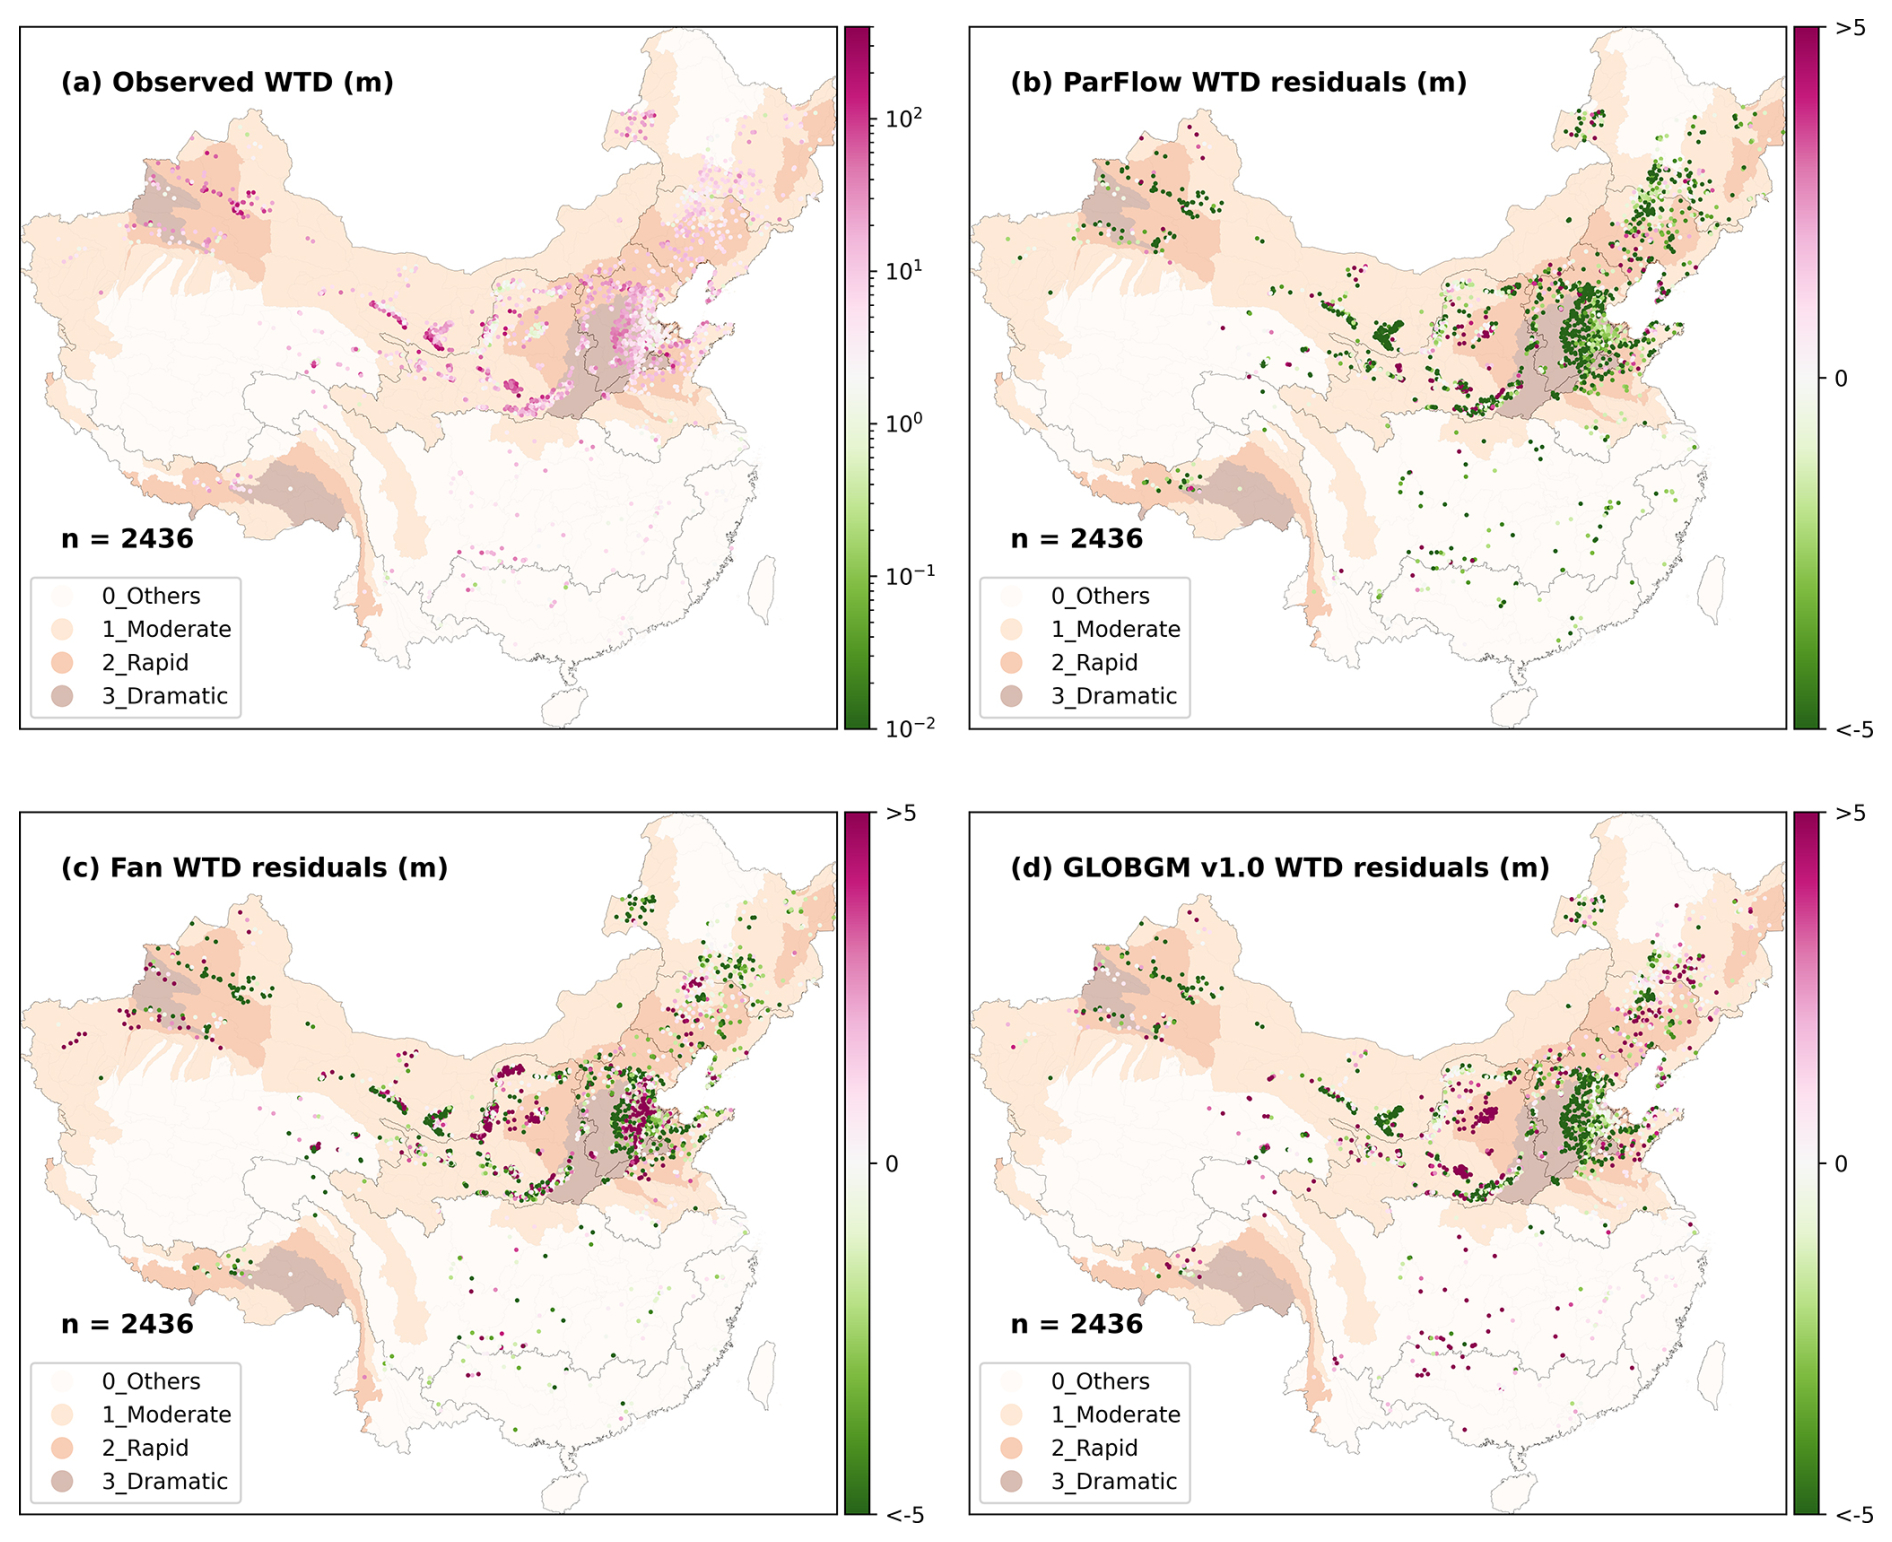
Figure 7Well locations (a) and residuals of water table depth for each model (b–d). Here, residuals refer to the differences between simulations and observations. The background shows the average decrease in groundwater storage from 2003 to 2020 based on GRACE data (Zhao et al., 2023). The decrease is classified into three levels: moderate, rapid, and dramatic.
We collected monthly observations of the hydraulic heads in 8563 wells in 2018. After removing wells located outside of the model domain, in confined aquifers, and on ParFlow river channels, 2436 wells remained for evaluation (Fig. 7a). The annual means of WTD were calculated by subtracting hydraulic heads from well elevations measured at the land surface. These wells are part of the national groundwater monitoring network maintained by the Ministry of Land and Resources. We collected the data by digitizing the China Geological Environmental Monitoring Groundwater Level Yearbook of 2018 and then double-checked the data to avoid errors. The yearbook, which started from 2005, has currently been updated to 2021. We fully understand that 1-year monthly observations cannot represent the long-term average state of the water table. An ongoing effort is being made to digitize all data in the yearbook and to apply QA/QC (quality assurance and quality control) to the digitized data, although this will take a few years to finish.

Figure 8Scatterplots of simulations vs. observations of water table depth. The simulations are long-term average water table depths of 1981–2010 in the current work, of 2004–2014 in Fan's model, and of 1958–2015 in GLOBGM v1.0. The observations are the averages of 2018.
We compared WTDs simulated by the three models with observations (Fig. 8). RSR values show generally satisfying performances for all three models. CONCN 1.0 has RSR values that fall between the two global models (0.88 compared to 0.80 and 1.41), with a bias towards shallow water tables. The residuals of WTD for each model are shown in Fig. 7b–d. Each subplot also shows the decrease in groundwater storage based on GRACE data (Zhao et al., 2023), which is classified into three levels: moderate, rapid, and dramatic. The decrease in groundwater storage is mainly observed in northern China, such as in the Song–Liao plains, the North China Plain, and the Hetao Plain and at the northern edge of the Tarim basin. Agriculture, with intensive groundwater pumping for irrigation, is well-developed in these areas. While model simulations represent natural conditions without groundwater pumping, simulated water tables might be expected to be shallower than observed, i.e., negative WTD residuals, given anthropogenic impacts. However, the residuals from the Fan et al. (2013, 2017) model show positive residuals in these areas (Fig. 7c). Similarly, positive residuals of GLOBGM v1.0 are found in Tibet and the Song–Liao plains, where the decrease in groundwater storage is likely to be significant. Given the uncertainty in groundwater pumping and the lack of extraction data, it is challenging to represent these processes in large-scale models. It is important to note that Fan's model is an inverse model and that the predecessor of GLOBGM v1.0 is a calibrated model, while the ParFlow CONCN 1.0 model is uncalibrated. Groundwater observations are sparse; many uncertainties exist, particularly in the subsurface architecture; and extraction from wells is unknown, creating a substantial modeling challenge. Calibration of large-scale groundwater models to observations becomes particularly challenging given that both extraction and hydraulic conductivity will lower water tables and can have an equal impact on RSR values.
All three models show deep simulated water tables located just below the Szechwan basin, at the boundaries of the Yangtze River and the Pearl River basins (Fig. 7). This finding may suggest a higher potential recharge in 2018 compared to the historic period (1981–2010), which was used to drive the model. Notably, these areas are part of the extensive karst regions (Wang et al., 2019), where unique potential recharge and groundwater movement may occur along preferential flow pathways (e.g., fractures and conduits) (Hartmann et al., 2017). Given that ParFlow modeling has demonstrated acceptable performance in karst regions in previous studies (Srivastava et al., 2014; Yang et al., 2023b), we did not apply specific adjustments to model inputs for these regions. However, we assigned higher hydraulic conductivities in karst regions, assuming that karst aquifers behave similarly to porous media at a scale of approximately 1 km (i.e., the model resolution). This assumption may simplify the karst geology, and we acknowledge its limitations as the simulated deep water tables could also result from the underlying karst geology. More specifically, wells are easily created in places lacking prominent karst features, where local hydraulic conductivities are relatively lower. However, the higher effective hydraulic conductivity of a grid cell may generate deep water tables without representing such subgrid heterogeneities.
In southern China, where it is wet, CONCN 1.0 shows shallow water tables, whereas Fan's model and GLOBGW v1.0 predict relatively deeper water tables (Fig. 7b–d). These differences are likely to arise from the distinct model formulations. ParFlow integrates overland flow and groundwater movement by simultaneously solving Richards' equation and the shallow-water equation via shared nodes in the top layer. As a result, WTDs in wells near rivers are likely to be underestimated due to the widened rivers in the model, resulting from the model's resolution of approximately 1 km. WTDs in some wells located too close to rivers, e.g., tens or hundreds of meters, which is smaller than the model resolution, cannot be captured at all as the grid cell has been fully saturated. However, monitoring wells are typically located near rivers, which explains the shallow WTDs generated by CONCN 1.0 in southern China (Fig. 7b). Fan's model and GLOBGW v1.0, which account for river–groundwater interactions, use the difference between groundwater head and river level (Fan et al., 2017; de Graaf et al., 2017). In these two models, rivers and the top subsurface layer are loosely coupled without shared pressure heads. In other words, rivers can flexibly carve the topography, and groundwater with levels lower than the land surface can discharge to rivers. Additionally, WTDs, even in grid cells with rivers, can be calibrated, which is not possible in ParFlow due to the integrated formulation. Though Fan's model and GLOBGW v1.0 use similar formulations for groundwater–river interactions, the WTDs of Fan's model are shallower than those of GLOBGW v1.0 in southern China, which highlights other uncertainties of the two models (Reinecke et al., 2024).
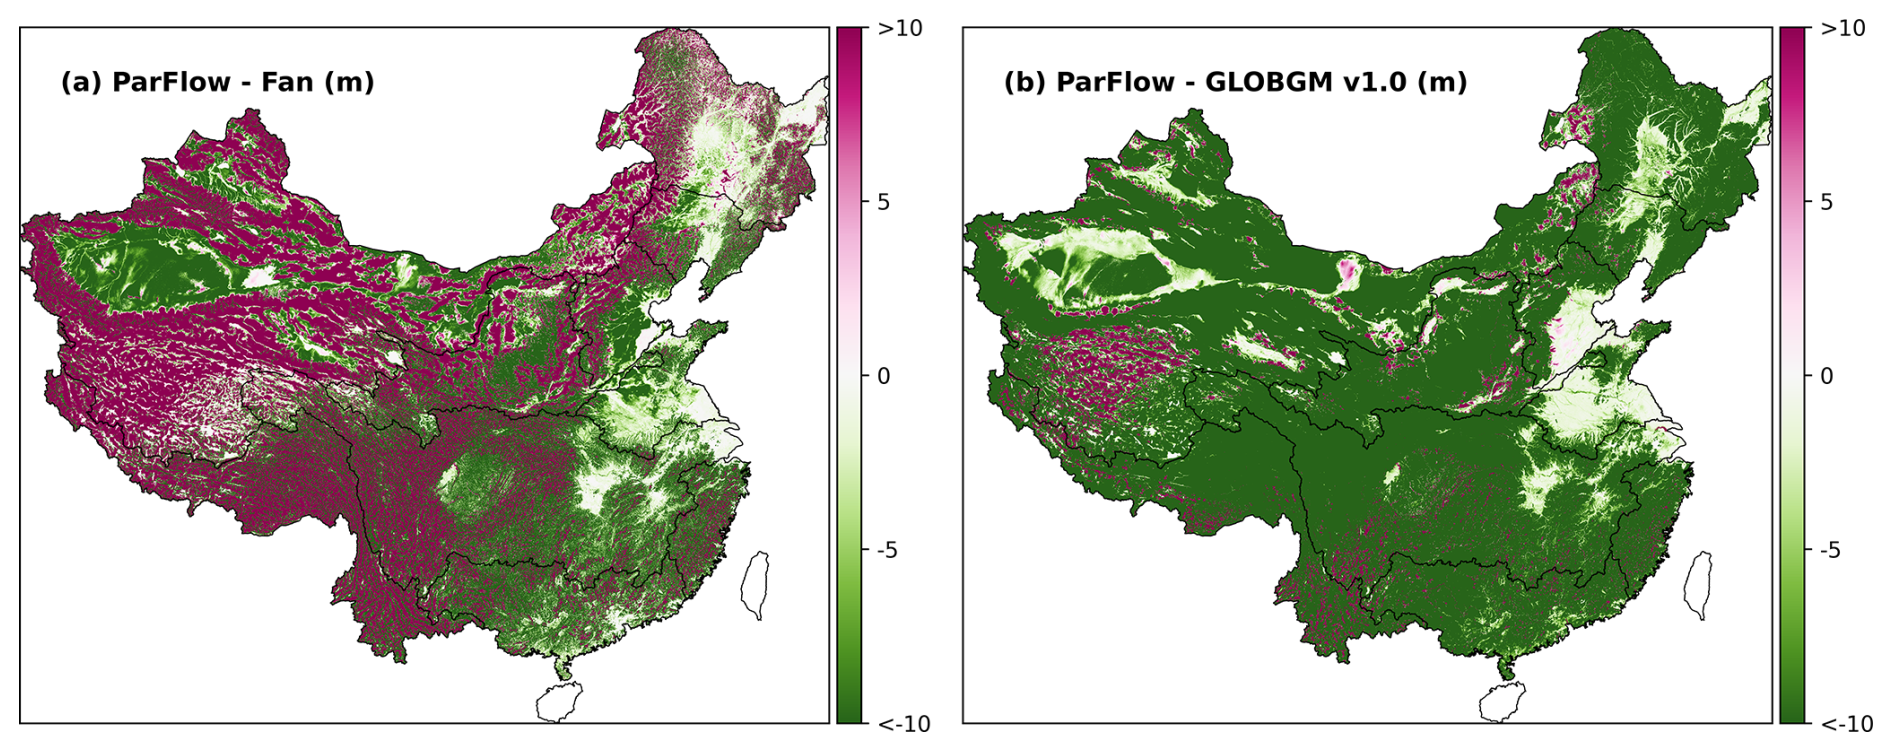
Figure 9Differences in terms of water table depth between CONCN 1.0 and two global models: (a) the difference between CONCN 1.0 and Fan's model and (b) the difference between CONCN 1.0 and GLOBGM v1.0.
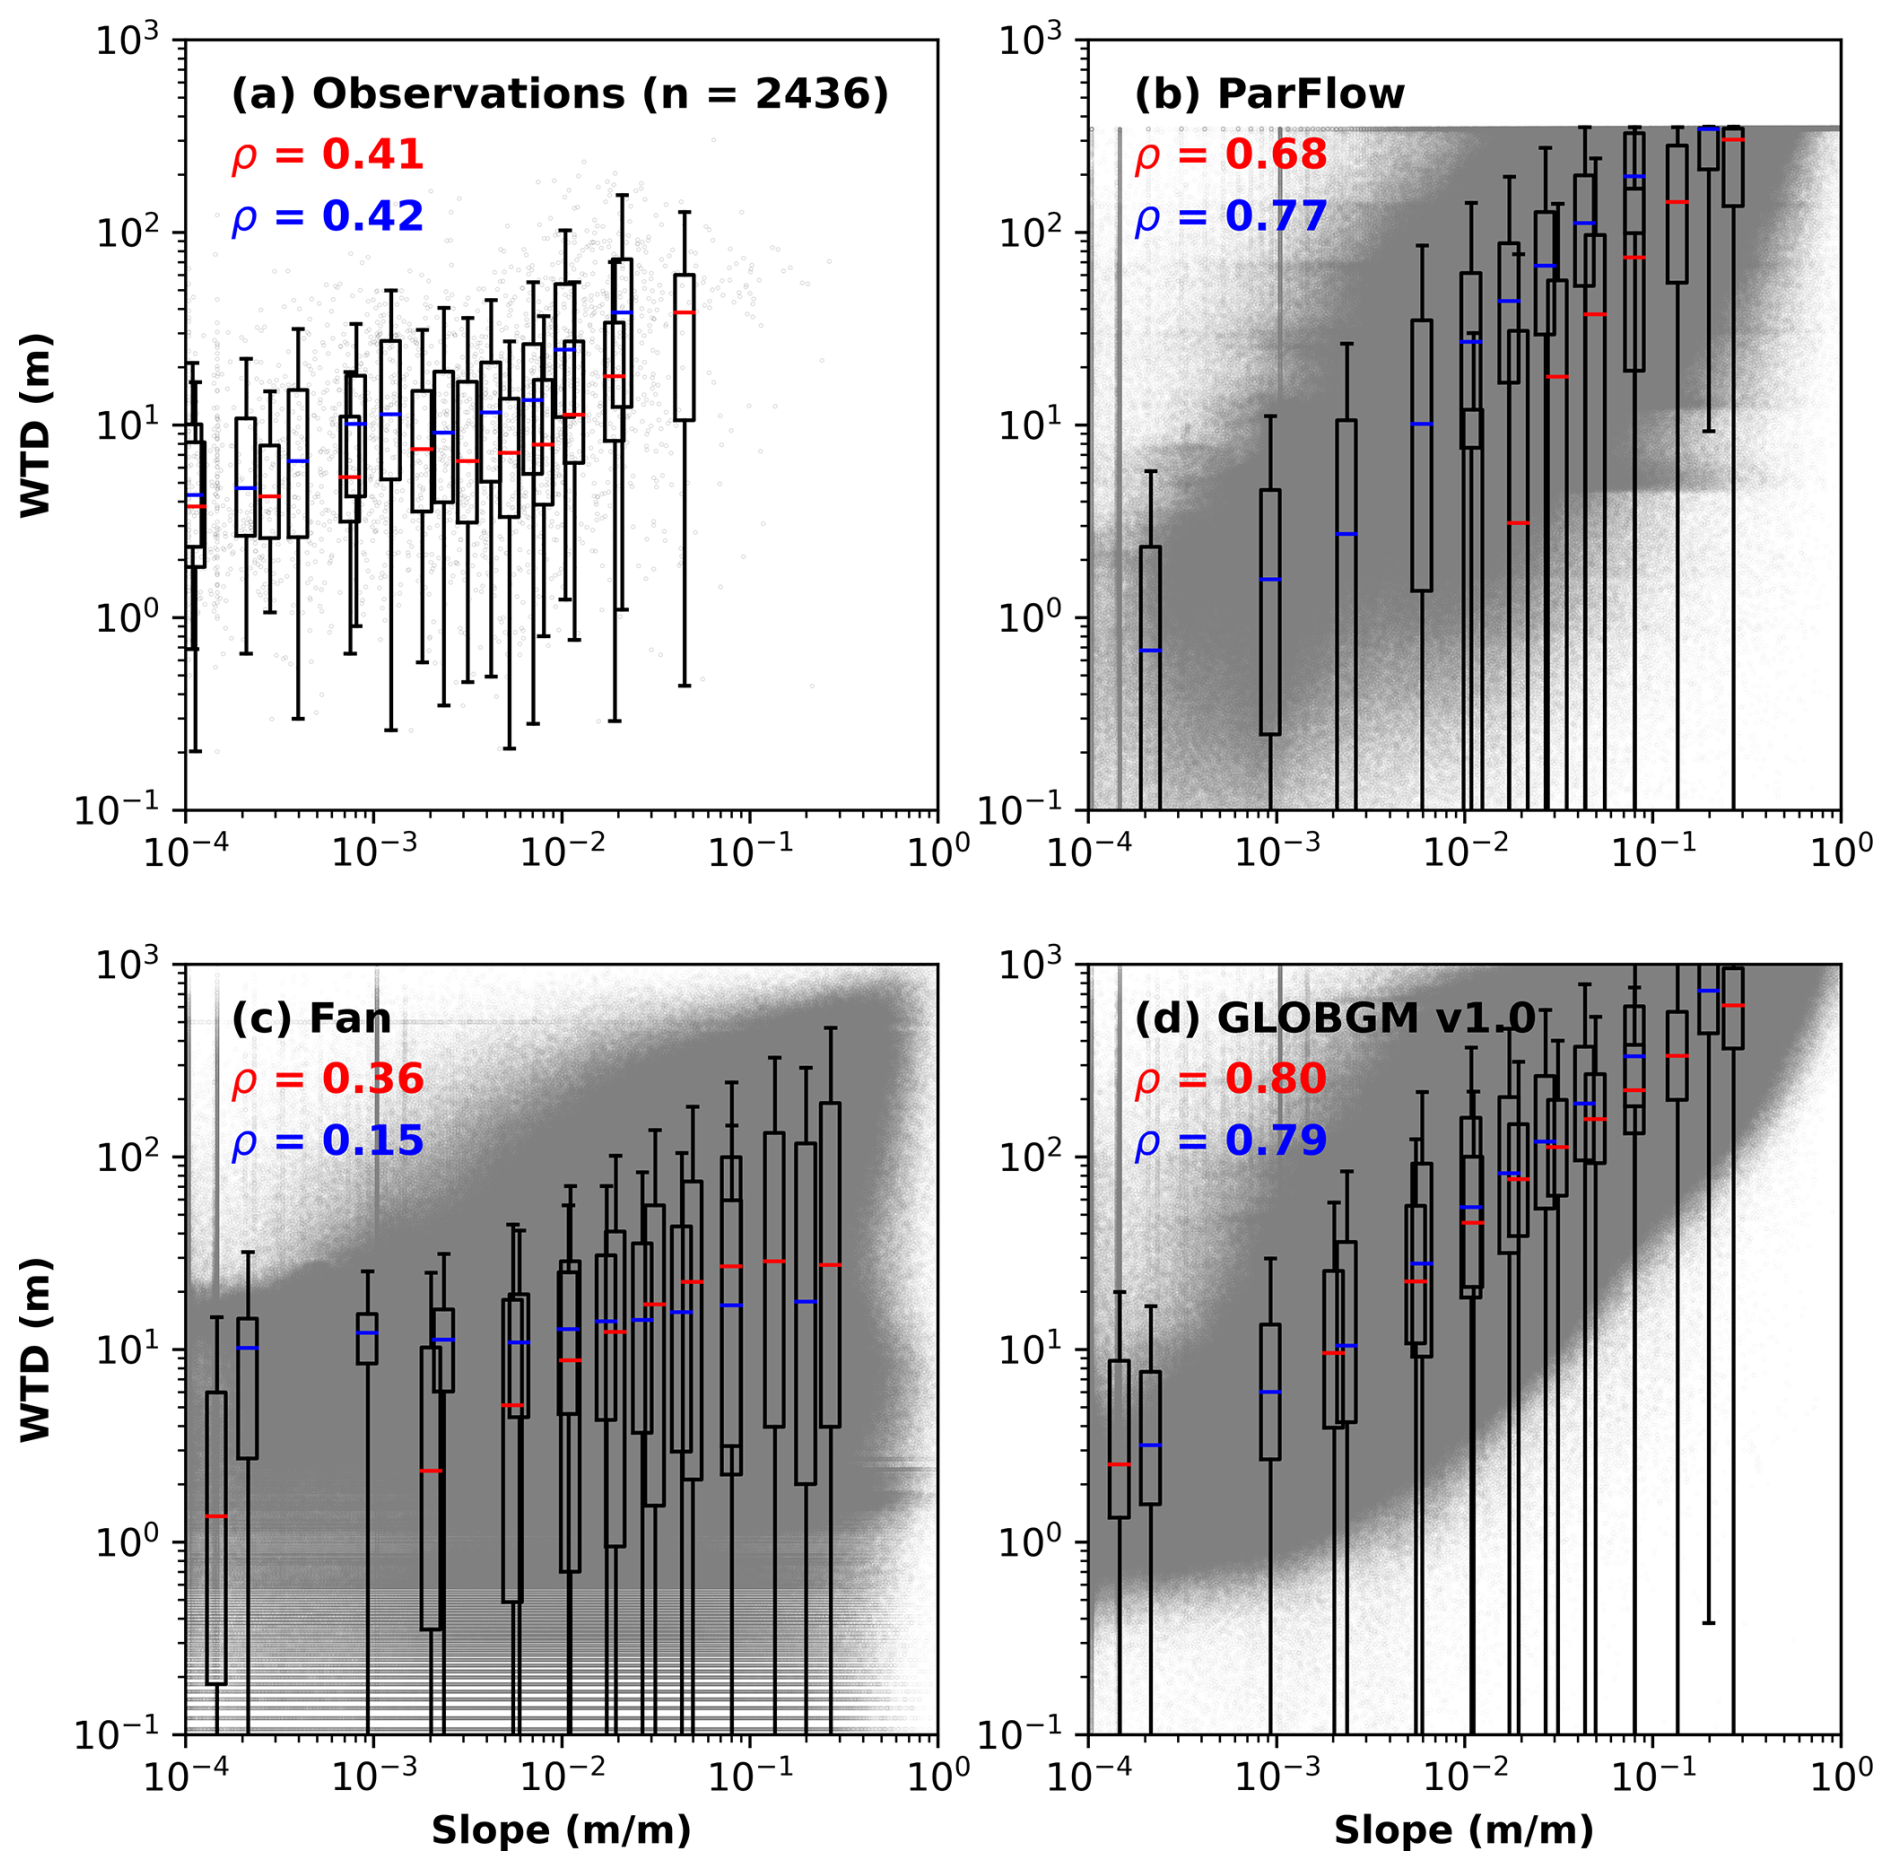
Figure 10Variations in water table depth with topographic slope for observations (a) and simulations of three models (b–c). Spearman rank correlations shown in each subplot are based on the point cloud. Boxplots (without outliers) for better visualization of the point cloud are created by evenly separating slopes into 10 bins. Boxplots and Spearman rank correlations in each subplot are distinguished by potential recharge. Red and blue are for points located in regions with and without long-term average potential recharge (i.e., P − ET > 0 and P − ET = 0).
To avoid the bias in evaluation caused by well locations due to the fact that they are concentrated near rivers, we plotted the differences in terms of WTDs between CONCN 1.0 and the two global models in Fig. 9a and b. Results indicate that Fan's model generally produces shallower WTDs, whereas GLOBGW v1.0 simulates deeper WTDs, i.e., an intermediate performance by CONCN 1.0, which expands the understanding applicable to riparian areas to the entire modeling domain. The significant discrepancies in terms of WTDs across the three models highlight substantial uncertainties in WTDs simulated by current large-scale groundwater models, which cannot be fully revealed using the limited available observations. This underscores the need for further efforts in parameterizations and formulations of the models in this modeling community. Reinecke et al. (2024) found that WTDs generated by global models are strongly correlated with topography (i.e., slope) yet exhibit minimal climatic influences. In contrast, WTDs of Fan's model and observations show weaker correlations with topography and can be further differentiated in water-limited and energy-limited regions. We show generally similar results in Fig. 10, where red and blue are used to differentiate the Spearman rank correlations and boxplots in wet and arid regions based on potential recharge in Fig. 2f.
In Fig. 10, WTDs of CONCN 1.0 and GLOBGM v1.0 show strong correlations with topography, whereas observations and WTDs of Fan's model exhibit weaker correlations. The shallower WTDs simulated by ParFlow in wet regions, as discussed earlier, may decrease the correlation with topography, yet it is interesting to find that the terrain-following grid of ParFlow results in slightly lower correlations than GLOBGM v1.0. Unlike the findings in Reinecke et al. (2024), correlations of observations with topography in different climate regions appear to be similar. This different finding could be attributed to the predominance of agricultural areas in the observation dataset, where groundwater pumping likely exerts a significant influence. The limited number of observations in this study is another potential limitation. In addition to the general explanation for the different correlations among models in Reinecke et al. (2024), the formulation of Fan's model may play an important role. By incorporating the plant use of groundwater and dynamic root uptake depth in an inverse modeling based on inferred ET from remote sensing, Fan's model may introduce stronger regulations in relation to water tables via recharge, thereby diminishing the controls from (or the sensitivity to) topography. Additionally, Fan's model relies on remote sensing ET that has occurred under irrigation conditions, which includes the ET induced by irrigation. This additional ET is likely to be derived from groundwater, amplifying the effects of plant water use compared to natural conditions. This phenomenon may also explain the deeper water tables predicted by Fan's model in agricultural areas, as shown in Fig. 7. These findings suggest that groundwater models should account for plant water use from deep soil or groundwater. Recharge estimated by hydrological or land surface models with limited soil depths and/or without lateral groundwater convergence may be insufficient. Furthermore, uncertainties arising from human disturbances, such as groundwater pumping, should also be quantified.
In this study, we built the first surface water–groundwater integrated hydrologic modeling platform for the entirety of continental China with a high resolution using ParFlow. This CONCN 1.0 model was rigorously evaluated by both data products and observations based on RSR values. Comparisons with observations show satisfying performances in terms of streamflow and water table depth. Comparisons with global data products show comparable performance in terms of streamflow in relation to the global models and an intermediate performance in terms of water table depth among global models. These results also demonstrate the transferability of the modeling workflow using ParFlow. However, we also recognize the challenges inherent in large-scale hydrologic modeling. Data quality and availability (e.g., for direct use or quick access) present a significant challenge during modeling. The vast arid and semi-arid regions of China further increase uncertainties in input data, such as potential recharge. As a result, lower simulated streamflow is observed in northwestern China and in the Haihe River and Liao River basins. Significant uncertainties in simulated water table depth are identified in current large-scale groundwater models, which might be attributed to the different parameterizations and formulations of the models, necessitating continuous efforts from the community.
We hope that our work can catalyze conversations and collaborations between various communities involved in hydrologic modeling, geological surveys, model development, data products, and data monitoring and/or sharing. Clearly, all efforts are aimed at improving the efficiencies and capabilities of large-scale hydrologic modeling, which is powerful in addressing diverse ecohydrologic issues and accelerating scientific discoveries across multiple disciplines. Below, we summarize both the challenges and opportunities that require the attention and collaborative efforts of the hydrology community and beyond.
-
Human activities related to water resources are intensive in China, such as the long-term groundwater pumping in the Huang–Huai–Hai plains, the South-North Water Transfer projects, the operation of the Three Gorges Dam, and the revegetation in the Loess Plateau. Flash extremes are also becoming more frequent, such as the Yangtze drought (August 2022) and the storms in Zhengzhou (July 2022) and Beijing (July 2023). These factors make China one of the world's most significant ecohydrologic hotspots. Integrated hydrologic modeling systems are essential to address these issues. While local and regional models have been developed in recent years, modeling platforms with a high resolution at larger or national scales are still lacking, hindering efficient water resources management and timely decision-making across multiple scales.
-
Hydrologic processes, especially groundwater at the hillslope or catchment scales, play important roles in terrestrial water and energy cycles, yet they are often oversimplified or poorly represented in Earth system models. Many studies conducted in China on critical hydrologic questions have focused on limited components of the hydrologic cycle. Therefore, it is urgent to build large-scale hydrologic models and couple them with regional weather or climatic models to better understand the terrestrial hydrologic cycle in China. More importantly, the modeling should go beyond water balance to include flow paths or water quality to gain a deeper understanding of the food–energy–water nexus and to conduct risk assessments in the changing world.
-
Large-scale hydrologic modeling relies on massive amounts of data for various input variables. Discrete observations are often not user-friendly when it comes to direct use by modelers. Data products help fill spatial and temporal gaps and are necessary for effective modeling. Many of the products currently used only emerged in recent years, making large-scale hydrologic modeling inefficient in China and other parts of the world in earlier times. The rapid development of global data products suggests that now is the ideal time to build large-scale, consistent hydrologic modeling platforms. However, high-quality data products within a consistent framework are still lacking, and inter-evaluations between different products could help constrain uncertainties from various sources (see Sect. 2.3).
-
We also need to leverage the strengths of local documents in China. The hydrolithologies of GLHYMPS 1.0 were built using the global lithology map GLiM, which relies on the geological map with a scale of 1:2.5 million published by the China Geological Survey in 2001. Currently, national geological maps with a scale of 1:500 000 are available, while some local maps have a scale of 1:50 000. We need to fully consider such resources to improve the permeability and/or hydrolithology products in China in terms of both horizontal resolution and available depth. This is critical for building a more reliable hydrostratigraphy, which could substantially improve model performance. In addition, much useful information is probably hidden in system conceptualizations done for previous modeling studies. We should consciously investigate, accumulate, and utilize this information. Particularly in the context of groundwater systems, hydrogeologists may have previously interpreted available data in many places, holding valuable information due to the regional combination of expertise and data.
-
Building large-scale hydrologic models using different formulations is encouraged. Model comparisons are necessary to identify the strengths and limitations of different modeling systems with regard to the issues in focus (Bailey et al., 2016; Zafarmomen et al., 2024; Kim et al., 2008). Such community activities are also helpful in reaching consensus on critical questions, such as conceptual models or model parameterizations, calibrations, evaluations, and opportunities incorporating new techniques and concepts. All of these factors are essential for improving the performance of next-generation models in China and can provide valuable insights for modeling efforts in other parts of the world.
The datasets we used are all from public sources and have been cited in the main text. ParFlow version 3.12–3.13 as used in this study can be found here: https://doi.org/10.5281/zenodo.4816884 (Smith et al., 2024).
Conceptualization: CY and RM. Methodology: CY, LC, and RM. Investigation: CY, ZJ, WX, and RM. Resources: ZW, XZ, YZ, YD, and RM. Writing (original draft): CY. Writing (review and editing): CY, JM, and RM.
The contact author has declared that none of the authors has any competing interests.
Publisher's note: Copernicus Publications remains neutral with regard to jurisdictional claims made in the text, published maps, institutional affiliations, or any other geographical representation in this paper. While Copernicus Publications makes every effort to include appropriate place names, the final responsibility lies with the authors.
We are pleased to acknowledge that the work reported in this paper was largely performed using the Princeton Research Computing resources at Princeton University, made up of a consortium of groups led by the Princeton Institute for Computational Science and Engineering (PICSciE) and the Office of Information Technology's Research Computing. We would like to acknowledge the high-performance-computing support from Derecho provided by NCAR's Computational and Information Systems Laboratory.
This research has been supported by the basic startup fund of Sun Yat-sen University (grant nos. 74110-12240025, 74110-12255010), the National Natural Science Fund for Excellent Young Scientists Fund Program (Overseas) (grant no. 24EAA00330), the Guangdong Major Project of Basic and Applied Basic Research (grant no. 2021B0301030007), and the National Natural Science Foundation of China (grant no. 42088101).
This paper was edited by Nunzio Romano and reviewed by Thorsten Wagener and one anonymous referee.
Bailey, R. T., Wible, T. C., Arabi, M., Records, R. M., and Ditty, J.: Assessing regional-scale spatio-temporal patterns of groundwater–surface water interactions using a coupled SWAT-MODFLOW model, Hydrol. Process., 30, 4420–4433, https://doi.org/10.1002/hyp.10933, 2016.
Belleflamme, A., Goergen, K., Wagner, N., Kollet, S., Bathiany, S., El Zohbi, J., Rechid, D., Vanderborght, J., and Vereecken, H.: Hydrological forecasting at impact scale: the integrated ParFlow hydrological model at 0.6 km for climate resilient water resource management over Germany, Frontiers in Water, 5, 1183642, https://doi.org/10.3389/frwa.2023.1183642, 2023.
Bianchi, M., Scheidegger, J., Hughes, A., Jackson, C., Lee, J., Lewis, M., Mansour, M., Newell, A., O'Dochartaigh, B., Patton, A., and Dadson, S.: Simulation of national-scale groundwater dynamics in geologically complex aquifer systems: an example from Great Britain, Hydrolog. Sci. J., 69, 572–591, https://doi.org/10.1080/02626667.2024.2320847, 2024.
Cao, G. L., Zheng, C. M., Scanlon, B. R., Liu, J., and Li, W. P.: Use of flow modeling to assess sustainability of groundwater resources in the North China Plain, Water Resour. Res., 49, 159–175, https://doi.org/10.1029/2012wr011899, 2013.
Chen, J., Sudicky, E. A., Davison, J. H., Frey, S. K., Park, Y. J., Hwang, H. T., Erler, A. R., Berg, S. J., Callaghan, M. V., Miller, K., Ross, M., and Peltier, W. R.: Towards a climate-driven simulation of coupled surface-subsurface hydrology at the continental scale: a Canadian example, Can. Water Resour. J., 45, 11–27, https://doi.org/10.1080/07011784.2019.1671235, 2020.
Collins, G. and Reddy, G.: China's Growing Water Crisis, Foreign Affairs, The Council on Foreign Relations, Inc., https://www.foreignaffairs.com/china/chinas-growing-water-crisis (last access: 9 May 2025), 2022.
Condon, L. E. and Maxwell, R. M.: Modified priority flood and global slope enforcement algorithm for topographic processing in physically based hydrologic modeling applications, Comput. Geosci.-UK, 126, 73–83, https://doi.org/10.1016/j.cageo.2019.01.020, 2019.
Condon, L. E., Kollet, S., Bierkens, M. F. P., Fogg, G. E., Maxwell, R. M., Hill, M. C., Fransen, H.-J. H., Verhoef, A., Van Loon, A. F., Sulis, M., and Abesser, C.: Global Groundwater Modeling and Monitoring: Opportunities and Challenges, Water Resour. Res., 57, e2020WR029500, https://doi.org/10.1029/2020WR029500, 2021.
Cosgrove, B., Gochis, D., Flowers, T., Dugger, A., Ogden, F., Graziano, T., Clark, E., Cabell, R., Casiday, N., Cui, Z., Eicher, K., Fall, G., Feng, X., Fitzgerald, K., Frazier, N., George, C., Gibbs, R., Hernandez, L., Johnson, D., Jones, R., Karsten, L., Kefelegn, H., Kitzmiller, D., Lee, H., Liu, Y., Mashriqui, H., Mattern, D., McCluskey, A., McCreight, J. L., McDaniel, R., Midekisa, A., Newman, A., Pan, L., Pham, C., RafieeiNasab, A., Rasmussen, R., Read, L., Rezaeianzadeh, M., Salas, F., Sang, D., Sampson, K., Schneider, T., Shi, Q., Sood, G., Wood, A., Wu, W., Yates, D., Yu, W., and Zhang, Y.: NOAA's National Water Model: Advancing operational hydrology through continental-scale modeling, J. Am. Water Resour. As., 60, 247–272, https://doi.org/10.1111/1752-1688.13184, 2024.
Dai, Y., Xin, Q., Wei, N., Zhang, Y., Shangguan, W., Yuan, H., Zhang, S., Liu, S., and Lu, X.: A Global High-Resolution Data Set of Soil Hydraulic and Thermal Properties for Land Surface Modeling, J. Adv. Model. Earth Sy., 11, 2996–3023, https://doi.org/10.1029/2019ms001784, 2019.
Dai, Y. J., Zeng, X. B., Dickinson, R. E., Baker, I., Bonan, G. B., Bosilovich, M. G., Denning, A. S., Dirmeyer, P. A., Houser, P. R., Niu, G. Y., Oleson, K. W., Schlosser, C. A., and Yang, Z. L.: The Common Land Model, B. Am. Meteorol. Soc., 84, 1013–1023, https://doi.org/10.1175/Bams-84-8-1013, 2003.
David, C. H., Maidment, D. R., Niu, G.-Y., Yang, Z.-L., Habets, F., and Eijkhout, V.: River Network Routing on the NHDPlus Dataset, J. Hydrometeorol., 12, 913–934, https://doi.org/10.1175/2011JHM1345.1, 2011.
de Graaf, I., Condon, L., and Maxwell, R.: Hyper-Resolution Continental-Scale 3-D Aquifer Parameterization for Groundwater Modeling, Water Resour. Res., 56, e2019WR026004, https://doi.org/10.1029/2019WR026004, 2020.
de Graaf, I. E. M., Sutanudjaja, E. H., van Beek, L. P. H., and Bierkens, M. F. P.: A high-resolution global-scale groundwater model, Hydrol. Earth Syst. Sci., 19, 823–837, https://doi.org/10.5194/hess-19-823-2015, 2015.
de Graaf, I. E. M., van Beek, R. L. P. H., Gleeson, T., Moosdorf, N., Schmitz, O., Sutanudjaja, E. H., and Bierkens, M. F. P.: A global-scale two-layer transient groundwater model: Development and application to groundwater depletion, Adv. Water Resour., 102, 53–67, https://doi.org/10.1016/j.advwatres.2017.01.011, 2017.
Delsman, J. R., Mulder, T., Romero Verastegui, B., Bootsma, H., Zitman, P., Huizer, S., and Oude Essink, G. H. P.: Reproducible construction of a high-resolution national variable-density groundwater salinity model for the Netherlands, Environ. Modell. Softw., 164, 105683, https://doi.org/10.1016/j.envsoft.2023.105683, 2023.
Devitt, L., Neal, J., Wagener, T., and Coxon, G.: Uncertainty in the extreme flood magnitude estimates of large-scale flood hazard models, Environ. Res. Lett., 16, 064013, https://doi.org/10.1088/1748-9326/abfac4, 2021.
Eilander, D., van Verseveld, W., Yamazaki, D., Weerts, A., Winsemius, H. C., and Ward, P. J.: A hydrography upscaling method for scale-invariant parametrization of distributed hydrological models, Hydrol. Earth Syst. Sci., 25, 5287–5313, https://doi.org/10.5194/hess-25-5287-2021, 2021.
Fan, Y., Li, H., and Miguez-Macho, G.: Global Patterns of Groundwater Table Depth, Science, 339, 940–943, https://doi.org/10.1126/science.1229881, 2013.
Fan, Y., Miguez-Macho, G., Jobbágy, E. G., Jackson, R. B., and Otero-Casal, C.: Hydrologic regulation of plant rooting depth, P. Natl. Acad. Sci. USA, 114, 10572–10577, https://doi.org/10.1073/pnas.1712381114, 2017.
Fan, Y., Miguez-Macho, G., Weaver, C. P., Walko, R., and Robock, A.: Incorporating water table dynamics in climate modeling: 1. Water table observations and equilibrium water table simulations, J. Geophys. Res.-Atmos., 112, D10125, https://doi.org/10.1029/2006JD008111, 2007.
Feng, D., Fang, K., and Shen, C.: Enhancing Streamflow Forecast and Extracting Insights Using Long-Short Term Memory Networks With Data Integration at Continental Scales, Water Resour. Res., 56, e2019WR026793, https://doi.org/10.1029/2019WR026793, 2020.
Ferguson, G., McIntosh, J. C., Jasechko, S., Kim, J.-H., Famiglietti, J. S., and McDonnell, J. J.: Groundwater deeper than 500 m contributes less than 0.1 % of global river discharge, Commun. Earth Environ., 4, 48, https://doi.org/10.1038/s43247-023-00697-6, 2023.
Foster, L. M., Williams, K. H., and Maxwell, R. M.: Resolution matters when modeling climate change in headwaters of the Colorado River, Environ. Res. Lett., 15, 104031, https://doi.org/10.1088/1748-9326/aba77f, 2020.
Friedl, M. and Sulla-Menashe, D.: MODIS/Terra+Aqua Land Cover Type Yearly L3 Global 500m SIN Grid V061, NASA EOSDIS Land Processes Distributed Active Archive Center [dataset], https://doi.org/10.5067/MODIS/MCD12Q1.061, 2022.
Gleeson, T., Moosdorf, N., Hartmann, J., and van Beek, L. P. H.: A glimpse beneath earth's surface: GLobal HYdrogeology MaPS (GLHYMPS) of permeability and porosity, Geophys. Res. Lett., 41, 3891–3898, https://doi.org/10.1002/2014gl059856, 2014.
Gleeson, T., Wagener, T., Döll, P., Zipper, S. C., West, C., Wada, Y., Taylor, R., Scanlon, B., Rosolem, R., Rahman, S., Oshinlaja, N., Maxwell, R., Lo, M.-H., Kim, H., Hill, M., Hartmann, A., Fogg, G., Famiglietti, J. S., Ducharne, A., de Graaf, I., Cuthbert, M., Condon, L., Bresciani, E., and Bierkens, M. F. P.: GMD perspective: The quest to improve the evaluation of groundwater representation in continental- to global-scale models, Geosci. Model Dev., 14, 7545–7571, https://doi.org/10.5194/gmd-14-7545-2021, 2021.
Gochis, D. J., Yu, W., and Yates, D. N.: The WRF-Hydro model technical description and user's guide, version 3.0, NCAR Technical Document, 120 pages, the National Center for Atmospheric Research, Boulder, CO, USA, 2015.
Han, J., Miao, C., Gou, J., Zheng, H., Zhang, Q., and Guo, X.: A new daily gridded precipitation dataset for the Chinese mainland based on gauge observations, Earth Syst. Sci. Data, 15, 3147–3161, https://doi.org/10.5194/essd-15-3147-2023, 2023.
Hartmann, A., Gleeson, T., Wada, Y., and Wagener, T.: Enhanced groundwater recharge rates and altered recharge sensitivity to climate variability through subsurface heterogeneity, P. Natl. Acad. Sci. USA, 114, 2842–2847, https://doi.org/10.1073/pnas.1614941114, 2017.
Hartmann, J. and Moosdorf, N.: The new global lithological map database GLiM: A representation of rock properties at the Earth surface, Geochem. Geoph. Geosy., 13, Q12004, https://doi.org/10.1029/2012GC004370, 2012.
Hellwig, J., de Graaf, I. E. M., Weiler, M., and Stahl, K.: Large-Scale Assessment of Delayed Groundwater Responses to Drought, Water Resour. Res., 56, e2019WR025441, https://doi.org/10.1029/2019WR025441, 2020.
Henriksen, H. J., Troldborg, L., Nyegaard, P., Sonnenborg, T. O., Refsgaard, J. C., and Madsen, B.: Methodology for construction, calibration and validation of a national hydrological model for Denmark, J. Hydrol., 280, 52–71, https://doi.org/10.1016/S0022-1694(03)00186-0, 2003.
Hoch, J. M., Sutanudjaja, E. H., Wanders, N., van Beek, R. L. P. H., and Bierkens, M. F. P.: Hyper-resolution PCR-GLOBWB: opportunities and challenges from refining model spatial resolution to 1 km over the European continent, Hydrol. Earth Syst. Sci., 27, 1383–1401, https://doi.org/10.5194/hess-27-1383-2023, 2023.
Hu, L., Xu, Z., and Huang, W.: Development of a river-groundwater interaction model and its application to a catchment in Northwestern China, J. Hydrol., 543, 483–500, https://doi.org/10.1016/j.jhydrol.2016.10.028, 2016.
Huang, C., Zheng, X., Tait, A., Dai, Y., Yang, C., Chen, Z., Li, T., and Wang, Z.: On using smoothing spline and residual correction to fuse rain gauge observations and remote sensing data, J. Hydrol., 508, 410–417, https://doi.org/10.1016/j.jhydrol.2013.11.022, 2014.
Huscroft, J., Gleeson, T., Hartmann, J., and Börker, J.: Compiling and Mapping Global Permeability of the Unconsolidated and Consolidated Earth: GLobal HYdrogeology MaPS 2.0 (GLHYMPS 2.0), Geophys. Res. Lett., 45, 1897–1904, https://doi.org/10.1002/2017GL075860, 2018.
Jiang, X., Ma, R., Ma, T., and Sun, Z.: Modeling the effects of water diversion projects on surface water and groundwater interactions in the central Yangtze River basin, Sci. Total Environ., 830, 154606, https://doi.org/10.1016/j.scitotenv.2022.154606, 2022.
Jiang, Y.: China's water scarcity, J. Environ. Manage., 90, 3185–3196, https://doi.org/10.1016/j.jenvman.2009.04.016, 2009.
Jiménez, C., Prigent, C., Mueller, B., Seneviratne, S. I., McCabe, M. F., Wood, E. F., Rossow, W. B., Balsamo, G., Betts, A. K., Dirmeyer, P. A., Fisher, J. B., Jung, M., Kanamitsu, M., Reichle, R. H., Reichstein, M., Rodell, M., Sheffield, J., Tu, K., and Wang, K.: Global intercomparison of 12 land surface heat flux estimates, J. Geophys. Res.-Atmos., 116, D02102, https://doi.org/10.1029/2010JD014545, 2011.
Kim, N. W., Chung, I. M., Won, Y. S., and Arnold, J. G.: Development and application of the integrated SWAT–MODFLOW model, J. Hydrol., 356, 1–16, https://doi.org/10.1016/j.jhydrol.2008.02.024, 2008.
Knoben, W. J. M., Freer, J. E., and Woods, R. A.: Technical note: Inherent benchmark or not? Comparing Nash–Sutcliffe and Kling–Gupta efficiency scores, Hydrol. Earth Syst. Sci., 23, 4323–4331, https://doi.org/10.5194/hess-23-4323-2019, 2019.
Kollet, S. J. and Maxwell, R. M.: Integrated surface-groundwater flow modeling: A free-surface overland flow boundary condition in a parallel groundwater flow model, Adv. Water Resour., 29, 945–958, 2006.
Kollet, S. J. and Maxwell, R. M.: Capturing the influence of groundwater dynamics on land surface processes using an integrated, distributed watershed model, Water Resour. Res., 44, W02402, https://doi.org/10.1029/2007wr006004, 2008.
Lancia, M., Yao, Y., Andrews, C. B., Wang, X., Kuang, X., Ni, J., Gorelick, S. M., Scanlon, B. R., Wang, Y., and Zheng, C.: The China groundwater crisis: A mechanistic analysis with implications for global sustainability, Sustainable Horizons, 4, 100042, https://doi.org/10.1016/j.horiz.2022.100042, 2022.
Li, Z., Chen, Y., Yang, J., and Wang, Y.: Potential evapotranspiration and its attribution over the past 50 years in the arid region of Northwest China, Hydrol. Process., 28, 1025–1031, https://doi.org/10.1002/hyp.9643, 2014.
Lin, P., Pan, M., Beck, H. E., Yang, Y., Yamazaki, D., Frasson, R., David, C. H., Durand, M., Pavelsky, T. M., Allen, G. H., Gleason, C. J., and Wood, E. F.: Global Reconstruction of Naturalized River Flows at 2.94 Million Reaches, Water Resour. Res., 55, 6499–6516, https://doi.org/10.1029/2019wr025287, 2019.
Livneh, B., Bohn, T. J., Pierce, D. W., Munoz-Arriola, F., Nijssen, B., Vose, R., Cayan, D. R., and Brekke, L.: A spatially comprehensive, hydrometeorological data set for Mexico, the U. S., and Southern Canada 1950–2013, Sci. Data, 2, 150042, https://doi.org/10.1038/sdata.2015.42, 2015.
Ma, N., Szilagyi, J., Zhang, Y., and Liu, W.: Complementary-Relationship-Based Modeling of Terrestrial Evapotranspiration Across China During 1982–2012: Validations and Spatiotemporal Analyses, J. Geophys. Res.-Atmos., 124, 4326–4351, https://doi.org/10.1029/2018JD029850, 2019.
Maxwell, R. M.: A terrain-following grid transform and preconditioner for parallel, large-scale, integrated hydrologic modeling, Adv. Water Resour., 53, 109–117, https://doi.org/10.1016/j.advwatres.2012.10.001, 2013.
Maxwell, R. M., Condon, L. E., and Kollet, S. J.: A high-resolution simulation of groundwater and surface water over most of the continental US with the integrated hydrologic model ParFlow v3, Geosci. Model Dev., 8, 923–937, https://doi.org/10.5194/gmd-8-923-2015, 2015.
Miao, C., Gou, J., Fu, B., Tang, Q., Duan, Q., Chen, Z., Lei, H., Chen, J., Guo, J., Borthwick, A. G. L., Ding, W., Duan, X., Li, Y., Kong, D., Guo, X., and Wu, J.: High-quality reconstruction of China's natural streamflow, Sci. Bull., 67, 547–556, https://doi.org/10.1016/j.scib.2021.09.022, 2022.
Müller Schmied, H., Cáceres, D., Eisner, S., Flörke, M., Herbert, C., Niemann, C., Peiris, T. A., Popat, E., Portmann, F. T., Reinecke, R., Schumacher, M., Shadkam, S., Telteu, C.-E., Trautmann, T., and Döll, P.: The global water resources and use model WaterGAP v2.2d: model description and evaluation, Geosci. Model Dev., 14, 1037–1079, https://doi.org/10.5194/gmd-14-1037-2021, 2021.
Muñoz-Sabater, J., Dutra, E., Agustí-Panareda, A., Albergel, C., Arduini, G., Balsamo, G., Boussetta, S., Choulga, M., Harrigan, S., Hersbach, H., Martens, B., Miralles, D. G., Piles, M., Rodríguez-Fernández, N. J., Zsoter, E., Buontempo, C., and Thépaut, J.-N.: ERA5-Land: a state-of-the-art global reanalysis dataset for land applications, Earth Syst. Sci. Data, 13, 4349–4383, https://doi.org/10.5194/essd-13-4349-2021, 2021.
Moriasi, D. N., G. Arnold, J., W. Van Liew, M., L. Bingner, R., D. Harmel, R., and L. Veith, T.: Model Evaluation Guidelines for Systematic Quantification of Accuracy in Watershed Simulations, T. ASABE, 50, 885–900, https://doi.org/10.13031/2013.23153, 2007.
Niu, Z., He, H., Zhu, G., Ren, X., Zhang, L., and Zhang, K.: A spatial-temporal continuous dataset of the transpiration to evapotranspiration ratio in China from 1981–2015, Sci. Data, 7, 369, https://doi.org/10.1038/s41597-020-00693-x, 2020.
O'Neill, M. M. F., Tijerina, D. T., Condon, L. E., and Maxwell, R. M.: Assessment of the ParFlow–CLM CONUS 1.0 integrated hydrologic model: evaluation of hyper-resolution water balance components across the contiguous United States, Geosci. Model Dev., 14, 7223–7254, https://doi.org/10.5194/gmd-14-7223-2021, 2021.
Peng, S.: 1-km monthly precipitation dataset for China (1901–2022), National Tibetan Plateau Data Center [dataset], https://doi.org/10.5281/zenodo.3185722, 2020.
Pietz, D. A.: China's Water Challenges: National and Global Implications, Education About ASIA, 22, 8–14, 2017.
Regan, R. S., Juracek, K. E., Hay, L. E., Markstrom, S. L., Viger, R. J., Driscoll, J. M., LaFontaine, J. H., and Norton, P. A.: The U. S. Geological Survey National Hydrologic Model infrastructure: Rationale, description, and application of a watershed-scale model for the conterminous United States, Environ. Modell. Softw., 111, 192–203, https://doi.org/10.1016/j.envsoft.2018.09.023, 2019.
Reinecke, R., Foglia, L., Mehl, S., Trautmann, T., Cáceres, D., and Döll, P.: Challenges in developing a global gradient-based groundwater model (G3M v1.0) for the integration into a global hydrological model, Geosci. Model Dev., 12, 2401–2418, https://doi.org/10.5194/gmd-12-2401-2019, 2019.
Reinecke, R., Wachholz, A., Mehl, S., Foglia, L., Niemann, C., and Döll, P.: Importance of Spatial Resolution in Global Groundwater Modeling, Groundwater, 58, 363–376, https://doi.org/10.1111/gwat.12996, 2020.
Reinecke, R., Gnann, S., Stein, L., Bierkens, M., de Graaf, I., Gleeson, T., Essink, G. O., Sutanudjaja, E. H., Ruz Vargas, C., Verkaik, J., and Wagener, T.: Uncertainty in model estimates of global groundwater depth, Environ. Res. Lett., 19, 114066, https://doi.org/10.1088/1748-9326/ad8587, 2024.
Running, S., Mu, Q., Zhao, M., and Moreno, A.: MODIS/Terra Net Evapotranspiration Gap-Filled Yearly L4 Global 500m SIN Grid V061, NASA EOSDIS Land Processes Distributed Active Archive Center [dataset], https://doi.org/10.5067/MODIS/MOD16A3GF.061, 2021.
Schaap, M. G. and Leij, F. J.: Database-related accuracy and uncertainty of pedotransfer functions, Soil Sci., 163, 765–779, https://doi.org/10.1097/00010694-199810000-00001, 1998.
Schaefli, B. and Gupta, H. V.: Do Nash values have value?, Hydrol. Process., 21, 2075–2080, https://doi.org/10.1002/hyp.6825, 2007.
Shangguan, W., Hengl, T., de Jesus, J. M., Yuan, H., and Dai, Y. J.: Mapping the global depth to bedrock for land surface modeling, J. Adv. Model. Earth Sy., 9, 65–88, 2017.
Smith, S., Ferguson, I., Engdahl, N., Gasper, F., Chennault, C., Triana, J. S. A., Avery, P., Rigor, P., Condon, L., Jourdain, S., Bennett, A., Artavanis, G., Maxwell, R., Kulkarni, K., Bansal, V., Beisman, J., de Rooij, R., Swilley, J., Lazzeri, D., Thompson, D., Coon, E., Bertolacci, I., Azeemi, M. F., Wagner, N.: parflow/parflow: ParFlow Version 3.13.0 (v3.13.0), Zenodo [code], https://doi.org/10.5281/zenodo.10989198, 2024.
Srivastava, V., Graham, W., Muñoz-Carpena, R., and Maxwell, R. M.: Insights on geologic and vegetative controls over hydrologic behavior of a large complex basin – Global Sensitivity Analysis of an integrated parallel hydrologic model, J. Hydrol., 519, 2238–2257, https://doi.org/10.1016/j.jhydrol.2014.10.020, 2014.
Strahler, A. N.: Quantitative analysis of watershed geomorphology, Eos T. Am. Geophys. Un., 38, 913–920, https://doi.org/10.1029/TR038i006p00913, 1957.
Sutanudjaja, E. H., van Beek, R., Wanders, N., Wada, Y., Bosmans, J. H. C., Drost, N., van der Ent, R. J., de Graaf, I. E. M., Hoch, J. M., de Jong, K., Karssenberg, D., López López, P., Peßenteiner, S., Schmitz, O., Straatsma, M. W., Vannametee, E., Wisser, D., and Bierkens, M. F. P.: PCR-GLOBWB 2: a 5 arcmin global hydrological and water resources model, Geosci. Model Dev., 11, 2429–2453, https://doi.org/10.5194/gmd-11-2429-2018, 2018.
Swilley, J. S., Tijerina-Kreuzer, D., Tran, H. V., Zhang, J., Yang, C., Condon, L. E., and Maxwell, R. M.: Continental Scale Hydrostratigraphy: Comparing Geologically Informed Data Products to Analytical Solutions, Groundwater, 62, 75–92, https://doi.org/10.1111/gwat.13354, 2023.
Tian, Y., Zheng, Y., Zheng, C., Xiao, H., Fan, W., Zou, S., Wu, B., Yao, Y., Zhang, A., and Liu, J.: Exploring scale-dependent ecohydrological responses in a large endorheic river basin through integrated surface water-groundwater modeling, Water Resour. Res., 51, 4065–4085, https://doi.org/10.1002/2015WR016881, 2015.
Tijerina, D., Condon, L., FitzGerald, K., Dugger, A., O'Neill, M. M., Sampson, K., Gochis, D., and Maxwell, R.: Continental Hydrologic Intercomparison Project, Phase 1: A Large-Scale Hydrologic Model Comparison Over the Continental United States, Water Resour. Res., 57, e2020WR028931, https://doi.org/10.1029/2020WR028931, 2021.
Tijerina-Kreuzer, D., Swilley, J. S., Tran, H. V., Zhang, J., West, B., Yang, C., Condon, L. E., and Maxwell, R. M.: Continental scale hydrostratigraphy: basin-scale testing of alternative data-driven approaches, Groundwater, 62, 93–110, https://doi.org/10.1111/gwat.13357, 2023.
Vergnes, J.-P., Caballero, Y., and Lanini, S.: Assessing climate change impact on French groundwater resources using a spatially distributed hydrogeological model, Hydrolog. Sci. J., 68, 209–227, https://doi.org/10.1080/02626667.2022.2150553, 2023.
Verkaik, J., Sutanudjaja, E. H., Oude Essink, G. H. P., Lin, H. X., and Bierkens, M. F. P.: GLOBGM v1.0: a parallel implementation of a 30 arcsec PCR-GLOBWB-MODFLOW global-scale groundwater model, Geosci. Model Dev., 17, 275–300, https://doi.org/10.5194/gmd-17-275-2024, 2024.
Wang, K., Zhang, C., Chen, H., Yue, Y., Zhang, W., Zhang, M., Qi, X., and Fu, Z.: Karst landscapes of China: patterns, ecosystem processes and services, Landscape Ecology, 34, 2743–2763, https://doi.org/10.1007/s10980-019-00912-w, 2019.
Wang, X., Tian, Y., Yu, J., Lancia, M., Chen, J., Xiao, K., Zheng, Y., Andrews, C. B., and Zheng, C.: Complex Effects of Tides on Coastal Groundwater Revealed by High-Resolution Integrated Flow Modeling, Water Resour. Res., 59, e2022WR033942, https://doi.org/10.1029/2022WR033942, 2023.
Westerhoff, R., White, P., and Miguez-Macho, G.: Application of an improved global-scale groundwater model for water table estimation across New Zealand, Hydrol. Earth Syst. Sci., 22, 6449–6472, https://doi.org/10.5194/hess-22-6449-2018, 2018.
Yamazaki, D., Ikeshima, D., Sosa, J., Bates, P. D., Allen, G. H., and Pavelsky, T. M.: MERIT Hydro: A High-Resolution Global Hydrography Map Based on Latest Topography Dataset, Water Resour. Res., 55, 5053–5073, https://doi.org/10.1029/2019wr024873, 2019.
Yan, F., Shangguan, W., Zhang, J., and Hu, B.: Depth-to-bedrock map of China at a spatial resolution of 100 meters, Sci. Data, 7, 2, https://doi.org/10.1038/s41597-019-0345-6, 2020.
Yang, C., Li, H.-Y., Fang, Y., Cui, C., Wang, T., Zheng, C., Leung, L. R., Maxwell, R. M., Zhang, Y.-K., and Yang, X.: Effects of Groundwater Pumping on Ground Surface Temperature: A Regional Modeling Study in the North China Plain, J. Geophys. Res.-Atmos., 125, e2019JD031764, https://doi.org/10.1029/2019jd031764, 2020.
Yang, C., Maxwell, R., McDonnell, J., Yang, X., and Tijerina-Kreuzer, D.: The Role of Topography in Controlling Evapotranspiration Age, J. Geophys. Res.-Atmos., 128, e2023JD039228, https://doi.org/10.1029/2023JD039228, 2023a.
Yang, C., Tijerina-Kreuzer, D. T., Tran, H. V., Condon, L. E., and Maxwell, R. M.: A high-resolution, 3D groundwater-surface water simulation of the contiguous US: Advances in the integrated ParFlow CONUS 2.0 modeling platform, J. Hydrol., 130294, https://doi.org/10.1016/j.jhydrol.2023.130294, 2023b.
Yang, J. and Huang, X.: The 30 m annual land cover dataset and its dynamics in China from 1990 to 2019, Earth Syst. Sci. Data, 13, 3907–3925, https://doi.org/10.5194/essd-13-3907-2021, 2021.
Yang, Y., Feng, D., Beck, H. E., Hu, W., Sengupta, A., Monache, L. D., Hartman, R., Lin, P., Shen, C., and Pan, M.: Global Daily Discharge Estimation Based on Grid-Scale Long Short-Term Memory (LSTM) Model and River Routing, ESS Open Archive, ESS Open Archive, https://doi.org/10.22541/essoar.169724927.73813721/v1, 2023c.
Yin, Z., Lin, P., Riggs, R., Allen, G. H., Lei, X., Zheng, Z., and Cai, S.: A synthesis of Global Streamflow Characteristics, Hydrometeorology, and Catchment Attributes (GSHA) for large sample river-centric studies, Earth Syst. Sci. Data, 16, 1559–1587, https://doi.org/10.5194/essd-16-1559-2024, 2024.
Yu, X., Luo, L., Hu, P., Tu, X., Chen, X., and Wei, J.: Impacts of sea-level rise on groundwater inundation and river floods under changing climate, J. Hydrol., 614, 128554, https://doi.org/10.1016/j.jhydrol.2022.128554, 2022.
Zafarmomen, N., Alizadeh, H., Bayat, M., Ehtiat, M., and Moradkhani, H.: Assimilation of Sentinel-Based Leaf Area Index for Modeling Surface-Ground Water Interactions in Irrigation Districts, Water Resour. Res., 60, e2023WR036080, https://doi.org/10.1029/2023WR036080, 2024.
Zhang, J., Condon, L. E., Tran, H., and Maxwell, R. M.: A national topographic dataset for hydrological modeling over the contiguous United States, Earth Syst. Sci. Data, 13, 3263–3279, https://doi.org/10.5194/essd-13-3263-2021, 2021.
Zhang, Y., Kong, D., Gan, R., Chiew, F. H. S., McVicar, T. R., Zhang, Q., and Yang, Y.: Coupled estimation of 500 m and 8-day resolution global evapotranspiration and gross primary production in 2002–2017, Remote Sens. Environ., 222, 165–182, https://doi.org/10.1016/j.rse.2018.12.031, 2019.
Zhao, K., Fang, Z., Li, J., and He, C.: Spatial-temporal variations of groundwater storage in China: A multiscale analysis based on GRACE data, Resources, Conserv. Recycling, 197, 107088, https://doi.org/10.1016/j.resconrec.2023.107088, 2023.