the Creative Commons Attribution 4.0 License.
the Creative Commons Attribution 4.0 License.
 | 28 Apr 2025
Technical note: An assessment of the relative contribution of the Soret effect to open-water evaporation
Michael L. Roderick
Callum J. Shakespeare
It is standard practice to assume that evaporation from open water depends on the gradient in water vapour concentration as per Fick's law. However, Fick's law is only true in an isothermal system. In general, we anticipate an additional mass flux due to the temperature gradient (in a non-isothermal system), and this is known as Soret diffusion or the Soret effect. Here we evaluate the magnitude of the Soret effect and find that, under exceptional circumstances, the Soret effect may be as high as ∼ 5 % of the classical concentration-dependent mass (“Fickian”) diffusion but that it will usually be less than 2 % of that same flux. Furthermore, we evaluate the magnitude of an additional advective (or “Stefan”) flux not usually considered in hydrologic studies that may be as high as ∼ 5 % of the concentration-dependent diffusion. Whether these small additional fluxes need to be considered will depend on the nature of the investigation.
- Article
(1415 KB) - Full-text XML
- Comment
- BibTeX
- EndNote


Evaporation is usually described as mass transfer down a concentration gradient (i.e. Fick's law) (Monteith and Unsworth, 2008). However, strictly speaking, Fick's law is only true under isothermal conditions (Bejan, 2016, p. 639). In many hydrologic applications, the surface and adjacent air temperatures are substantially different and the near-surface evaporative environment is generally not isothermal. The temperature gradient will contribute to the mass transfer via what is known as the Soret effect that acts independently of the concentration gradient (Bejan, 2016, p. 639). The same Onsager-based framework leads to an analogous conclusion that a concentration gradient will contribute to the sensible heat transfer, and this is known as the Dufour effect (Bejan, 2016, p. 639), which emphasizes the symmetrical nature of the Onsager-based flux coupling. In applications (e.g. hydrology, agriculture, ecology, climate), it is a near-universal practice to ignore the Onsager-based flux coupling. Instead we have traditionally assumed that sensible heat transfer only depends on the temperature gradient and that evaporation only depends on the concentration gradient (e.g. Monteith and Unsworth, 2008). Recent work by plant scientists suggests that T gradients can make an important (e.g. up to 10 % of the total water vapour flux under typical circumstances) contribution to evaporation from leaves (Griffani et al., 2024). This result raises the important question of whether an approach that assumes open-water evaporation to be solely described by Fick's law is sufficiently accurate for applications in hydrology, agriculture, and ecology and more generally for weather/climate studies. The aim of this technical note is to address that question.
Ludwig (in 1856) first made a brief report noting the formation of a concentration gradient in the presence of a steady-state temperature gradient in a liquid mixture. This initial observation was subsequently investigated in more detail using liquid solutions by Soret (in 1879). In liquids, the phenomenon is now usually known as the Soret effect (or sometimes the Ludwig–Soret effect). In gas mixtures, the same thermodynamic phenomenon has often been called thermodiffusion and was predicted theoretically using the kinetic theory of gases (Chapman, 1916; Enskog, 1911) before the first experimental confirmation (Chapman and Dootson, 1917). In essence, in the presence of a steady-state temperature gradient, there is a preferential sorting of the molecules, with lighter molecules “diffusing” towards the hotter end of the gradient in the gas mixture. In air, which can be thought of as a mixture of dry air (equivalent molecular mass ≈ 29 g mol−1) and water vapour (molecular mass ≈ 18 g mol−1), the (lighter) water vapour molecules will tend to “diffuse” from colder to hotter regions. Hence, when an evaporating surface is colder than the adjacent air, we anticipate an additional mass flux due to the temperature gradient. Similarly, when the evaporating surface is hotter than the adjacent air, we anticipate a reduction in the mass flux via the same phenomenon. For the sake of brevity, we refer to this thermal phenomenon as the Soret effect.
In the first half of the 20th century, there was extensive interest in the Soret effect in gases because a comparison of the experimental results with theoretical calculations was routinely used to investigate the nature of the molecular collisions. A comprehensive foundation text on the topic is available (Grew and Ibbs, 1952). In this paper, we make use of experimental measurements of the Soret effect in gas mixtures to evaluate the magnitude of this thermal effect on open-water evaporation relative to the traditional concentration-based (“Fickian”) approach.
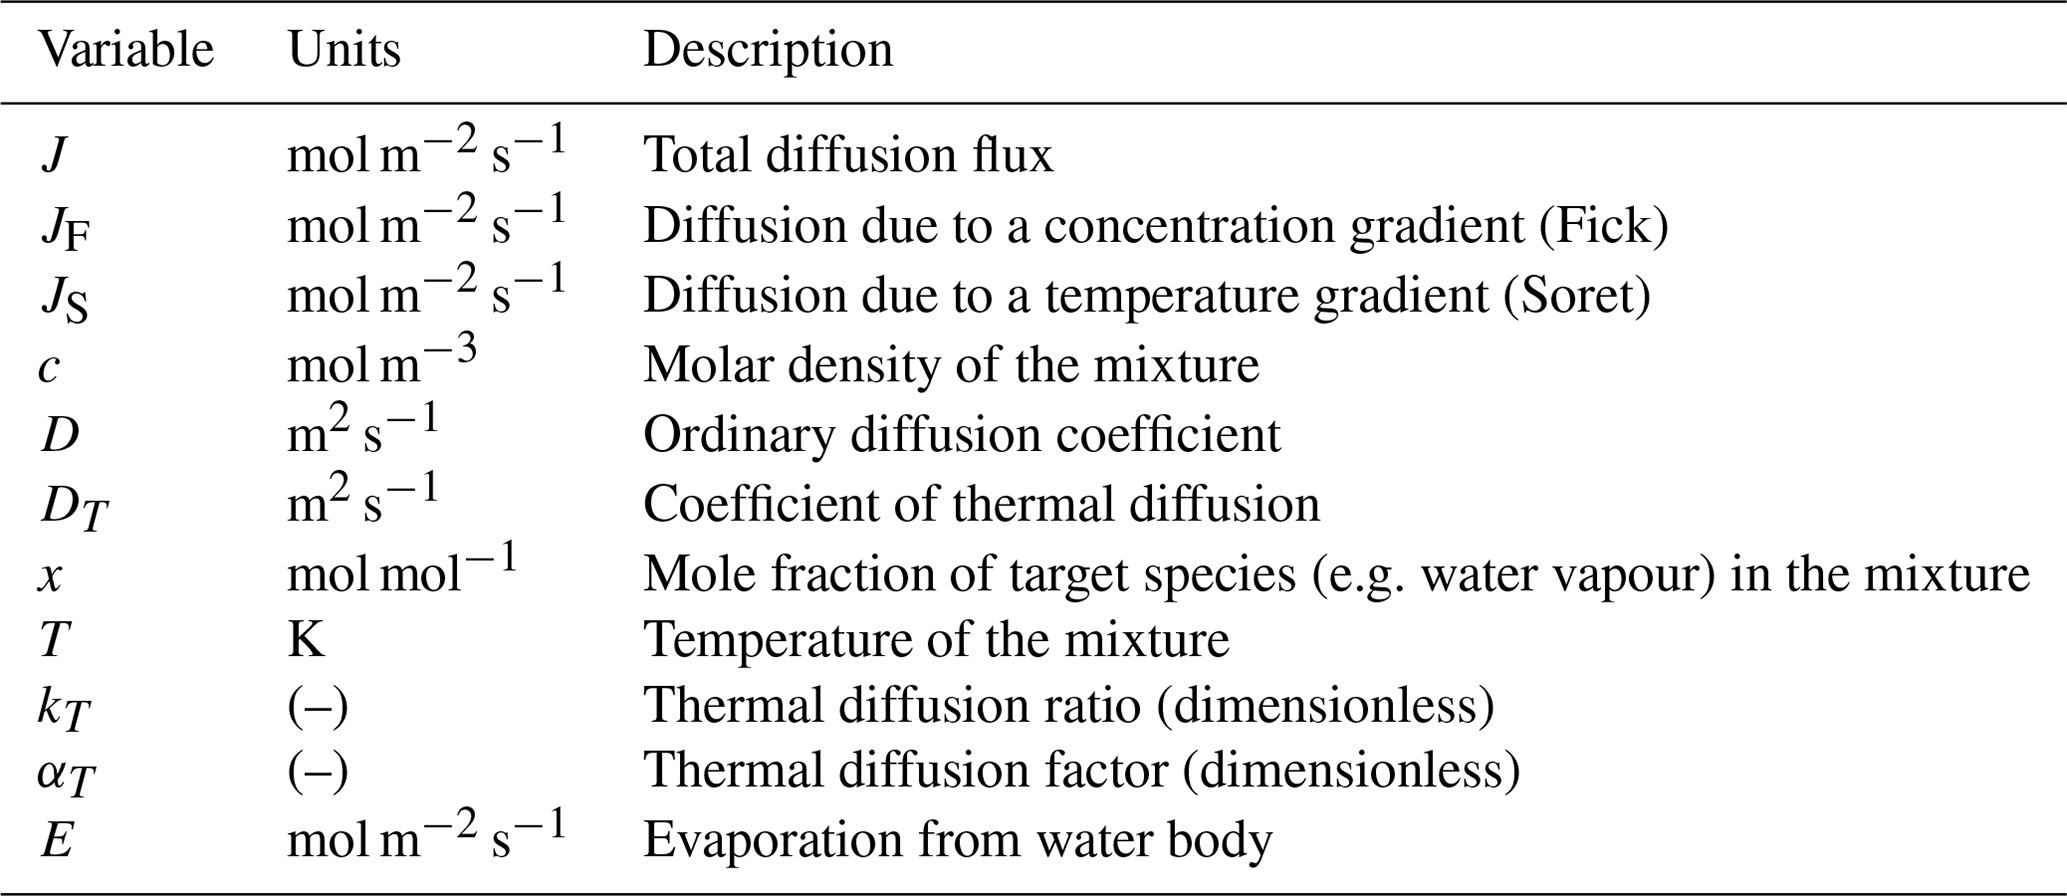
Traditional thermodiffusion experiments use a binary gas mixture in a closed system where the total diffusive flux J (mol m−2 s−1) of the target species is the sum of two terms. The first term is due to a concentration gradient (denoted by JF to represent Fick's law), and the second is due to a temperature gradient (denoted by JS to represent the Soret effect),
and is formally given by (Grew and Ibbs, 1952)
where c (mol m−3) is the molar density of the mixture, D (m2 s−1) is the ordinary (“Fickian”) diffusion coefficient, and x (mol mol−1) is the mole fraction of the species of interest. DT (m2 s−1) is known as the coefficient of thermal diffusion, and T (K) is the mixture temperature. Note that, in this formulation, the molar- and thermal-based diffusion coefficients have the same (classical) units for diffusivity (m2 s−1). We further note that, in the recent literature, it is common to define the “driving force” of thermodiffusion using ∇T (e.g. Ortiz de Zárate, 2019; Platten, 2006; Rahman and Saghir, 2014) instead of ∇(ln T), as used in the original Enskog–Chapman formulation based on the kinetic theory of gases. As a consequence, we note that, in the above-cited modern literature, the thermodiffusion coefficient has a different physical meaning (and different units) from that in the original theory. Here we follow the original literature as per Eq. (1) (Chapman and Cowling, 1939; Grew and Ibbs, 1952) because nearly all of the key experimental work was completed before 1960 and was based on the classical formulation that uses ∇(ln T) as the “driving force”. In this approach, we can make direct use of extensive (translated Russian) thermodynamic tables based on pre-1960 experiments (Vargaftik, 1983) and of many useful graphical and tabulated summaries in the foundation textbook on the topic (Grew and Ibbs, 1952).
Thermodiffusion depends on the bulk composition of the mixture. For example, the obvious limiting conditions are that DT must equal zero when x equals either zero or 1, since there can be no identifiable thermodiffusion in a pure substance. The classical approach is to define a dimensionless thermal diffusion ratio kT (Grew and Ibbs, 1952),
The dependence on bulk composition is incorporated by expressing kT as per Grew and Ibbs (1952),
where αT is the dimensionless thermal diffusion factor. The (quadratic in x) form of Eq. (3) is the simplest that captures the requisite limiting conditions (i.e. kT=0 when x=0 or 1). Combining Eqs. (1)–(3), we have
The most extensive database on thermodiffusion in gases that we have been able to locate includes some 12 pages of summarized experimental data in a set of (translated Russian) thermodynamic tables (Vargaftik, 1983, pp. 654–665) that document experimental estimates of kT and x for numerous binary gas mixtures. In addition, there are useful experimental data (αT) for a subset of the same binary gas mixtures in the foundation textbook on the topic (Grew and Ibbs, 1952). Surprisingly, neither of these extensive data sources lists a single experiment involving water vapour, and we have not been able to locate an experiment involving water vapour elsewhere in the scientific literature. Instead, as described below, we initially use experimental data for gas mixtures that have very similar macroscopic properties to infer the appropriate value of αT for the H2O–dry air mixture of primary interest.
Foundation work by Chapman established that the molecular masses of the mixture components only influence the thermal diffusion factor by their ratios (Chapman, 1940). The two macroscopic (dimensionless) variables traditionally used to collate the various theoretical/numerical results are known as the proportionate mass difference M ((m1–m2)(m1+m2), where m1 is the molecular mass of the heavier component) and the proportionate diameter difference Σ ((σ1–σ2)(σ1+σ2), where σ1 is the diameter of the heavier component) defined by the collision diameters (σ) of the mixture components (Chapman, 1940; Grew and Ibbs, 1952). In general, the thermal diffusion factor αT increases with M and Σ but is much more sensitive to M than to Σ (Grew and Ibbs, 1952, Fig. 7, p. 29). The values of M and Σ for three binary gas mixtures (N2–CO2, N2–N2O, H2–CO2) for which we have extensive experimental data (Vargaftik, 1983) are listed in Table 2 along with relevant values for an H2O–dry air mixture for which we have no experimental data. We note that the values of M and Σ for the H2O–dry air mixture are more or less the same as those for the two N2-based mixtures.
Table 2Dimensionless variables (M, Σ; see main text) for four binary gas mixtures. Calculations for Σ use the following values for the collision diameter: m, m, m, m, m. These values have been calculated using an empirical formula dependent on the molecular mass (Wang and Frenklach, 1994; see their Eq. 6).
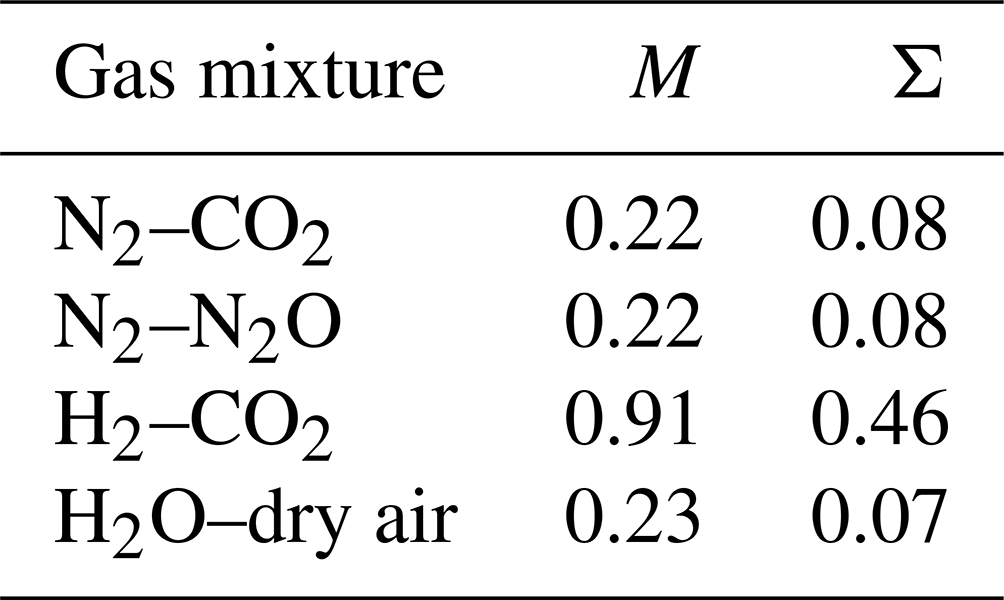
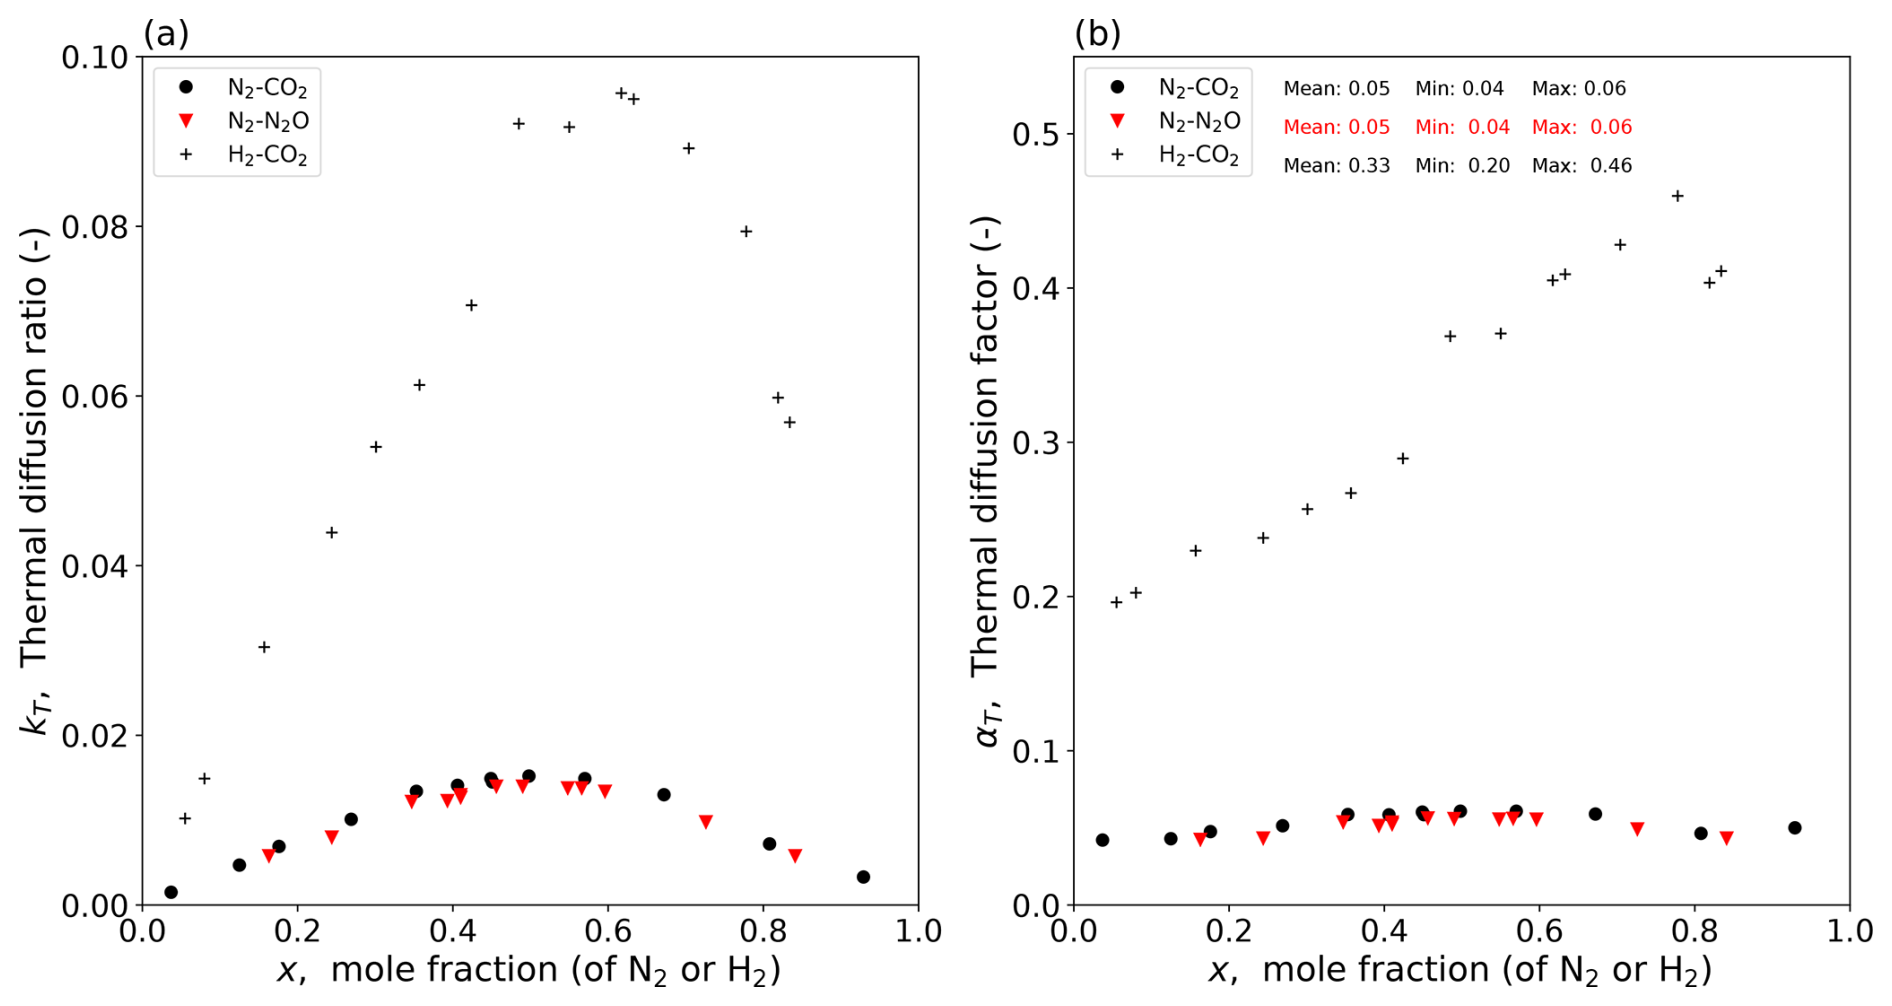
Figure 1Experimental data for three binary gas mixtures at a mean T of 328 K (Vargaftik, 1983, p. 661). Composition dependence of (a) the thermal diffusion ratio (kT) and (b) the thermal diffusion factor (αT; calculated per Eq. 3).
The experimental data for the three binary gas mixtures are shown in Fig. 1. The experimental results highlight the strong dependence of kT on the bulk mixture composition (Fig. 1a). With data for kT and the mole fraction (of N2 and H2) available in the tables, we calculate the dimensionless thermal diffusion factor αT for all three gas mixtures (Fig. 1b). The results show that the experimental values of αT for the two N2-based gas mixtures are more or less the same (mean ≈ 0.05) (Fig. 1b). The experimental values of αT summarized by Grew and Ibbs (1952, p. 130) for the N2-based mixtures are consistent with those given here (Fig. 1b). In contrast, the experimental values of αT for the H2–CO2 mixture are much larger, as expected based on the much larger value for M (Grew and Ibbs, 1952; see their Fig. 8 on p. 30). We know by experiment that αT usually increases slightly with T, and our empirical estimates of αT are for a T of 328 K (Fig. 1). We can use the empirical equation of Youssef et al. (1965, their Eq. 7) for the N2–CO2 mixture to correct the value of αT back to a T of 300 K, and, doing that, we find a value of 0.048. In the context of the magnitude of the Soret effect relative to concentration-dependent diffusion, we show below that it is not necessary to consider the slight T dependence because the Soret effect is already relatively small. This result suggests that a value of 0.05 for the thermal diffusion factor would be a useful starting point for the H2O–dry air mixture.
The thermodynamic tables used above (Vargaftik, 1983) list kT as a function of x at a given T. An alternative approach to estimate αT is to use an empirical correlation based on the proportionate mass difference M. For that, we used a tabular summary of αT based on 113 individual thermodiffusion experiments involving 39 different binary gas mixtures (Grew and Ibbs, 1952, their Table VA on pp. 128–130). The resulting empirical equation was αT≈0.38M (R2=0.92, n=113; see Fig. A1 in Appendix A) and confirmed the strong dependence on M noted in earlier works (Chapman, 1940). With that equation, we predict αT≈0.09 for the H2O–dry air mixture. This is a nearly a factor of 2 higher than our earlier estimate (αT≈0.05) derived from individual experiments using two N2-based gas mixtures. Here we follow a conservative approach and adopt the larger value as suitable for the H2O–dry air mixture.
We use that value (i.e. αT=0.09) in the next section to evaluate the magnitude of the Soret effect relative to the effect of concentration-dependent diffusion using a simple example.
We begin by rewriting Eq. (4) with the adopted value for αT (0.09) for the H2O–dry air mixture, and we follow the typical hydrologic sign convention (diffusion is positive upwards from the liquid surface) with the total diffusive flux of water vapour given by
where xs(Ts) is the (saturated) mole fraction of water vapour at the evaporating surface of temperature Ts, xa is the mole fraction of water vapour in air with a temperature of Ta, is the mean mole fraction () of water vapour over the diffusive pathway of thickness Δz, and ((Ts+Ta)/2) is the mean T over the same pathway. Note that we will have a positive Soret effect when Ts<Ta. In writing Eq. (5), we follow the standard threshold model for the boundary layer, with the concentration and temperature both assumed to follow a linear profile from the surface to the top of the boundary layer at a distance of Δz (∼ 1–5 mm depending primarily on wind speed) above the liquid surface (Lim et al., 2012; their Fig. 1).
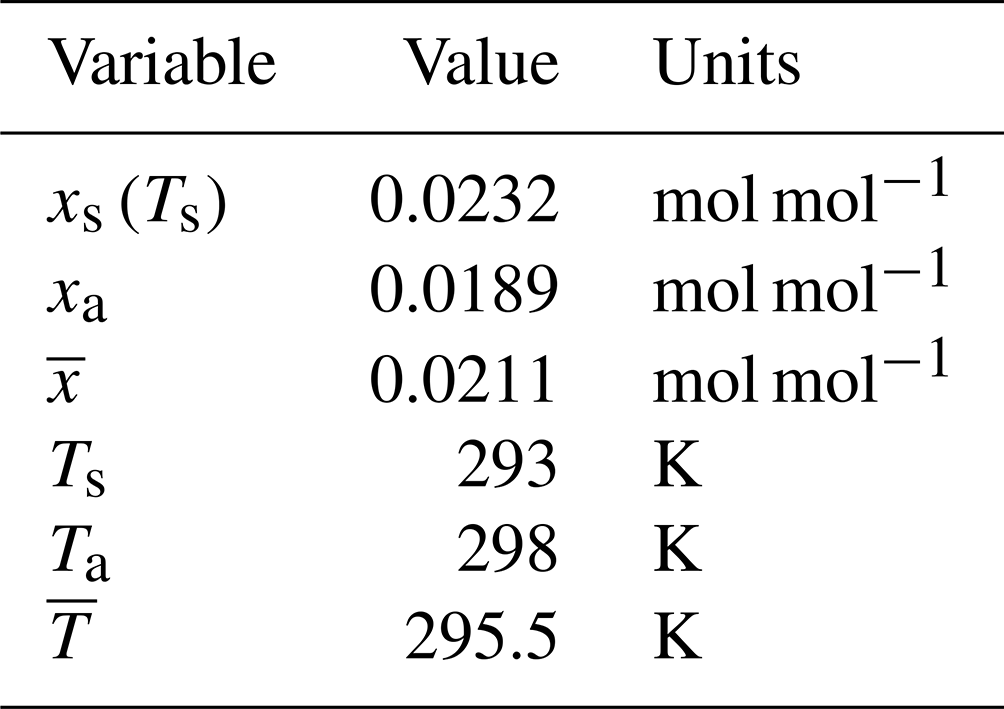
To take a typical numerical example, assume air at 298 K and a relative humidity of 60 % with a total air pressure of 1 bar, where the surface T is initially 5 K cooler than the air. With those data (Table 3), we have
which equals
In this numerical example, concentration-dependent mass diffusion contributes 99.3 % of the total diffusion flux, with the Soret effect contributing 0.7 % to the total. We could enhance the percentage due to the Soret effect by holding the air properties constant while decreasing the surface T until, for example, xs(Ts) equals xa. In that limit, the mole fraction gradient would become zero and the Soret effect would then be 100 % of the total flux. However, the flux due to the Soret effect remains small, as we show below.
Table 3Data for numerical example: standard air at 298 K and rel. humidity = 60 % with Ts=293 K.
Having developed an initial sense for the typical magnitude of the Soret effect, we use experimental data in the next section to evaluate the relative Soret effect over a much larger range of Earth surface conditions.
To make a more comprehensive assessment of the magnitude of the Soret effect, we use a recently published experimental database on evaporation (Roderick et al., 2023a). The database includes 70 individual evaporation experiments performed under carefully controlled laboratory conditions with E measured using an accurate balance. The experiments encompass a broad range of environmental conditions (Ta range from 15 to 45 °C, relative humidity range from 20 % to 78 %, wind speed (U) range from 0.5 to 4 m s−1). One important feature of the experiments is that the air properties (T, humidity, wind) were held constant during each individual evaporation experiment, which meant that the water bath from which evaporation occurred was a very good approximation to the classical theoretical wet bulb thermometer. As a consequence, the water bath was generally colder than the adjacent air, which would tend to maximize the (positive) contribution of the Soret effect, and these data are ideal for assessing the relative importance of the Soret effect under typical conditions at the Earth's surface.
Traditionally, hydrologists have assumed that the total evaporative flux from the surface to the air was due to diffusion alone, but the broader engineering literature has long formulated the problem slightly differently. In particular, while water vapour is diffusing along a (concentration and/or temperature) gradient from the surface to the air, there must be a counter-diffusion of dry air in the opposite direction. The liquid surface is highly permeable to water, but, to a reasonable approximation (i.e. ignore Henry's law solubility), it is nearly impenetrable to the dry air. With all else equal, the dry air should accumulate at the liquid–air interface via the diffusion flux, but that is not observed. Instead, by an argument originally due to Stefan, there must be a compensating upwards flow that exactly balances the downward diffusion of dry air, leaving the overall velocity of the dry air in the boundary layer to be near zero. This compensating advective flux is widely recognized in the broader engineering literature (e.g. Kreith et al., 1999; Cussler, 2009) but has generally been ignored in hydrology and other closely related climate-based fields (Kowalski, 2017). Here we incorporate this additional advective contribution (EA) and express the total surface–air evaporative mass flux (E) as
with the additional advective flux defined by Kreith et al. (1999) and Cussler (2009):
The derivation of Eqs. (7)–(8) is fully described in Appendix B. Hence, the total evaporative flux is given by
To split the observed evaporation into the separate components, we use Eq. (9) to first calculate the value of Δz that gave the observed evaporation with the concentration-dependent diffusion coefficient for water vapour in air calculated at the mean temperature. The (calculated) values of the boundary layer thickness (see Fig. C1a in Appendix C) are typically in the range of 1–5 mm and decline with wind speed as expected (Lim et al., 2012). Furthermore, in all but 1 of the 70 experiments, the evaporating liquid water surface was colder than the adjacent air: by up to ∼ 17 °C in a few instances (Fig. C1b in Appendix C). Typically, the evaporating surface was ∼ 10 °C colder than the adjacent air, and we reiterate that these conditions will maximize the (positive) contribution of the Soret effect to the overall evaporative flux. The results of the flux partitioning are summarized in Fig. 2.
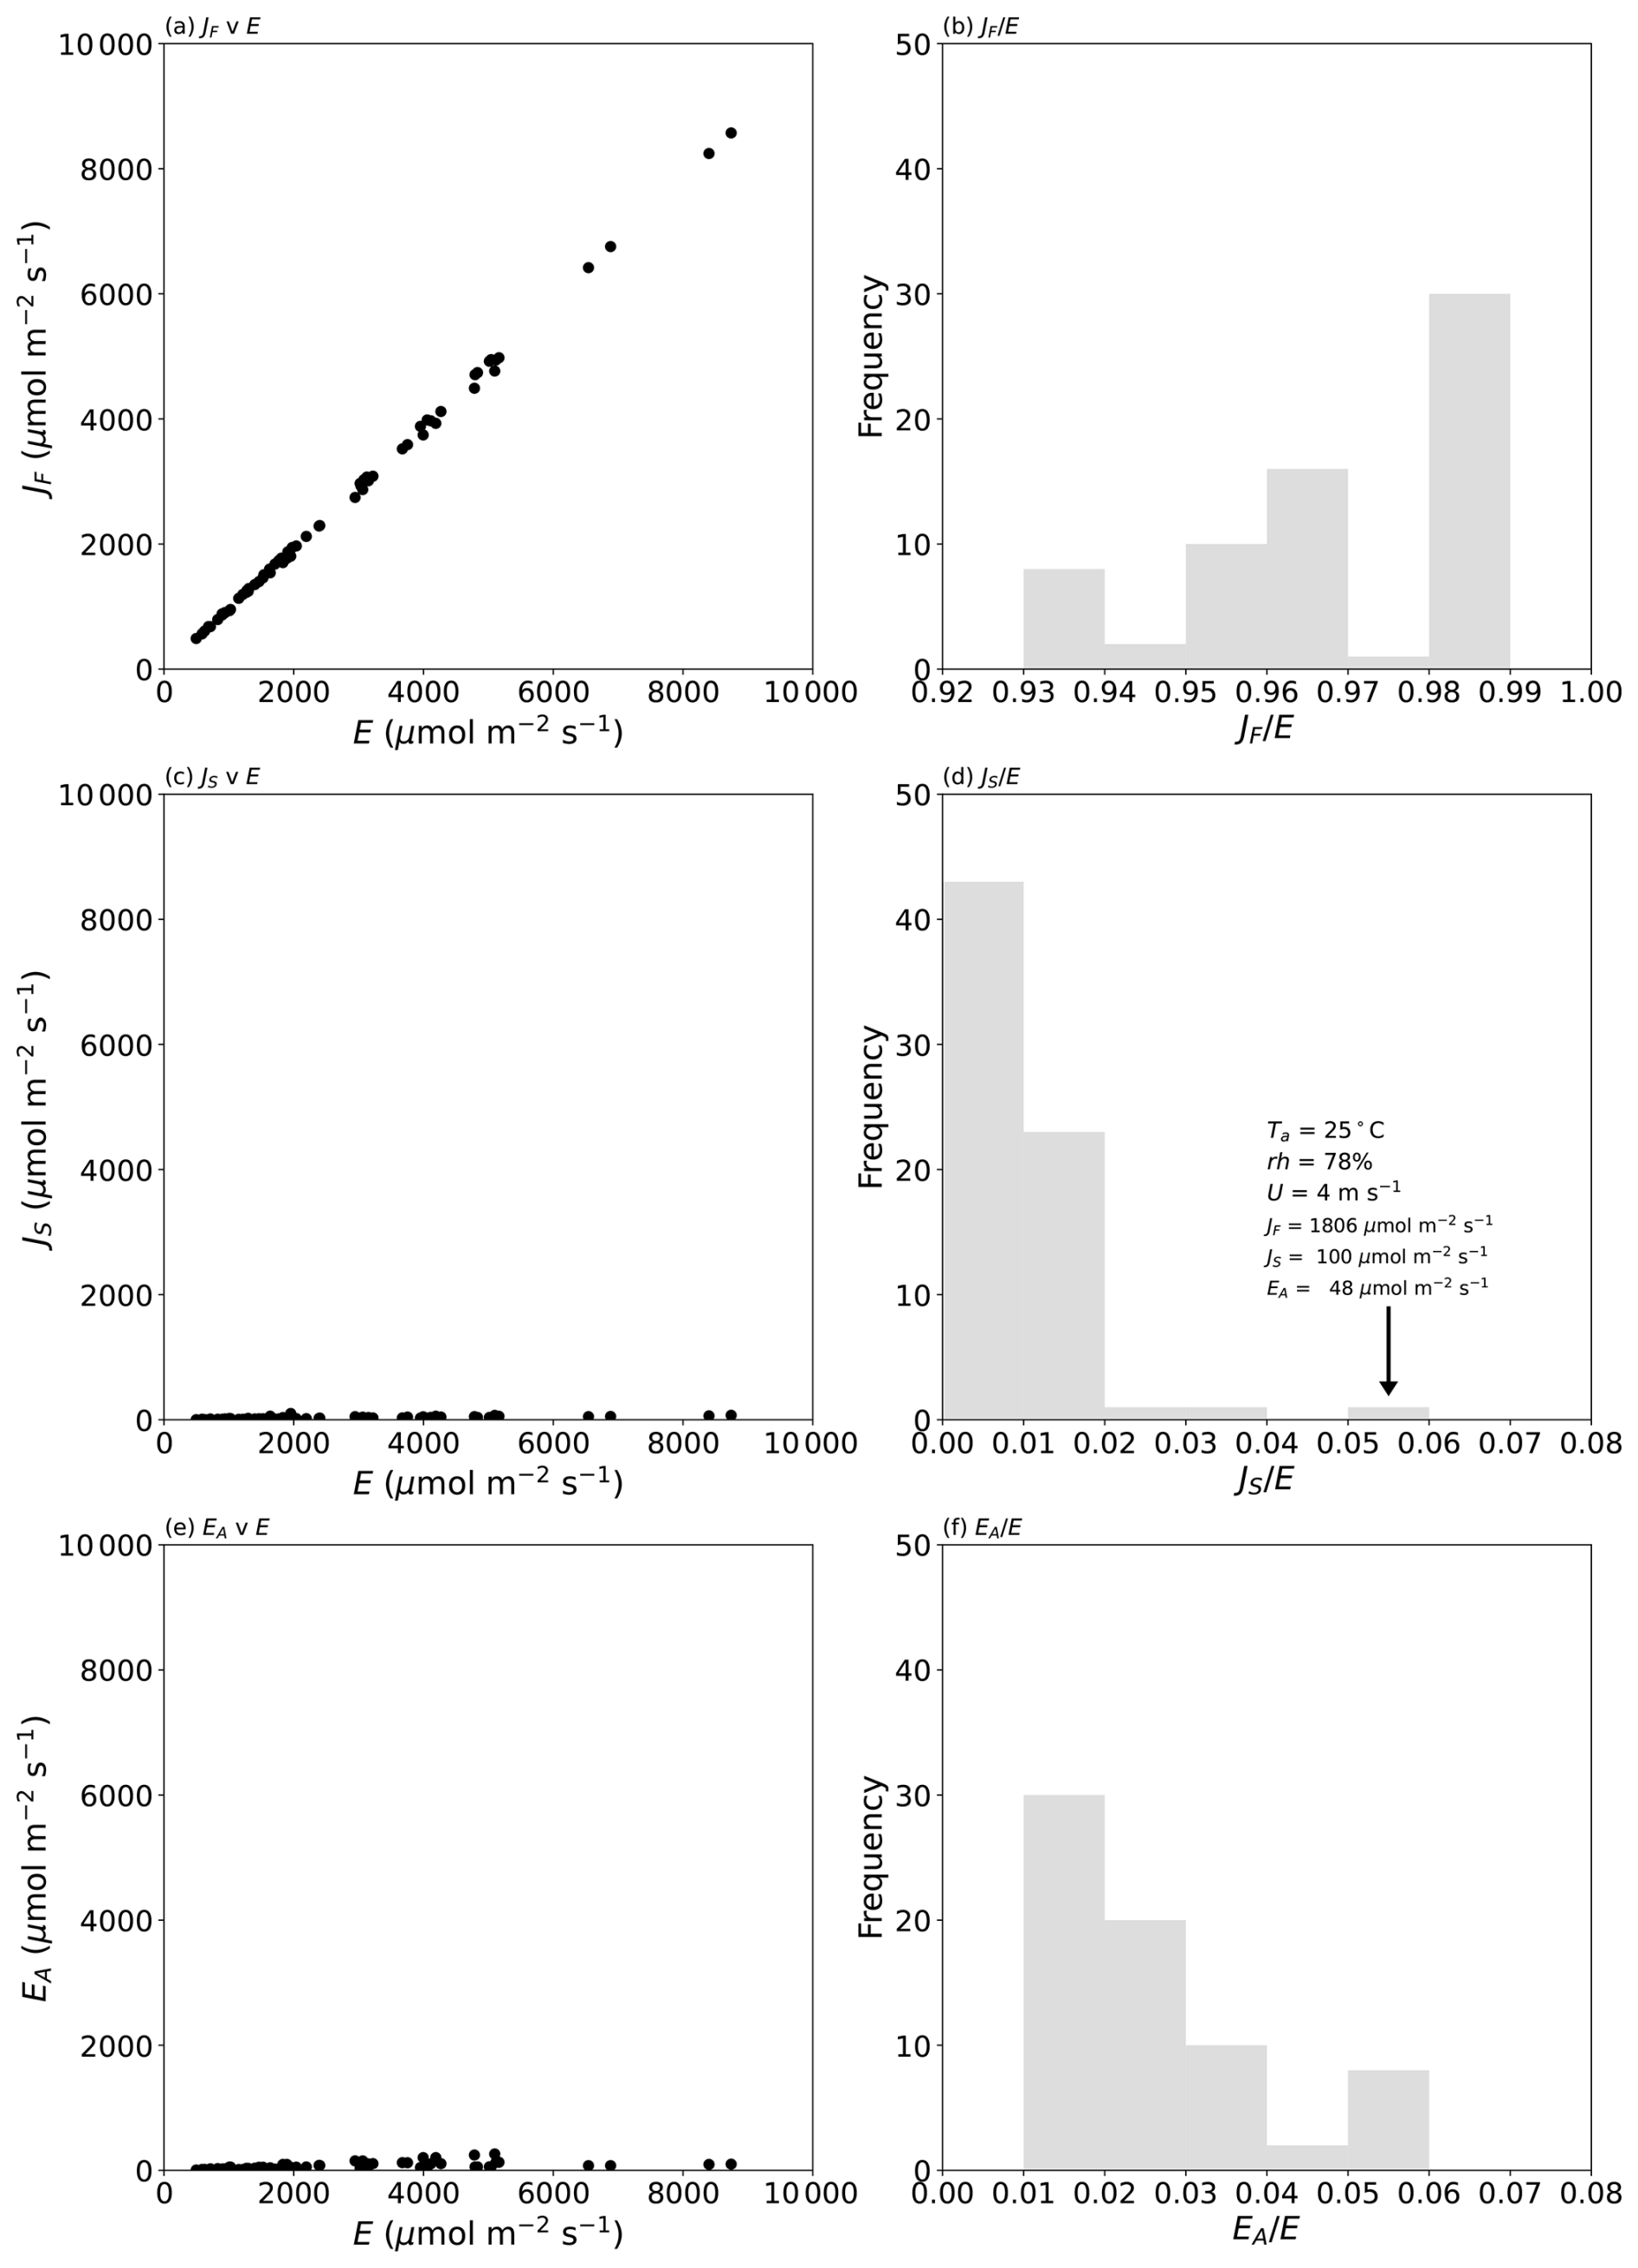
Figure 2Partitioning the measured evaporative flux in 70 laboratory experiments into separate diffusive and advective components. The left column shows the evaporation due to (a) the concentration gradient (JF), (c) the temperature gradient (JS), and (e) the advective flow (EA). The right column (b, d, f) depicts histograms of the relative fractions of each component. The text in panel (d) denotes the air properties and fluxes during that experiment. See Fig. D1 (Appendix D) for more detail on panels (c) and (e).
The results confirm the total evaporative flux to be dominated by Fickian diffusion (>93 % of the total in all cases; Fig. 2b). The next most important term is the advective component, which scales directly with the mole fraction of water in the air (Eq. 8). In our experiments, the advective component was responsible for as much as 5 % of the total flux (Fig. 2f) in one extreme set of laboratory experiments (Ta at 45 °C and relative humidity ∼ 52 %), and such conditions occasionally occur in the current climate (e.g. Schär, 2016). More generally, the advective component would regularly represent up to ∼ 4 % of the total evaporative flux in moist tropical regions in the current climate but would be smaller in colder climates (Shakespeare and Roderick, 2024). We conclude that the experimental data for the advective flux (Fig. 2f) are indicative of the range of real-world conditions in the current climate.
The impact of the Soret effect was typically smaller again and was less than 2 % of the total evaporative flux in most (67 of 70) experiments (Fig. 2d). The maximum relative Soret effect was 5 % in a sole experiment (see text label in Fig. 2d). That experiment was conducted under very high relative humidity (78 %; Fig. 2d), which reduced the total evaporation (to 1954 µmol m−2 s−1; see Fig. 2d). The total evaporation in that instance is actually a small flux (cf. Fig. 2a), and this circumstance will always enhance the relative Soret effect. To see that more clearly, we note that the relative Soret effect () can be closely approximated by the ratio . Using Eqs. (7) and (9) we have, for that ratio,
For typical Earth surface conditions, we have . Using that approximation and replacing the mean values by the relevant sums, we have a more convenient expression as follows:
With this form, we note that the unfamiliar relative Soret effect will actually be familiar to many readers from hydrology and from the broader Earth science communities as nothing more than a rescaled Bowen ratio (). By definition, the relative Soret effect increases with the surface-to-air T difference. By inspection of Eq. (11), it is also clear that the relative Soret effect will tend to be higher as (i) the T increases, since the sum (xs(Ts)+xa) also tends to increase in warmer climates, and as (ii) the surface-to-air mole fraction difference tends to zero, i.e. as .
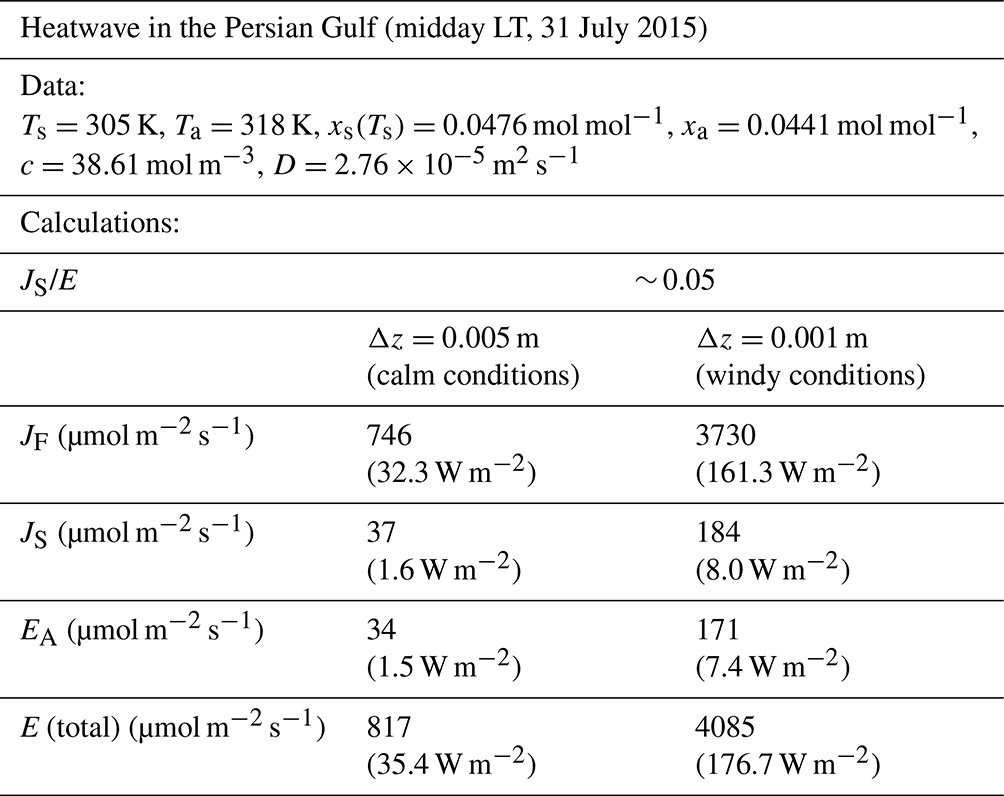
To test whether our experimental data were indicative of the entire range of possibilities, we conducted a broad literature survey to identify extreme circumstances under which we might expect a high relative and absolute Soret effect. To that end, we identified the 2015 Persian Gulf heatwave (Schär, 2016) as an event with the key attributes (warm water, large surface-to-air T difference). At midday local time (LT) on 31 July 2015, the observed conditions (Ta=45 °C, relative humidity ∼ 45 %, Ts=32 °C) were the most extreme (Schär, 2016), and we estimate that the Soret effect would have accounted for about 5 % of the total evaporative flux at this time (Table E1, Appendix E). The magnitude of the fluxes would vary primarily with wind speed (i.e. with the boundary layer thickness, Δz), and, assuming windy conditions, we estimate the Soret flux was around 184 µmol m−2 s−1 (latent heat flux equivalent = 8.0 W m−2), while the total evaporative flux was 4085 µmol m−2 s−1 (176.7 W m−2) (Table E1, Appendix E). Despite the fact that the relative Soret effect was ∼ 5 %, the absolute value of the Soret flux (8 W m−2 latent heat flux equivalent) is actually relatively small in a hydroclimatic context. Furthermore, heatwave conditions are often accompanied by calm conditions, and, if that were the case, the Soret flux would be much smaller (∼ 37 µmol m−2 s−1, 1.6 W m−2 latent heat flux equivalent), with the total evaporative flux declining to ∼ 817 µmol m−2 s−1 (35.4 W m−2) (Table E1, Appendix E). This extreme example emphasizes the point that the relative Soret effect will usually increase as the total flux declines.
These data beg the question of whether the flux due to the Soret effect would be routinely measurable. In our experiments, the evaporation was measured using an accurate balance under carefully controlled laboratory conditions, which enabled us to also estimate the error in each steady-state evaporation measurement. The maximum evaporation error in any single evaporation experiment was ∼ 60 µmol m−2 s−1 (latent heat flux equivalent is 2.6 W m−2) (Fig. 3). In contrast, the flux due to the Soret effect was in general slightly larger than the measurement error implying that it was resolvable in most of the 70 carefully controlled laboratory experiments (Fig. 3). The maximum flux due to the Soret effect reported here is ∼ 100 µmol m−2 s−1 (latent heat flux equivalent is 4.3 W m−2) for the same experiment discussed previously. Whether fluxes of that magnitude are important would depend on the circumstances, but they are unlikely to be a major problem given a typical measurement resolution for the latent heat flux of 10–20 W m−2 in most field-based programmes.
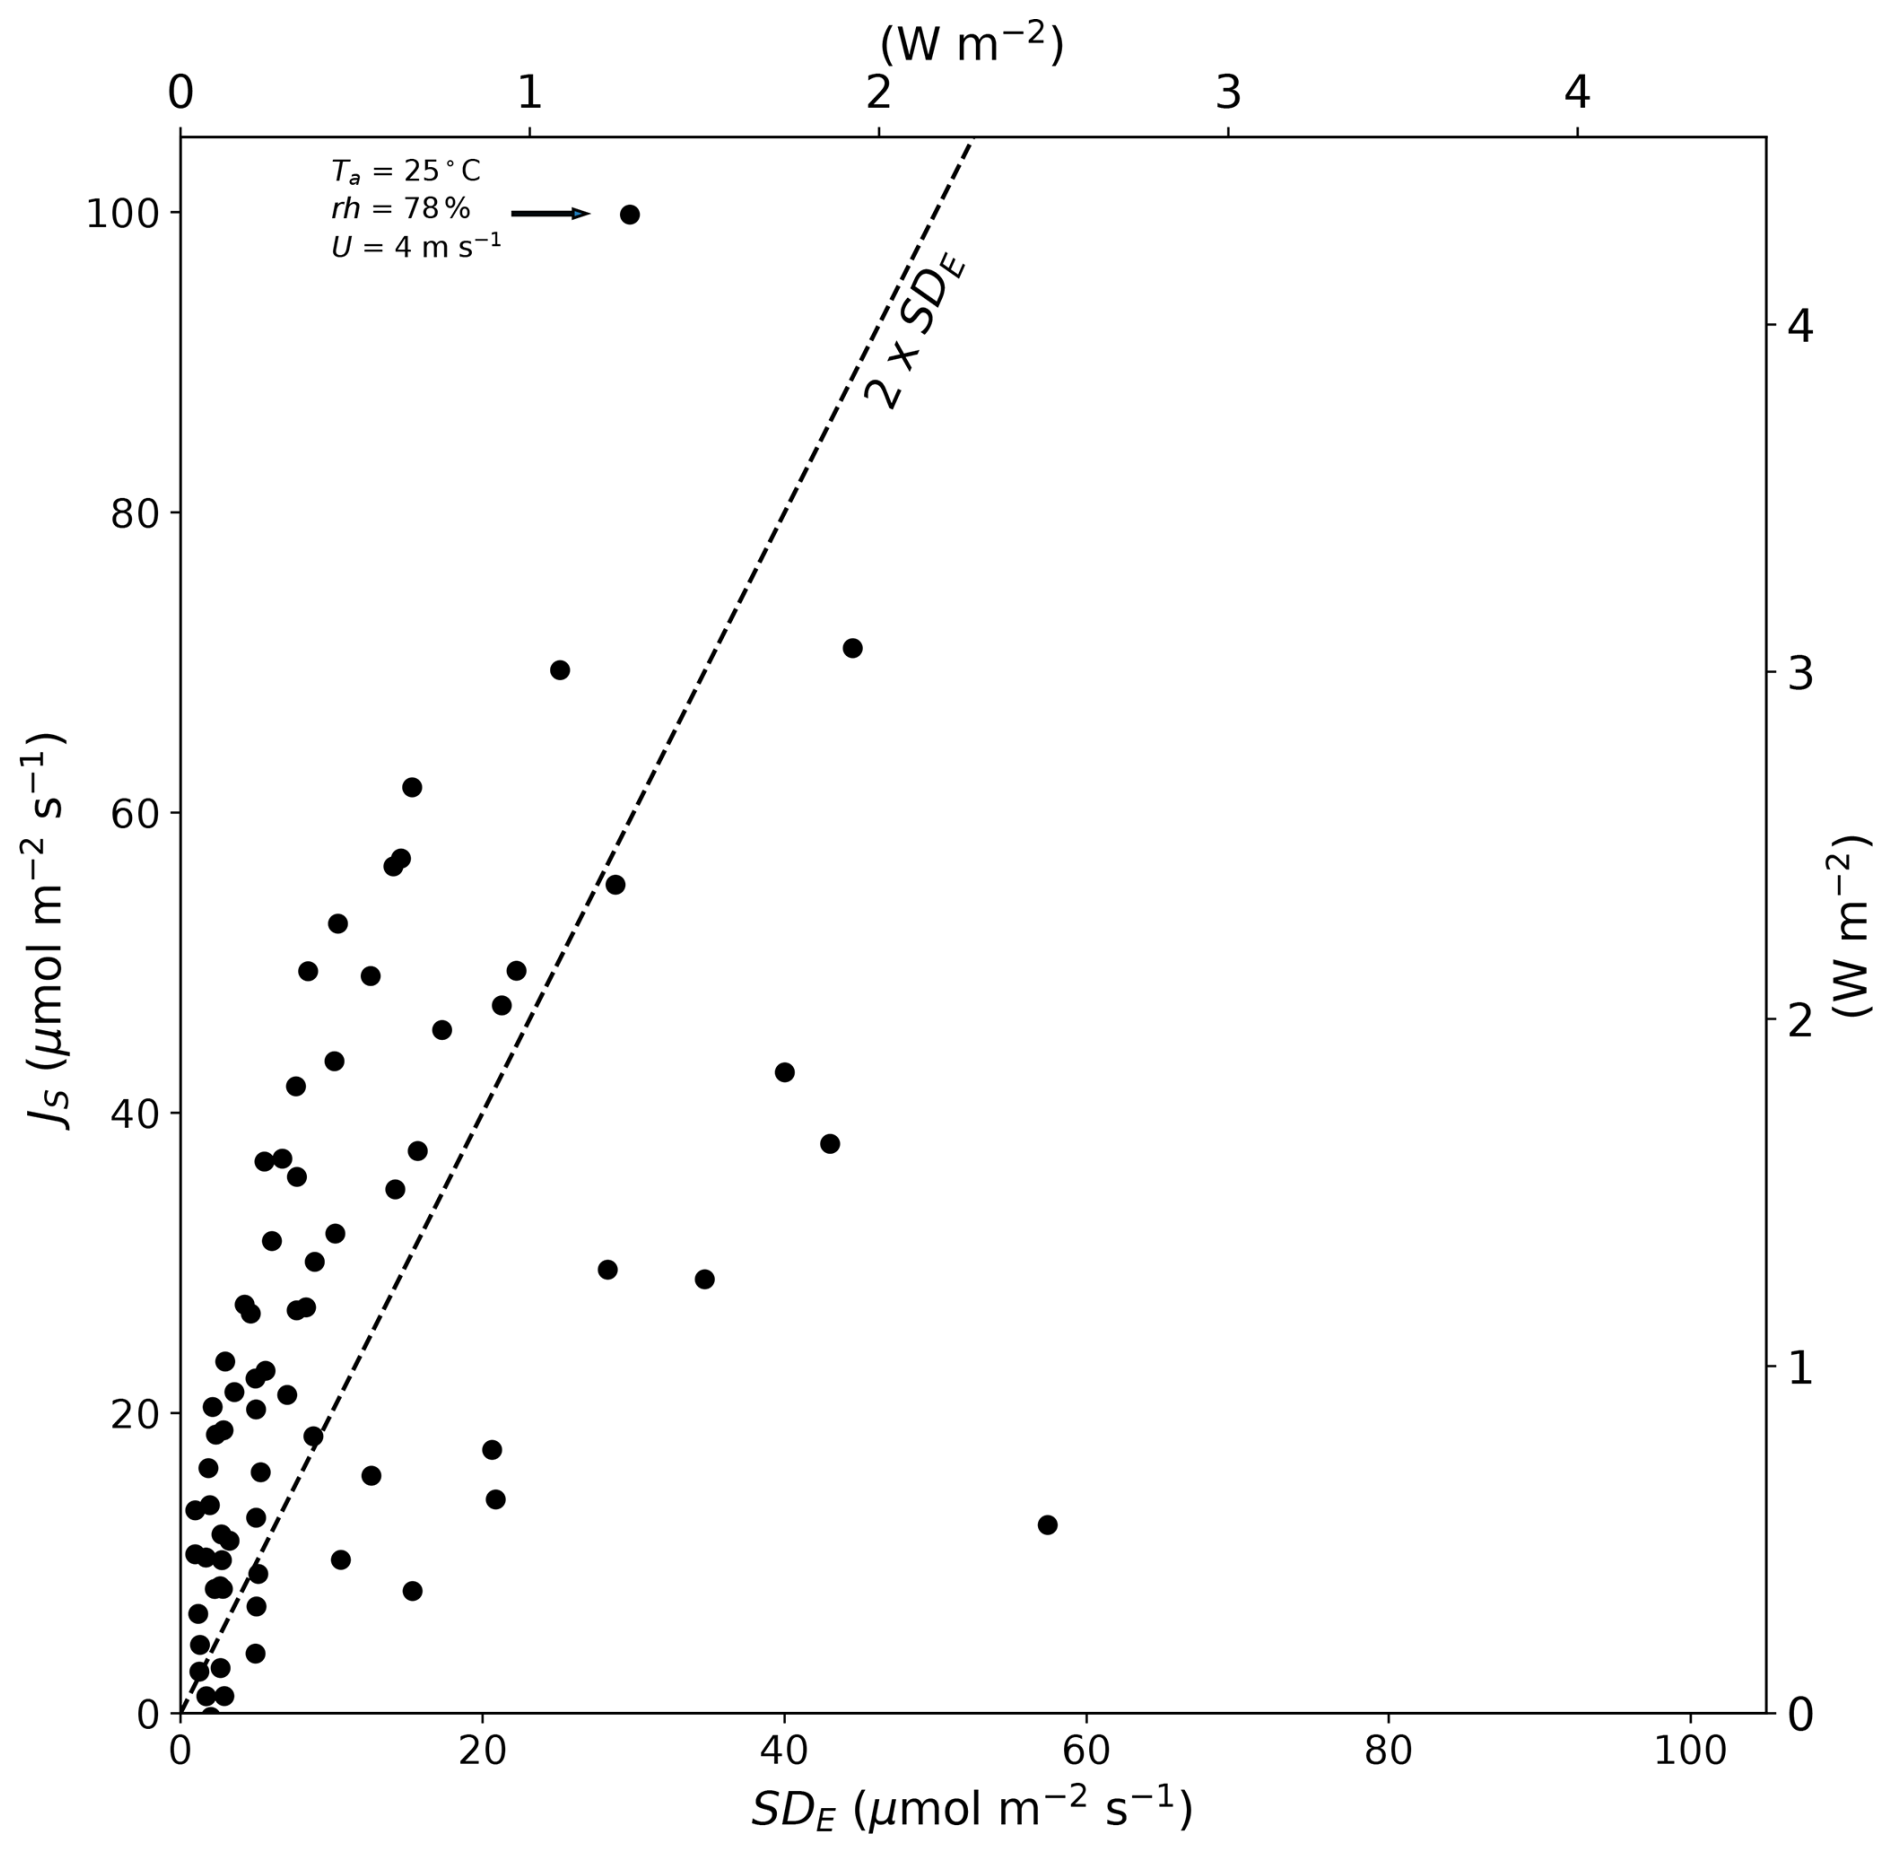
Figure 3Magnitude of the Soret effect (JS) compared to the standard deviation in the total evaporative flux (SDE) in 70 individual laboratory-controlled evaporation experiments. The dashed line denotes the 90 % confidence interval (2 × SDE). The text near the uppermost JS (∼ 100 µmol m−2 s−1) summarizes the air properties for that particular evaporation experiment. The latent heat flux equivalent (secondary x and y axes) assumes the latent heat of vaporization is 2.4 MJ kg−1.
The Soret effect is a real phenomenon and played a prominent role in the overall development of the kinetic theory of gases (Chapman and Cowling, 1939; Grew and Ibbs, 1952). However, we were unable to locate a single experiment involving water vapour, and instead we initially assumed that the thermal diffusion factor for an H2O–dry air mixture was the same as for other well-studied binary gas mixtures (N2–CO2, N2–N2O) (Fig. 1) having very similar relative differences in molecular mass between the components (Table 2). That experimentally based approach led to a numerical value of 0.05 for the thermal diffusion factor in an H2O–dry air mixture. We then augmented that by an analysis using data from 113 individual experiments (all completed before 1952) based on 39 different binary mixtures of gases, and the resulting correlation (Fig. A1) was used to estimate the thermal diffusion factor to be 0.09 for the same H2O–dry air mixture. We followed a conservative approach by adopting the larger value (αT∼0.09) in subsequent analysis, but we recognize that, in the absence of a specific H2O–dry air experiment, these values must be regarded as interim estimates.
Recent work by Griffani et al. (2024) also examined the impact of the Soret effect on evaporation (i.e. transpiration from plants) but used a numerical value of 0.5 for the (same) thermal diffusion factor. This is a factor of 5 larger than the value we adopted, and they predicted that the magnitude of the Soret effect was also typically larger by a factor of 5. This factor of 5 difference requires an explanation.
The Griffani et al. (2024) result is different for two reasons. Firstly, it was based on Landau's original theoretical derivation, which assumed a binary gas mixture having perfect elastic collisions where the molecular mass of the heavier molecule was assumed to be substantially larger than that of the lighter molecule (Lifshitz and Pitaevskii, 1981, p. 36). The latter assumption implies a value for the proportionate mass difference M of 1, which is much larger than the actual value for an H2O–dry air mixture (M=0.23; Table 2). Furthermore, the measured thermal diffusion factor in real gas mixtures is substantially less (by ∼ 20 %–70 %; see Table VA in Grew and Ibbs, 1952, pp. 128–130) than the theoretical calculation based on the perfectly elastic collision assumption. Hence, because of the underlying assumptions, the Griffani et al. (2024) estimate for the thermal diffusion factor is not relevant to an H2O–dry air mixture.
When the surface is colder than the air, the Soret effect predicts an additional evaporative flux, and the reverse holds when the surface is warmer than the air. We used existing experimental data to evaluate the magnitude of the Soret effect. In the experimental data, the evaporating surface was colder than the air, and our experimental assessment (Fig. 2) was restricted to a positive Soret effect. Our results using a thermal diffusion factor of 0.09 for the H2O–dry air mixture show that the Soret effect typically enhances the evaporative flux by up to 2 % (Fig. 2d), and this effect was small in an absolute sense (usually less than 60 µmol m−2 s−1, <2.6 W m−2 latent heat flux equivalent) (Fig. 3). Using the most extreme example we could identify (2015 Persian Gulf Heatwave, Ta=45 °C, relative humidity ∼ 45 %, Ts=32 °C), we found that the relative Soret effect in that instance was ∼ 5 % of the total evaporative flux, but, again, the absolute effect remained small (<184 µmol m−2 s−1, <8 W m−2 latent heat flux equivalent) (Table E1, Appendix E). In summary, when a liquid water surface is cooled relative to the air, the relative Soret effect increases but the total evaporative flux is reduced. Hence, it is important to also consider the absolute magnitude of the Soret flux. The alternate conditions are when the surface is warmer than the air. These conditions would lead to a negative Soret effect, thereby reducing the total evaporative flux, but the relative impact is likely to remain small under most conceivable conditions, since those same conditions will increase the total evaporative flux. To give an example, assume the same conditions as in Table 2 (Ta=298 K, relative humidity = 60 %), but we now increase the surface temperature to, say, 372 K (i.e. just below the boiling point). The result is that the Soret effect reduces the total flux by only 0.5 % and can safely be ignored. In summary, we anticipate the Soret effect to remain small in most typical circumstances (usually less than 60 µmol m−2 s−1, <2.6 W m−2 latent heat flux equivalent) (Fig. 3) but that it may become a factor of 2 or 3 larger under exceptional circumstances when the surface is much cooler than the air under very warm conditions. Whether those magnitudes are important will depend on the application, but, for most applications in hydrology, they can likely be ignored, as has been common practice for the last century.
We also assessed the importance of the (so-called Stefan) advective flux and note that this always enhances the diffusive flux in an apparently straightforward way (Kowalski, 2017) and is much simpler to implement compared to the Soret effect. On a molar basis, this flux scales directly with the overall mole fraction of water vapour and can be as large as 5 % of the total flux (Fig. 2f). Again, whether that is important will depend on the application, but there is no obvious reason to ignore it, since it can readily be calculated (Eq. 8).
Under typical environmental conditions, the Soret effect is also small in liquids. Despite that, there is current interest in evaluating whether the Soret effect can be used to desalinate water (Xu et al., 2024). That approach requires innovative engineering by recycling the treated stream multiple times to eventually separate the salt from the fresh water (Xu et al., 2024). Hence, despite the fact that the Soret effect is small, under typical environmental conditions, it may still have important future engineering applications.
We use tabulated experimental data (from 113 individual experiments) based on 39 different binary gas mixtures (Grew and Ibbs, 1952) to plot the thermal diffusion factor αT as a function of the proportionate mass difference M (Fig. A1). The variations at a given M (i.e. the apparent vertical lines) are due to (the sometimes very large) experimental variations in T imposed on the same binary gas mixture. The plot includes data over a total T range from 89 to 755 K, but restricting the analysis to a more relevant T range (260<T<360) did not materially alter the regression result (see Fig. A1 caption). The cluster near the origin is experiments involving isotopic mixtures. Two outliers have been highlighted, and both are from a single study that used binary gas mixtures incorporating radon gas, which had the largest molecular mass (≈ 222 g mol−1) of any substance in the experimental summary.
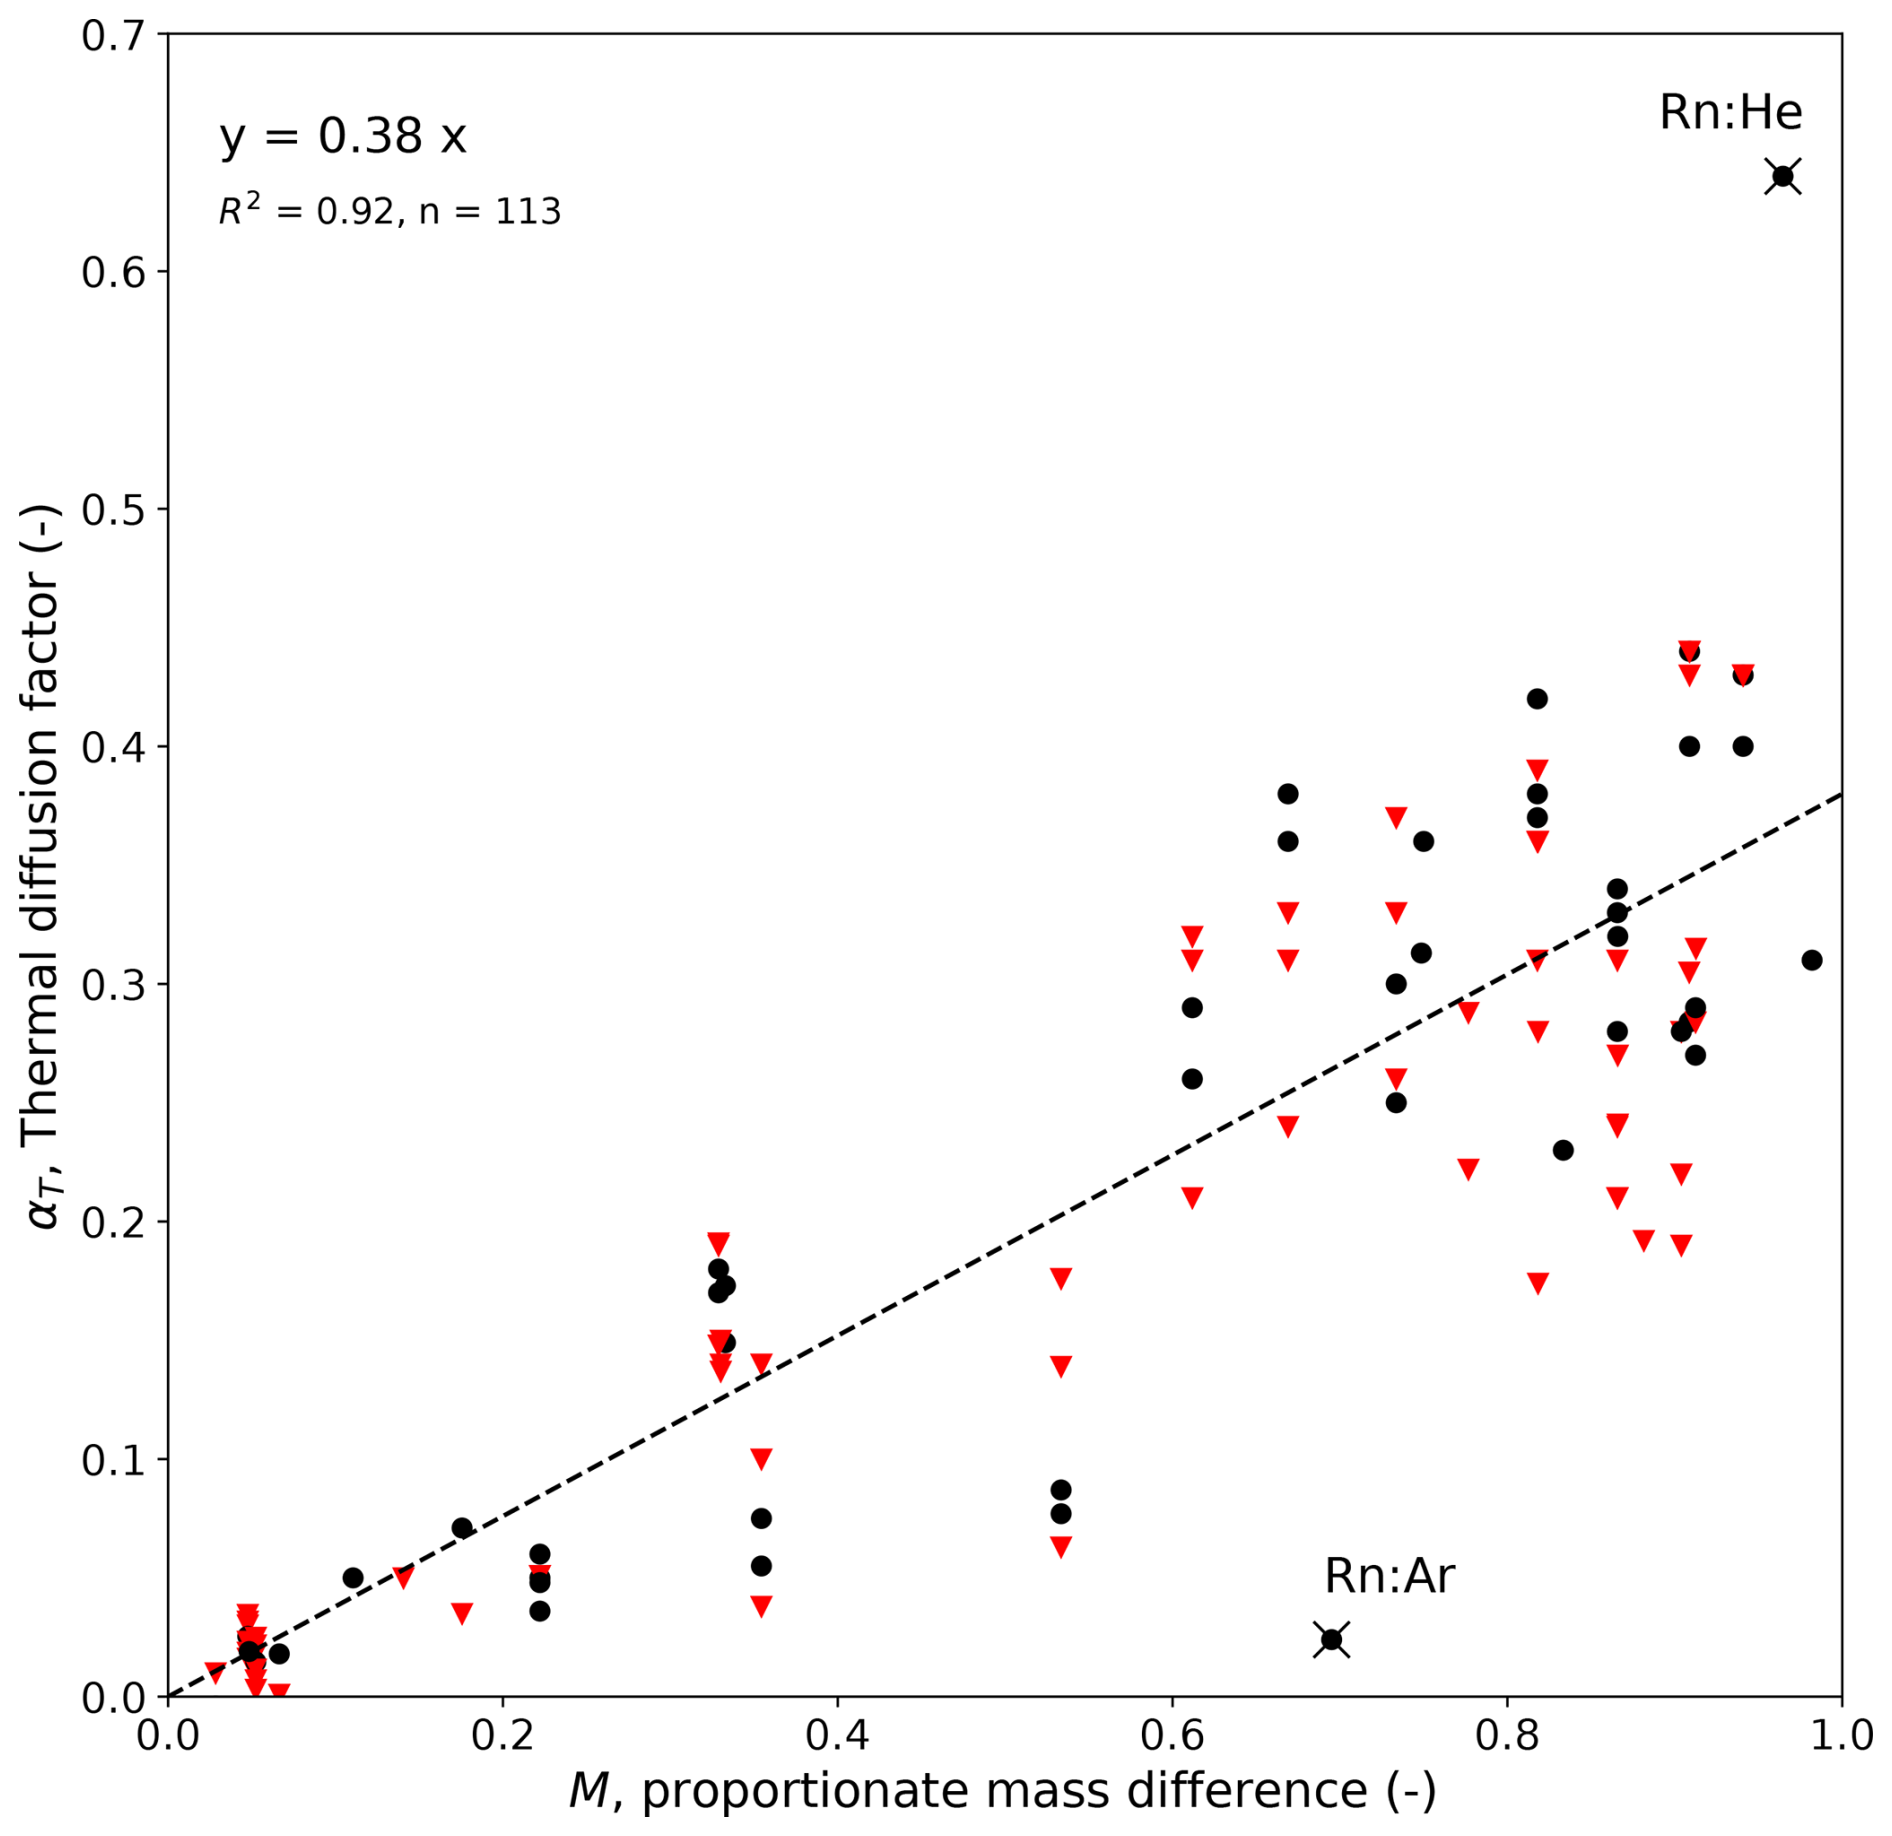
Figure A1Empirical dependence of αT on M based on experimental data from binary gas mixtures (Grew and Ibbs, 1952; their Table VA on pp. 128–130). The regression results use all available data (top-left text), with the black dots denoting individual experiments with mean T in the 260–360 K range (regression: y=0.39x, R2=0.91, n=47) and the remaining experiments (n=66) shown as red inverted triangles. The two outliers (×: Rn:Ar, Rn:He) are binary gas mixtures incorporating radon gas.
With reference to the main text, the (so-called Stefan) compensating flow implies that the total evaporative flux is the sum of (two) diffusive mass fluxes augmented by an advective mass flux (Kreith et al., 1999; Cussler, 2009),
An important point for evaporation from the Earth's surface is that the total mass flux is dominated by the mass flux of water vapour, from which it follows that E is also a very good approximation to the total liquid–air mass flux at the surface (Kowalski, 2017). To derive an expression for EA, we first note that (Kreith et al., 1999; Cussler, 2009)
where cw (mol m−3) is the molar concentration of water vapour in the air and vw (m s−1) is the velocity of the water vapour which is measured relative to the laboratory frame of reference. To split the total flux into separate components due to diffusion and advection, we specify a reference velocity (v∗, defined below) as follows (Kreith et al., 1999; Cussler, 2009):
The first term on the left denotes the flux due to diffusion, and the latter is the advective component. Hence, we have
and
Here we define the reference velocity as the molar-average velocity (also equal to the volume-average velocity assuming constant density), defined as (Kreith et al., 1999; Cussler, 2009)
where vd (m s−1) is the velocity of the dry air. The formulation adopted here (i.e. downward diffusion of dry air is perfectly compensated by an upwards advective flow) implies that vd is zero, and Eq. (B6) becomes
Combining that result with Eqs. (B2) and (B5), we have
Hence, Eq. (B1) can be rewritten as
In the engineering literature, the prefactor () in Eq. (B9) is often called a Stefan pre-factor or sometimes a Stefan adjustment, and this formulation is often described as the classic “diffusion through a stagnant gas film” problem (Kreith et al., 1999; Cussler, 2009). Importantly, this formulation works best with constant density and is best evaluated at the top of the boundary layer (i.e. a distance Δz above the liquid surface), where the air density is (typically assumed) reasonably constant thereafter. In our formulation, xa is the mole fraction of water at the top of the boundary layer, as appears in the main text (see Eq. 8).
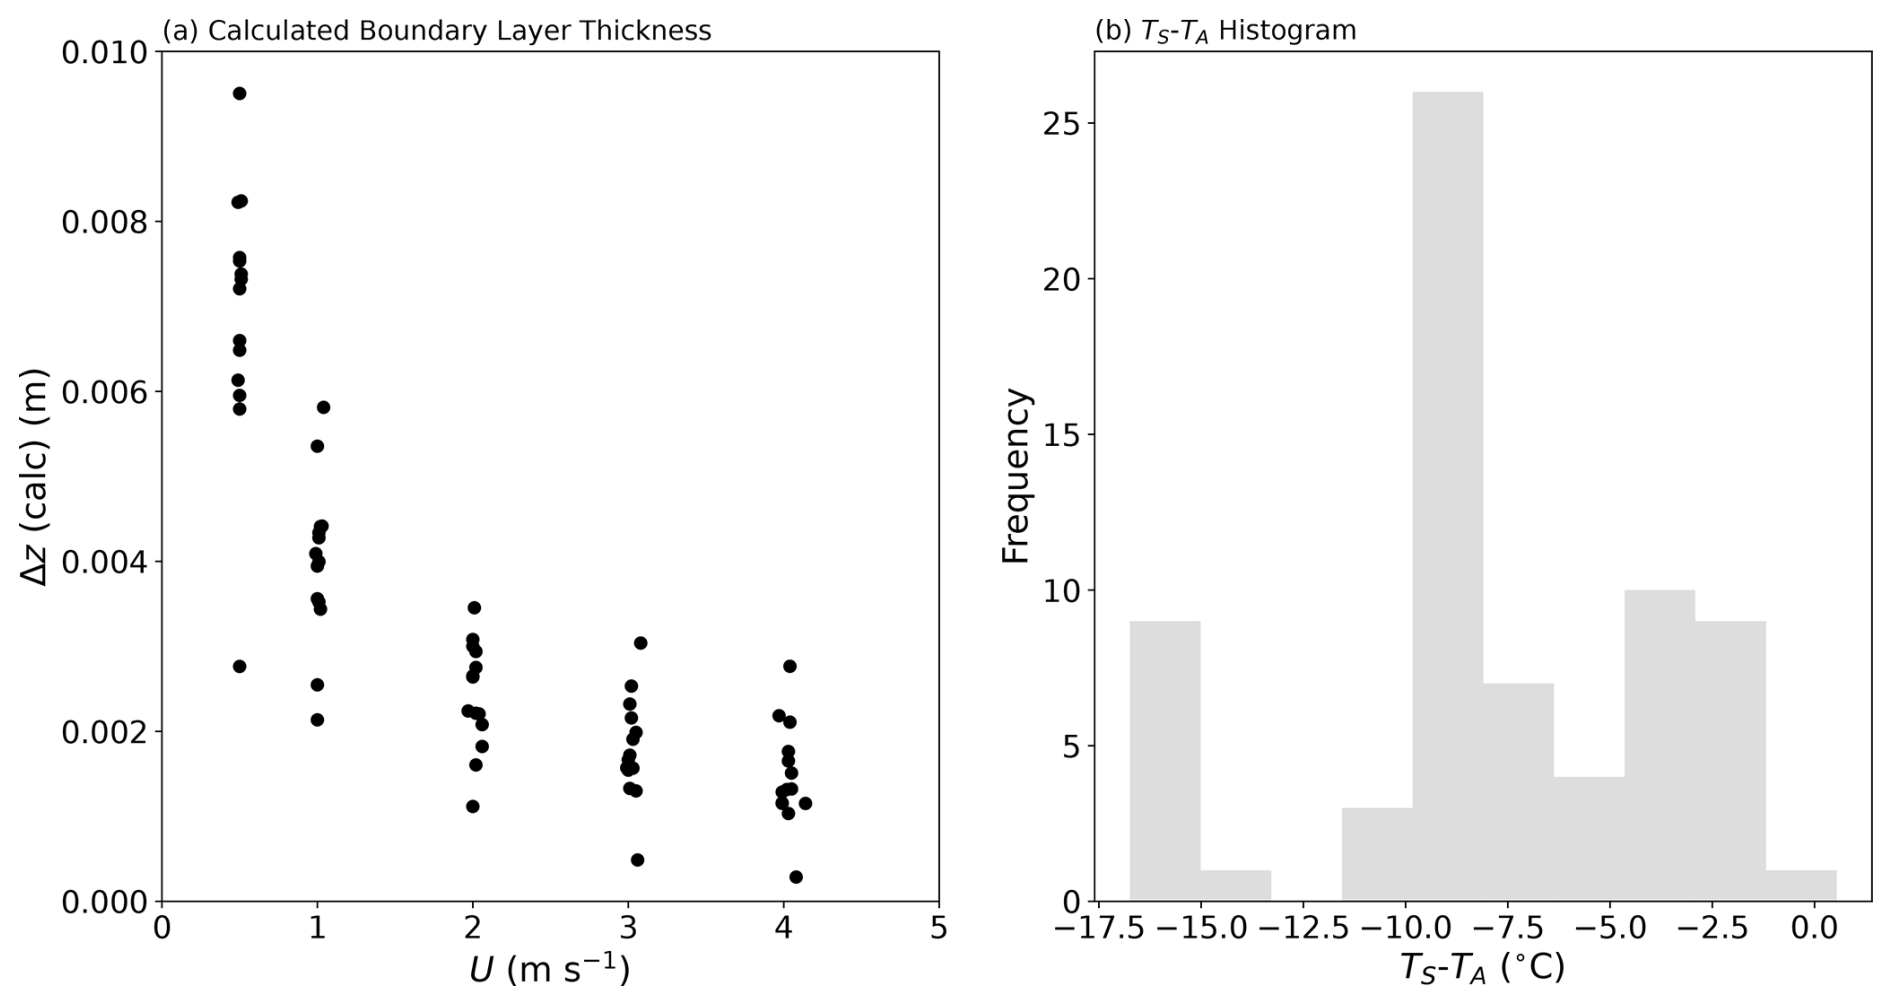
Figure C1Key characteristics of the 70 individual laboratory-controlled evaporation experiments. (a) Calculated value of the boundary layer thickness (see main text) as a function of wind speed (U) and (b) a histogram showing the variation in Ts-Ta over the 70 individual evaporation experiments.
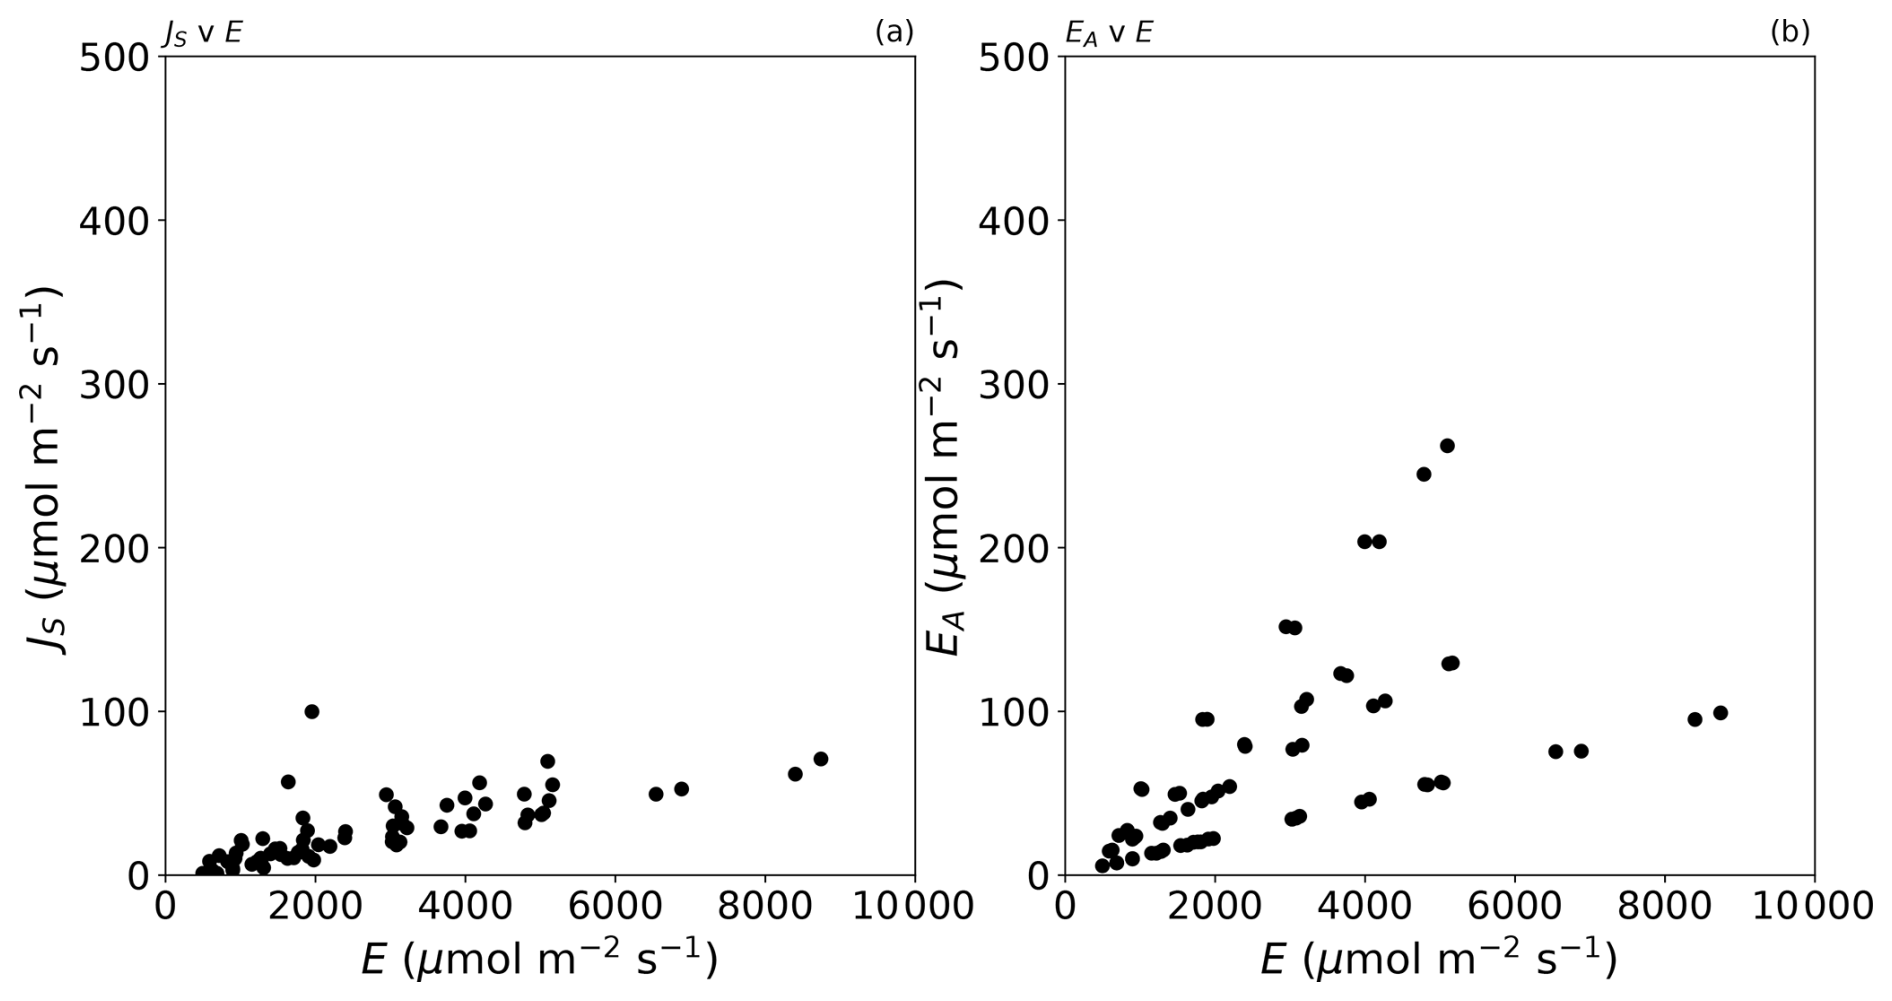
Figure D1Additional detail (different y axis) for (a) Fig. 2c and (b) Fig. 2e in the main text.
Table E1Estimate of the evaporative fluxes during an extreme heatwave in the Persian Gulf. The observed data are from Schär (2016; their Fig. 1) and are taken at midday local time (LT) on 31 July 2015 (Ta=45 °C, rel. humidity = 45 %, Ts=32 °C and assumed equal to the midpoint of the observed dew point and wet-bulb T). The wind conditions were not described in the original publication, and we completed calculations assuming a typical value for the boundary layer thickness under the stated (calm, windy) conditions. We use a fixed value for the latent heat of vaporization (2.4 MJ kg−1) to convert the evaporative flux to the latent heat flux equivalent (in W m−2).
The evaporation experiment data are available at https://doi.org/10.5281/zenodo.8381685 (Roderick et al., 2023b).
MLR conceived the overall project. MLR and CJS undertook the analysis. MLR prepared the article with contributions from CJS.
The contact author has declared that neither of the authors has any competing interests.
Publisher’s note: Copernicus Publications remains neutral with regard to jurisdictional claims made in the text, published maps, institutional affiliations, or any other geographical representation in this paper. While Copernicus Publications makes every effort to include appropriate place names, the final responsibility lies with the authors.
We thank Pierre Rognon, Graham Farquhar, and Fulton Rockwell for discussions on the Soret effect. We also thank four anonymous reviewers and Demetris Koutsoyiannis for helpful comments that improved the article. We acknowledge Andrew Kowalski for pointing out the missing advective flow in the original analysis.
This research has been supported by the Australian Research Council (grant no. DP190100791).
This paper was edited by Nadia Ursino and reviewed by Andrew Kowalski, Demetris Koutsoyiannis, and four anonymous referees.
Bejan, A.: Advanced Engineering Thermodynamics, John Wiley & Sons, New York, 746 pp., https://doi.org/10.1002/9781119245964, 2016.
Chapman, S.: The kinetic theory of simple and composite monatomic gases: viscosity, thermal conduction, and diffusion, P. Roy. Soc. A-Math. Phy., 93, 1–20, https://doi.org/10.1098/rspa.1916.0046, 1916.
Chapman, S.: The characteristics of thermal diffusion, P. Roy. Soc. A-Math. Phy., 177, 38–62, https://doi.org/10.1098/rspa.1940.0110, 1940.
Chapman, S. and Cowling, T. G.: The mathematical theory of non-uniform gases, Cambridge University Press, Cambridge, UK, 404 pp., https://doi.org/10.2307/3607024, 1939.
Chapman, S. and Dootson, F.: XXII. A note on thermal diffusion, Philos. Mag., 33, 248–253, https://doi.org/10.1080/14786440308635635, 1917.
Cussler, E. L.: Diffusion: Mass Transfer in Fluid Systems, Cambridge University Press, Cambridge, UK, https://doi.org/10.1017/CBO9780511805134, 2009.
Enskog, D.: Remarks on a fundamental equation in kinetic gas law, Phys. Z., 12, 533–539, 1911.
Grew, K. E. and Ibbs, T. L.: Thermal diffusion in gases, Cambridge University Press, Cambridge, UK, 143 pp., ISBN 9781114551121, 1952.
Griffani, D. S., Rognon, P., and Farquhar, G. D.: The role of thermodiffusion in transpiration, New Phytol., 243, 1301–1311, https://doi.org/10.1111/nph.19642, 2024.
Kowalski, A. S.: The boundary condition for vertical velocity and its interdependence with surface gas exchange, Atmos. Chem. Phys., 17, 8177–8187, https://doi.org/10.5194/acp-17-8177-2017, 2017.
Kreith, F., Boehm, R. F., Raithby, G. D., Hollands, K. G. T., Suryanarayana, N. V., Modest, M. F. V., Carey, V. P., Chen, J. C., Lior, N., Shah, R. K., Bell, K. J., Moffat, R. J., Mills, A. F., Bergles, A. E., Swanson, L. W., Antonetti, V. W., Irvine Jr., T. F., and Capobianchi, M.: Heat and Mass Transfer, in: Mechanical Engineering Handbook, edited by: Kreith, F., CRC Press LLC, Boca Raton, ISBN 9780849395819, 1999.
Lifshitz, E. M. and Pitaevskii, L. P.: Physical Kinetics: Volume 10, Landau and Lifshitz: Course of Theoretical Physics, Pergamon Press, Oxford, UK, 452 pp., ISBN 9780750626354, 1981.
Lim, W. H., Roderick, M. L., Hobbins, M. T., Wong, S. C., Groeneveld, P. J., Sun, F., and Farquhar, G. D.: The aerodynamics of pan evaporation, Agric. For. Meteorol., 152, 31–43, https://doi.org/10.1016/j.agrformet.2011.08.006, 2012.
Monteith, J. L. and Unsworth, M. H.: Principles of Environmental Physics, Edward Arnold, London, 419 pp., ISBN 9780123869104, 2008.
Ortiz de Zárate, J. M.: Definition of frame-invariant thermodiffusion and Soret coefficients for ternary mixtures, Eur. Phys. J. E, 42, 43, https://doi.org/10.1140/epje/i2019-11803-2, 2019.
Platten, J. K.: The Soret Effect: A Review of Recent Experimental Results, J. Appl. Mech., 73, 5–15, https://doi.org/10.1115/1.1992517, 2006.
Rahman, M. A. and Saghir, M. Z.; Thermodiffusion or Soret effect: Historical review, Int. J. Heat Mass Transfer, 73, 693–705, https://doi.org/10.1016/j.ijheatmasstransfer.2014.02.057, 2014.
Roderick, M. L., Jayarathne, C., Rummery, A. J., and Shakespeare, C. J.: Evaluation of a wind tunnel designed to investigate the response of evaporation to changes in the incoming long-wave radiation at a water surface, Atmos. Meas. Tech., 16, 4833–4859, https://doi.org/10.5194/amt-16-4833-2023, 2023a.
Roderick, M., Jayarathne, C., Rummery, A., and Shakespeare, C.: Evaluation of a wind tunnel designed to investigate the response of evaporation to changes in the incoming longwave radiation at a water surface (V12 (Final)), Zenodo [data set], https://doi.org/10.5281/zenodo.8381685, 2023b.
Schär, C.: Climate extremes: The worst heat waves to come, Nat. Clim. Change, 6, 128–129, https://doi.org/10.1038/nclimate2864, 2016.
Shakespeare, C. J. and Roderick, M. L.: What Controls Near-Surface Relative Humidity Over the Ocean?, J. Atmos. Model. Earth Sy., 16, e2023MS004168, https://doi.org/10.1029/2023MS004168, 2024.
Vargaftik, N. B.: Handbook of Physical Properties of Liquids and Gases: Pure Substances and Mixtures, Hemisphere Publishing Corporation, Washington DC, 758 pp., ISBN 9780891163565, 1983.
Wang, H. and Frenklach, M.: Transport properties of polycyclic aromatic hydrocarbons for flame modeling, Combust. Flame, 96, 163–170, https://doi.org/10.1016/0010-2180(94)90167-8, 1994.
Xu, S., Hutchinson, A. J., Taheri, M., Corry, B., and Torres, J. F.: Thermodiffusive desalination, Nat. Commun., 15, 2996, https://doi.org/10.1038/s41467-024-47313-5, 2024.
Youssef, A., Hanna, M. M., and Migahed, M. D.: Performance of Thermal Diffusion Columns for Gas Mixtures, Z. Naturforsch. A, 20, 655–662, https://doi.org/10.1515/zna-1965-0503, 1965.
- Abstract
- Introduction
- Theory
- Empirical estimate of the thermal diffusion factor αT for an H2O–dry air mixture
- Typical magnitude of the Soret effect relative to ordinary “Fickian” diffusion
- Contribution of the Soret effect to the total evaporation
- Discussion and conclusions
- Appendix A: Empirical dependence of αT on M
- Appendix B: Derivation of Eqs. (7)–(9) in the main text
- Appendix C: Key characteristics of the evaporation experiments
- Appendix D: Alternate plots for Fig. 2c and e
- Appendix E: The Soret effect during the 2015 Persian Gulf heatwave
- Data availability
- Author contributions
- Competing interests
- Disclaimer
- Acknowledgements
- Financial support
- Review statement
- References