the Creative Commons Attribution 4.0 License.
the Creative Commons Attribution 4.0 License.
 | 20 Mar 2025
Constructing a geography of heavy-tailed flood distributions: insights from common streamflow dynamics
Ralf Merz
Stefano Basso
Heavy-tailed flood distributions depict the higher occurrence probability of extreme floods. Understanding the spatial distribution of heavy-tail floods is essential for effective risk assessment. Conventional methods often encounter data limitations, leading to uncertainty across regions. To address this challenge, we utilize hydrograph recession exponents derived from common streamflow dynamics, which have been shown to be a robust indicator of flood tail propensity across analyses with varying data lengths. Analyzing extensive datasets covering Atlantic Europe, northern Europe, and the continental United States, we uncover distinct patterns: prevalent heavy tails in Atlantic Europe, diverse behavior in the continental United States, and predominantly non-heavy tails in northern Europe. The regional tail behavior has been observed in relation to the interplay between terrain and meteorological characteristics, and we conducted quantitative analyses to assess the influence of hydroclimatic conditions using Köppen classifications. Notably, temporal variations in catchment storage are a crucial mechanism driving highly nonlinear catchment responses that favor heavy-tailed floods, often intensified by concurrent dry periods and high temperatures. Furthermore, this mechanism is influenced by various flood generation processes, which can be shaped by both hydroclimatic seasonality and catchment scale. These insights deepen our understanding of the interplay between climate, physiographical settings, and flood behavior while highlighting the utility of hydrograph recession exponents in flood hazard assessment.
- Article
(4470 KB) - Full-text XML
-
Supplement
(761 KB) - BibTeX
- EndNote


Floods are devastating natural hazards that pose significant risks to infrastructure, property, and human life (McDermott, 2022; Bevere and Remondi, 2022). The unprecedented magnitude of extreme floods often characterizes these hazards, which is better depicted by the heavy-tailed behavior exhibited in flood frequency distributions (Smith et al., 2018; Merz et al., 2021; Merz et al., 2022). The concept of heavy-tailed behavior finds broad application in various fields to describe the likelihood of extreme-event occurrences (Katz et al., 2002; Kondor et al., 2014; Malamud, 2004; Sartori and Schiavo, 2015; Wang et al., 2022a). In particular, it is widely recognized as a prevalent feature in hydrologic extremes (Papalexiou et al., 2013; Smith et al., 2018). While acknowledging various statistical definitions of heavy-tailed distributions (e.g., Gumbel, 1958; Hosking, 1990; Werner and Upper, 2002; El Adlouni et al., 2008; Merz et al., 2022; Nair et al., 2022), we have identified a theoretical control on the occurrence of power-law-tailed flows (Wang et al., 2023), which is one type of heavy-tailed distribution and indicates a substantial probability of extreme floods.
In the review of Merz et al. (2022), it becomes evident that multiple hydro-physiographic characteristics interact within a complex system, collectively shaping flood tail behavior. Specifically, the interplay between characteristic flood generation (Bernardara et al., 2008; Thorarinsdottir et al., 2018), the presence of mixed flood types (Morrison and Smith, 2002; Villarini and Smith, 2010), the tail heaviness of rainfall distributions (Gaume, 2006), the catchment aridity (Molnar et al., 2006; Merz and Blöschl, 2009; Guo et al., 2014), and the catchment area (Pallard et al., 2009; Villarini and Smith, 2010) are proposed as factors contributing to the nonlinearity of catchment responses. For instance, climate conditions have been found to shape the catchment geomorphology (Wu et al., 2023) and river network dynamics (Ward et al., 2020), which contribute to the degree of catchment response nonlinearity (Biswal and Marani, 2010). This nonlinearity is increasingly recognized as a plausible driver of heavy-tailed flood behavior (Fiorentino et al., 2007; Struthers and Sivapalan, 2007; Gioia et al., 2008; Rogger et al., 2012; Basso et al., 2015; Merz et al., 2022; Basso et al., 2023; Wang et al., 2023).
The nonlinearity of catchment hydrological responses manifests in the hydrograph recession behavior, commonly described by a power-law function (Brutsaert and Nieber, 1977; Biswal and Marani, 2010; Tashie et al., 2020a):
Here, q represents streamflow; t denotes time; and B and a are empirical constants referred to as the recession coefficient and exponent, respectively. In particular, the recession exponent a is used to express linear to nonlinear responses. Higher a values indicate streamflow behavior with a quicker rise for a peak and faster decay during high flows having while slower decay and more stability during low flows (Tashie et al., 2019). Given that a higher recession exponent reflects significant nonlinearity in catchment responses, it has been proposed as an indicator of the emergence of heavy-tailed flood distributions (Basso et al., 2015; Wang et al., 2023).
In our prior research (Wang et al., 2023), we introduced hydrograph recession exponents as a newly proposed indicator for heavy-tailed flood behavior. This indicator allows for the inference of heavy-tailed flood distributions based on physical mechanisms (i.e., typical hydrological processes within common streamflow dynamics). We demonstrated that this simple indicator reliably pinpoints heavy-tailed flow distributions identified in a dataset of river basins in Germany. Unlike conventional approaches relying on the statistical fitting of maxima or peak-over-threshold values (which often yield only a few data points over short periods), the identified link between ordinary streamflow dynamics (which embody the underlying storage–discharge dynamics) and tail behaviors enables leveraging the wealth of information contained in daily streamflow records.
A reliable estimation of tail heaviness is challenging due to data scarcity. Wietzke et al. (2020) employed bootstrap experiments to evaluate the sensitivity to data availability of four frequently used indices (i.e., shape parameter of the generalized extreme value (GEV) distribution, upper-tail ratio, Gini index, and obesity index). They highlighted that estimates are often unreliable, particularly for cases with heavier tails. Studies based on goodness-of-fit tests for generalized extreme value (GEV) distributions suggested that 30 to 40 samples are necessary for reliable estimation (Cai and Hames, 2010; Németh et al., 2019). Additional efforts to improve the reliability of tail heaviness estimates include the use of L moments (Hosking et al., 1985), which ensure better upper-tail estimation of GEVs compared to maximum likelihood, and L-moment ratio diagrams (Vogel and Fennessey, 1993), which improve estimation in highly skewed samples. Besides advancements in tail heaviness indices and parameter estimation methods, the reduced demands on data length for estimating tail behavior through the hydrograph recession exponent present an alternative solution to this issue. In particular, the consistent estimates of flood tail heaviness across various data lengths based on hydrograph recession exponents suggest its potential value as a tool for analyzing regions with diverse gauge data records.
This study emphasizes distinguishing between heavy- and non-heavy-tailed distributions rather than quantifying tail heaviness. Identifying heavy-tailed distributions is inherently challenging, yet it is hydrologically significant. In fact, the presence of a heavy tail alone can serve as a critical warning of a relatively high probability of extreme events, making it a crucial issue also in studies using other indices (e.g., Macdonald et al., 2022).
Our aim in this following work is to construct a geography of flood tail behavior based on the inferred heavy-tailed flood “hotspots” recognized by this indicator, thus ensuring comparability of analyses across different data lengths. Nonetheless, we acknowledge that other indicators could also be used; however, we are specifically interested in the recession exponent because it is a novel index that allows us to infer the propensity for rivers to experience extreme floods. Such an index enables us to identify potential risks even in the absence of recorded extreme floods, which is often not possible with other indicators. Its stability provides additional value to mitigate the bias often introduced by the variance in dataset lengths across cases. Given that longer and comparable record lengths are desirable for analyzing heavy-tailed distributions using conventional methods (Cunderlik and Burn, 2002; Papalexiou and Koutsoyiannis, 2013; Zaerpour et al., 2024) and considering the global variation in available hydrological data lengths (Lins, 2008), this work contributes to filling the research gap by providing a reliable estimation of heavy-tailed flood behavior across a wide range of geography (Merz et al., 2022; Zaerpour et al., 2024). Specifically, our objectives are twofold: (1) to validate the effectiveness of recession exponents in identifying heavy-tailed flood behavior through an extensive analysis and (2) to investigate the underlying factors related to diverse physiographical settings, taking into account spatial patterns, seasonality, and catchment-scale characteristics, and how they influence catchment nonlinearity, leading to the emergence of heavy-tailed floods.
We organize the structure of this paper as follows: Sect. 2 describes the study areas and the hydrological data based on an extensive dataset composed of four countries. Sect. 3 describes the methods of estimation and validation of hydrograph recession exponents in identifying heavy-tailed flood behavior in the dataset, the framework of the analyses of spatial patterns of inferred heavy-tailed flood behavior, the framework of the analyses of seasonal dynamics of inferred heavy-tailed flood behavior, and statistical tests. In Sect. 4, we present the validation results of our heavy-tailed flood behavior index, along with analyses of the relationships between flood tail behavior and geographical spatial characteristics, seasonal patterns, and catchment scales in these comparable countries. Physical interpretations of the results and remarks from the literature are discussed in Sect. 5. The main conclusions are summarized in Sect. 6.
We conducted analyses based on datasets covering three main regions: Atlantic Europe, northern Europe, and the continental United States. Our dataset for Atlantic Europe includes river gauges of catchments in Germany and the United Kingdom. The former exhibits a larger variation in elevation, ranging from sea level to 2962 m, while the latter is generally flatter, with elevations ranging from sea level to 1345 m. Northern Europe is characterized by strong snow dynamics in flood generation processes, setting it apart from the other regions in this study. The continental United States represents the most diverse region in terms of physiographical settings, allowing us to validate and consolidate the transferability of our findings. We aim to select catchments with low anthropogenic influences and long continuous records. Specifically, the Model Parameter Estimation Experiment dataset (MOPEX, Duan et al., 2006; NOAA-National Weather Service-Office of Hydrologic Development, 2022), which exhibits an exclusion of strong effects from human activities, is used for the continental United States. The Global Runoff Data Centre (GRDC, Bundesanstalt für Gewässerkunde, 2022) provided runoff data with, continuous records spanning more than 50 years, for Norway and the United Kingdom, contributing to the dataset for northern Europe and part of Atlantic Europe. Additionally, the dataset from Germany, collected by Tarasova et al. (2018), was utilized for another part of Atlantic Europe. For all the datasets, we excluded catchments where flows were reported to be disturbed by large reservoirs or control gates (Lehner et al., 2011; Wang et al., 2022a) or where visual examination revealed obvious flow disturbances. A total of 575 river gauges were selected from an initial pool of 797 based on these criteria. We collected daily continuous streamflow records, with a median recording length of 62 years (ranging from 24 to 148 years, covering the years 1872–2021) across these regions. The corresponding drainage areas range from 4 to 40 504 km2, with a median of 1240 km2 (refer to Table A1 in the Appendix for detailed information on each region).
Our analysis was performed on a seasonal basis, considering spring (March–May), summer (June–August), autumn (September–November), and winter (December–February) to account for the seasonality of hydrograph recessions (Tashie et al., 2020b) and flood distributions (Durrans et al., 2003). Each analysis conducted on a specific river gauge during a season was treated as a case study. Consistently with previous studies (e.g., Botter et al., 2007a, 2010; Ceola et al., 2010; Doulatyari et al., 2015; Basso et al., 2021; Basso et al., 2023), we chose case studies in Atlantic Europe and the continental United States characterized by limited snowfall, which minimizes the potential transfer of water across seasons due to strong snow accumulation and melting. Specifically, this condition is defined as having an average daily temperature below 0 °C during precipitation events for over 50 % of a season (Basso et al., 2021). However, recognizing that recession exponents can inherently capture both linear and nonlinear catchment responses, we intentionally included case studies in northern Europe, which are characterized by a dominant runoff generation process driven by snow dynamics. This deliberate inclusion provides a counter-verification, allowing us to explore the capability of the recession exponent as a measure of flood tail behavior in regions primarily characterized by snowmelt-driven flood generation processes. In summary, this analysis encompasses regions dominated by both rainfall-driven and snowmelt-driven floods, providing an extensive examination of these factors. These procedures resulted in a total of 1997 case studies, distributed as follows: 540 in spring, 520 in summer, 543 in autumn, and 394 in winter (refer to Table A1 for detailed information on each region).
Köppen climate classification and the derived potential evapotranspiration are employed to describe and categorize the hydroclimatic characteristics of the study regions. The Köppen climate classification is sourced from the work of Beck et al. (2018), providing high-resolution (1 km) maps that depict present-day conditions (1980–2016). Concurrently, the derived potential evapotranspiration is obtained from the research presented by Zomer et al. (2022), offering high-resolution (1 km) maps that illustrate monthly average data (1970–2000). The latter is based on the Food and Agriculture Organization application of the Penman–Monteith equation (FAO-56, Allen et al., 1998; Fick and Hijmans, 2017).
3.1 Inferring heavy tails of flood distributions from common streamflow dynamics
We adopt a framework of the physically based extreme value (PHEV) distribution of river flows, introduced by Basso et al. (2021). This framework offers a mechanistic–stochastic characterization of both the magnitude and the probability of flows, underpinned by essential hydrological processes like precipitation, infiltration, evapotranspiration, soil moisture, and runoff generation within river basins, as previously described in well-established mathematical descriptions (Laio et al., 2001; Porporato et al., 2004; Botter et al., 2007b, 2009). Specifically, rainfall is described as a marked Poisson process with a frequency of λp[T−1] and exponentially distributed depths with average α[L]. Soil moisture increases due to rainfall infiltration and decreases due to evapotranspiration. The latter is represented by a linear function of soil moisture between the wilting point and an upper critical value expressing the water-holding capacity of the root zone. Runoff pulses occur at a frequency of λ<λp when the soil moisture exceeds the critical value. These pulses replenish a single catchment's storage, which drains according to a nonlinear storage–discharge relation. The related hydrograph recession is described via a power-law function, with an exponent of a[−] and a coefficient of (Brutsaert and Nieber, 1977), which allows for mimicking the joint effect of different flow components (Basso et al., 2015). The description of runoff generation and streamflow dynamics provided by this framework has been successfully tested across a diverse range of hydroclimatic and physiographic conditions through a number of studies (Arai et al., 2020; Botter et al., 2007a, 2010; Ceola et al., 2010; Doulatyari et al., 2015; Mejía et al., 2014; Müller et al., 2014; Müller et al., 2021; Pumo et al., 2014; Santos et al., 2018; Schaefli et al., 2013).
Within the PHEV framework, we obtain consistent expressions for the probability distributions of various flow metrics, including daily streamflow (Botter et al., 2009), ordinary peak flows (local flow peaks resulting from streamflow-producing rainfall events), and floods (flow maxima within a specified time frame) (Basso et al., 2016).
By taking the limit of these distributions, insights into the tail behavior of these theoretical flow distributions are obtained (Basso et al., 2015; Wang et al., 2023). In particular, Wang et al. (2023) showed that the tail of the distribution is exclusively governed by a power-law function (indicating heavy tails) when the hydrograph recession exponent exceeds 2, signifying discernible nonlinearity of catchment responses. Conversely, the tail appears to be non-heavy when the recession exponent is below 2, suggesting linearity of catchment responses (notice that recession exponents are found to be above 1 in most river basins; Biswal and Kumar, 2014; Tashie et al., 2020b). Equation (1) provides the mathematical expressions for the case of floods as an example (note that similar conclusions are drawn for the theoretical distributions of daily streamflow and ordinary peak flows). As a result, the hydrograph recession exponent has been proposed as a suitable indicator of heavy-tailed flood behavior based on the analysis of common discharge dynamics. For further detailed information, please refer to Wang et al. (2023).
Here, q represents the discharge, pM(q) denotes the mathematical expression of the probability distribution of flow maxima (i.e., floods) in PHEV, and C is a normalization constant.
We employ an event-based analysis for estimating hydrograph recession exponents, a method deemed to be more robust than cloud-based analysis (Biswal and Marani, 2010; Dralle et al., 2017; Jachens et al., 2020). Specifically, we estimate the parameters of empirical power laws for individual hydrograph recessions through a linear regression of the pairs of and q in log–log scale. We use the constant-time-step (CTS) method to estimate the time derivatives (see an example in Fig. S2 in the Supplement), which has commonly been used in various studies (e.g., Biswal and Marani, 2010; Mutzner et al., 2013; Dralle et al., 2017; Tashie et al., 2020b; Basso et al., 2023). We acknowledge the availability of alternative methods, such as the exponential time step (ETS), and confirm that the ETS yields results similar to the CTS in this study (see Sect. S1 and Fig. S1 in the Supplement). The initiation of a recession event is defined as an ordinary peak of daily discharge that surpasses the mean discharge over the entirety of discharge records (Biswal and Marani, 2010; Mutzner et al., 2013). We incorporate the entire recession process in the estimation of power-law exponents (which has been shown to be crucial in shaping flood frequency behavior; Guo et al., 2014; Basso et al., 2016), meaning that both the peak and the subsequent daily streamflow decay are included without excluding any days (Dralle et al., 2017). This decision ensures that we account for the effects of both fast flows, mainly associated with surface flows (early stage of recession), and slow flows, mainly associated with subsurface flows (late stage of recession), on catchment nonlinear responses in the adopted recession analysis (Barnes, 1939; Chen and Krajewski, 2016; Mathai and Mujumdar, 2022). This procedure marks the pivotal difference between the adopted analysis and those solely focused on the recession behavior of low flow and/or baseflow (Fig. S3 provides a schematic diagram of the hydrograph recession analysis adopted in this study). To reduce noise from short events (Ye et al., 2014; Chen and Krajewski, 2016) and to ensure sufficient sample sizes (i.e., a sufficient number of analyzed recessions) to obtain representative values of recession parameters (Shaw, 2016), it is common practice to set a minimum recession duration. Based on the catchment sizes in our dataset, we selected 5 d as the minimum threshold for the recession duration (i.e., analyzing all cases with recession durations longer than 5 d), a choice well-supported by the existing literature (e.g., Biswal and Marani 2010; Shaw and Riha, 2012; Thomas et al., 2015; Chen and Krajewski, 2016; Dralle et al., 2017; Jachens et al., 2020; Tashie et al., 2020a). Finally, we determine the median value of estimated exponents across all identified events as the representative value to ensure robustness (Dralle et al., 2017; Jachens et al., 2020).
3.2 Validation of hydrograph recession exponents as an index of heavy-tailed flood behavior
To validate the identification of heavy-tailed flood behavior obtained through recession exponents, we compare it to the behavior estimated from data by fitting a power-law distribution to the empirical data distribution and evaluating the reliability of these empirical power laws.
A case study is considered to exhibit heavy-tailed behavior if the power-law distribution effectively describes the tail behavior of the data distribution. To establish whether this is happening, we employed the framework introduced by Clauset et al. (2009). The upper tail of the discharge distribution is fitted with a power-law distribution using the method of maximum likelihood. Empirical data following a power-law distribution (if applicable) typically do so above a certain lower bound (Clauset et al., 2009). Therefore, we employ the approach proposed by Clauset et al. (2007) to determine an optimized lower boundary above which a power-law tail may emerge. This method selects the boundary according to which the empirical probability distribution and the best-fit power-law model are most similar, as evaluated by the Kolmogorov–Smirnov (KS) statistic, which is used to quantify the distance between these distributions. If the optimized lower boundary is higher than the true lower boundary, the reduced data sample leads to a poor match due to statistical fluctuations. If it is lower, the distributions differ fundamentally. The goodness of fit is evaluated by means of the KS test. We used the KS test instead of alternatives like the Anderson–Darling test to ensure appropriate sample sizes for our datasets (Hosking and Wallis, 1987; Clauset et al., 2009; Klaus et al., 2011; Alstott et al., 2014) (see Fig. S4). The KS statistic (κ) is employed to preliminarily assess the reliability of empirical power-law distributions (], with κ= 0 denoting the highest reliability). The test is applied with a significance level of p > 0.1, which is more stringent than the typical p > 0.05 since, here, the goal is to fail to reject the null hypothesis (i.e., to confirm the lack of evidence to conclude that a difference exists between the distributions). Cases meeting this criterion are further evaluated against alternative distributions (e.g., lognormal) by using a bootstrapping method, where 1000 synthetic datasets are generated from the optimized power-law model (Clauset et al., 2009). Cases also passing this further criterion are deemed to be “power-law-tailed”. Those that do not are labeled “uncertain”, indicating that either these cases are not power-law-tailed or their distribution cannot be determined due to high uncertainty from small sample sizes. We conduct these computations using the Python package plfit 1.0.3. We calculate empirical power-law exponents b for each case and assess the consistency between the heavy-tailed behavior identified by means of both a and b.
We conduct our approach using three distinct empirical data distributions: daily streamflow, ordinary peaks, and monthly maxima. These analyses strengthen our validation process and enhance the evaluation of our results. It is worth noting that our chosen benchmark, the empirical power law, may be influenced by fitting uncertainty due to data scarcity in certain cases, particularly when analyzing maxima. To mitigate this, we consider monthly maxima (Fischer and Schumann, 2016; Malamud and Turcotte, 2006) instead of the seasonal maxima previously used in the literature (e.g., Basso et al., 2021) in order to expand the sample size. Parallel analyses for cases with larger sample sizes (i.e., daily streamflow and ordinary peaks) provide more robust validation and lend support to the interpretation of results for maxima (the median sample sizes are 1280, 512, and 132 for daily streamflow, ordinary peaks, and monthly maxima, respectively). It is important to clarify that these sample sizes refer specifically to the tail of the empirical distributions. In other words, only the most extreme observations – defined as those located within the identified tail of the empirical distribution, where the tail is determined based on the optimized lower boundary calculated using the framework proposed by Clauset et al. (2009) – are analyzed to assess whether the empirical distributions exhibit power-law behavior in their tails. For the overview of the entire data series analyzed in this study, please refer to Sect. 2.
3.3 Analyses of spatial and seasonal patterns of inferred flood tail behavior
We construct a geographical representation of inferred heavy-tailed flood behavior by utilizing estimated recession exponents derived from common streamflow dynamics across study countries and for each season. This representation serves as an evaluation of the propensity for heavy-tailed flood behavior across various regions and seasons. We simplify the seasonal results by identifying the dominant tail behavior, which refers to the majority of seasons (> 50 %) exhibiting either heavy-tailed or non-heavy-tailed behavior, as the representative inferred flood tail behavior in the analysis of spatial pattern (Sect. 4.2).
To determine the dominant hydroclimatic characteristics of each catchment, we overlaid the Köppen climate map (Beck et al., 2018) and a derived potential evapotranspiration map (Zomer et al., 2022) with river gauge and catchment boundary data. For the climate map, the most prevalent climate type within each catchment boundary was assigned as the representative feature. For potential evapotranspiration, the catchment average value was calculated. Of the 575 catchments in our dataset, 473 have boundary information. For the remaining 102 catchments lacking boundary data, representative features were determined based on the river gauge location. While we acknowledge the potential bias introduced by this limitation, it is worth noting that all 102 catchments are located in either the UK or northern Europe. Due to the relatively low climate variability in these regions, the impact of this bias is expected to be minimal.
To analyze seasonal patterns, we initially investigate the coherence of inferred flood tail behavior across seasons, focusing on consistency between heavy- or non-heavy-tailed behavior. Catchments with valid recession exponents from only one season are omitted from this analysis. As a result, the selection comprises 179 out of 180 catchments in Atlantic Europe, 79 out of 82 in northern Europe, and 290 out of 313 in the continental United States. We also employ the Wilcoxon signed-rank test (Wilcoxon, 1945), a non-parametric statistical hypothesis test, at a significance level of 0.05 in this section. This test assesses whether the median of recession exponents (within a climate group on a seasonal basis) is above 2 or below 2 or shows no significant difference from 2 (Fig. 7).
4.1 Effectiveness of identifying heavy-tailed flood behavior using common discharge dynamics
Figure 1 shows the frequency histograms of KS statistics κ for two groups of cases: red histograms denote cases with recession exponents a above 2, and blue histograms denote cases with recession exponents a below 2. The mean κ is significantly smaller (p<0.05) for the former group (red histograms) compared to for the latter one (blue histograms) for the case studies from Atlantic Europe (both Germany and the UK) and the continental United States. This result shows that power-law distributions (characterized by heavy-tailed behavior) better represent the empirical data in case studies with recession exponents above 2. In the Norwegian case studies, no significant difference was identified between the two groups. This is likely due to the absolute values of the recession exponent in this context, which are lower than in the other three countries and are mostly between 1 and 2, thus indicating a prevalence of non-heavy-tailed behaviors to date.
To quantify the accuracy provided by the identification of heavy-tailed flood behavior through recession exponents, we set decreasing thresholds for κ, which correspond to increasing reliability of power laws as descriptions of the empirical data. The accuracy of our index (i.e., the recession exponent) can therefore be calculated as , where κr is the threshold, Nc(κ<κr) is the number of case studies with κ<κr, and is the number of case studies with a>2 among the Nc(κ<κr) case studies. We found that the accuracy is clearly correlated to the reliability level requested for the empirical power laws (represented by κr) for case studies in Atlantic Europe and the continental United States. This confirms that the recession exponent provides higher accuracy in detecting heavy-tailed behaviors when the empirical distributions of observed data can be represented by power laws with more certainty, thus underscoring the consistency between identifying heavy-tailed cases using the proposed index and the observations. The accuracy increases in the same way for case studies in Norway, but it always remains below 0.5. Below, we will elucidate the reasons for and implications of this finding after considering the results presented in Fig. 2.
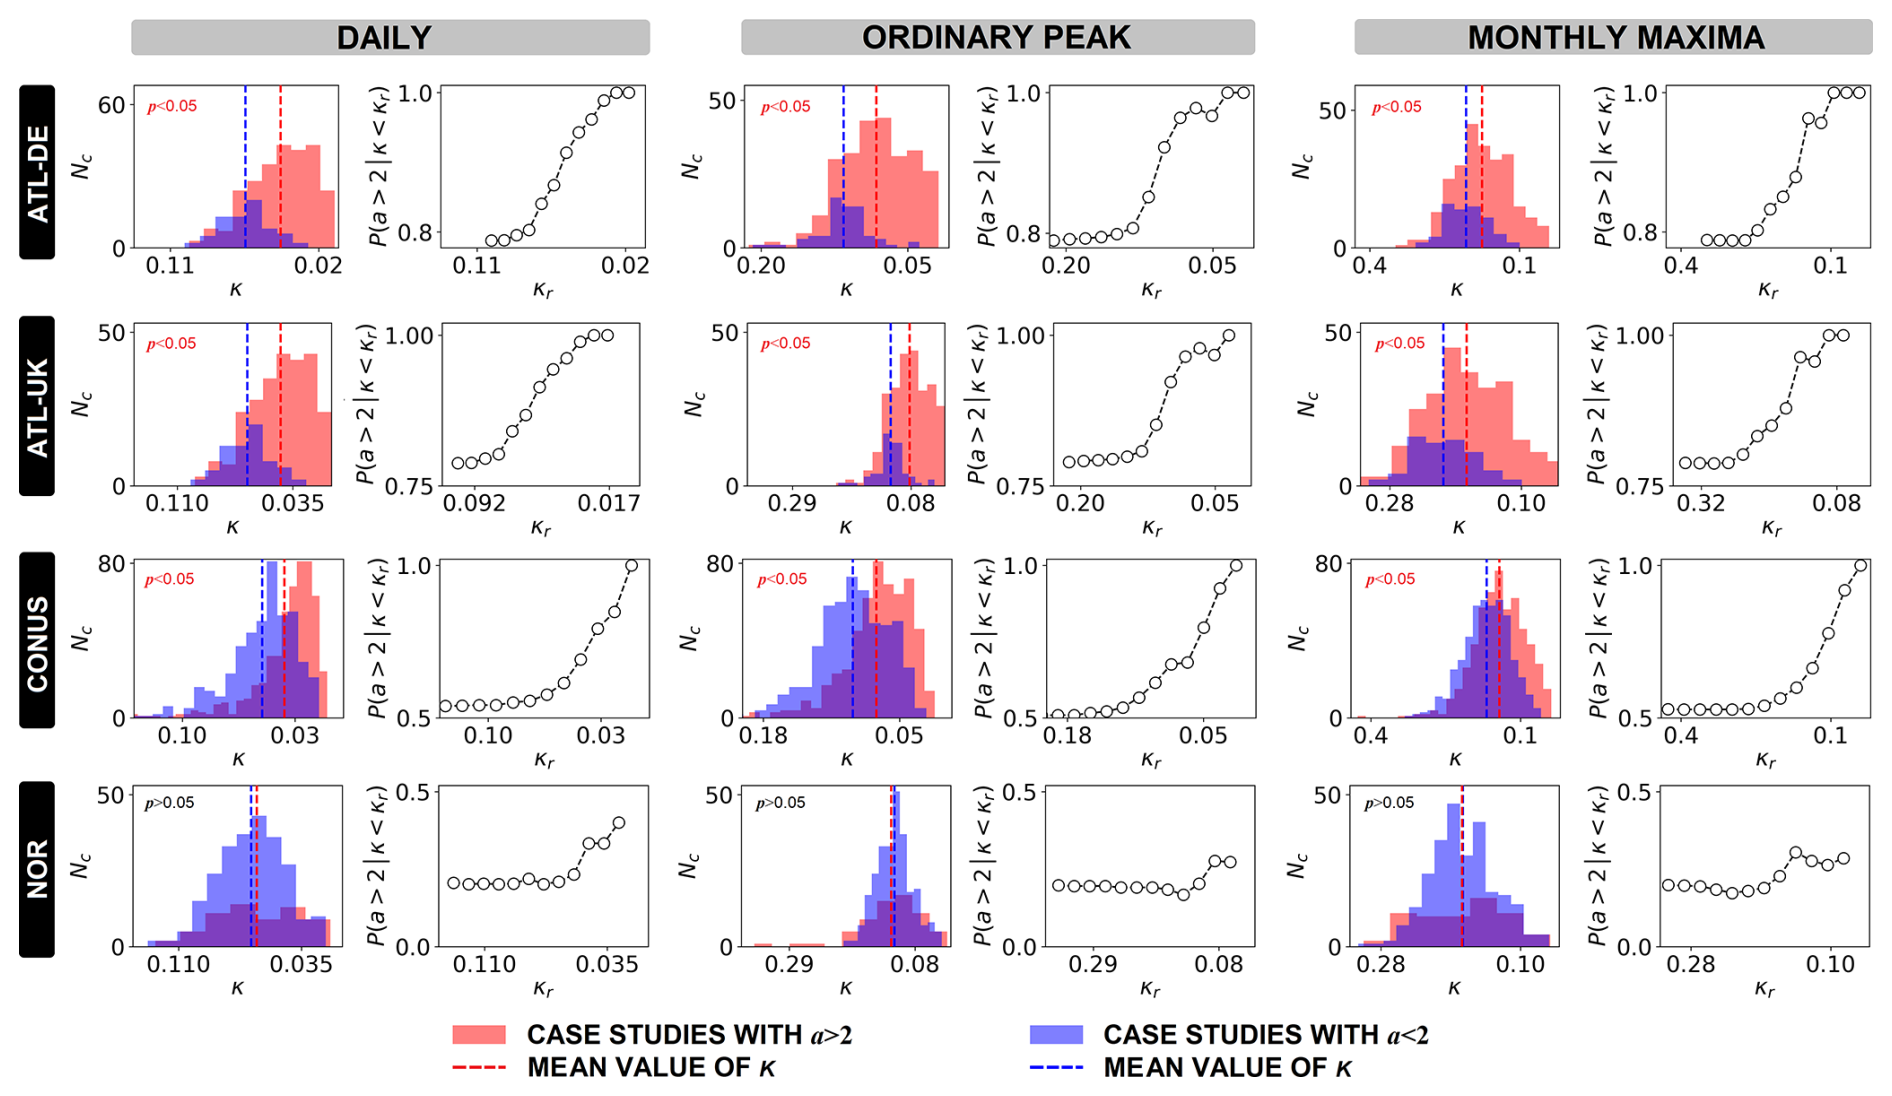
Figure 1Effectiveness of identifying heavy-tailed flood behavior using hydrograph recession exponents. Case studies are categorized into two groups in each study region: Atlantic Europe–Germany (ATL-DE), Atlantic Europe–the United Kingdom (ATL-UK), northern Europe (NOR), and the continental United States (CONUS). The group with recession exponents a above 2 is represented by red histograms, and the group with recession exponents a below 2 is represented by blue histograms. In all three analyses (daily streamflow, ordinary peak flow, and monthly maxima), every case study is subjected to empirical power-law fitting, resulting in a representative power law for the dataset, measured by the KS statistic κ (where κ∈[0,∞], and κ= 0 signifies maximum reliability). The histograms portray the count of case studies Nc analyzed as a function of κ for two distinct groups. Dashed lines on the histogram plots indicate the means of the histograms. The means of two groups (a > 2 and a < 2) are subjected to Welch's t test at a significance level of 0.05 to determine whether they are significantly different (p < 0.05) or not (p > 0.05). The line chart shows the accuracy of using the recession exponent to identify heavy-tailed behavior (denoted as ) as the κr threshold decreases (i.e., as the reliability of empirical power laws increases). The results for ATL-DE are reproduced from Wang et al. (2023).
In Fig. 2, we explore the correlation between the values of empirical power-law exponents b and the values of recession exponents a for case studies exhibiting heavy-tailed behavior. This is achieved by utilizing the goodness-of-fit testing procedure of Clauset et al. (2009) to categorize case studies into power-law-tailed case studies and uncertain case studies. The former are depicted as black dots, while the latter are depicted as gray dots. The presence of a sizable number of uncertain case studies indicates the difficulty of establishing with certainty whether or not the underlying distribution of empirical data is a power law. This difficulty is often due to limited data availability, although the possibility that, indeed, the data do not follow power laws cannot be excluded. We also perform an L-moment analysis, a compelling method in order statistics used to quantitatively describe extremes, known for its robustness in relation to stochastic sampling uncertainties (Hosking, 1990). This analysis serves to confirm the tail heaviness observed in the identified power-law-tailed case studies, with these case studies showing clearly heavier tails than exponential distributions (i.e., the widely accepted distinction between heavy- and non-heavy-tailed distributions; Merz et al., 2022) (see Fig. S5).
We cannot conclude whether uncertain case studies (gray dots) represent cases that are, indeed, not power-law-tailed or if their underlying distributions cannot be determined due to the high uncertainty caused by small sample sizes. Therefore, we benchmark the recession exponent against the empirical power-law exponent by focusing on the “certain group”, i.e., power-law-tailed case studies (black dots). For all power-law-tailed case studies, we calculated Spearman correlations rs (Spearman, 1904) to test the correlation between a and b, which is valid for both linear and nonlinear associations between random variables. We found that a and b are significantly correlated at a significance level of 0.05 in Atlantic Europe (both Germany and the UK) and the continental United States. To highlight the correlation, we binned the power-law-tailed case studies and used red markers showing the median values of a and b (squares), the interquartile intervals of b (vertical bars), and the binning ranges of a. In each region, the composition of each bin encompasses one-seventh of the total number of case studies, except for northern Europe, where this fraction is adjusted to one-fifth due to the limited number of power-law-tailed cases. In Atlantic Europe and the continental United States, a larger number of uncertain case studies emerges in the analysis of flow maxima compared to the analysis of daily streamflow and ordinary peak flow (for daily streamflow, ordinary peaks, and flow maxima, respectively: 265, 270, and 352 out of 386 case studies in Germany; 258, 280, and 306 out of 325 case studies in the UK; and 589, 624, and 836 out of 980 case studies in the continental United States). Since the same case studies have already exhibited power-law-tailed distributions in their daily streamflow and ordinary peak flow data, the increase in uncertain case studies in the analysis of flow maxima suggests that the greater level of uncertainty is due to limited data availability rather than indicating a rise in the number of non-power-law-tailed case studies.
This aligns with the existing literature that emphasizes the prevalence of heavy-tailed behavior when sufficiently long data records are available (e.g., Farquharson et al., 1992; Bernardara et al., 2008; Villarini and Smith, 2010; Rogger et al., 2012; Papalexiou and Koutsoyiannis, 2013; Guo et al., 2014; Basso et al., 2016; Smith et al., 2018). Such findings, on the one hand, highlight the limitations of relying solely on statistical data analyses to identify flood tail behavior. On the other hand, they underscore additional advantages of using the mechanistic approach proposed in this study, namely the hydrograph recession exponent. The utilization of the hydrograph recession exponent effectively identifies cases exhibiting heavy-tailed behavior; even in situations where statistical methods fail to confirm the underlying distribution (as observed in monthly maxima), this index still yields robust estimates of tail heaviness based on recession exponent values.
In Norway, however, the majority of case studies across all three analyses (i.e., daily streamflow, ordinary peaks, and flow maxima) are identified as uncertain (respectively, 291, 289, and 300 out of 306 case studies). These results align with the fact that the values of the recession exponent for the Norwegian case studies predominantly fall between 1 and 2 (Fig. 2), indicating that, to date, catchment responses are relatively closer to being linear in Norway compared to in the other countries, implying the prevalence of non-heavy-tailed flood behavior. This also explains the pattern presented in the Norway panel of Fig. 1. Given that the case studies generally have recession exponents below 2, the number of case studies with recession exponents above 2 is not enough to distinguish between the two distributions of κ.
Overall, the effectiveness of recession exponents in distinguishing heavy- and non-heavy-tailed flood behavior has been substantiated (see also Wang et al., 2023). This differentiation hinges on a critical threshold: the value of 2. However, we acknowledge that misattributions may occur, particularly when a is around the threshold value. In datasets showcasing diverse physiographical characteristics, the interpretation is consistent. Areas with higher recession exponents (above 2), indicating discernible nonlinearity in catchment responses, tend to exhibit heavy-tailed flood behavior. Conversely, regions with lower recession exponents (below 2), reflecting relatively linear responses in catchments, are more likely to signify non-heavy-tailed flood behavior.
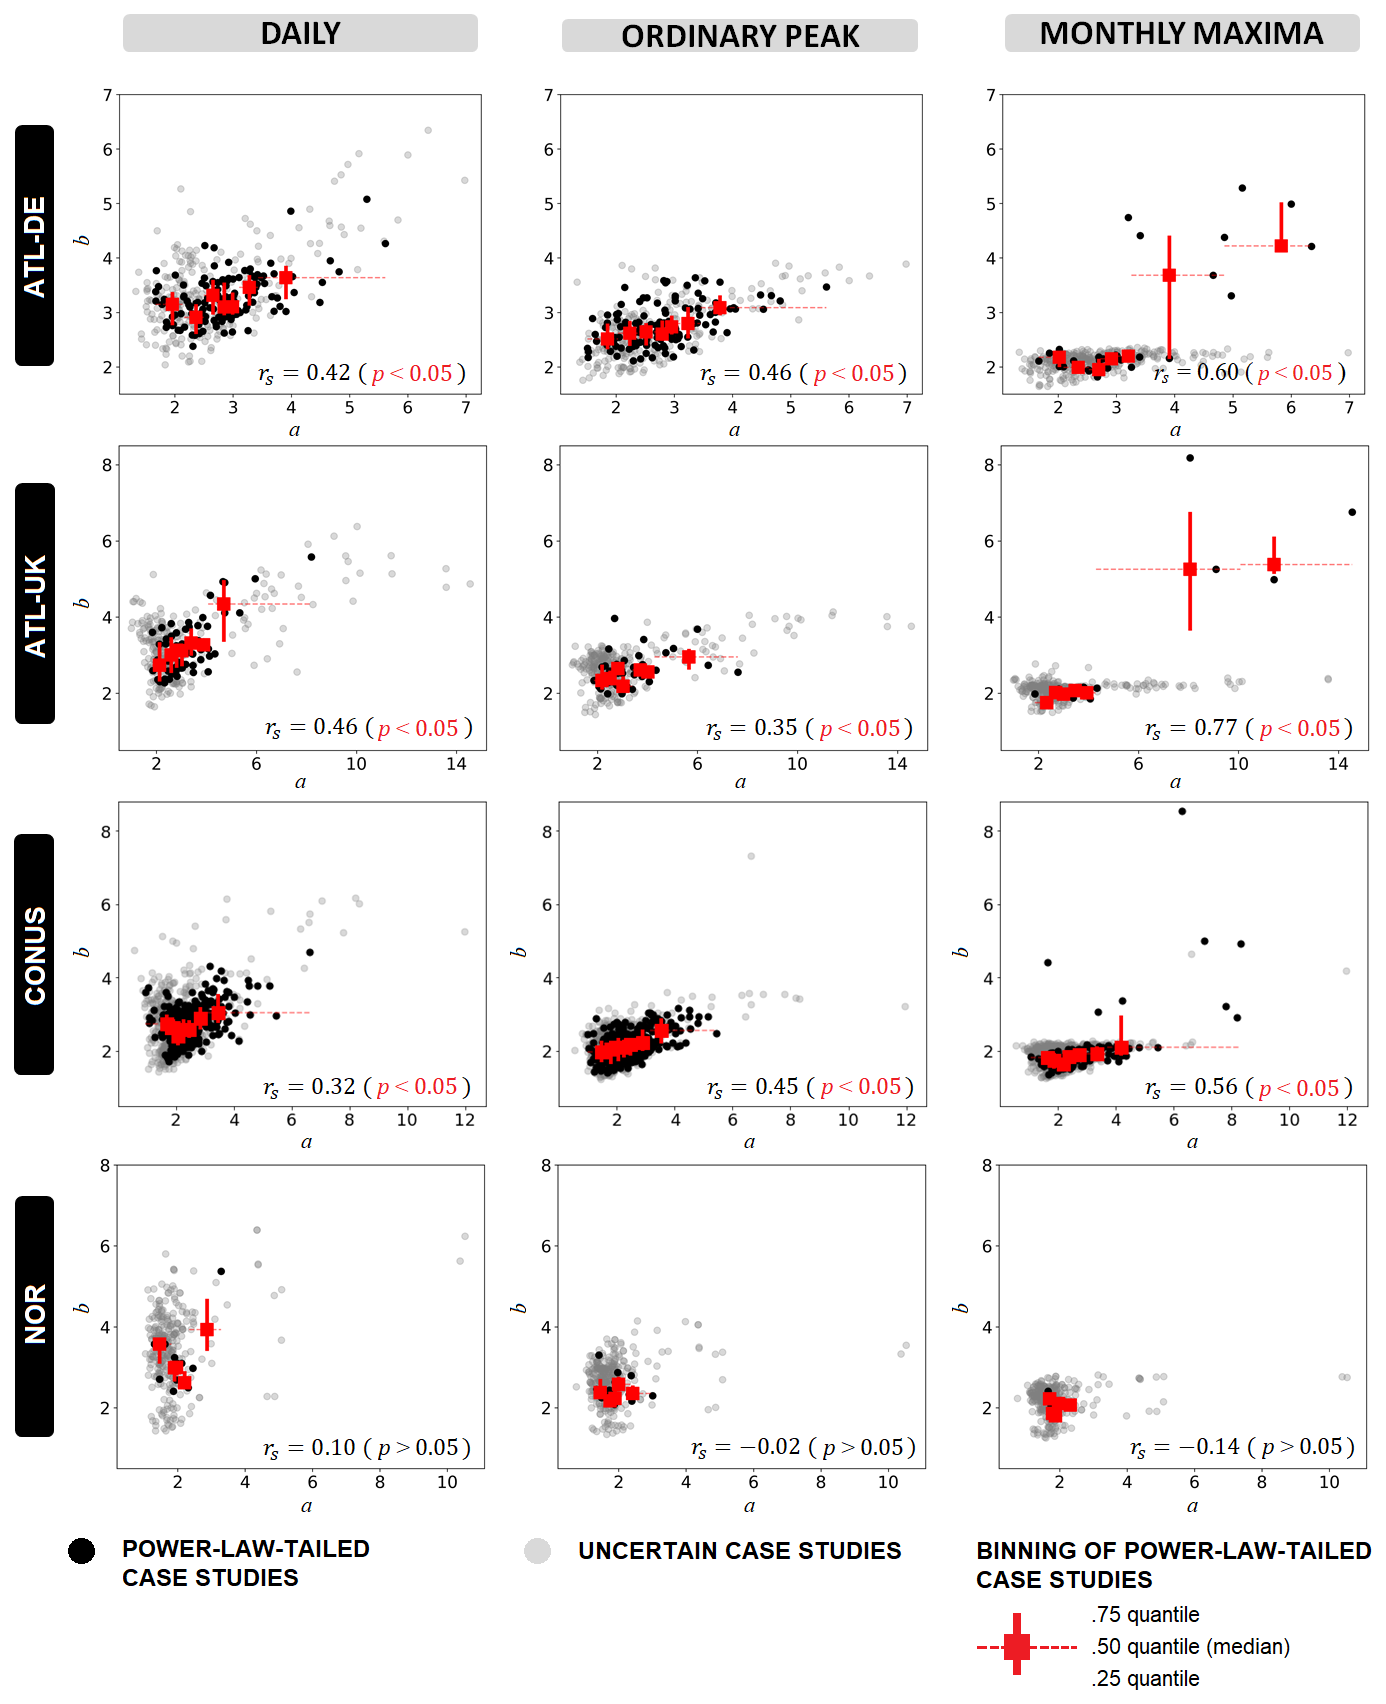
Figure 2Empirical power-law exponent b as a function of the hydrograph recession exponent a (physically based index of heavy-tailed flood behavior). Case studies are classified into groups of power-law-tailed (black dots) and uncertain (gray dots) case studies on the basis of the goodness-of-fit test (Clauset et al., 2009). The former group shows statistical confirmation that the data's distribution tail can be properly characterized by a power law, indicating heavy-tailed behavior. Conversely, the latter group indicates our inability to statistically affirm whether the data follow a power-law distribution or not. For the power-law-tailed case studies, the correlation between the empirical power-law exponent b and the hydrograph recession exponent a is underlined by red markers. This correlation is quantified using the Spearman correlation coefficient rs at a significance level of 0.05. The squares represent the median values of a and b, vertical bars indicate the interquartile intervals of b, and horizontal dashed bars indicate the binning ranges of a. In each region, the composition of each bin encompasses one-seventh of the total number of case studies, except for NOR, where this fraction is adjusted to one-fifth due to the constraint posed by the total number of power-law-tailed case studies. The counts of the power-law-tailed case studies in the analyses of daily streamflows, ordinary peak flows, and monthly flow maxima are as follows: 121, 116, and 34 out of 386 case studies for ATL-DE, respectively; 67, 45, and 19 out of 325 case studies for ATL-UK, respectively; 391, 356, and 144 out of 980 case studies for CONUS, respectively; and 15, 17, and 6 out of 306 case studies for NOR, respectively. The results for ATL-DE are reproduced from Wang et al. (2023).
4.2 Spatial patterns of inferred flood tail behavior
Figure 3 displays the spatial distribution of dominant flood tail behavior across seasons based on the recession exponent values. This dominant behavior represents either heavy or non-heavy tails, depending on what is observed in the majority of seasons. Additionally, Fig. 4 and Table 1 provide quantitative analyses of the propensity for flood tail behavior across different regions.
In Atlantic Europe–Germany (Fig. 3a), approximately 81 % of catchments are identified as sites with dominant heavy-tailed flood behavior (red dots), indicating a prevalence of such behavior. This result agrees with the findings of Mushtaq et al. (2022), who reported that a distribution with a relatively heavier tail (i.e., the log-normal) best represents ordinary peak flows in the majority of German basins considered in their study. The inferred heavy-tailed sites are spread across Germany. They dominate in the eastern part, while there are mixed patterns of heavy- and non-heavy-tailed behavior in the western part. This finding aligns with Macdonald et al. (2022), who used GEV shape parameters as an indicator of heavy-tailed behavior for gauges with more than 50 years of observations. The climate conditions are primarily humid continental (Dfb) and temperate oceanic (Cfb). Humid continental climate is prominent in the east, while temperate oceanic climate generally covers the west.
In Atlantic Europe–the UK (Fig. 3b), four climate types are present, with temperate oceanic climate (Cfb) being the dominant one. The terrain of this country in comparison to that of the other three countries is relatively homogeneous, with no high mountains. According to our findings, heavy-tailed flood behavior is prevalent in the UK, with a prevalence of 77 %, particularly in the eastern and southern coastal regions. This aligns with clues from historical events (European Environmental Agency, 2010) and clues from future flood risk assessments (Rudd et al., 2023). Huntingford et al. (2014) reported a case in which a rapid succession of vigorous Atlantic low-pressure systems crossed much of the UK, resulting in repeated heavy-rainfall events. Southeastern England was identified as a distinct region characterized by exceptionally high flows, exacerbated by increasingly saturated catchments. These catchment characteristics and hydrological responses align with our findings, which indicate the pronounced heavy tails in such a region.
In northern Europe (Norway) (Fig. 3c), however, non-heavy-tailed flood behavior dominates. Approximately 89 % of sites are inferred to have non-heavy-tailed flood behavior. Norway encompasses nine climate types but is primarily covered by a subarctic climate (Dfc), characterized by low temperatures and reduced evapotranspiration. Hydrological processes are significantly influenced by snow dynamics, which generally determine linear catchment responses as a result of snow accumulation and melting processes (Santos et al., 2018).
In contrast to the aforementioned countries with relatively consistent climate and dominant flood behavior, the continental United States (Fig. 3d) displays a diverse range of climate types and a balanced propensity toward heavy- and non-heavy-tailed flood behavior. The eastern regions are dominated by a humid subtropical climate (Cfa), hot-summer humid continental climate (Dfa), and temperate oceanic climate (Cfb) from south to north. The interior western states feature a cold semi-arid climate (BSk), while mixed patterns are observed in the western mountainous and coastal areas. An overall relatively even distribution of inferred heavy-tailed (52 %) and non-heavy-tailed (48 %) flood behavior prevails in this diverse-climate country.
Figure 3e provides an example of how the spatial distribution of flood behavior is influenced by regional physio-climatic features. In particular, catchments on the eastern side of the Appalachian Mountains exhibit pronounced heavy-tailed flood behavior, while those on the western side mostly exhibit non-heavy-tailed behavior. This is consistent with several previous findings based on the skewness of annual maximum streamflow (Interagency Advisory Committee on Water Data, 1982), the GEV shape parameters (Villarini and Smith, 2010), and the upper-tail ratio (Smith et al., 2018). This is likely due to the interaction between cold air from the inland polar jet stream and warm ocean currents, which leads to the formation of nor'easters, which are synoptic-scale extratropical cyclones in the western North Atlantic Ocean along the northeastern coast of the continental United States. These weather systems often resulted in heavy rain or rain-on-snow events. Conversely, on the western side of mountains, catchments tend to exhibit non-heavy-tailed behavior, potentially due to the leeward rain shadow effect.
In summary, the spatial distributions of inferred flood tail behavior indicate that regions with dominant climate types tend to exhibit a single or dominant flood tail behavior, as observed in the Atlantic Europe and northern Europe areas studied in this research. Conversely, the interplay among regional physio-climatic conditions shows their impacts on the propensity for regional flood behavior across diverse climate conditions in the continental United States.
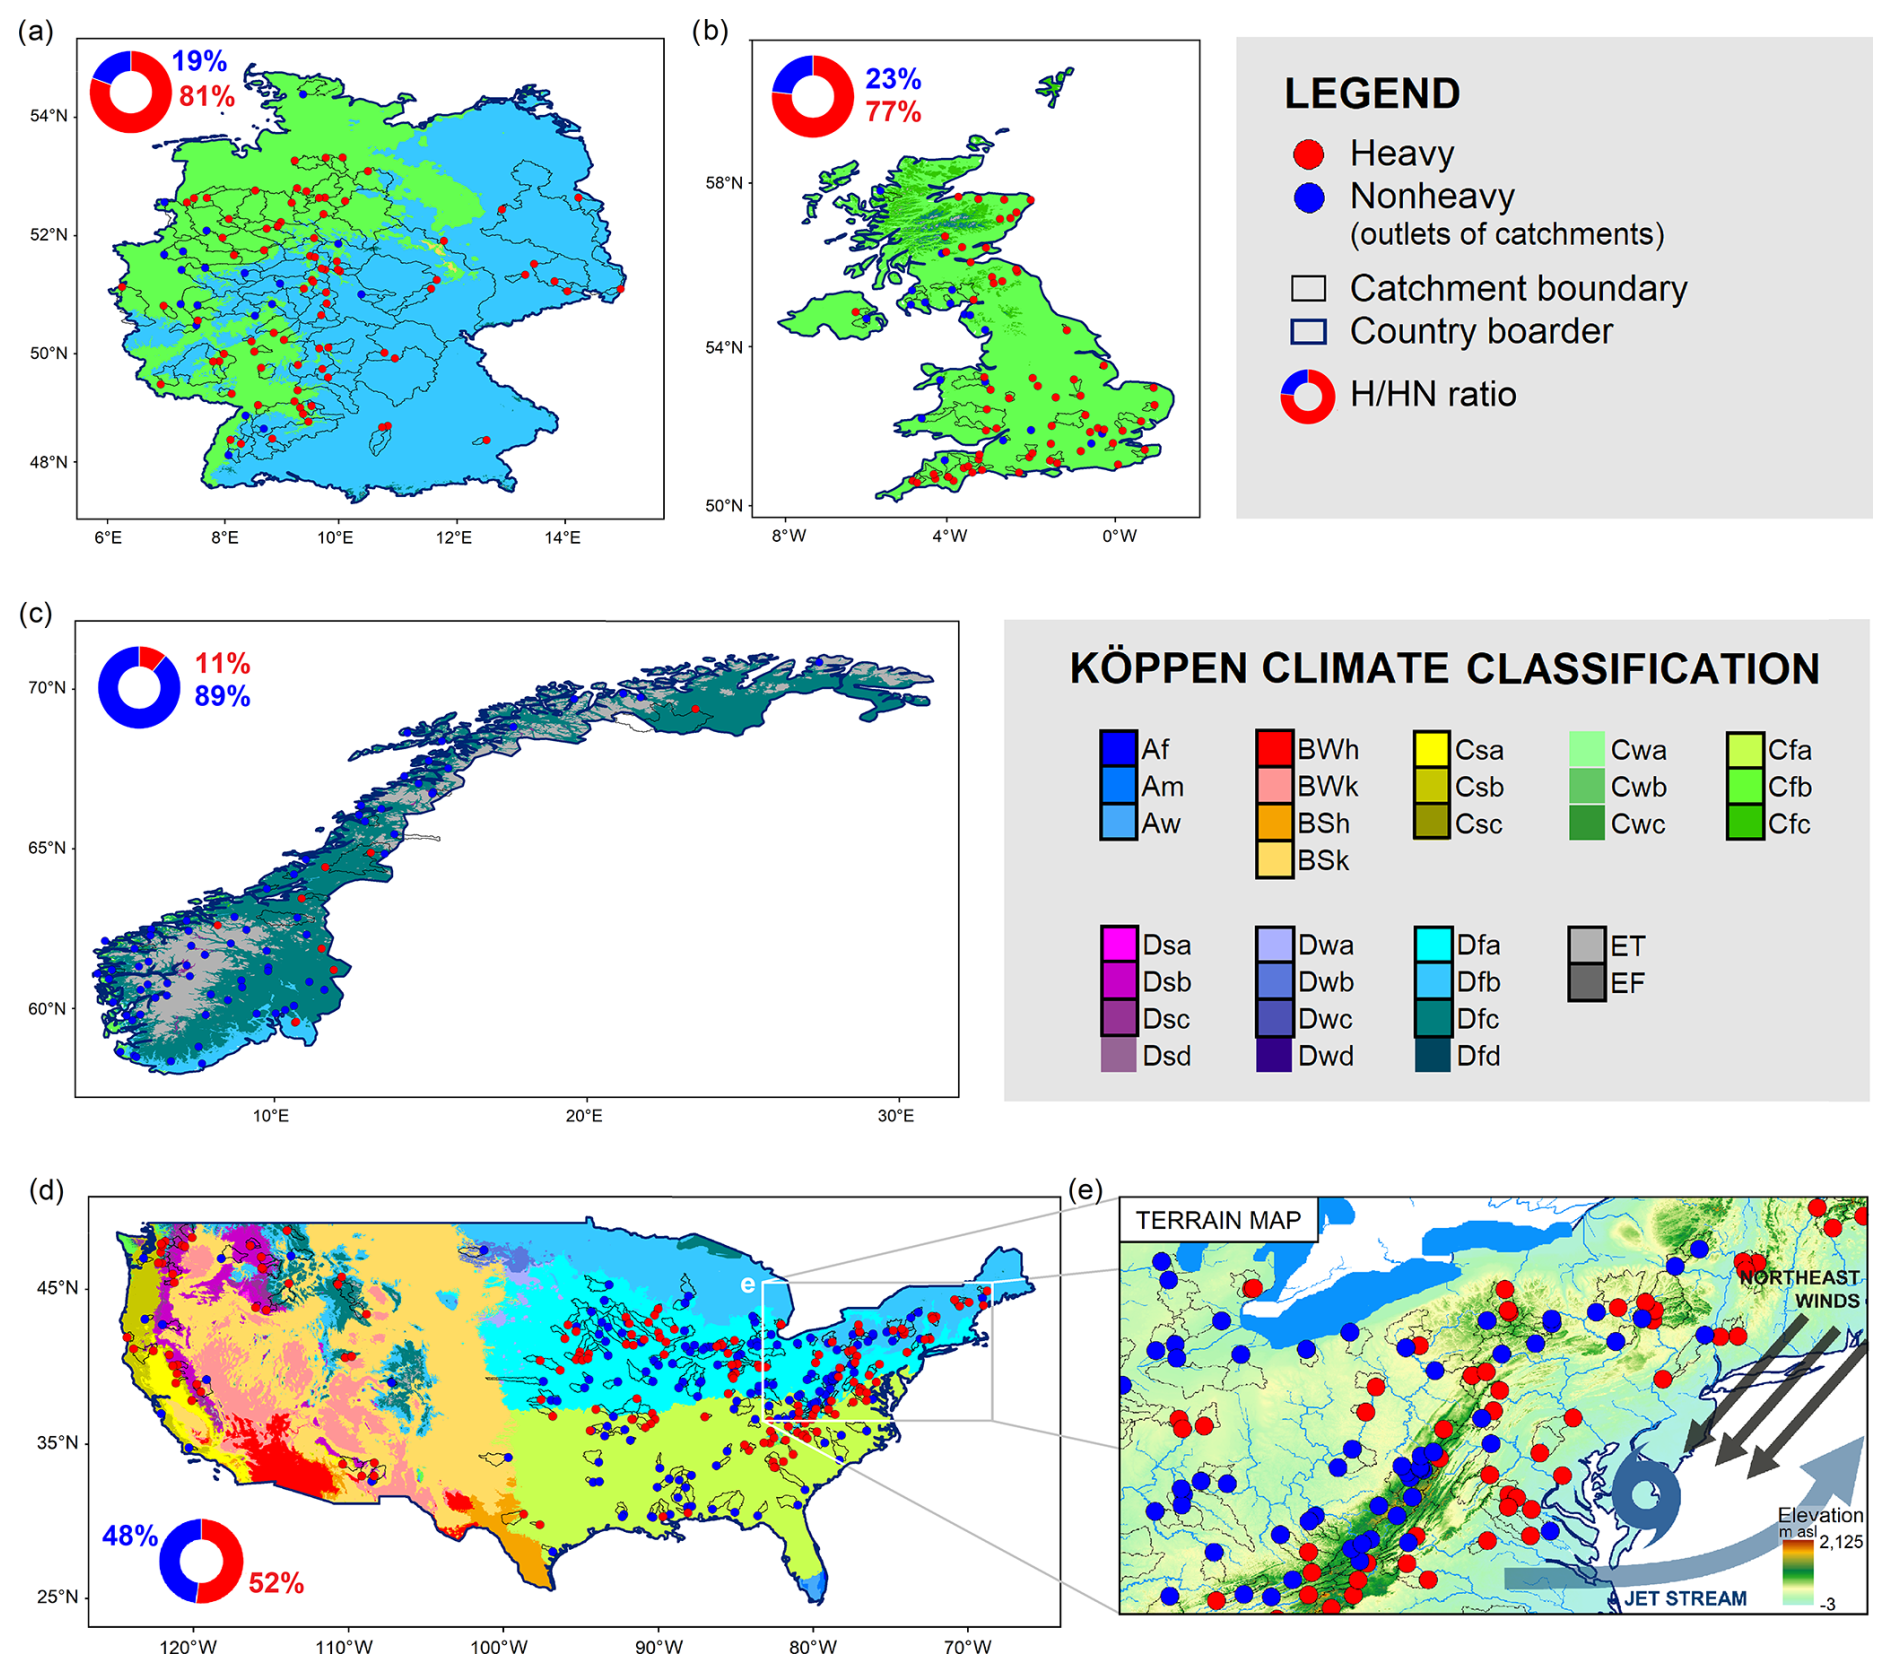
Figure 3Spatial distribution of dominant flood behavior. The dominant pattern determines the representative flood tail behavior of catchments across all study countries, whether it is heavy or non-heavy, which is defined by the major pattern recognized across seasons. Tail behavior is inferred by hydrograph recession exponents. The ratio of heavy- to non-heavy-tailed catchments is indicated as the H NH ratio. Köppen climate classification based on Beck et al. (2018), with present climate types outlined by bold dark frames in the legend. (a) ATL-DE: a total of 98 gauges represent catchments ranging from 110 to 23 843 km2, with a median area of 1195 km2. (b) ATL-UK: a total of 82 gauges represent catchments ranging from 15 to 9948 km2, with a median area of 283 km2. (c) NOR: a total of 82 gauges represent catchments ranging from 4 to 40 504 km2, with a median area of 234 km2. Note that some catchment boundaries are absent in the dataset for catchments in the UK and Norway. (d) CONUS: a total of 313 gauges represent catchments ranging from 66 to 9935 km2, with a median area of 1769 km2. (e) A zoomed-in map illustrates the discernible patterns of flood tail behavior resulting from specific flood generation processes influenced by the interplay between regional terrain and meteorological features. Note that the cylinder map projection is employed in these maps.
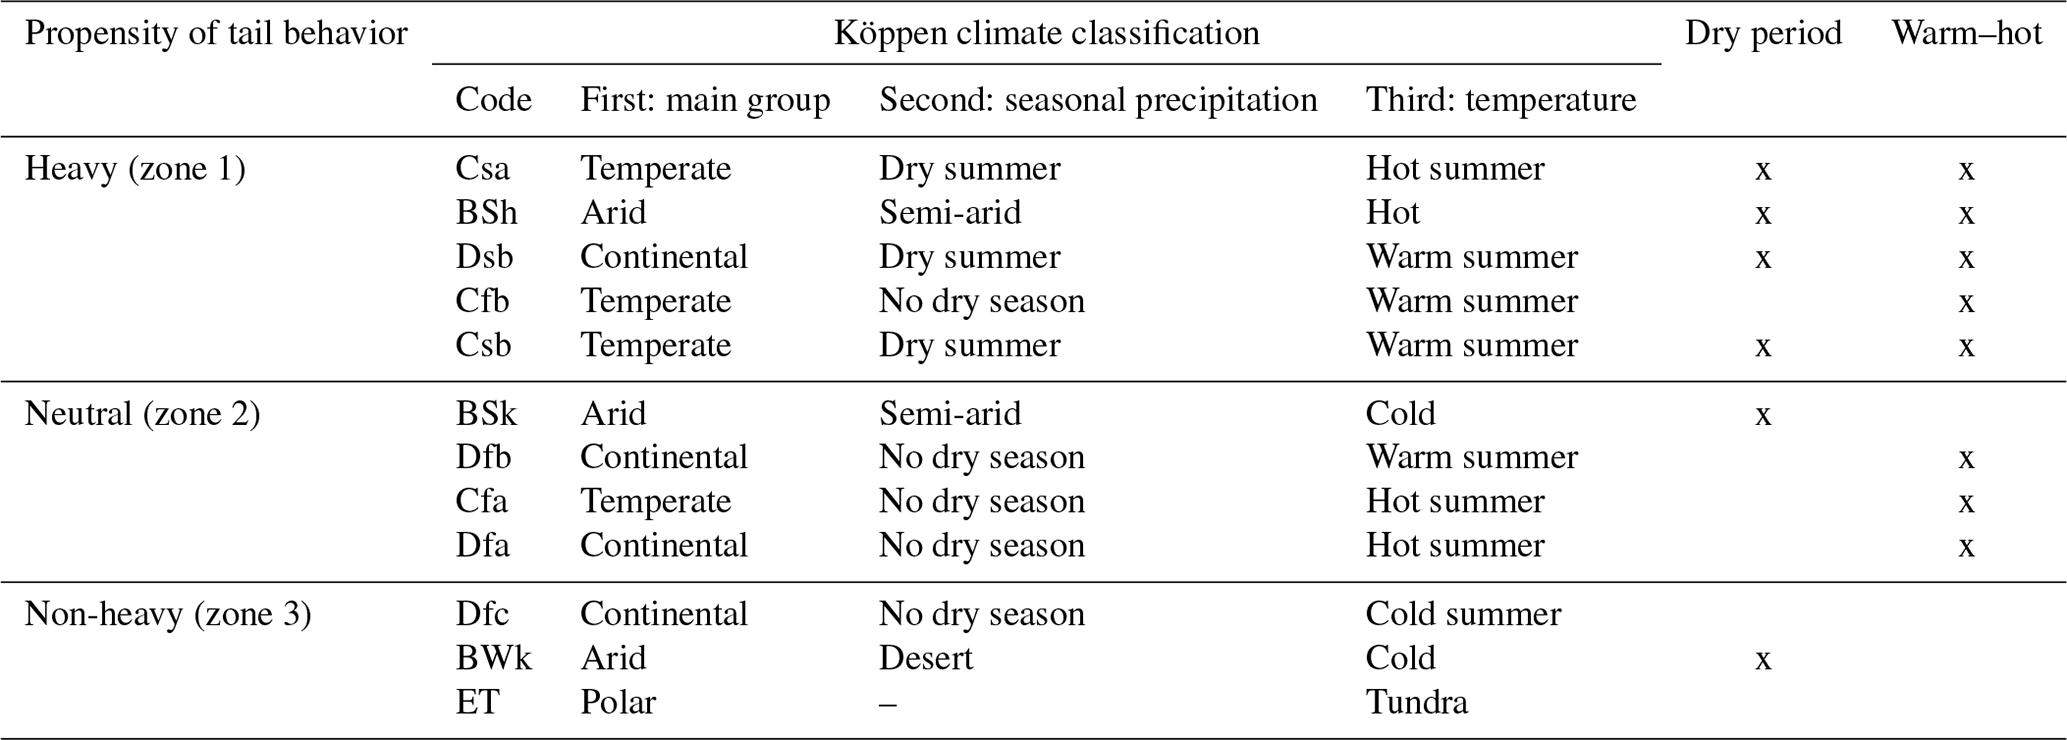
To obtain quantitative results, we examine the predominant flood tail behavior (inferred by recession exponents) of catchments across various climate regions and sort these regions based on the proportion of heavy-tailed catchments from high to low, as illustrated in Fig. 4. By categorizing climate type regions based on the proportion of heavy-tailed catchments, we establish three groups according to their propensity for flood tail behavior: heavy-tailed group, indicating regions with over 66.6 % of catchments being dominated by heavy tails; neutral group, encompassing regions with 33.3 % to 66.6 % of catchments being dominated by heavy tails and representing a relatively even propensity for both heavy and non-heavy tails in the catchments within these regions; and non-heavy-tailed group, representing regions with less than 33.3 % of catchments being dominated by heavy tails and denoting the propensity for non-heavy tails. According to the Köppen climate type classification, the overarching hydroclimatic characteristics can be delineated by three hierarchical features: (1) the main group, which encompasses five areas, namely tropical, arid, temperate, continental, and polar; (2) precipitation characteristics; and (3) temperature characteristics (the detailed quantitative criterion adopted is provided in Table S1). The findings are synthesized in Fig. 4 and Table 1, where the groups of flood tail behavior propensity are juxtaposed with the distinctive traits of each climate region.
Five climate regions are identified as having a higher propensity for heavy tails: a Mediterranean climate (Csa), hot semi-arid climate (BSh), humid continental climate (Dsb), temperate oceanic climate (Cfb), and cool-summer Mediterranean climate (Csb). These regions are characterized by warm to hot temperatures, often accompanied by occasional dry periods (except for Cfb). Based on the definition of Köppen climate classification, the occurrence of dry periods is a result of significantly uneven rainfall throughout the year, with at least 3 times as much rainfall in the wettest month compared to in the driest month. In semi-arid climates (BSh), there is generally lower annual rainfall (summarized in Table 1). Higher temperatures increase the potential evapotranspiration, often enhancing atmospheric moisture content and facilitating convective rainfall. Moreover, the dynamics of evapotranspiration in hillslopes influence the nonlinearity of runoff processes in catchments (Tashie et al., 2019). Dry periods can lead to lower catchment soil moisture, facilitating nonlinear runoff generation (Merz and Blöschl, 2009; Viglione et al., 2009). The findings presented here indicate that heavy-tailed flood behavior tends to emerge due to the substantial nonlinearity observed in catchment hydrological processes, facilitated by temporally uneven rainfall and higher evapotranspiration variation throughout the year.
We also find that certain regions show a relatively neutral propensity with regard to flood tail behavior (either heavy- or non-heavy-tailed) and aggregate them into the second group of Fig. 4 and Table 1. These regions encompass cold semi-arid climate (BSk), humid continental climate (Dfb), humid subtropical climate (Cfa), and humid continental climate (Dfa). While cold semi-arid climates (BSk) experience dryness, they are characterized by very limited precipitation. In the other three regions (Dfb, Cfa, and Dfa), heavy tails may still occur due to higher evapotranspiration, which is driven by high temperatures. However, the relatively even distribution of rainfall throughout the year in these regions may reduce the propensity for heavy tails, resulting in a smoother occurrence of heavy-tailed flood behavior. In summary, the regions in this group still have a certain probability of exhibiting heavy-tailed flood behavior. However, the absence of either a drier state of the catchment (caused by uneven rainfall) or higher temperatures (which ensure sufficient atmospheric moisture for rainfall and strengthened nonlinearity) could constrain the occurrence of such behavior.
In the last group, which includes regions with a subpolar climate (Dfc), tundra climate (ET), and cold desert climate (BWk), there is a higher propensity for non-heavy tails, and the two evident factors for heavy tails recognized from previous results are generally lacking. Runoff generation in Dfc and ET is primarily driven by snow dynamics, with snowmelt being the main contributor to runoff. Snowmelt is highly dependent on energy capacity, resulting in hydrological responses that are more likely to exhibit linearity. This favors the occurrence of non-heavy-tailed flood behavior (Thorarinsdottir et al., 2018). Catchments located in the region of BWk exhibit non-heavy-tailed behavior, which might also be attributed to limited precipitation in deserts.
In this study, we do not find substantial influences of the general hierarchical feature (especially the temperate and continental climate classifications) on the propensity for flood tail behavior.
To sum up this section, we identify the conjunction of dry periods and higher temperatures as crucial factors contributing to the dynamics of catchment storage, as defined by Kirchner et al. (2009) and Botter et al. (2009), in reference to the variable water volume in a catchment between dry and wet periods, shaped by factors like soil moisture, precipitation, and evapotranspiration (Merz and Blöschl, 2009; Zhou et al., 2022). Since achieving an equal distribution of study sites across climate types is challenging, we should remain mindful of potential bias due to sample sensitivity, particularly in regions with limited cases (e.g., Csa, BSh, and BWk). While excluding these groups does not affect the conclusions of Fig. 4 and Table 1, increasing the number of study sites in these climates could enhance our understanding.
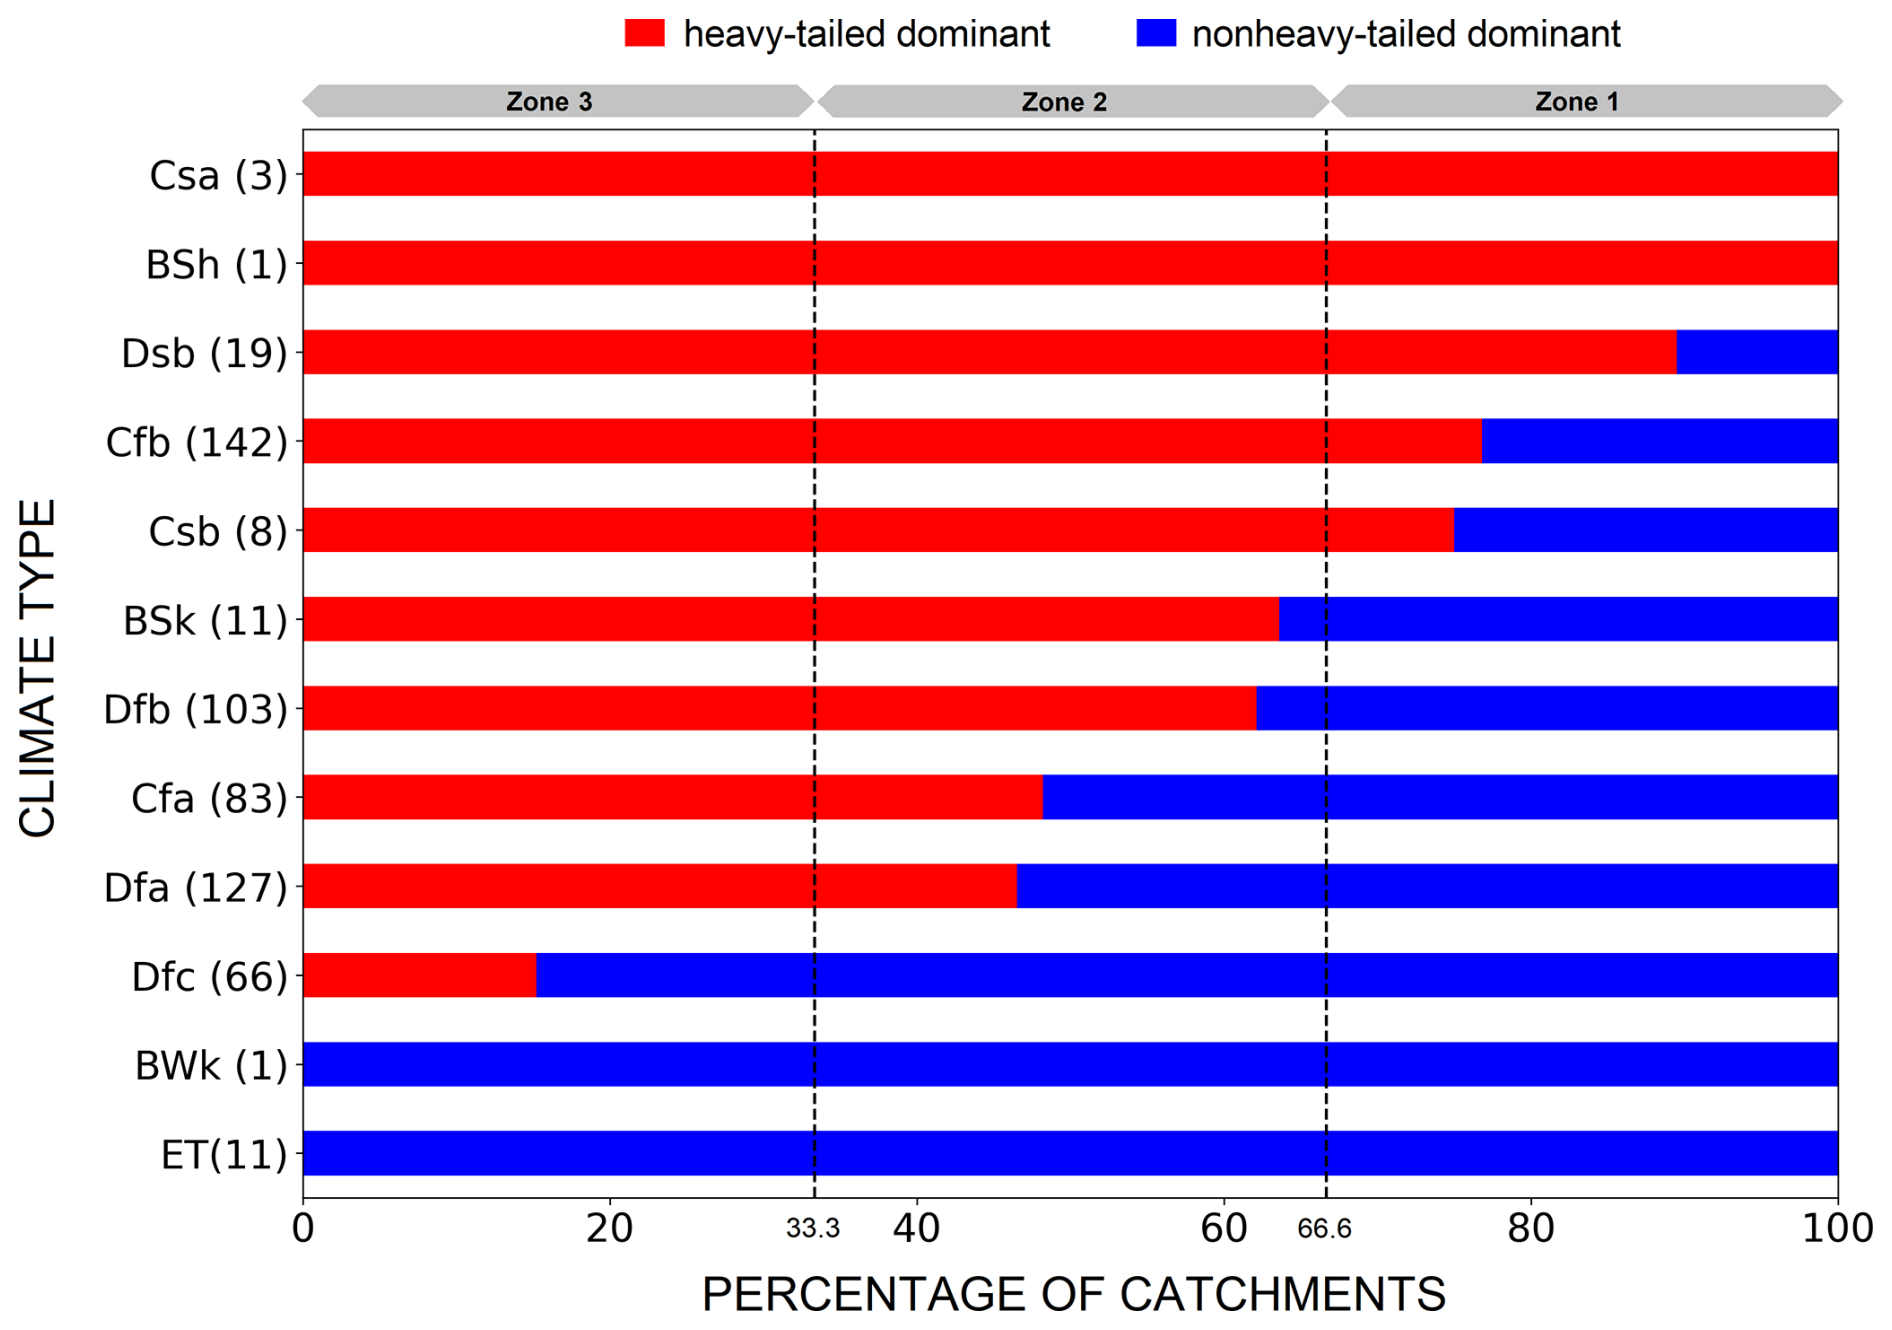
Figure 4Propensity of inferred flood tail behavior in diverse climate regions. Catchments are categorized by climate types and grouped by dominant (across seasons) heavy-tailed case percentages. Three groups are defined by heavy-tailed case proportions: zone 1 (> 66.6 %) represents heavy tails, zone 2 (33.3 %–66.6 %) is neutral, and zone 3 (< 33.3 %) represents non-heavy tails. The number of catchments in each climate region is indicated in parentheses after the climate type.
Table 1Comparison of inferred flood tail behavior propensity with climate characteristics.
4.3 Seasonal patterns of inferred flood tail behavior
We analyze the seasonality of flood tail behavior, an aspect of this phenomenon which has been previously suggested but remains poorly understood (Durrans et al., 2003; Basso et al., 2015; Macdonald et al., 2022). Figure 5 illustrates the spatial distribution of catchments with consistent tail behavior across seasons (i.e., with either heavy or non-heavy tails across all seasons; black triangles) and those with varying tail behavior across seasons (green dots). The percentages of catchments exhibiting inconsistent flood tail behaviors are, respectively, 33 %, 33 %, 17 %, and 34 % in the continental United States, Atlantic Europe–Germany, Atlantic Europe–the UK, and northern Europe. The results indicate that, although the majority of catchments tend to exhibit stable heavy- or non-heavy-tailed behavior, still, around one-third reveal changing patterns across seasons. Notably, there is a particularly high percentage of consistent patterns (83 %) in Atlantic Europe–the UK, likely due to the relatively uniform climate and terrain conditions across the country, characterized by continuous rainfall throughout a year (as shown in Fig. 3b).
We further investigate the dynamics of heavy- and non-heavy-tailed case studies across seasons in Fig. 6. Heavy-tailed case studies increase from spring to autumn (approximately corresponding to the growing season in the northern hemisphere) and decrease from autumn to spring (approximately corresponding to the dormant season in the Northern Hemisphere), as seen in the aggregated patterns across all regions (panel a). This pattern can be attributed to the increasing temperature in the growing season, during which increasing evapotranspiration consumes water storage in the shallow subsurface, escalating the nonlinearity of catchment responses (Tashie et al., 2019). The seasonality of evapotranspiration effects on catchment nonlinearity is supported by the findings of Tarasova et al. (2018), who observed clear seasonal dynamics of catchment average runoff coefficients. These coefficients tend to be higher in wet winters and lower in dry summers. It has been shown that significant variation in runoff coefficients is linked to high nonlinearity of hydrological responses, facilitating heavier-tailed floods. This phenomenon is often observed in dry catchments (Merz and Blöschl, 2009). Other studies confirmed that the nonlinearity of catchment responses favors the emergence of heavy-tailed flood behavior (Gioia et al., 2008; Rogger et al., 2012; Basso et al. 2015) and is often expressed by quicker recession during high-flow periods and greater stability during low-flow periods. Conversely, during the dormant season, nonlinearity decreases due to reduced competition from evapotranspiration and replenished water storage. We underscore that the significant variability in evapotranspiration amplifies the fluctuation of catchment storage conditions, causing soil moisture levels to oscillate between drier and wetter states. This alternation leads to the occurrence of both very small and very large events, which are characteristic of heavy-tailed flood behavior.
This dynamic is particularly pronounced in the continental United States (panel b), characterized by a wide range of geography and diverse temperate and continental climates. The number of inferred heavy-tailed cases can increase by 50 % from spring to autumn. In Atlantic Europe (panels c and d), heavy-tailed behavior is relatively prevalent and shows no significant distinction from spring to autumn but still experiences a noticeable decrease in winter, likely due to lower temperatures and evapotranspiration. Northern Europe (panel e) presents different patterns due to varying controls on runoff generation. A slight increase in heavy-tailed cases during the winter is observed, which could be attributed to a relatively higher contribution of rainfall-driven flood events during a season when snowmelt-driven events are less common.
We delve into the seasonal characteristics of this behavior further by combining the regional patterns based on climate classification.
We find that the grouping based on their distinct patterns of seasonality (Fig. 7a) closely aligns with the grouping based on the analysis of dominant patterns throughout the year (Fig. 4 and Table 1). Regions represented by red area in Fig. 7a (corresponding to the heavy-tailed group in Table 1) characterized by uneven rainfall distribution throughout the year based on the Köppen classification (see Table S1), leading to pronounced fluctuations between drier and wetter soil states, combined with higher evapotranspiration rates (indicated by warm to hot temperatures), tend to exhibit a dominance of heavy-tailed behavior in their hydrological responses across all seasons. In regions represented by the white area in Fig. 7a (corresponding to the neutral group in Table 1), unlike with the former group (red area), the rainfall pattern does not favor the emergence of heavy-tailed behavior as it is more evenly distributed in time. However, strong evapotranspiration, as depicted in Fig. 7b, characterizes these areas. The increased evapotranspiration during the growing seasons and the decreased evapotranspiration during the dormant seasons may be mainly responsible for the seasonality of flood tail behavior in these areas. Regions represented by the blue area in Fig. 7a (corresponding to the non-heavy-tailed group in Table 1) still exhibit dynamics in evapotranspiration across seasons, but the amounts are comparably low (Fig. 7b). In these regions, runoff generation is primarily influenced by snow dynamics, and most runoff results from snowmelt during the growing seasons, driven by energy availability. A previous study (Santos et al., 2018) found that such a flood generation process tends to display close-to-linear hydrological responses. These findings support the proposed mechanism of heavy-tailed flood behavior established in the spatial analyses and further demonstrate the pivotal effect of the variation in evapotranspiration and catchment storage on the emergence of heavy-tailed flood behavior.
We acknowledge that the hydroclimatic factors analyzed in this study may not account for all cases, as observed in regions classified as Cfa and Cfb, where the former has higher temperatures but fewer heavy-tailed case studies compared to the latter. This discrepancy could be attributed to either the uncertainty in inferring heavy-tailed floods through recession exponents (particularly for cases with values close to the threshold) or the presence of additional factors or mechanisms influencing flood tail behavior in these regions. It is crucial to note that most catchments classified as Cfb in our dataset are primarily from the UK, while those classified as Cfa are mostly from the southeastern US. Indeed, extreme floods are prevalent in the UK (European Environmental Agency, 2010; Robson, 2002), aligning with the inference based on our analysis of recession exponents. One of the primary causes of floods in the UK is suggested to be extreme or storm-related heavy rainfall (Osborn et al., 2000; Huntingford et al., 2014), which has been identified to some extent as a factor contributing to the emergence of heavy-tailed flood behavior (e.g., McCuen and Smith, 2008; Macdonald et al., 2022) but has not been explicitly included in the analyses of this study.
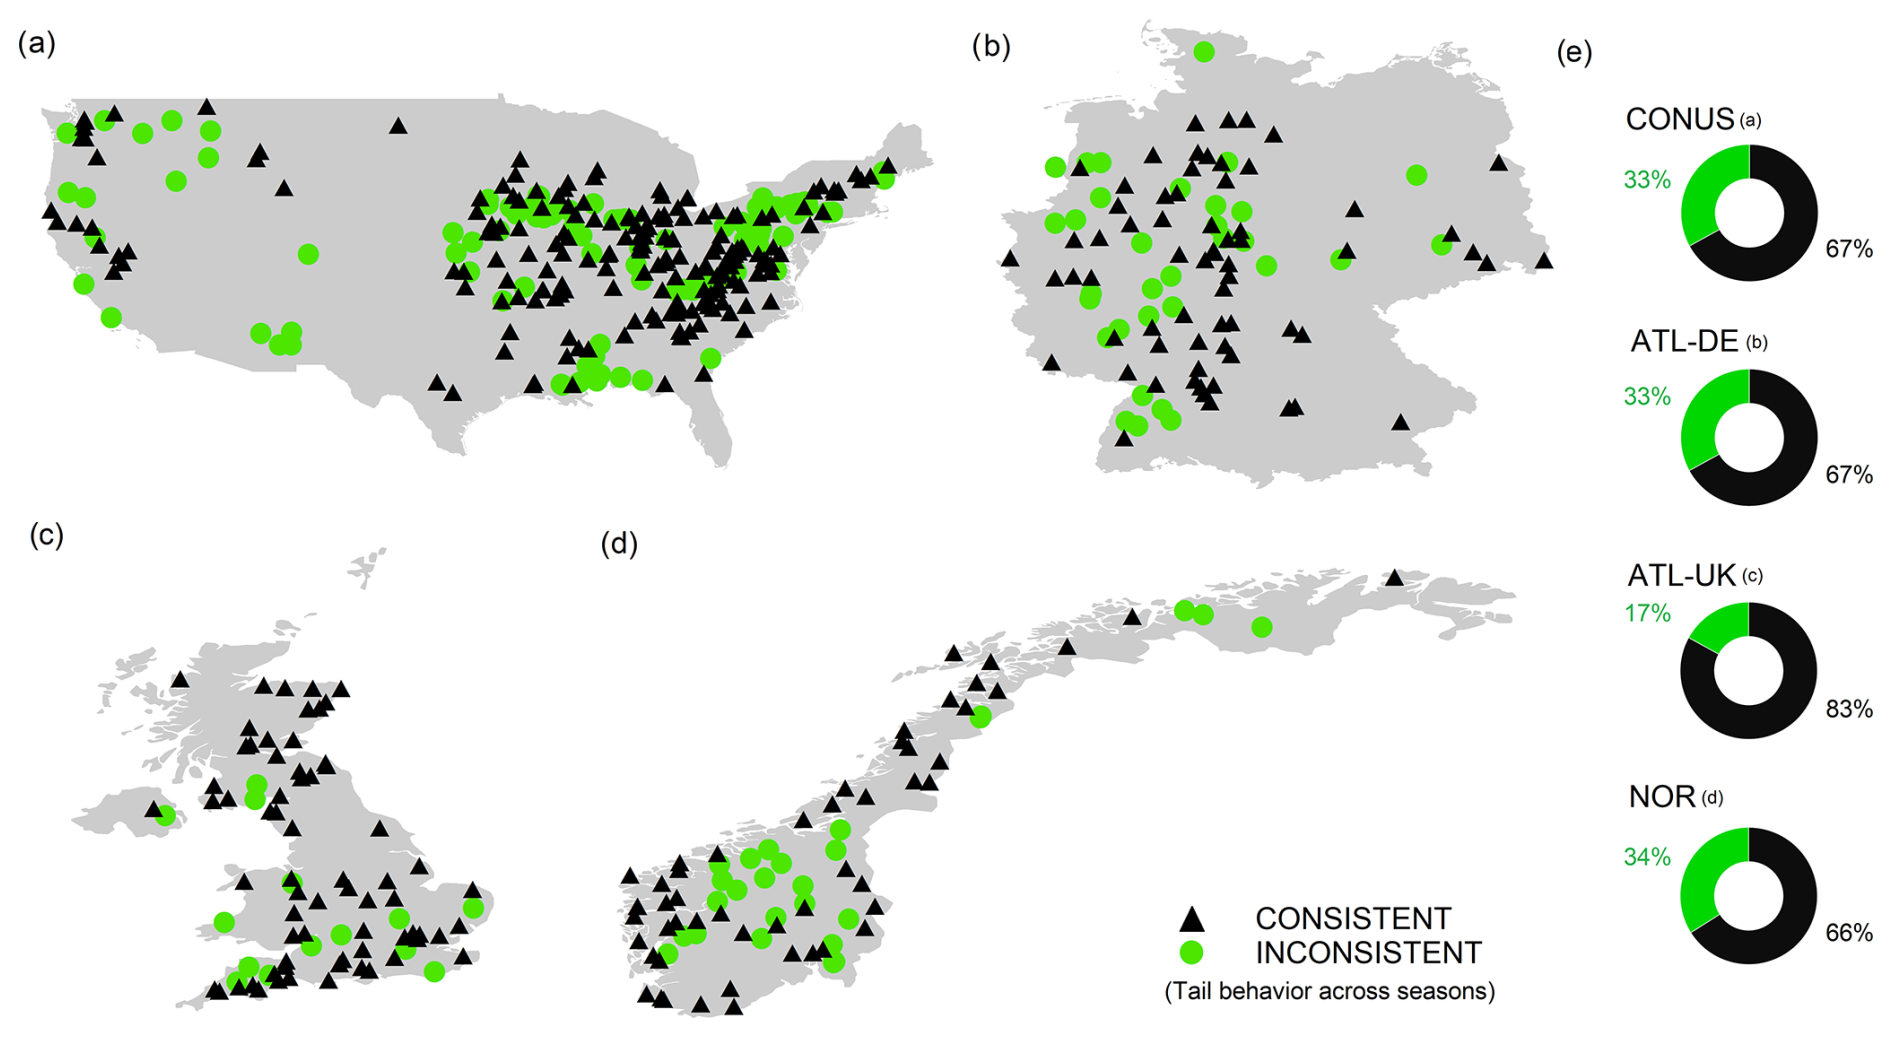
Figure 5Consistency of inferred flood tail behavior across seasons: (a) 290 catchments in CONUS, (b) 98 catchments in ATL-DE, (c) 81 catchments in ATL-UK, (d) 79 catchments in NOR, (e) percentage of consistent and inconsistent catchments in each country.
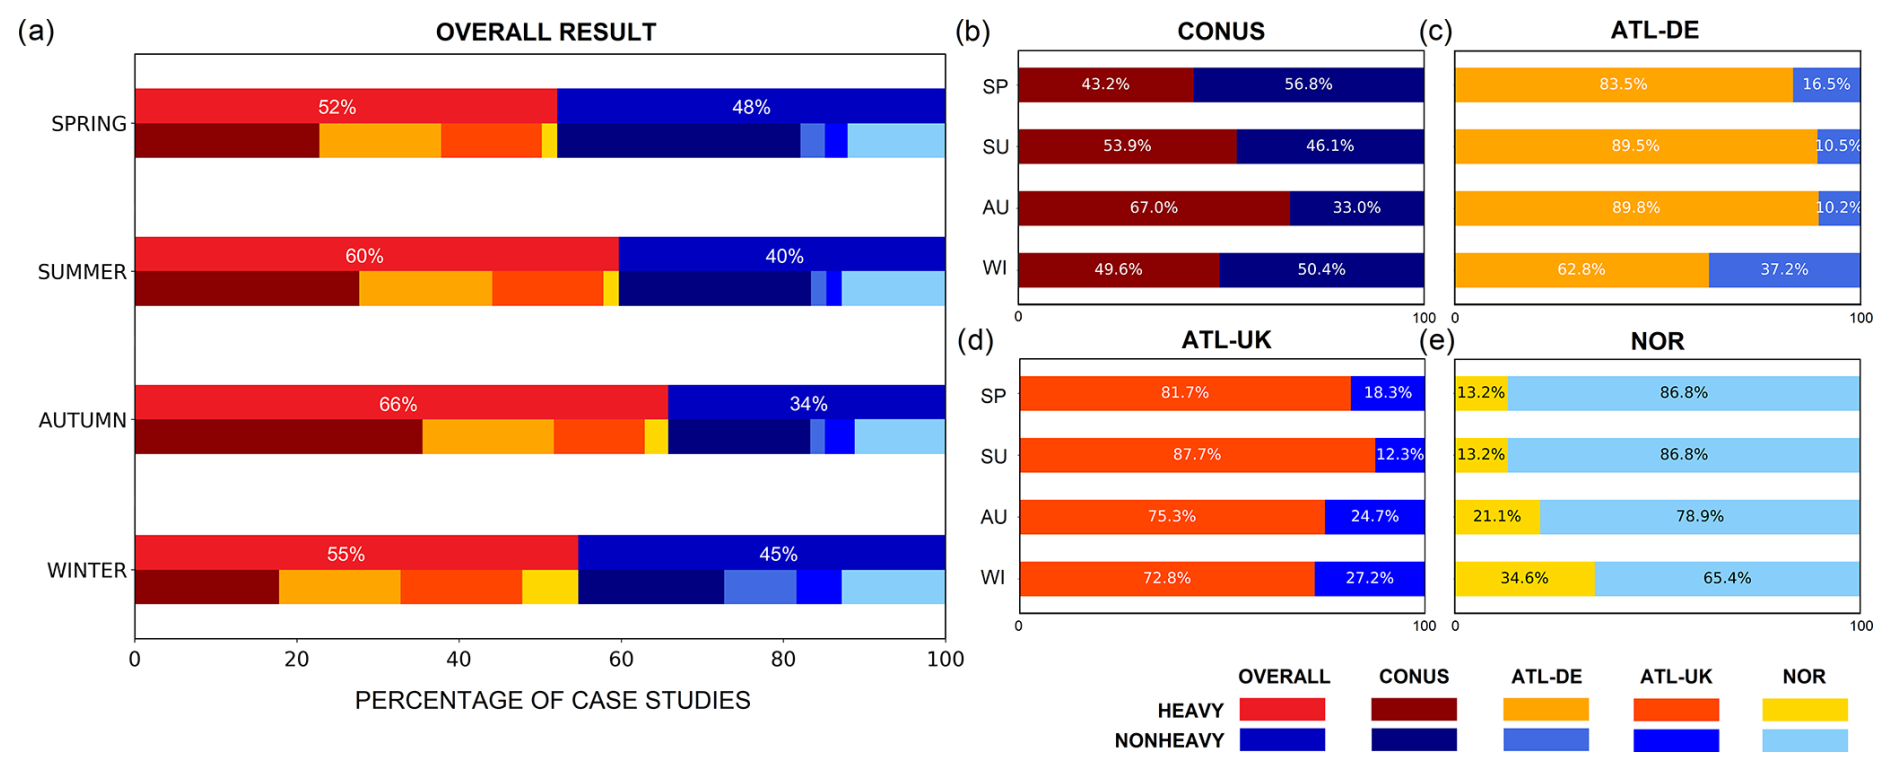
Figure 6Seasonal variations in the percentage of inferred flood tail behavior between heavy and non-heavy case studies. (a) The aggregated results encompass all study regions, while the second line provides a breakdown by country. In total, there are 1997 case studies composed of 540 in spring, 520 in summer, 543 in autumn, and 394 in winter. (b)–(e) Results for each study region (see Table A1 for detailed case numbers across seasons in each region).
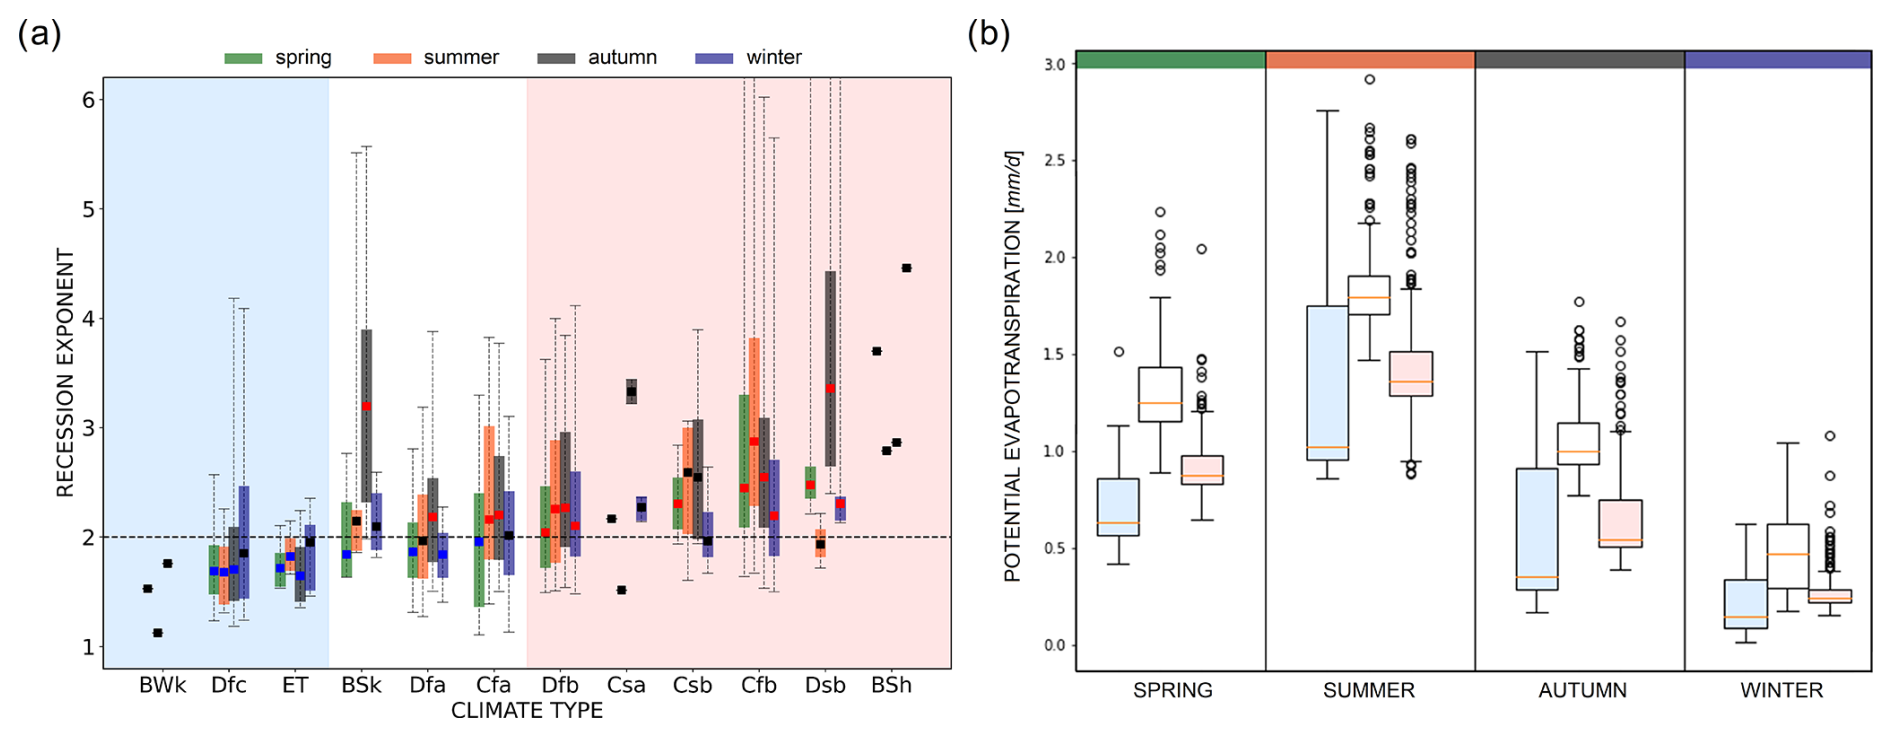
Figure 7Seasonal variations in recession exponents (inferred flood tail behavior) and potential evapotranspiration across diverse climate regions. (a) Seasonality of flood tail behavior. Case studies grouped by climate regions based on seasons. Medians of recession exponents in each group are compared with a value of two using Wilcoxon signed-rank test (significance level: 0.05). Red squares indicate significantly heavy-tailed (recession exponents > 2) groups, blue squares indicate significantly non-heavy-tailed (recession exponents < 2) groups, and black squares denote insignificance. Climate regions are categorized as follows: the red area denotes regions with prominent heavy tails across seasons, the blue area denotes regions with prominent non-heavy tails across seasons, and the white area denotes regions with significant seasonality in flood tail behavior. (b) Seasonality of derived potential evapotranspiration (Zomer et al., 2022) as a function of the seasonality characteristic of flood tail behavior.
4.4 Factors associated with catchment scales and their role in flood tail behavior
It remains unclear how flood tail behavior varies across catchment scales and what the underlying drivers and mechanisms are (Merz et al., 2022). We employ catchment nonlinearity, represented by recession exponents, to explore the influence of catchment scales on flood tail behavior, as depicted in Fig. 8. We utilize the categorization of regions characterized by distinct controls on flood tail behavior, primarily influenced by characteristic runoff generation processes (as with the three groups identified in Fig. 7), to elucidate the underlying mechanisms. Case studies are categorized into bins based on catchment area, with the median values represented by squares, interquartile intervals depicted by vertical bars, and catchment area ranges indicated by horizontal dashed bars. Panels (a), (b), (c), and (d) present results for all regions, regions exhibiting significant heavy tails across seasons, regions with a neutral propensity and seasonal variations, and regions displaying pronounced non-heavy tails across seasons, respectively. Each panel comprises a total of 30 bins, with approximately 67, 33, 24, and 10 case studies in panels (a), (b), (c), and (d), respectively (with minor variations due to rounding).
From the perspective of all case studies (Fig. 8a), the pattern appears to be somewhat unclear. Apart from the case studies involving extremely small and large catchment areas, there seems to be a decrease in nonlinearity as catchment area increases. Nevertheless, the relationship is rather weak. These findings align with the results of previous studies (e.g., Merz and Blöschl, 2009; Villarini and Smith, 2010; Smith et al., 2018), which, by using different indices to quantify the heaviness of upper tails, have suggested a relatively weak inverse correlation between catchment area and the occurrence of heavy-tailed flood behavior.
However, we can evidently clarify this relationship by considering the distinct runoff generation processes recognized in different regions. Panel (b) illustrates that catchment area plays no significant role in catchment nonlinearity in regions characterized by prominent heavy tails. On the other hand, a clear inverse relationship between nonlinearity and catchment area is shown in panel (c), representing regions characterized by a neutral propensity for heavy and non-heavy tails. In contrast, a proportional relationship between nonlinearity and catchment area is identified in panel (d), representing regions characterized by prominent non-heavy tails.
As shown in the previous sections, nonlinearity in neutral regions is primarily driven by high evapotranspiration facilitated by high temperatures. When the catchment area increases, it has a higher chance of encompassing diverse terrain types, including areas with higher altitudes, such as mountainous regions. Increased altitude tends to result in lower temperatures and evapotranspiration rates, negating the evapotranspiration variation and its impact on catchment nonlinearity, which is the main driver of nonlinearity in this region and thus substantiates an inverse relationship (Fig. 8c). In regions with prominent heavy tails (Fig. 8b), nonlinearity is generated from the interplay of uneven rainfall and evapotranspiration dynamics, and the enlargement of catchments does not substantively change this relationship. For regions with prominent non-heavy tails (Fig. 8d), the underlying mechanisms are similar to the neutral regions but work in the opposite direction due to the differently dominant mechanisms. Recall that the runoff process in this region is generally dominated by snow dynamics. The region is mainly located in high-mountain or high-latitude areas. As catchments expand, more diverse terrain is encompassed, potentially introducing a mixture of flood generation processes due to the incorporation of lowland or coastal areas. Particularly, more rain-on-snow events or rainfall-driven events may be encompassed in the same catchment together with snowmelt-driven events (Vormoor et al., 2016). Therefore, an increase in nonlinearity is facilitated due to the mixture of flood types, favoring the emergence of heavier tails in flood distributions (Tarasova et al., 2020). It should be noted that the tail patterns, based on Fig. 8d, are still more likely to be non-heavy tails (i.e., recession exponents below 2), even though nonlinearity indeed appears to show an increasing tendency along with catchment area.
These findings disentangle the relationship between flood tail behavior (inferred from catchment nonlinearity) and catchment scale and provide a mechanistic understanding that underscores the role of variability in runoff generation processes introduced by the expansion of catchment area.

Figure 8Catchment nonlinearity as a function of catchment area. The recession exponents, representing catchment nonlinearity, have been evenly grouped into bins based on catchment area. The squares denote the median values, vertical bars represent the interquartile intervals of the recession exponents, and horizontal dashed bars indicate the catchment area ranges for each bin. (a) All regions (encompassing case studies, n= 1997). Panels (b)–(d) show case studies separately according to categorization recognized in Fig. 7. (b) Regions with prominent heavy tails (n= 978). (c) Regions with seasonality and neutral propensity for flood tail behavior (n= 733). (d) Regions with prominent non-heavy tails (n= 286). In each panel, there are a total of 30 bins, each containing approximately 67, 33, 24, and 10 case studies in panels (a), (b), (c), and (d), respectively (with slight variations due to rounding).
We have confirmed the effectiveness of the recession exponent in identifying heavy-tailed flood behavior in case studies across study regions with varying degrees of propensity for such behavior: heavy-tailed richness (Atlantic Europe), neutrality (the continental United States), and non-heavy-tailed richness (northern Europe). The same approach is also capable of predicting river basins where extreme floods are more likely to occur (which is a proxy for heavy-tailed flood behavior), as shown by Basso et al. (2023). In fact, the recession exponent reflects catchment nonlinearity, a robust driver of heavy-tailed flood behavior (Fiorentino et al., 2007; Struthers and Sivapalan, 2007; Gioia et al., 2008; Rogger et al., 2012; Basso et al., 2015; Merz et al., 2022; Basso et al., 2023; Wang et al., 2023), and it can be robustly estimated from relatively short series of daily streamflow (e.g., Chen and Krajewski, 2016; Biswal and Marani, 2010; Dralle et al., 2017; Tashie et al., 2019).
We further identify key drivers of heavy-tailed flood behavior by conducting large-scale physio-climatic analyses. Specifically, our findings reveal that regions with a pronounced propensity for heavy tails exhibit distinct characteristics: the presence of a dry period and higher temperatures (as shown in Fig. 4 and Table 1). This aligns with previous studies based on the mathematical analysis which associates heavier-tailed flood behavior with a lower frequency of streamflow-triggering rainfall events. Such lower frequency often results from erratic rainfall patterns and higher rates of evapotranspiration, leading to drier catchment conditions (Botter, 2010; Basso et al., 2016). In line with this theory, our large-scale analysis provides evidence by showing a prevalent propensity for heavy tails in regions characterized by uneven rainfall patterns throughout the year (i.e., more erratic rainfall), contributing to the presence of dry periods, along with higher potential evapotranspiration rates, as indicated by higher temperatures.
The underlying mechanism of the emergence of heavy-tailed flood behavior is attributed to variations in catchment water storage. In wetter catchments, relatively stable runoff coefficients are observed due to consistently high levels of soil moisture across events. In contrast, drier catchments exhibit larger variations in runoff coefficients between small and large events (Merz and Blöschl, 2009; Viglione et al., 2009). This increased variability in runoff coefficients results in high nonlinearity of catchment responses, favoring heavy-tailed flood behavior. Previous studies have suggested the prevalence of heavy tails in drier catchments (Molnar et al., 2006; Merz and Blöschl, 2009; Guo et al., 2014). Our findings show that this mechanism is primarily driven by concurrent higher evapotranspiration and lower rainfall in summer, as well as lower evapotranspiration and higher rainfall in winter. These conditions lead to variations in storage, enabling the occurrence of both very small and very large flood events, thereby resulting in heavy-tailed flood behavior. In line with this, Tarasova et al. (2018) observed clear seasonal dynamics of catchment average runoff coefficients in Germany, with higher values in wet winters and lower values in dry summers.
The seasonality of flood tail behavior has been suggested in previous studies but remains less understood (Basso et al., 2015; Smith et al., 2018; Macdonald et al., 2022). It is noteworthy that more than one-third of catchments appear to exhibit inconsistent flood tail behavior across seasons (Fig. 5). In these catchments, some seasons show a tendency toward non-heavy tails, while others tend to display heavy tails. Identifying these catchments and understanding the factors driving them to exhibit heavy tails is vital for hazard assessment. This understanding allows us to pinpoint catchments where extreme floods could potentially occur, even if methods solely based on annual maximum floods might estimate the flood tail as non-heavy based on annual maxima, when heavy tails can still occur within a single season. We have identified that regions characterized by stronger evapotranspiration favor this seasonality of flood tail behavior as it may lead to larger variations in water storage, particularly in the growing seasons (highlighted in white in Fig. 7). This finding aligns with previous studies that have observed similar seasonal dynamics in the nonlinearity of hydrological responses (Tashie et al., 2019; Tarasova et al., 2018).
In this study, we found that the relationship between flood tail behavior and catchment scale can be explained by changes in catchment nonlinearity, influenced by distinct flood generation processes. Previous studies have suggested varied relationships between flood tail behavior and catchment scale, with some indicating that smaller catchments exhibit heavier tails (Meigh et al., 1997; Pallard et al., 2009), while others report weak correlations (Merz and Blöschl, 2009; Villarini and Smith, 2010) or no significant relationship (Morrison and Smith, 2002; Smith et al., 2018). In contrast, our findings (Fig. 8) clarify these patterns by considering region classifications based on dominant flood generation processes, which determine whether the nonlinearity of hydrological response increases or decreases when catchments expand.
We acknowledge that our methodology assumes that flood generation arises from the interplay of precipitation, infiltration, soil moisture dynamics, temporary storage, and discharge. It is less applicable where these processes are bypassed, such as in regions dominated by snowmelt or where soil moisture and catchment storage play minimal roles (e.g., in cases of intense precipitation where impervious surfaces and drainage systems predominantly control flood responses). These represent inherent limitations of the framework.
To summarize the findings and underscore the contributions of this study, we benchmark them against the existing hypotheses proposed in the state-of-the-art review of heavy-tailed flood distributions (Merz et al., 2022). These hypotheses (highlighted in italics) provide a framework for understanding the factors influencing flood tail behavior, and our study sheds light on which of these hypotheses receive stronger support or require further refinement. We acknowledge that this summary does not cover all the hypotheses proposed in the review due to the scope of this study. Instead, it primarily focuses on the compartments of the atmosphere and catchments.
“Hypothesis 2 (of the review paper): the characteristic flood generation process shapes the upper flood tail catchments.” While previous studies have hinted at the possibility that regions where flood generation is dominated by rainfall-driven floods tend to exhibit heavier-tailed flood behavior compared to regions dominated by snowmelt (Bernardara et al., 2008; Thorarinsdottir et al., 2018), more explicit process explanations are desired. In line with this hypothesis, we present further evidence showing that the specific nonlinearity inherent in each flood generation process is the primary driver of flood tail behavior. Specifically, we show that, in snowmelt-dominated regions, such as in the case studies in Norway, hydrological responses closely resemble linear behavior, and, thus, floods tend to exhibit pronounced non-heavy-tailed behavior. Conversely, heavy-tailed floods are more prominent in regions like the UK, where hydrological responses display nonlinearity (as indicated by recession exponents above 2). In these areas, flood generation processes are primarily driven by rainfall events. Furthermore, our study reveals that flood generation processes are significantly influenced by the interplay between regional terrain and meteorological features. These factors, in turn, impact the nonlinearity of hydrological responses and can determine the occurrence of heavy or non-heavy tails in flood distributions (Fig. 3e). Therefore, this study provides evidence that the influence of flood generation processes is closely tied to the nonlinearity of hydrological behaviors. This finding enhances the understanding of these processes, supporting advancements in this area, as suggested by Merz et al. (2022).
“Hypothesis 3: mixture of flood event types generates heavy tails.” One argument presented in this hypothesis is that heavy tails may arise from the presence of a flood type displaying heavy-tailed behavior within a mixture of processes (Morrison and Smith, 2002; Villarini and Smith, 2010). However, studies exploring the relationship between the mixture of flood types and flood tails have been lacking. Our research addresses this gap by demonstrating that, in regions primarily characterized by non-heavy-tailed floods, driven mainly by snowmelt, the tail heaviness increases as catchment areas expand. This increase is likely to be attributable to the incorporation of additional flood types, especially those associated with rainfall processes occurring in lowland and coastal areas, as catchment areas expand. Thus, this study addresses the knowledge gap by showing that a mix of flood event types can result in heavy-tailed flood behavior. It further suggests that this is especially critical for regions transitioning from snow-dominated flood generation processes to more mixed types, as observed in northern Europe (Tarasova et al., 2023).
“Hypothesis 4: non-linear response to precipitation causes heavy flood tails.” Studies have consistently highlighted the significance of nonlinearity in hydrological processes within catchments as a key determinant in the emergence of heavy-tailed flood behavior (e.g., Struthers and Sivapalan, 2007; Rogger et al., 2012; Basso et al., 2015). In our research, we contribute by introducing a quantitative approach that employs hydrograph recession exponents as a measure of nonlinearity in flood tail analyses and validate its effectiveness in identifying heavy-tailed flood behavior in a large-scale analysis. While nonlinearity has long been acknowledged as a contributing factor, our work uniquely utilizes this driver as a reliable index by establishing a specific recession exponent threshold that robustly discriminates heavy-tailed distributions, characterized by power-law tails, from non-heavy ones, offering a valuable tool to the field. Furthermore, our large-scale analysis identifies rainfall unevenness and high temperatures as crucial drivers behind the observed nonlinearity in flood responses. Specifically, they intensify catchment soil dryness and amplify water balance storage variations, thereby facilitating both very small and very large runoff events, translating into heavy-tailed flood behavior. In summary, this study proposes a quantification approach based on these acknowledged, robust drivers using daily streamflow observations. This approach paves a broader path for exploring the relationship between flood tail behavior and other physio-climatic variables, enhancing our understanding of extreme hydrological events.
“Hypothesis 5: drier catchments have heavier flood tails due to interaction of water balance processes.” In alignment with previous studies that suggest that the water balance processes in drier catchments contribute to the emergence of heavy-tailed flood behavior (e.g., Molnar et al., 2006; Merz and Blöschl, 2009; Guo et al., 2014), we emphasize the critical interplay between uneven rainfall and evapotranspiration dynamics in facilitating these processes and in shaping such the behavior. Specifically, our findings show that heavy-tailed flood behavior is more likely to occur in catchments characterized by lower rainfall and higher evapotranspiration in one season (e.g., summer) in contrast with more rainfall and lower evapotranspiration in another season (e.g., winter). When one of these conditions is lacking, heavy-tailed behavior may be less pronounced. For example, regions classified as BSh and BSk, both of which exhibit semi-arid characteristics based on their rainfall patterns, exhibit differences in the prevalence of heavy-tailed cases. BSk regions, despite their semi-arid status, exhibit fewer pronounced heavy-tailed cases due to colder temperatures (Table 1) and only show a higher rate of heavy-tailed cases during the summer (Fig. 7). This interplay highlights the importance of considering the seasonality of flood tail behavior, particularly in regions that do not experience significant dry periods based on their rainfall patterns. In such regions, heavy tails are still likely to occur in seasons with higher evapotranspiration rates (indicated by the white area in Fig. 7). The interaction between evapotranspiration and the temporal characteristics of rainfall is suggested to be the underlying reason why drier catchments favor heavy-tailed floods, as observed in their seasonal flood tail behavior.
“Hypothesis 6: smaller catchments have heavier flood tails due to less pronounced spatial aggregation effects.” A commonly debated question among hydrologists is whether the roles identified in large catchments are applicable to smaller ones and vice versa. This issue has also arisen in discussions regarding flood tail heaviness, but evidence on the matter has been scattered. While smaller catchments have been suggested to exhibit heavier tails (Meigh et al., 1997; Pallard et al., 2009), previous research has revealed weak (Merz and Blöschl, 2009; Villarini and Smith, 2010) to no (Morrison and Smith, 2002; Smith et al., 2018) correlations between catchment size and tail heaviness. Our findings (Fig. 8) help clarify the relationship between catchment nonlinearity (used as an indicator of tail heaviness) and catchment size. We observe distinct patterns among regions characterized by strong, neutral, and weak conditions of heavy-tail behavior. These findings underscore the importance of considering the dominant flood generation processes specific to each region. To thoroughly address how catchment sizes affect flood tail behavior, it is important not only to focus on the size itself but also to investigate how flood generation processes vary across different sizes within their study areas. This nuanced understanding can illuminate how catchment size interacts with flood dynamics – either amplifying, reducing, or exerting no significant effect on heavy-tailed flood behavior.
We analyze common streamflow dynamics to infer heavy-tailed flood behavior by employing a recently developed index of tail heaviness, namely the hydrograph recession exponent. The wide-ranging dataset allows for the unveiling of spatial and seasonal patterns of flood tail behavior and allows us to construct a geography of heavy-tailed flood distributions. We analyze and discuss the underlying influences of hydroclimatic settings on geographical patterns as represented by Köppen climate characteristics. The main findings of this study are summarized below.
Capability of recession exponents for detecting heavy-tailed flood behavior. The capability of this index to discern between case studies which display heavy-tailed flood distributions and those that exhibit non-heavy-tailed behavior is validated by using empirical data from catchments across an extensive dataset covering Atlantic Europe, northern Europe, and the continental United States. This extensive analysis provides a well-rounded evaluation due to the inclusion of regions with divergent conditions, such as rainfall-driven floods (Atlantic Europe and the continental United States) versus snowmelt-driven floods (northern Europe), as well as regions characterized by single or dominant hydroclimates (Atlantic and northern Europe) versus those with mixed hydroclimates (the continental United States).
Regional propensity for heavy-tailed flood behavior. The Atlantic Europe area is characterized by a propensity for heavy-tailed flood behavior, which is prevalent in these regions. Conversely, a tendency for non-heavy-tailed flood behavior is predominant in northern Europe under current hydroclimatic conditions, as indicated by the degree of catchment nonlinearity in each region. The continental United States exhibits a mixture of heavy- and non-heavy-tailed behavior. This is likely the result of overarching climatic characteristics, which also shape river network morphology, interacting with diverse regional physio-climatic settings. We emphasize that the relatively more uniform climates in the Atlantic and northern European regions covered in this study contribute to a dominant presence of heavy or non-heavy-tailed behaviors in these countries, while the continental United States encompasses more complex patterns due to more diverse hydroclimatic conditions.
Factors influencing heavy-tailed flood behavior. The presence of simultaneous dry periods (defined by uneven rainfall throughout the year) and higher temperatures emerges as the pivotal condition favoring heavy-tailed flood behavior. Drier catchments alter the runoff generation process, resulting in higher nonlinearity of catchment responses, while higher temperatures elevate evapotranspiration rates, enhancing nonlinearity but also maintaining atmospheric moisture, preventing precipitation limitations. The absence of either condition diminishes the prevalence of heavy-tailed flood behavior. More generalized climate categorizations like arid, temperate, and continental exhibit minimal influence on our results.
Seasonality of flood tail behavior. We contribute to a better understanding of the seasonality of flood tail behavior. Around two-thirds of catchments exhibit consistent behavior across seasons, with the remaining one-third demonstrating seasonality. Heavy-tailed flood behavior is more likely during the growing season (spring to autumn) and is diminished during the dormant season (autumn to winter). These findings hint at the role of temperature-driven evapotranspiration dynamics for the emergence of heavy-tailed flood behavior, which is particularly important in regions which do not experience simultaneous dry conditions and high temperatures.
Influences of catchment area on flood tail behavior. We elucidate that the impacts of catchment size on flood tail behavior are primarily contingent on the dominant flood generation processes within each region. Specifically, the expansion of catchment area tends to have three distinct effects: (1) it diminishes tail heaviness in regions with moderate nonlinearity, characterized by strong evapotranspiration dynamics and relatively even rainfall throughout the year. This reduction is attributed to the smoothing of evapotranspiration variations. (2) Conversely, in regions with low nonlinearity, characterized by snowfall dynamics, increasing catchment area intensifies tail heaviness. This effect results from the inclusion of diverse flood types, particularly rainfall-driven floods. (3) In regions with high nonlinearity, characterized by simultaneous strong evapotranspiration dynamics and uneven rainfall throughout the year, catchment size expansion appears to have no significant impact on tail heaviness. This lack of effect is likely due to the absence of a significant influence on rainfall patterns, critical in determining the presence of drier soil conditions.
We propose that a key mechanism driving the emergence of heavy-tailed flood behavior is the temporal variability in catchment storage, primarily induced by simultaneous high evapotranspiration rates and drier soil conditions. This variation in storage can lead to the occurrence of both very small and very large flood events, ultimately resulting in heavy-tailed flood behavior. In contrast, when the catchment remains consistently wet or dry, the magnitude of generated floods tends to fall within a similar range, leading to non-heavy tails in the distribution. It is important to emphasize that this mechanism is influenced by seasonality and catchment size, both of which play a role in shaping the variability in catchment storage.
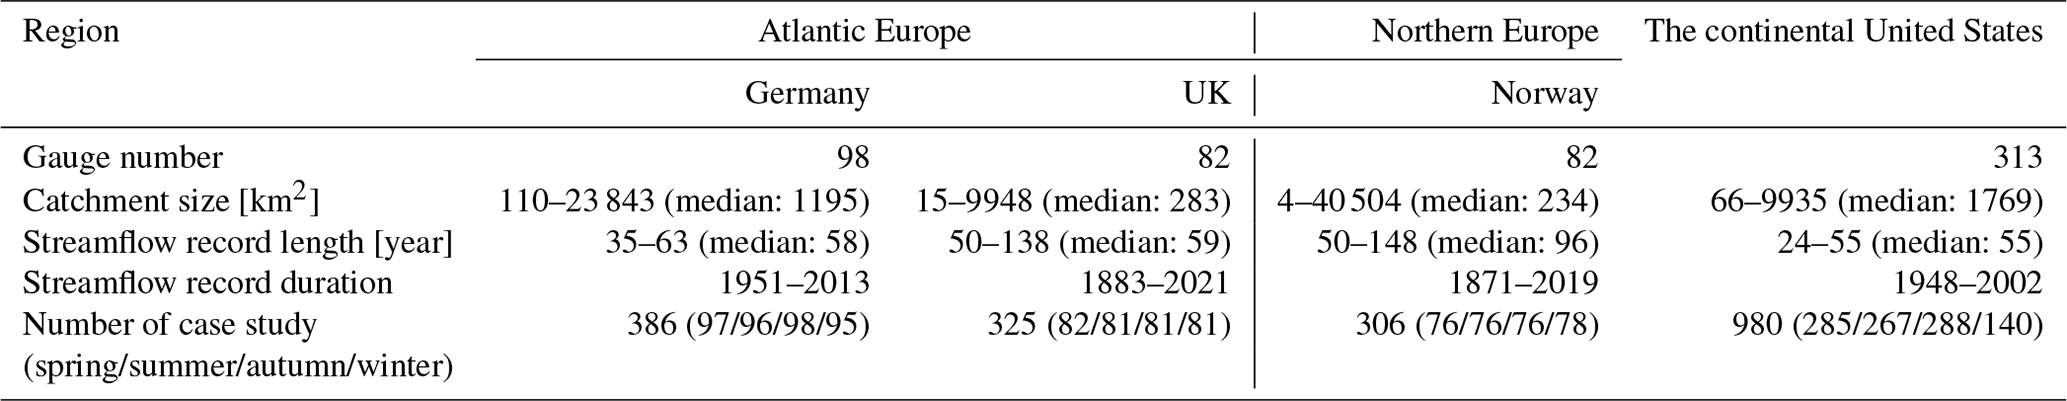
Discharge data were provided by the following organizations: the Bavarian State Office of Environment (LfU) in Germany (https://www.gkd.bayern.de/de/fluesse/abfluss, Bayerisches Landesamt für Umwelt, 2022), the Global Runoff Data Centre (GRDC) prepared by the Federal Institute for Hydrology (BfG) in the UK and Norway (https://grdc.bafg.de/data/data_portal_guide/, Bundesanstalt für Gewässerkunde, 2022), and the National Oceanic and Atmospheric Administration (NOAA) Office of Global Programs (MOPEX) in the US (https://hiscentral.cuahsi.org/pub_network.aspx?n=5599, NOAA-National Weather Service-Office of Hydrologic Development, 2022). We obtained the digital elevation model from the Shuttle Radar Topography Mission (SRTM) (https://cgiarcsi.community/data/srtm-90m-digital-elevation-database-v4-1/, CGIAR Consortium for Spatial Information, 2022). Köppen climate classifications were sourced from the high-resolution present-day Köppen climate map (Beck et al., 2018). Derived potential evapotranspiration data were sourced from the high-resolution map (Zomer et al., 2022). The dataset of dams used in this study is available from GeoDAR v.1.0 (https://doi.org/10.5281/zenodo.6163413, Wang et al., 2022b). For the characteristics of separated rainfall–runoff events for each streamflow gauge used in the analysis, please refer to Data Set S1 in the supporting information of Tarasova et al. (2018). The paper and the Supplement contain all the necessary details to replicate the results.
The supplement related to this article is available online at https://doi.org/10.5194/hess-29-1525-2025-supplement.
HJW: conceptualization (lead), data curation (lead), formal analysis (lead), methodology (lead), investigation (lead), software (lead), visualization (lead), writing (original draft (lead) and review and editing (equal)).
RM: conceptualization (support), formal analysis (equal), methodology (support), investigation (support), supervision (lead), visualization (support), writing (review and editing (equal)).
SB: conceptualization (support), formal analysis (equal), methodology (lead), investigation (lead), software (support), supervision (lead), visualization (support), writing (review and editing (equal)).
The contact author has declared that none of the authors has any competing interests.
Publisher's note: Copernicus Publications remains neutral with regard to jurisdictional claims made in the text, published maps, institutional affiliations, or any other geographical representation in this paper. While Copernicus Publications makes every effort to include appropriate place names, the final responsibility lies with the authors.
This work is supported by the Deutsche Forschungsgemeinschaft (DFG, German Research Foundation) under project no. 421396820 (“Propensity of rivers to extreme floods: climate-landscape controls and early detection (PREDICTED)”), under Research Group FOR 2416 (“Space-Time Dynamics of Extreme Floods (SPATE)”), and the National Taiwan University (project no. NTU-NFG-114L7479). We also acknowledge the financial support provided by the Helmholtz Centre for Environmental Research – UFZ.
This paper was edited by Serena Ceola and reviewed by two anonymous referees.
Allen, R. G., Pereira, L. S., Raes, D., and Smith, M.: Crop evapotranspiration – guidelines for computing crop water requirements – FAO Irrigation and drainage paper 56, Rome, ISBN 92-5-104219-5,998.
Alstott, J., Bullmore, E., and Plenz, D.: Powerlaw: A python package for analysis of heavy-tailed distributions, PLoS One, 9, e95816, https://doi.org/10.1371/journal.pone.0085777, 2014.
Arai, R., Toyoda, Y., and Kazama, S.: Runoff recession features in an analytical probabilistic streamflow model, J. Hydrol., 597, 125745, https://doi.org/10.1016/j.jhydrol.2020.125745, 2020.
Barnes, B. S.: The structure of discharge-recession curves, EOS T. AGU, 20, 721–725, https://doi.org/10.1029/TR020i004p00721, 1939.
Basso, S., Botter, G., Merz, R., and Miniussi, A.: PHEV! The PHysically-based Extreme Value distribution of river flows, Environ. Res. Lett., 16, 124065, https://doi.org/10.1088/1748-9326/ac3d59, 2021.
Basso, S., Schirmer, M., and Botter, G.: On the emergence of heavy-tailed streamflow distributions, Adv. Water Resour., 82, 98–105, https://doi.org/10.1016/j.advwatres.2015.04.013, 2015.
Basso, S., Schirmer, M., and Botter, G.: A physically based analytical model of flood frequency curves, Geophys. Res. Lett., 43, 9070–9076, https://doi.org/10.1002/2016GL069915, 2016.
Basso, S., Merz, R., Tarasova, L., and Miniussi, A.: Extreme flooding controlled by stream network organization and flow regime, Nat. Geosci., 16, 339–343, https://doi.org/10.1038/s41561-023-01155-w, 2023.
Bayerisches Landesamt für Umwelt: Abfluss Bayern, Bayerisches Landesamt für Umwelt [data set], https://www.gkd.bayern.de/de/fluesse/abfluss, last access: 26 August 2022.
Beck, H. E., Zimmermann, N. E., McVicar, T. R., Vergopolan, N., Berg, A., and Wood, E. F.: Present and future Köppen-Geiger climate classification maps at 1-km resolution, Sci. Data, 5, 180214, https://doi.org/10.1038/sdata.2018.214, 2018.
Bernardara, P., Schertzer, D., Sauquet, E., Tchiguirinskaia, I., and Lang, M.: The flood probability distribution tail: How heavy is it?, Stoch. Env. Res. Risk A., 22, 107–122, https://doi.org/10.1007/s00477-006-0101-2, 2008.
Bevere, L. and Remondi, F.: Natural catastrophes in 2021: the floodgates are open, Swiss Re Institute sigma research, https://www.swissre.com/press-release/Extreme-flood-events-once-again-drive-high-losses-in-2021-yet-75-of-flood-risks-remain-uninsured-Swiss-Re-Institute-reveals/3269ad99-b743-4398-82e3-534a87783910 (last access: 5 December 2022), 2022.
Biswal, B. and Kumar, D. N.: Study of dynamic behaviour of recession curves, Hydrol. Process., 792, 784–792, https://doi.org/10.1002/hyp.9604, 2014.
Biswal, B. and Marani, M.: Geomorphological origin of recession curves, Geophys. Res. Lett., 37, L24403, https://doi.org/10.1029/2010GL045415, 2010.
Botter, G.: Stochastic recession rates and the probabilistic structure of stream flows, Water Resour. Res., 46, W12527, https://doi.org/10.1029/2010WR009217, 2010.
Botter, G., Peratoner, F., Porporato, A., Rodriguez-Iturbe, I., and Rinaldo, A.: Signatures of large-scale soil moisture dynamics on streamflow statistics across U.S. climate regimes, Water Resour. Res., 43, 1–10, https://doi.org/10.1029/2007WR006162, 2007a.
Botter, G., Porporato, A., Rodriguez-Iturbe, I., and Rinaldo, A.: Basin-scale soil moisture dynamics and the probabilistic characterization of carrier hydrologic flows: Slow, leaching-prone components of the hydrologic response, Water Resour. Res., 43, 1–14, https://doi.org/10.1029/2006WR005043, 2007b.
Botter, G., Porporato, A., Rodriguez-Iturbe, I., and Rinaldo, A.: Nonlinear storage-discharge relations and catchment streamflow regimes, Water Resour. Res., 45, 1–16, https://doi.org/10.1029/2008WR007658, 2009.
Botter, G., Basso, S., Porporato, A., Rodriguez-Iturbe, I., and Rinaldo, A.: Natural streamflow regime alterations: Damming of the Piave river basin (Italy), Water Resour. Res., 46, 1–14, https://doi.org/10.1029/2009WR008523, 2010.
Brutsaert, W. and Nieber, J. L.: Regionalized drought flow hydrographs from a mature glaciated plateau, Water Resour. Res., 13, 637–643, https://doi.org/10.1029/WR013i003p00637, 1977.
Bundesanstalt für Gewässerkunde: Global Runoff Database, Bundesanstalt für Gewässerkunde [data set], https://grdc.bafg.de/data/data_portal_guide/, last access: 29 August 2022.
Cai, Y. and Hames, D.: Minimum sample size determination for generalized extreme value distribution, Commun. Stat. Simulat., 40, 87–98, https://doi.org/10.1080/03610918.2010.530368, 2010.
Ceola, S., Botter, G., Bertuzzo, E., Porporato, A., Rodriguez-Iturbe, I., and Rinaldo, A.: Comparative study of ecohydrological streamflow probability distributions, Water Resour. Res., 46, 1–12, https://doi.org/10.1029/2010WR009102, 2010.
CGIAR Consortium for Spatial Information: SRTM 90m Digital Elevation Database v4.1, CGIAR Consortium for Spatial Information [data set], https://cgiarcsi.community/data/srtm-90m-digital-elevation-database-v4-1, last access: 21 August 2022.
Chen, B. and Krajewski, W.: Analysing individual recession events: sensitivity of parameter determination to the calculation procedure, Hydrolog. Sci. J., 61, 2887–2901, https://doi.org/10.1080/02626667.2016.1170940, 2016.
Clauset, A., Shalizi, C. R., and Newman, M. E. J.: Power-law distributions in empirical data, SIAM Rev., 51, 661–703, https://doi.org/10.1137/070710111, 2009.
Clauset, A., Young, M., and Gleditsch, K. S.: On the Frequency of Severe Terrorist Events, J. Conflict Resolut., 51, 58–87, https://doi.org/10.1177/0022002706296157, 2007.
Cunderlik, J. M. and Burn, D. H.: Utilisation d'une information sur le régime des crues dans une analyse fréquentielle régionale des crues, Hydrolog. Sci. J., 47, 77–92, https://doi.org/10.1080/02626660209492909, 2002.
Doulatyari, B., Betterle, A., Basso, S., Biswal, B., Schirmer, M., and Botter, G.: Predicting streamflow distributions and flow duration curves from landscape and climate, Adv. Water Resour., 83, 285–298, https://doi.org/10.1016/j.advwatres.2015.06.013, 2015.
Dralle, D. N., Karst, N. J., Charalampous, K., Veenstra, A., and Thompson, S. E.: Event-scale power law recession analysis: quantifying methodological uncertainty, Hydrol. Earth Syst. Sci., 21, 65–81, https://doi.org/10.5194/hess-21-65-2017, 2017.
Duan, Q., Schaake, J., Andréassian, V., Franks, S., Goteti, G., Gupta, H. V, Gusev, Y. M., Habets, F., Hall, A., Hay, L., Hogue, T., Huang, M., Leavesley, G., Liang, X., Nasonova, O. N., Noilhan, J., Oudin, L., Sorooshian, S., Wagener, T., and Wood, E. F.: Model Parameter Estimation Experiment (MOPEX): An overview of science strategy and major results from the second and third workshops, J. Hydrol., 320, 3–17, https://doi.org/10.1016/j.jhydrol.2005.07.031, 2006.
Durrans, S. R., Eiffe, M. A., Thomas, W. O., and Goranflo, H. M.: Joint Seasonal/Annual Flood Frequency Analysis, J. Hydrol. Eng., 8, 181–189, https://doi.org/10.1061/(asce)1084-0699(2003)8:4(181), 2003.
El Adlouni, S., Bobée, B., and Ouarda, T. B. M. J.: On the tails of extreme event distributions in hydrology, J. Hydrol., 355, 16–33, https://doi.org/10.1016/j.jhydrol.2008.02.011, 2008.
European Environmental Agency: Mapping the impacts of natural hazards and technological accidents in Europe An overview of the last decade, Publications Office of the European Union, https://doi.org/10.2800/62638, 2010.
Farquharson, F. A. K., Meigh, J. R., and Sutcliffe, J. V.: Regional flood frequency analysis in arid and semi-arid areas, J. Hydrol., 138, 487–501, https://doi.org/10.1016/0022-1694(92)90132-F, 1992.
Fick, S. E. and Hijmans, R. J.: WorldClim 2 new 1-km spatial resolution climate surfaces for global land areas.pdf.crdownload, Int. J. Climatol., 37, 4302–4315, https://doi.org/10.1002/joc.5086, 2017.
Fiorentino, M., Manfreda, S., and Iacobellis, V.: Peak runoff contributing area as hydrological signature of the probability distribution of floods, Adv. Water Resour., 30, 2123–2134, https://doi.org/10.1016/j.advwatres.2006.11.017, 2007.
Fischer, S. and Schumann, A.: Robust flood statistics: comparison of peak over threshold approaches based on monthly maxima and TL-moments, Hydrolog. Sci. J., 61, 457–470, https://doi.org/10.1080/02626667.2015.1054391, 2016.
Gaume, E.: On the asymptotic behavior of flood peak distributions, Hydrol. Earth Syst. Sci., 10, 233–243, https://doi.org/10.5194/hess-10-233-2006, 2006.
Gioia, A., Iacobellis, V., Manfreda, S., and Fiorentino, M.: Runoff thresholds in derived flood frequency distributions, Hydrol. Earth Syst. Sci., 12, 1295–1307, https://doi.org/10.5194/hess-12-1295-2008, 2008.
Gumbel, E. J.: Statistics of Extremes, Columbia University Press, https://doi.org/10.7312/gumb92958, 1958.
Guo, J., Li, H.-Y., Leung, L. R., Guo, S., Liu, P., and Sivapalan, M.: Links between flood frequency and annual water balance behaviors: A basis for similarity and regionalization, Water Resour. Res., 50, 937–953, https://doi.org/10.1002/2013WR014374, 2014.
Hosking, J. R. M.: L-Moments: Analysis and Estimation of Distributions Using Linear Combinations of Order Statistics, J. R. Stat. Soc., 52, 105–124, 1990.
Hosking, J. R. M. and Wallis, J. R.: Parameter and quantile estimation for the generalized Pareto distribution, Technometrics, 29, 339–349, https://doi.org/10.1080/00401706.1987.10488243, 1987.
Hosking, J. R. M., Wallis, J. R., and Wood, E. F.: Estimation of the generalized extreme-value distribution by the method of probability-weighted moments, Technometrics, 27, 251–261, https://doi.org/10.1080/00401706.1985.10488049, 1985.
Huntingford, C., Marsh, T., Scaife, A. A., Kendon, E. J., Hannaford, J., Kay, A. L., Lockwood, M., Prudhomme, C., Reynard, N. S., Parry, S., Lowe, J. A., Screen, J. A., Ward, H. C., Roberts, M., Stott, P. A., Bell, V. A., Bailey, M., Jenkins, A., Legg, T., Otto, F. E. L., Massey, N., Schaller, N., Slingo, J., and Allen, M. R.: Potential influences on the United Kingdom's floods of winter 2013/14, Nat. Clim. Change, 4, 769–777, https://doi.org/10.1038/nclimate2314, 2014.
Interagency Advisory Committee on Water Data: Guidelines for determining flood flow frequency: Bulletin 17B, https://water.usgs.gov/osw/bulletin17b/dl_flow.pdf (last access: 12 October 2024), 1982.
Jachens, E. R., Rupp, D. E., Roques, C., and Selker, J. S.: Recession analysis revisited: impacts of climate on parameter estimation, Hydrol. Earth Syst. Sci., 24, 1159–1170, https://doi.org/10.5194/hess-24-1159-2020, 2020.
Katz, R.: Statistics of Extremes in Climatology and Hydrology, Adv. Water Resour., 25, 1287–1304, 2002.
Kirchner, J. W.: Catchments as simple dynamical systems: Catchment characterization, rainfall-runoff modeling, and doing hydrology backward, Water Resour. Res., 45, 1–34, https://doi.org/10.1029/2008WR006912, 2009.
Klaus, A., Yu, S., and Plenz, D.: Statistical analyses support power law distributions found in neuronal avalanches, PLoS One, 6, e19779, https://doi.org/10.1371/journal.pone.0019779, 2011.
Kondor, D., Pósfai, M., Csabai, I., and Vattay, G.: Do the rich get richer? An empirical analysis of the Bitcoin transaction network, PLoS One, 9, e86197, https://doi.org/10.1371/journal.pone.0086197, 2014.
Laio, F., Porporato, A., Fernandez-Illescas, C. P., and Rodriguez-Iturbe, I.: Plants in water-controlled ecosystems: Active role in hydrologic processes and responce to water stress IV. Discussion of real cases, Adv. Water Resour., 24, 745–762, https://doi.org/10.1016/S0309-1708(01)00007-0, 2001.
Lehner, B., Liermann, C. R., Revenga, C., Vörömsmarty, C., Fekete, B., Crouzet, P., Döll, P., Endejan, M., Frenken, K., Magome, J., Nilsson, C., Robertson, J. C., Rödel, R., Sindorf, N., and Wisser, D.: High-resolution mapping of the world's reservoirs and dams for sustainable river-flow management, Front. Ecol. Environ., 9, 494–502, https://doi.org/10.1890/100125, 2011.
Lins, H. F.: Challenges to hydrological observations, WMO Bull., 57, 55–58, 2008.
Macdonald, E., Merz, B., Guse, B., Wietzke, L., Ullrich, S., Kemter, M., Ahrens, B., and Vorogushyn, S.: Event and Catchment Controls of Heavy Tail Behavior of Floods, Water Resour. Res., 58, 1–25, https://doi.org/10.1029/2021wr031260, 2022.
Malamud, B. D.: Tails of natural hazards, Phys. World, 17, 31–35, https://doi.org/10.1088/2058-7058/17/8/35, 2004.
Malamud, B. D. and Turcotte, D. L.: The applicability of power-law frequency statistics to floods, J. Hydrol., 322, 168–180, https://doi.org/10.1016/j.jhydrol.2005.02.032, 2006.
Mathai, J. and Mujumdar, P. P.: Use of streamflow indices to identify the catchment drivers of hydrographs, Hydrol. Earth Syst. Sci., 26, 2019–2033, https://doi.org/10.5194/hess-26-2019-2022, 2022.
McCuen, R. H. and Smith, E.: Origin of Flood Skew, J. Hydrol. Eng., 13, 771–775, https://doi.org/10.1061/(asce)1084-0699(2008)13:9(771), 2008.
McDermott, T. K. J.: Global exposure to flood risk and poverty, Nat. Commun., 13, 6–8, https://doi.org/10.1038/s41467-022-30725-6, 2022.
Meigh, J. R., Farquharson, F. A. K., and Sutcliffe, J. V.: A worldwide comparison of regional flood estimation methods and climate, Hydrolog. Sci. J., 42, 225–244, https://doi.org/10.1080/02626669709492022, 1997.
Mejía, A., Daly, E., Rossel, F., Javanovic, T., and Gironás, J.: A stochastic model of streamflow for urbanized basins, Water Resour. Res., 50, 1984–2001, https://doi.org/10.1002/2013WR014834, 2014.
Merz, B., Basso, S., Fischer, S., Lun, D., Blöschl, G., Merz, R., Guse, B., Viglione, A., Vorogushyn, S., Macdonald, E., Wietzke, L., and Schumann, A.: Understanding heavy tails of flood peak distributions, Water Resour. Res., 58, 1–37, https://doi.org/10.1029/2021wr030506, 2022.
Merz, B., Blöschl, G., Vorogushyn, S., Dottori, F., Aerts, J. C. J. H., Bates, P., Bertola, M., Kemter, M., Kreibich, H., Lall, U., and Macdonald, E.: Causes, impacts and patterns of disastrous river floods, Nat. Rev. Earth Environ., 2, 592–609, https://doi.org/10.1038/s43017-021-00195-3, 2021.
Merz, R. and Blöschl, G.: Process controls on the statistical flood moments – a data based analysis, Hydrol. Process., 23, 675–696, https://doi.org/10.1002/hyp, 2009.
Molnar, P., Anderson, R. S., Kier, G., and Rose, J.: Relationships among probability distributions of stream discharges in floods, climate, bed load transport, and river incision, J. Geophys. Res.-Earth, 111, 1–10, https://doi.org/10.1029/2005JF000310, 2006.
Morrison, J. E. and Smith, J. A.: Stochastic modeling of flood peaks using the generalized extreme value distribution, Water Resour. Res., 38, 41-1–41-12, https://doi.org/10.1029/2001wr000502, 2002.
Müller, M. F., Dralle, D. N., and Thompson, S. E.: Analytical model for flow duration curves in seasonally dry climates, Water Resour. Res., 50, 5510–5531, https://doi.org/10.1002/2014WR015301, 2014.
Müller, M. F., Roche, K. R., and Dralle, D. N.: Catchment processes can amplify the effect of increasing rainfall variability, Environ. Res. Lett., 16, 084032, https://doi.org/10.1088/1748-9326/ac153e, 2021.
Mushtaq, S., Miniussi, A., Merz, R., and Basso, S.: Reliable estimation of high floods: A method to select the most suitable ordinary distribution in the Metastatistical extreme value framework, Adv. Water Resour., 161, 104127, https://doi.org/10.1016/j.advwatres.2022.104127, 2022.
Mutzner, R., Bertuzzo, E., Tarolli, P., Weijs, S. V., Nicotina, L., Ceola, S., Tomasic, N., Rodriguez-Iturbe, I., Parlange, M. B., and Rinaldo, A.: Geomorphic signatures on Brutsaert base flow recession analysis, Water Resour. Res., 49, 5462–5472, https://doi.org/10.1002/wrcr.20417, 2013.
Nair, J., Wierman, A., and Zwart, B.: The Fundamentals of Heavy Tails: Properties, Emergence, and Estimation, Cambridge University Press, https://doi.org/10.1017/9781009053730, 2022.
Németh, L., Hübnerová, Z., and Zempléni, A.: Trend detection in GEV models, 1–13, arXiv [preprint], https://doi.org/10.48550/arXiv.1907.09435, 2019.
NOAA-National Weather Service-Office of Hydrologic Development: MOPEX, NOAA [data set], https://hiscentral.cuahsi.org/pub_network.aspx?n=5599, last access: 5 September 2022.
Osborn, T. J., Hulme, M., Jones, P. D., and Basnett, T. A.: Observed trends in the daily intensity of United Kingdom precipitation, Int. J. Climatol., 20, 347–364, https://doi.org/10.1002/(SICI)1097-0088(20000330)20:4<347::AID-JOC475>3.0.CO;2-C, 2000.
Pallard, B., Castellarin, A., and Montanari, A.: A look at the links between drainage density and flood statistics, Hydrol. Earth Syst. Sci., 13, 1019–1029, https://doi.org/10.5194/hess-13-1019-2009, 2009.
Papalexiou, S. M., Koutsoyiannis, D., and Makropoulos, C.: How extreme is extreme? An assessment of daily rainfall distribution tails, Hydrol. Earth Syst. Sci., 17, 851–862, https://doi.org/10.5194/hess-17-851-2013, 2013.
Papalexiou, S. M. and Koutsoyiannis, D.: Battle of extreme value distributions: A global survey on extreme daily rainfall, Water Resour. Res., 49, 187–201, https://doi.org/10.1029/2012WR012557, 2013.
Porporato, A., Daly, E., and Rodriguez-Iturbe, I.: Soil water balance and ecosystem response to climate change, Am. Nat., 164, 625–632, https://doi.org/10.1086/424970, 2004.
Pumo, D., Viola, F., La Loggia, G., and Noto, L. V.: Annual flow duration curves assessment in ephemeral small basins, J. Hydrol., 519, 258–270, https://doi.org/10.1016/j.jhydrol.2014.07.024, 2014.
Robson, A. J.: Evidence for trends in UK flooding, Philos. T. R. Soc. A, 360, 1327–1343, https://doi.org/10.1098/rsta.2002.1003, 2002.
Rogger, M., Pirkl, H., Viglione, A., Komma, J., Kohl, B., Kirnbauer, R., and Merz, R.: Step changes in the flood frequency curve: Process controls, Water Resour. Res., 48, 1–15, https://doi.org/10.1029/2011WR011187, 2012.
Rudd, A. C., Kay, A. L., and Sayers, P. B.: Climate change impacts on flood peaks in Britain for a range of global mean surface temperature changes, J. Flood Risk Manag., 16, 1–15, https://doi.org/10.1111/jfr3.12863, 2023.
Santos, A. C., Portela, M. M., Rinaldo, A., and Schaefli, B.: Analytical flow duration curves for summer streamflow in Switzerland, Hydrol. Earth Syst. Sci., 22, 2377–2389, https://doi.org/10.5194/hess-22-2377-2018, 2018.
Sartori, M. and Schiavo, S.: Connected we stand: A network perspective on trade and global food security, Food Policy, 57, 114–127, https://doi.org/10.1016/j.foodpol.2015.10.004, 2015.
Schaefli, B., Rinaldo, A., and Botter, G.: Analytic probability distributions for snow-dominated streamflow, Water Resour. Res., 49, 2701–2713, https://doi.org/10.1002/wrcr.20234, 2013.
Shaw, S. B.: Investigating the linkage between streamflow recession rates and channel network contraction in a mesoscale catchment in New York state, Hydrol. Process., 30, 479–492, https://doi.org/10.1002/hyp.10626, 2016.
Shaw, S. B. and Riha, S. J.: Examining individual recession events instead of a data cloud: Using a modified interpretation of dQ/dt−Q streamflow recession in glaciated watersheds to better inform models of low flow, J. Hydrol., 434–435, 46–54, https://doi.org/10.1016/j.jhydrol.2012.02.034, 2012.
Smith, J. A., Cox, A. A., Baeck, M. L., Yang, L., and Bates, P.: Strange Floods: The Upper Tail of Flood Peaks in the United States, Water Resour. Res., 54, 6510–6542, https://doi.org/10.1029/2018WR022539, 2018.
Spearman, C.: The proof and measurement of association between two things, Am. J. Psychol., 15, 72–101, https://doi.org/10.2307/1412159, 1904.
Struthers, I. and Sivapalan, M.: A conceptual investigation of process controls upon flood frequency: role of thresholds, Hydrol. Earth Syst. Sci., 11, 1405–1416, https://doi.org/10.5194/hess-11-1405-2007, 2007.
Tarasova, L., Basso, S., and Merz, R.: Transformation of Generation Processes From Small Runoff Events to Large Floods, Geophys. Res. Lett., 47, e2020GL090547, https://doi.org/10.1029/2020GL090547, 2020.
Tarasova, L., Basso, S., Zink, M., and Merz, R.: Exploring Controls on Rainfall-Runoff Events: 1. Time Series-Based Event Separation and Temporal Dynamics of Event Runoff Response in Germany, Water Resour. Res., 54, 7711–7732, https://doi.org/10.1029/2018WR022587, 2018.
Tarasova, L., Lun, D., Merz, R., Blöschl, G., Basso, S., Bertola, M., Miniussi, A., Rakovec, O., Samaniego, L., Thober, S., and Kumar, R.: Shifts in flood generation processes exacerbate regional flood anomalies in Europe, Commun. Earth Environ., 4, 49, https://doi.org/10.1038/s43247-023-00714-8, 2023.
Tashie, A., Pavelsky, T., and Band, L. E.: An Empirical Reevaluation of Streamflow Recession Analysis at the Continental Scale, Water Resour. Res., 56, e2019WR025448, https://doi.org/10.1029/2019WR025448, 2020a.
Tashie, A., Pavelsky, T., and Emanuel, R. E.: Spatial and Temporal Patterns in Baseflow Recession in the Continental United States, Water Resour. Res., 56, e2019WR026425, https://doi.org/10.1029/2019WR026425, 2020b.
Tashie, A., Scaife, C. I., and Band, L. E.: Transpiration and subsurface controls of streamflow recession characteristics, Hydrol. Process., 33, 2561–2575, https://doi.org/10.1002/hyp.13530, 2019.
Thomas, B. F., Vogel, R. M., and Famiglietti, J. S.: Objective hydrograph baseflow recession analysis, J. Hydrol., 525, 102–112, https://doi.org/10.1016/j.jhydrol.2015.03.028, 2015.
Thorarinsdottir, T. L., Hellton, K. H., Steinbakk, G. H., Schlichting, L., and Engeland, K.: Bayesian Regional Flood Frequency Analysis for Large Catchments, Water Resour. Res., 54, 6929–6947, https://doi.org/10.1029/2017WR022460, 2018.
Viglione, A., Merz, R., and Blöschl, G.: On the role of the runoff coefficient in the mapping of rainfall to flood return periods, Hydrol. Earth Syst. Sci., 13, 577–593, https://doi.org/10.5194/hess-13-577-2009, 2009.
Villarini, G. and Smith, J. A.: Flood peak distributions for the eastern United States, Water Resour. Res., 46, 1–17, https://doi.org/10.1029/2009WR008395, 2010.
Vogel, R. M. and Fennesse, N. M.: L moment diagrams should replace product moment diagrams, Water Resour. Res., 29, 1745–1752, https://doi.org/10.1029/93WR00341, 1993.
Vormoor, K., Lawrence, D., Schlichting, L., Wilson, D., and Wong, W. K.: Evidence for changes in the magnitude and frequency of observed rainfall vs. snowmelt driven floods in Norway, J. Hydrol., 538, 33–48, https://doi.org/10.1016/j.jhydrol.2016.03.066, 2016.
Wang, H., Merz, R., Yang, S., Tarasova, L., and Basso, S.: Emergence of heavy tails in streamflow distributions: the role of spatial rainfall variability, Adv. Water Resour. J., 171, 104359, https://doi.org/10.1016/j.advwatres.2022.104359, 2023.
Wang, J., Walter, B. A., Yao, F., Song, C., Ding, M., Maroof, A. S., Zhu, J., Fan, C., McAlister, J. M., Sikder, S., Sheng, Y., Allen, G. H., Crétaux, J.-F., and Wada, Y.: GeoDAR: georeferenced global dams and reservoirs dataset for bridging attributes and geolocations, Earth Syst. Sci. Data, 14, 1869–1899, https://doi.org/10.5194/essd-14-1869-2022, 2022a.
Wang, J., Walter, B. A., Yao, F., Song, C., Ding, M., Maroof, A. S., Zhu, J., Fan, C., McAlister, J. M., Sikder, M. S., Sheng, Y., Allen, G. H., Crétaux, J.-F., and Wada, Y.: GeoDAR: Georeferenced global Dams And Reservoirs dataset for bridging attributes and geolocations, Zenodo [data set], https://doi.org/10.5281/zenodo.6163413, 2022b.
Ward, A. S., Wondzell, S. M., Schmadel, N. M., and Herzog, S. P.: Climate Change Causes River Network Contraction and Disconnection in the H.J. Andrews Experimental Forest, Oregon, USA, Front. Water, 2, 1–10, https://doi.org/10.3389/frwa.2020.00007, 2020.
Werner, T. and Upper, C.: Time Variation in the Tail Behaviour of Bund Futures Returns, https://ideas.repec.org/p/zbw/bubdp1/4190.html (last access: 6 September 2023), 2002.
Wietzke, L. M., Merz, B., Gerlitz, L., Kreibich, H., Guse, B., Castellarin, A., and Vorogushyn, S.: Comparative analysis of scalar upper tail indicators, Hydrolog. Sci. J., 65, 1625–1639, https://doi.org/10.1080/02626667.2020.1769104, 2020.
Wilcoxon, F.: Individual comparisons by ranking methods, Biometrics Bull., 1, 80–83, https://doi.org/10.2307/3001968, 1945.
Wu, Q., Ke, L., Wang, J., Pavelsky, T. M., Allen, G. H., Sheng, Y., Duan, X., Zhu, Y., Wu, J., Wang, L., Liu, K., Chen, T., Zhang, W., Fan, C., Yong, B., and Song, C.: Satellites reveal hotspots of global river extent change, Nat. Commun., 14, 1587, https://doi.org/10.1038/s41467-023-37061-3, 2023.
Ye, S., Li, H. Y., Huang, M., Alebachew, M. A., Leng, G., Leung, L. R., Wang, S. wen, and Sivapalan, M.: Regionalization of subsurface stormflow parameters of hydrologic models: Derivation from regional analysis of streamflow recession curves, J. Hydrol., 519, 670–682, https://doi.org/10.1016/j.jhydrol.2014.07.017, 2014.
Zaerpour, M., Papalexiou, S. M., Pietroniro, A., &Nazemi, A.: How extreme are flood peak distributions? A quasi-global analysis of daily discharge records, J. Hydrol., 631, 130849, https://doi.org/10.1016/j.jhydrol.2024.130849, 2024.
Zhou, X., Sheng, Z., Yang, Y., Han, S., Zhang, Q., Li, H., and Yang, Y.: Catchment water storage dynamics and its role in modulating streamflow generation in spectral perspective: a case study in the headwater of Baiyang Lake, China, Hydrol. Earth Syst. Sci. Discuss. [preprint], https://doi.org/10.5194/hess-2022-357, 2022.
Zomer, R. J., Xu, J., and Trabucco, A.: Version 3 of the Global Aridity Index and Potential Evapotranspiration Database, Sci. Data, 9, 1–15, https://doi.org/10.1038/s41597-022-01493-1, 2022.