the Creative Commons Attribution 4.0 License.
the Creative Commons Attribution 4.0 License.
 | 19 Mar 2025
Seasonal and diurnal freeze–thaw dynamics of a rock glacier and their impacts on mixing and solute transport
Cyprien Louis
Landon J. S. Halloran
Rock glaciers play a vital role in the hydrological functioning of many alpine catchments. Here, we investigate seasonal and daily freeze–thaw cycles of the previously undocumented Canfinal rock glacier (RG) located in the Val d'Ursé catchment (Bernina Range, Switzerland) and the RG's influence on the dynamics of the hydrogeological system. We combine digital image correlation techniques, geochemical and isotopic analyses, time series analysis, and hydrological monitoring to understand the functioning of the hydrological system. An acceleration of RG creep since 1990 has occurred, with the most active regions exhibiting horizontal velocities of ∼1 m yr−1. Distinct geochemical signatures of springs influenced by RG discharge reflect contrasting and temporally variable groundwater mixing ratios. A novel application of frequency–domain analysis to time series of air temperature and spring electrical conductivity enables a quantitative understanding of the RG thaw and subsurface flow dynamics. Following the onset of snowmelt, we observed a gradual decrease in the time lag between air temperature maxima and spring electrical conductivity minima at the front of the rock glacier. This suggests progressively increasing flows within the talus, driven by efficient recharge from snowmelt and contributions from the thawing rock glacier. Through our multi-method approach, we develop a conceptual model representing the main cryo-hydrogeological processes involved in RG-influenced alpine headwaters.
- Article
(6564 KB) - Full-text XML
-
Supplement
(1045 KB) - BibTeX
- EndNote


Recent studies have quantified the role of groundwater in sustaining perennial streamflow in both glaciated and non-glaciated alpine headwater catchments (Somers et al., 2019; Halloran et al., 2023). Rock glaciers (RGs) are key features in alpine headwaters, being the most common periglacial phenomena on Earth (Krainer et al., 2007). They can store significant volumes of water as groundwater and ice and contribute to catchment-scale fluxes (Harris et al., 2009; Evans et al., 2018). Rising temperatures and changes in precipitation are accelerating the thawing of RGs worldwide (Kääb et al., 2007; Marcer et al., 2021; Frei et al., 2018; Hanus et al., 2021; Manchado et al., 2024). Rock glacier degradation is expected to have a significant impact on the alpine hydrological cycle, affecting the hydrology of downstream springs and streams (Jones et al., 2021).
The active layer has been shown to act as a thermal insulator between the surface and the frozen RG core (Humlum, 1997; Amschwand et al., 2024). It has a low thermal conductivity, which implies a different thermal regime between the RG and its surrounding environment. The ice is therefore partially insulated from external conditions and, thus, is thermally decoupled, making it more resilient to climate change than glaciers (Anderson et al., 2018; Jones et al., 2019, 2021). Analysis of displacement dynamics can aid in tracking the seasonal freeze–thaw dynamics of active RGs (Groh and Blöthe, 2019). The creep of active RGs is primarily caused by forces at the primary basal shear horizon (Krainer et al., 2015). The dynamics of RGs change over time and at different scales depending on the evolution of the RG thermal regime. It is mainly controlled by heat conduction driven by air temperature, but other processes such as advection of air or water through the RG matrix can also play a role (Haeberli et al., 2006; Pruessner et al., 2018). Several studies have found an increase in horizontal velocities as a result of rising temperatures in the Alps due to climate change (Kääb et al., 2007; Marcer et al., 2021).
The critical link between RG freeze–thaw cycles, hydrological regimes, and creep dynamics is an underdeveloped topic (van Tiel et al., 2024; Harrington et al., 2018; Pauritsch et al., 20216). In the context of climate change, several hypotheses – which are not mutually exclusive – have been proposed to explain modifications in the dynamics of horizontal displacement velocities observed in active RGs:
-
In summer, high average and extreme air temperature values favor the melting of RG ice, leading to destabilization and acceleration (Marcer et al., 2021).
-
Since adequate snow cover acts as a thermal insulator for the ground, a colder, snowier winter will tend to protect the active zone of the RG in early spring (DallAmico et al., 2008).
-
The early winter snow cover is important because it influences the thermal conditions underground by insulating the ground from the arrival of colder air. As a result, it is unfavorable for the preservation and formation of ice within the RG (Zhang, 2005).
-
Intense precipitation in the form of rain has a destabilizing effect due to the amount of water it can carry and the heat transfer it induces (Wirz et al., 2016).
Determining the long- and short-term dynamics of RG freeze–thaw cycles remains a major challenge (Pruessner et al., 2021). This knowledge gap stems from difficulties in collecting relevant data at such elevations, as well as a lack of understanding of the processes involved over pertinent timescales. Difficulties lie in distinguishing between water fluxes from RGs and those from deeper groundwater flow paths, as well as in capturing their seasonal to daily variability (Krainer et al., 2015; Harrington et al., 2018). Few studies that place RGs in their broader hydrogeological context have been conducted (e.g., Krainer et al., 2007; Del Siro et al., 2023; Munroe and Handwerger, 2023). As a result, seasonal variations in discharge sources such as groundwater, precipitation, and snowmelt are often overlooked.
Environmental tracers provide unique information on the origin of waters, their residence times, and mixing during hydrological changes. Studies have used electrical conductivity (EC) as a tracer to complement water level data at alpine sites, taking advantage of its low cost and low probe maintenance requirements (Cano-Paoli et al., 2019). For example, EC can be used to separate hydrographs (Laudon and Slaymaker, 1997) or to analyze daily dilution–enrichment cycles of RG runoff on a seasonal or daily scale (Brighenti et al., 2021). EC is generally low at the onset of snowmelt and during high-runoff periods due to significant dilution. In contrast, during late-summer and winter baseflow, EC progressively increases as groundwater, with its higher mineralization, becomes the primary driver of streamflow (Jones et al., 2019). Field campaigns for water sampling, on the other hand, face significant logistical challenges in alpine environments, limiting the ability to intervene at appropriate intervals to capture the variability of responses during high-frequency hydrological changes. Several authors have characterized the seasonal evolution of the composition of water discharge from RGs using isotopic analyses (in particular, 18O). These studies suggest that only a small fraction of the water released by rock glaciers originates from ice thaw, with precipitation, snowmelt, and groundwater being the primary sources of spring water (Krainer et al., 2007, 2015; Harrington et al., 2018).
In this study, we employ a multi-method approach to investigate the cryo-hydrogeological functioning of the Val d'Ursé Critical Zone Observatory in Switzerland, where a major rock glacier (the Canfinal rock glacier) is present. By combining digital image correlation, hydrochemical analysis, and a novel frequency–domain analysis of temperature and electrical conductivity monitored at spring locations, we aim to resolve the seasonal to diurnal freeze–thaw dynamics of the RG, identify multi-year trends in its creep rates and their meteorological drivers, and elucidate cryosphere–groundwater interactions. This comprehensive approach not only enhances our understanding of the complex hydrological processes in the Val d'Ursé headwater catchment but also generates knowledge that can be applied to other alpine regions with similar environmental settings.
The Canfinal rock glacier is located in the UniNE Val d'Ursé Critical Zone Observatory (CZO) for Alpine Research (Grisons, Switzerland) (Fig. 1). It is a glacially formed, E–W-oriented valley located in the Bernina Range (Western Rhaetian Alps, Switzerland) that feeds the main Val Poschiavo valley to the east. The geology consists of crystalline basement rocks and intruded granite of the Sella nappe. The lower and middle parts of the valley are constituted by the Marinelli-Formation schist with Sella granodiorite (Lindsay, 2000). Musella granite and Sella granodiorite combine to form the southern ridges which feed the Canfinal RG. The Sella nappe is thrust over the Bernina nappe near the northern boundary of the Val d'Ursé, and the nappe stack is part of a larger regional anticline.
Field outcrop observations reveal highly fractured and faulted lithologies, including open fractures, exfoliation joins, calcite veins, and folded schist (Lindsay, 2000). Analysis of fractures in borehole KB4 (Fig. 1) indicates dip angles ranging from 30 to 90° from the horizontal, with fracture density decreasing with depth. This trend is consistent with findings from other crystalline regions (Eberhardt et al., 2004) and supports classical conceptual structural models in alpine settings (Welch and Allen, 2014). This fracture pattern results from tectonic processes such as exhumation, stress release, and topographic stresses (Hencher et al., 2011). The main lineaments in the catchment are oriented NW–SE and NNE–SSW and are predominantly sub-vertical (Lindsay, 2000).
In the region, mean precipitation is 1060 mm over the period of 2014–2022 based on measurements from nearby weather stations managed by the Federal Office of Meteorology and Climatology MeteoSwiss (Robbia, 1078 m a.s.l., and Passo del Bernina, 2272 m a.s.l.). Annual mean temperature measured at the front of the RG during 2014–2018 is 3.2 °C. Typically, in the Alps, peaks in monthly precipitation occur in early spring and late fall, while February is the driest and coldest month (Lindsay, 2000).
The hydrogeological system of the study site is made up of a fractured aquifer which is overlain by Quaternary detrital sediments and coarse deposits. Several locations in the study area are intensely fractured, which allows for efficient deep groundwater recharge. Infiltration is expected to be greatest on gentle slopes with exposed permeable material such as debris and talus deposits or fractured bedrock. Several springs and groundwater seepage zones influenced by permafrost thaw have been identified across the watershed. They confirm the permafrost zones indicated by the Federal Office of Environment (Fig. 1).
The Val d'Ursé CZO (Fig. 1) includes a 200.3 m deep borehole equipped with two pore water pressure sensors (KB4 in Fig. 1). Additionally, the electrical conductivity (EC) and temperature of several springs (Fig. 1) are monitored.
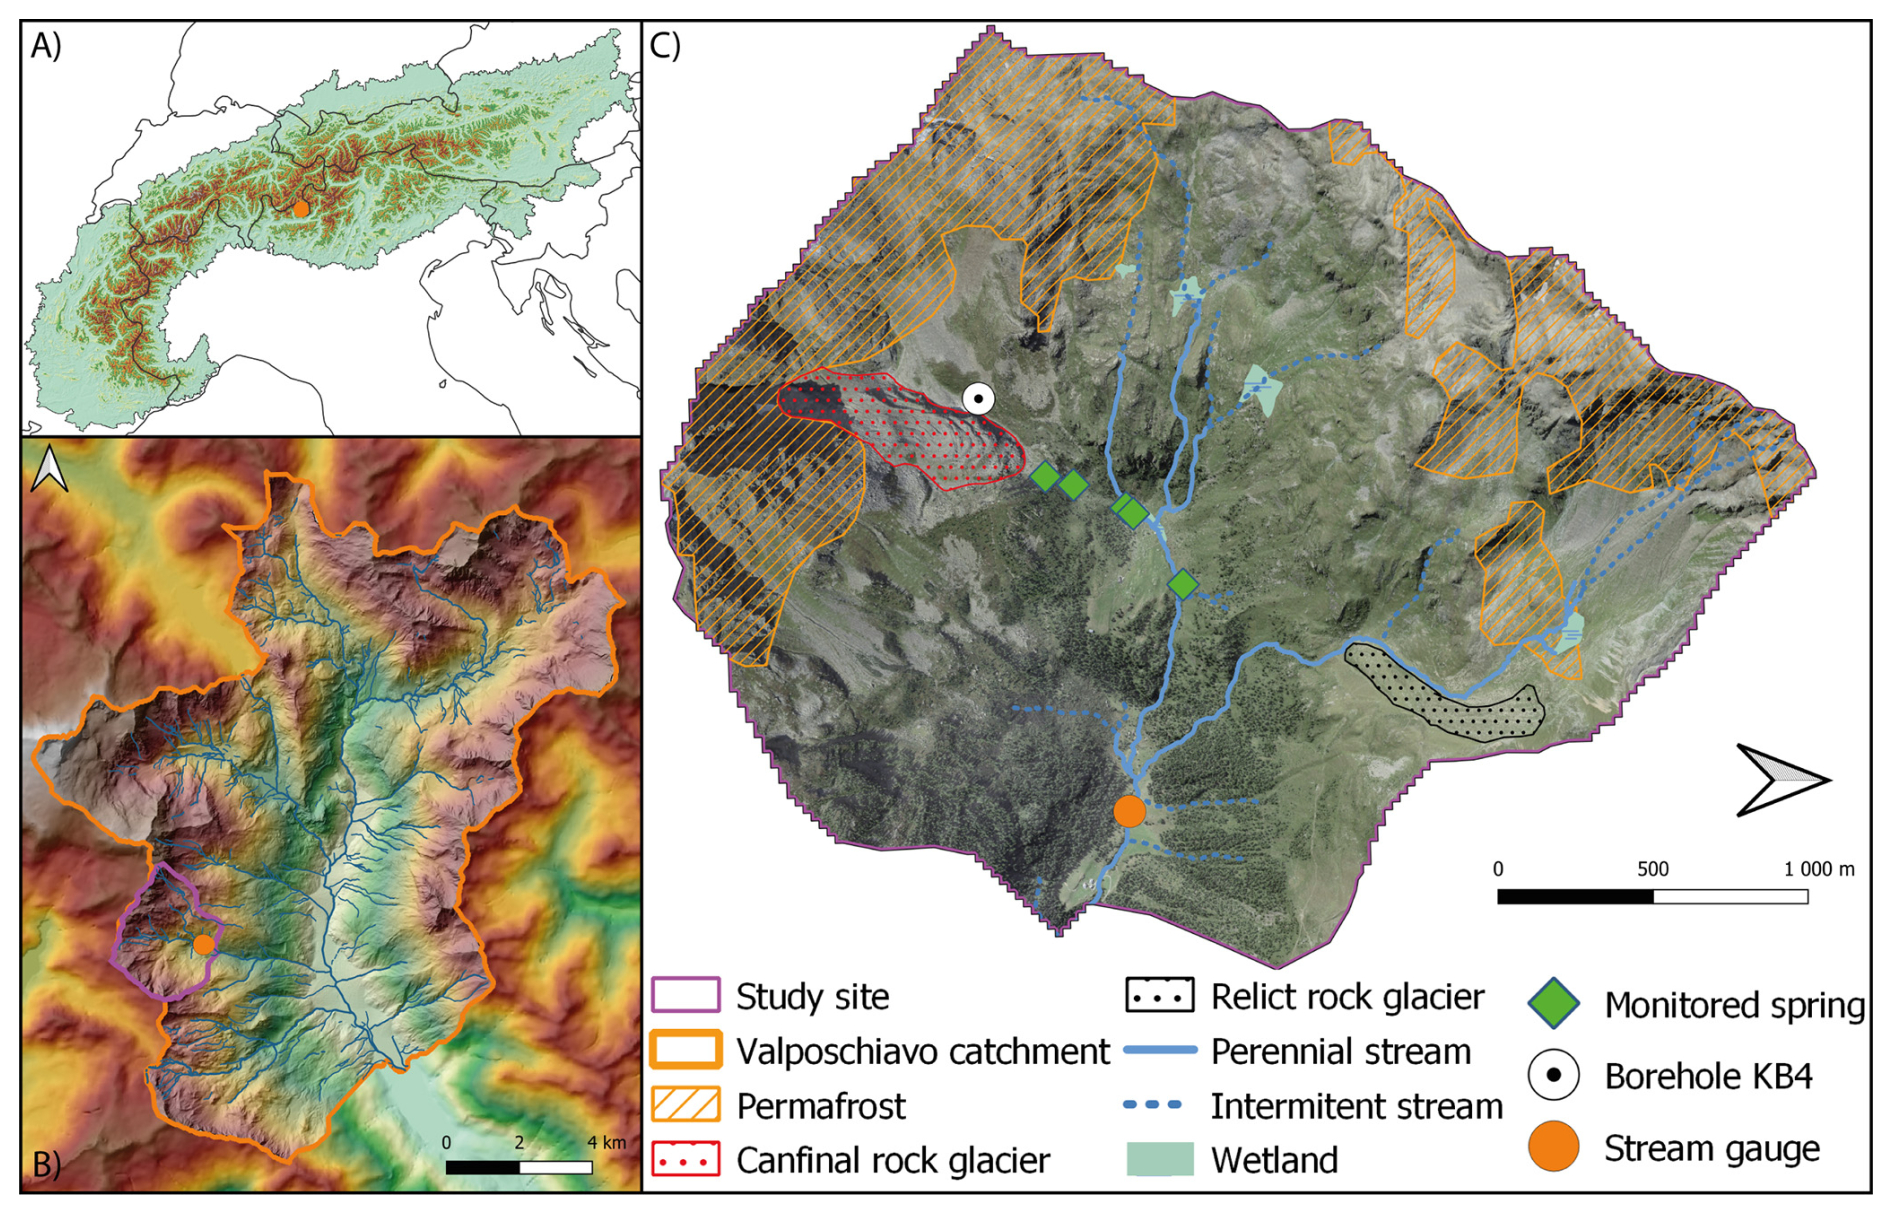
Figure 1Location of the study site: (a) in relation to the Alps and (b) within the Poschiavino catchment. (c) The Val d'Ursé Critical Zone Observatory (CZO) for Alpine Research. The CZO is characterized by a dense network of springs, streams, wetlands, permafrost (FOEN Switzerland, 2005), and two major rock glaciers. It is supported by an extensive monitoring network, though only a selection of environmental monitoring points relevant to this study are shown. Aerial picture © data: CNES, Spot Image, swisstopo, NPOC.
A former glacier front, associated with the Cavaglia local glacial stage (Egesen I), reached an elevation of 2160 m a.s.l., with an equilibrium line at ∼2450 m, where the Canfinal RG now stands (Burga, 1987). Rockfalls from the cliffs filled the moraine valley of this retreated or partially retreated glacier, and favorable permafrost conditions led to the formation of the Canfinal RG. There are also signs of lateral moraines located beneath the RG. The RG has a length of ∼820 m, a maximum width of ∼250 m, and a surface area of ∼0.2 km2. Its front is located at an elevation of ∼2220 m and faces northeast. Its rooting zone begins at an elevation of ∼2500 m, at the base of a ridge. This cliff links the Piz Canfinal (2812 m) to the Corno Campascio (2808 m) and contains several weak zones feeding debris to the RG. Longitudinal ridges in the upper part are a sign of sharp contrasts in horizontal displacement between the center and the edge of the RG. The presence of longitudinal ridges in the lower section indicates a lower flow (Fig. 2). The RG's lower foot is more vegetated and appears to be separated from the rest. Although it will be considered as a whole in the context of this study, the entire structure is most likely to be the result of several generations of RGs, some of which are now inactive or relicts (Fig. 2).
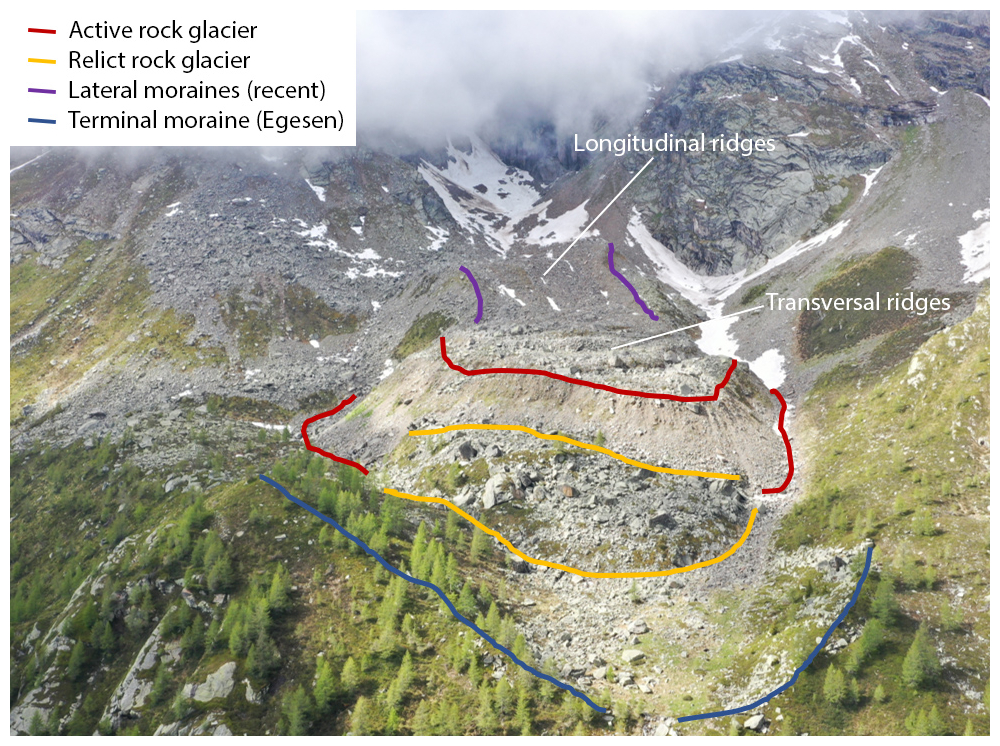
Figure 2Geomorphological description of the Canfinal RG and its surroundings. Additional information on Quaternary geological and geomorphological features in the Val d'Ursé can be found in Fig. S1 in the Supplement. For reference, the front of the rock glacier is approximately 250 m wide.
Numerous perennial and intermittent springs immediately downslope from the RG indicate a shallow and dynamic water table that reaches its maximum near the end of the snowmelt season. The spring at the foot of the Canfinal RG is located at ∼2210 m in a relatively flat, humid meadow. During periods of high runoff and snowmelt, another spring is active at the mid-slope of the talus, while the majority of the springs at the foot of the talus slope are perennial and feed the Val d'Ursé.
3.1 Digital image correlation
Digital image correlation is a powerful method to calculate rock glacier displacement fields (e.g., Amschwand et al., 2021) based on snow-free remote sensing imagery. We analyzed the historical and present rheological dynamics of the Canfinal RG using 13 largely snow-free SWISSIMAGE ortho-rectified photos (swisstopo) from between 1956 and 2019 and data from an unoccupied aerial vehicle (UAV) survey from October 2022. The ortho-photos have a pixel resolution of 0.5 m for the oldest (1956–2003), a resolution of 0.25 m for the four images taken between 2006 and 2015, and a resolution of 0.1 m for 2019. Using the PIX4DMapper software, the photos from our UAV survey were converted into an ortho-photo with a resolution of 2.7 cm.
We used an open-source fast Fourier transform (FFT)-based digital image correlation open-source package (Bickel et al., 2018). Before co-registration, the software pre-processes images via a Wallis filter in order to reduce noise and improve contrast (Baltsavias, 1991). Displacement is calculated across image pairs. The co-registration algorithm works by selecting a reference block of pixels with sufficient optical contrast in the first (oldest) ortho-image. In the second ortho-image, the algorithm searches for the same block in a test area. If the block is successfully detected, a local horizontal displacement vector between the two images is calculated by means of the difference via the coordinates of the centroid. In our application, only vectors with an RMSE under a defined threshold, depending on the resolution of the orthophotos, are kept. This filtering enables the exclusion of spurious data from steep slopes and in cliff-adjacent areas that are frequently covered by loose debris or snow.
3.2 Hydrochemistry and tracers
Spring and streams samples were sampled during seven main campaigns carried out between July 2022 and July 2024 (30 June 2022, 12 July 2022, 18 September 2022, 29 October 2022, 11 June 2023, 3 June 2024, and 11 July 2024) during different hydrological periods and when access to the site was possible. A total of 37 springs and streams were sampled at least once (Fig. 3). Water samples for anion, cation, and water isotopes were filtered through a 0.2 µm cellulose acetate mesh sieve and stored in PTFE bottles (for cations and anions) and glass vials (for water isotopes). Samples for cations were acidified. All samples were stored at 4 °C and analyzed within a week. Cations and anions were analyzed using ion chromatography (Dionex), and water isotopes were measured with a Picarro L2130-i isotopic water analyzer at the geochemical laboratory of the University of Neuchâtel. Water isotope values are reported in ‰ relative to Vienna Standard Mean Ocean Water (VSMOW). The seasonal evolution of the isotopic data was compared to a local meteoric water line (LMWL) corresponding to an average of four northern regions of Italy bordering the catchment (Longinelli and Selmo, 2003; Longinelli et al., 2006):
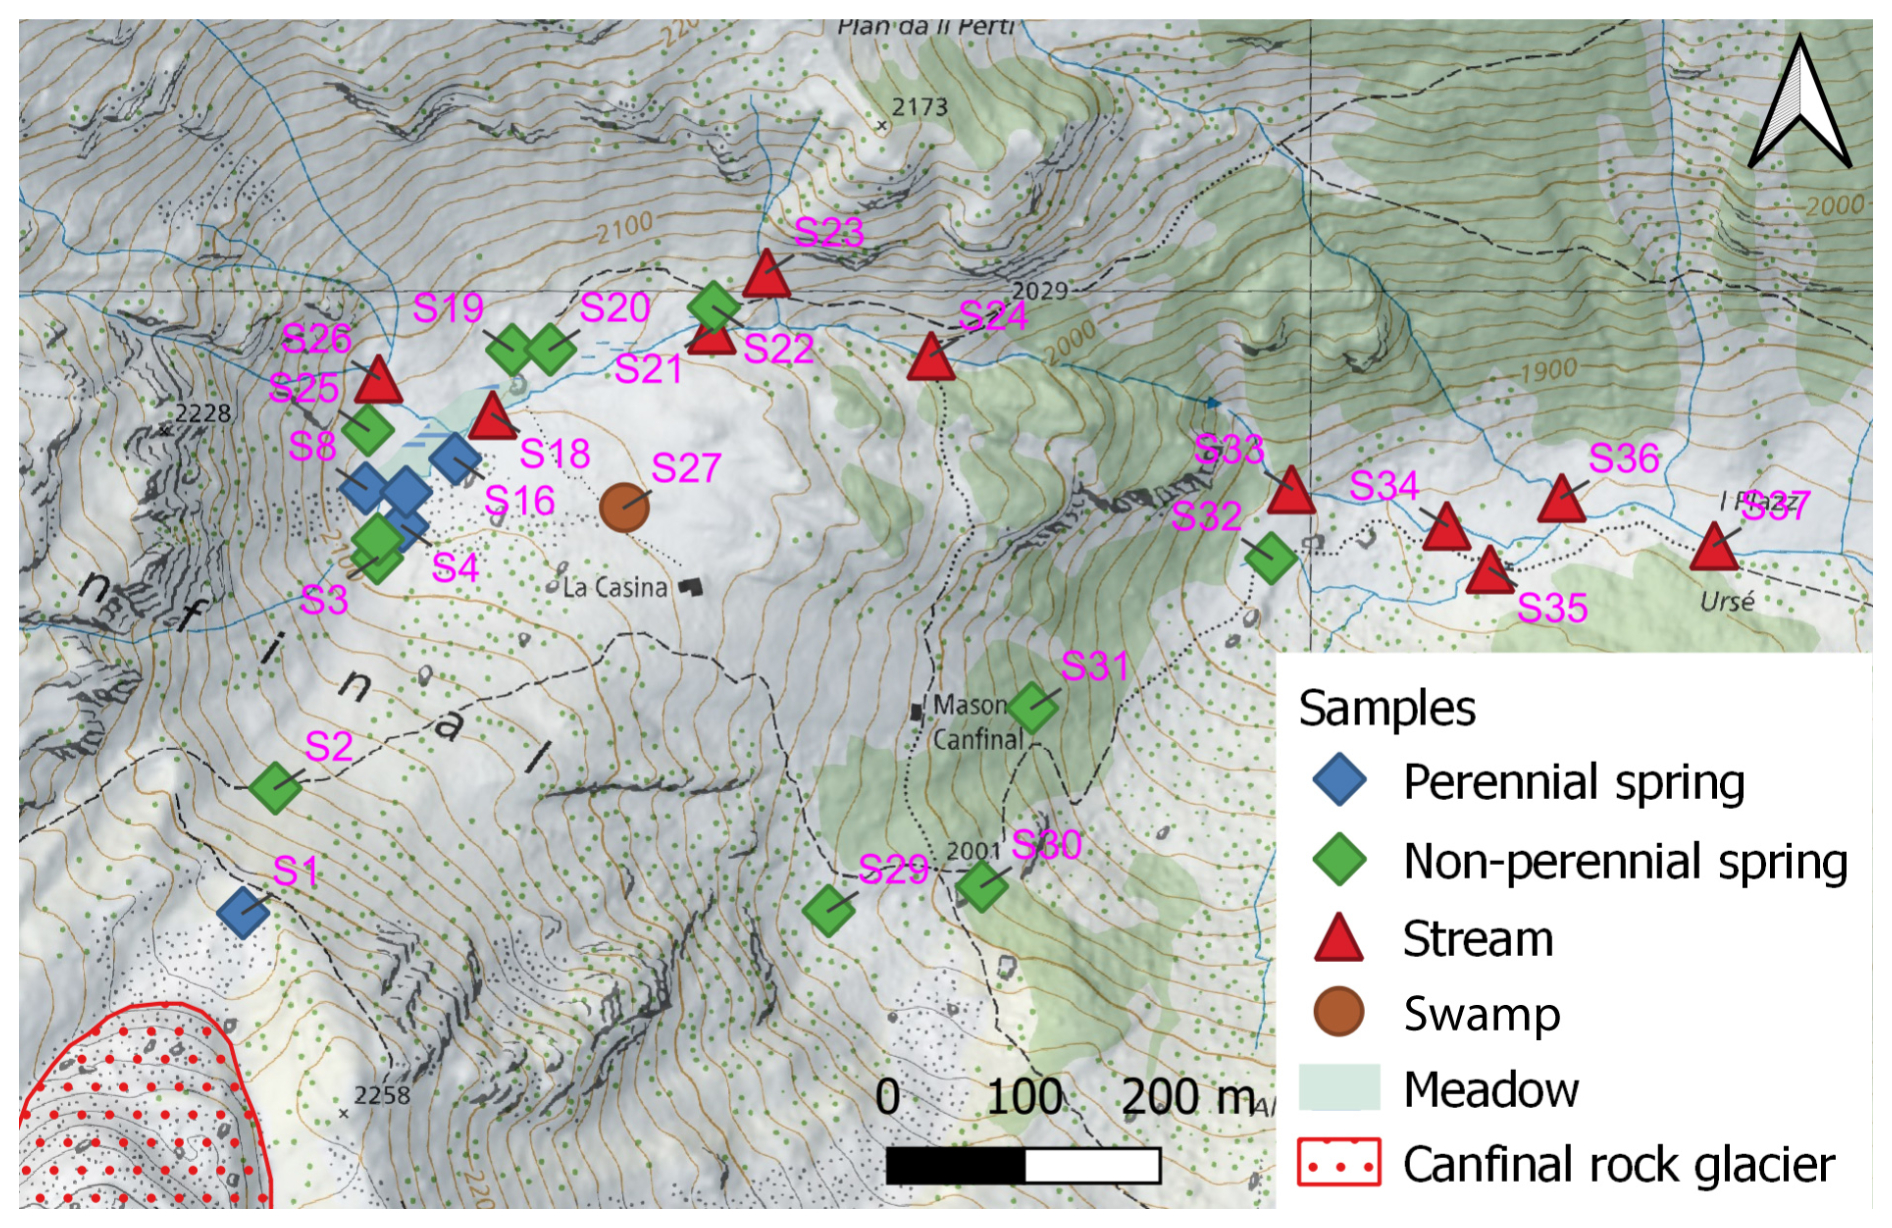
Figure 3The various springs and streams from which samples were collected during five campaigns between July 2022 and June 2023 for hydrochemical and isotopic analysis. The Val d'Ursé stream gauge is at the same location as the sampling point S37. Springs S1–S4 were also equipped with temperature and/or EC probes.
Principal component analysis (PCA) was performed to statistically identify the different water sources and their varying contributions to spring flow. The variables considered included stable isotopes (δ18O and δ2H); EC; and concentration of the main ions, namely SO, Na+, K+, Ca2+ and Mg2+. We used the Python package scikit-learn (Pedregosa et al., 2011) with variable standardization (scaling and centering) for PCA of all the data.
3.3 Frequency–domain analyses of spring time series
Frequency–domain analyses of hydrological time series can offer novel insights into hydrological processes (e.g., Acworth et al., 2017; Rau et al., 2017; Houben et al., 2022). For example, they enable the direct comparison of the phase and amplitude of diurnal signals (see Fig. S2 in the Supplement). This provides information on the delay and intensity of cyclic processes. Wavelet analysis of rock glacier outflow data has been carried out by Brighenti et al. (2021), the results of which hinted at the utility of such investigations. Here, we perform this analysis on data from springs that are influenced by meltwater from the RG. EC values from four springs situated at the foot of the Canfinal RG (S1), in the middle of the talus (S2), and at the talus–meadow interface (S3 and S4) (Fig. 3) were recorded. Specific conductance (EC at 25 °C) was calibrated with measurements taken by a portable probe (WTW Cond 3310). As we remove the periods during which the probes are air-exposed (i.e., dry springs) before analysis, only springs S1 and S4 have sufficient filtered data for this type of analysis. Because our frequency–domain approach utilizes relative phase and amplitudes, the absolute accuracy of the EC probes (often 5 µS cm−1, which may be less than the amplitude of the diurnal variation in EC) is unimportant. Nevertheless, lower measurement noise, which may be frequency-dependent, results in more accurate determination of amplitude and phase due to a higher signal-to-noise ratio.
A rolling-window FFT was used to isolate the dominant diurnal, i.e., 1 cycle per day (cpd), signal of the EC and air temperature (Tair) time series. Days that were heavily influenced by dilution due to heavy rainfall events, as well as periods when the springs were dry, were excluded. A 3 d window length (Fig. S2) with a 1 d step was selected to balance the temporal resolution, spectral leakage, and noise reduction, as well as to avoid eliminating excessive amounts of data adjacent to excluded time series data points.
Diurnal (i.e., frequency f=1 cpd) signals with non-stationary amplitude and phase dominate Tair, ECS1, and ECS4 time series. Amplitude (A) is a measure of the intensity of the diurnal variation, while phase (ϕ) or, similarly, time lag is a measure of the time of day at which minima and maxima occur. Here, to aid in interpretation, we present the data as a shifted time lag (Δt):
where ϕ is implicitly defined, noting the sign convention here, in the sinusoid.
The time lag is then limited to the range of [0 h,24 h) by shifting values outside this range by multiples of 24 h. Thus, a sinusoid with a phase ϕ=0 corresponds to a time lag of 06:00 UTC+0, i.e., the time of day at which the function is at its maximum. In a hypothetical case where maximum temperature coincides with minimum EC, the signals would be completely out of phase, and, thus, the time lag difference between them would be ±12 h. The interpretation of these data is discussed in Sect. 5.3.
4.1 Inter-annual dynamics derived from photogrammetry
The RG horizontal velocity field (Fig. 4) shows a high degree of spatial and temporal variability. For the most recent period (2019–2022), the horizontal velocity is highest in the center of the upper part of the RG. Here, the average horizontal velocity can exceed 1 m yr−1 slightly. A decreased velocity is observed in the lower, central part where horizontal ridges are visible. At the edges of the RG and in the frontal zone, creep is negligible.
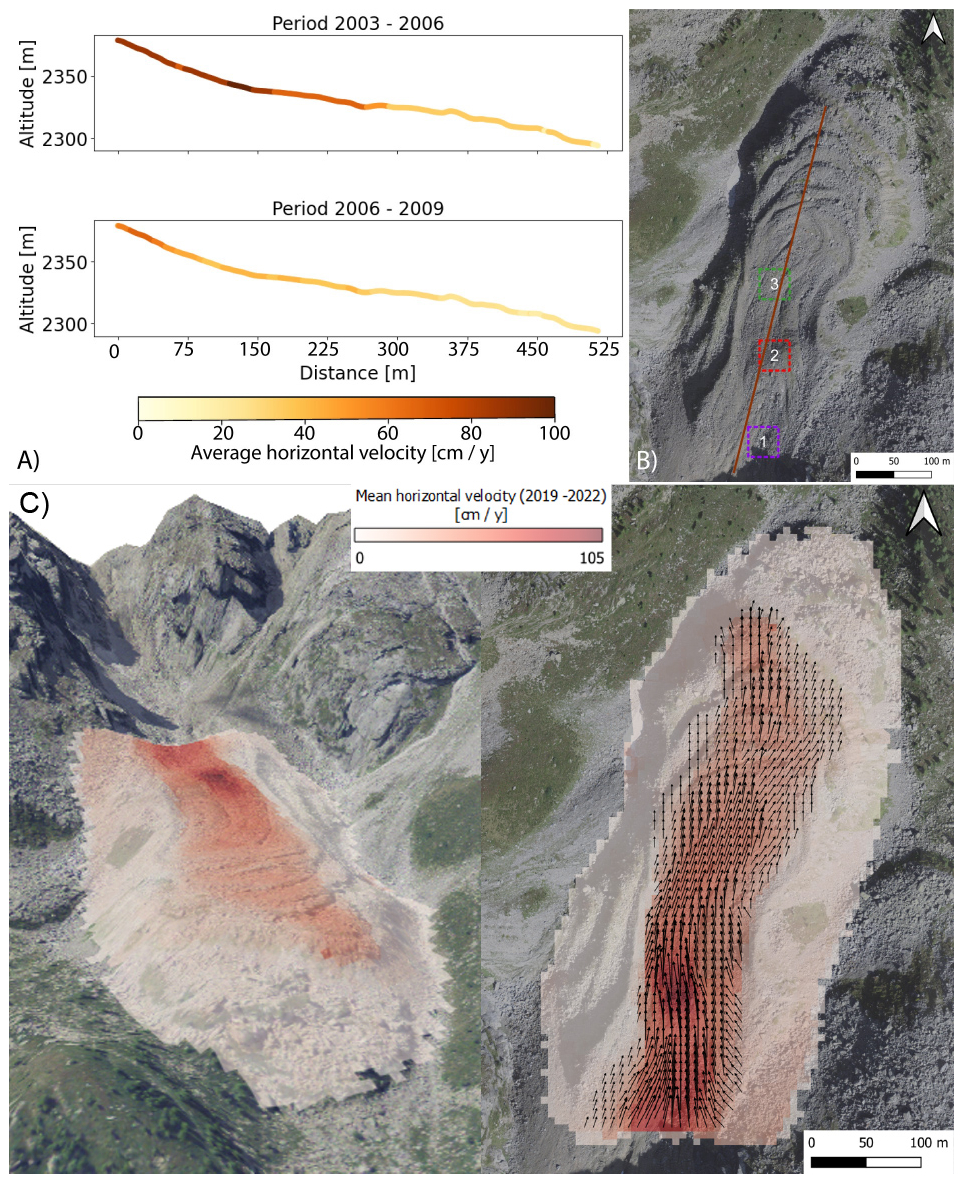
Figure 4(a) Average horizontal velocity along the topography between the contrasting periods 2003–2006 (high activity) and 2006–2009 (low activity). (b) The three zones in the upper part of the Canfinal RG for which recent changes in average horizontal velocity have been compared (see text). (c) 3-D and top-down views of average horizontal velocity of the Canfinal RG for the period 2019–2022. Vectors represent the horizontal displacement direction and intensity. Aerial picture © data: CNES, Spot Image, swisstopo, NPOC.
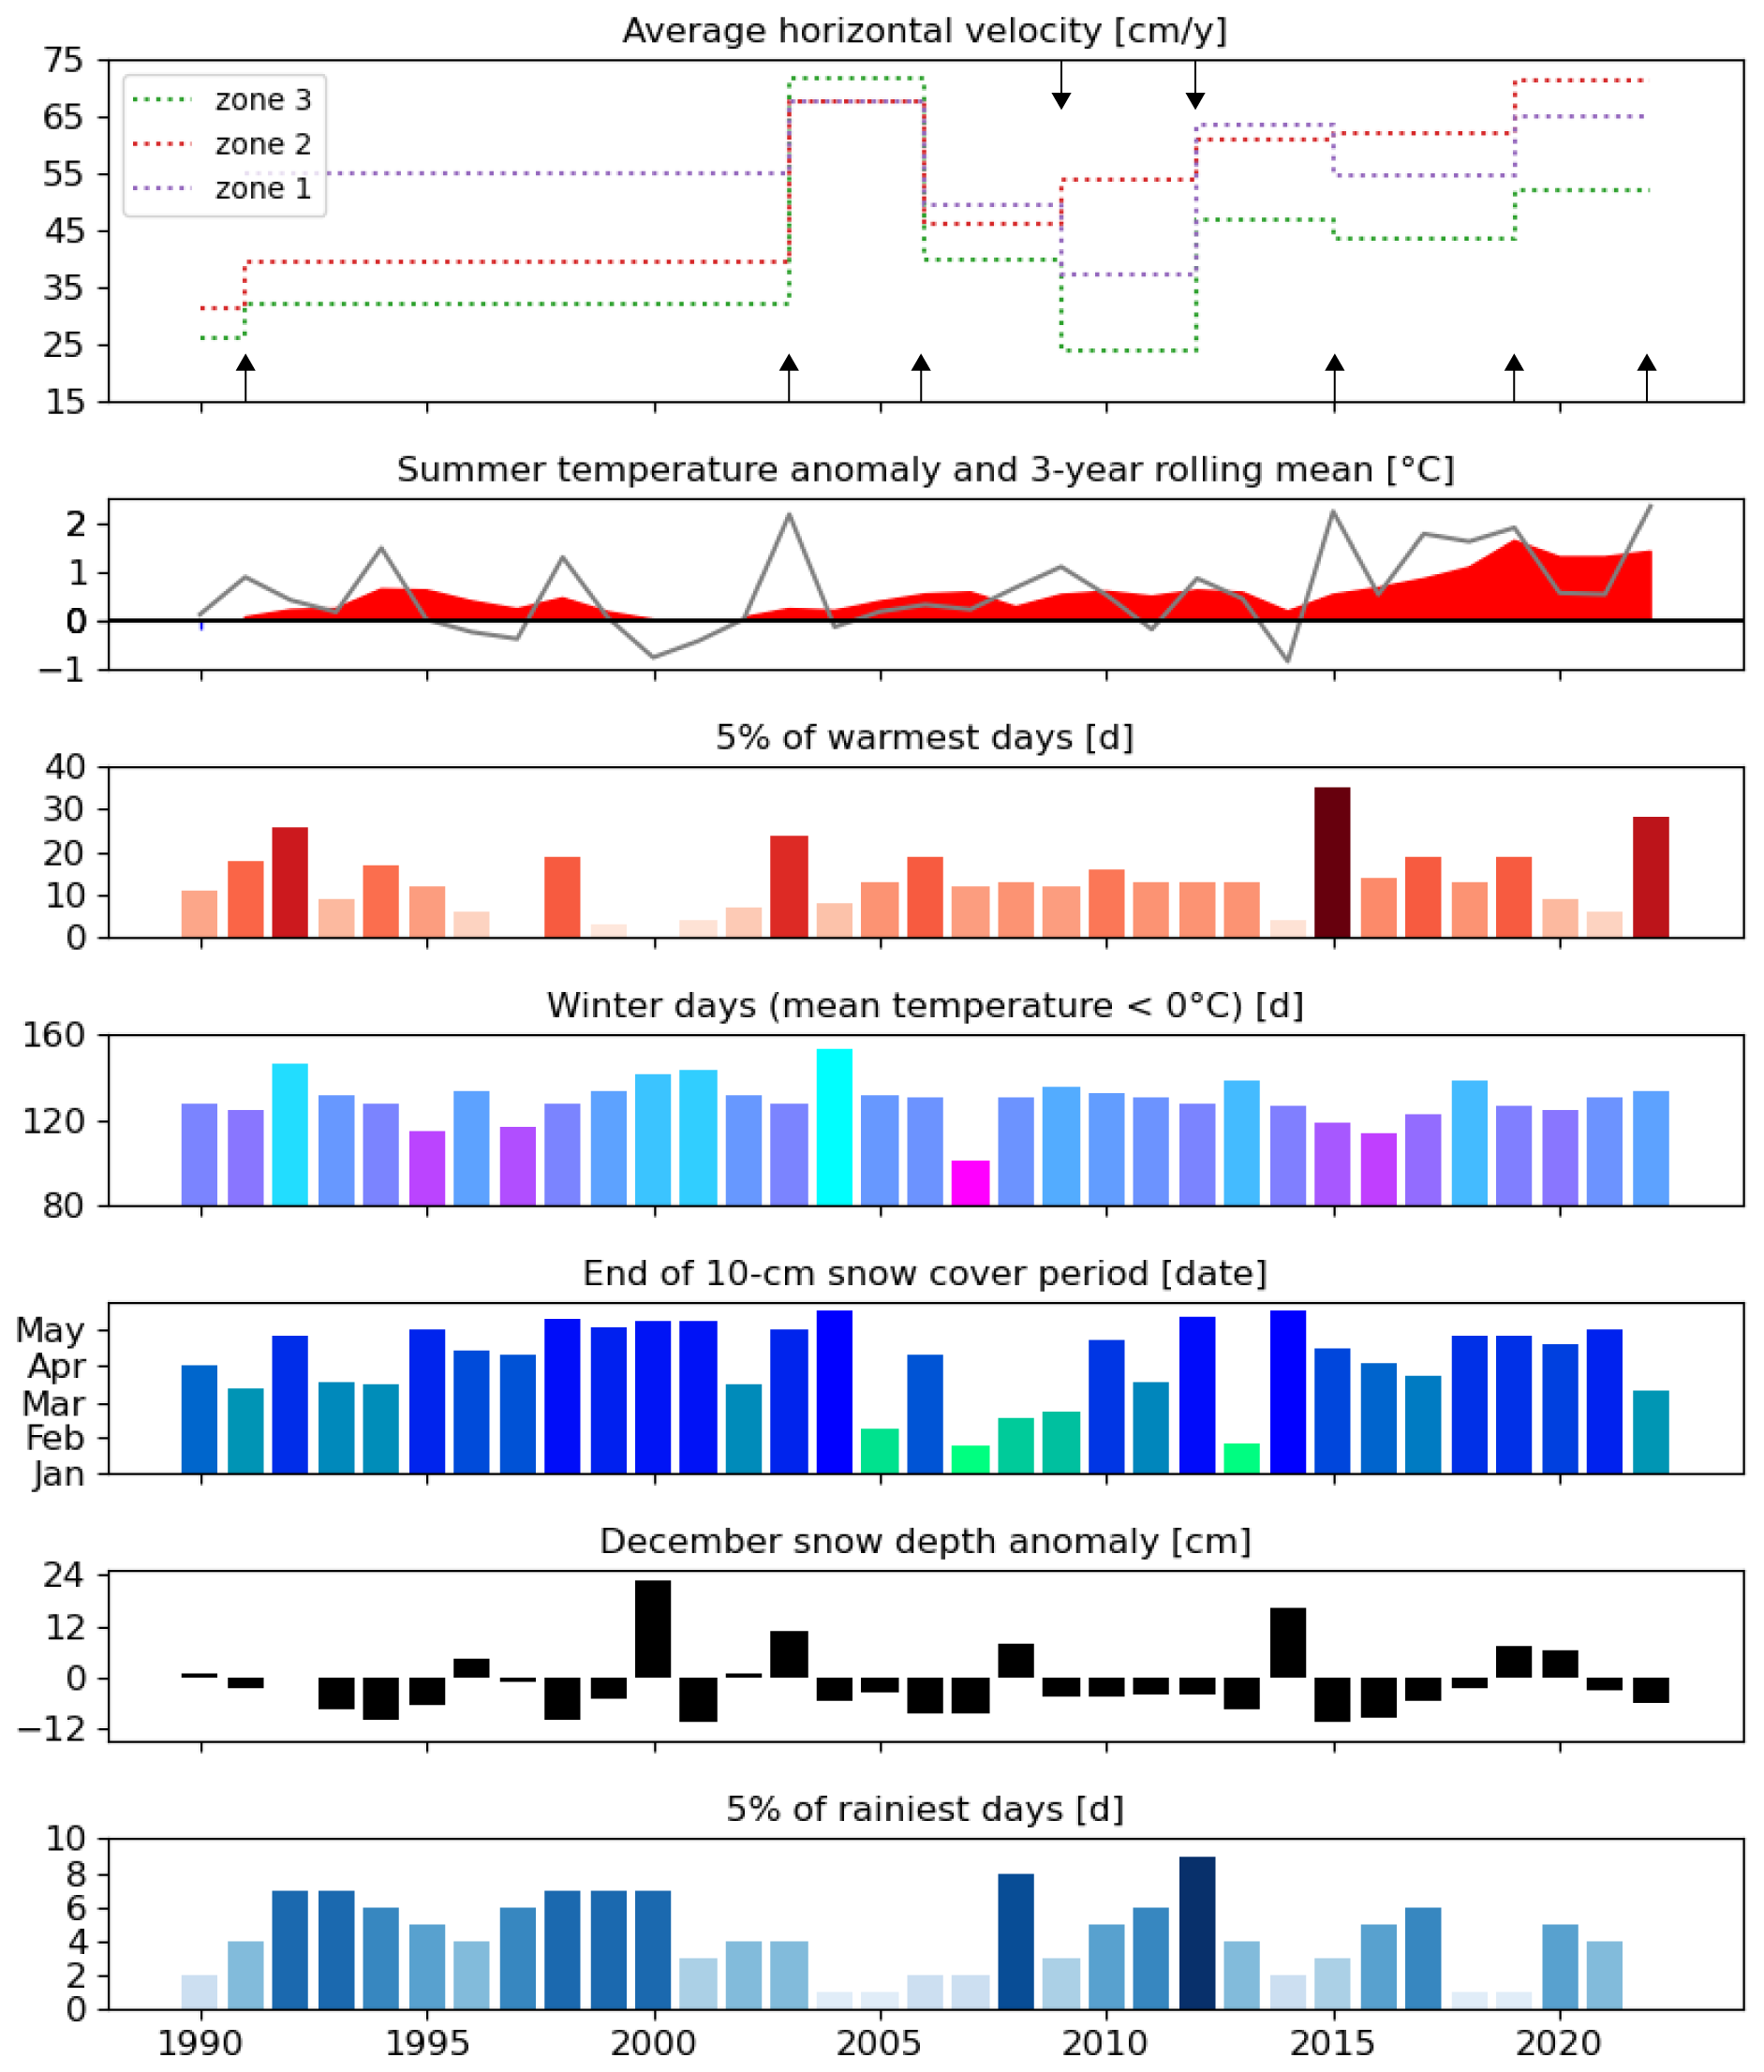
The differences in average horizontal velocity along the topographic profile of the RG confirm that velocities are highest in the upper part. Average horizontal velocities for three 40 m × 40 m zones in the upper part were compared with six climate indicators for the period 1990 to 2022. These climate indicators were obtained form the global-scale ERA5 database (Hersbach et al., 2023), which provides data calculated on a 31 km grid. While local climate variability may be averaged out in such coarse global datasets, they still offer valuable insights into broader trends and seasonal dynamics of the required climate indicators:
-
summer temperature anomaly (mean daily Tair anomaly for the summer period (June–August) compared to the mean summer Tair measured since 1940)
-
5 % of hottest days (number of summer days (JJA) per year when the mean Tair is higher than 95 % of the daily summer mean Tair measured since 1940)
-
winter days (number of days per year when the average Tair is below 0 °C)
-
end of 10 cm snow cover (date when the snow cover falls below 10 cm)
-
December snow depth anomaly (anomaly of the mean snow depth at the beginning of the winter season, i.e., in December)
-
5 % of wettest days (number of days per year on which the cumulative precipitation is greater than 95 % of the daily cumulative precipitation since 1990).
The results show a general acceleration of the average horizontal velocity since the 1990s (Fig. 5), especially for zones 2 and 3 (Fig. 4b). The average horizontal velocity in zone 2 was 39±6 cm yr−1 between 1992 and 2003, while its maximum was measured between 2019 and 2022 at 71±5 cm yr−1. In zone 3, the average velocity was 32±6 and 52±5 cm yr−1 for the same two periods but peaked at 72±9 cm yr−1 between 2003 and 2006. The variations are less significant for zone 1, which nevertheless experienced a slowdown in the period 2010–2012 (37±12 cm yr−1). This stabilization is also visible in zone 2.
Only the climate indicators for the summer Tair anomaly and days with extreme temperatures show a similar overall trend that can be attributed to climate change. All three zones experienced a strong acceleration between 2003 and 2006, with 2003 being characterized by a very warm summer Tair anomaly (>2 °C) and a high number of days (24) with extreme temperatures. These values correspond to the European heatwave of 2003. It should also be noted that 2014 had a strong winter with a significant snow depth anomaly that lasted until May. There were also less intense precipitation events, and the summer was characterized by a negative Tair anomaly and few extremely warm days. In the following years, from 2015 to 2019, there was a slowdown in zones 1 and 3 and a stabilization in zone 2. Otherwise, there are no globally similar trends between the acceleration and stabilization phases of the three zones and the winter indicators or intense precipitation events.
4.2 Spring water sources and seasonal dynamics
All ionic concentrations are relatively low for the Val d'Ursé catchment (EC <250 µS cm−1). This is expected for such alpine environments dominated by crystalline bedrock aquifers. Here, we focus on springs influenced by the rock glacier, distinguishing between those located near its front (S1 and S2 in Fig. 3) and those at the base of the talus (S3 and S4 in Fig. 3). Additionally, we differentiate between samples collected during high-flow periods (defined to be from May to August, indicated in blue in Fig. 3) and those collected during low-flow periods (defined to be from September to December, indicated in red in Fig. 3).
Firstly, these two groups of springs show clear differences in mineralization content. S1–S2 are less mineralized than S3–S4, as is evident for Ca2+ + Mg2+ and SO concentrations in Fig. 6a). These differences suggest more diluted groundwater close to the RG (referred to as the rock glacier end-member), while mineralization increases with distance from the RG, suggesting a greater contribution from deep mineralized groundwater (referred to as the deep groundwater end-member in the following). However, S1 and S2 show higher concentrations of some reactive elements like K+ and NO (Fig. 6b). S1 has the highest concentration of NO (∼0.03 meq L−1), and this decreases along the talus–meadow complex as a function of distance from the RG. S4 has an NO concentration of 0.022 meq L−1, while all other springs located in the meadow area but not aligned with the RG and the talus have NO concentrations ranging between 0.002 to 0.133 meq L−1.
In a classical bivariate plot of water isotopes showing δ18O and δ2H, all samples align with the local meteoric water (LMWL) (Longinelli and Selmo, 2003; Longinelli et al., 2006). There is no clear distinction in terms of isotopic composition between the two end-members, suggesting a similar source of recharge water. The only variability arises during changes in seasonal flow regimes.
Indeed, both end-members show dilution–enrichment dynamics throughout the season. During high-flow periods, after the onset of the snowmelt, both end-members display a drop in concentration due to mixing with melted water. Focusing on the relationship between Ca2+ + Mg2+ and SO, the deep groundwater end-member (squares in Fig. 6) shows a clear mixing toward the rock glacier end-member under high-flow regimes of about 40 %. Similarly, water isotopes show an decrease in δ18O and δ2H after the snowmelt typical of cold-water recharge (Fig. 6c). As the season advances, the isotopes show a progressive increase in δ18O and δ2H.
All those observations are effectively summarized in a principal component analysis presented in Fig. 6d. The main elements discussed before are considered, i.e., EC, Ca2+, Mg2+, SO, K+, Na+, δ18O, and δ2H. The first two axes of the PCA explain 53 % and 29 % of the total variation in the dataset, respectively. The PCA confirms the differentiation of the two end-members along the PC1 dominated by EC, Ca2+, Mg2+, and SO, while PC2, influenced by K+, Na+, δ18O, and δ2H, explains the seasonal variability with increasing values during low-flow regimes.
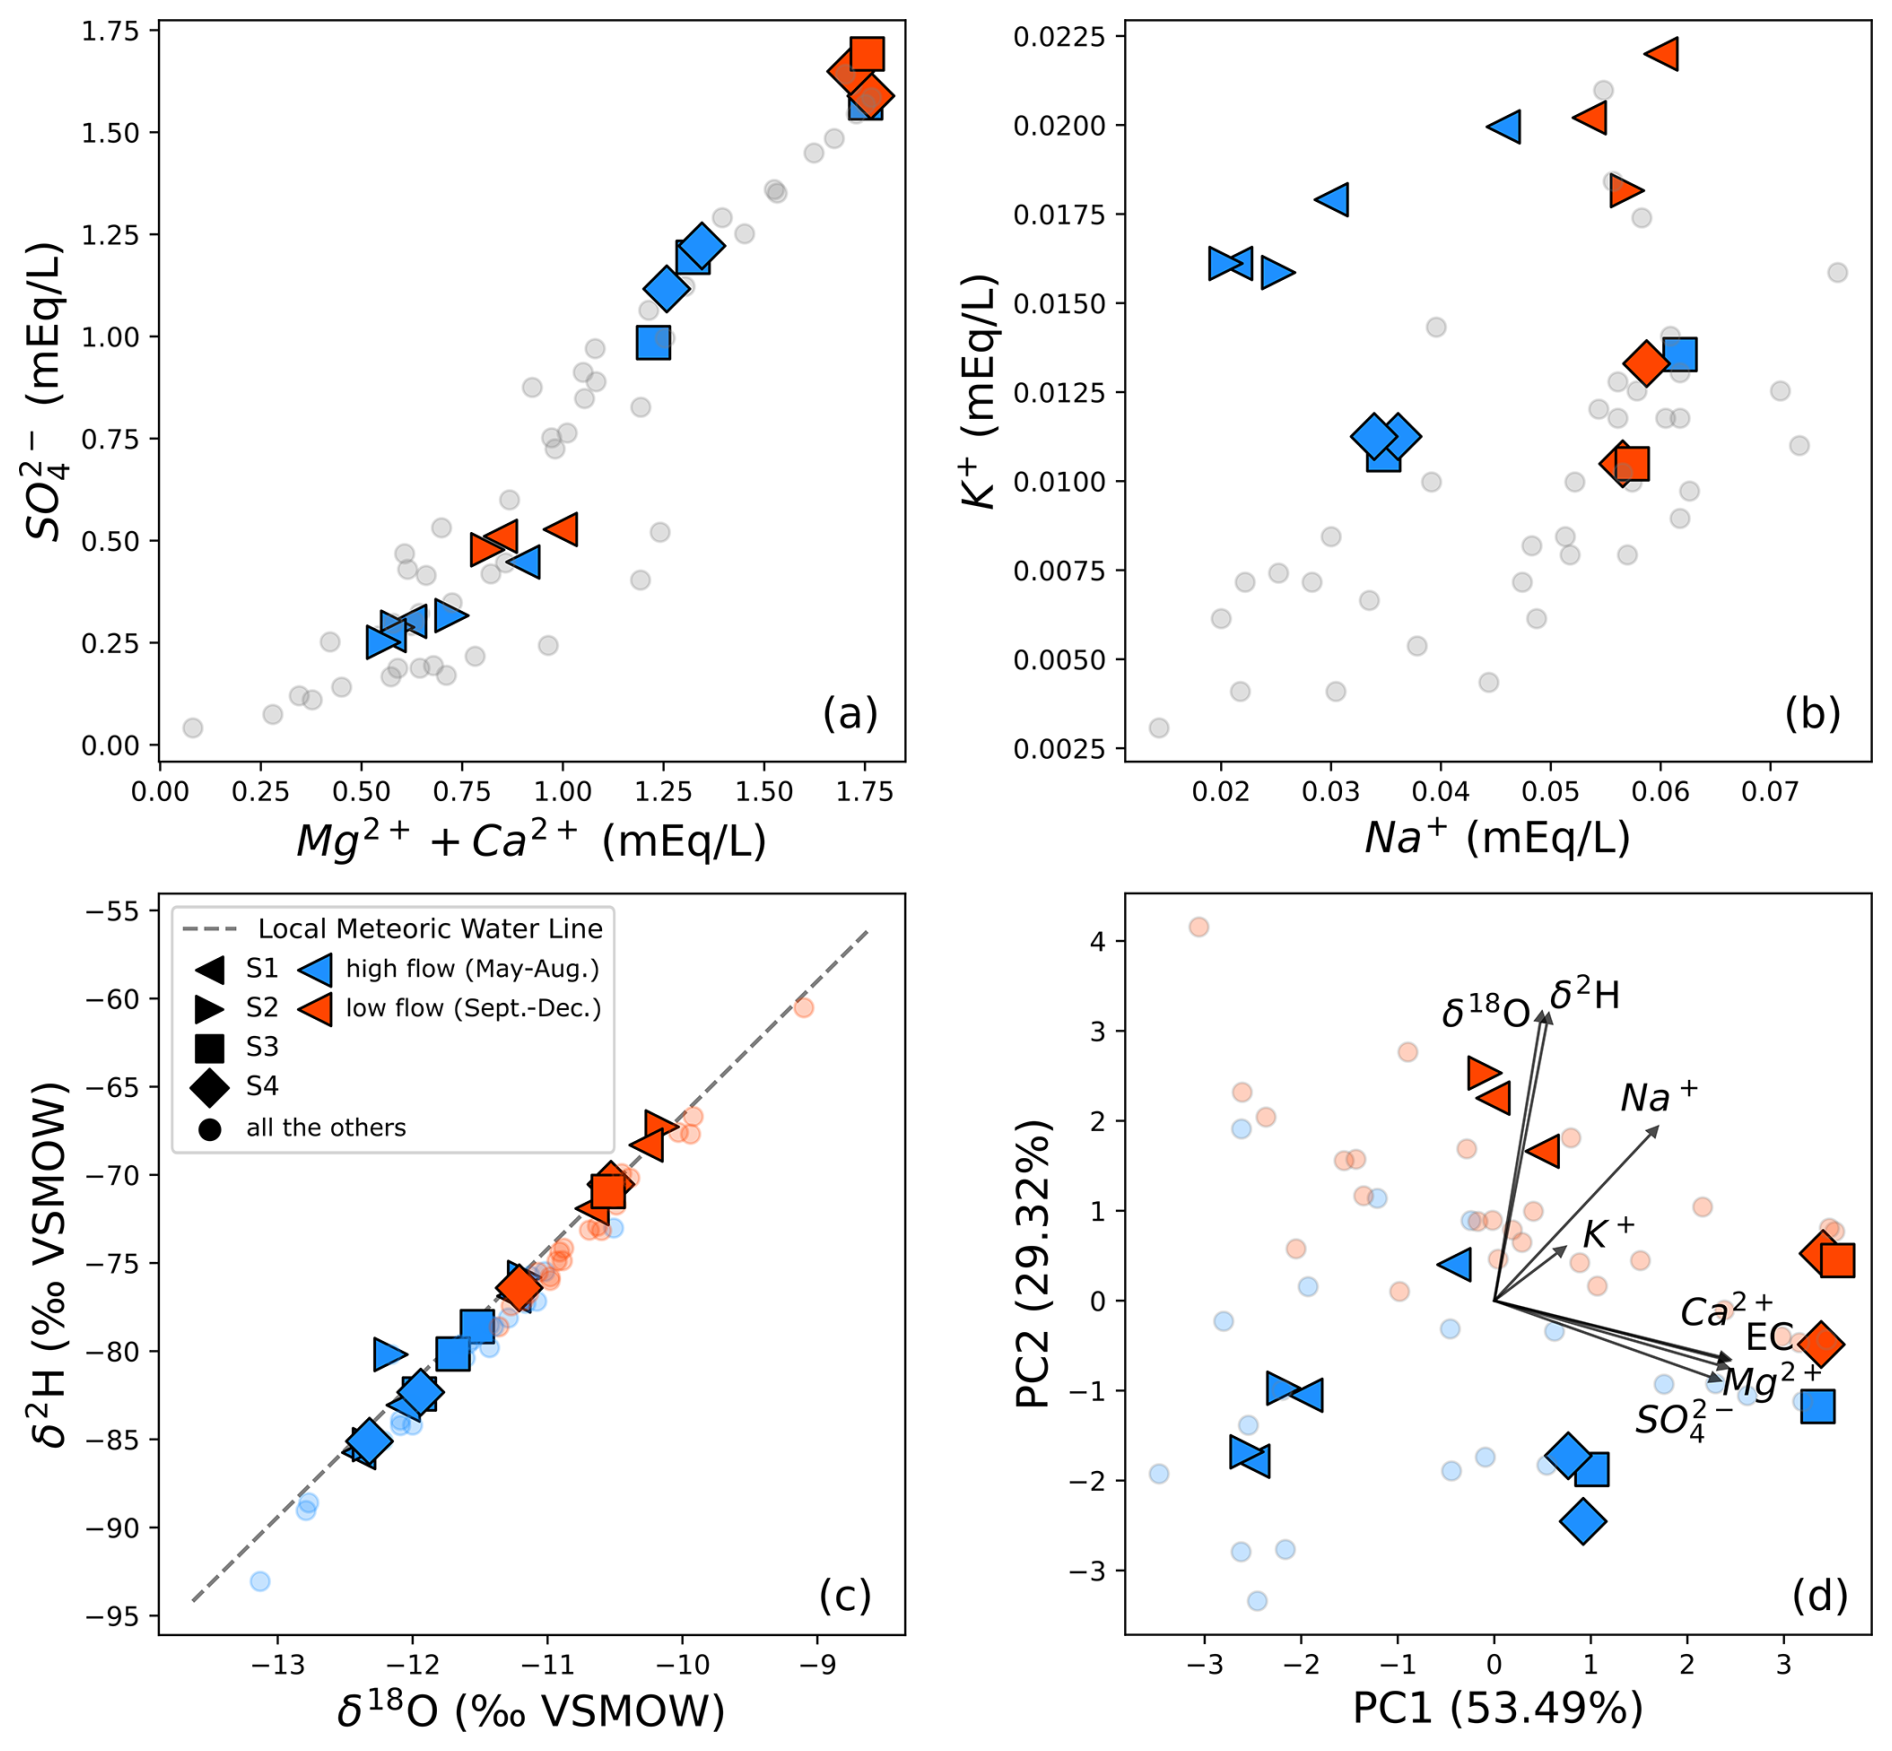
Figure 6Chemical composition and isotopic ratios of main springs (S1–S4) under high- and low-flow regimes. (a) Bivariate plot of sulfate versus the sum of calcium and magnesium concentrations. (b) Bivariate plot of potassium versus sodium concentrations. (c) Isotopic composition compared with the local meteoric water line (LMWL) (Longinelli and Selmo, 2003; Longinelli et al., 2006). (d) Principal component analysis (PCA) plot with the first two components, explaining the majority of the variance within the dataset (percentage of variance explained is shown in brackets). Eigenvectors representing the influence of each variable are indicated by black arrows. For all plots, the main springs S1 to S4 are highlighted with unique symbols, while all the other sampling points are represented by circles in the background. Analyses performed during high-flow regimes are marked in blue, and those from low-flow regimes are marked in red.
4.3 Frequency–domain analyses of dilution linked to RG diurnal thaw cycles
EC time series measurements from the springs (Fig. 7) showed varying responses at the foot of the RG (S1) and at the talus–meadow interface (S4). Rainfall events have a strong dilution effect on both springs, specifically at the end of summer and during fall. Between two events, the EC systematically recovers to its value from before the first event, with a characteristic timescale that is faster for S1 than for S4. A seasonal variability in the EC signal is also involved at both springs, although this is more evident in S4. A decrease in EC is involved at the onset of the snowmelt, with minimum values around May–June, and is followed by an exponential increase until the next snowmelt recharge season. In fall, some long duration of free rain events implies that the spring S1 dries out between September and October months. S1 is also dry during most of the snow cover period, while S4 continues to flow. In 2023, S1 was reactivated at the beginning of May following the snowmelt recharge, with a lower EC (about 40 µS cm−1) than before the winter.
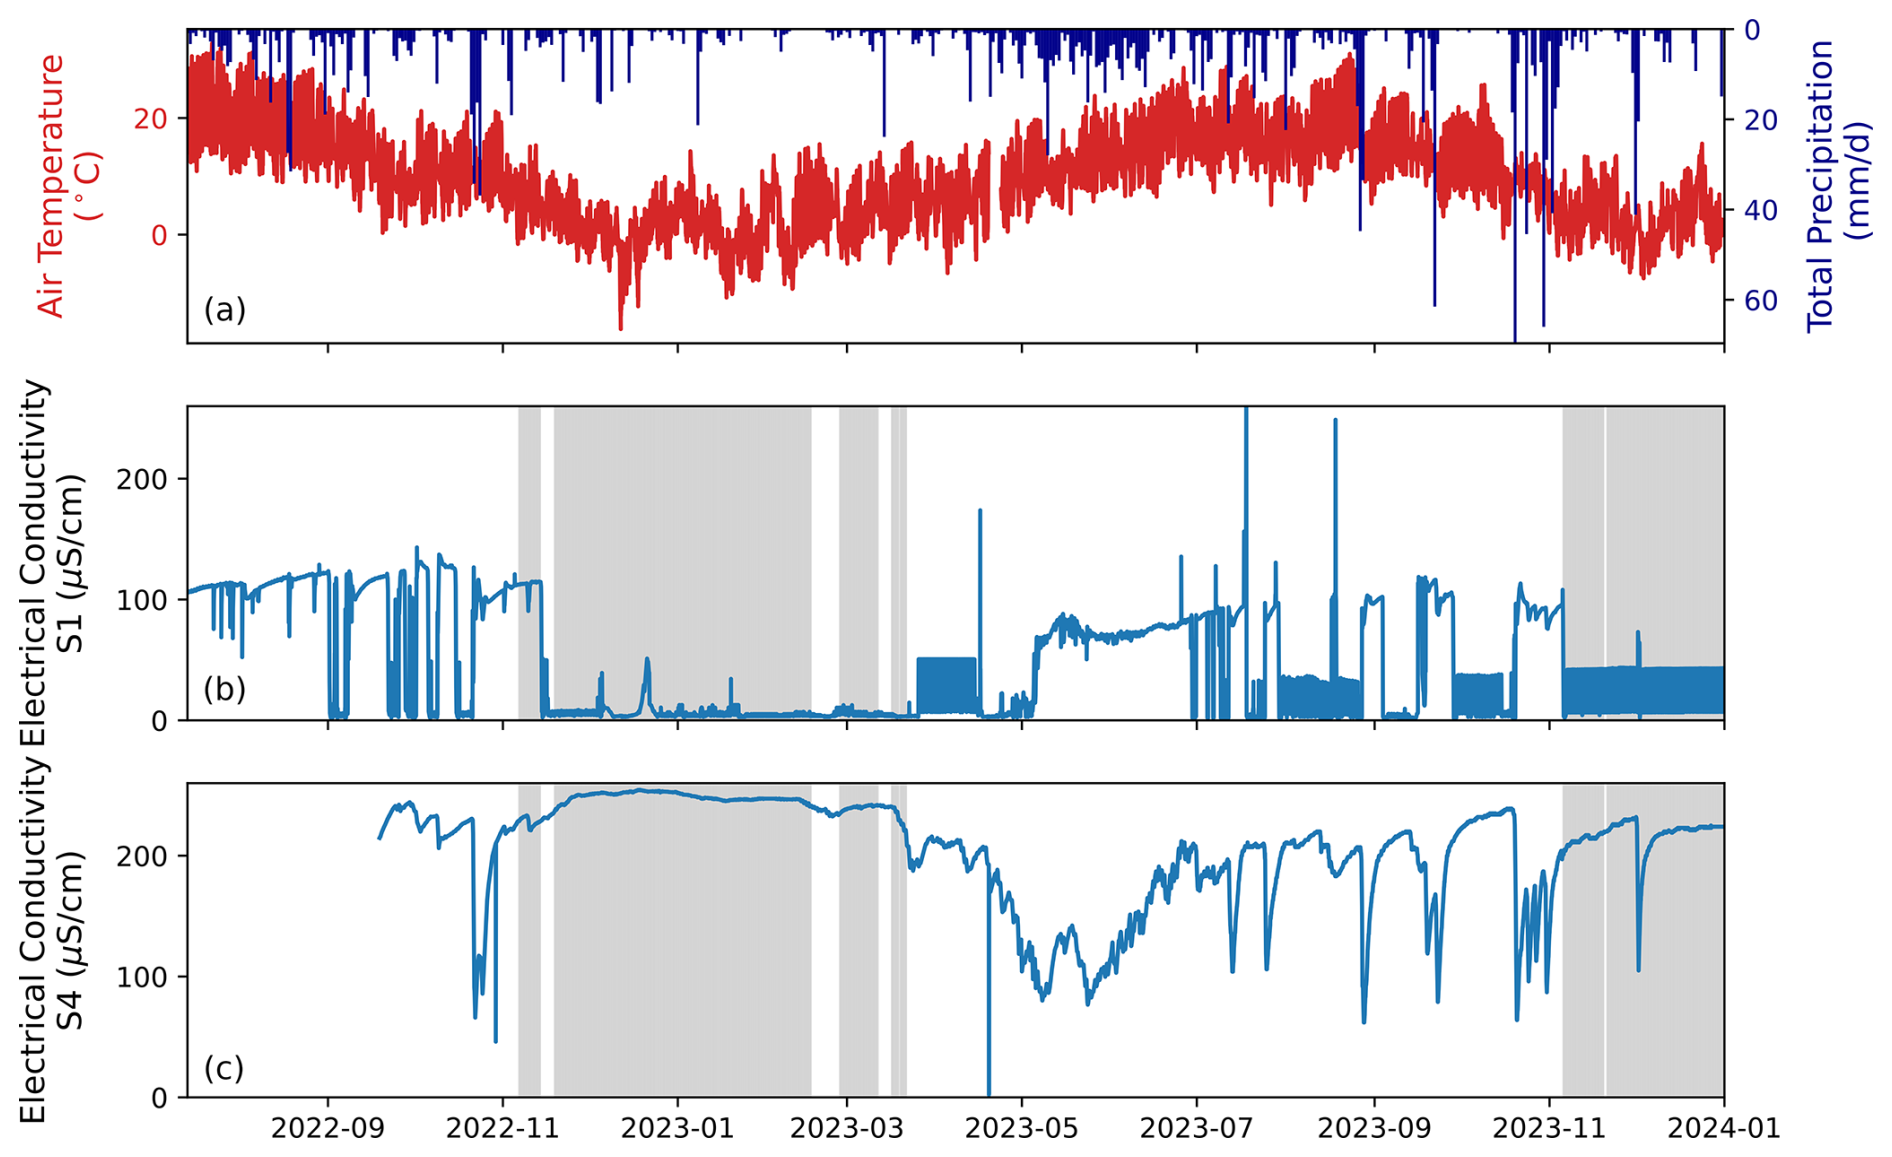
Figure 7(a) Daily precipitation and air temperature from the nearby weather station Robbia (MeteoSwiss). (b) Electrical conductivity of spring S1, located at the base of the Canfinal rock glacier, and (c) electrical conductivity of spring S4, situated at the talus–meadow interface. Data are displayed from July 2022 to January 2024. Gray-shaded areas denote periods when the weekly average air temperature is below 0 °C. Starting April 2023, S1 EC exhibited significant noise, probably linked to the sensor not being immersed in water.
The amplitude (Fig. 8a–e1) and time lag (Fig. 8a–e2) of the 1 cpd components of Tair, ECS1, and ECS4 were calculated using a 3 d rolling window stepped in increments of 1 d. Frequency–domain analysis of these time series reveals significant amplitude variations and a phase lag between the Tair and EC signals measured at these springs. The 1 cpd amplitudes vary significantly for all datasets, indicating seasonal differences in the intensities of daily cycles. Tair varies more diurnally during summer than during winter, as indicated by its amplitude trend. The amplitudes of the spring EC diurnal variations also exhibit seasonal trends, which may be linked to the intensity of dilution from RG melt. S1 and S4 both show a much higher amplitude in periods immediately after snowmelt than in the summer and fall periods, with an amplitude of 0.75 for S1 and of 2.25 for S4 in June. Subsequently, amplitudes decrease to values close to 0 in the late summer and fall. For S1, these low amplitudes were particularly visible in 2022, while 2023 had poor-quality data which prevented the analysis. For S4, this seasonality is consistent during the full recording period (see Sect. 5.4). This seasonality is also assessed by looking at the ratio of the EC amplitudes to those of Tair (), which aims to normalize the EC amplitudes by the main driver of daily melt rate variations (Fig. 8d–e1). Note that S4 shows significant variations in late summer due to the high variability in EC amplitudes during this period, probably due to high-precipitation storm events influencing the signal.
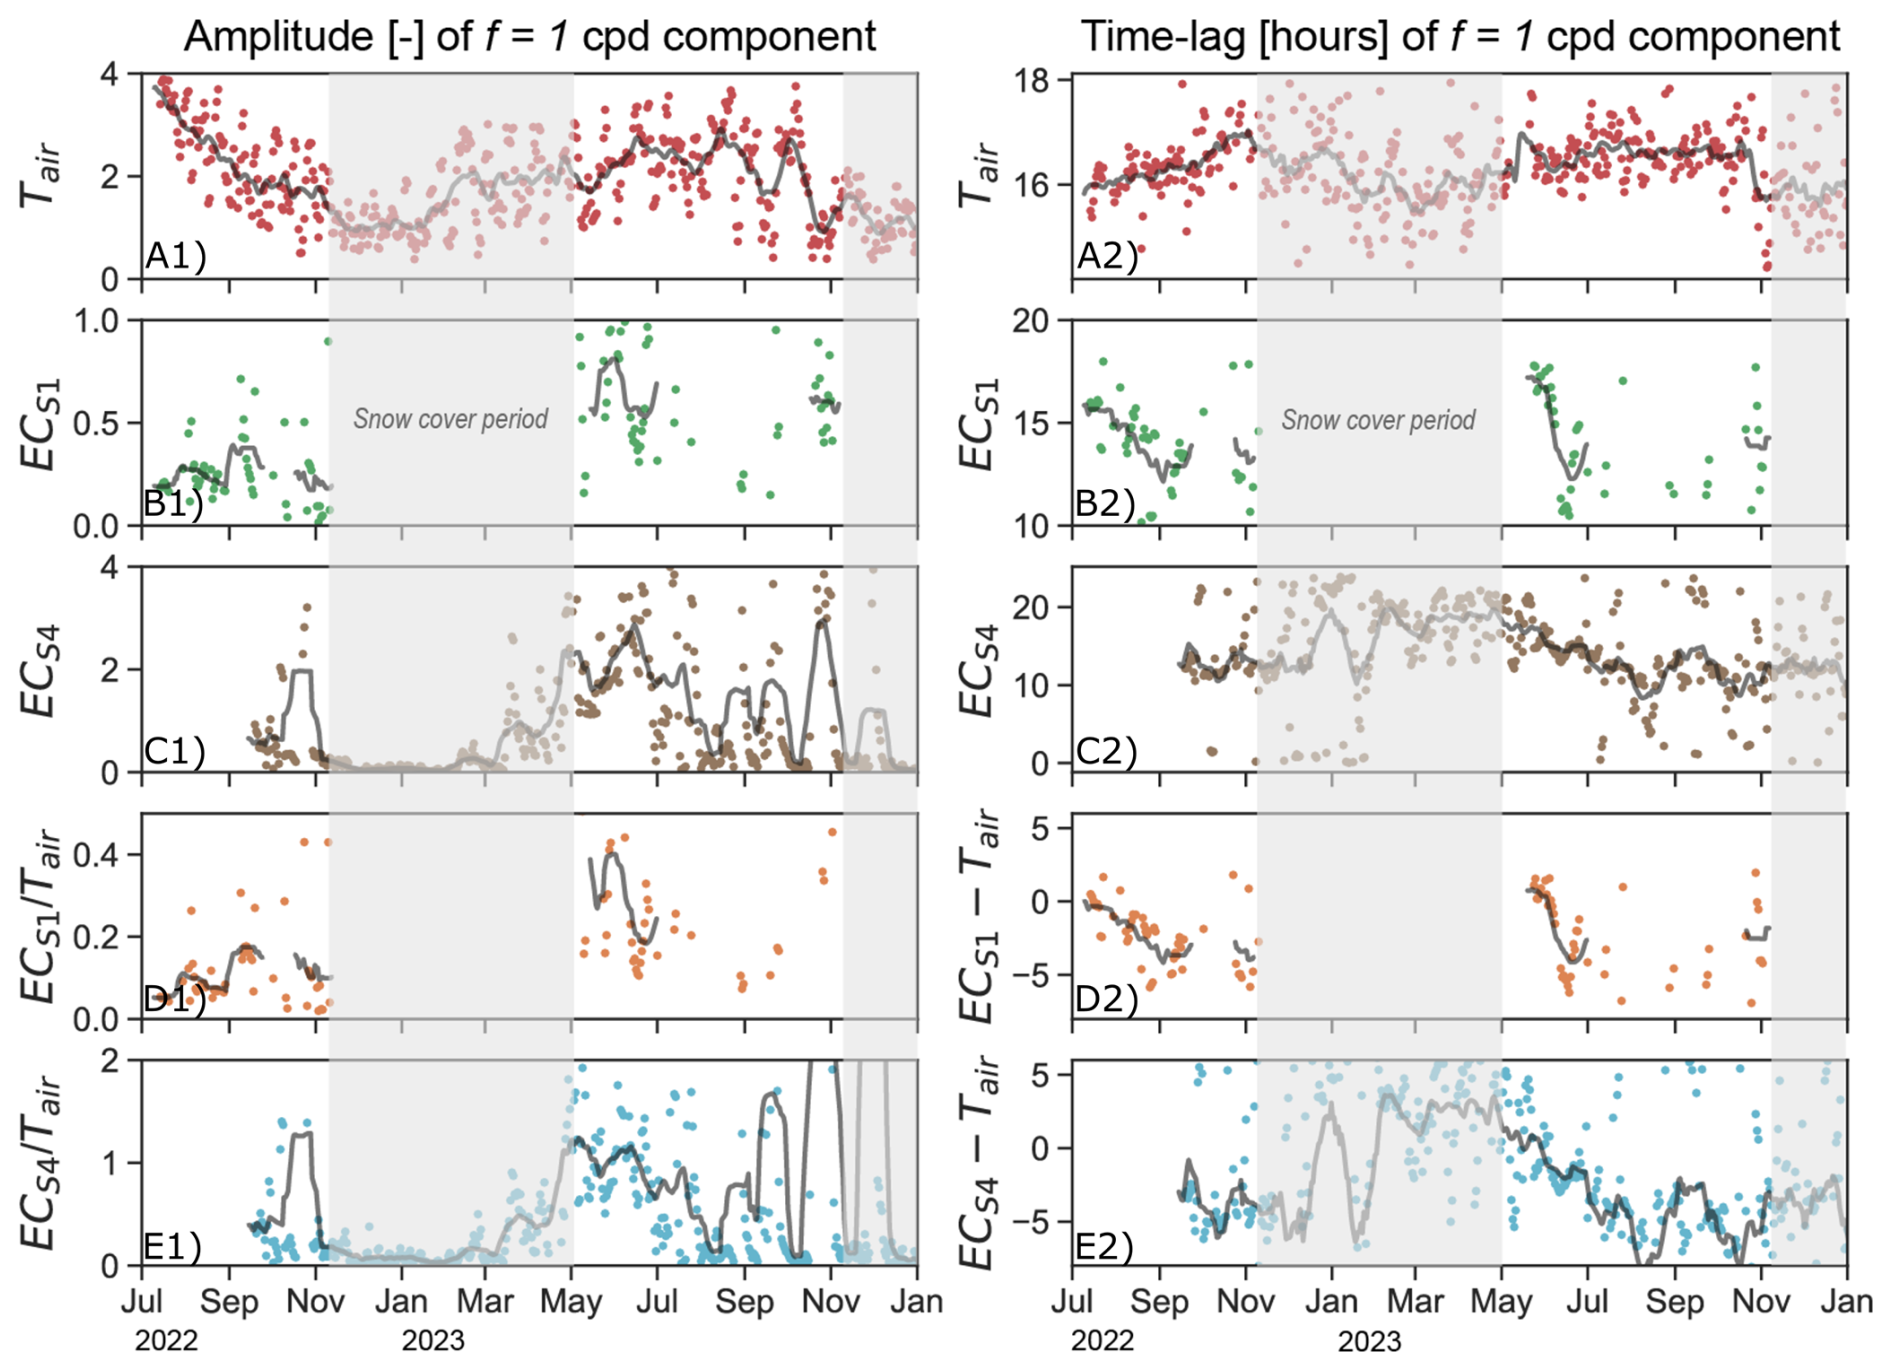
Figure 8Amplitude (a–e1) and time lag (a–e2) of 1 cpd components of the filtered EC time series from springs S1 (foot of the Canfinal RG) and S4 (talus–meadow interface) and of air temperature between July 2022 to January 2024. The relative amplitude ratios (d1–e1) and time lag differences (d2–e2) between the springs' EC and air temperature signals are also illustrated. Rolling means with a 21 d window length are shown as a continuous line in order to help discern seasonal variations. Here, amplitudes can be considered to be unitless, and phase has been converted to time lag (i.e., from radians to hours UTC+0) to facilitate interpretation (Sect. 3.3). The periods of snow cover are indicated by the shaded sections.
The time lag information (Fig. 8a–e2) enables an objective measurement of the timing of diurnal dilution processes. The phase of the 1 cpd component of Tair is, as expected, relatively stable throughout the year. S1 exhibits a clear decreasing trend in time lag (Fig. 8B2), specifically from ∼15 to ∼12 h, starting at the onset of snowmelt, indicating that the times of minimum daily EC occur progressively earlier over this period. The phase of S4 shows a similar trend over the same period, with a decrease from ∼19 to ∼11 h, particularly visible in the 2023 spring. The time lag difference (or phase shift) between EC and Tair (Fig. 8d–e2) confirms these observations. Nonetheless, we can observe that the EC daily maxima generally precede the Tair maxima and, thus, the EC daily minima lag Tair by <12 h.
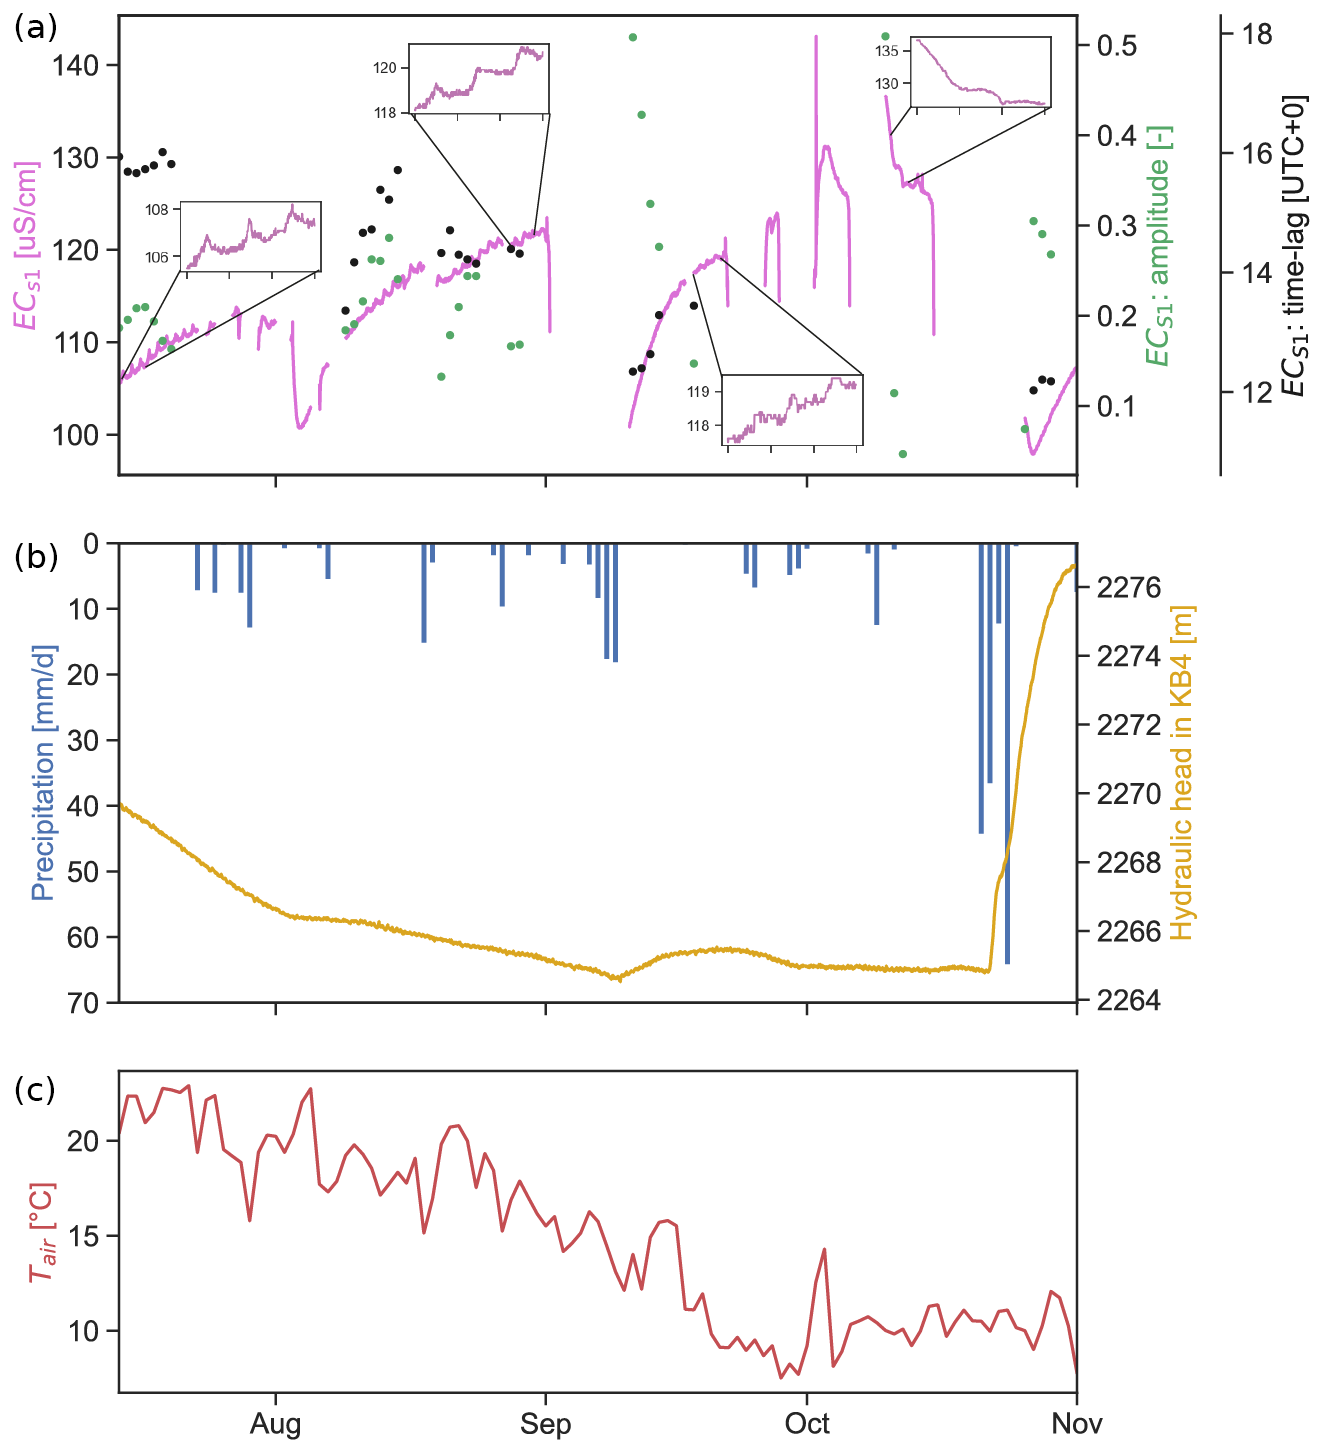
Figure 9(a) Cleaned electrical conductivity of spring S1, as well as the amplitude and time lag of the 1 cpd frequency component (see Fig. 8), for the period 14 July 2022–1 November 2022. Periods with no data represent days with precipitation or spring flow cessation. Details of selected 3 d windows are also shown to illustrate the changes in daily variations. (b) Fractured aquifer hydraulic head (KB4; see Fig. 1) and daily rainfall (mm) over the same time period. (c) The 7 d average air temperature (°C).
The longer-term, non-diurnal variations in EC and hydraulic head provide valuable insights into local hydrological processes (Figs. 9 and S4). During the summer and fall snow-free period, the EC of springs S1 and S4 gradually increases (Fig. 9a), while the hydraulic head measured in borehole KB4, adjacent to the rock glacier (Fig. 1), decreases. The minimum hydraulic head, recorded in early September and late October at KB4, corresponds to a period when spring S1 was dry, while S4 continued to flow throughout the season. The overall cooling trend in air temperature during this period is associated with a decrease in EC amplitude and a negative shift in time lag at S1, highlighting that lower temperatures lead to a reduced rate of rock glacier thaw. Precipitation events temporally influence the seasonal variability further by recharging the deep aquifer and diluting the spring EC signal. These punctual events impact the frequency–domain analysis, modifying both the amplitudes and time lags of EC variations before returning to previous values.
5.1 Creep is accelerating as a result of rising temperatures
Horizontal velocity patterns of Canfinal RG are consistent with the presence of longitudinal ridges in the upper part of the RG, indicating strong velocity contrasts between the center of the RG (1 m yr−1) and the edges. The horizontal ridges in the lower part confirm the stabilization of the displacement. We can conclude that the upper part is active, while the lower part consists of older features that are now inactive or relicts. Since 1990, the zones delineated in the upper active part, especially zones 2 and 3 (Fig. 4b), which are further away from the cliffs, have accelerated. This is the steepest part of the RG and is also the zone for which most conceptual models indicate the largest proportion of ice (Jones et al., 2019; Schaffer et al., 2019), making this higher velocity a good indicator of the presence of a large amount of supersaturated debris and/or ice mix under steady-state creep. This demonstrates that, in addition to slope, the volume and temperature of the ice, which affect its rheology, as well as the increase in liquid-water content caused by thawing, have a significant impact on the dynamics of RGs (Duval et al., 1983; Kääb et al., 2007; Marcer et al., 2021). Nonetheless, most of the horizontal RG displacement is observed in the shear horizon. This is located at the base of the RGs, and the effect of Tair is therefore delayed and limited (Kääb et al., 2007; Cicoira et al., 2021). Temperature variations within the shear horizon are thought to alter its mechanical properties over longer timescales, particularly those near the melting point. The presence of pressurized water within this unit suggests that the unfrozen-water content has a strong influence on its dynamics (Ikeda et al., 2008; Buchli et al., 2018; Cicoira et al., 2021). In addition, melting ice allows more liquid water to enter the shear horizon, with the associated destabilizing effect and heat conduction (Wirz et al., 2016).
Although the determined horizontal velocities are multi-year averages, the trends appear to be correlated to the summer Tair anomaly and the number of days with extreme Tair (Fig. 5), both of which are increasing in the Alps due to global warming. This observation is consistent with the results of several studies in the Alps indicating acceleration of RGs as a result of rising temperatures (Kääb et al., 2007; Marcer et al., 2021). We note, however, that recent deceleration has been observed at four RGs at similar elevations to that of the Canfinal RG – but situated immediately down-gradient of glaciers – in the Swiss National Park (Manchado et al., 2024). The year 2014 saw a colder summer, and it appears that this may have had a stabilizing effect in the following years. In fact, this phenomenon was also noted by Cusicanqui et al. (2021) for the Laurichard RG, which is underlain by highly fractured granite (Bodin et al., 2009). A strong acceleration after the European heatwave of 2003 was also observed for many other RGs in the Swiss Alps and western Austria (Krainer and He, 2006; Delaloye et al., 2010). These similarities suggest that active RGs in the same geographical area tend to be affected in the same way by summer temperature extremes. Although it has been shown that precipitation can cause short-term acceleration of RGs (Wirz et al., 2016), our results lack the temporal resolution to confirm this. There is no visible relationship between the average velocity changes and the winter indicators. One explanation could be that the long-term activity of the RG is mainly influenced by Tair and/or that the other parameters have no significant effect in comparison. It is also possible that the confirmation of stabilizing or accelerating effects of the various indicators (Fig. 5) requires data with a higher temporal resolution.
In addition, the data available at the Canfinal RG do not allow for establishing a clear relationship between multi-year kinematics and climatic or hydrological conditions, although links between hydrology and kinematics are evident. As suggested by Cicoira et al. (2019), recharge from precipitation and snowmelt is one of the main drivers for RG displacement. The investigation of these coupled processes offers interesting prospects for future research, especially as global warming increasingly influences precipitation patterns, including shifts in the balance between rain and snow in the Alps. Observations of increased displacement in areas where the morphology indicates ice-rich permafrost suggest that these zones could follow the same trajectory as the glacier's front under the effects of warming: a gradual reduction in ice content until becoming immobile.
5.2 Seasonal variations in spring end-members reveal freeze–thaw cycle and transport dynamics
A progressive enrichment in heavy stable isotopes is observed for all springs and streams sampled as the summer advances, while the hydraulic head of the fractured aquifer and the streamflow measured at the Val d'Ursé decrease during the same period. This indicates that the contribution of groundwater increases after the end of snowmelt and maintains the baseflow of the catchment. This enrichment can also be explained by a higher contribution by enriched meteoric water formed at higher temperatures than by winter snow, increased evaporation from open surfaces in summer, and/or the release of meltwater from permafrost that has undergone several freeze–thaw cycles and induces recharge at higher altitudes (Williams et al., 2006; Moran et al., 2007; Beria et al., 2018; Brighenti et al., 2021). The seasonal variations in EC measured at S1–S4, as well as in the outlet streamflow of the Val d'Ursé catchment, confirm that the water of the fractured aquifer is more mineralized during the winter low flows, while it is significantly diluted from snowmelt recharge, rainfall events, and permafrost thawing from spring to fall (Colombo et al., 2019). A clear contribution from the Canfinal RG cannot be directly detected in the signals from borehole KB4 or in the EC or streamflow variations measured at the outlet of the catchment and, thus, at the headwater catchment scale. This is in agreement with other RG studies that have determined the contribution to total discharge by active RGs to be ≲5 % (Krainer et al., 2015; Harrington et al., 2018; Bearzot et al., 2023).
The PCA performed on a single sampling campaign performed in October 2022 samples (Fig. S3) shows that the springs closest to the Canfinal RG have a distinct geochemical signature compared to the others. They are characterized by a higher concentration of K+ and Na2+ and the greater enrichment of heavy stable isotopes. The fact that rock weathering is thought to be the main driver for the presence of certain trace elements in RG runoff helps to explain the high concentration of K+ and Na2+ (Colombo et al., 2018). In fact, the rocks that make up the debris of the RG and the surrounding cliffs are orthogneiss (Sella granodiorite) with muscovite and feldspars, and a granite intrusion (Musella granite) rich in biotite and feldspars. The concentrations of NO are higher between the RG and the talus–meadow interface than in other springs in the Val d'Ursé catchment. Studies have highlighted this peculiarity in the discharge of RGs and block fields (Williams et al., 2007; Colombo et al., 2019). Some suggest that bacterial activity in RGs is the cause of this enrichment (Fegel et al., 2016; Tolotti et al., 2020). These extreme environments, with snow cover in winter; low light levels; and stable, cold soil temperatures around 0 °C, are carbon limited and can support nitrifying bacterial communities. According to Del Siro et al. (2023), this could also be the case for atmospheric pollutants released by melting ice. These results lead us to conclude that the presence of the Canfinal RG and the lithology of its constituent rocks influence the hydrochemistry of the springs fed by its discharge. The higher isotopic values of the discharge from the RG could be explained by easier infiltration of water from summer rainfall events into it (Krainer et al., 2007) or by an altitudinal gradient, as proposed by Moran et al. (2007).
5.3 RG diurnal dynamics are revealed through frequency–domain analysis
The EC measurements of springs S1 and S4 during the snow-free period show the existence of a daily cycle of dilution–enrichment. Dry periods are characterized by an increase in the EC of the discharge over several days, influenced each day by a dilution that starts in the afternoon. Although the discharge rate could not be measured, available studies indicate a maximum discharge rate in the afternoon, corresponding to the meltwater supply of the RG (Krainer and Mostler, 2002). We note that both low-EC (e.g., Haeberli, 1990) and high-EC (e.g., Nickus et al., 2023) ice has been observed in RGs. Furthermore, EC is not a conservative tracer, and contrasting mechanisms, often related to short-term weather events, of RG EC–discharge relationships exist (Colombo et al., 2018). As we filter out spikes in EC caused by rain events, our hypothesis is that our observed EC variations are related to diurnal melt cycles. Due to the absence of high-solubility rocks in the rooting zone of the Canfinal RG, we make our interpretations based on the hypothesis of lower-EC discharge. The majority of melt in the snow-free period is assumed to originate from the active layer, but we recognize that, in the late summer and fall, it is possible that significant melt from “older” permafrost may occur (Del Siro et al., 2023).
Under these assumptions, the diurnal RG discharge peak is expected to correspond to the S1 EC minimum due to its dilution effect. This occurs with a time lag difference (or phase shift) relative to the maximum Tair due to (a) the residence times of the flow path and (b) the heat transfer and melt dynamics in the RG. We observe a clear trend in the lag between the S1–S4 EC and Tair diurnal cycles during the snow-free period (Fig. 8). The shift from ∼0 h in July to h in November for S1 implies a lag between the maximum Tair and minimum EC of ∼12 h during the warmest period and of ∼7 h during the coldest snow-free period. In 2023, there is a clear trend in the S1 time lag difference relative to Tair (lower right, Fig. 8), decreasing from to h over the May–August period, implying a lag between the maximum air temperature and minimum EC of ∼13 h at the beginning of the snow-free period, which decreases to ∼7 h by mid-summer. After this, the time lag fluctuates with no clear trend.
There are likely to be several factors that cause these seasonal trends in lag time between diurnal Tair maxima and EC minima. Firstly, the active layer thickens over the snow-free period, implying increasingly shorter flow paths throughout the melt season. Furthermore, preferential flow paths, akin to moulins in glaciers, may also be formed internally by meltwater throughout this period, further reducing the residence time. This particular phenomenon, which we cannot confirm with our current data, would also have the potential to initiate and accelerate melt from permafrost which could have a higher EC than the active layer. Secondly, as temperatures decrease, there will be, proportionally, less melt from higher-elevation zones of the rock glacier, and, thus, the mean flow path length to the foot of the RG will decrease. Finally, during the warmest months, melt is expected to be continuous, while, in the late season, daily minimum temperatures are often <0 °C. We posit that these processes combine to contribute to a delay between maximum air temperature and minimum spring EC that decreases throughout the snow-free period. For S4, while the spring and summer trend in time lag is clear, there is the additional complexity of what is likely to be a significant influence from other sources. The proportion of deeper groundwater likely increases throughout the first half of the snow-free period, while the water originating from RG melt has a decreased effect. The S4 EC data, which show a decreasing diurnal amplitude over the snow-free period, support this hypothesis. As the Canfinal RG was previously undocumented and unexplored, there are unfortunately no data available on the RG internal structure and ice chemistry. Future electrical resistivity tomography (e.g., Mewes et al., 2017; Buckel et al., 2023) and core-drilling investigations could provide data to support our above-outlined reasoning.
5.4 Intermittent flow and dilution intensities in springs
In the southern European Alps, the summer and fall of 2022 were drier than average and followed a winter with exceptionally low snow accumulation (Choler, 2023), with another dry summer in 2023. Because of this, the contribution of deeper groundwater to the springs (Fig. 10) may have played a more important role than in average years. As discharged baseflow becomes more mineralized, the amplitude of dilution due to the diurnal freeze–thaw cycle of the RG ice may increase. At the end of winter, S1 reactivates as the snowpack melts, resulting in a large diurnal amplitude that is also visible in the spring discharge at the talus–meadow interface. This emphasizes the importance of both snowmelt and ice-melt cycles as the cause of important oscillations in water parameters (Krainer and Mostler, 2002; Berger et al., 2004; Krainer et al., 2007) and the fact that these cycles smooth out during the summer (Brighenti et al., 2021). Based on these results, groundwater from the shallow fractured aquifer is the main component of the Canfinal RG discharge (Fig. 10). Its discharge is strongly influenced in spring and until summer by snowmelt, which reactivates S1 with a daily dilution of greater amplitude and earlier occurrence in the afternoon. Intermittent drying of springs S1–S3 was observed multiple times, with springs S2 and S3 (in the talus slope) only flowing continuously at the beginning of the snow-free period. These observations, combined with the pore pressure data monitored at the KB4 borehole (Figs. 9 and S4), indicate that groundwater levels are only high enough to sustain spring discharge immediately after snowmelt before the water table drops. Flow in springs S2 and S3 later in the year is short-lived and mainly caused by precipitation events. In contrast, spring S1, as discussed, is directly influenced by RG thawing, which contributes to a groundwater table that remains at or near the surface for a longer period. Spring S4 is at the talus–meadow interface, where the topographic gradient lessens, and, as such, appears to have perennial flow assured by the deeper groundwater system, even when the water table is at its annual minimum. This water has a longer residence time, as indicated by its higher mineralization compared to the other three springs. During winter baseflow conditions, snow cover and large amounts of frozen ground prevent recharge of the fractured aquifer. As a result, the water table drops significantly, and all springs are dry, except for S4 (Fig. 10).
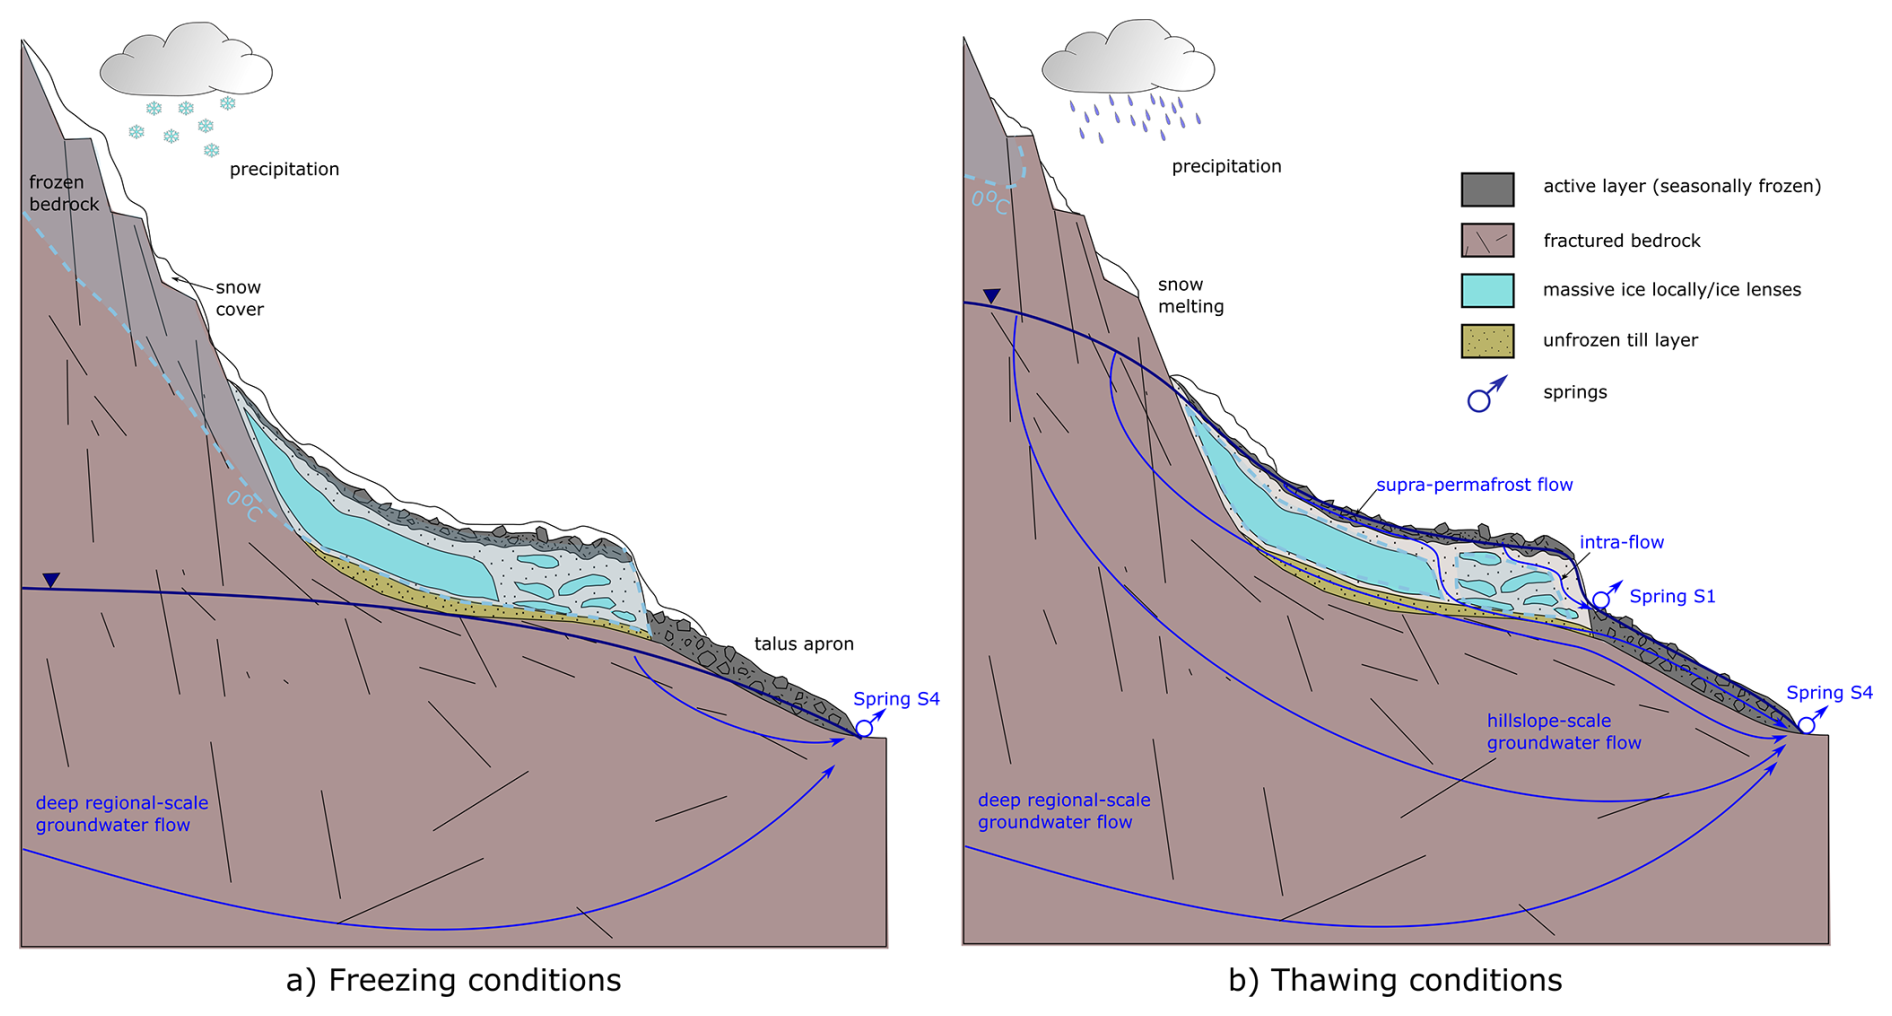
Figure 10Conceptual model of the interaction between permafrost and mobile groundwater at the Canfinal RG during (a) freezing conditions in winter and (b) thawing conditions in summer. Modified from Jones et al. (2019). The figure is not to scale.
5.5 Refining the conceptual model for RG–groundwater interactions
The ensemble of our analyses allows us to propose a refined conceptual model for the cryo-hydrogeological functioning of the Canfinal RG (Fig. 10). Freeze–thaw cycles influence spring runoff and solute transport on seasonal and daily timescales. During winter, the shallow subsurface remains dominantly frozen, preventing groundwater recharge and confining groundwater flow to deep flow paths with longer residence times and higher solute concentrations. As temperatures rise during the summer, the active layer of permafrost thaws, re-enabling shallow groundwater flow paths. Meltwater from ice-rich RGs and permafrost discharges to down-gradient aquifers, springs, and streams. Spring discharge rates and their composition in specific environmental tracers such as EC, ions, and water stable isotopes vary as a result of recharge and freeze–thaw cycles. Melting of low-EC ice from the RG results in the dilution of down-gradient springs with effective residence times progressively decreasing until the return of freezing conditions with a low water table.
Although RGs generally contain smaller quantities of water than glaciers (Wagner et al., 2021), their hydrological role is significant in many alpine catchments. Their rheological and hydrological state serves as an important climate change “barometer” for alpine environments where they are present. As climate change is expected to increasingly impact mountain headwater catchments (van Tiel et al., 2024; Evans et al., 2018; Somers et al., 2019; Arnoux et al., 2021; Halloran et al., 2023), it is urgent to improve our understanding of the feedback mechanisms between the cryosphere and hydrology, where the interface between permafrost and groundwater is critical. We confirmed that the Canfinal RG is active and that its creep rate appears to have accelerated in recent years alongside increasing temperature, as commonly observed in the Alps and other mountain regions worldwide. Without measurements of the internal structure of the RG, it is not possible to reliably estimate its remaining “lifespan”. Geochemical and isotopic analyses enabled the differentiation of water sources contributing to the connected springs. The frequency–domain analyses in which we isolate the non-stationary 1 cpd components of EC and temperature provided valuable insights into the connectivity of the RG and springs. We have determined that the delay between diurnal air temperature maxima and dilution minima decreases after the snowmelt recharge, implying a progressive decrease in RG–spring residence times, and we have proposed several mechanisms for this phenomenon. We recommend that this type of approach be applied to additional sites to tests its limits in determining the temporal dynamics of permafrost–groundwater interactions. Monitoring of the RG interior via direct measurements or geophysical techniques, as well as via numerical modeling, may provide us with a refined understanding of the internal hydrological processes in the Canfinal RG and other RGs. Our combination of remote sensing imagery, geochemical measurements, and hydrological monitoring has enabled a more comprehensive understanding of this vulnerable alpine cryo-hydrological system.
The data that support the findings of this study are available from the corresponding author, Clément Roques, upon reasonable request.
The supplement related to this article is available online at https://doi.org/10.5194/hess-29-1505-2025-supplement.
All the authors wrote the paper collaboratively. CL: fieldwork, laboratory analyses, data validation and analyses, figure creation, programming, and synthesis. LJSH and CR: supervision, field work, data analysis, programming, figure creation, synthesis, project management, and revisions. CR: data management and coordination activities at the Val d'Ursé Critical Zone Observatory.
The contact author has declared that none of the authors has any competing interests.
Publisher's note: Copernicus Publications remains neutral with regard to jurisdictional claims made in the text, published maps, institutional affiliations, or any other geographical representation in this paper. While Copernicus Publications makes every effort to include appropriate place names, the final responsibility lies with the authors.
We thank the handling editor, Geneviève Ali; two anonymous reviewers; and the community commenter, Giacomo Medici, for their feedback, which has improved the final paper. We would like to thank Luc Illien (GFZ Potsdam), Emilio Kenda, Noam Makkinga, and Eliot Barbier (Université de Neuchâtel) for their assistance in the field, as well as John Molson (Université de Laval) for the discussions about thermal-cryosphere processes. We are grateful to Clémence Berguerand and Isaline Perrenoud for performing the geochemical analysis at the CHYN laboratory. Clément Roques and Landon Halloran acknowledge funding by the Swiss Federal Office for Spatial Development ARE and the European Union through the interreg Alpine Space Programme (grant no. ASP0500341, Waterwise). Landon J. S. Halloran acknowledges funding from the Swiss National Science Foundation (SNSF grant no. 212622, “RADMOGG”).
This research has been supported by the Schweizerischer Nationalfonds zur Förderung der Wissenschaftlichen Forschung (grant no. 212622), the Swiss Federal Office for Spatial Development ARE, and the European Union through the interreg Alpine Space Programme (grant no. ASP0500341, Waterwise).
This paper was edited by Geneviève Ali and reviewed by two anonymous referees.
Acworth, R. I., Rau, G. C., Halloran, L. J. S., and Timms, W. A.: Vertical groundwater storage properties and changes in confinement determined using hydraulic head response to atmospheric tides, Water Resour. Res., 53, 2983–2997, https://doi.org/10.1002/2016WR020311, 2017. a
Amschwand, D., Ivy-Ochs, S., Frehner, M., Steinemann, O., Christl, M., and Vockenhuber, C.: Deciphering the evolution of the Bleis Marscha rock glacier (Val d'Err, eastern Switzerland) with cosmogenic nuclide exposure dating, aerial image correlation, and finite element modeling, The Cryosphere, 15, 2057–2081, https://doi.org/10.5194/tc-15-2057-2021, 2021. a
Amschwand, D., Scherler, M., Hoelzle, M., Krummenacher, B., Haberkorn, A., Kienholz, C., and Gubler, H.: Surface heat fluxes at coarse blocky Murtèl rock glacier (Engadine, eastern Swiss Alps), The Cryosphere, 18, 2103–2139, https://doi.org/10.5194/tc-18-2103-2024, 2024. a
Anderson, R. S., Anderson, L. S., Armstrong, W. H., Rossi, M. W., and Crump, S. E.: Glaciation of alpine valleys: The glacier – debris-covered glacier – rock glacier continuum, Geomorphology, 311, 127–142, https://doi.org/10.1016/j.geomorph.2018.03.015, 2018. a
Arnoux, M., Brunner, P., Schaefli, B., Mott, R., Cochand, F., and Hunkeler, D.: Low-flow behavior of alpine catchments with varying quaternary cover under current and future climatic conditions, J. Hydrol., 592, 125591, https://doi.org/10.1016/j.jhydrol.2020.125591, 2021. a
Baltsavias, E. P.: Multiphoto geometrically constrained matching, Doctoral Thesis, Swiss Federal Institute of Technology, Zurich, https://doi.org/10.3929/ethz-a-000617558, 1991. a
Bearzot, F., Colombo, N., Cremonese, E., di Cella, U. M., Drigo, E., Caschetto, M., Basiricò, S., Crosta, G., Frattini, P., Freppaz, M., Pogliotti, P., Salerno, F., Brunier, A., and Rossini, M.: Hydrological, thermal and chemical influence of an intact rock glacier discharge on mountain stream water, Sci. Total Environ., 876, 162777, https://doi.org/10.1016/j.scitotenv.2023.162777, 2023. a
Berger, J., Krainer, K., and Mostler, W.: Dynamics of an active rock glacier (Ötztal Alps, Austria), Quaternary Res., 62, 233–242, https://doi.org/10.1016/j.yqres.2004.07.002, 2004. a
Beria, H., Larsen, J. R., Ceperley, N. C., Michelon, A., Vennemann, T., and Schaefli, B.: Understanding snow hydrological processes through the lens of stable water isotopes, WIREs Water, 5, e1311, https://doi.org/10.1002/wat2.1311, 2018. a
Bickel, V. T., Manconi, A., and Amann, F.: Quantitative Assessment of Digital Image Correlation Methods to Detect and Monitor Surface Displacements of Large Slope Instabilities, Remote Sens., 10, 865, https://doi.org/10.3390/rs10060865, 2018. a
Bodin, X., Thibert, E., Fabre, D., Ribolini, A., Schoeneich, P., Francou, B., Reynaud, L., and Fort, M.: Two decades of responses (1986–2006) to climate by the Laurichard rock glacier, French Alps, 20, 331–344, https://doi.org/10.1002/ppp.665, 2009. a
Brighenti, S., Engel, M., Tolotti, M., Bruno, M. C., Wharton, G., Comiti, F., Tirler, W., Cerasino, L., and Bertoldi, W.: Contrasting physical and chemical conditions of two rock glacier springs, Hydrol. Process., 35, e14159, https://doi.org/10.1002/hyp.14159, 2021. a, b, c, d
Buchli, T., Kos, A., Limpach, P., Merz, K., Zhou, X., and Springman, S. M.: Kinematic investigations on the Furggwanghorn Rock Glacier, Switzerland, Permafrost Periglac. Process., 29, 3–20, https://doi.org/10.1002/ppp.1968, 2018. a
Buckel, J., Mudler, J., Gardeweg, R., Hauck, C., Hilbich, C., Frauenfelder, R., Kneisel, C., Buchelt, S., Blöthe, J. H., Hördt, A., and Bücker, M.: Identifying mountain permafrost degradation by repeating historical electrical resistivity tomography (ERT) measurements, The Cryosphere, 17, 2919–2940, https://doi.org/10.5194/tc-17-2919-2023, 2023. a
Burga, C. A.: Gletscher- und Vegetationsgeschichte der Südrätischen Alpen seit der Späteiszeit, vol. 101 of Denkschriften der Schweizerischen Naturforschenden Gesellschaft, Birkhäuser, Basel – Boston, ISBN 978-3-0348-9986-4 978-3-0348-9301-5, https://doi.org/10.1007/978-3-0348-9301-5, 1987. a
Cano-Paoli, K., Chiogna, G., and Bellin, A.: Convenient use of electrical conductivity measurements to investigate hydrological processes in Alpine headwaters, Sci. Total Environ., 685, 37–49, https://doi.org/10.1016/j.scitotenv.2019.05.166, 2019. a
Choler, P.: Above-treeline ecosystems facing drought: lessons from the 2022 European summer heat wave, Biogeosciences, 20, 4259–4272, https://doi.org/10.5194/bg-20-4259-2023, 2023. a
Cicoira, A., Beutel, J., Faillettaz, J., and Vieli, A.: Water controls the seasonal rhythm of rock glacier flow, 528, 115844, https://doi.org/10.1016/j.epsl.2019.115844, 2019. a
Cicoira, A., Marcer, M., Gärtner-Roer, I., Bodin, X., Arenson, L. U., and Vieli, A.: A general theory of rock glacier creep based on in-situ and remote sensing observations, Permafrost Periglac. Process., 32, 139–153, https://doi.org/10.1002/ppp.2090, 2021. a, b
Colombo, N., Salerno, F., Gruber, S., Freppaz, M., Williams, M., Fratianni, S., and Giardino, M.: Review: Impacts of permafrost degradation on inorganic chemistry of surface fresh water, Global Planet. Change, 162, 69–83, https://doi.org/10.1016/j.gloplacha.2017.11.017, 2018. a, b
Colombo, N., Salerno, F., Martin, M., Malandrino, M., Giardino, M., Serra, E., Godone, D., Said-Pullicino, D., Fratianni, S., Paro, L., Tartari, G., and Freppaz, M.: Influence of permafrost, rock and ice glaciers on chemistry of high-elevation ponds (NW Italian Alps), Sci. Total Environ., 685, 886–901, https://doi.org/10.1016/j.scitotenv.2019.06.233, 2019. a, b
Cusicanqui, D., Rabatel, A., Vincent, C., Bodin, X., Thibert, E., and Francou, B.: Interpretation of Volume and Flux Changes of the Laurichard Rock Glacier Between 1952 and 2019, French Alps, J. Geophys. Res.-Earth Surf., 126, e2021JF006161, https://doi.org/10.1029/2021JF006161, 2021. a
DallAmico, M., Endrizzi, S., Rigon, R., and Gruber, S.: The importance of snow cover evolution in rock glacier temperature modeling, 9th International Conference on Permafrost, 29 June–3 July 2008, Fairbanks, Alaska, 57–58, 2008. a
Del Siro, C., Scapozza, C., Perga, M.-E., and Lambiel, C.: Investigating the origin of solutes in rock glacier springs in the Swiss Alps: A conceptual model, Front. Earth Sci., 11, 1056305, https://doi.org/10.3389/feart.2023.1056305, 2023. a, b, c
Delaloye, R., Lambiel, C., and Gärtner-Roer, I.: Overview of rock glacier kinematics research in the Swiss Alps, Geogr. Helv., 65, 135–145, https://doi.org/10.5194/gh-65-135-2010, 2010. a
Duval, P., Ashby, M. F., and Anderman, I.: Rate-controlling processes in the creep of polycrystalline ice, J. Phys. Chem., 87, 4066–4074, https://doi.org/10.1021/j100244a014, 1983. a
Eberhardt, E., Evans, K., Zangerl, C., and Loew, S.: Consolidation Settlements above Deep Tunnels in Fractured Crystalline Rock: Numerical Analysis of Coupled Hydromechanical Mechanisms, in: Coupled Thermo-Hydro-Mechanical-Chemical Processes in Geo-Systems, edited by: Stephanson, O., vol. 2 of Elsevier Geo-Engineering Book Series, 759–764, Elsevier, https://doi.org/10.1016/S1571-9960(04)80130-7, 2004. a
Evans, S. G., Ge, S., Voss, C. I., and Molotch, N. P.: The Role of Frozen Soil in Groundwater Discharge Predictions for Warming Alpine Watersheds, Water Resour. Res., 54, 1599–1615, https://doi.org/10.1002/2017WR022098, 2018. a, b
Fegel, T. S., Baron, J. S., Fountain, A. G., Johnson, G. F., and Hall, E. K.: The differing biogeochemical and microbial signatures of glaciers and rock glaciers, J. Geophys. Res.-Biogeo., 121, 919–932, https://doi.org/10.1002/2015JG003236, 2016. a
FOEN Switzerland: Map of potential permafrost distribution, https://www.geocat.ch/geonetwork/srv/eng/catalog.search#/metadata/71d087ef-6531-4131-98ea-88ff655d8a63 (last access: January 2024), 2005. a
Frei, P., Kotlarski, S., Liniger, M. A., and Schär, C.: Future snowfall in the Alps: projections based on the EURO-CORDEX regional climate models, The Cryosphere, 12, 1–24, https://doi.org/10.5194/tc-12-1-2018, 2018. a
Groh, T. and Blöthe, J. H.: Rock Glacier Kinematics in the Kaunertal, Ötztal Alps, Austria, Geosciences, 9, 373, https://doi.org/10.3390/geosciences9090373, 2019. a
Haeberli, W., ed.: Pilot analyses of permafrost cores from the active rock glacier Murtel I, Piz Corvatsch, Eastern Swiss Alps, a workshop report, ETHZ, Versuchsanstalt für Wasserbau, Hydrologie und Glaziologie, 1990. a
Haeberli, W., Hallet, B., Arenson, L., Elconin, R., Humlum, O., Kääb, A., Kaufmann, V., Ladanyi, B., Matsuoka, N., Springman, S., and Mühll, D. V.: Permafrost creep and rock glacier dynamics, Permafrost Periglac. Process., 17, 189–214, https://doi.org/10.1002/ppp.561, 2006. a
Halloran, L. J., Millwater, J., Hunkeler, D., and Arnoux, M.: Climate change impacts on groundwater discharge-dependent streamflow in an alpine headwater catchment, Sci. Total Environ., 902, 166009, https://doi.org/10.1016/j.scitotenv.2023.166009, 2023. a, b
Hanus, S., Hrachowitz, M., Zekollari, H., Schoups, G., Vizcaino, M., and Kaitna, R.: Future changes in annual, seasonal and monthly runoff signatures in contrasting Alpine catchments in Austria, Hydrol. Earth Syst. Sci., 25, 3429–3453, https://doi.org/10.5194/hess-25-3429-2021, 2021. a
Harrington, J. S., Mozil, A., Hayashi, M., and Bentley, L. R.: Groundwater flow and storage processes in an inactive rock glacier, Hydrol. Process., 32, 3070–3088, https://doi.org/10.1002/hyp.13248, 2018. a, b, c, d
Harris, C., Arenson, L. U., Christiansen, H. H., Etzelmüller, B., Frauenfelder, R., Gruber, S., Haeberli, W., Hauck, C., Hölzle, M., Humlum, O., Isaksen, K., Kääb, A., Kern-Lütschg, M. A., Lehning, M., Matsuoka, N., Murton, J. B., Nötzli, J., Phillips, M., Ross, N., Seppälä, M., Springman, S. M., and Vonder Mühll, D.: Permafrost and climate in Europe: Monitoring and modelling thermal, geomorphological and geotechnical responses, Earth-Sci. Rev., 92, 117–171, https://doi.org/10.1016/j.earscirev.2008.12.002, 2009. a
Hencher, S. R., Lee, S. G., Carter, T. G., and Richards, L. R.: Sheeting joints: Characterisation, shear strength and engineering, Rock Mech. Rock Eng., 44, 1–22, https://doi.org/10.1007/s00603-010-0100-y, 2011. a
Hersbach, H., Bell, B., Berrisford, P., Biavati, G., Horányi, A., Muñoz Sabater, J., Nicolas, J., Peubey, C., Radu, R., Rozum, I., Schepers, D., Simmons, A., Soci, C., Dee, D., and Thépaut, J.-N.: ERA5 hourly data on single levels from 1940 to present, Copernicus Climate Change Service (C3S) Climate Data Store (CDS) [data set], https://doi.org/10.24381/cds.adbb2d47, 2023. a
Houben, T., Pujades, E., Kalbacher, T., Dietrich, P., and Attinger, S.: From Dynamic Groundwater Level Measurements to Regional Aquifer Parameters – Assessing the Power of Spectral Analysis, Water Resour. Res., 58, e2021WR031289, https://doi.org/10.1029/2021WR031289, 2022. a
Humlum, O.: Active layer thermal regime at three rock glaciers in Greenland, Permafrost Periglac. Process., 8, 383–408, https://doi.org/10.1002/(SICI)1099-1530(199710/12)8:4<383::AID-PPP265>3.0.CO;2-V, 1997. a
Ikeda, A., Matsuoka, N., and Kääb, A.: Fast deformation of perennially frozen debris in a warm rock glacier in the Swiss Alps: An effect of liquid water, J. Geophys. Res.-Earth Surf., 113, F01021, https://doi.org/10.1029/2007JF000859, 2008. a
Jones, D. B., Harrison, S., Anderson, K., and Whalley, W. B.: Rock glaciers and mountain hydrology: A review, Earth-Sci. Rev., 193, 66–90, https://doi.org/10.1016/j.earscirev.2019.04.001, 2019. a, b, c, d
Jones, D. B., Harrison, S., Anderson, K., and Betts, R. A.: Author Correction: Mountain rock glaciers contain globally significant water stores, Sci. Rep., 11, 20997, https://doi.org/10.1038/s41598-021-00027-w, 2021. a, b
Krainer, K. and He, X.: Flow velocities of active rock glaciers in the austrian alps, Geografiska Annaler: Ser. A, 88, 267–280, 2006. a
Krainer, K. and Mostler, W.: Hydrology of Active Rock Glaciers: Examples from the Austrian Alps, Arct. Antarct. Alp. Res., 34, 142–149, https://doi.org/10.1080/15230430.2002.12003478, 2002. a, b
Krainer, K., Mostler, W., and Spötl, C.: Discharge from active rock glaciers, Austrian Alps: A stable isotope approach, Austrian J. Earth Sc., 100, 102–112, 2007. a, b, c, d, e
Krainer, K., Bressan, D., Dietre, B., Haas, J. N., Hajdas, I., Lang, K., Mair, V., Nickus, U., Reidl, D., Thies, H., and Tonidandel, D.: A 10,300-year-old permafrost core from the active rock glacier Lazaun, southern Otztal Alps (South Tyrol, northern Italy), Quaternary Res., 83, 324–335, https://doi.org/10.1016/j.yqres.2014.12.005, 2015. a, b, c, d
Kääb, A., Frauenfelder, R., and Roer, I.: On the response of rockglacier creep to surface temperature increase, Global Planet. Change, 56, 172–187, https://doi.org/10.1016/j.gloplacha.2006.07.005, 2007. a, b, c, d, e
Laudon, H. and Slaymaker, O.: Hydrograph separation using stable isotopes, silica and electrical conductivity: an alpine example, J. Hydrol., 201, 82–101, https://doi.org/10.1016/S0022-1694(97)00030-9, 1997. a
Lindsay, E. R. P.: Reversible recharge-related groundwater fluctuation and ground surface deformation at Alp Canfinal, Switzerland, Master's thesis, Swiss Federal Institute of Technology Zurich, Department of Earth Sciences, Zurich, 2000. a, b, c, d
Longinelli, A. and Selmo, E.: Isotopic composition of precipitation in Italy: a first overall map, J. Hydrol., 270, 75–88, https://doi.org/10.1016/S0022-1694(02)00281-0, 2003. a, b, c
Longinelli, A., Anglesio, E., Flora, O., Iacumin, P., and Selmo, E.: Isotopic composition of precipitation in Northern Italy: Reverse effect of anomalous climatic events, J. Hydrol., 329, 471–476, https://doi.org/10.1016/j.jhydrol.2006.03.002, 2006. a, b, c
Manchado, A. M.-T., Allen, S., Cicoira, A., Wiesmann, S., Haller, R., and Stoffel, M.: 100 years of monitoring in the Swiss National Park reveals overall decreasing rock glacier velocities, Commun. Earth Environ., 5, 1–17, https://doi.org/10.1038/s43247-024-01302-0, 2024. a, b
Marcer, M., Cicoira, A., Cusicanqui, D., Bodin, X., Echelard, T., Obregon, R., and Schoeneich, P.: Rock glaciers throughout the French Alps accelerated and destabilised since 1990 as air temperatures increased, Commun. Earth Environ., 2, 1–11, https://doi.org/10.1038/s43247-021-00150-6, 2021. a, b, c, d, e
Mewes, B., Hilbich, C., Delaloye, R., and Hauck, C.: Resolution capacity of geophysical monitoring regarding permafrost degradation induced by hydrological processes, The Cryosphere, 11, 2957–2974, https://doi.org/10.5194/tc-11-2957-2017, 2017. a
Moran, T. A., Marshall, S. J., Evans, E. C., and Sinclair, K. E.: Altitudinal Gradients of Stable Isotopes in Lee-Slope Precipitation in the Canadian Rocky Mountains, Arct. Antarct. Alp. Res., 39, 455–467, https://doi.org/10.1657/1523-0430(06-022)[MORAN]2.0.CO;2, 2007. a, b
Munroe, J. S. and Handwerger, A. L.: Contribution of rock glacier discharge to late summer and fall streamflow in the Uinta Mountains, Utah, USA, Hydrol. Earth Syst. Sci., 27, 543–557, https://doi.org/10.5194/hess-27-543-2023, 2023. a
Nickus, U., Thies, H., Krainer, K., Lang, K., Mair, V., and Tonidandel, D.: A multi-millennial record of rock glacier ice chemistry (Lazaun, Italy), Front. Earth Sci., 11, 141379, https://doi.org/10.3389/feart.2023.1141379, 2023. a
Pauritsch, M., Wagner, T., Winkler, G., and Birk, S.: Investigating groundwater flow components in an Alpine relict rock glacier (Austria) using a numerical model, Springer Nature Link, 25, 371–383, https://doi.org/10.1007/s10040-016-1484-x, 2016. a
Pedregosa, F., Varoquaux, G., Gramfort, A., Michel, V., Thirion, B., Grisel, O., Blondel, M., Prettenhofer, P., Weiss, R., Dubourg, V., Vanderplas, J., Passos, A., Cournapeau, D., Brucher, M., Perrot, M., and Duchesnay, E.: Scikit-learn: Machine Learning in Python, J. Mach. Learn. Res., 12, 2825–2830, 2011. a
Pruessner, L., Phillips, M., Farinotti, D., Hoelzle, M., and Lehning, M.: Near-surface ventilation as a key for modeling the thermal regime of coarse blocky rock glaciers, Permafrost Periglac. Process., 29, 152–163, https://doi.org/10.1002/ppp.1978, 2018. a
Pruessner, L., Huss, M., Phillips, M., and Farinotti, D.: A Framework for Modeling Rock Glaciers and Permafrost at the Basin-Scale in High Alpine Catchments, J. Adv. Model. Earth Sy., 13, e2020MS002361, https://doi.org/10.1029/2020MS002361, 2021. a
Rau, G. C., Halloran, L. J. S., Cuthbert, M. O., Andersen, M. S., Acworth, R. I., and Tellam, J. H.: Characterising the dynamics of surface water-groundwater interactions in intermittent and ephemeral streams using streambed thermal signatures, Adv. Water Resour., 107, 354–369, https://doi.org/10.1016/j.advwatres.2017.07.005, 2017. a
Schaffer, N., MacDonell, S., Réveillet, M., Yáñez, E., and Valois, R.: Rock glaciers as a water resource in a changing climate in the semiarid Chilean Andes, Reg. Environ. Change, 19, 1263–1279, https://doi.org/10.1007/s10113-018-01459-3, 2019. a
Somers, L. D., McKenzie, J. M., Mark, B. G., Lagos, P., Ng, G. C., Wickert, A. D., Yarleque, C., Baraër, M., and Silva, Y.: Groundwater Buffers Decreasing Glacier Melt in an Andean Watershed – But Not Forever, Geophys. Res. Lett., 46, 13016–13026, https://doi.org/10.1029/2019GL084730, 2019. a, b
Tolotti, M., Cerasino, L., Donati, C., Pindo, M., Rogora, M., Seppi, R., and Albanese, D.: Alpine headwaters emerging from glaciers and rock glaciers host different bacterial communities: Ecological implications for the future, Sci. Total Environ., 717, 137101, https://doi.org/10.1016/j.scitotenv.2020.137101, 2020. a
van Tiel, M., Aubry-Wake, C., Somers, L., Andermann, C., Avanzi, F., Baraer, M., Chiogna, G., Daigre, C., Das, S., Drenkhan, F., Farinotti, D., Fyffe, C. L., de Graaf, I., Hanus, S., Immerzeel, W., Koch, F., McKenzie, J. M., Müller, T., Popp, A. L., Saidaliyeva, Z., Schaefli, B., Schilling, O. S., Teagai, K., Thornton, J. M., and Yapiyev, V.: Cryosphere–groundwater connectivity is a missing link in the mountain water cycle, Nature Water, 2, 624–637, https://doi.org/10.1038/s44221-024-00277-8, 2024. a, b
Wagner, T., Kainz, S., Krainer, K., and Winkler, G.: Storage-discharge characteristics of an active rock glacier catchment in the Innere Ölgrube, Austrian Alps, Hydrol. Process., 35, e14210, https://doi.org/10.1002/hyp.14210, 2021. a
Welch, L. A. and Allen, D. M.: Hydraulic conductivity characteristics in mountains and implications for conceptualizing bedrock groundwater flow, Hydrogeol. J., 22, 1003–1026, https://doi.org/10.1007/s10040-014-1121-5, 2014. a
Williams, M. W., Knauf, M., Caine, N., Liu, F., and Verplanck, P. L.: Geochemistry and source waters of rock glacier outflow, Colorado Front Range, Permafrost Periglac. Process., 17, 13–33, https://doi.org/10.1002/ppp.535, 2006. a
Williams, M. W., Knauf, M., Cory, R., Caine, N., and Liu, F.: Nitrate content and potential microbial signature of rock glacier outflow, Colorado Front Range, Earth Surf. Process. Landf., 32, 1032–1047, https://doi.org/10.1002/esp.1455, 2007. a
Wirz, V., Gruber, S., Purves, R. S., Beutel, J., Gärtner-Roer, I., Gubler, S., and Vieli, A.: Short-term velocity variations at three rock glaciers and their relationship with meteorological conditions, Earth Surf. Dynam., 4, 103–123, https://doi.org/10.5194/esurf-4-103-2016, 2016. a, b, c
Zhang, T.: Influence of the seasonal snow cover on the ground thermal regime: An overview, Rev. Geophys., 43, RG4002, https://doi.org/10.1029/2004RG000157, 2005. a