the Creative Commons Attribution 4.0 License.
the Creative Commons Attribution 4.0 License.
 | 17 Mar 2025
Meteorological ingredients of heavy precipitation and subsequent lake-filling episodes in the northwestern Sahara
Joëlle C. Rieder
Franziska Aemisegger
Elad Dente
The dry Sahara was potentially wetter in the past during the warm African Humid Period. Although debated, this climatic shift is a possible scenario in a future warmer climate. One major line of evidence reported for past green periods in the Sahara is the presence of paleo-lakes. Even today, Saharan desert lakes get filled from time to time. However, very little is known about these events due to the lack of available in situ observations. In addition, the hydrometeorological conditions associated with these events have never been systematically investigated. This study proposes filling this knowledge gap by examining the meteorology of lake-filling episodes (LFEs) of Sebkha el Melah – a commonly dry lake in the northwestern Sahara. Heavy-precipitation events (HPEs) and LFEs are identified using a combination of precipitation observations and lake volume estimates derived from satellite remote sensing. Weather reanalysis data are used together with three-dimensional trajectory calculations to investigate the moisture sources and characteristics of weather systems that lead to HPEs and to assess the conditions necessary for producing LFEs. Results show that hundreds of HPEs occurred between 2000 and 2021, but only six LFEs eventuated. The ratio between the increase in lake water volume during LFEs and the precipitation volume during HPEs that triggered the lake filling, known as the runoff coefficient, provides a very useful characteristic to assess storm impacts on water availability. For the six LFEs investigated in this study, the runoff coefficient ranges across 5 orders of magnitude, much lower than the ratios often cited in the literature for the Sahara. We find that LFEs are generated most frequently in autumn by the most intense HPEs, for which the key ingredients are (i) the formation of surface extratropical cyclones to the west of the North African Atlantic coast in interplay with upper-level troughs and lows, (ii) moisture convergence from the tropics and the extratropical North Atlantic, (iii) a pre-moistening of the region upstream of the catchment over the Sahara through a recycling-domino-process, (iv) coupled or sequential lifting processes (e.g. orographic lifting and large-scale forcing), and (v) the stationarity of synoptic systems that result in long-duration (typically 3 d) HPEs. Based on the insights gained into Saharan LFEs in the present-day climate, we suggest that the initial filling and persistence of Saharan lakes may be related to changes in the intensity, frequency, or synoptic pattern of HPEs rather than to a change in mean precipitation alone. Future studies can leverage these insights to better assess the mechanisms involved in the greening of the Sahara in the past and, potentially, in a warmer future.
- Article
(20073 KB) - Full-text XML
-
Supplement
(297 KB) - BibTeX
- EndNote


1.1 Saharan lakes in the past, present, and future
Inundated lakes in the Sahara are presently a rare, mostly undocumented, transient phenomenon. As a consequence of the lack of rainfall (Nicholson, 2011; Morin et al., 2020; Armon et al., 2024a), the extent of surface waterbodies and vegetation in the Sahara is limited, and the region is considered to be mostly uninhabitable. Yet, ample geological evidence indicates that, during a relatively warm period in the mid-Holocene called the African Humid Period (AHP), the Sahara used to be wetter and greener (e.g. Hoelzmann et al., 2000). Although debated, one major line of evidence for a wetter Sahara during this period, as well as of previous AHPs, is the reported presence of Saharan (mega-) lakes (e.g. COHMAPMembers, 1988; Hoelzmann et al., 2000; Lézine et al., 2011; Abafoni et al., 2014). Such lakes, or even smaller-scale wetlands rather than mega-lakes, as was recently suggested by Quade et al. (2018), point to increased precipitation during such AHPs. When Saharan lakes get filled, they can alter the regional atmospheric circulation and enhance precipitation, therefore locally triggering positive land surface feedbacks (e.g. Krinner et al., 2012; Chandan and Peltier, 2020; Specht et al., 2022). However, currently, the mechanisms involved in both the initial filling and persistence of Saharan lakes are de facto unclear.
The interest in the processes leading to lake-filling episodes (LFEs) is raised not only because of paleo-environmental proxies indicating wetter conditions but also due to current climate warming. While, in many regions, present-day anthropogenically induced climate change decreases surface water availability (e.g. Archer and Predick, 2008; Cissé et al., 2022), intriguingly, some desert regions may exhibit increased water availability with climate warming. For example, in the Indian deserts, boosted food production was recently linked to climate-change-induced modifications of the hydrological regime due to a rise in precipitation (Rajesh and Goswami, 2023). For the Sahara, climate model projections show a pronounced increase in precipitation throughout most of the desert (mean annual precipitation increase of 41.5 % with warming of 4°C under an SSP5-8.5 scenario, compared with the period 1850–1900) and a decrease in precipitation for the northwestern Sahara (∼ −10 % to −30 %; Iturbide et al., 2021; Gutiérrez et al., 2021). Very large uncertainties, 1 order of magnitude larger than the projected change, are associated with these precipitation projections, especially in the northwestern part of the Sahara. Thus, the future of surface water resources in the Sahara is unclear.
In deserts, precipitation matters not only as a key component of the freshwater mass balance but also as a potentially high-impact hazard. Despite the vast uninhabited areas, there are several large urban centres bordering the Sahara. Storm Daniel, which affected northern Libya in September 2023, is a recent example of how deadly and devastating heavy-precipitation events (HPEs) can be in a desert area (Armon et al., 2024b). This storm induced flash floods in ephemeral streams draining south into the Sahara (Copernicus, 2023) and led to the filling of Saharan lakes that have been empty since the start of Landsat observations (i.e. 1984; Pekel et al., 2016). While some studies previously addressed specific HPEs in the Sahara and their link with floods (e.g. Fink and Knippertz, 2003; Schepanski et al., 2012; Zurqani et al., 2022), to the best of our knowledge, only one study thoroughly analysed the climatology of HPEs in this region (Armon et al., 2024a), but it does not include the link to LFEs. The study of recent LFEs in the Sahara is fairly limited and outdated and is mainly based on observations collected by Dubief (1953) until the 1950s.
To better understand the processes involved in such potentially devastating rainstorms; their capacity to fill Saharan lakes under past, present, and future climates; and to clarify the impact of projected precipitation changes on water availability, we need a better quantitative understanding of the relationship between the atmospheric processes triggering rainfall in the Sahara and the desert hydrology leading to lake filling in the present-day climate.
1.2 Atmospheric circulation controls on precipitation in the Sahara and its link with paleo-lakes
Studies focusing on precipitation in the Sahara are scarce, particularly with respect to heavy precipitation (Armon et al., 2024a). A few studies have investigated regional-scale precipitation events in the Sahara to identify the synoptic systems which can lead to Saharan precipitation, but they focused mainly on the periphery of the desert (e.g. Nicholson, 1981; Knippertz et al., 2003; Roca et al., 2005; Rubin et al., 2007).
Nevertheless, the processes leading to the dryness of the Sahara are generally well known: a year-round subsidence over the Sahara prevents strong and deep convection (e.g. Rodwell and Hoskins, 1996; Roca et al., 2005; Nicholson, 2011). During winter, the subsidence is established by the down-branches of the Hadley and Ferrel cells, which induce the subtropical high-pressure systems (e.g. Nicholson, 2011). An anticyclonic flow is established over the Sahara at the surface, creating dry northeasterly trades – the Harmattan (e.g. Santos-Soares, 2015; Dahinden et al., 2021). During summer, the heating of the surface induces a low-level heat low (Fig. 1a; Chen, 2005; Nicholson, 2011). Nevertheless, even in summer, several factors reinforce the weak subsidence from the Hadley cell and suppress the ascent of air needed for precipitation formation: (i) the compensating downward motion from the Asian Monsoon, (ii) the ageostrophic descending force at the right exit of the African Easterly Jet, and (iii) the surface cooling along the western coast of the Sahara through cold coastal upwelling of the Canary Current and maritime stratus cooling (Rodwell and Hoskins, 1996, 2001; Webster and Fasullo, 2003; Chen, 2005; Miyasaka and Nakamura, 2005). However, given the strong subsidence aloft in all seasons, how can precipitation still occur in the Sahara?
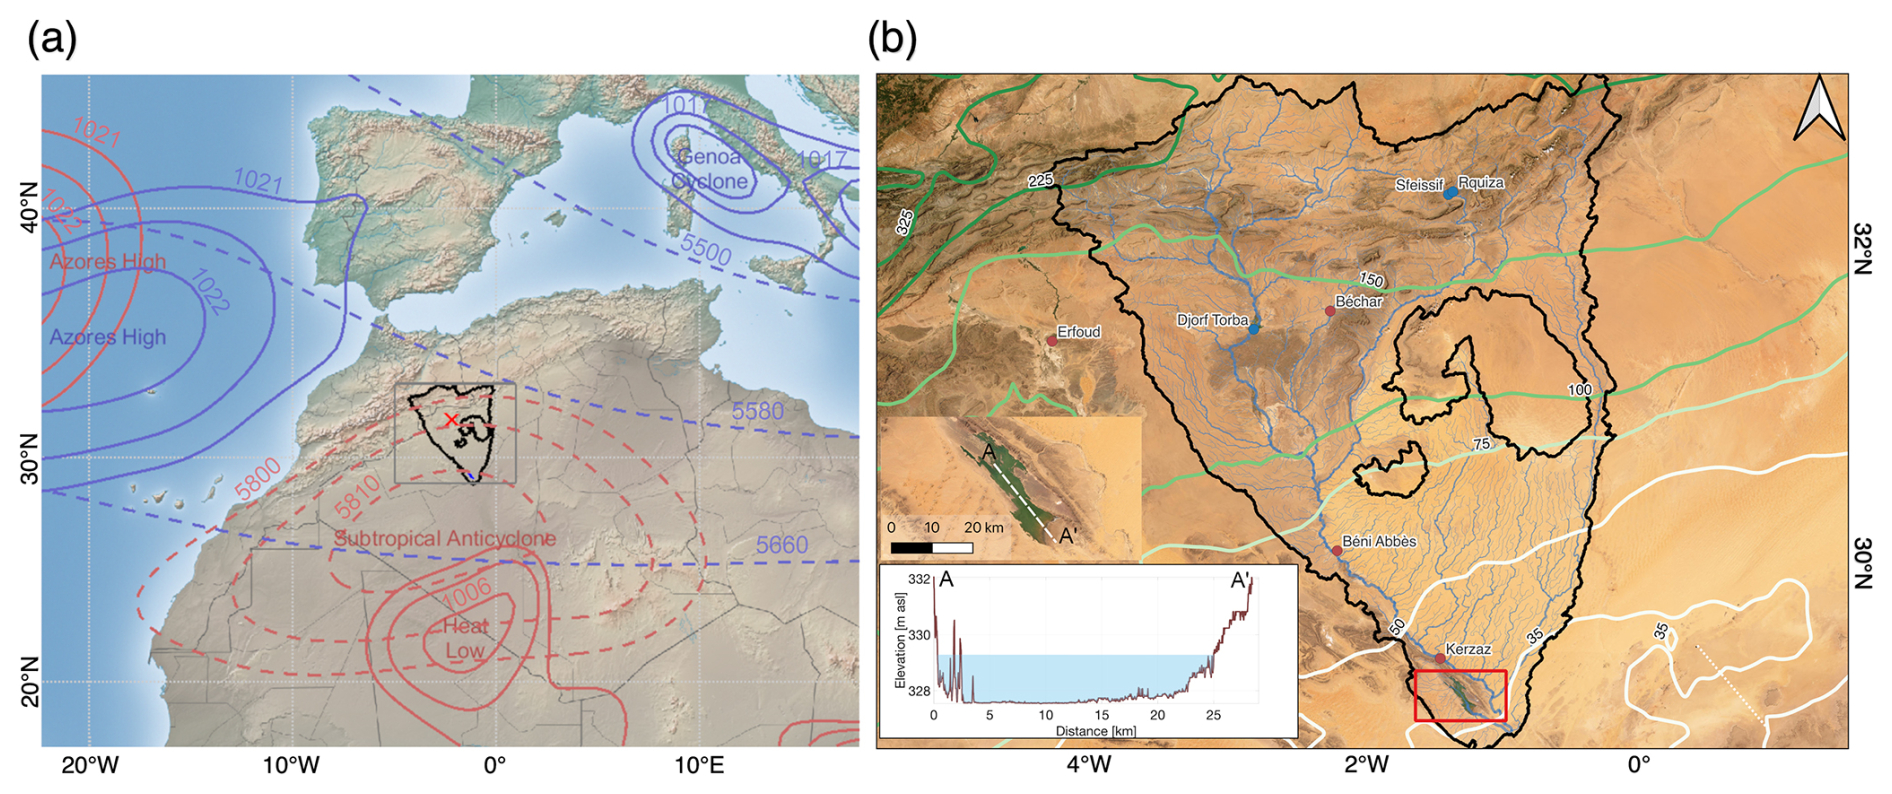
Figure 1Major synoptic-scale systems over the northwestern Sahara (a) and the properties of the study region around the Sebkha el Melah catchment (Lehner et al., 2008) (b). In (a), climatology (June 2000–May 2021) of mean winter (blue lines) and summer (red lines) prominent synoptic systems with selected contours of sea level pressure (solid lines; hPa) and mid-troposphere geopotential height (500 hPa, dashed lines; m) are shown on top of the region's topography (from Natural Earth). The Sebkha el Melah catchment is outlined in black. In (b), satellite imagery of the catchment and the lake (upper inset) from ESRI world imagery (Earthstar Geographics | Esri, © TomTom, Garmin, FAO, NOAA, USGS; OpenStreetMap contributors 2016. Distributed under the Open Data Commons Open Database License (ODbL) v1.0.) is shown together with the river network (blue lines; Lehner and Grill, 2013) and IMERG precipitation climatology (June 2000–May 2021, green-white-shaded isohyets; mm yr−1). A cross-section of the lake's topography (Armon et al., 2020), across the dashed white line, is shown in the lower inset. Blue shading represents the estimated lake level when the satellite image was acquired.
As the Sahara marks the subtropical transition region between extratropical and tropical weather systems, the northern Sahara receives most precipitation during winter from extratropical cyclones or fronts connected to upper-level troughs, dominantly reaching the northern regions of the Sahara, through the equatorward shift of the westerly jet stream (e.g. Nicholson, 1981; Harada et al., 2003; Armon et al., 2024a). In the southern Sahara, most precipitation falls during summer due to tropical depressions, cloud clusters, or squall lines, originating from African easterly waves and potentially developing into mesoscale convective systems (e.g. Nicholson, 1981, 2011) as the intertropical convergence zone (ITCZ) moves northward (e.g. Nicholson, 1981; Harada et al., 2003). During transition seasons, the interaction of the extratropical upper-level forcing and tropical systems creates precipitation over the Sahara, mainly at the eastern and western boundaries of the desert (e.g. Flohn, 1975; Nicholson, 1981, 2000; Knippertz et al., 2003; Warner, 2004; de Vries, 2021). A prominent feature associated with this rainfall is tropical plumes, i.e. elongated cloud bands stretching from southeast to northwest, or features similar to these tropical moisture excursions (Mcguirk et al., 1987; Knippertz, 2003; Rubin et al., 2007; Nicholson, 2011).
While different systems potentially cause Saharan precipitation, it is unclear whether similar systems are the cause of wetter periods in the past. Various mechanisms have been associated with increased frequency and intensity of precipitation and the filling of lakes in the geological past. The simplest, most discussed one is the invigoration and poleward migration of the African Monsoon in response to increased summer insolation during the early Holocene, contributing to increased rainfall throughout the Sahara (e.g. COHMAPMembers, 1988; Lézine et al., 2011). In addition to changes in heating and insolation, increased tropical-plume activity was suggested to be associated with larger rainfall input throughout the Sahara during past glacial periods (e.g. Yokochi et al., 2019) based on the isotopic analysis of fossil groundwater (Sonntag et al., 1978; Abouelmagd et al., 2012) or toward the end of the AHP in the northwestern Sahara (Skinner and Poulsen, 2016). However, even collectively, these mechanisms cannot explain the reported amounts of precipitation needed to maintain proposed Saharan lakes (e.g. Claussen and Gayler, 1997; Quade et al., 2018).
Despite these studies relating atmospheric conditions with lake filling in the geological past, no study relates present-day lake filling in the Sahara with atmospheric circulation features. Therefore, this study investigates the conditions associated with the filling of Sebkha el Melah (Fig. 1) – a normally dry lake in the northwestern Sahara, filled, on average, only every few years (Mabbutt, 1977; Armon et al., 2020). We combine present-day precipitation and lake-filling remote sensing observations from satellites with meteorological reanalysis data and trajectory-based atmospheric transport diagnostics to explore questions relevant to the hydrometeorology of desert lakes. What are the necessary meteorological ingredients to produce LFEs in the northwestern Sahara? What triggers the ascent of air, what are the origins of the precipitated moisture, and how do these properties differ between HPEs that trigger LFEs and “normal” HPEs? What portion of rainfall is converted into runoff and effectively contributes to lake filling? In other words, what is the ratio between catchment precipitation and lake-filling volume, known as the runoff coefficient (e.g. Merz et al., 2006)? What is the role of below-cloud precipitation evaporation in producing HPEs in the Sahara?
After presenting the study area (Sect. 2) and the methods applied (Sect. 3), we first identify HPEs and LFEs over the catchment area of the lake (Sect. 4.1). Then, we investigate the atmospheric conditions prevailing during an exemplary case of an especially large LFE (Sect. 4.2) and finally take on a climatological perspective, highlighting the differences in meteorological conditions associated with LFEs and more common HPEs (Sect. 4.3). In the end, we discuss the ingredients leading to HPEs (Sect. 5.1), the unique characteristics of LFEs (Sect. 5.2), and the relevance of runoff coefficient values to understanding paleo- and future-climate impacts on surface water availability in the Sahara (Sect. 5.3).
Sebkha el Melah (29.17° N, 1.23° W), sometimes spelled Sabkhat El-Mellah, is located in central-western Algeria (Fig. 1). Its catchment area (∼ 98 000 km2) lies on the southeastern flank of the High and Saharan Atlas Mountains, with headwaters at ∼ 2000 m elevation and a lowest point (lake floor) at ∼ 300 m. Mean annual precipitation exhibits a strong gradient, ranging from > 200 mm in the north to roughly 30 mm in the south (Fig. 1b). The normally dry lake is fed mainly by Wadi (or Oued) Saoura, a mostly ephemeral stream entering the lake from the southeast (river head in the west). From the confluence of the main tributaries of Wadi Saoura, the Guir and Zousfana streams, Wadi Saoura follows the southeastern edge of the Grand Erg Occidental sand sea. Flowing at the verge of the erg, transmission losses are so high that, during minor to moderate flows, water cannot reach as far south as Sebkha el Melah; only major floods (once every few years) are able to reach the lake (Mabbutt, 1977). When the lake reaches full capacity at ∼ 5 m depth and ∼ 0.9 km3 (Fig. 1b and Fig. A2 in the Appendix), which only happens in extremely rare floods, water backflows along the same channel through the Messaoud stream south into the Sahara. Otherwise, the primary source of water loss from the lake is evaporation (Mabbutt, 1977; Armon et al., 2020). While the eastern part of the catchment is covered mainly with highly permeable sands, the northern and western regions are characterised by abundant bedrock outcrops and hamadas (Merzougui et al., 2007), which can contribute much more runoff (e.g. Yair and Kossovsky, 2002; Wheater, 2007). Furthermore, whereas some of the upper parts of both the Guir and the Zousfana streams are dammed – Djorf Torba Dam in the upper Guir, built in the 1960s (Sarra et al., 2023), and the Sfeissif and Rquiza dams in the upper Zousfana, built in the 2010s (FAO, 2016) – floods in Wadi Saoura still persist and are able to fill Sebkha el Melah (Armon et al., 2020). Given that minor floods dissipate before reaching the lake, Sebkha el Melah is a highly valuable proxy for heavy precipitation leading to major floods at the Sahara's headwaters.
HPEs and LFEs were analysed using three complementary approaches: we (i) identified HPEs using satellite remote sensing precipitation data, (ii) investigated the meteorological factors leading to HPEs using reanalysis data, and (iii) subsampled LFE-generating HPEs using a lake-filling remote sensing technique. The different datasets were combined to obtain the best possible description of the strongest HPEs and LFEs and to alleviate the impact of potential errors resulting from using any one of the approaches exclusively.
3.1 Data
3.1.1 IMERG remote sensing precipitation
To estimate precipitation amounts, we used the sixth version of the Integrated Multi-satellitE Retrievals for Global Precipitation Measurement (IMERG V06) (Huffman et al., 2020). IMERG data (June 2000–May 2021) are half-hourly global rainfall and snowfall estimations with a grid resolution of 0.1° × 0.1°, combining satellite precipitation estimations from multiple sources, including active and passive microwave retrievals and infrared imagery, calibrated with ground-based rain gauges (e.g. Hou et al., 2014; Huffman et al., 2020). These data are currently the best high-resolution option, representing spatiotemporal rainfall characteristics in the region, as well as in other desert regions (Zambrano-Bigiarini et al., 2017; Islam et al., 2020; Mahmoud et al., 2021; Zhou et al., 2021; Rachdane et al., 2022; Armon et al., 2024a). Still, precipitation estimations from satellites show potential limitations in the desert as a result of, for example, evaporation of precipitation (Dinku et al., 2011), under-detection because of small-scale short-duration precipitation (Li et al., 2021), or miscalibration during numerous inter-calibration steps with different spatiotemporal resolutions (Huffman et al., 2020).
3.1.2 ERA5 reanalysis data
The fifth generation of the European Centre for Medium-range Weather Forecasts (ECMWF) Reanalysis dataset (ERA5) was used for the meteorological analysis of the HPEs identified with IMERG data. The reanalysis provides hourly outputs, with a horizontal resolution of ∼ 31 km (here available at the resolution of a 0.5° interpolated grid) and with 137 vertical levels, extending from the surface to 1 hPa (Hersbach et al., 2020). We used a set of common meteorological parameters, which enabled us to inspect the meteorological conditions prevailing during HPEs, including potential vorticity (PV). PV is a commonly used variable which indicates the stability and vorticity (rotational fluid motion) of the atmosphere. It is mostly used to describe the jet stream waviness and upper-level influence on cyclogenesis, as well as the destabilisation of the lower levels (e.g. Hoskins et al., 1985; Portmann et al., 2021). It is important to note that, while the resolution of ERA5 is very high compared to other reanalyses, it is still insufficient to explicitly represent convection. Therefore, convective precipitation in the dataset is parameterised, which may lead to errors in precipitation estimations.
3.1.3 Lake observations
To identify the existence and area of water in the lake, we used satellite imagery from both Landsat satellite series (Neigh et al., 2022) at 30 m per pixel and the Moderate Resolution Imaging Spectroradiometer (MODIS; Wolfe, 2023) satellites at 250 m per pixel. Since 1984, Landsat satellites have provided the longest continuous imagery of Earth in various wavelength bands. Previous studies showed that surface water could be systematically detected and mapped using Landsat imagery (e.g. Pekel et al., 2016; Pickens and Sherani, 2020). The revisit time of Landsat satellites in the study area is approximately 16 d. During cloudy periods, which are not frequent in arid areas, consecutive clear images of the lake may be available once a month or even a bit less frequently. To inspect potential LFEs when Landsat imagery was not available, MODIS imagery (available twice per day during daylight since 1999) was used.
3.2 Methods
3.2.1 Identification of heavy-precipitation events
HPEs were identified using the local (pixel-based) climatology of IMERG (Fig. 2a) following Armon et al. (2024a). HPEs (Fig. 2d) were defined based on three criteria:
- a.
Precipitation must locally exceed a climatology-based threshold. To distinguish between normal and high precipitation intensities, we determined the threshold to be the pixel-specific 90 % quantile of daily IMERG precipitation (Fig. 2a), conditioned on rainfall occurrence (P90 | P > 1 mm d−1). By comparing the daily data to the threshold map, the threshold-exceeding grid cells were defined as heavy precipitation for a specific day (Fig. 2b–c).
- b.
Precipitation must occur over a substantial contiguous area. Heavy precipitation has to occur over a spatially continuous “event scale”, defined here as ≥ 1000 km2 – a typical local storm size (e.g. Lohmann et al., 2016; Zoccatelli et al., 2019).
- c.
The identified precipitation area is spatially and temporally close to connected (using buffer zones). We considered a spatial one-pixel buffer zone surrounding the identified area. If the buffer zones of neighbouring areas were connected (i.e. if these areas are distanced one to two pixels apart), the areas were considered to be one. Similarly, a two-pixel buffer zone was considered as a temporal buffer zone, connecting precipitation areas of two consecutive daily time steps. It is important to note that, using this approach, if events are small and isolated enough, more than one event can be identified for a given day.
Criteria (b) and (c) were considered to minimise misinterpretations of events due to the occurrence of “noise” in the dataset and heterogeneity in the precipitation threshold.
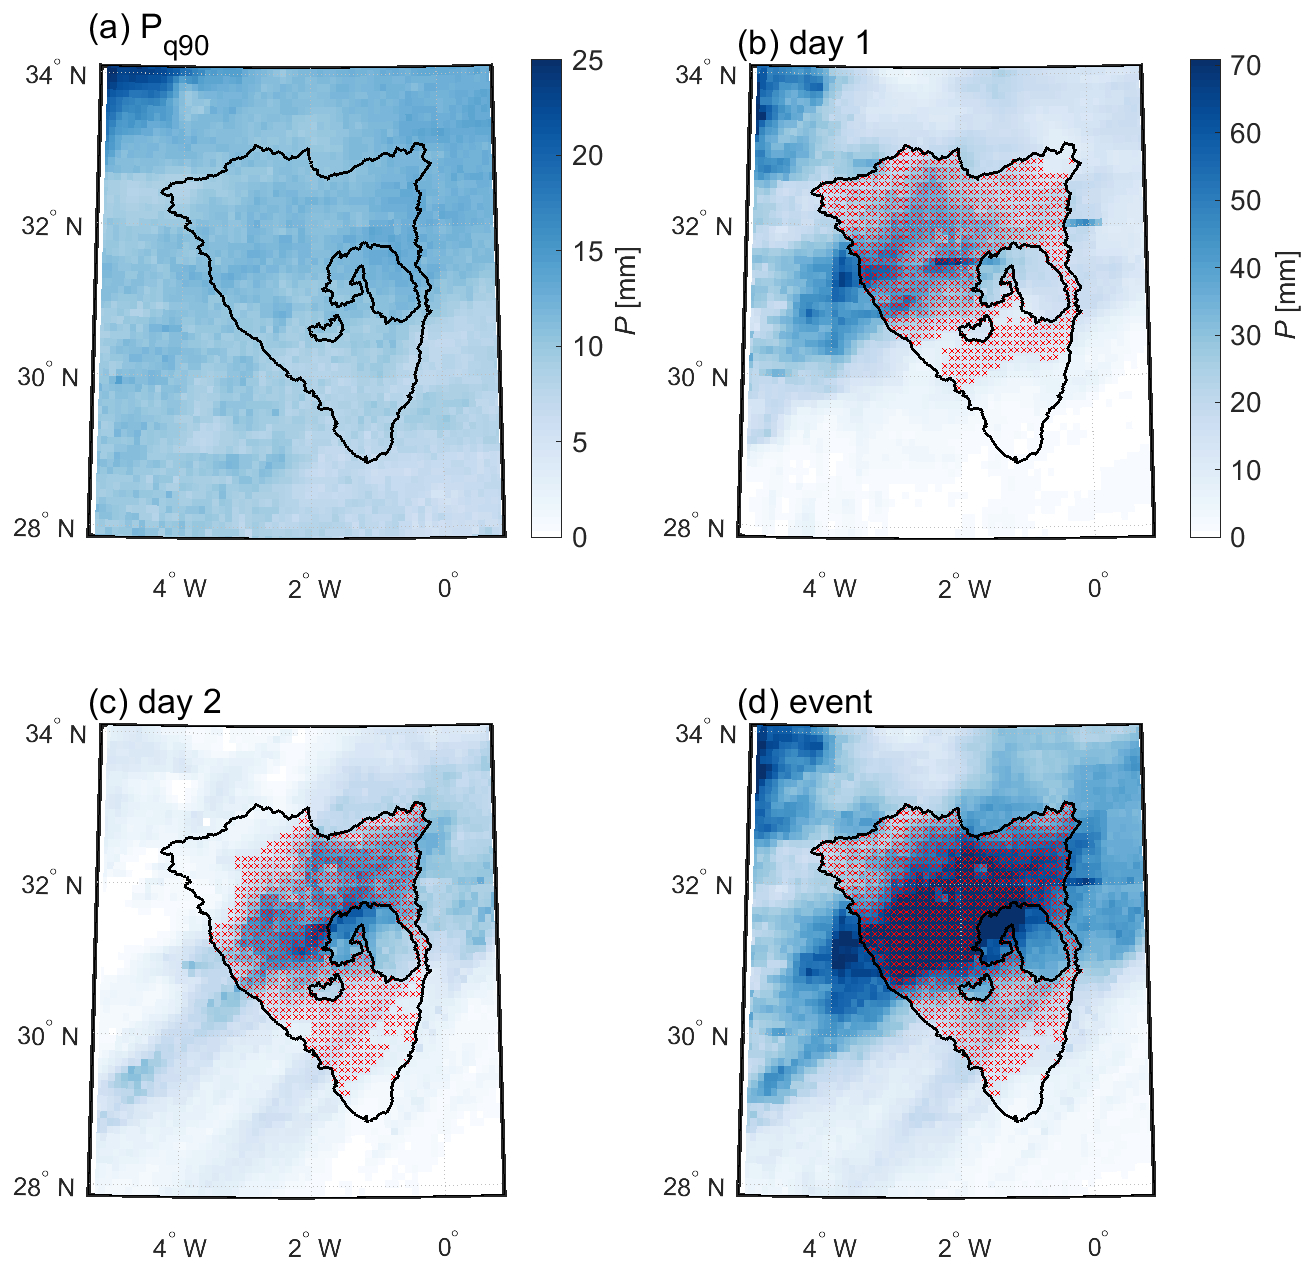
Figure 2Heavy-precipitation-event identification example for 2 (28–29 November 2014) out of 4 d (27–30 November 2024) identified as an HPE. (a) The pixel-specific 90th quantile of daily precipitation intensity (P90 | P > 1 mm d−1). Panels (b) and (c) show daily precipitation (shades of blue) for day one and two of this HPE, respectively, and the threshold exceeding grid cells (red). (d) Event accumulated precipitation and threshold-exceeding event grid cells. Note that the colour bar has a different amplitude for panel (a) than for panels (b)–(d).
Rainfall properties during HPE days in the two precipitation datasets, IMERG and ERA5, were compared by integrating precipitation over the entire catchment. Additionally, the HPE magnitude, determined here as the volume of IMERG-based precipitation over the area identified as an HPE, was extracted for every HPE. HPEs were categorised into three different categories based on their impact on lake storage and their magnitude: (i) LFE-generating HPEs; (ii) strong HPEs, namely those that compose the top 20 % of all identified HPEs by their magnitude; and (iii) medium HPEs, i.e. all other HPEs.
3.2.2 Lake-filling identification and quantification of lake storage changes
A list of LFEs was compiled by identifying time periods in which the lake area increased abruptly, followed by a slow decrease, using a three-step process:
-
Landsat-based detection of lake water area. The full Landsat 5, 7, and 8 surface reflectance cloud-masked imagery was used to detect the existence and extent of water by applying the Modified Normalized Difference Water Index (MNDWI, based on the green and shortwave infrared bands; Xu, 2006; Pekel et al., 2016) for the time period 2000–2021 over Sebkha el Melah. Obtaining an accurate MNDWI threshold for water classification depends on local environmental conditions (e.g. land cover) and the specific Landsat sensor (Pekel et al., 2016). To find a consistent MNDWI threshold over time and across satellite sensors, we performed a sensitivity analysis based on the studied LFEs (Fig. 3a–b). For every LFE maximum-area documentation date, the water area was calculated using various MNDWI thresholds. Then, the desired robust MNDWI threshold was chosen within the low-slope parts of all the plots, i.e. where a change in the threshold has the smallest impact on the resulting water areas across the LFEs. Based on this analysis and a manual inspection of the detected water extent, a threshold of 0.4 was chosen to classify water within Sebkha el Melah. (Fig. 3a–b).
-
LFE validation. The resulting MNDWI-based lake area time series (Fig. 3c) was used to manually identify LFEs. Because some imagery underestimates the lake area due to cloud cover, partial tile coverage of the lake, void stripes in Landsat 7 data (reducing the area by up to 20 %; Table A1), or other artefacts (Fig. A1), a running maximum was applied to the lake area time series, and LFEs were extracted from it. For the maximum lake area within an LFE, we manually chose the closest imagery that captured the full extent of the water. For every LFE, we visually inspected the true-colour composite of the Landsat imagery that documented it. The “observation gap” between LFEs and Landsat-based lake area imagery could be a few weeks. Therefore, evaporation from the lake's surface during the gap period could impact the detection of the maximum wetted area and the derived water volume. Here, we considered typical evaporation rates for this area of 20 cm month−1 (Rognon, 2001; Saggaï and Bachi, 2018). These evaporative losses are expected to affect volume estimates, particularly for small LFEs. To make sure we do not miss any small LFEs because of evaporation, we used MODIS's corrected reflectance composite (bands 7–2–1) to visually review the 10 largest HPEs in the study period.
-
Lake water volume and effective runoff coefficients. To quantify the storage volume corresponding to the lake area detected in steps 1 and 2, we used the hypsometric curve of the lake (Fig. A2) based on the bathymetry model derived by Armon et al. (2020). This bathymetry was derived through a combination of high-horizontal-resolution Landsat imagery with high vertical-resolution Ice, Cloud and land Elevation Satellite-2 (ICESat-2) laser altimetry. To compute the effective runoff coefficients for every LFE, i.e. the coefficients based on the volume of water that eventually filled the lake, we divided the lake storage change between the pre- and post-event conditions by the IMERG-based precipitation volume. A delayed lake stage observation after an HPE artificially changes the effective runoff coefficient. Therefore, we take into account two end-member scenarios: (a) runoff is solely contributed to the lake by precipitation during the specific HPE, and (b) runoff is contributed by precipitation during the HPE, as well as by precipitation in the following weeks until the lake is observed. For scenario (b), we additionally estimated potential evaporation losses during this time period. Considering additional rainfall volumes lowers the runoff coefficient, while accounting for evaporation raises it. Based on MODIS observations, we know that Sebkha el Melah reaches maximum filling values a few days after HPEs. Therefore, the actual runoff coefficients lie somewhere between these two end-member scenarios.
A limitation of our event-based runoff coefficient estimates is the anthropogenically altered hydrology of the catchment, mainly by the construction of dams (Sect. 2). Because the operation schemes of the dams are not publicly available, their specific impact on the result was not calculated. However, the effective runoff coefficient is generally expected to be lower after the dam construction compared to events before the construction. Other potential sources for volume and area errors are presented in Table A1 in the Appendix.
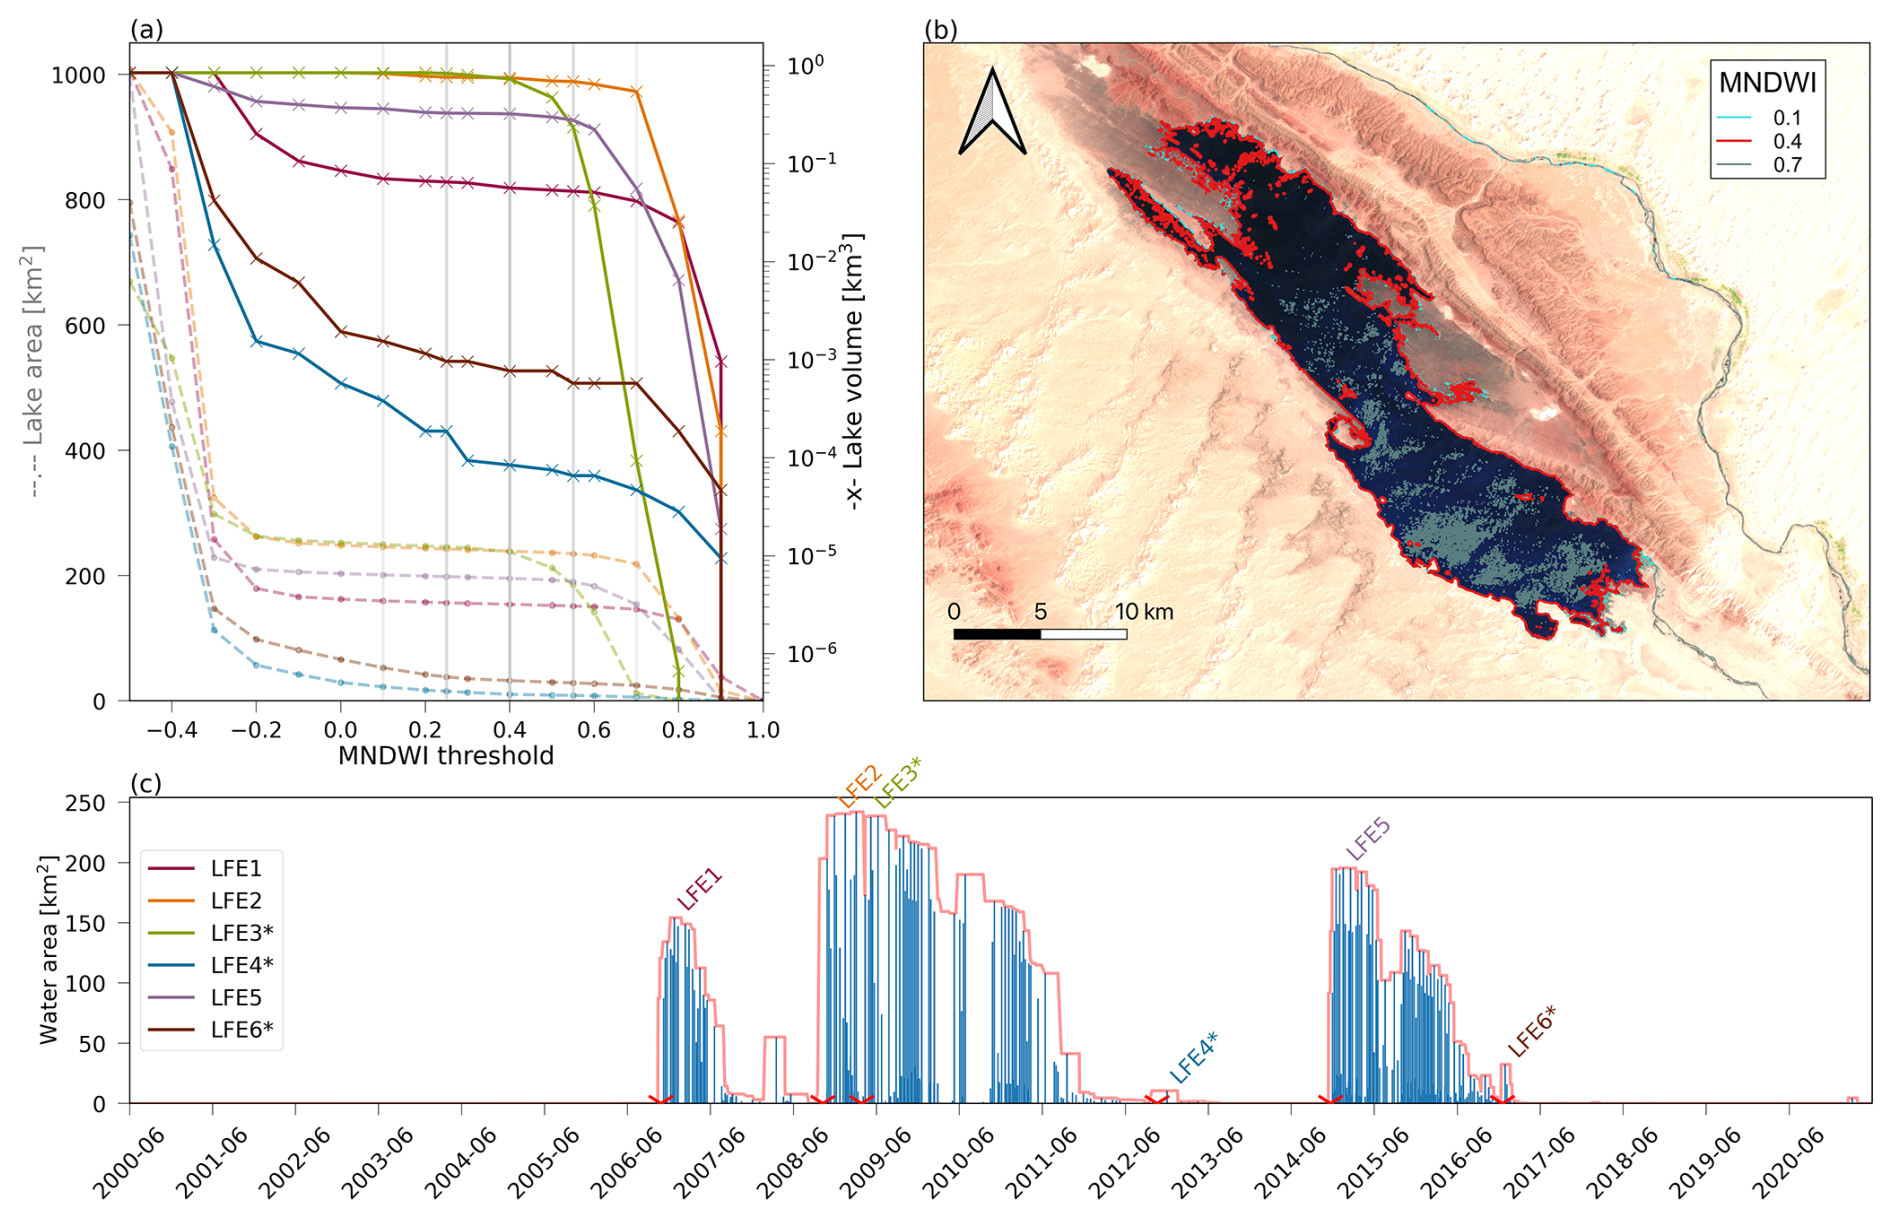
Figure 3Lake-filling identification and quantification of the lake's storage. (a) The sensitivity of lake area (dashed lines; left axis) and volume (solid lines; right axis) to the MNDWI threshold over different LFE maximum filling dates. MNDWI thresholds of 0.1, 0.25, 0.4, 0.55, and 0.7 are marked (grey lines). The sensitivity of the area and, to a lesser extent, the volume to changes in the MNDWI threshold are low over a wide range of MNDWI values (∼ 0–0.4). (b) An example of different MNDWI threshold lake areas for LFE3 (7 May 2009). MNDWI thresholds of 0.1 (light blue), 0.4 (red), and 0.7 (dark blue) are marked. (c) Time series of the lake's area with a 0.4 MNDWI threshold for the study period (June 2000–May 2021) represented by Landsat observations (blue bars) and a smoothed (running 15-data-point maxima) series of lake area (red line). HPE dates corresponding to the identified LFEs are marked as red crosses. * LFEs where the lake was already partially inundated. Landsat-7 image in panel (b) is courtesy of the US Geological Survey.
3.2.3 Lake volume uncertainty analyses
The potential impacts of the observation gap and the evaporation rate on the derived volume were computed. Lake area changes due to evaporation during the observation gap may lead to noticeable deviation of the lake volume, associated with the LFE. Furthermore, additional rainstorms can occur between the filling of the lake and the next Landsat observation. Whereas high-magnitude HPEs are expected to lead to the filling of the lake, low-magnitude rainstorms are not expected to cause substantial surface runoff and flooding (e.g. Zoccatelli et al., 2019; Shmilovitz et al., 2020). These effects from additional rainfall and the estimated evaporation impacts are used to present possible uncertainties in the lake volume estimates for each of the LFEs.
Additionally, uncertainties in the volume estimations can arise from the MNDWI thresholds we chose (Fig. 3a). Therefore, we also present this potential volume uncertainty specifically for each LFE. These uncertainties are further discussed in the results (Sect. 4.1), in which the rainfall volume estimates from IMERG and the detected lake volumes are compared to derive runoff coefficient estimates.
3.2.4 Trajectory calculations
To characterise the moisture sources and the meteorological conditions leading to HPEs and LFEs, we calculated air parcel backward trajectories. Trajectory calculations from the Sebkha el Melah catchment were initiated every 6 h and were computed 10 d backward in time, driven by the 3D wind fields from the ERA5 dataset and using the Lagrangian analysis tool (LAGRANTO; Wernli and Davies, 1997; Sprenger and Wernli, 2015). Trajectories were initiated from 21 different locations within the catchment, each spaced 70 km apart. For each of these locations, starting points were selected every 35 hPa in the vertical within the layer where clouds typically form during HPEs (i.e. between 900 and 200 hPa). This configuration yields 420 trajectories per 6 h time step for every HPE. In addition, different meteorological variables, including specific humidity (q) and relative humidity (RH), were interpolated to the hourly trajectory positions.
To investigate the potential role of precipitation evaporation, as well as the injection of moisture into the air parcel within convective plumes, the atmospheric conditions above (up to 100 hPa) and below (down to the surface) the trajectories were extracted from ERA5. The thermodynamic variables of q, RH, boundary layer height, temperature, and hydrometeor concentration were interpolated to the geographical positions of the trajectories along the vertical profiles at an hourly resolution and were averaged across selected trajectories which formed the main moisture transport pathway in the lower troposphere.
3.2.5 Moisture source diagnostics
The moisture sources for precipitation during the identified HPEs were diagnosed with a well-established Lagrangian moisture source diagnostic (MSD; Sodemann et al., 2008). This diagnostic has been applied in many atmospheric water cycle studies. More specifically, Dahinden et al. (2023) investigated the tropical and subtropical water cycle and the dynamics of the Saharan heat low, and Aemisegger et al. (2021) and Villiger and Aemisegger (2024) studied the North Atlantic trade wind water cycle. This trajectory-based diagnostic identifies the evaporative source footprint of precipitating waters by establishing a mass balance of vapour phase humidity in the air parcels contributing to the precipitation event. Here, we use ERA5 data to track hourly changes in q (i.e. Δq) forward in time along each of the trajectories (Fig. 4a). If Δq is positive, the air parcel is considered to have taken up moisture through surface evaporation (event no. 1 in Fig. 4a) or below-cloud rain evaporation (event no. 3 in Fig. 4a). Negative Δq values are due to precipitation formation in clouds being underway (events no. 2 and no. 4 in Fig. 4a). In this case, all previous uptakes are discounted proportionally to their contribution to the humidity lost in the precipitation event. A Δq threshold of 0.001 g kg−1 is used to avoid spurious uptakes or losses and to neglect numerical noise in Δq along the trajectories.
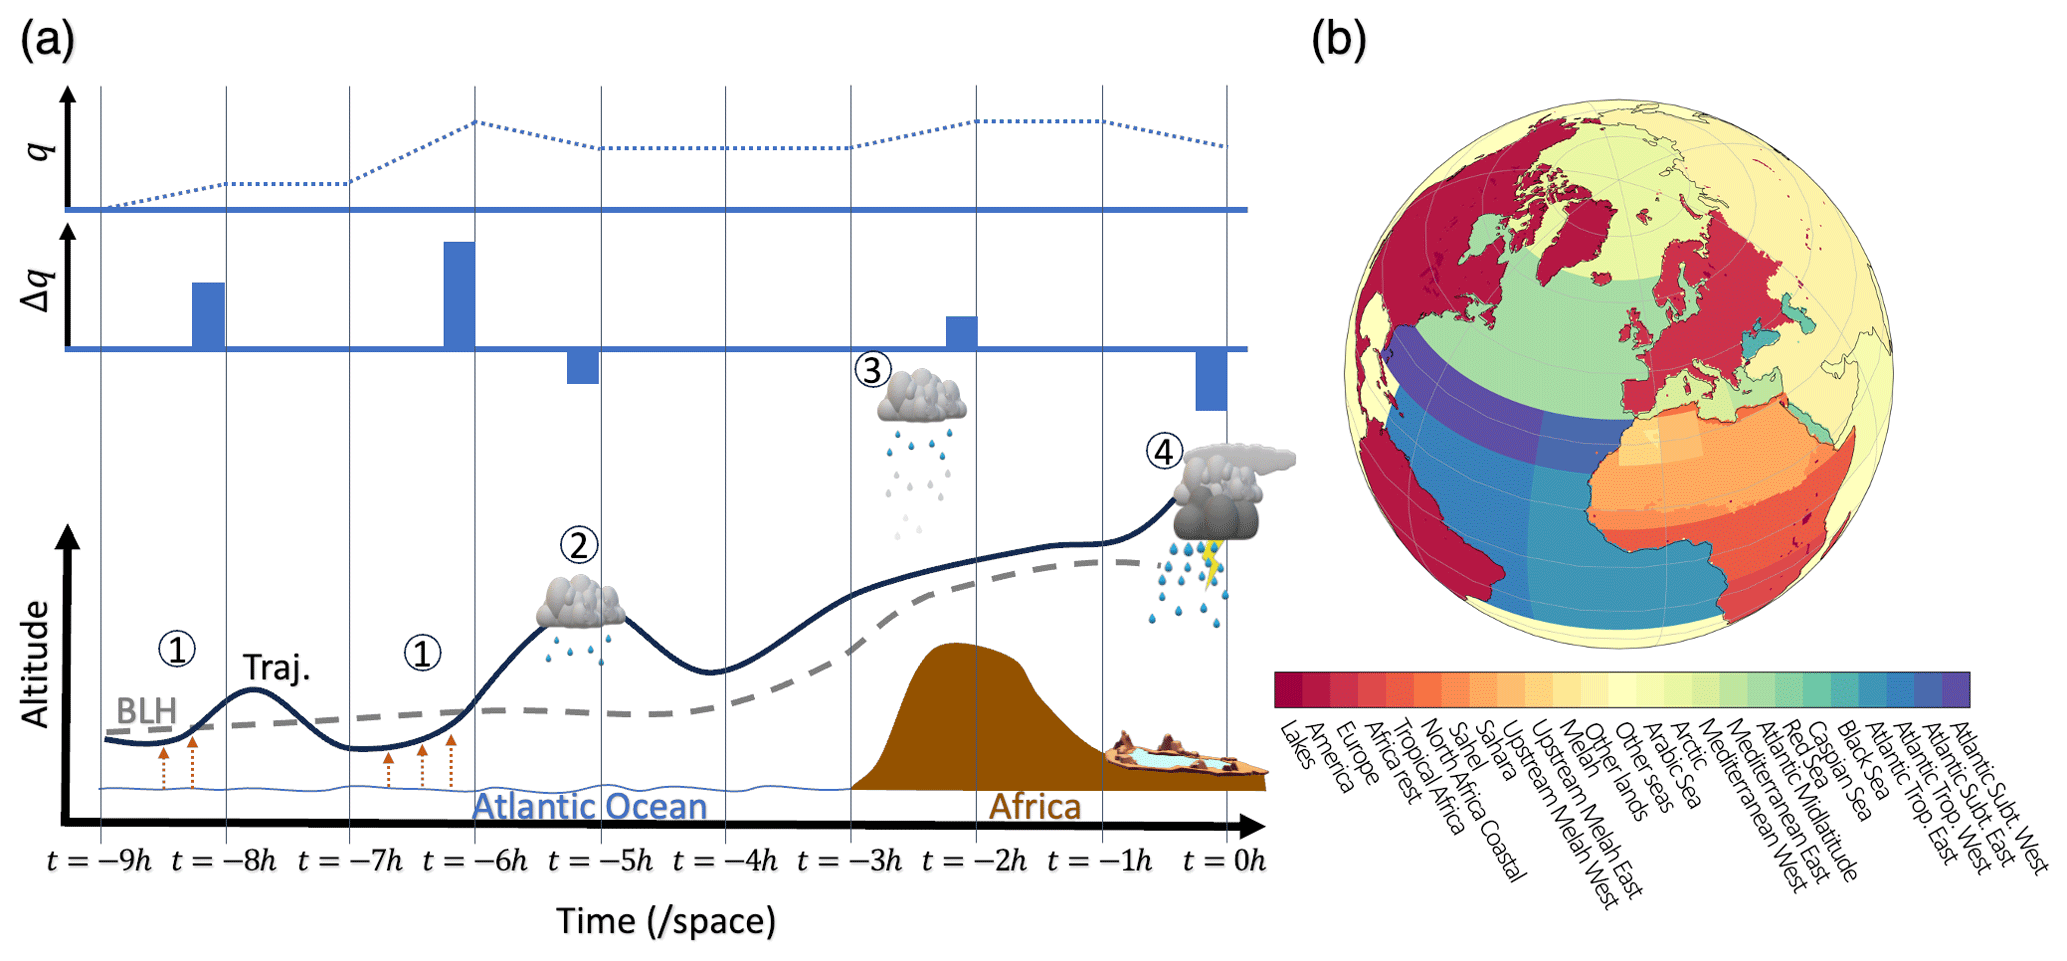
Figure 4Overview of the moisture source diagnostic (MSD). (a) Sketch of an exemplary backward trajectory of an air parcel passing over the Atlantic Ocean on its way to Africa (black line). Time before arrival is given at the bottom. The specific humidity (q; dashed blue line) in the air parcel and its variation (Δq; blue bars) between consecutive time intervals are in the upper panels. The boundary layer height (BLH; dashed grey line) is shown along the trajectory path, along with moisture increases by (1) surface evaporation or sublimation (orange arrows) and (3) below-cloud evaporation or sublimation (rainy cloud above trajectory) and moisture decreases by precipitation (2) along the way and (4) over the catchment. Figure adapted from Sodemann et al. (2008). (b) Moisture source region classification for the MSD.
Thus, one air parcel generally has multiple moisture sources along its path. Each source is associated with a weight quantifying its contribution to the water vapour at the point of arrival in the cloud forming precipitation above the catchment. The relative moisture contribution of each individual air parcel to the precipitation at a given 6 h time step is determined by its share of the total water vapour content carried by the airstreams feeding the precipitation-bearing cloud system observed in the IMERG dataset. This approach was chosen to make sure that the moisture sources are identified for all HPEs detected by IMERG data, even when there is no precipitation or only limited precipitation in ERA5 data. In Sodemann et al. (2008), only trajectories with a negative Δq and with an RH of more than 80 % are considered to contribute to precipitation. Here, because of the convective nature and complex small-scale structure of precipitation systems in the Sahara, the position and the vertical structure of the cloud system producing precipitation in the Sebkha el Melah catchment are not necessarily expected to be accurately represented in ERA5. However, we can safely expect ERA5 to faithfully represent the large-scale transport of moisture into the cloud layer above the catchment. We thus assume that the trajectories arriving in the cloud layer contribute to the observed precipitation proportionally to their water vapour content at arrival. We then use the IMERG precipitation observations integrated over the catchment and over the preceding 6 h to weight the contribution of each 6 h time step to the total precipitation of a given HPE. Finally, moisture sources are integrated over different pre-defined regions (Fig. 4b).
4.1 Overview of identified HPEs and LFEs: occurrence, rainfall, and runoff
During the study period (June 2000–May 2021), 250 HPEs occurred in the catchment of Sebkha el Melah over 356 d in total (see Fig. 5a and the Supplement), with an average of 1.4 events per month. Events are not distributed evenly throughout the year (Fig. A3): autumn is when events are most frequent (2.6 events per month), followed by spring (1.7 events per month), winter (0.9 events per month), and summer (0.4 events per month). Precipitation during HPEs varies between 0.5 and 60.8 mm, averaged over the catchment, with a mean value of 6.8 mm (Table 1).
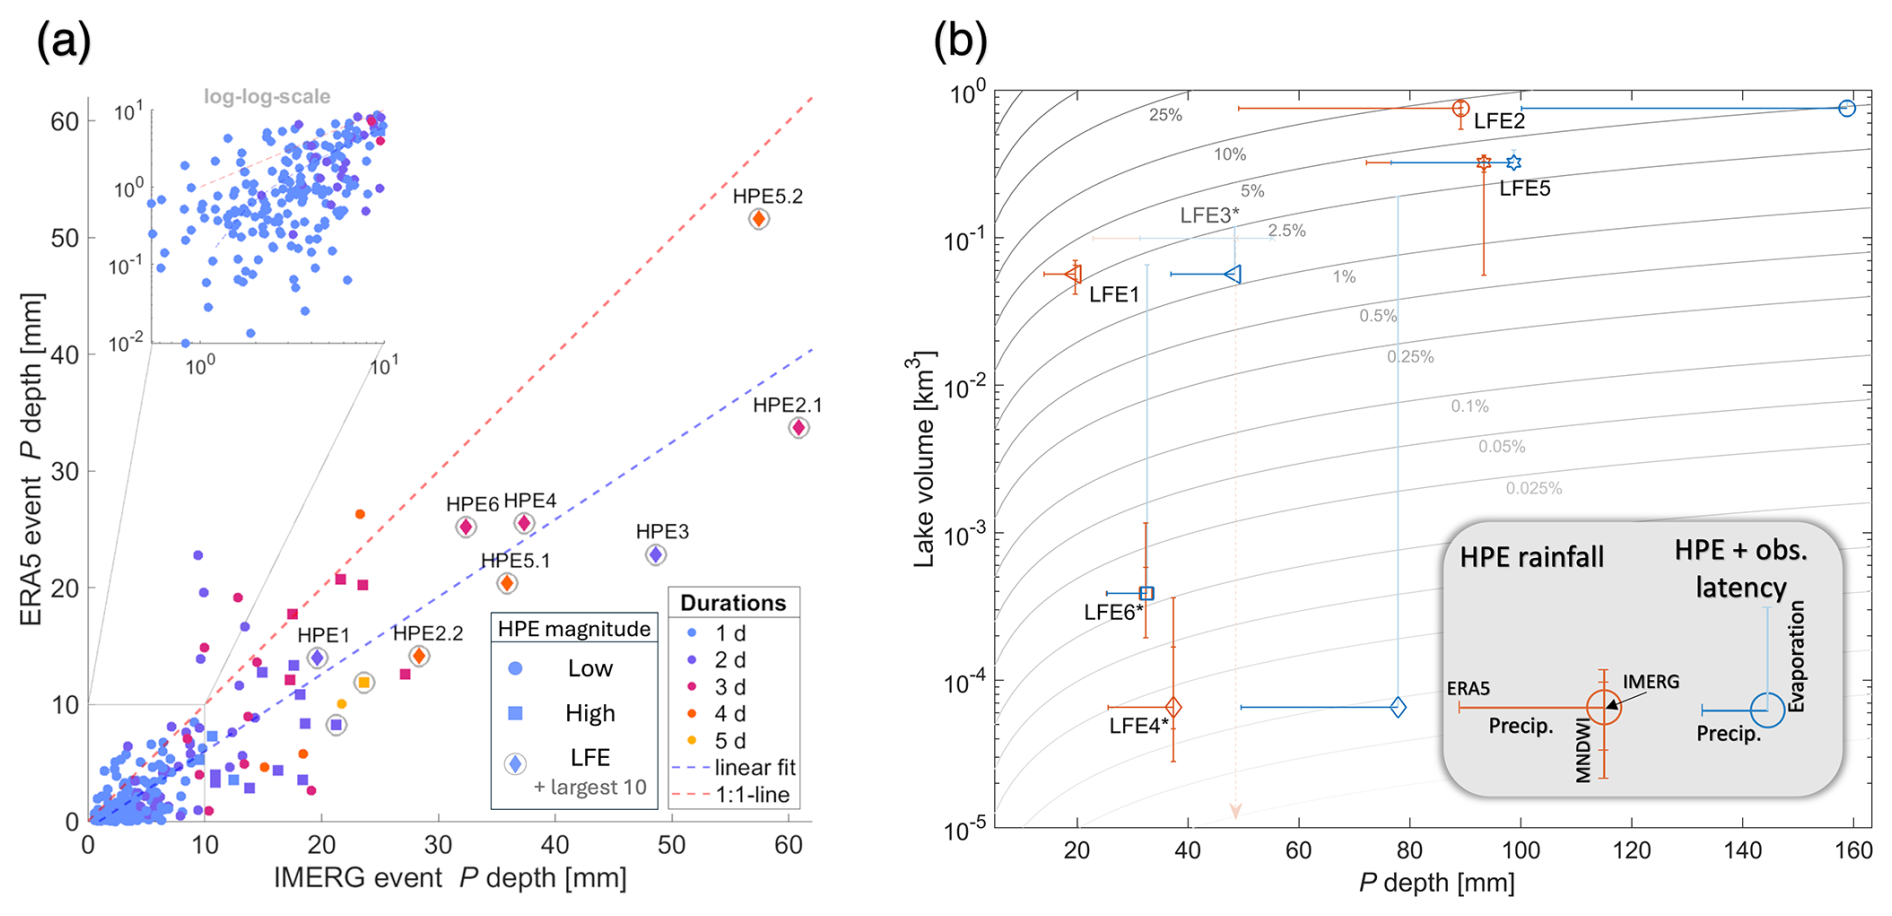
Figure 5Duration and accumulated precipitation of HPEs and runoff coefficients of LFEs in Sebkha el Melah. (a) Mean catchment precipitation (P) depth for IMERG- and ERA5-based data. Event durations are shown in colours; the 10 largest HPEs by magnitude are marked with grey circles, with LFE-generating HPEs marked with diamonds and labelled; strong HPEs with a magnitude ≥ 80th quantile are marked with squares; and medium HPEs are marked with dots. Both data sources show relatively good agreement for precipitation accumulation, but ERA5 is negatively biased compared with IMERG. Additionally, LFEs are only observed over the 10 largest HPEs by magnitude. (b) Effective runoff coefficient during LFEs computed by dividing the lake storage change with precipitation during LFE-generating HPEs. Grey contours are the effective runoff coefficients. Every LFE is shown twice, distinguishing between the two end-member scenarios (third point in Sect. 3.2.2), where orange symbols represent rainfall during the HPE only, and the blue symbols also represent the rainfall added until the lake observation (Table 2). Negative horizontal error bars represent ERA5 precipitation. Vertical orange error bars show lake storage variability when using MNDWI thresholds other than 0.4 (values are the same as in Fig. 3a). Positive vertical blue error bars represent evaporative loss estimates. LFEs with a * indicate that the lake was already partially inundated. LFE3, shown in semi-transparent colours, is represented only by the evaporative-loss scenario because no visual check based on Landsat data was possible due to cloud cover and missing data (Table 2).
Since in situ rain measurements in the Sahara are scarce, it is difficult to validate precipitation data from both the satellite and reanalysis datasets. While ERA5-based precipitation is consistently lower compared to IMERG precipitation (−43 %, on average; Table 1), high correlation values between the two datasets (ρPearson=0.87) and similar rankings for the events (ρSpearman=0.72) suggest that both can capture HPEs in the catchment (Table 1). However, because of the coarser resolution and parameterised convection in ERA5 (Sect. 3.1.2), convective rainfall – which is an important contributor to the majority of HPEs in desert areas (e.g. Sharon, 1972; Morin et al., 2020) – is not well represented in the ERA5 data, and precipitation rates are probably too low, as was recently observed over the entire Sahara (Armon et al., 2024a).
Rarely, HPEs trigger enough runoff to (partially) fill Sebkha el Melah. During the study period, LFEs occurred only six times, partially filling the lake with water volumes of ≤ 0.8 km3, amounting to about 90 % of its capacity (Figs. 5b and A2 and Table 2). Clearly, LFEs originate from the largest HPEs; each of the LFEs is associated with at least one of the 10 largest HPEs by HPE magnitude (Sect. 3.2.1), mostly coinciding with longer event durations (typically 3 d; Fig. 5a). Two of these LFEs resulted from two sequential HPEs, and the other four are a result of single HPEs (Table 2). Hereafter, we number these LFEs chronologically and use the same numbers to describe the corresponding HPEs, such that the first LFE during the study period is termed LFE1, and its associated HPE is termed HPE1. LFE-generating HPEs are characterised by event magnitudes > 1.4 km3 (14.7 mm when averaged over the catchment), while strong HPEs have magnitudes of ≥ 0.66 km3 (6.8 mm), and medium HPEs range between 0.66 and 0.01 km3 (6.7 and 0.1 mm, respectively).
Table 1Comparison of mean catchment precipitation properties during HPEs in IMERG and ERA5.
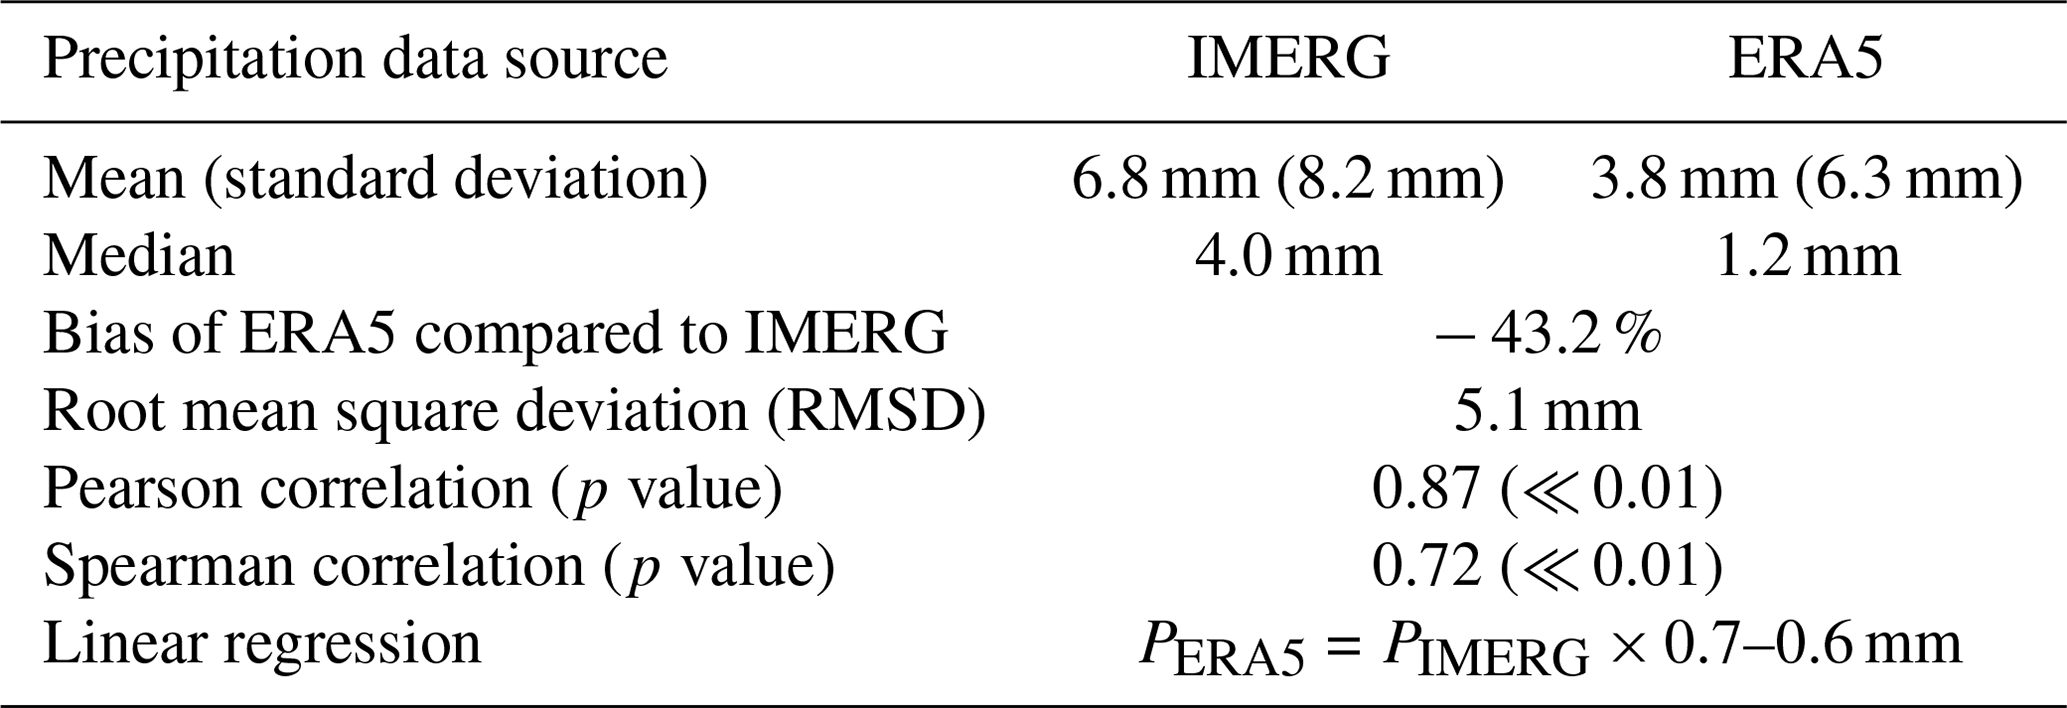
Table 2Overview of LFEs.
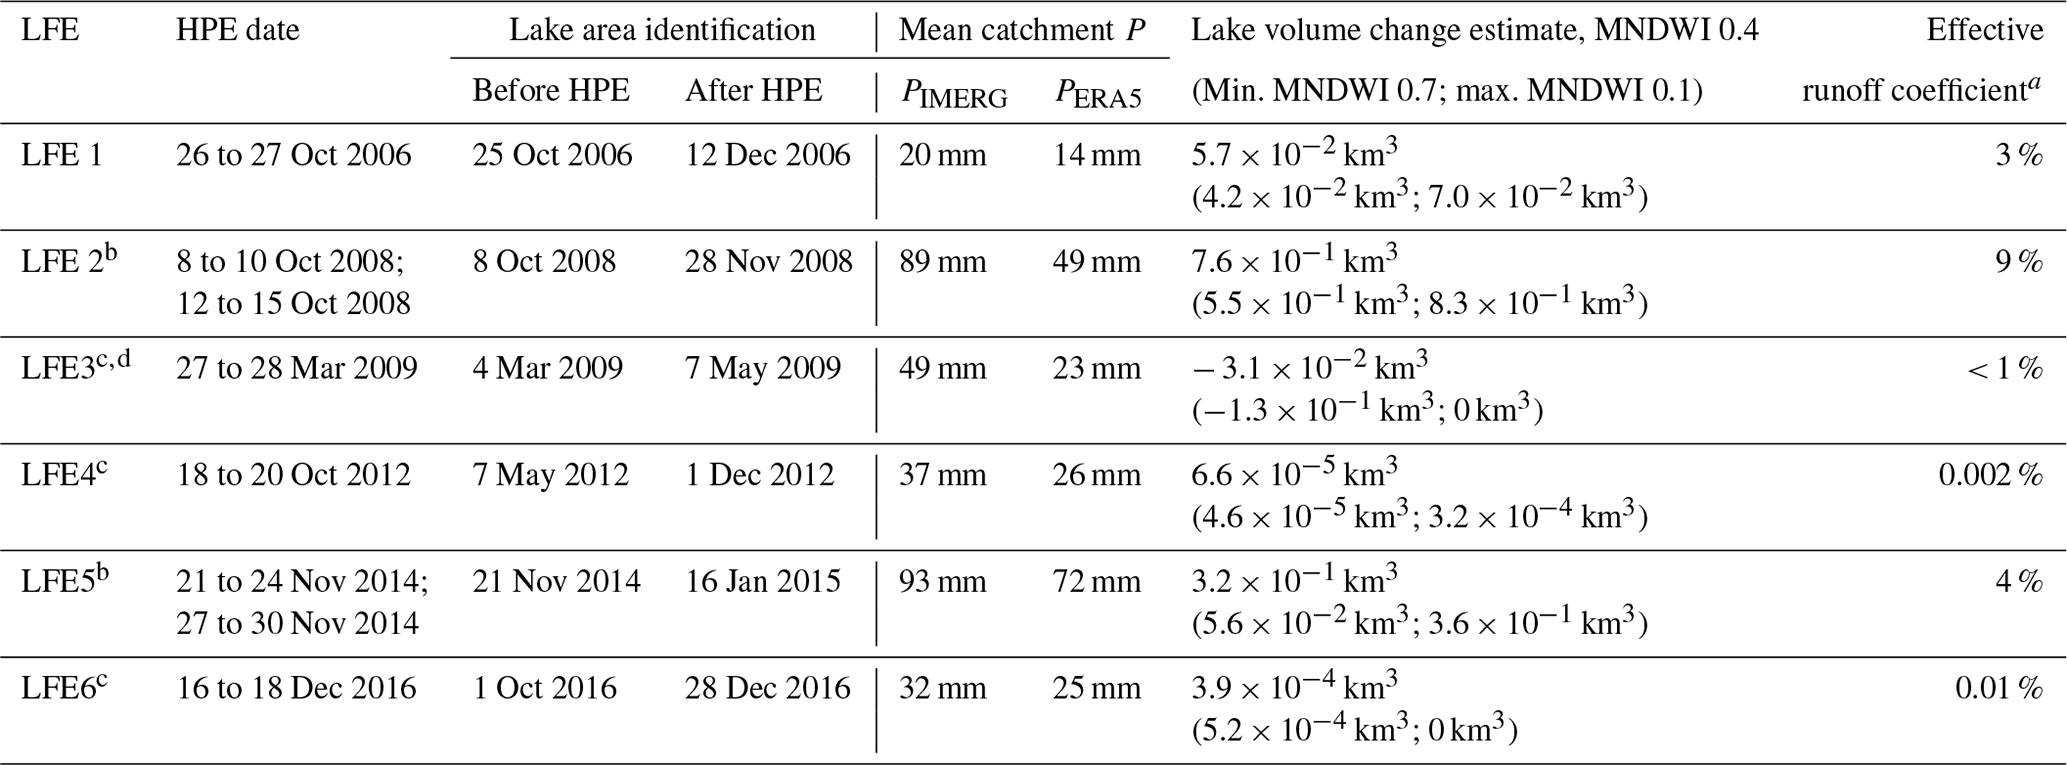
a Based on the IMERG event precipitation compared to the lake volume estimate of the MNDWI threshold of 0.4. b Two HPEs are associated with this LFE. c LFEs in which Sebkha el Melah was already inundated before the event. d Detected via MODIS observations but not with the MNDWI identification (Sect. 3.2.2).
While the HPEs that lead to LFEs are characterised by high rainfall values, runoff varies greatly between events. Mean catchment precipitation during these HPEs, when accumulating rainfall during consecutive HPEs if only one LFE eventuated, is between 20 and 93 mm. Effective runoff coefficients, which represent the portion of rainfall that actually reaches the lake by surface runoff, are computed for each of the LFEs based on the two end-member scenarios in the third point in Sect. 3.2.2. Scenario (a), in which precipitation is considered during HPEs only, is represented by the red symbols in Fig. 5b, and scenario (b), in which precipitation is accumulated until the Landsat observation time, is represented by the blue symbols. The calculated effective runoff coefficients of the LFEs vary by 5 orders of magnitude (< 0.001 % – ∼ 10 %). While, in general, higher coefficients are exhibited when higher precipitation amounts occur, while relatively high coefficient values (> 1 %) are exhibited in LFE1 (and potentially in LFE3; Fig. 5b). Still, the highest effective runoff coefficients are exhibited for the largest events (LFE2 and LFE5), where average precipitation over the catchment reaches nearly 100 mm during the event duration.
4.2 Meteorological conditions during the November 2014 LFE: a case study
To better understand the synoptic ingredients involved in the filling of Sebkha el Melah, we focus now on a specific case study – LFE5 in November 2014 (Fig. 5b, Table 2). This LFE is associated with two consecutive HPEs (event nos. 5.1 and 5.2 in Fig. 5a), which contributed a combined volume of 0.32 km3 to the lake, ending a 3-year period during which the lake was almost completely empty, with the exception of a small LFE in October 2012 (LFE4; Fig. 3). Precipitation during HPE5.1 and HPE5.2 was extremely intense, summing to 93 mm averaged over the catchment, with values locally exceeding 140 mm over the central part of the catchment (Fig. 6). In both sub-events of HPE5, two distinct peaks of precipitation appear: HPE5.1 on 22 November 2014 and from 23 to 24 November 2014 and HPE5.2 on 27 November 2014 and from 28 to 29 November 2014. Both IMERG- and ERA5-based precipitation data are remarkably similar in terms of the timing of precipitation, with ERA5 showing a −22 % bias compared to IMERG for catchment mean precipitation and slightly lower precipitation intensities.
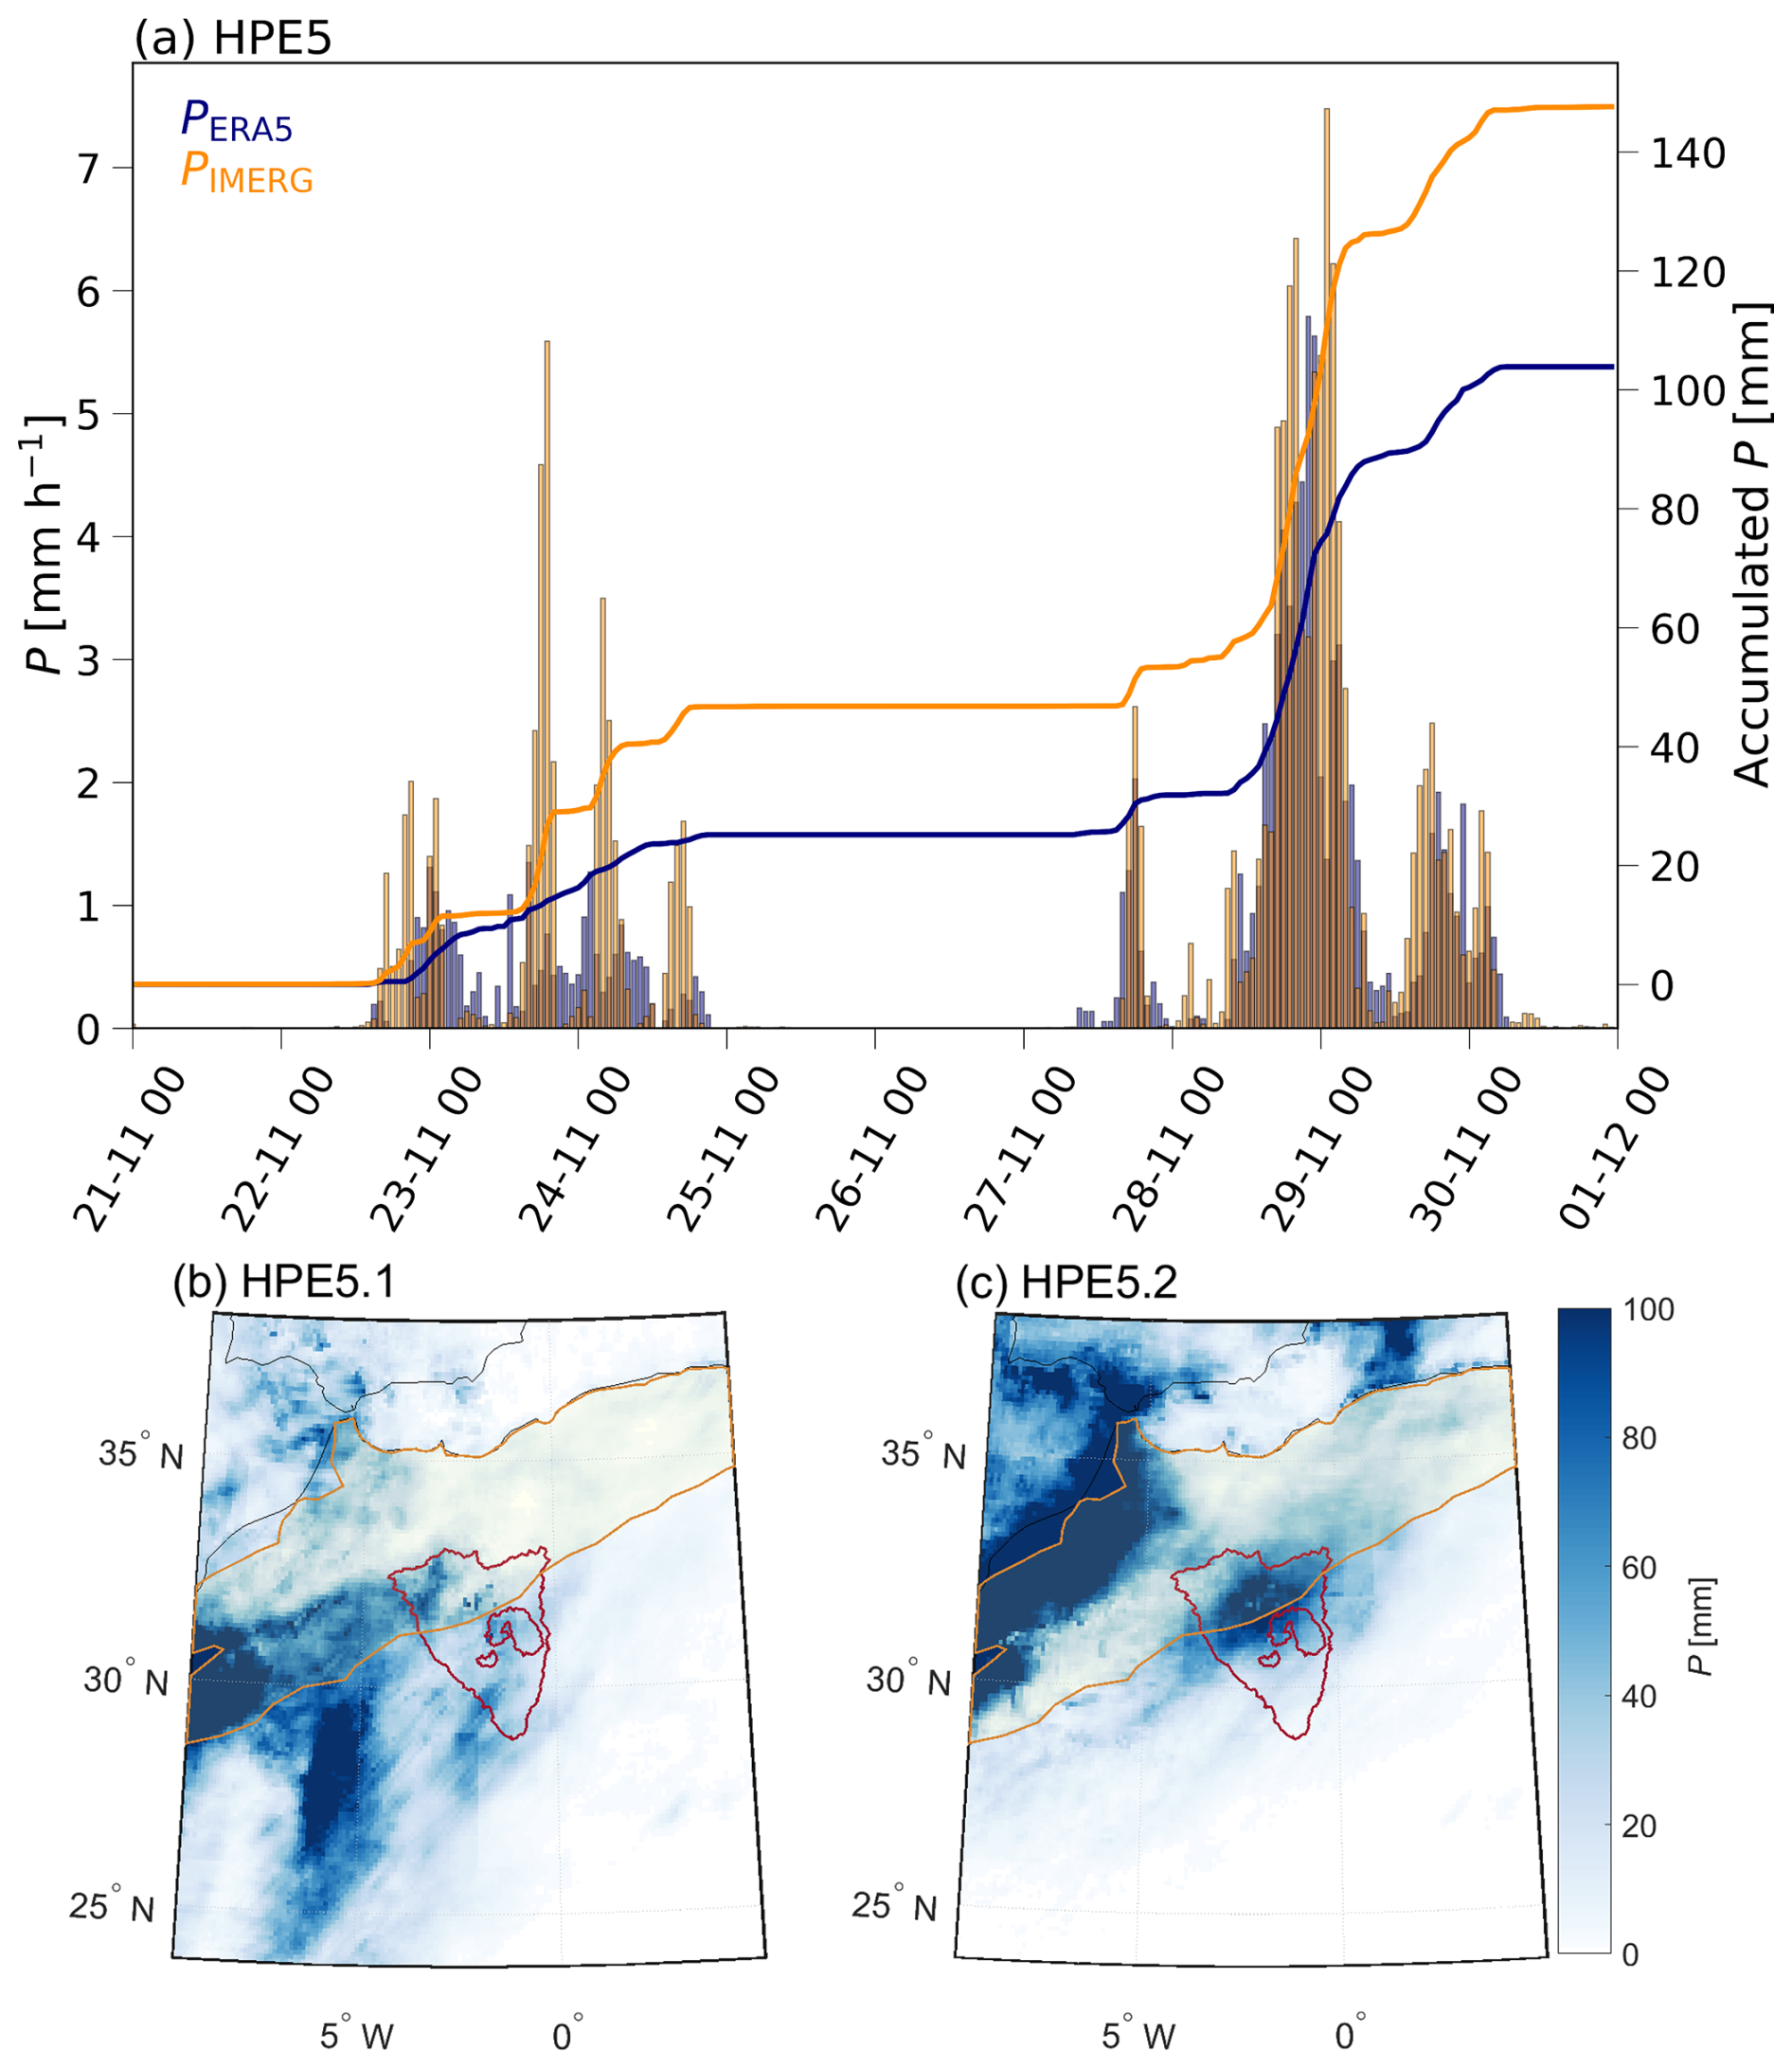
Figure 6Precipitation during HPE5. (a) Hourly evolution of precipitation intensity (left axis; bars) and accumulated precipitation (right axis; lines) for IMERG (orange) and ERA5 (blue) data interpolated to the central part of the catchment for the city of Béchar (Fig. 1b). (b) Accumulated IMERG-based precipitation during HPE5.1 (21 to 24 November 2014). (c) Similar to (b) but for HPE5.2 (27 to 30 November 2014). Red contour is the Sebkha el Melah catchment, and brown shading denotes the Atlas Mountain Range (contour based on NaturalEarth, 2023).
4.2.1 Synoptic evolution
During HPE5.1, a low-level cyclone was positioned along the western coast of Morocco, exhibiting increased moisture and extensive precipitation. This low-level cyclone was formed through two sequential upper-level stratospheric PV streamers, which reached farther south of 30° N and transformed into PV cut-offs (Fig. 7a, b). These upper-level PV features persisted in the region throughout HPE5.1. Concurrently, a pronounced anticyclone prevailed over eastern North Africa and the Mediterranean. The anticyclonic wind field to the east of the study region and the cyclonic wind field to the west induced a convergent southerly to southwesterly flow from equatorial West Africa toward the catchment (Fig. 7a, b). This flow is associated with an elevated moisture band from the tropics, resembling a tropical plume.
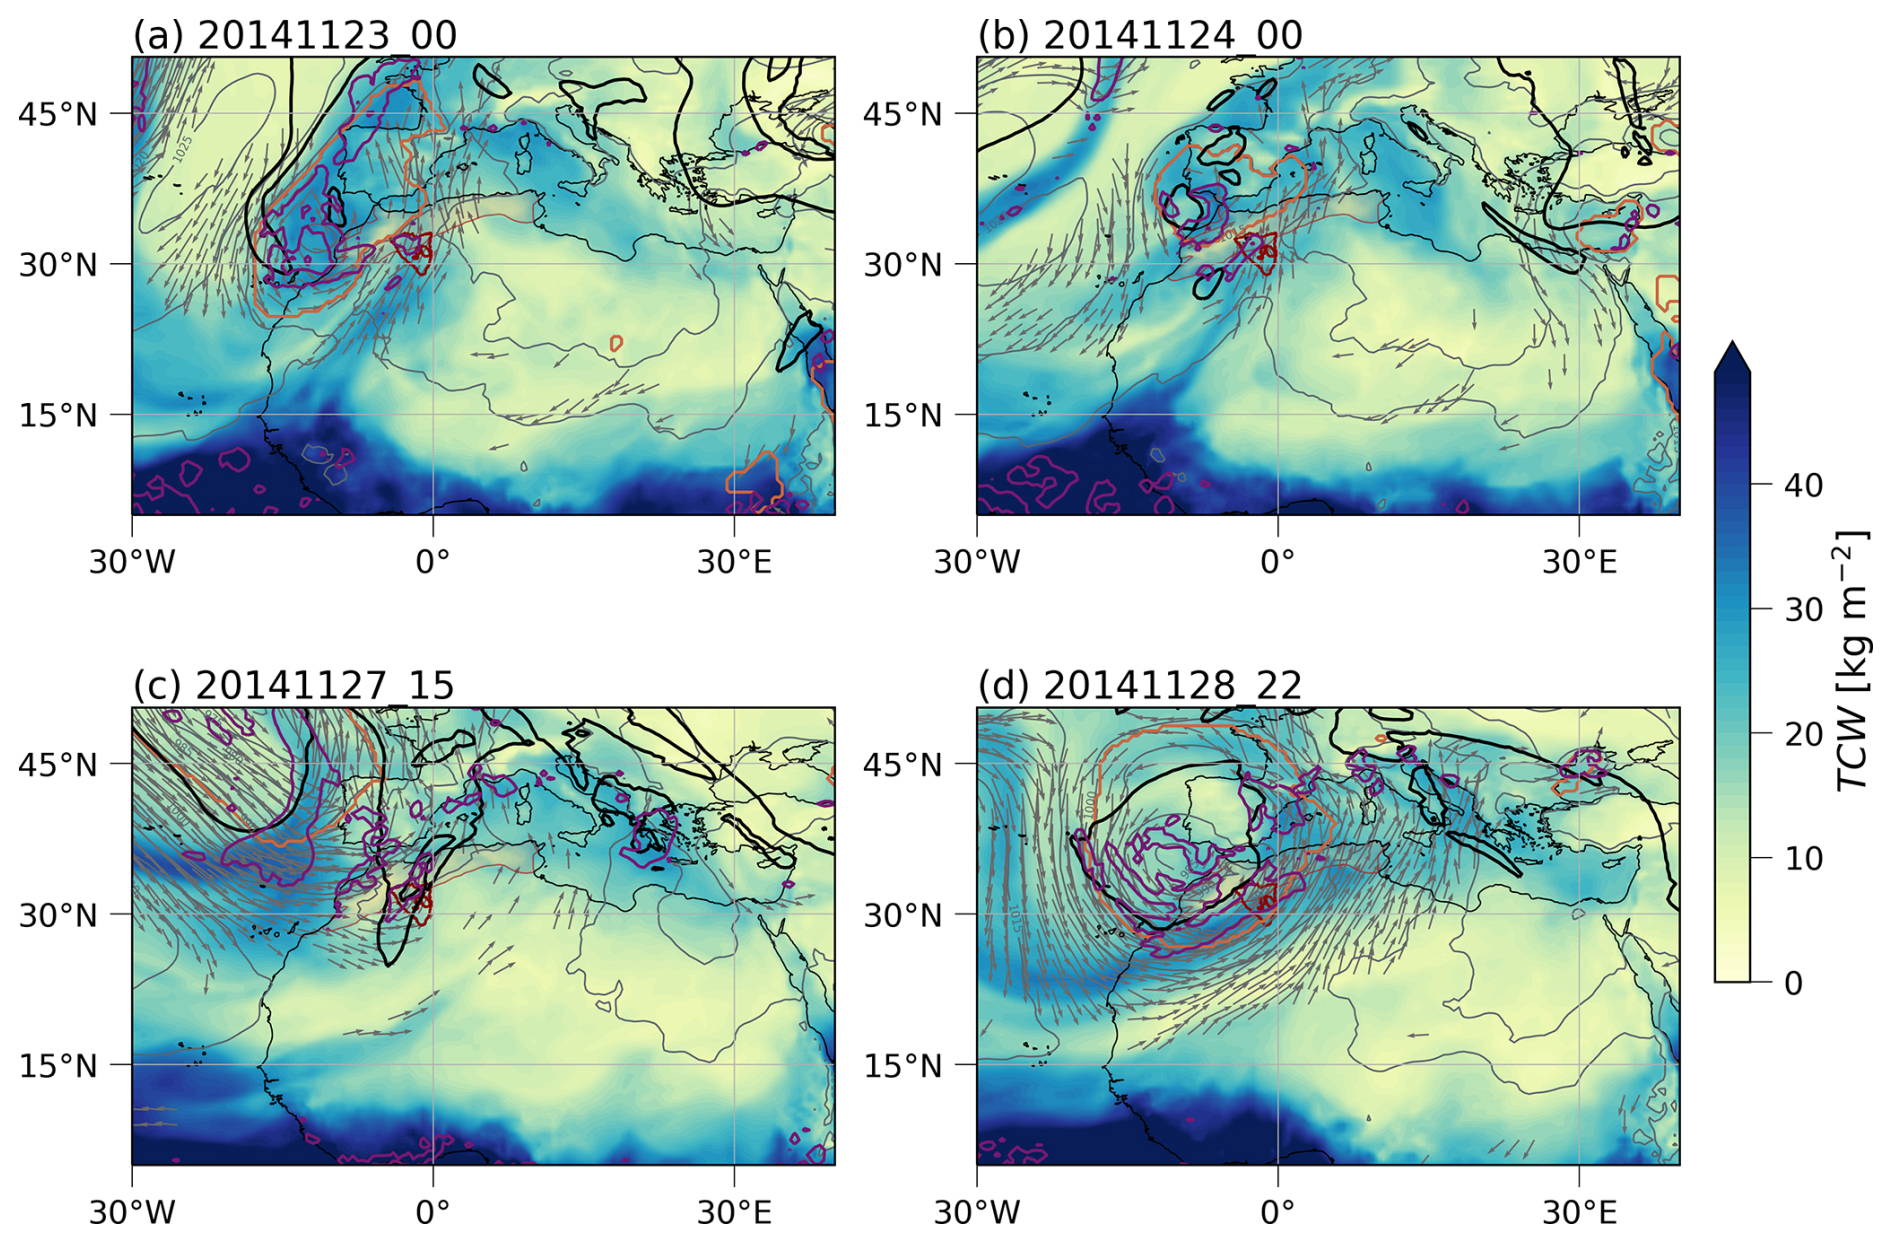
Figure 7Synoptic-scale conditions during HPE5.1 (a, b) and HPE5.2 (c, d) as an example for the southward intrusion of upper-level PV features and a low-level cyclone and a northward intrusion of moist air. The total column water (TCW) is coloured, the thick black contour is the 2-PVU line on a 320 K isentrope, the violet contour represents modelled precipitation (ERA5; where intensity is > 0.5 mm h−1), the orange depicts the location of the surface-level cyclone, the grey arrows are 850 hPa wind vectors (shown only where wind speed is > 10 m s−1), the grey contours are mean sea level pressure, the red contour is the Sebkha el Melah catchment, and the brown shading shows the Atlas Mountain Range.
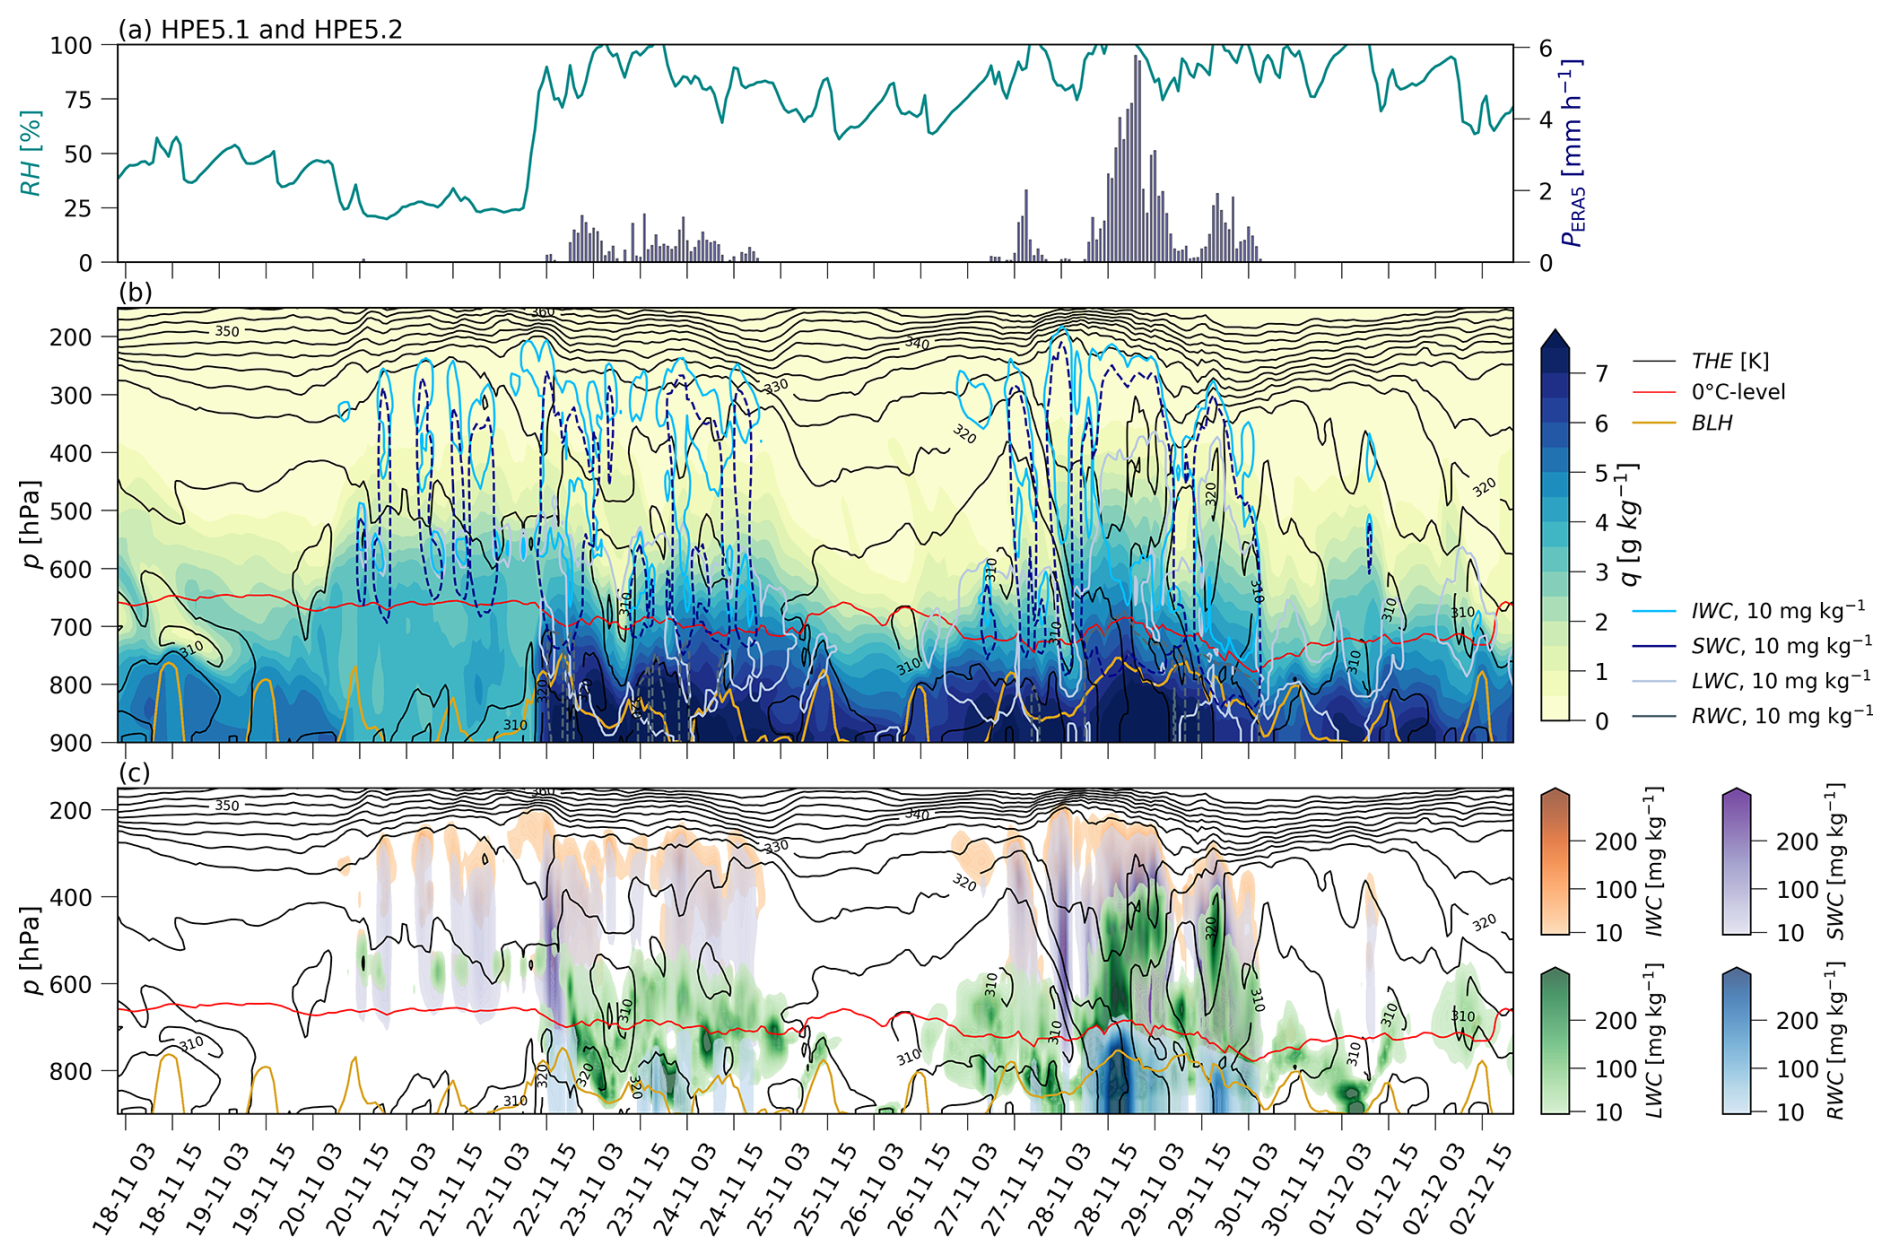
Figure 8Moisture dynamics during HPE5.1 and HPE5.2 (LFE5). The temporal evolution of the atmospheric column in ERA5 is interpolated to the catchment centre (Béchar; Fig. 1b). (a) Time evolution of surface relative humidity (RH, turquoise line, left axis) and precipitation (P, blue bars, right axis). (b) Time evolution of specific humidity (q, coloured field), equivalent potential temperature (θe; THE, black lines), 0 °C level (red line), boundary layer height (BLH, yellow line), 10 mg kg−1 isolines of ice water content (IWC, solid light-blue line), snow water content (SWC, dashed dark-blue line), liquid-water content (LWC, solid light-grey line), and rain water content (RWC, dashed dark-grey line). (c) Time evolution of IWC (orange), SWC (violet), LWC (green), RWC (blue), THE (black lines), 0 °C level (red line), and BLH (yellow line). Precipitation evaporation and sublimation are evident before each of the two rain periods.
In between HPE5.1 and HPE5.2 (25–26 November 2014), low-level winds in the catchment weakened (not shown). Winds turned for a short period into (north-)easterlies as the upper-level PV cut-off and, with it, the surface cyclone moved to the east. During this stage, low-level moisture was still high due to the evaporation of previous precipitation (Fig. 8a, b). In fact, relative and specific humidity remained high within the boundary layer throughout HPE5, with values between 60 % and 100 % and > 7 g kg−1, respectively. With the development of an upper-level stratospheric PV streamer on 26 November 2014, a cyclone formed along the western Iberian coast (not shown). Thereafter, the streamer extended south to 25° N.
In the initial stage of HPE5.2 (27 November 2014), the narrow PV streamer moved over the catchment, supporting the ascent of the (remaining) moisture in the vicinity of the catchment and producing light precipitation. At the same time, a deep cyclone in the north started moving southward as a large upper-level stratospheric PV cut-off emerged, approaching (or continuously reforming) from the southern tip of Greenland, over the Iberian Peninsula, to the western coast of Morocco (Fig. 7c). Moisture accumulated in front of this cyclone, also associated with an extratropical frontal system (Fig. A5). When the cyclone reached the western coast of Morocco, the low-level southwesterlies bypassed the Atlas Mountains and brought moisture far into the Sahara (Fig. 7c, d). On 29 to 30 November 2014, the cold front of the low-level cyclone and the southern part of the upper-level PV cut-off moved slowly over the catchment, bringing catchment precipitation to its peak (Fig. 6a).
Throughout HPE5, isentropes were weakly stratified across the troposphere, indicating potentially strong convection (Fig. 8b, c). Thus, the two events were accompanied by a low-level destabilisation, which roughly coincided with precipitation peaks. The approach of the upper-level PV streamers and cut-offs contributed to the destabilisation and initialisation of precipitation upstream of the catchment. The upper-level PV structures, however, do not cross the catchment during precipitation peaks, except on 27 November 2014. Thus, their role in precipitation formation is mainly on a large scale as triggers of the moist low-level southerly flow toward the Atlas, enabling intense convection over the orography. The ERA5 hydrometeor concentrations during HPE5 indicate that deep mixed-phase precipitating clouds, with cloud tops reaching higher than 300 hPa, characterised this event (Fig. 8c), in agreement with MODIS cloud top observations (Fig. A4). The reduced stability during 25 and 26 November 2014 points toward strong vertical mixing up to the mid-troposphere, potentially by surface heating, but due to dry convection only as no clouds form, and moisture is not depleted (Fig. 8).
4.2.2 Moisture sources
Moisture supply for precipitation during HPE5 originated predominantly from two major sources: one is to the south of the study region, over the southern Sahara and Sahel, contributing to the first part of the event (HPE5.1; Fig. 9a, c), and the other is the Atlantic Ocean, representing the dominant moisture supply for the second part of the event (HPE5.2; Fig. 9b, c). The MSD is only able to identify ∼ 70 % of the moisture origin for the first part of HPE5.1 (Fig. 9c), pointing toward important contributions of moisture from uptakes that occurred more than 10 d before the precipitation event. This is remarkable because typical water vapour residence times are 4 to 5 d globally, with a trend toward smaller durations in the tropics and oceanic subtropics (Gimeno et al., 2021), while residence times of 8 d or more were found for precipitation in the Sahara (Sodemann, 2020). Furthermore, the boundary layer contribution is low compared to the contribution of the free atmosphere at about 30 %, temporally averaged for the first part of HPE5.1. For the second part of HPE5.1, the MSD explains more than 90 %, and the boundary layer contribution rises to about 40 %.
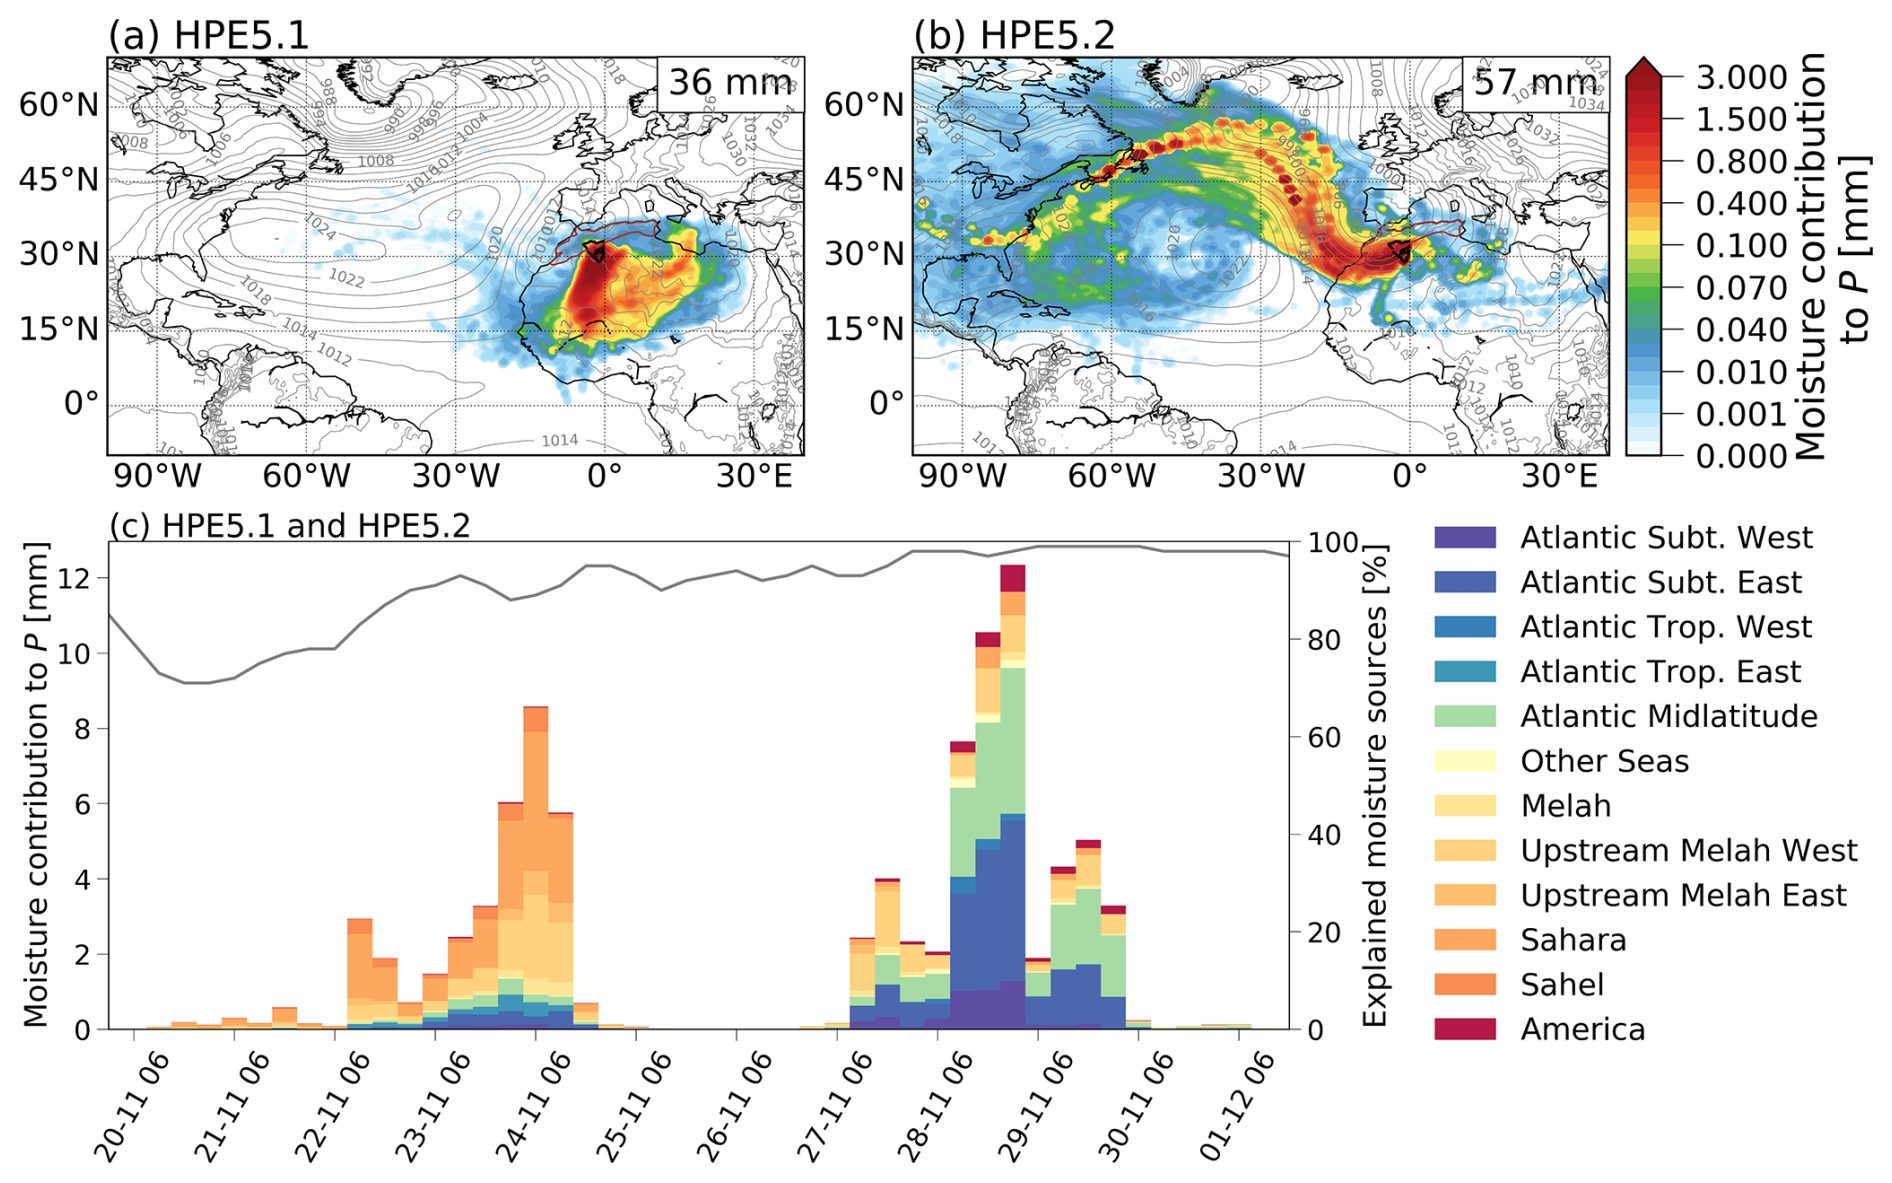
Figure 9Moisture supply to precipitation during (a) HPE5.1 and (b) HPE5.2 and their (c) temporal evolution (Fig. 4b), showing the major moisture sources (regions with moisture supply of < 0.01 mm 6 h−1 are excluded) and the percentage of explained moisture source (grey line). In panels (a) and (b), a thick black contour indicates the Sebkha el Melah catchment, grey contours indicate the mean sea level pressure isolines averaged over the HPE duration, and the upper-right box shows mean catchment precipitation. Generally, one pixel with 1 mm of moisture signal is interpreted as contributing 1 mm of P to the HPE over the catchment. Moisture sources clearly differ between the two rain periods, shifting from more arid during HPE5.1 (orange colours) to Atlantic moisture sources (blue-green colours) during HPE5.2.
As the surface of the Sahara is very dry, it is surprising that this region contributes so much moisture during the first part of HPE5.1. To better understand this phenomenon, we focus on the atmosphere upstream of the catchment. Figure 10 shows the vertical moisture profile along ERA5 trajectories crossing the region southwest of the catchment. The moist mid-level troposphere along the air parcels' pathways exhibited clouds and precipitation sporadically. This precipitation is invigorated in the Sahel and Sahara (from −50 h onward; Fig. 10b, c), yet it does not reach the ground until the HPE starts. Rather, it is evaporated or sublimated in the sub-cloud layer (note, for example, that the purple contour in Fig. 10c does not reach the ground, meaning that snow is sublimating). Moisture for this precipitation may originate and converge from more tropical regions (tropical West Africa, the Sahel, and the tropical North Atlantic) and be transported through the Sahara to the catchment. Similar observations were previously addressed through tropical plumes (Knippertz et al., 2003; Knippertz, 2003; Rubin et al., 2007; Skinner and Poulsen, 2016). However, some of the moisture might be recycled from the upwind sub-cloud evaporation or sublimation of precipitation in the tropical plume. This explanation is in line with the fact that only a small part of the moisture uptake is attributed to evaporative sources in the boundary layer. A similar signal is observed in the vertical time evolution of the atmosphere above the catchment before HPE5.1. It already shows elevated values of specific humidity at mid-levels and cloud formation at higher levels at 15:00 UTC on 20 November 2014 (Fig. 8b, c). Considering this process, the Sahara can be described as a moisture source induced by precipitation evaporation and not due to contributions from surface evaporation.
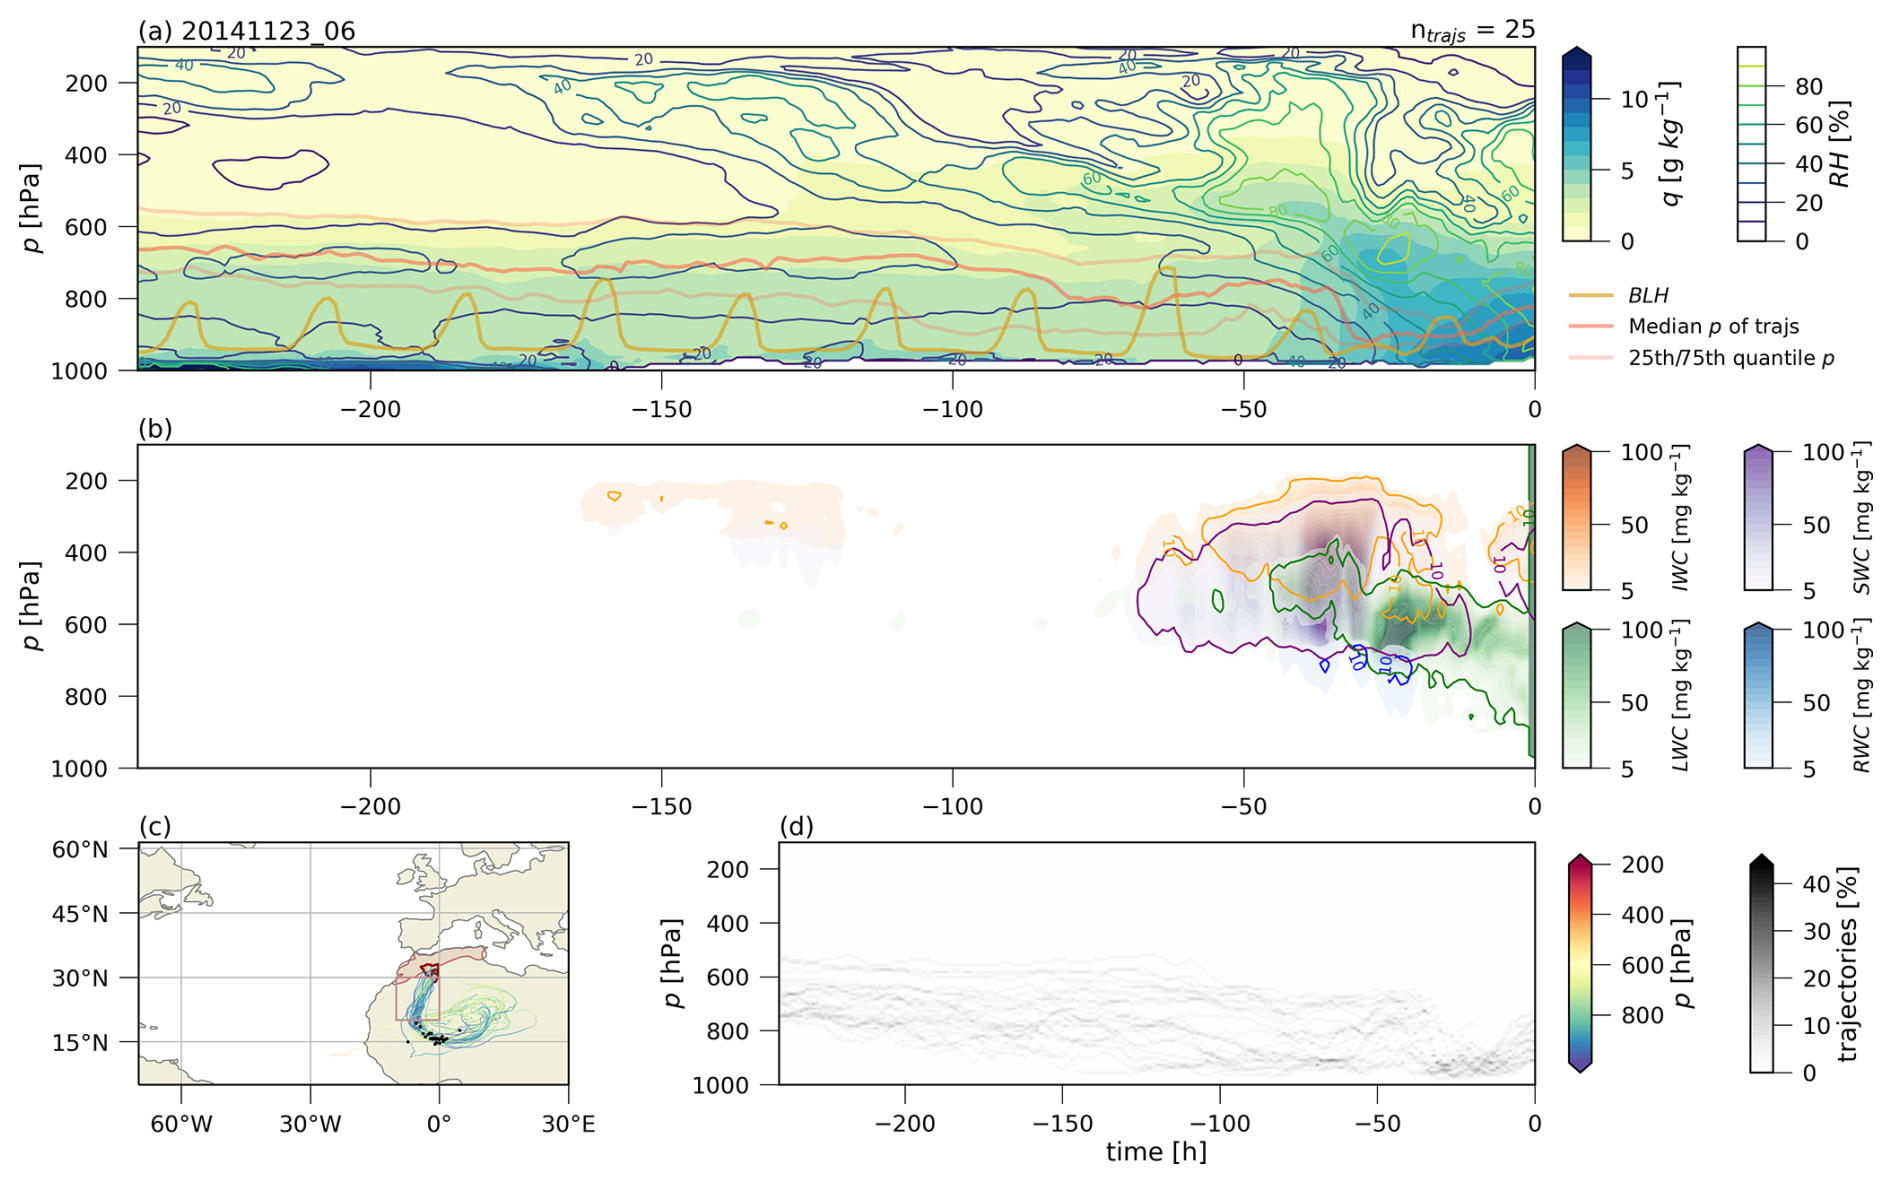
Figure 10Vertical profile along the main moisture transport pathway to HPE5.1 (at 06:00 UTC on 23 November 2014). (a) Temporal evolution (x axis, in hours) of the vertical distribution (y axis) of specific (q, coloured field) and relative (RH, coloured lines) humidity, the boundary layer height (BLH, thick yellow line), and averaged trajectory–pressure levels (red-shaded lines). (b) Vertical evolution of ice water content (IWC, orange), snow water content (SWC, violet), liquid-water content (LWC, green), and rain water content (RWC, blue). (c) Trajectory positions and pressure levels (coloured) 10 d backward – black dots indicate air parcel positions at t = −50 h, the red contour is the Sebkha el Melah catchment, and the brown contour is the Atlas Mountains. (d) Percentage of trajectories at every pressure level 10 d backward. Precipitation evaporation and sublimation are exhibited over two periods before the arrival of these air parcels in the catchment.
For HPE5.2, the MSD signal indicates an intense evaporation area over the North Atlantic as the dominant moisture source of precipitation (Fig. 9b, c), attributable to the intense extratropical cyclone approaching from southern Greenland (Fig. 7). The largest precipitation amount arrives during the night from 28 to 29 November 2014, with > 70 % of moisture coming from the North Atlantic, coinciding with the deep cyclone reaching the catchment from the west (Fig. 7). Furthermore, the boundary layer contribution varies between 55 % and 90 %, which can be related to surface evaporation over the North Atlantic. As the deep cyclone on 28 to 29 November 2014 travelled rather slowly over the catchment, moist air parcels had sufficient time to move around the southern tip of the Atlas Mountains.
On 27 November 2014, though, a large portion of the precipitated moisture originated from just upstream of the catchment region. The building up of low-level clouds on 27 November 2014 (Fig. 8) hints toward the fact that the remaining moisture of HPE5.1 fuelled the initial phase of precipitation during HPE5.2, further supported by an initial boundary layer contribution of up to 60 % to precipitation. The MSD for HPE5.2 is able to attribute 95 % – 100 % of the moisture sources (Fig. 9c).
To conclude this case study, it seems that a rather stationary extratropical low-level cyclone with an upper-level forcing positioned at the western coast of Morocco is essential to generate a strong enough HPE to trigger an LFE. This constellation, depending on its strength and exact position, may either induce moisture convergence (e.g. a tropical plume) from the tropics and the Atlantic into the catchment of Sebkha el Melah or transport large amounts of oceanic moisture around and partly over the Atlas Mountains into the catchment. Additionally, the stationarity of the synoptic weather system and/or the continued reinforcement of a low-level extratropical cyclone allow moist air parcels to be advected and lifted during long enough time periods to create HPEs. The coupled or sequential lifting processes through upper-level forcing, orographic lifting, and potentially convection because of diurnal surface heating most probably play an important role in maintaining precipitation over a long enough time period to trigger an LFE.
4.3 Climatology of HPEs
Given the different precipitation forcing mechanisms that appear to play a role for just one exemplary LFE, as well as the observation of precipitation appearing dominantly during afternoon and nighttime hours, in the following section, we explore whether these are general characteristics of HPEs and LFEs in Sebkha el Melah.
LFE-generating HPEs have distinct characteristics compared to other HPEs and the mean climatology. To show these differences, we divided the identified HPEs into three categories based on their HPE magnitude (Sect. 3.2.1): (a) LFE-generating HPEs, (b) strong HPEs, and (c) medium HPEs (Fig. 5a).
First, we examine the daily cycle of precipitation; it shows a clear diurnal pattern in all seasons (Fig. 11), albeit one that is less pronounced in winter. Precipitation intensity rises in the afternoon, peaks in the late evening (18:00 to 21:00 UTC+1), and then drops back to lower values during the night and morning. This daily cycle indicates a major convective influence on total rainfall due to the strong heating of the surface in the Sahara. During winter, though, the precipitation intensity varies more throughout the day, suggesting that the convective influence is smaller, and the large-scale forcing from extratropical systems is more prominent.
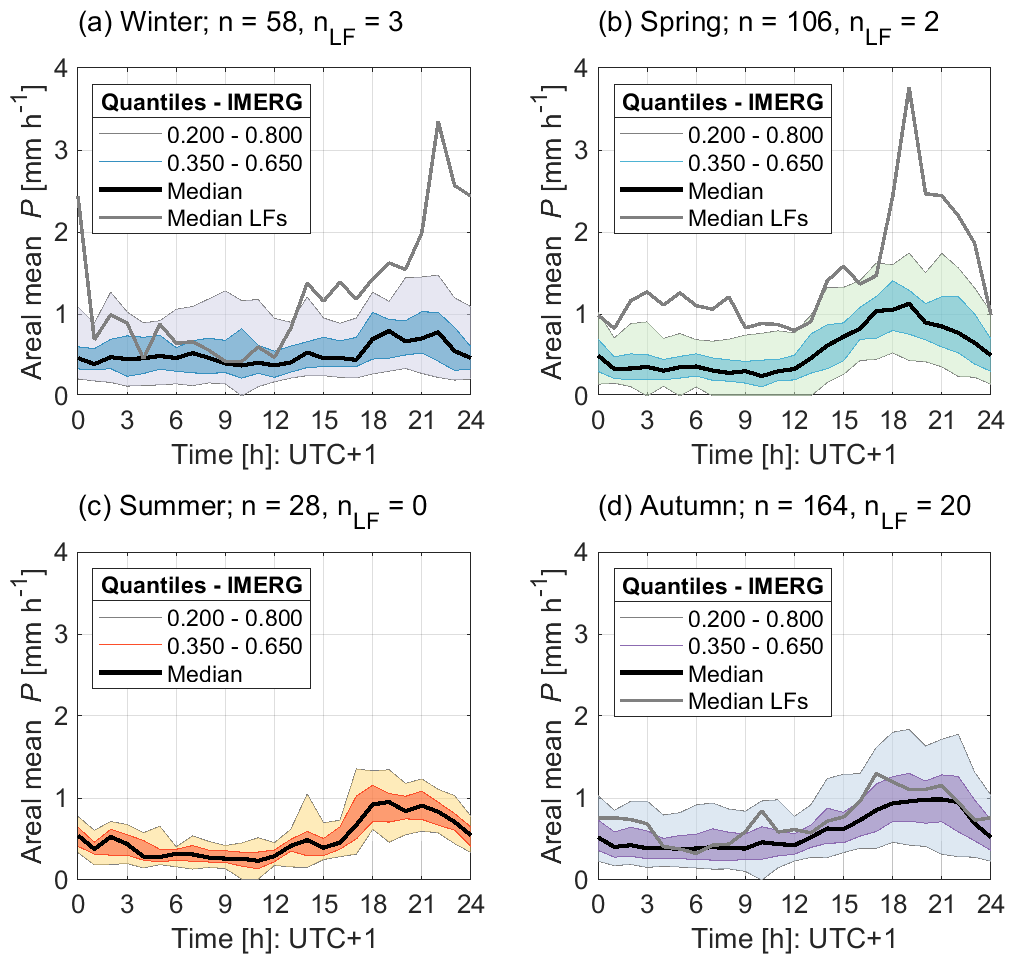
Figure 11Daily cycle of mean catchment precipitation (P) intensity for HPE days during (a) winter (DJF), (b) spring (MAM), (c) summer (JJA), and (d) autumn (SON). Precipitation quantiles are computed compared to all HPE days. Grey lines show the median intensities for LFE-generating HPEs. n refers to the number of HPE days. nLF refers to the number of LFE-generating HPE days.
Rain intensity during LFE-generating HPEs is higher compared to the intensity during strong and medium events while exhibiting the same general daily cycle. In autumn, the difference in the mean catchment intensity of LFE-generating HPEs compared to other HPEs diminishes slightly, with LFEs situated at roughly the 65th quantile (Fig. 11). We hypothesise that this smaller difference might be related to the typical area of rain cells, which is smaller in autumn because of a larger contribution of convective precipitation caused by the smaller-scale forcing for precipitation; more isolated convective cells forced by surface heating show typically higher rain intensities, smaller areal coverage, shorter lifetimes, and smaller vertical velocities (e.g. Sharon, 1972; Belachsen et al., 2017; Armon et al., 2018). Despite the small area covered by convective storms, those events may create LFEs if they are situated over the areas contributing efficiently to the lake filling (i.e. the rockier and/or downstream part of the catchment). Yet, their precipitation intensity will be small when averaged over the catchment within the daily cycle.
In general, all three HPE categories exhibit the same type of synoptic-scale anomalies but with an increased anomaly for higher HPE intensities (Fig. 12). The upper-level geopotential height anomaly during HPEs shows a major negative signal centred toward the northwest of the catchment over the western Atlas Mountains and the western coast of Morocco, accompanied by an upper-level cyclonic wind anomaly and increased atmospheric moisture contents. These anomalies become larger for the strong HPEs and are the deepest for LFE-generating HPEs. The structure of these anomalies indicates the presence of an upper-level low or a trough, which are chiefly associated with PV features such as streamers and cut-off lows (Fig. A6) and a more meandering jet stream (Portmann et al., 2021). These upper-level anomalies tend to destabilise the low levels and increase the potential of a surface cyclone formation, which is usually present along the western coast of Morocco (Fig. A7) during precipitation events in the catchment.
An upper-level wind anomaly on the western side of the catchment changes from west-southwest during medium HPEs (Fig. 12d) to southwest during strong HPEs (Fig. 12c) to south-southwest during LFE-generating HPEs. Similar patterns are exhibited at the surface as well, although with a lower intensity (Fig. A7). The normal westerlies (Fig. 12a) and the southwesterlies during medium HPEs impinge on the Atlas Mountains, which may lead to increased precipitation on the windward side of the mountains and decreased precipitation on the lee-side (e.g. Roe, 2005; Marra et al., 2022). In contrast, during strong HPEs and LFEs, the stronger winds clearly blow around the Atlas Mountains, leading to decreased orographically induced rain-out. Thus, larger amounts of moisture can reach the catchment and the southern side of the Atlas Mountains, enabling increased precipitation in the “rain shadow” of the mountains.

Figure 12Upper-level and moisture anomalies during HPEs. (a) Average annual climatology of total column water (TCW; kg m−2; colours), winds at 500 hPa (m s−1; grey arrows), and geopotential height at 500 hPa (grey contours). Anomalies of these variables during LFE-generating HPEs (b), strong (≥ 80th quantile) HPEs (c), and medium HPEs (d) are presented in the other panels. The red contour represents the Sebkha el Melah catchment, and the brown patch represents the Atlas Mountain Range. n denotes the number of days considered. Anomalies are clearly more emphasised during LFEs compared to during HPEs and during strong HPEs compared to during medium HPEs.
Atmospheric moisture content also shows clear anomaly signals during HPEs. Total column water increases over the catchment and upwind (southwest) of it, with larger anomaly amplitudes during strong and LFE-generating HPEs (Fig. 12). During LFE-generating HPEs, higher moisture values are seen near the Moroccan coastline and over the Atlantic Ocean as well. This emphasises the importance of moisture presence over both the Sahara (to the southwest of the catchment) and the North Atlantic.
In addition to anomalous wind, pressure, and humidity, HPEs are characterised by a negative surface temperature anomaly. Anomalously low surface temperatures (T at 2 m) are evident through all HPE classes, with a larger deviation for strong HPEs and even larger deviations for LFE-generating HPEs when compared to the yearly climatology (Fig. A7). Compared to the wet-season (September–May) climatology (Fig. A8), the negative anomaly is accentuated over the southwest of the catchment. This negative anomaly may represent below-cloud evaporative cooling, consistent with the evaporation of precipitation along the trajectory toward the catchment described in Sect. 4.2, advection of cold air from the ocean, or decreased surface warming due to the presence of clouds. However, taken together, evaporative cooling and the positive moisture anomaly upwind and over the catchment suggest that the repeated recycling of moisture through below-cloud evaporation (Sect. 4.2.2) is likely to be essential in the generation of strong HPEs and LFEs.
To investigate the importance of the domino process in more detail we compiled a composite of the moisture sources of all medium HPEs, strong HPEs, and LFE-generating HPEs using our trajectory-based MSD results. Thereby, we can show that the importance of moisture recycling through this domino process is likely to be considerable and intensifies with increased event magnitude. The origin of more than 60 % of the moisture throughout all HPEs is classified as coming from the desert (Fig. 13, orange-yellow colours). While the largest moisture-contributing region to HPEs is the Sahara and the vicinity of the Sebkha el Melah catchment, during LFE-generating HPEs, the role of the farther Sahara and even the Sahel is clearly more important than for strong and medium HPEs. During these non-lake-filling HPEs, the moisture originates from regions closer to the catchment, and higher contributions from the Atlantic and the Mediterranean are observed.
However, given the normally dry conditions over the surface of the Sahara, we can assume that mechanisms other than surface evaporation are involved in triggering such HPEs. Based on the evaporation of precipitation upwind (Fig. 10) and before the HPE starts (Fig. 8), we suggest that a pre-moistening of the atmosphere in the vicinity of the catchment is important for precipitation formation over Sebkha el Melah and that recycling of moisture in a domino-like way throughout the upstream region within the Sahara is significant for HPEs. We term this moisture-recycling mechanism the “domino effect”. Moisture from the tropics forms clouds and precipitates along the tropical plume. A large part of this precipitation evaporates or sublimates when falling into the relatively dry lower and middle troposphere (possibly forming virgae). Thereby, a vertical connection between the upper-level clouds transporting moisture of tropical origin and the lower-level dry airstream from the Sahel is established. This moisture thus gets recycled and transported further north into the catchment in a domino-like process, which may repeat itself several times along the transport pathway from the tropics into the Sahara and finally into the catchment. This recycling process likely contributes to destabilising the lower to middle troposphere, which, together with the large-scale convergence of moisture from different tropical sources (from the tropical North Atlantic and from the Sahel, Fig. 8; similar observations were made by Knippertz et al., 2003) and the forcing for ascent due to topography upon arrival in the catchment, leads to the formation of a large-scale deep convective system forming intense precipitation. Since, during the evaporation phase, no precipitation is detected by IMERG, it is difficult to estimate the magnitude of this domino effect. To confirm the significance of this process, in situ or ground observations, such as from rain gauges or weather radar, would be needed. Nevertheless, because of this process, the Sahara can be described as a moisture source induced by precipitation evaporation and not due to contributions from surface evaporation. This domino process should be further investigated in the future by numerical tracer experiments that allow us to follow the moisture from surface evaporation in specific regions (e.g. Dahinden et al., 2023) forward in time with model integration.
The MSD analysis reinforces the synoptic climatology observations (e.g. Fig. 12), which indicates that the domino effect is more important for LFEs. Smaller events receive moisture mainly from local moisture recycling over the nearby desert region, with supplemental moisture originating from the Atlantic and the Mediterranean regions. However, to generate enough precipitation to fill the lake, moisture recycled from farther away is necessary, brought from the tropics and recycled over the Sahel and the Sahara. With the MSD approach used in this study, it is not possible to identify the sources of the recycled moisture underway; however, in a future study, we plan to use a regional climate model with numerical tracers (as in Dahinden et al., 2023), which will allow us to identify the tropical regions from which the moisture from the mid- to upper-level cloud layers originates.
The second most important moisture source for HPEs is the Atlantic Ocean (Fig. 13, blue-green colours). Extratropical cyclones from the (North) Atlantic control the wind fields and bring moisture around the Atlas Mountains, especially during strong (non-LFE) HPEs (middle column in Fig. 13). The strong northerly winds over the North Atlantic (Fig. 12) advect dry midlatitude air over the relatively warmer subtropical ocean surface, thus increasing oceanic surface evaporation (Aemisegger and Papritz, 2018).
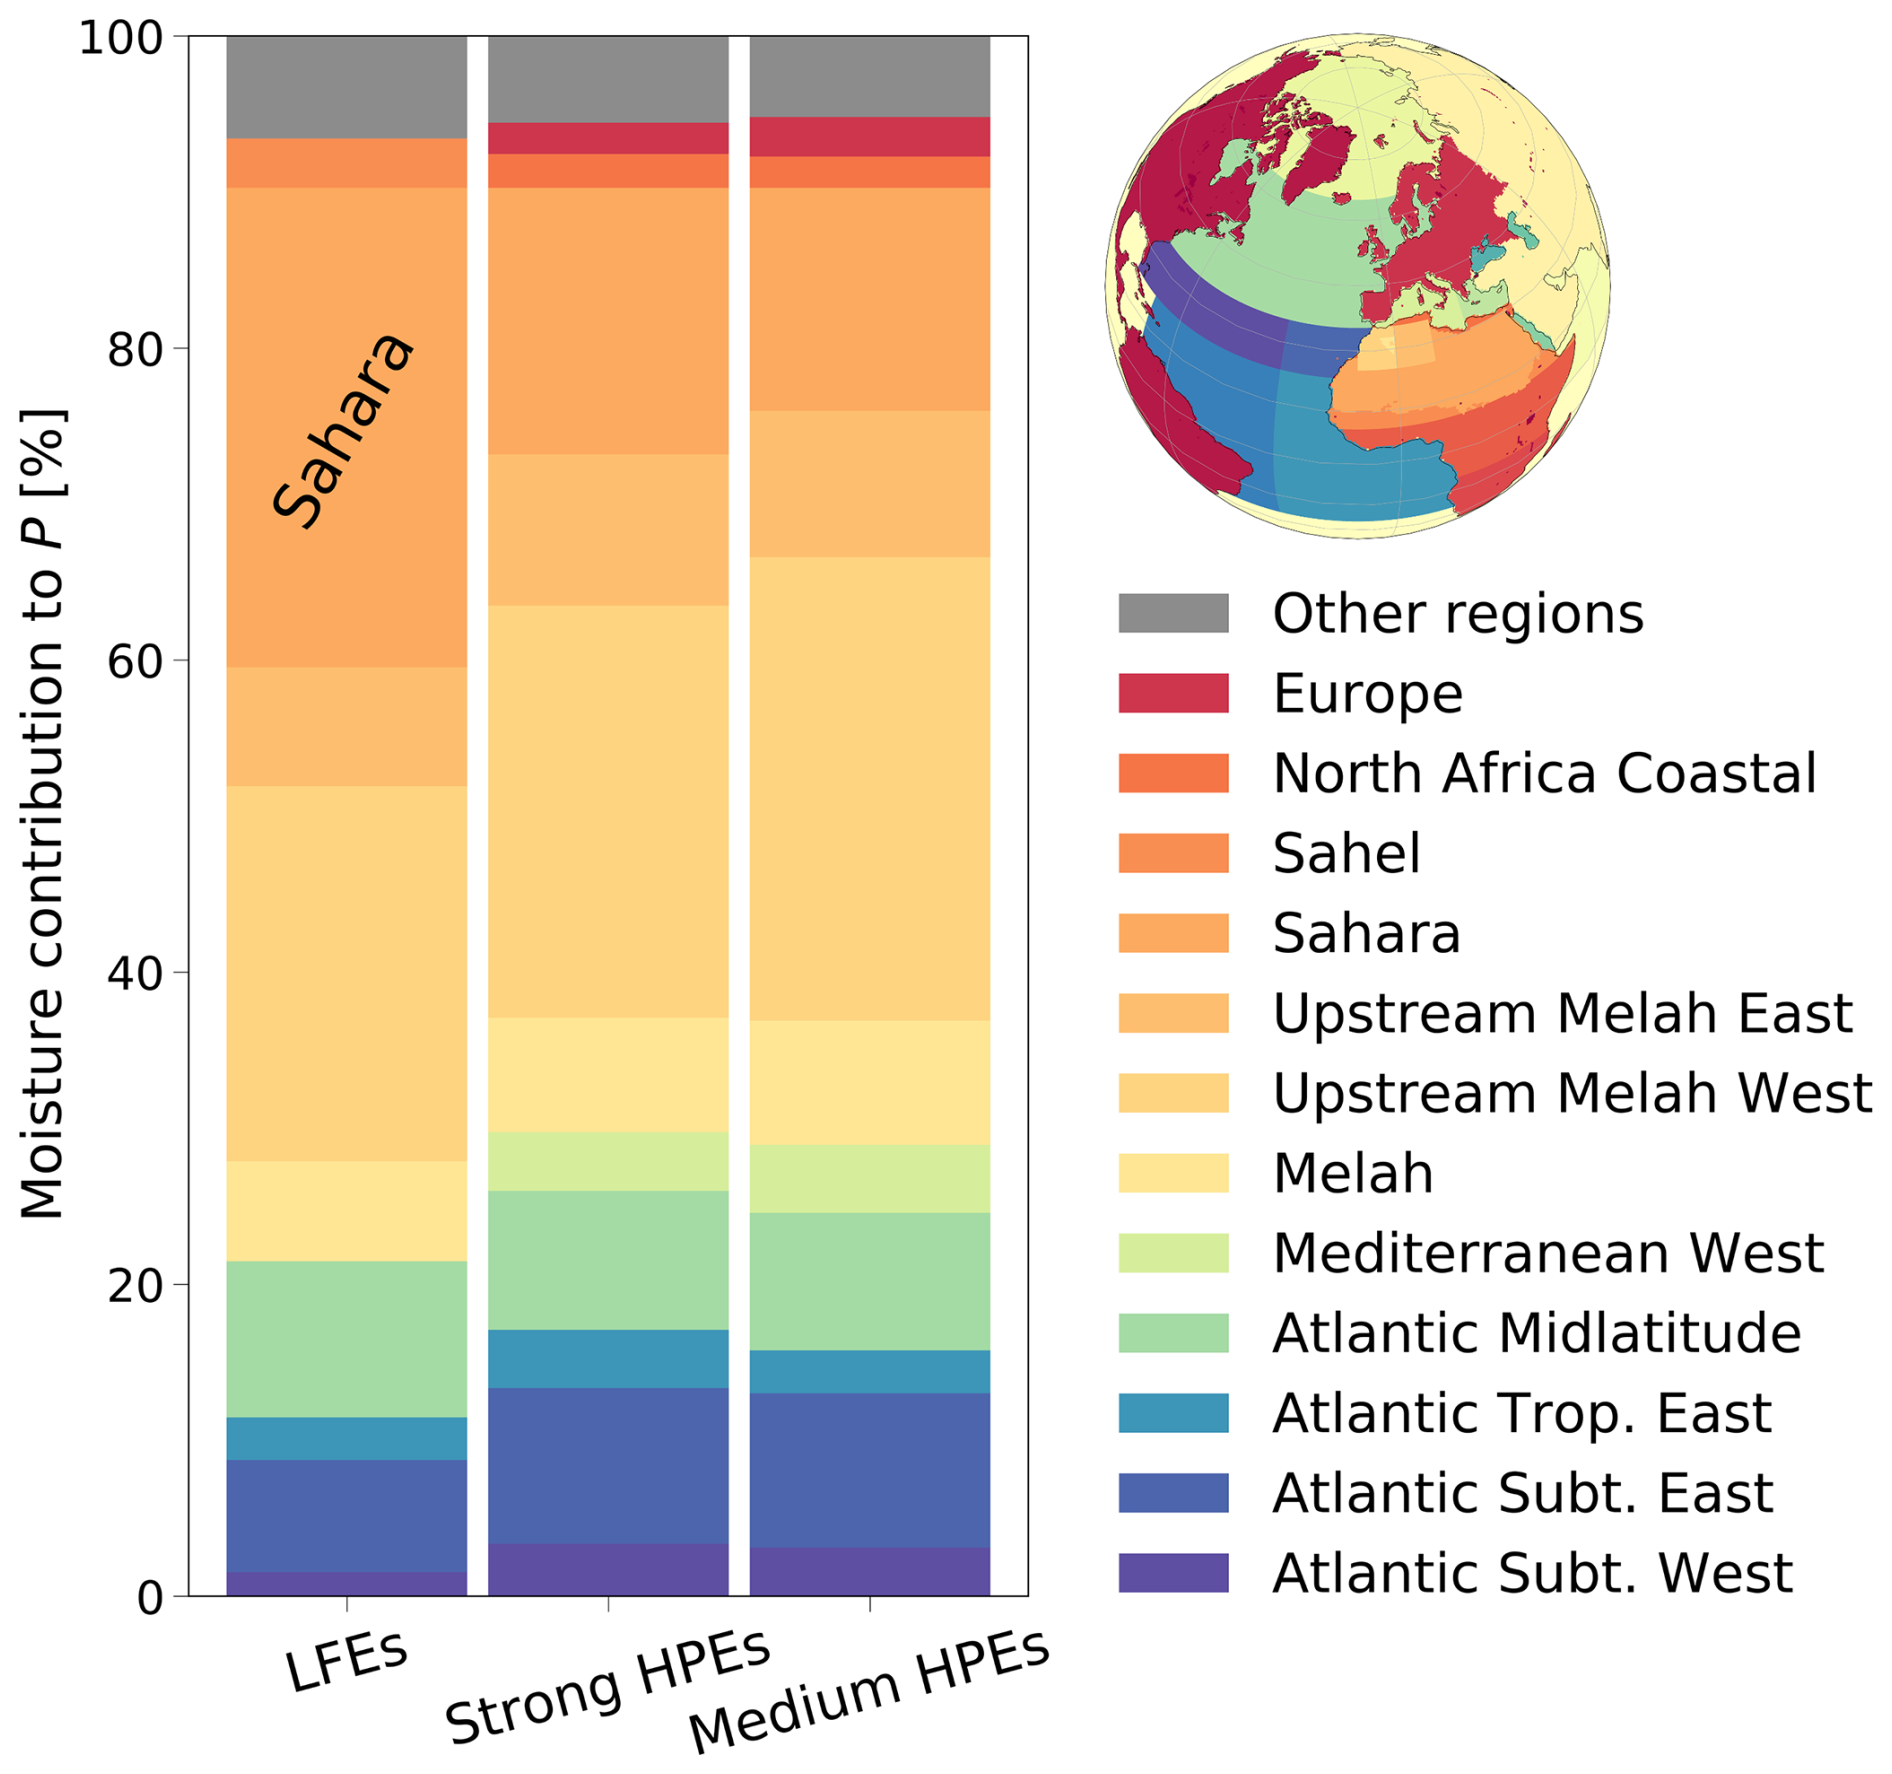
Figure 13Composite climatology of moisture sources for HPEs, composed from all of the analysed HPEs using the MSD. Columns represent contributions of different regions (legend and map on the right side and in Fig. 4b) for LFE-generating HPEs, strong HPEs, and medium HPEs. Regions displayed are only those that contributed more than 1.5 %. Values represent the attributed proportion of all precipitation during all HPEs in every category.
The purpose of this study is to better understand the meteorological ingredients needed for the occurrence of LFEs in the northwestern Sahara. Using remotely sensed precipitation data, we identified 250 HPEs over the catchment of Sebkha el Melah. We showed that the HPE magnitude is a good predictor for determining whether an HPE leads to the filling of the lake, with LFEs being induced by 8 of the 10 largest HPEs. In the 21 years between June 2000 and May 2021, these eight large HPEs resulted in six LFEs in Sebkha el Melah, with most LFEs resulting from only one HPE. These LFEs were quantified by applying the MNDWI to the time series of Landsat imagery and comparing the inundated area with the hypsometric curve of the lake. Higher precipitation amounts were found to lead to higher runoff coefficients, albeit large inter-event variability exists. The meteorological conditions during HPEs were evaluated based on the ERA5 reanalysis data, first for an exemplary high-magnitude LFE that occurred in November 2014 and then for all of the identified HPEs, stratified by their magnitude: LFE-triggering HPEs, strong HPEs, and medium HPEs. We have assessed the atmospheric ingredients prevailing during precipitation and highlighted the most important factors related to HPEs in general and LFE-triggering HPEs in particular. In addition to the various atmospheric variables analysed, we computed backward trajectories and tracked the sources of moisture contributing to precipitation.
5.1 Ingredients for HPEs in the northwestern Sahara
Two meteorological features are responsible for generating heavy precipitation in the northwestern Sahara. These features are normally absent, thus keeping the region generally dry. However, when present, generally for durations of more than 1 d (Fig. 5a), LFEs may occur. These features are (i) synoptic-scale promotion and (ii) mesoscale reinforcement for the ascent of air, in combination with abundant moisture.
Ascent induced by synoptic-scale and mesoscale systems. Processes at various scales are involved in the HPEs in the northwestern Sahara, ranging from the synoptic scale to the local scale. At the synoptic scale, we have shown the importance of PV structures and low-level extratropical cyclones (Sect. 4.2–4.3), which were previously also found to be important for different parts of Morocco (Chaqdid et al., 2023). Upper-level PV structures destabilise the lower atmosphere and give rise to ascent. Furthermore, both the upper-level PV structures and low-level extratropical cyclones induce winds, which favour the advection of moist air from the Atlantic, the lifting of air parcels, and the formation of deep clouds due to low-level convergence and the advection of moist air toward the topography of the Atlas Mountains.
Climatological analyses of upper-level PV cut-offs and low-level extratropical cyclones show that the formation of such systems along the Atlantic coast of Morocco is rather exceptional. The frequency of both upper-level PV cut-offs and surface cyclones near the Atlantic coast of Morocco is roughly < 5 % to 10 %, with the highest frequencies during winter and autumn (Wernli and Schwierz, 2006; Portmann et al., 2021). However, these two features do not necessarily co-occur, which highlights the exceptional situation needed for the formation of HPEs over the northwestern Sahara in today's climate. This finding may help to investigate past and future projections of HPEs over the southwestern Sahara, particularly in relation to shifts in the jet stream, Rossby wave breaking leading to the occurrence of upper-level PV cut-offs and surface cyclones (e.g. de Vries, 2021). Additionally, the presence of upper-level PV features and low-level cyclones does not warrant the formation of a HPE, and further studies are needed to determine the frequency of these features without HPE formation.
On smaller scales, lifting mechanisms are connected to the wind field induced by the cyclone along the western coast of Morocco. Southerly to southwesterly winds force air parcels to travel over the Atlas Mountain chain. This either directly lifts air parcels enough to generate orographic precipitation or helps to overcome the convective inhibition that suppresses free convection. Furthermore, wind convergence can reinforce this ascent of air parcels. When convergence occurs upwind of the catchment (e.g. Fig. 7), it can support the formation of precipitation, inducing the moisture recycling process described above as a domino effect.
On the smallest scale, the daily cycle of HPEs (Fig. 11) indicates a contribution of free convection to the precipitation formation, with peak intensities observed in the evening in all seasons. However, it must be noted that convective precipitation is probably not sufficient to generate significant HPEs and LFEs; no LFEs are identified when the surface is warmest, i.e. in summer and in the other seasons convection happens mainly in connection with a synoptic-scale system (e.g. Fig. 12). Therefore, while short-lived deep convection is important for HPEs, triggering and enhancing precipitation in the northwestern Sahara, it requires larger-scale forcing as well.
Moisture abundance. The most important moisture sources for precipitation in the region are (1) local sources from precipitation recycling within the catchment and its surroundings (∼ 65 %) and (2) remote sources such as the North Atlantic, the Sahel, or the Mediterranean (∼ 30 % combined; Fig. 13).
In the desert, the importance of nearby moisture sources may seem surprising as actual evaporation from the surface is close to zero. However, we suggest that this moisture is actually mostly recycled; moisture diagnosed here as being taken up over the Sahara does not come from direct surface evaporation but rather from moistening through precipitation evaporation and sublimation and mixing due to the convergence of air parcels and convection (Dahinden et al., 2023). This means that this moisture might have originally come from other sources compared to the ones identified here, most likely from the tropics and the North Atlantic – upwind of the identified moisture sources. Cloud formation in squall lines or other mesoscale convective systems and tropical plumes is a potential candidate which fuels moisture transport into the southwestern outskirts of the Sahara, where it can precipitate, be recycled, and be transported deeper into the desert by the southerly flow. This sequence is repeated in a domino-like manner until the catchment region is reached, thus contributing “Saharan-flagged” moisture to the HPEs in our applied moisture source diagnostic approach. In addition, this aerial precipitation recycling process is supplemented by continental recycling and, thus, surface evaporation of the moisture remaining from recent precipitation events, which is common mainly in autumn (see, for example, the November 2014 case study (Sect. 4.2), Figs. 8 and A3). It is important to note that moisture sources in this study are analysed using one reanalysis product, as commonly done in MSD studies (e.g. Sodemann et al., 2008); however, if another reanalysis is used, results may slightly differ. In this regard, we do not expect the result to differ drastically between datasets because of the relatively good representation of synoptic-scale flows in modern reanalyses, even over the in situ-data-scarce region of North Africa (Zhou et al., 2023).
While several types of synoptic or mesoscale systems can contribute to cloud formation upwind of the Sahara, to transport this moisture deep into the desert, persistent southwesterly flows are needed. These flows occur in the middle to upper levels of the troposphere whenever a southward-intruding upper-level trough is present at the edge of the northwestern Sahara or over the Atlantic coast, which is indeed the case during the identified HPEs (Fig. 12). The related cyclones accumulate moisture from the Atlantic Ocean over their life cycle and precipitate during their passage into the Sahara and the catchment of Sebkha el Melah. This type of tropical–extratropical interaction was previously associated with tropical plumes (Knippertz et al., 2003; Knippertz, 2003; Rubin et al., 2007; Skinner and Poulsen, 2016).
5.2 Characteristics that differentiate between LFE-triggering, strong, and medium HPEs
Three conditions seemingly determine LFEs. These are the (a) lifting mechanism, (b) wind conditions, and (c) moisture source, which are described below.
LFEs need a strong and long-lasting lifting mechanism, which is maintained by the coupling of large-scale forcing and the mesoscale convective forcing. Persistence of upper-level conditions conducive to air lifting can happen, for example, when a strong, northward-extending, blocking high is situated upwind in the central North Atlantic Ocean. An example of this is given by the November 2014 case study (Sect. 4.2), where PV structures appear repeatedly in the vicinity of the catchment and a high persists over the central North Atlantic. At the same time, the persistent conditions allow for increased moisture transport from the southwest (e.g. Fink and Knippertz, 2003; Knippertz and Martin, 2005) and continuous formation of rain cells and, therefore, also for a longer rainfall duration and larger areal coverage, which are needed to generate intense desert floods (e.g. Doswell et al., 1996; Morin and Yakir, 2014). These conditions lead to relatively long-duration HPEs, with typical durations of 3 d for the LFE-triggering HPEs.
The wind conditions are related to the large-scale forcing. Orographic lifting only appears when the wind is strong enough and directed close to perpendicular toward the Atlas Mountains (i.e. southerly winds, similar to what was shown by Froidevaux and Martius (2016) for heavy precipitation in the Alps), such that the air parcels are forced to rise, making it possible to overcome the typical subsidence aloft. However, it seems that the essential ingredient is not the south-to-southwesterly wind within the catchment but actually the southwesterly flow that circumvents most of the High Atlas Mountains from the south such that the moisture is not lost to precipitation beforehand. These winds blow with higher velocities when the low-level cyclone is relatively deep and situated close to the western coast of Morocco (Fig. A7).
Lastly, to obtain enough moisture for creating heavy precipitation, it needs to be transported not only from the surrounding regions but also from faraway, specifically from tropical Africa and the midlatitude North Atlantic, being transported and recycled by the domino effect once it has reached the edge of the Sahara. Favourable conditions for such long-range-transport events are also obtained when the winds are stronger and blow from the southwest. The non-lake-filling HPEs show a less pronounced recycling process of moisture in the Sahara. The major part of the moisture for these events originates from the nearby upstream region, and the moisture uptake is, in general, weaker than for LFEs (Figs. 11, 13).
When all the above conditions are met, the precipitation that falls in the catchment of Sebkha el Melah has a higher potential to fill the lake. Namely, events are generally longer (2–5 d compared with 1 d on average for the non-lake-filling HPEs) and have high precipitation volumes. While the volume itself may not be sufficient to determine whether the lake gets filled (since few of the heaviest precipitation events did not fill the lake), the HPE magnitude (Sect. 3.2.1) is quite a good determinant for lake filling. Out of the 10 highest flood magnitude HPEs, 8 produced LFEs. This means that high-intensity precipitation needs to be rather spatially focused and located over the runoff-contributing areas of the catchment (Sect. 2) to overcome infiltration rates and generate high-magnitude surface runoff and flows in the streams.
5.3 From precipitation to runoff: effective runoff coefficients
Effective runoff coefficient, namely, the portion of precipitation that ends up in the lake, is one of the most important but non-resolved factors in relating paleo-lakes to paleo-climatic conditions (e.g. Quade et al., 2018). Runoff coefficients are generally not available for large desert catchments, especially at the event scale (Merz et al., 2006; Enzel et al., 2015). At the annual scale, considering the fact that it rains every year but the lake remains empty most of the time, effective runoff coefficients are expected to be close to zero. The runoff coefficients presented here are, to the best of our knowledge, the first to be obtained over the Sahara which represent the actual ratio between event precipitation and lake volume. Annual runoff coefficients in AHP literature range from ∼ 10 % to ∼ 30 % (annual values; e.g. Kutzbach, 1980; Coe and Harrison, 2002; Enzel et al., 2015; Bouchez et al., 2019). Here, we show that the event-based effective runoff coefficients in the basin range over about 5 orders of magnitude, from % to % (Fig. 5b). The higher runoff coefficient values are presumably related to precipitation over the parts of the catchment where rocky surfaces are exposed in combination with higher rainfall intensities, as well as longer rainfall durations and shorter inter-event periods. All these aspects increase the runoff-contributing area and its contribution to flood discharge (e.g. Rinat et al., 2021). The obtained runoff coefficient values are in line with the results of Wasko and Guo (2022) based on gridded rainfall data in Australia, but only a few of the catchments in their study are large, arid catchments. The construction of dams in the catchment is expected to lower the effective runoff coefficient. However, large HPEs are not expected to be heavily affected; the main dam in the catchment can only contain ∼ 0.25 km3 (Sarra et al., 2023), which is ∼ 4 % of the mean catchment rainfall in the largest HPE (Fig. 5a).
Desert lakes are commonly relatively small compared to their catchment area; therefore, effective runoff coefficients control the filling of these lakes, with only a minor filling contribution from direct rainfall over the lake (Quade et al., 2018). Therefore, when reconstructing the water budget of a desert lake, slight shifts in the values of the effective runoff coefficient lead to large deviations in the estimation of lake volumes. With the 21 years of data, the largest effective runoff coefficient values we estimate here per event are on the order of 10 %, and most are well below (Fig. 5b). These are very low values compared to the ones used in estimating paleo-rainfall during the AHP based on hydrological and radiative budgets (e.g. Kutzbach, 1980; Coe and Harrison, 2002). Here, we showed that higher runoff coefficients seem to be related to higher rainfall event depths and shorter inter-event dry periods. Therefore, based on present-day observations, we suggest that the filling and maintaining of Saharan lakes can be related to the intensity of individual events and changes in their frequency. In other words, if high-magnitude events are more frequent, the annual runoff coefficient is expected to increase even if the mean annual rainfall remains the same. Since it could take years for lakes to empty out through evaporation (e.g. Fig. 3c), a higher frequency of years with such high-magnitude events can maintain filled lakes with no change in the mean annual rainfall. Moreover, given the presented modern observations, a large-scale northward shift of the African monsoon during AHPs may not be necessary. Rather, a higher tendency of extratropical cyclones could produce increased lake levels. Therefore, while climate models struggle in shifting the African monsoon as far north as in filling lakes in the northwestern Sahara, an increased frequency of southward-intruding extratropical cyclones can potentially produce a similar result. We do not mean to imply that no change in precipitation occurred during the AHP; rather, we suggest that the magnitude of the change might have been less important compared to changes in the intensity and frequency of HPEs or that the type of change needed was previously undervalued. One major implication of this suggestion is that, to effectively model precipitation changes during past (or future) periods in the Sahara, relatively small-scale changes in precipitation need to be accounted for, calling for high-resolution model simulations. Given that precipitation during Saharan HPEs is largely convective, as discussed in Sect. 4.3, in order to accurately simulate changes in both precipitation and runoff, models need to be able to resolve convective-scale processes, which reaffirms conclusions made by both Folwell et al. (2022) and Jungandreas et al. (2023).
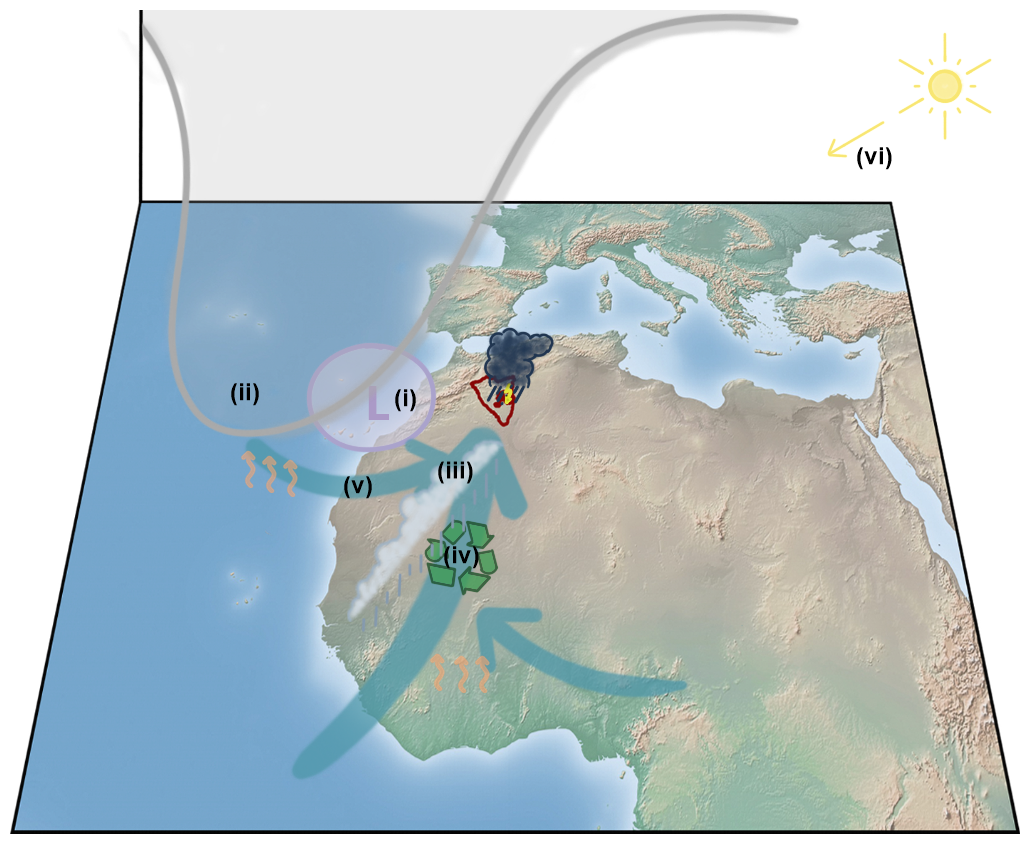
Figure 14Schematic summary of the major ingredients involved in filling Sebkha el Melah: (i) extratropical low-level cyclone (violet patch), (ii) southward-intruding upper-level PV structure (grey), (iii) moisture convergence (turquoise arrows), (iv) moisture recycling over the Sahara (domino process), (v) southwesterly wind bypassing the Atlas Mountains and lifted orographically on the rain shadow side of the mountains, and (vi) surface heating and convection triggering. The Sebkha el Melah catchment is marked in red. The basemap was made with Natural Earth.
Based on remote sensing of HPEs and LFEs, we show in this study the key ingredients involved in the most extreme HPEs that lead to the filling of Sebkha el Melah in the northwestern Sahara (Fig. 14). These ingredients are as follows:
-
a single (or a succession of) anomalously deep, long-lasting, extratropical low-level cyclone(s) (Fig. 14, i) accompanied by an upper-level PV feature (ii) to the west of the catchment (these enable both large-scale air ascent and the flow of air around the Atlas Mountains (v));
-
moisture convergence from the tropics (tropical plume) and North Atlantic (iii) and moisture recycling (domino process) upstream of the catchment (iv);
-
coupled or sequential lifting processes, specifically orographic lifting (mountains), upper-level forcing, and surface heating (vi).
The combination of these ingredients not only enables the rare formation of rainfall in this arid region but also helps in promoting heavy precipitation, floods, and the filling of Sebkha el Melah. Specifically, the most intense HPEs, the ones leading to LFEs, differ from less extreme HPEs by exhibiting stronger moisture convergence and advection of moist air around the Atlas Mountains. The moisture recycling domino process plays a significant role in contributing high amounts of moisture to the catchment, enabling a high precipitation volume. A small but highly variable fraction (–) of the precipitation volume makes it all the way to Sebkha el Melah. There, even without additional HPEs, water can persist for many months up to years. Other Saharan lakes, suggested to be filled in wetter periods in the past, potentially receive contributions from similar processes; their initial filling and persistence might reflect a change in the intensity, frequency, or type of events rather than a change (only) in the mean precipitation.
In a nutshell, this study has shed light on the relevant combination of dynamical ingredients needed to form the heavy precipitation in the northwestern Sahara that induces subsequent lake filling. This knowledge is relevant for long-term water resource management strategies in Saharan countries. In addition, the insights we presented provide new fundamental atmospheric-process understanding that can help in evaluating potential future and past greening of the Sahara.
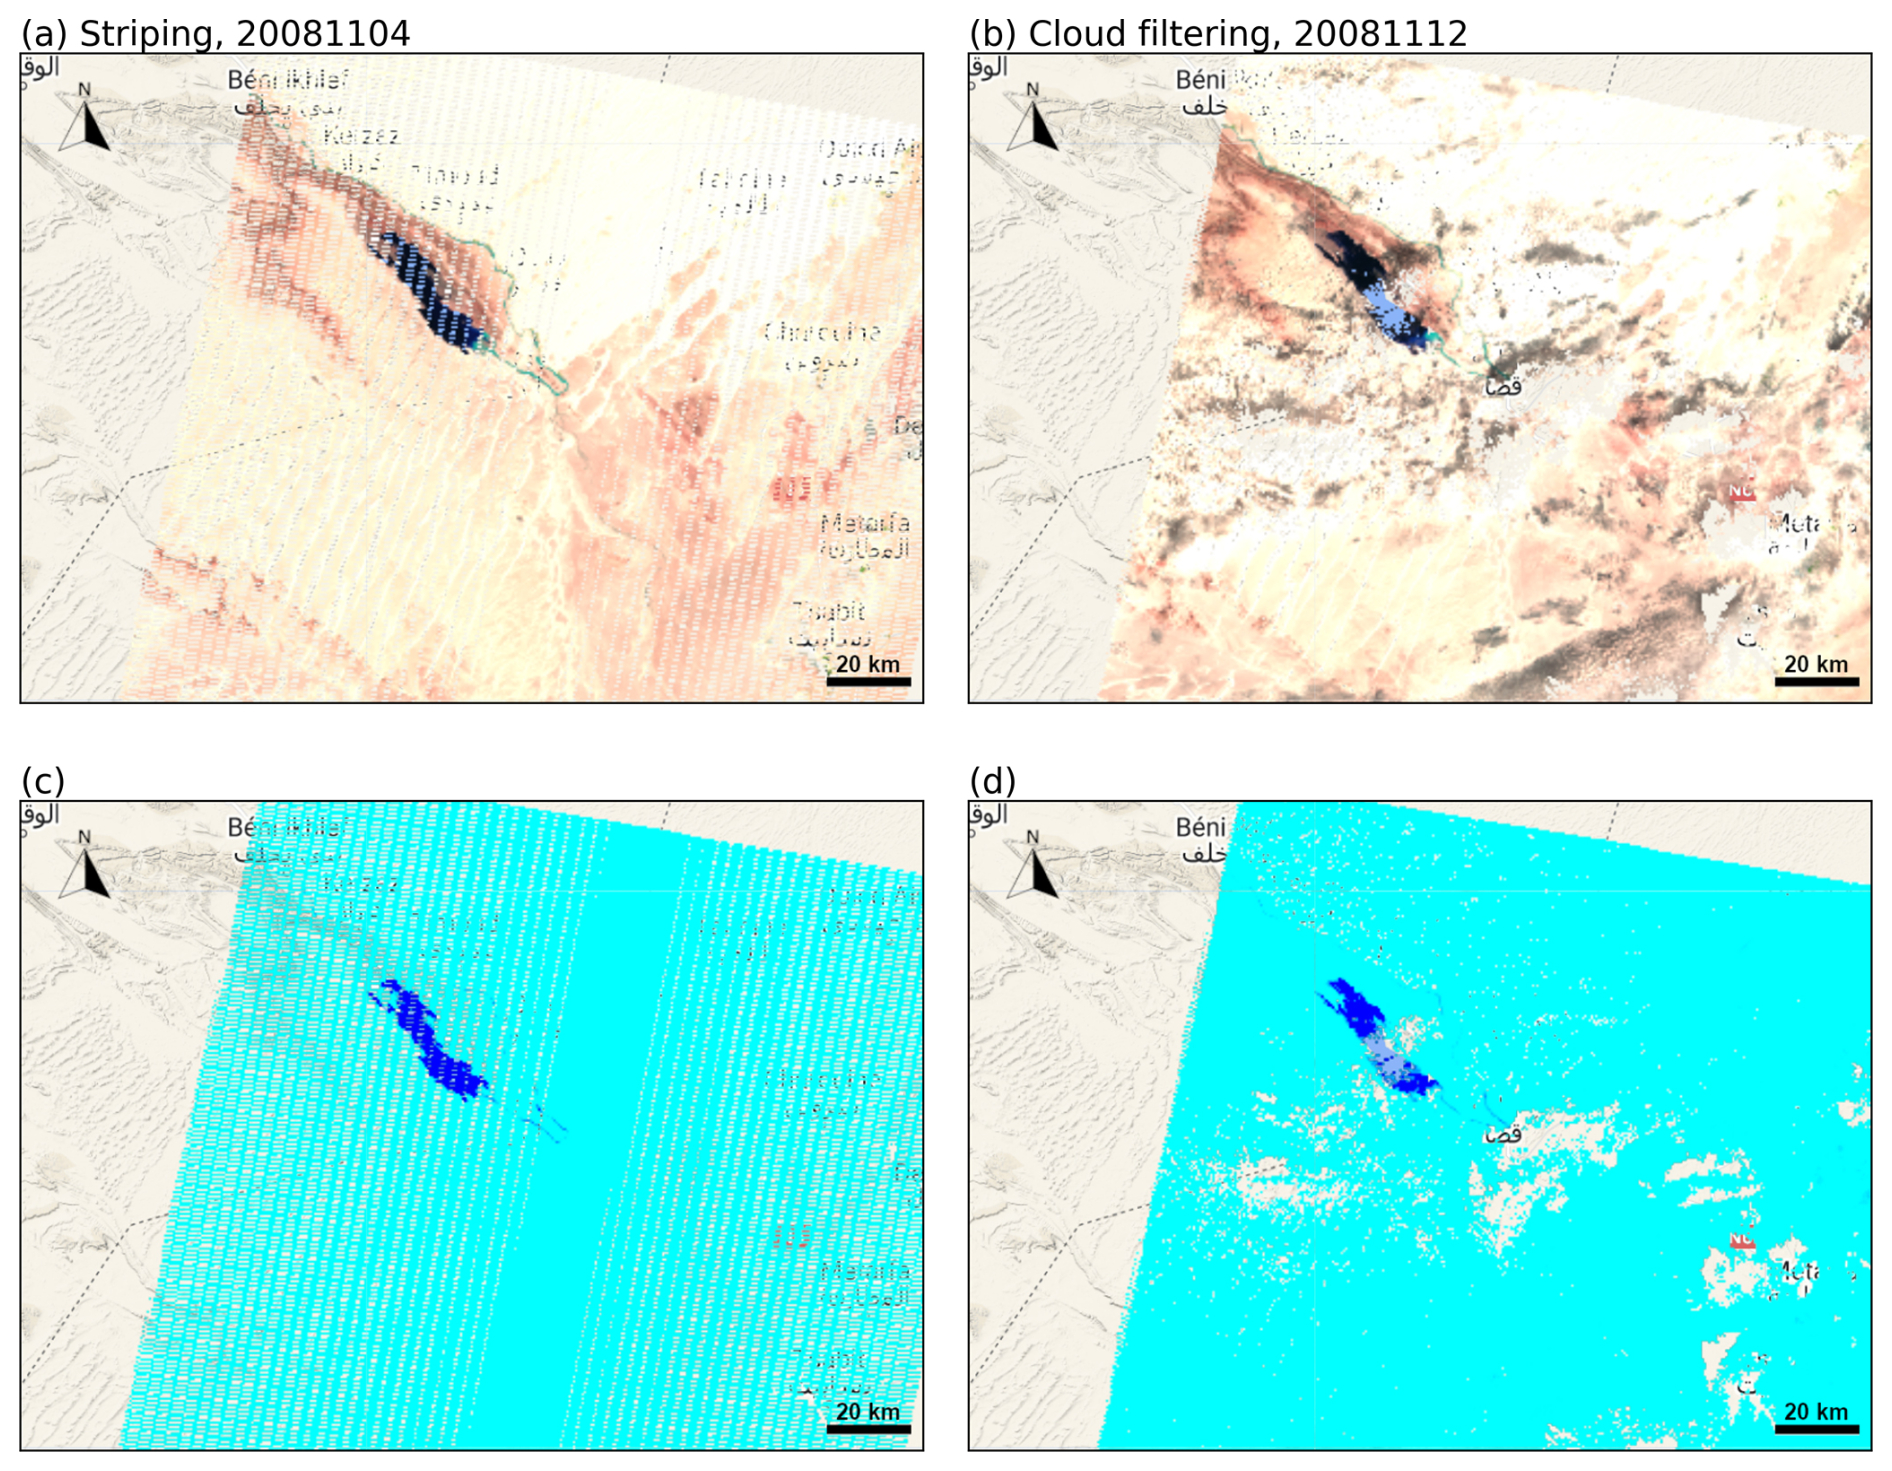
Figure A1Examples of MNDWI-based lake area identification errors. Panels (a) and (c) show Landsat-7's striping errors, and panels (b) and (d) show cloud-filtering errors. The blue layer represents the MNDWI-based water identification, with dark blue indicating water areas.
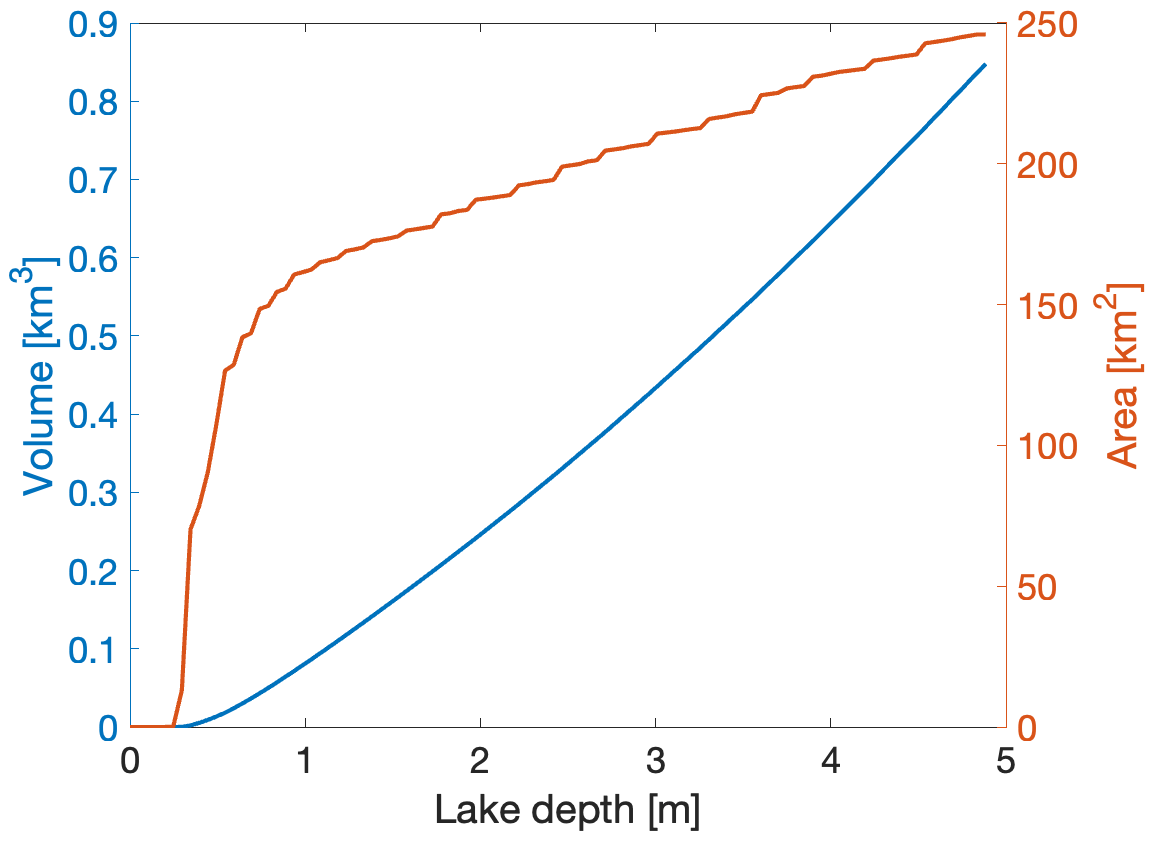
Figure A2The hypsometric curve of Sebkha el Melah for the conversion of lake area to volume based on the bathymetry estimates from Armon et al. (2020).
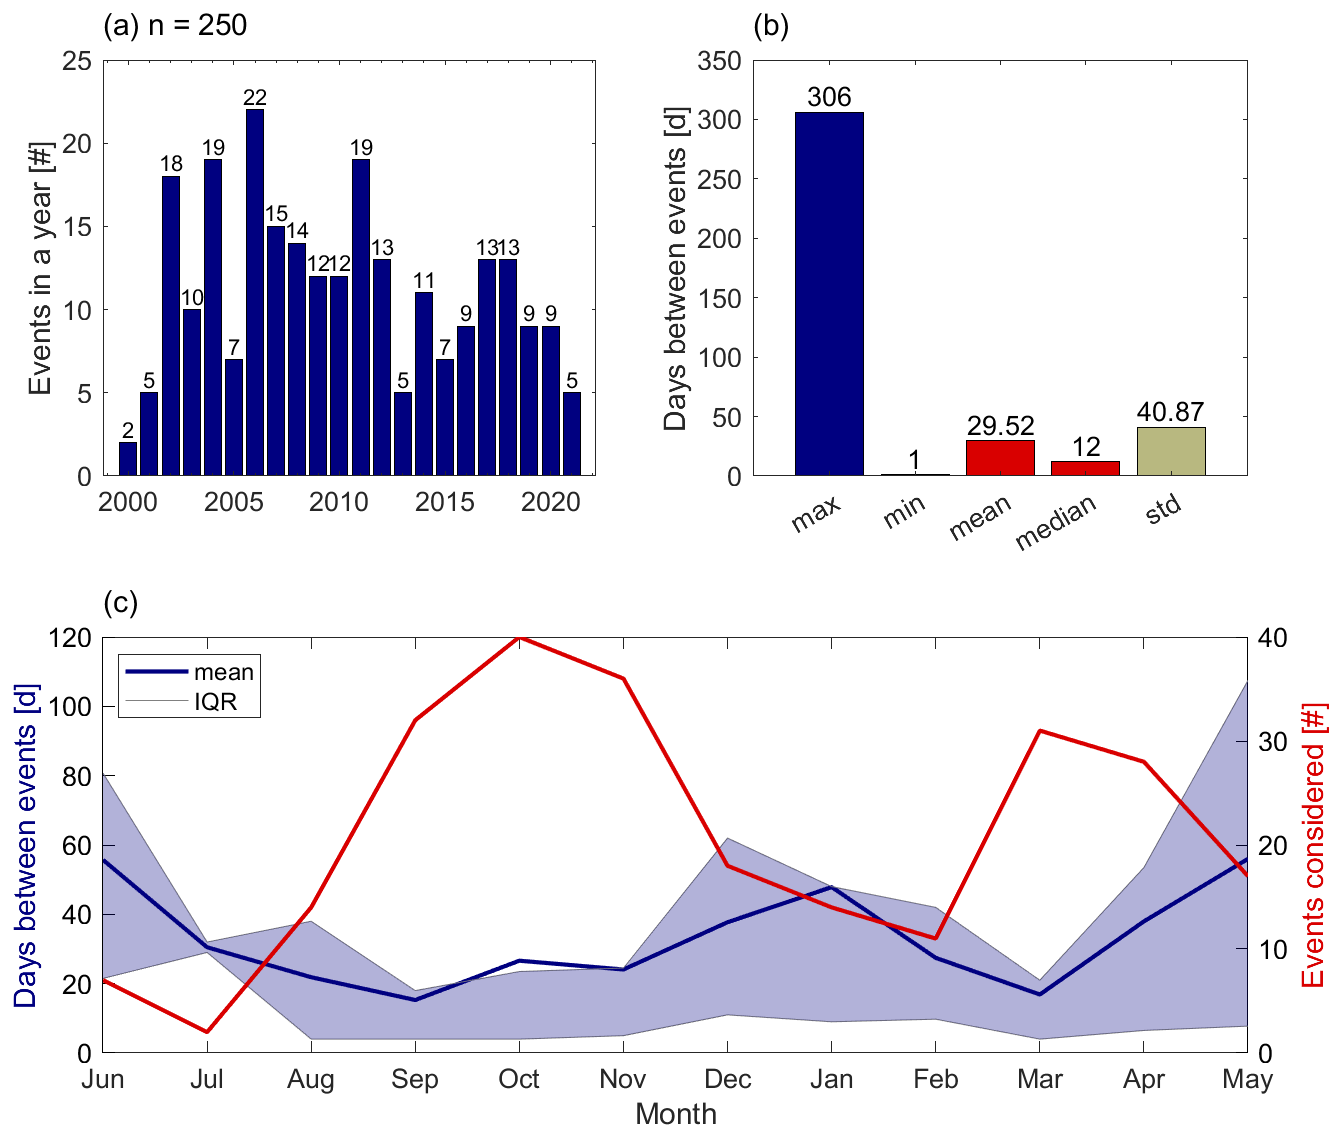
Figure A3HPE occurrence (June 2000–May 2021). (a) Yearly number of HPEs (labelled bars); n=250 is the number of HPEs considered. (b) Statistical properties of the inter-event periods (bars). (c) Yearly cycle of the inter-event period (left axis; blue line shows mean, blue shading shows inter-quantile range (IQR)) and the identified HPEs (right axis; red line) for the observation period.
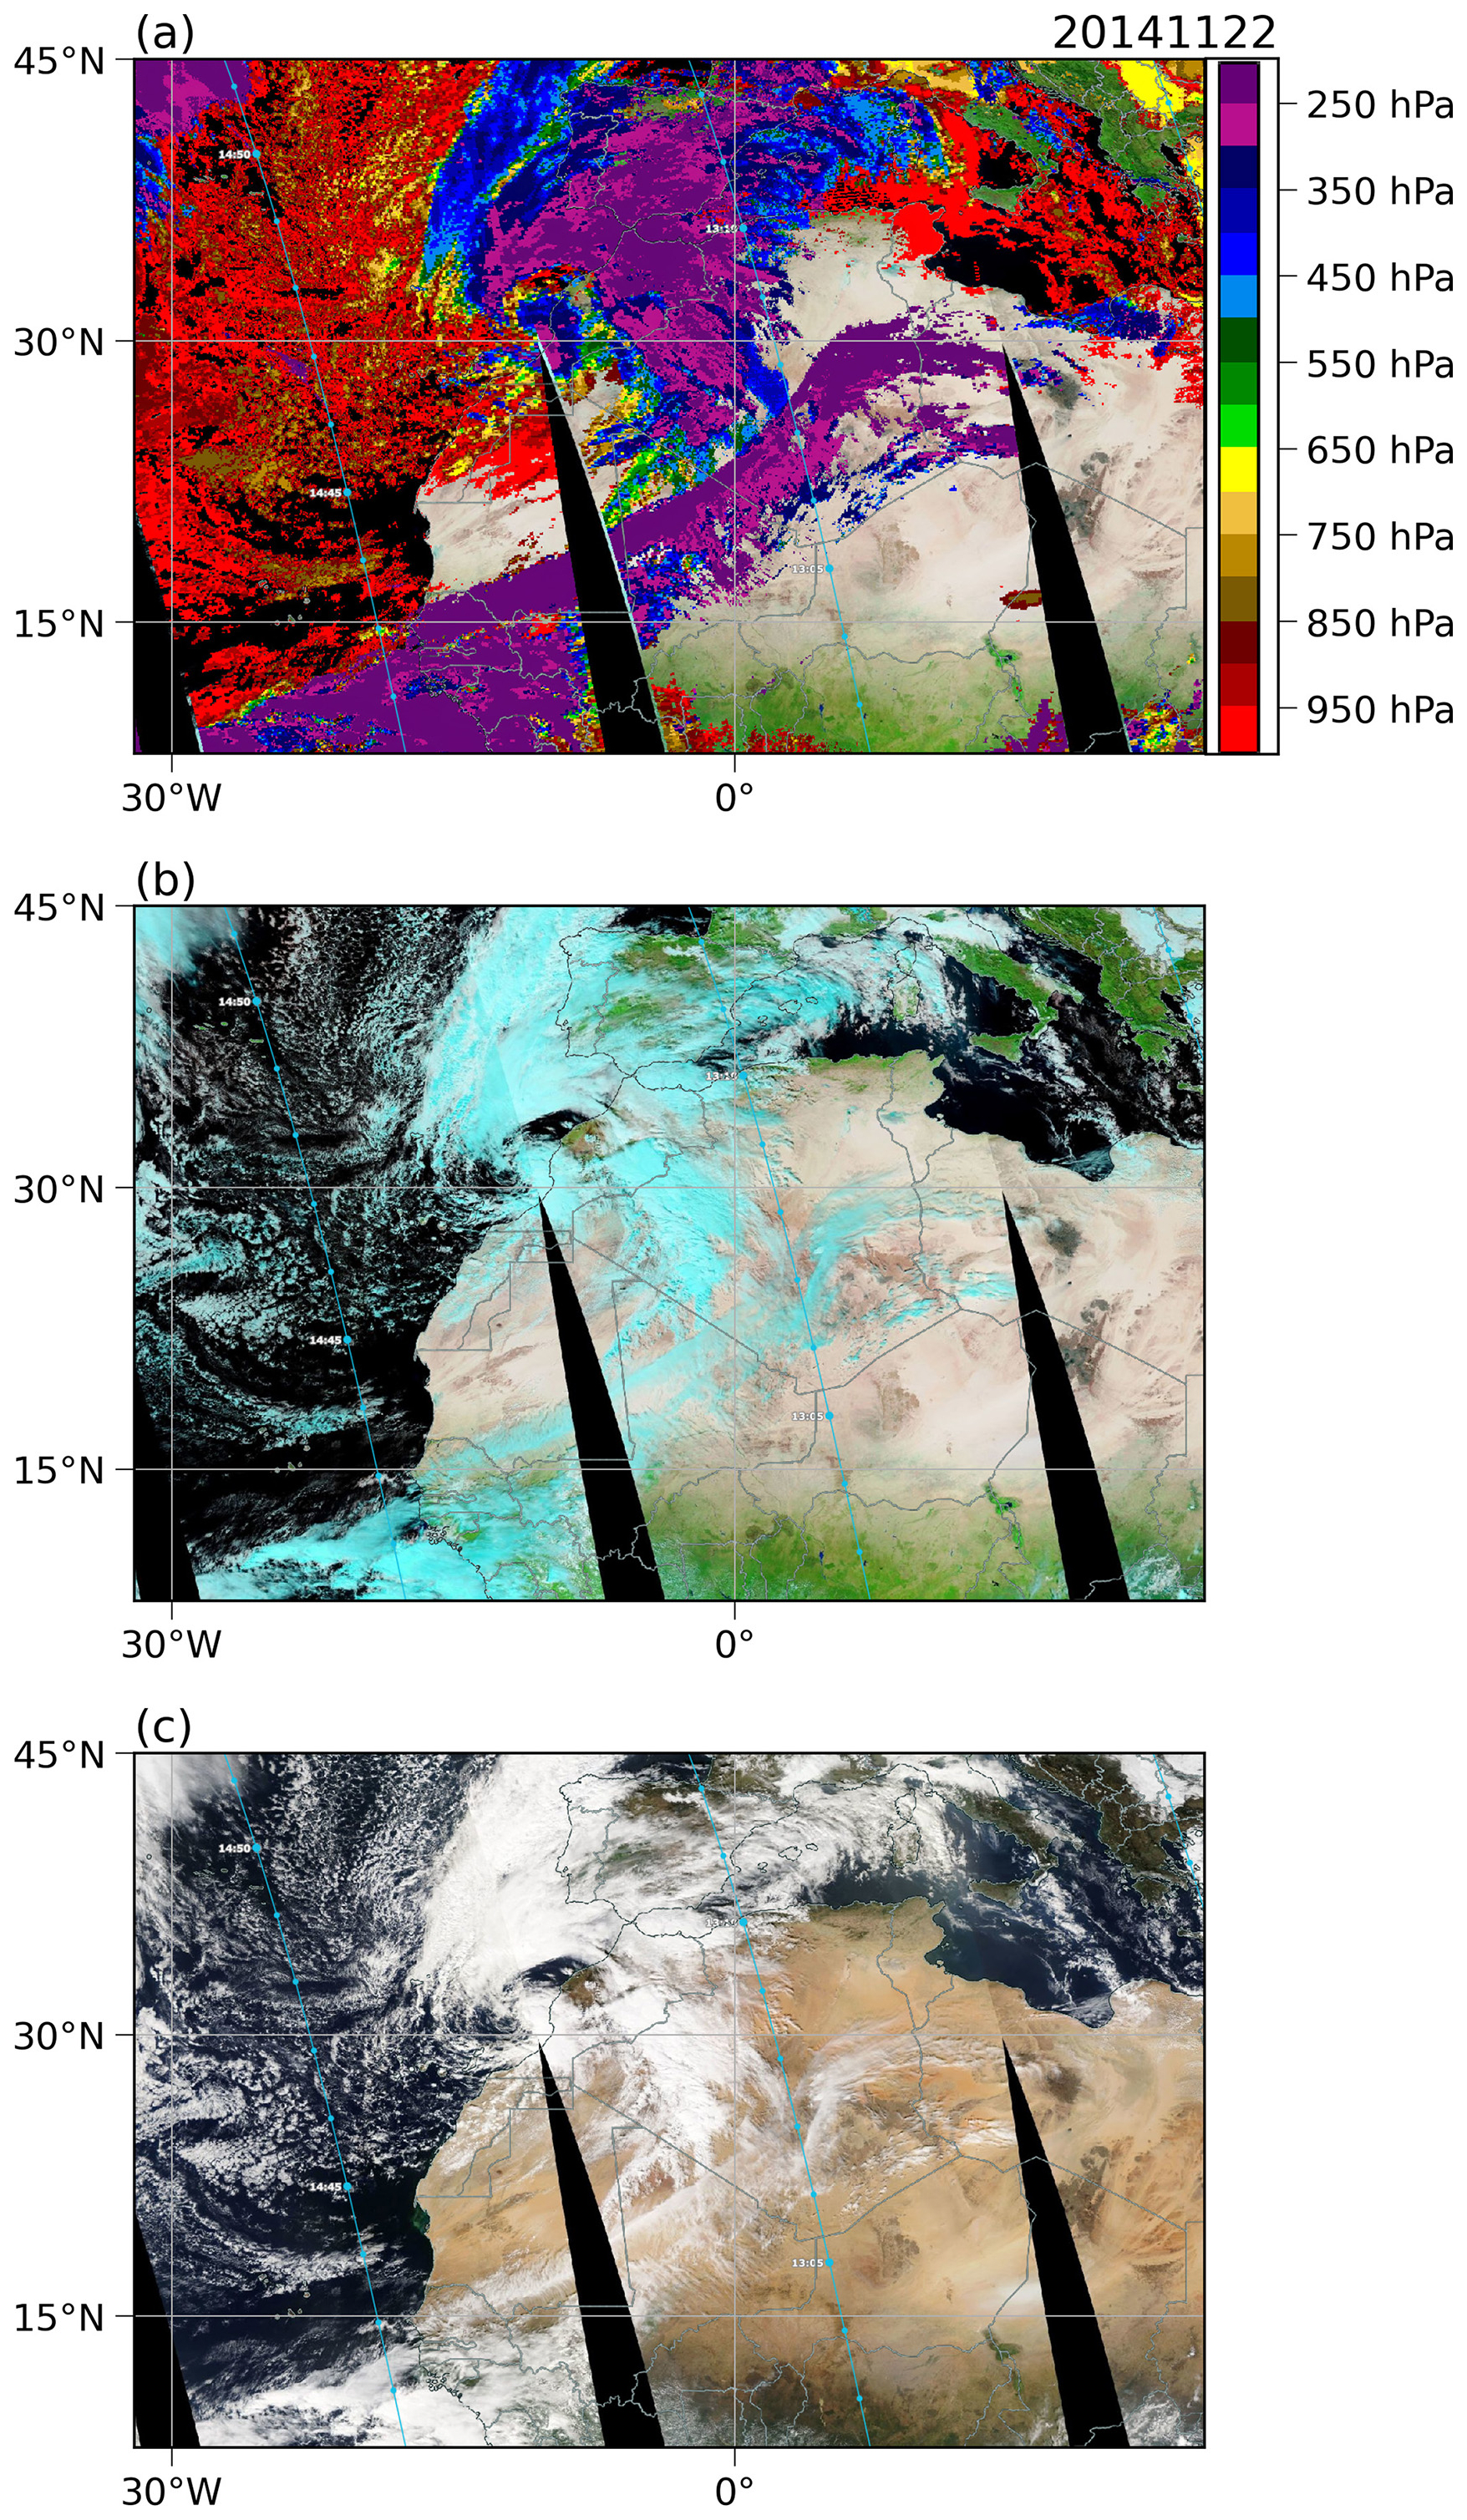
Figure A4Cloud cover (22 November 2014; HPE5.1, Sect. 4.2) from MODIS Aqua satellite observations (NASA Worldview). (a) Cloud top pressure (CTP), (b) corrected reflectance bands 7–2–1, and (c) corrected reflectance true colour. The blue line indicates the satellite path and its crossing time.
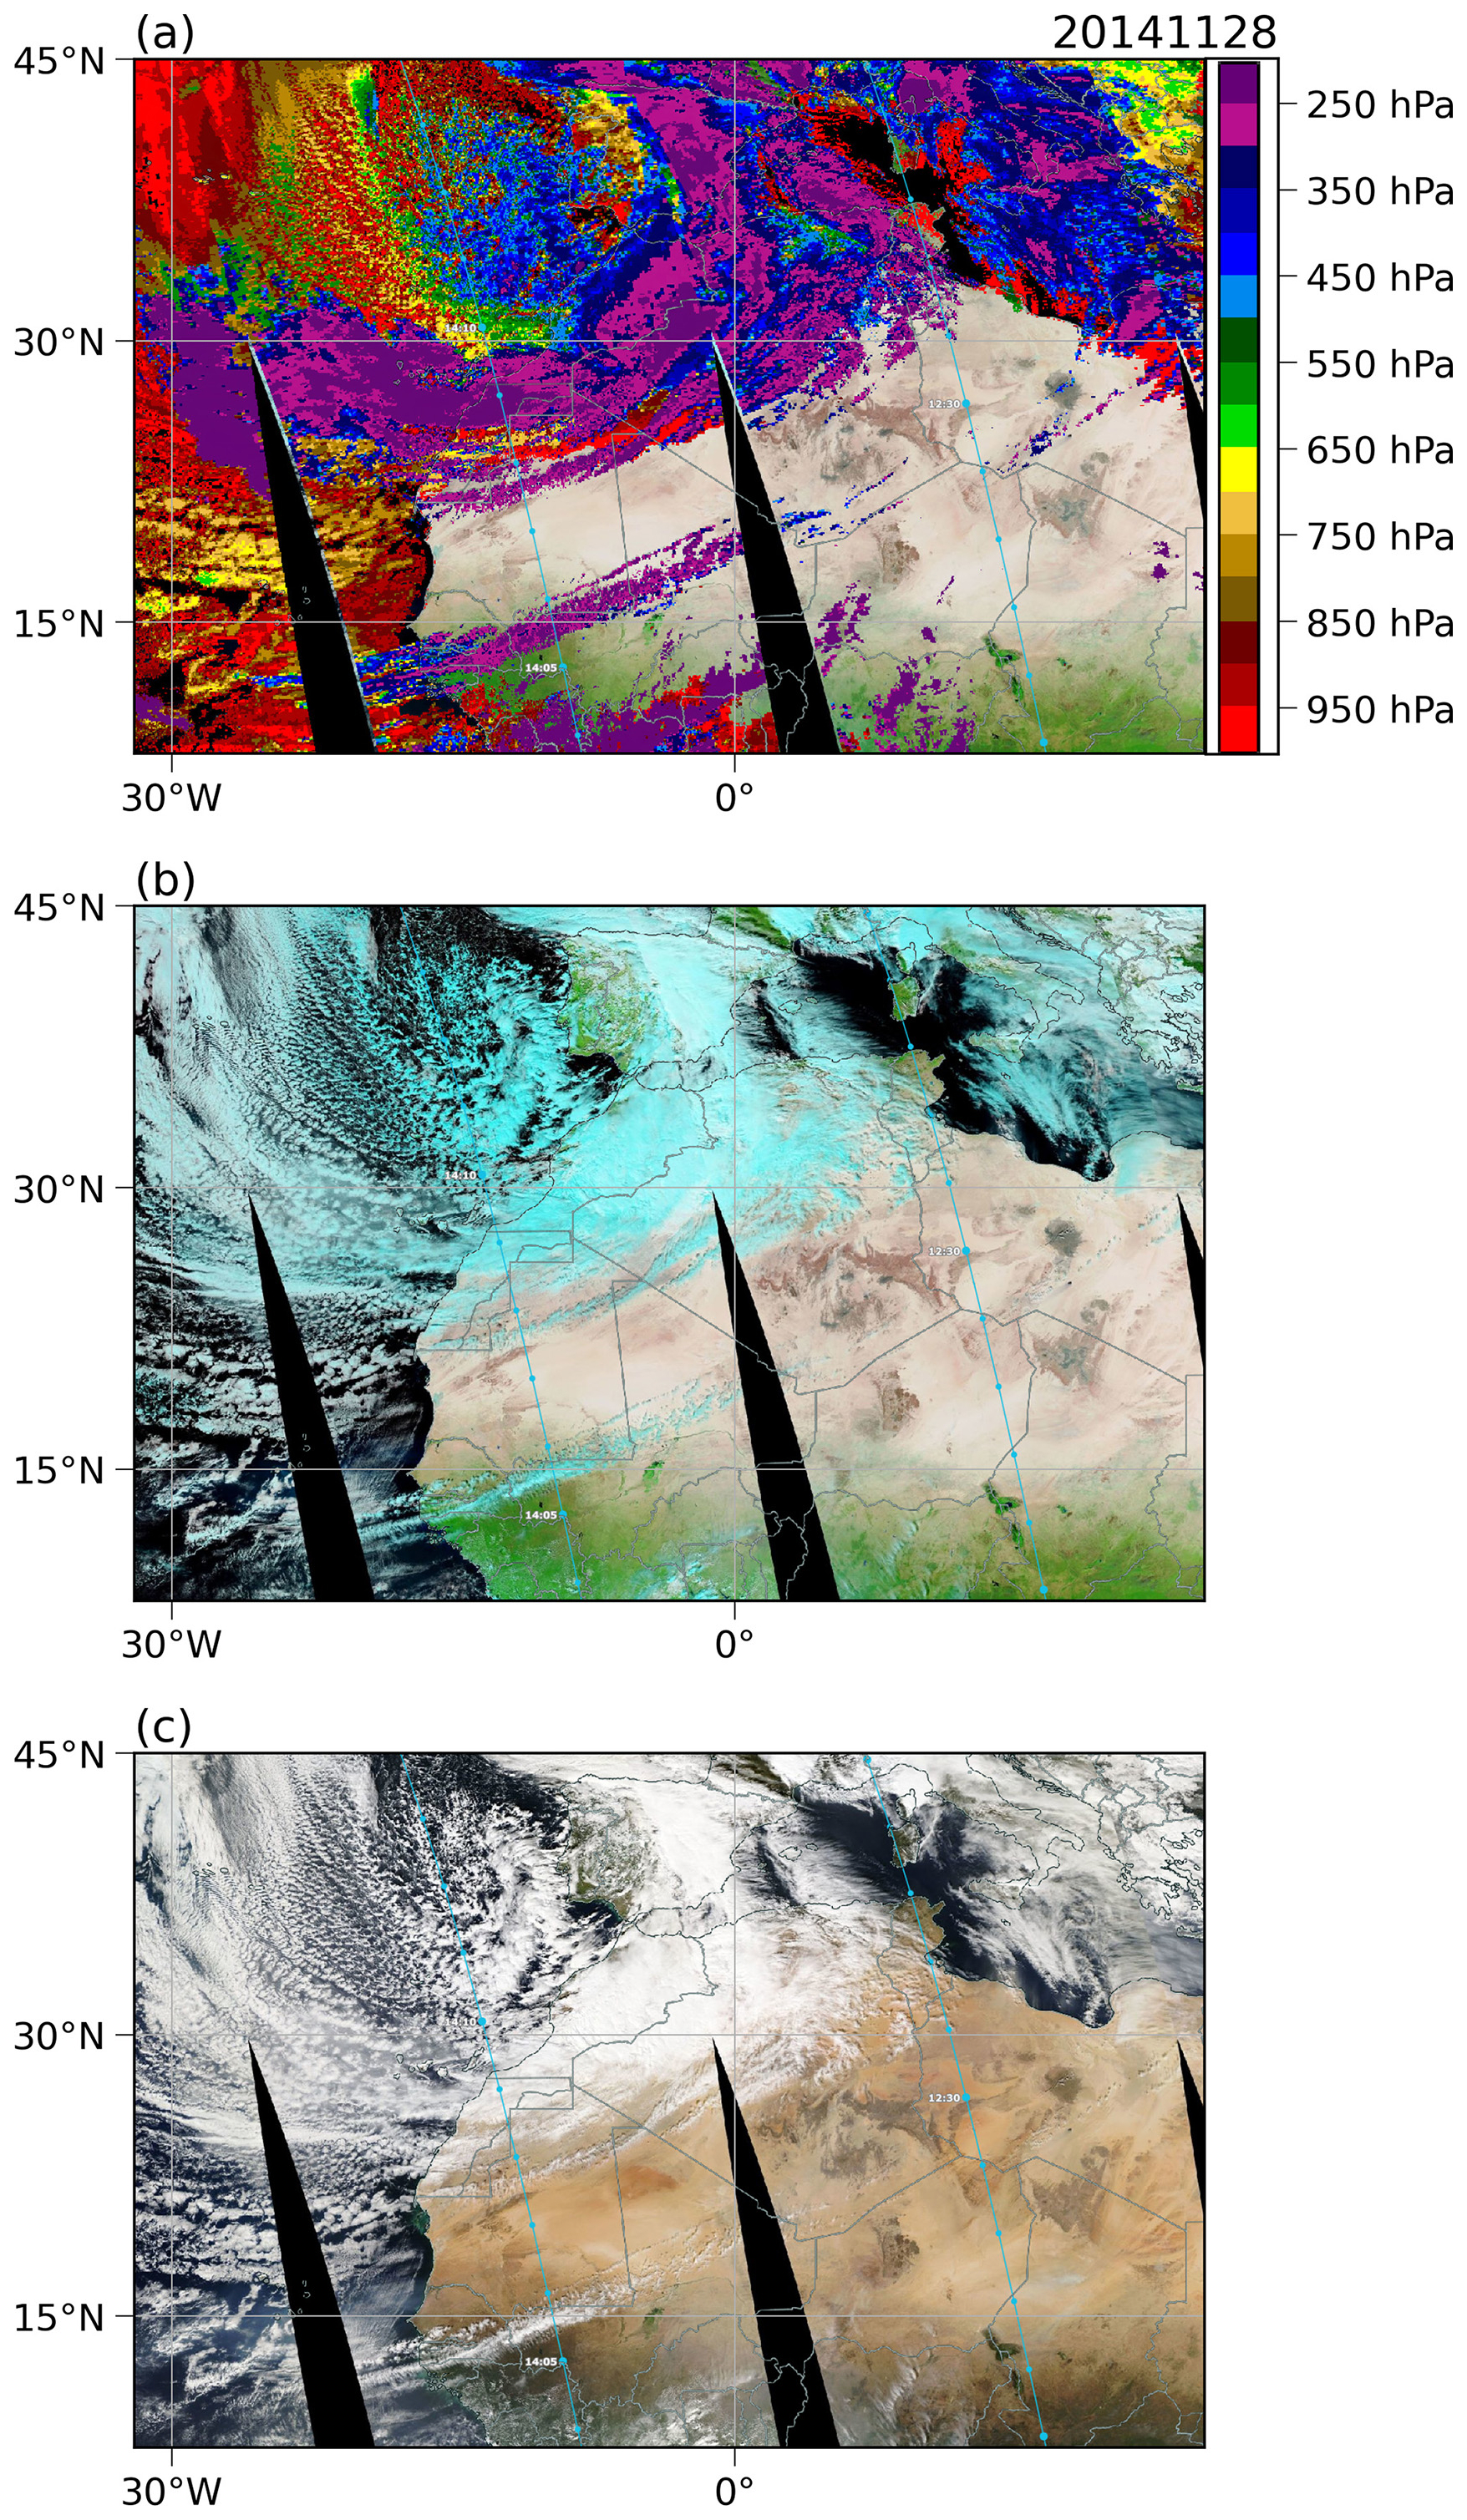
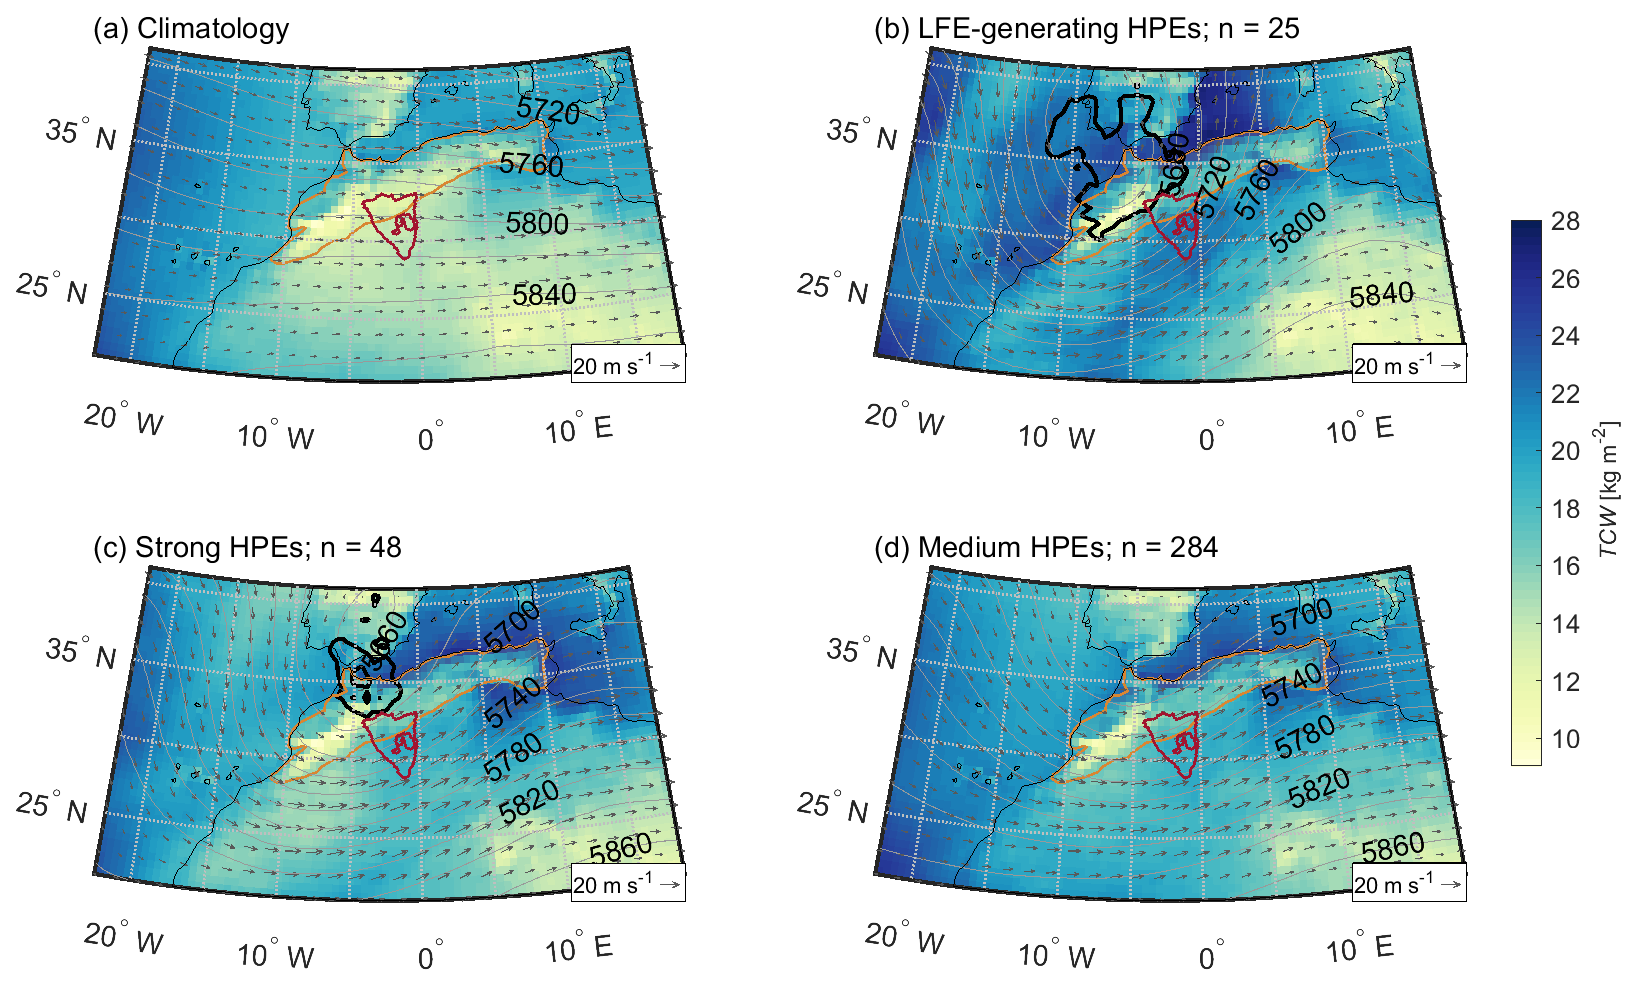
Figure A6Climatology of total column water (TCW) (kg m−2; colours), winds at 500 hPa (m s−1; grey arrows), geopotential height at 500 hPa (grey contours), and the 2-PVU line at 320 K (black contour) for (a) the period between June 2000 and May 2021, (b) the LFE-generating HPEs, (c) the strong HPEs, and (d) the medium HPEs. The red contour represents the Sebkha el Melah catchment, and the brown patch represents the Atlas Mountain Range. n denotes the number of days considered.
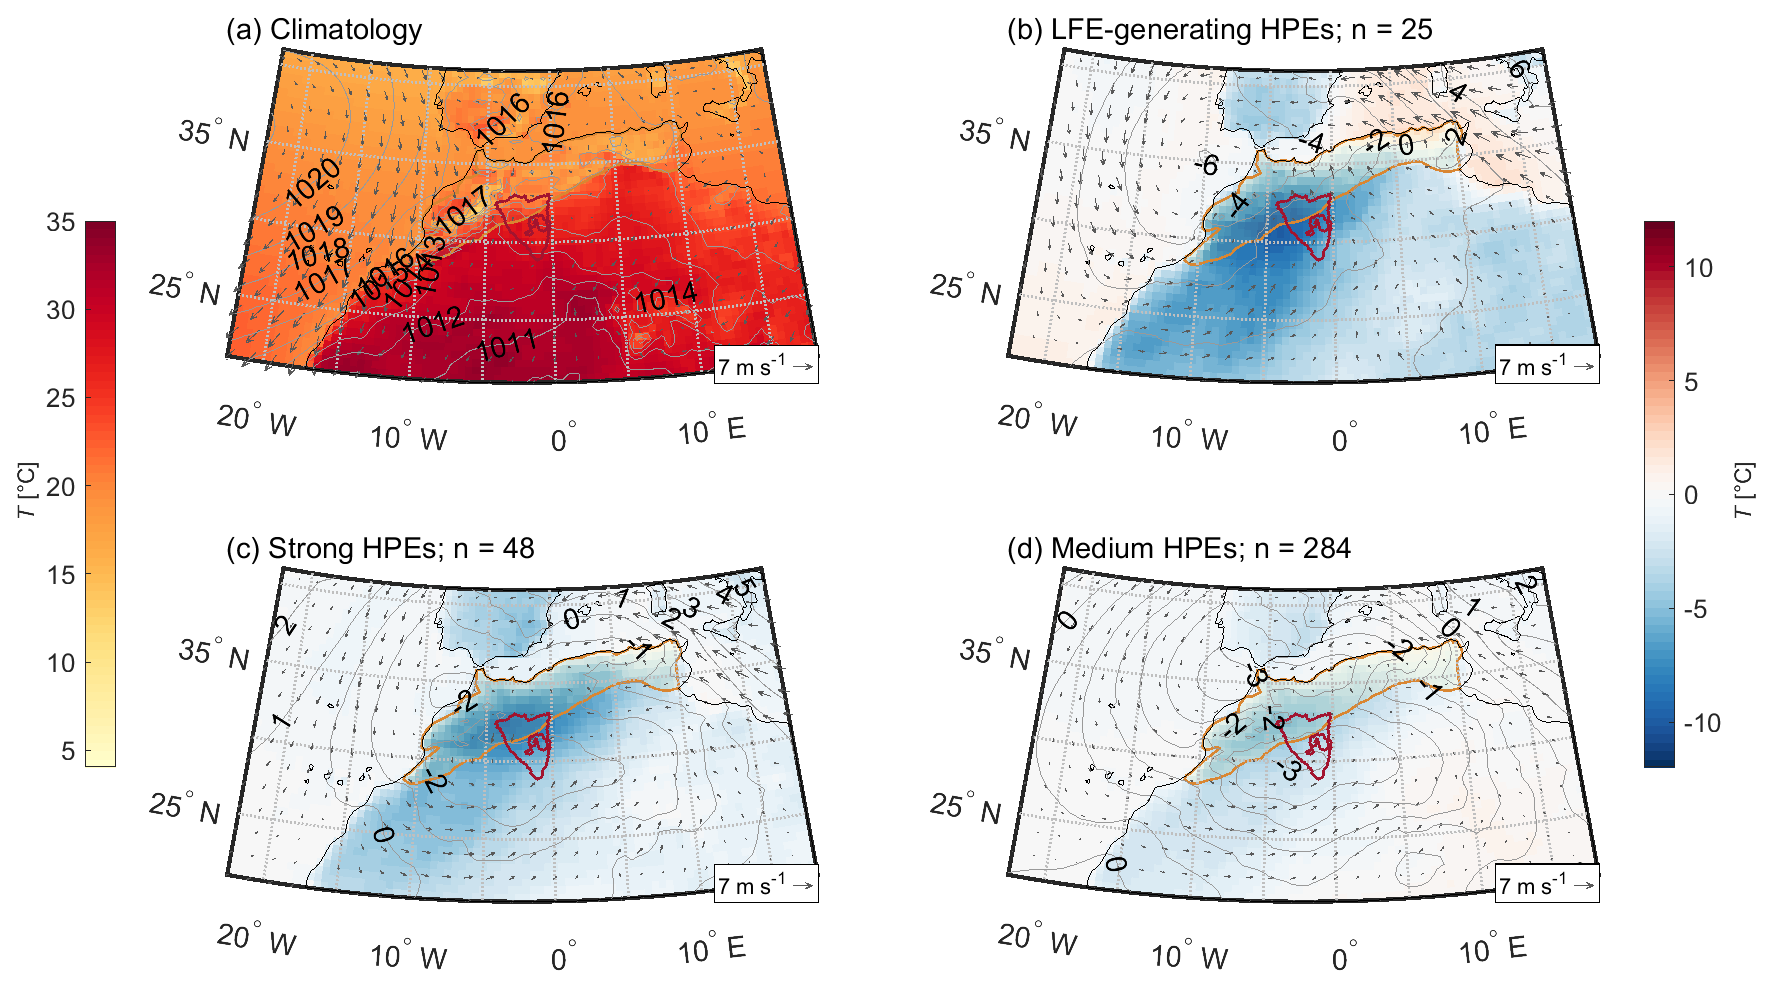
Figure A7Climatology (a) and anomalies (b–d) of 2 m temperature (T) (°C; colours), winds at 10 m (m s−1; grey arrows), and mean sea level pressure (grey contours) for (a) the period between June 2000 and May 2021, (b) the LFE-generating HPEs, (c) the strong HPEs, and (d) the medium HPEs. The red contour represents the Sebkha el Melah catchment, and the brown patch represents the Atlas Mountain Range. n denotes the number of days considered.
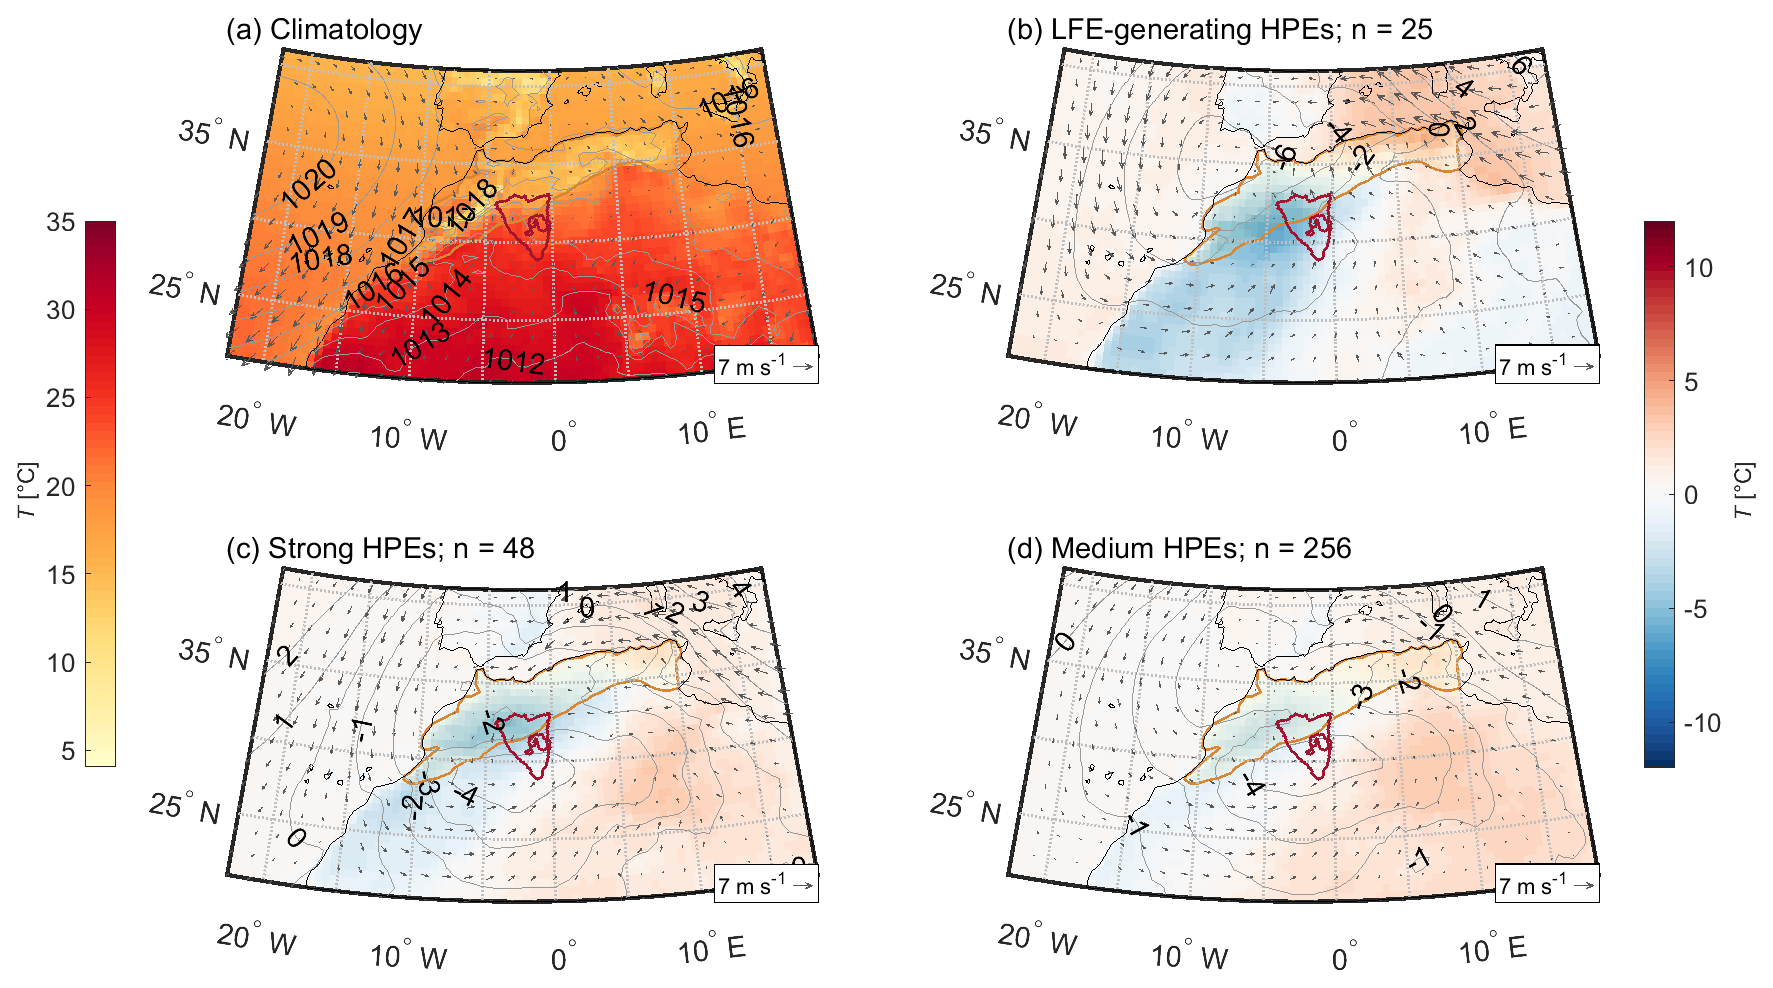
Figure A8September–May climatology (a) and anomalies (b–d) of 2 m temperature (T) (°C; colours), winds at 10 m (m s−1; grey arrows), and mean sea level pressure (grey contours) for (a) the period between June 2000 and May 2021, (b) the LFE-generating HPEs, (c) the strong HPEs, and (d) the medium HPEs. The red contour represents the Sebkha el Melah catchment, and the brown patch represents the Atlas Mountain Range. n denotes the number of days considered.
Table A1Uncertainties in the assessment of lake area and volume.
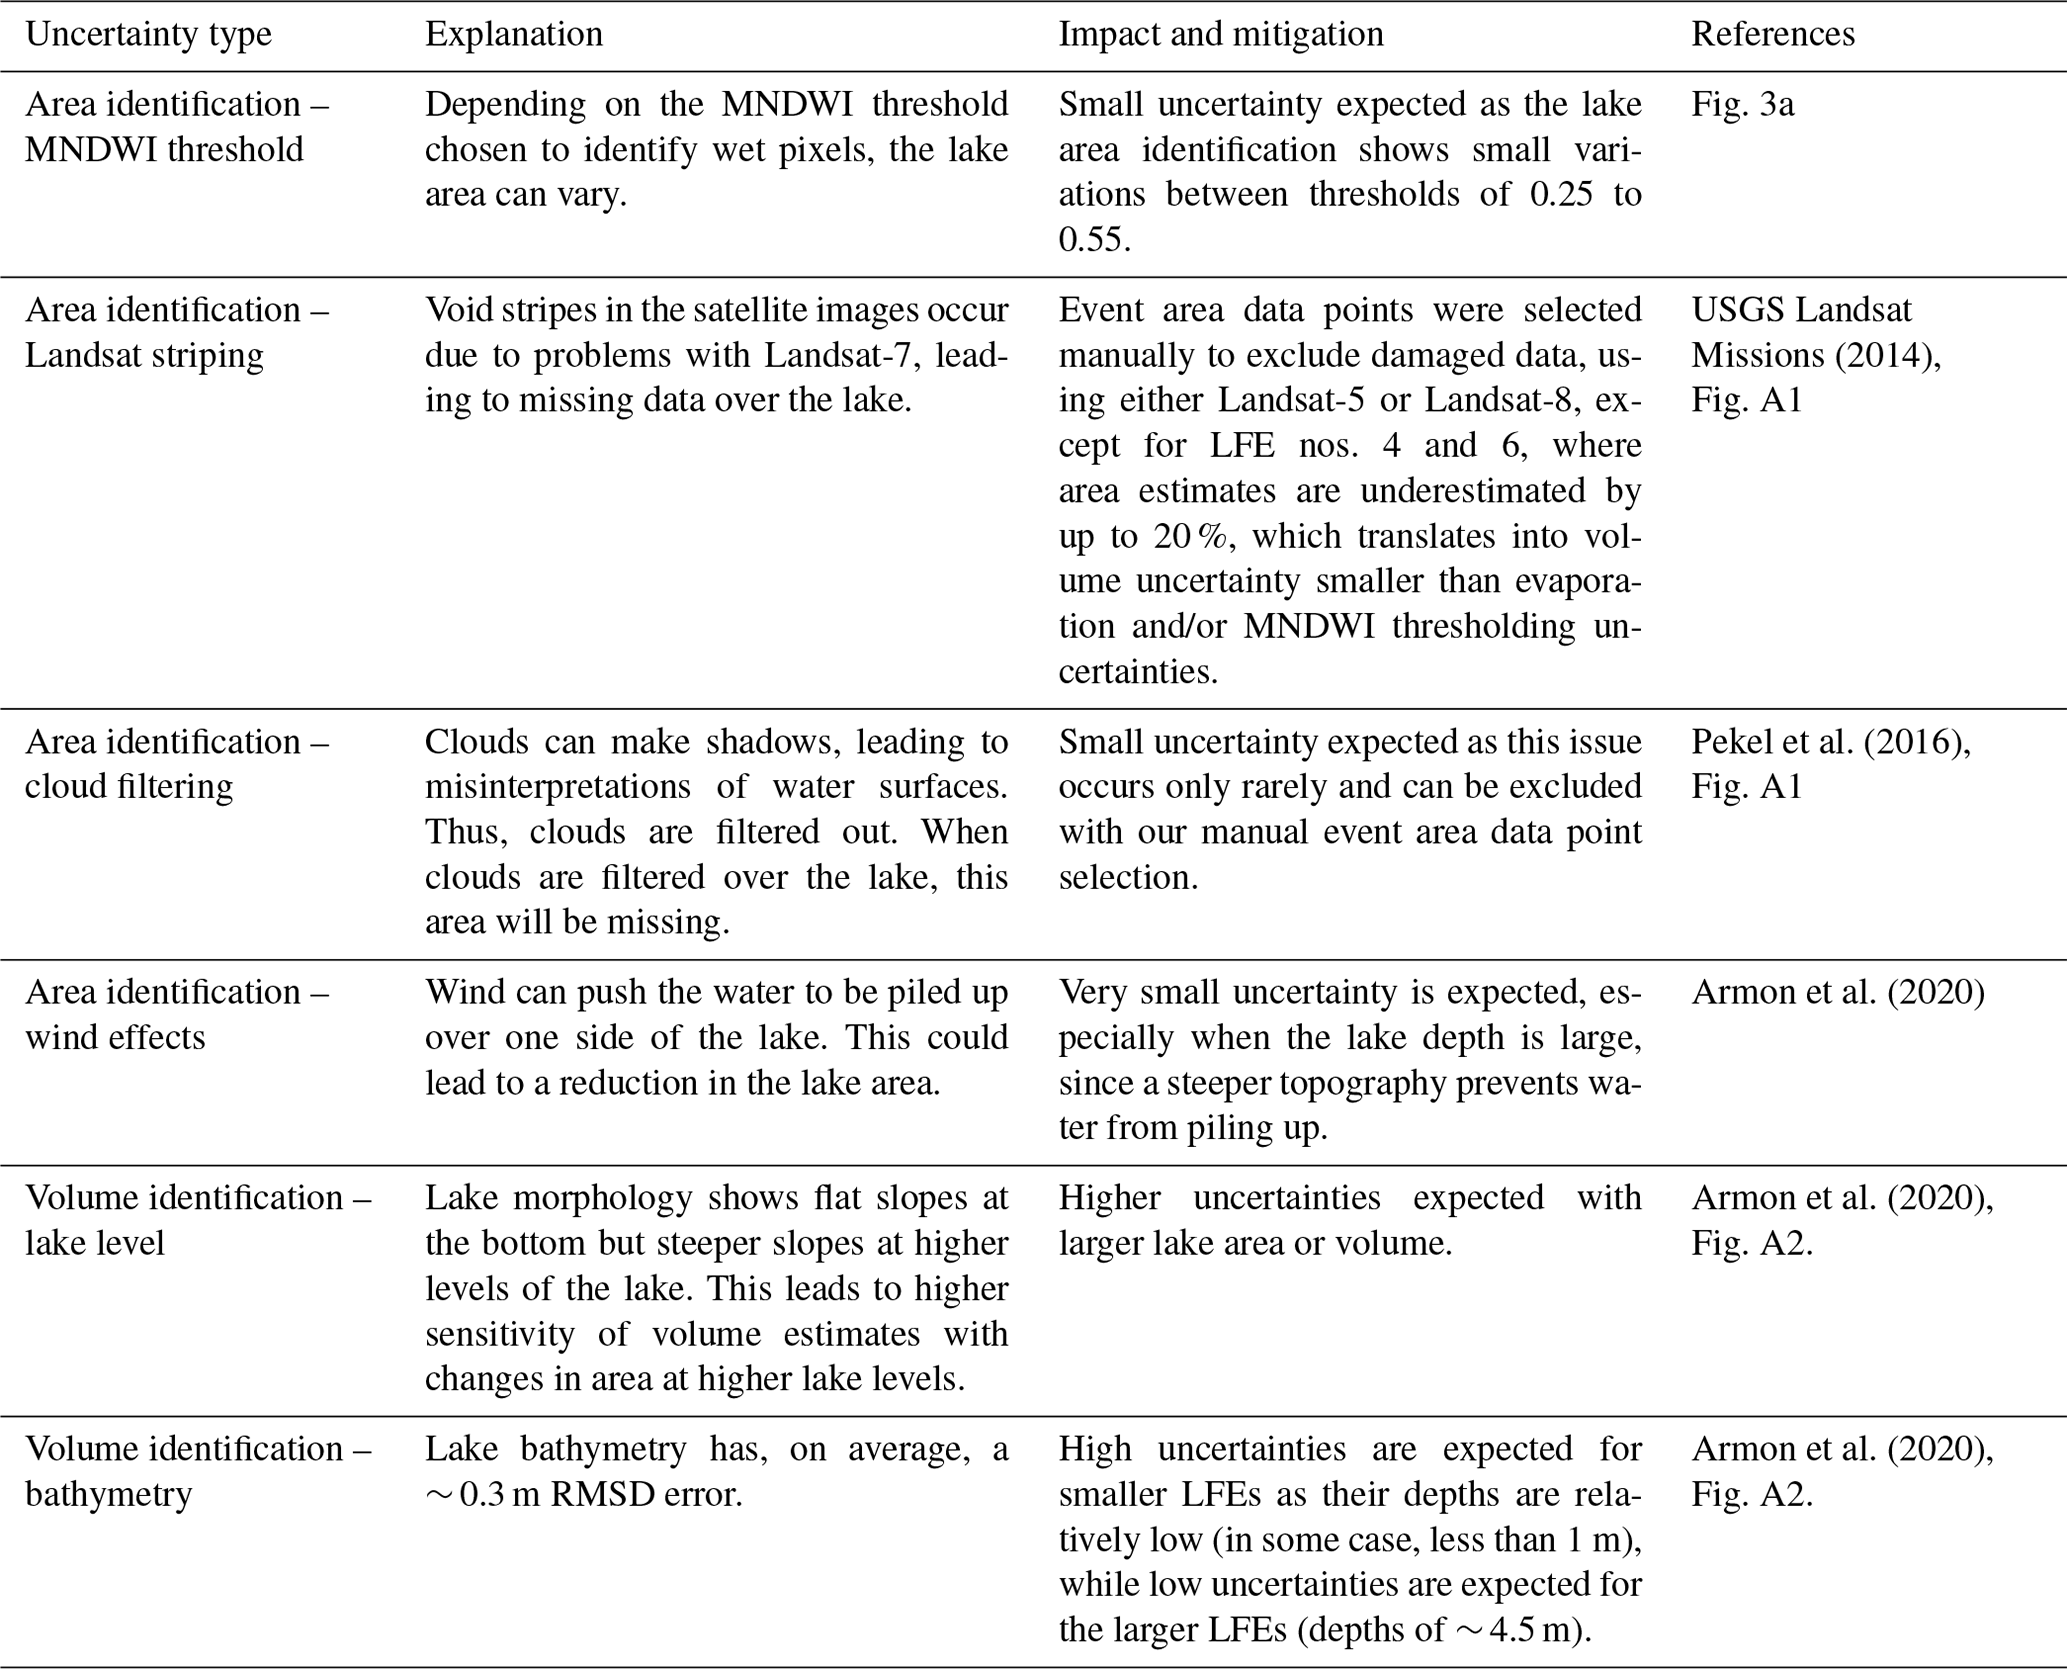
ERA5 data are available to download through https://doi.org/10.24381/cds.143582cf (Hersbach et al., 2017) MODIS data used here are courtesy of the NASA Worldview application (https://doi.org/10.5067/MODIS/MYD02QKM.061, MODIS Science Team, 2017), part of the NASA Earth Observing System Data and Information System (EOSDIS). Landsat data, courtesy of the US Geological Survey, were obtained through the Google Earth Engine and are available via https://developers.google.com/earth-engine/datasets/catalog/landsat (Gorelick et al., 2017). IMERG data are available to download through https://doi.org/10.5067/GPM/IMERGDF/DAY/06 (Huffman et al., 2023) (the NASA Goddard Earth Sciences (GES) Data and Information Services Center (DISC)). The bathymetric information of Sebkha el Melah was obtained from the results of Armon et al. (2020) and is available upon reasonable request from the corresponding author. An overview file of the properties of precipitation during all identified HPEs is available in the Supplement.
The supplement related to this article is available online at https://doi.org/10.5194/hess-29-1395-2025-supplement.
This paper is an outcome of JCR's MSc thesis, supervised by MA and FA. MA designed the study. ED contributed Google Earth Engine codes, as well as support with the Landsat data. JCR carried out most of the analyses based on codes by FA and MA and wrote the original draft of the paper with feedback from FA and MA.
The contact author has declared that none of the authors has any competing interests.
Publisher’s note: Copernicus Publications remains neutral with regard to jurisdictional claims made in the text, published maps, institutional affiliations, or any other geographical representation in this paper. While Copernicus Publications makes every effort to include appropriate place names, the final responsibility lies with the authors.
The authors would like to thank Heini Wernli for supporting this study and providing helpful feedback, as well as for partially funding it. We also thank Yehouda Enzel for helping us acquire runoff coefficient data. Special thanks go to Michael Sprenger for the very reliable technical support and for making the ERA5 dataset available to us and to Lisa Gross for the technical and design support in creating Fig. 14. Lastly, we would like to thank two anonymous reviewers for their helpful comments. MA was supported by an ETH Zurich Postdoctoral Fellowship (project no. 21-1 FEL-67) and by the Stiftung für naturwissenschaftliche und technische Forschung and the ETH Zurich Foundation, as well as by the Swiss National Science Foundation (grant no. TMPFP2_216989). Franziska Aemisegger acknowledges funding from the SNSF (grant no. TMSGI2_218303).
Moshe Armon was supported by an ETH Zurich Postdoctoral Fellowship (project no. 21-1 FEL-67) by the Stiftung für naturwissenschaftliche und technische Forschung and the ETH Zurich Foundation as well as by the Swiss National Science Foundation (grant no. TMPFP2_216989). Franziska Aemisegger was funded by the SNSF (grant no. TMSGI2_218303).
This paper was edited by Christa Kelleher and reviewed by two anonymous referees.
Abafoni, J., Arabi, A., and Funtua, I.: Luminescence chronology of the Bama Beach Ridge, Chad Basin, north eastern Nigeria, Quatern. Int., 338, 42–50, https://doi.org/10.1016/j.quaint.2014.04.065, 2014. a
Abouelmagd, A., Sultan, M., Milewski, A., Kehew, A. E., Sturchio, N. C., Soliman, F., Krishnamurthy, R. V., and Cutrim, E.: Toward a better understanding of palaeoclimatic regimes that recharged the fossil aquifers in North Africa: Inferences from stable isotope and remote sensing data, Palaeogeogr. Palaeocl., 329–330, 137–149, https://doi.org/10.1016/j.palaeo.2012.02.024, 2012. a
Aemisegger, F. and Papritz, L.: A Climatology of Strong Large-Scale Ocean Evaporation Events. Part I: Identification, Global Distribution, and Associated Climate Conditions, J. Climate, 31, 7287–7312, https://doi.org/10.1175/JCLI-D-17-0591.1, 2018. a
Aemisegger, F., Vogel, R., Graf, P., Dahinden, F., Villiger, L., Jansen, F., Bony, S., Stevens, B., and Wernli, H.: How Rossby wave breaking modulates the water cycle in the North Atlantic trade wind region, Weather Clim. Dynam., 2, 281–309, https://doi.org/10.5194/wcd-2-281-2021, 2021. a
Archer, S. R. and Predick, K. I.: Climate Change and Ecosystems of the Southwestern United States, Rangelands, 30, 23–28, https://doi.org/10.2111/1551-501X(2008)30[23:CCAEOT]2.0.CO;2, 2008. a
Armon, M., Dente, E., Smith, J. A., Enzel, Y., and Morin, E.: Synoptic-scale control over modern rainfall and flood patterns in the Levant drylands with implications for past climates, J. Hydrometeorol., 19, 1077–1096, https://doi.org/10.1175/JHM-D-18-0013.1, 2018. a
Armon, M., Dente, E., Shmilovitz, Y., Mushkin, A., Cohen, T. J., Morin, E., and Enzel, Y.: Determining Bathymetry of Shallow and Ephemeral Desert Lakes Using Satellite Imagery and Altimetry, Geophys. Res. Lett., 47, e2020GL087367, https://doi.org/10.1029/2020GL087367, 2020. a, b, c, d, e, f, g, h, i, j
Armon, M., de Vries, A. J., Marra, F., Peleg, N., and Wernli, H.: Saharan rainfall climatology and its relationship with surface cyclones, Weather and Climate Extremes, 131, 100 638, https://doi.org/10.1016/j.wace.2023.100638, 2024a. a, b, c, d, e, f, g
Armon, M., Shmilovitz, Y., and Dente, E.: Anatomy of a Foreseeable Disaster: Lessons from the 2023 Dam-Breaching Flood in Derna, Libya, Science Advances, in press, 2024b. a
Belachsen, I., Marra, F., Peleg, N., and Morin, E.: Convective rainfall in a dry climate: relations with synoptic systems and flash-flood generation in the Dead Sea region, Hydrol. Earth Syst. Sci., 21, 5165–5180, https://doi.org/10.5194/hess-21-5165-2017, 2017. a
Bouchez, C., Deschamps, P., Goncalves, J., Hamelin, B., Mahamat Nour, A., Vallet-Coulomb, C., and Sylvestre, F.: Water transit time and active recharge in the Sahel inferred by bomb-produced 36 Cl, Sci. Rep., 9, 1–8, https://doi.org/10.1038/s41598-019-43514-x, 2019. a
Chandan, D. and Peltier, W. R.: African Humid Period Precipitation Sustained by Robust Vegetation, Soil, and Lake Feedbacks, Geophys. Res. Lett., 47, e2020GL088728, https://doi.org/10.1029/2020GL088728, 2020. a
Chaqdid, A., Tuel, A., Fatimy, A. E., and Moçayd, N. E.: Extreme rainfall events in Morocco: Spatial dependence and climate drivers, Weather and Climate Extremes, 40, 100556, https://doi.org/10.1016/j.wace.2023.100556, 2023. a
Chen, T.-C.: Maintenance of the Midtropospheric North African Summer Circulation: Saharan High and African Easterly Jet, J. Climate, 18, 2943–2962, https://doi.org/10.1175/JCLI3446.1, 2005. a, b
Cissé, G., McLeman, R., Adams, H., Aldunce, P., Bowen, K., Campbell-Lendrum, D., Clayton, S., Ebi, K., Hess, J., Huang, C., Liu, Q., McGregor, G., Semenza, J., and Tirado, M.: Health, Wellbeing, and the Changing Structure of Communities, Cambridge University Press, Cambridge, UK and New York, USA, 1041–1170, ISBN 9781009325844, https://doi.org/10.1017/9781009325844.009, 2022. a
Claussen, M. and Gayler, V.: The Greening of the Sahara during the Mid-Holocene: Results of an Interactive Atmosphere-Biome Model, Global Ecol. Biogeogr., 6, 369–377, 1997. a
Coe, M. and Harrison, S.: The water balance of northern Africa during the mid-Holocene: An evaluation of the 6 Ka BP PMIP simulations, Clim. Dynam., 19, 155–166, https://doi.org/10.1007/s00382-001-0219-3, 2002. a, b
COHMAPMembers: Climatic Changes of the Last 18,000 Years: Observations and Model Simulations, Science, 241, 1043–1052, https://doi.org/10.1126/science.241.4869.1043, 1988. a, b
Copernicus: Storm Daniel Causes Flooding in Libya, https://www.copernicus.eu/en/media/image-day-gallery/storm-daniel-causes-flooding-libya (last access: 15 February 2025), 2023. a
Dahinden, F., Aemisegger, F., Wernli, H., Schneider, M., Diekmann, C. J., Ertl, B., Knippertz, P., Werner, M., and Pfahl, S.: Disentangling different moisture transport pathways over the eastern subtropical North Atlantic using multi-platform isotope observations and high-resolution numerical modelling, Atmos. Chem. Phys., 21, 16319–16347, https://doi.org/10.5194/acp-21-16319-2021, 2021. a
Dahinden, F., Aemisegger, F., Wernli, H., and Pfahl, S.: Unravelling the transport of moisture into the Saharan Air Layer using passive tracers and isotopes, Atmos. Sci. Lett., 24, e1187, https://doi.org/10.1002/asl.1187, 2023. a, b, c, d
de Vries, A. J.: A global climatological perspective on the importance of Rossby wave breaking and intense moisture transport for extreme precipitation events, Weather Clim. Dynam., 2, 129–161, https://doi.org/10.5194/wcd-2-129-2021, 2021. a, b
Dinku, T., Ceccato, P., and Connor, S. J.: Challenges of satellite rainfall estimation over mountainous and arid parts of east africa, Int. J. Remote Sens., 32, 5965–5979, https://doi.org/10.1080/01431161.2010.499381, 2011. a
Doswell, C. A., Brooks, H. E., and Maddox, R. A.: Flash flood forecasting: An ingredients-based methodology, Weather Forecast., 11, 560–581, https://doi.org/10.1175/1520-0434(1996)011<0560:FFFAIB>2.0.CO;2, 1996. a
Dubief, J.: Essai Sur L'hydrologie Superficielle Au Sahara, PhD thesis, Université d'Alger, https://catalog.loc.gov/vwebv/search?searchCode=LCCN&searchArg=56036105&searchType=1&permalink=y (last access: 7 March 2025), 1953. a
Enzel, Y., Kushnir, Y., and Quade, J.: The middle Holocene climatic records from Arabia: Reassessing lacustrine environments, shift of ITCZ in Arabian Sea, and impacts of the southwest Indian and African monsoons, Global Planet. Change, 129, 69–91, https://doi.org/10.1016/j.gloplacha.2015.03.004, 2015. a, b
FAO: Geo-referenced database on dams in Africa. Notes and References, Tech. rep., https://www.fao.org/3/bc807e/bc807e.pdf (last access: 15 February 2025), 2016. a
Fink, A. H. and Knippertz, P.: An extreme precipitation event in southern Morocco in spring 2002 and some hydrological implications, Weather, 58, 377–387, https://doi.org/10.1256/wea.256.02, 2003. a, b
Flohn, H.: Wechselbeziehung zwischen tropischen und außertropischen Zirkulationen, VS Verlag für Sozialwissenschaften, Wiesbaden, 22–29, ISBN 978-3-322-88078-9, https://doi.org/10.1007/978-3-322-88078-9_5, 1975. a
Folwell, S. S., Taylor, C. M., and Stratton, R. A.: Contrasting contributions of surface hydrological pathways in convection permitting and parameterised climate simulations over Africa and their feedbacks on the atmosphere, Clim. Dynam., 59, 633–648, https://doi.org/10.1007/s00382-022-06144-0, 2022. a
Froidevaux, P. and Martius, O.: Exceptional integrated vapour transport toward orography: an important precursor to severe floods in Switzerland, Q. J. Roy. Meteor. Soc., 142, 1997–2012, https://doi.org/10.1002/qj.2793, 2016. a
Gimeno, L., Eiras-Barca, J., Durán-Quesada, A. M., Dominguez, F., van der Ent, R., Sodemann, H., Sánchez-Murillo, R., Nieto, R., and Kirchner, J. W.: The residence time of water vapour in the atmosphere, Nature Reviews Earth and Environment, 2, 558–569, https://doi.org/10.1038/s43017-021-00181-9, 2021. a
Gorelick, N., Hancher, M., Dixon, M., Ilyushchenko, S., Thau, D., and Moore, R.: Google Earth Engine: Planetary-scale geospatial analysis for everyone, Remote Sens. Environ., 202, 18–27, https://doi.org/10.1016/j.rse.2017.06.031, 2017 (data available at: https://developers.google.com/earth-engine/datasets/catalog/landsat, last access: 11 March 2025). a
Gutiérrez, J., Jones, R., Narisma, G., Alves, L., Amjad, M., Gorodetskaya, I., Grose, M., Klutse, N., Krakovska, S., Li, J., Martínez-Castro, D., Mearns, L., Mernild, S., Ngo-Duc, T., van den Hurk, B., and Yoon, J.-H.: Atlas. In Climate Change 2021: The Physical Science Basis. Contribution of Working Group I to the Sixth Assessment Report of the Intergovernmental Panel on Climate Change, edited by: Masson-Delmotte, V., Zhai, P., Pirani, A., Connors, S. L., Péan, C., Berger, S., Caud, N., Chen, Y.,Goldfarb, L., Gomis, M. I., Huang, M., Leitzell, K., Lonnoy, E., Matthews, J. B. R.,Maycock, T. K., Waterfield, T., Yelekçi, O., Yu, R., and Zhou, B., Cambridge University Press, Cambridge, United Kingdom and New York, NY, USA, 1927–2058, https://doi.org/10.1017/9781009157896.021, 2021. a
Harada, C., Sumi, A., and Ohmori, H.: Seasonal and year-to-year variations of rainfall in the Sahara desert region based on TRMM PR data, Geophys. Res. Lett., 30, 1288, https://doi.org/10.1029/2002GL016695, 2003. a, b
Hersbach, H., Bell, B., Berrisford, P., Hirahara, S., Horányi, A., Muñoz‐Sabater, J., Nicolas, J., Peubey, C., Radu, R., Schepers, D., Simmons, A., Soci, C., Abdalla, S., Abellan, X., Balsamo, G., Bechtold, P., Biavati, G., Bidlot, J., Bonavita, M., De Chiara, G., Dahlgren, P., Dee, D., Diamantakis, M., Dragani, R., Flemming, J., Forbes, R., Fuentes, M., Geer, A., Haimberger, L., Healy, S., Hogan, R.J., Hólm, E., Janisková, M., Keeley, S., Laloyaux, P., Lopez, P., Lupu, C., Radnoti, G., de Rosnay, P., Rozum, I., Vamborg, F., Villaume, S., and Thépaut, J.-N.: Complete ERA5 from 1940: Fifth generation of ECMWF atmospheric reanalyses of the global climate, Copernicus Climate Change Service (C3S) Data Store (CDS) [data set], https://doi.org/10.24381/cds.143582cf, 2017. a
Hersbach, H., Bell, B., Berrisford, P., Hirahara, S., Horányi, A., Muñoz-Sabater, J., Nicolas, J., Peubey, C., Radu, R., Schepers, D., Simmons, A., Soci, C., Abdalla, S., Abellan, X., Balsamo, G., Bechtold, P., Biavati, G., Bidlot, J., Bonavita, M., De Chiara, G., Dahlgren, P., Dee, D., Diamantakis, M., Dragani, R., Flemming, J., Forbes, R., Fuentes, M., Geer, A., Haimberger, L., Healy, S., Hogan, R. J., Hólm, E., Janisková, M., Keeley, S., Laloyaux, P., Lopez, P., Lupu, C., Radnoti, G., de Rosnay, P., Rozum, I., Vamborg, F., Villaume, S., and Thépaut, J.-N.: The ERA5 global reanalysis, Q. J. Roy. Meteor. Soc., 146, 1999–2049, https://doi.org/10.1002/qj.3803, 2020. a
Hoelzmann, P., Kruse, H.-J., and Rottinger, F.: Precipitation estimates for the eastern Saharan palaeomonsoon based on a water balance model of the West Nubian Palaeolake Basin, Global Planet. Change, 26, 105–120, https://doi.org/10.1016/S0921-8181(00)00038-2, 2000. a, b
Hoskins, B. J., McIntyre, M. E., and Robertson, A. W.: On the use and significance of isentropic potential vorticity maps, Q. J. Roy. Meteor. Soc., 111, 877–946, https://doi.org/10.1002/qj.49711147002, 1985. a
Hou, A. Y., Kakar, R. K., Neeck, S., Azarbarzin, A. A., Kummerow, C. D., Kojima, M., Oki, R., Nakamura, K., and Iguchi, T.: The Global Precipitation Measurement Mission, B. Am. Meteorol. Soc., 95, 701–722, https://doi.org/10.1175/BAMS-D-13-00164.1, 2014. a
Huffman, G. J., Stocker, E. F., Bolvin, D. T., Nelkin, E. J., and Tan, J.: GPM IMERG Final Precipitation L3 1 day 0.1 degree x 0.1 degree V07, edited by: Savtchenko, A., Greenbelt, MD, Goddard Earth Sciences Data and Information Services Center (GES DISC) [data set], https://doi.org/10.5067/GPM/IMERGDF/DAY/06, 2023. a
Huffman, G. J., Bolvin, D. T., Braithwaite, D., Hsu, K.-L., Joyce, R. J., Kidd, C., Nelkin, E. J., Sorooshian, S., Stocker, E. F., Tan, J., Wolff, D. B., and Xie, P.: Integrated Multi-satellite Retrievals for the Global Precipitation Measurement (GPM) Mission (IMERG), 343–353, Springer International Publishing, Cham, ISBN 978-3-030-24568-9, https://doi.org/10.1007/978-3-030-24568-9_19, 2020. a, b, c
Islam, M. A., Yu, B., and Cartwright, N.: Assessment and comparison of five satellite precipitation products in Australia, J. Hydrol., 590, 125474, https://doi.org/10.1016/j.jhydrol.2020.125474, 2020. a
Iturbide, M., Fernández, J., Gutiérrez, J., Bedia, J., Cimadevilla, E., Díez-Sierra, J., Manzanas, R., Casanueva, A., Baño-Medina, J., Milovac, J., Herrera, S., Cofiño, A., San Martín, D., García-Díez, M., Hauser, M., Huard, D., and Yelekci, Ã.: Repository supporting the implementation of FAIR principles in the IPCC-WG1 Atlas, Zenodo, https://doi.org/10.5281/zenodo.3691645, 2021. a
Jungandreas, L., Hohenegger, C., and Claussen, M.: How does the explicit treatment of convection alter the precipitation–soil hydrology interaction in the mid-Holocene African humid period?, Clim. Past, 19, 637–664, https://doi.org/10.5194/cp-19-637-2023, 2023. a
Knippertz, P.: Tropical–Extratropical Interactions Causing Precipitation in Northwest Africa: Statistical Analysis and Seasonal Variations, Mon. Weather Rev., 131, 3069–3076, https://doi.org/10.1175/1520-0493(2003)131<3069:TICPIN>2.0.CO;2, 2003. a, b, c
Knippertz, P. and Martin, J. E.: Tropical plumes and extreme precipitation in subtropical and tropical West Africa, Q. J. Roy. Meteor. Soc., 131, 2337–2365, https://doi.org/10.1256/qj.04.148, 2005. a
Knippertz, P., Fink, A. H., Reiner, A., and Speth, P.: Three Late Summer/Early Autumn Cases of Tropical–Extratropical Interactions Causing Precipitation in Northwest Africa, Mon. Weather Rev., 131, 116–135, https://doi.org/10.1175/1520-0493(2003)131<0116:TLSEAC>2.0.CO;2, 2003. a, b, c, d, e
Krinner, G., Lézine, A.-M., Braconnot, P., Sepulchre, P., Ramstein, G., Grenier, C., and Gouttevin, I.: A reassessment of lake and wetland feedbacks on the North African Holocene climate, Geophys. Res. Lett., 39, L07701, https://doi.org/10.1029/2012GL050992, 2012. a
Kutzbach, J. E.: Estimates of past climate at Paleolake Chad, North Africa, based on a hydrological and energy-balance model, Quaternary Res., 14, 210–223, https://doi.org/10.1016/0033-5894(80)90049-6, 1980. a, b
Lehner, B. and Grill, G.: Global river hydrography and network routing: Baseline data and new approaches to study the world's large river systems, Hydrol. Process., 27, 2171–2186, https://doi.org/10.1002/hyp.9740, 2013. a
Lehner, B., Verdin, K., and Jarvis, A.: New Global Hydrography Derived From Spaceborne Elevation Data, Eos T. Am. Geophys. Un., 89, 93–94, https://doi.org/10.1029/2008EO100001, 2008. a
Li, Z., Tang, G., Hong, Z., Chen, M., Gao, S., Kirstetter, P., Gourley, J. J., Wen, Y., Yami, T., Nabih, S., and Hong, Y.: Two-decades of GPM IMERG Early and Final Run Products Intercomparison: Similarity and Difference in Climatology, Rates, and Extremes, J. Hydrol., 594, 125975, https://doi.org/10.1016/j.jhydrol.2021.125975, 2021. a
Lézine, A.-M., Hély, C., Grenier, C., Braconnot, P., and Krinner, G.: Sahara and Sahel vulnerability to climate changes, lessons from Holocene hydrological data, Quaternary Sci. Rev., 30, 3001–3012, https://doi.org/10.1016/j.quascirev.2011.07.006, 2011. a, b
Lohmann, U., Lüönd, F., and Mahrt, F.: An Introduction to Clouds: From the Microscale to Climate, Cambridge: Cambridge University Press, ISBN 9781139087513, https://doi.org/10.1017/CBO9781139087513, 2016. a
Mabbutt, J. A.: Desert landforms, Australian National University Press, Canberra, ACT, Australia, ISBN 9780262131315, 1977. a, b, c
Mahmoud, M. T., Mohammed, S. A., Hamouda, M. A., and Mohamed, M. M.: Impact of Topography and Rainfall Intensity on the Accuracy of IMERG Precipitation Estimates in an Arid Region, Remote Sens., 13, 13, https://doi.org/10.3390/rs13010013, 2021. a
Marra, F., Armon, M., and Morin, E.: Coastal and orographic effects on extreme precipitation revealed by weather radar observations, Hydrol. Earth Syst. Sci., 26, 1439–1458, https://doi.org/10.5194/hess-26-1439-2022, 2022. a
Mcguirk, J. P., Thompson, A. H., and Smith, N. R.: Moisture Bursts over the Tropical Pacific Ocean, Mon. Weather Rev., 115, 787–798, https://doi.org/10.1175/1520-0493(1987)115<0787:MBOTTP>2.0.CO;2, 1987. a
Merz, R., Blöschl, G., and Parajka, J.: Spatio-temporal variability of event runoff coefficients, J. Hydrol., 331, 591–604, https://doi.org/10.1016/j.jhydrol.2006.06.008, 2006. a, b
Merzougui, T., Mekkaoui, A., Mansour, H., and Graine-tazrout, K.: Hydrogeology of Béni Abbès: potential, hydrodynamics and influence on the palm field (Valley of Saoura, Algerian South-West), in: Aquifer Systems Management: Darcy's Legacy in a World of Impending Water Shortage, edited by: Chery, L. and de Marsily, G., chap. 20, Taylor & Francis, 269–278, ISBN 9780429082122, 2007. a
Miyasaka, T. and Nakamura, H.: Structure and Formation Mechanisms of the Northern Hemisphere Summertime Subtropical Highs, J. Climate, 18, 5046–5065, https://doi.org/10.1175/JCLI3599.1, 2005. a
MODIS Science Team: MODIS/Aqua Calibrated Radiances 5-Min L1B Swath 250m, NASA LANCE MODIS at the MODAPS [data set], https://doi.org/10.5067/MODIS/MYD02QKM.061, 2017. a
Morin, E. and Yakir, H.: Hydrological impact and potential flooding of convective rain cells in a semi-arid environment, Hydrolog. Sci. J., 59, 1353–1362, https://doi.org/10.1080/02626667.2013.841315, 2014. a
Morin, E., Marra, F., and Armon, M.: Dryland precipitation climatology from satellite observations, vol. 69, Springer, 843–859, https://doi.org/10.1007/978-3-030-35798-6_19, 2020. a, b
NaturalEarth, C.: Atlas Mountain Range contour, https://cartographyvectors.com/map/1251-atlas-mountain-range (last access: 12 November 2023), 2023. a
Neigh, C., Taylor, M. P., and Rocchio, L.: Landsat Data, nASA, U.S. Geological Survey, https://landsat.gsfc.nasa.gov/data/ (last access: 14 March 2023), 2022. a
Nicholson, S. E.: Rainfall and Atmospheric Circulation during Drought Periods and Wetter Years in West Africa, Mon. Weather Rev., 109, 2191–2208, https://doi.org/10.1175/1520-0493(1981)109<2191:RAACDD>2.0.CO;2, 1981. a, b, c, d, e
Nicholson, S. E.: The nature of rainfall variability over Africa on time scales of decades to millenia, Global Planet. Change, 26, 137–158, https://doi.org/10.1016/S0921-8181(00)00040-0, 2000. a
Nicholson, S. E.: Dryland Climatology, Cambridge University Press, https://doi.org/10.1017/CBO9780511973840, 2011. a, b, c, d, e, f
Pekel, J. F., Cottam, A., Gorelick, N., and Belward, A. S.: High-resolution mapping of global surface water and its long-term changes, Nature, 540, 418–422, https://doi.org/10.1038/nature20584, 2016. a, b, c, d, e
Pickens, A. H., Hansen, M. C., Hancher, M., Stehman, S. V, Tyukavina, A., Potapov, P., Marroquin, B., and Sherani, Z.: Mapping and sampling to characterize global inland water dynamics from 1999 to 2018 with full Landsat time-series, Remote Sens. Environ., 243, 111792, https://doi.org/10.1016/j.rse.2020.111792, 2020. a
Portmann, R., Sprenger, M., and Wernli, H.: The three-dimensional life cycles of potential vorticity cutoffs: a global and selected regional climatologies in ERA-Interim (1979–2018), Weather Clim. Dynam., 2, 507–534, https://doi.org/10.5194/wcd-2-507-2021, 2021. a, b, c
Quade, J., Dente, E., Armon, M., Dor, Y. B., Morin, E., Adam, O., and Enzel, Y.: Megalakes in the Sahara? A Review, Quaternary Res., 90, 253–275, https://doi.org/10.1017/qua.2018.46, 2018. a, b, c, d
Rachdane, M., El Khalki, E. M., Saidi, M. E., Nehmadou, M., Ahbari, A., and Tramblay, Y.: Comparison of High-Resolution Satellite Precipitation Products in Sub-Saharan Morocco, Water, 14, 3336, https://doi.org/10.3390/w14203336, 2022. a
Rajesh, P. V. and Goswami, B. N.: Climate Change and Potential Demise of the Indian Deserts, Earth's Future, 11, e2022EF003459, https://doi.org/10.1029/2022EF003459, 2023. a
Rinat, Y., Marra, F., Armon, M., Metzger, A., Levi, Y., Khain, P., Vadislavsky, E., Rosensaft, M., and Morin, E.: Hydrometeorological analysis and forecasting of a 3 d flash-flood-triggering desert rainstorm, Nat. Hazards Earth Syst. Sci., 21, 917–939, https://doi.org/10.5194/nhess-21-917-2021, 2021. a
Roca, R., Lafore, J.-P., Piriou, C., and Redelsperger, J.-L.: Extratropical Dry-Air Intrusions into the West African Monsoon Midtroposphere: An Important Factor for the Convective Activity over the Sahel, J. Atmos. Sci., 62, 390–407, https://doi.org/10.1175/JAS-3366.1, 2005. a, b
Rodwell, M. J. and Hoskins, B. J.: Monsoons and the dynamics of deserts, Q. J. Roy. Meteor. Soc., 122, 1385–1404, https://doi.org/10.1002/qj.49712253408, 1996. a, b
Rodwell, M. J. and Hoskins, B. J.: Subtropical Anticyclones and Summer Monsoons, J. Climate, 14, 3192–3211, https://doi.org/10.1175/1520-0442(2001)014<3192:SAASM>2.0.CO;2, 2001. a
Roe, G. H.: Orographic precipitation, Annu. Rev. Earth Pl. Sc., 33, 645–671, https://doi.org/10.1146/annurev.earth.33.092203.122541, 2005. a
Rognon, P.: Comment développer la recharge artificielle des nappes en régions sèches., Science et changements planétaires/Sécheresse, 11, 289–296, https://www.jle.com/en/revues/sec/e-docs/comment_developper_la_recharge_artificielle_des_nappes_en_regions_seches__230100/article.phtml (last access: 26 February 2025), 2001. a
Rubin, S., Ziv, B., and Paldor, N.: Tropical Plumes over Eastern North Africa as a Source of Rain in the Middle East, Mon. Weather Rev., 135, 4135–4148, https://doi.org/10.1175/2007MWR1919.1, 2007. a, b, c, d
Saggaï, S. and Bachi, O. E.: Evaporation Reduction from Water Reservoirs in Arid Lands Using Monolayers: Algerian Experience, Water Resour., 45, 280–288, https://doi.org/10.1134/S009780781802015X, 2018. a
Santos-Soares, E. F.: Regional weather dynamics and forcing in tropical and subtropical Northwest Africa, in: Oceanographic and biological features in the Canary Current Large Marine Ecosystem, vol. 115, 63–72, IOC-UNESCO, Paris, IOC Technical Series, http://hdl.handle.net/1834/9177 (last access: 15 February 2025), 2015. a
Sarra, A., Abderrahmane, M., Abdeljalil, B., Touhami, M., and Cherif, S.: Dams and water use in arid zones: drought, balance sheet, siltation, and outlook case of the Djorf Torba dam (southwest, Bechar, Algeria), Arab. J. Geosci., 16, 155, https://doi.org/10.1007/s12517-022-11152-9, 2023. a, b
Schepanski, K., Wright, T. J., and Knippertz, P.: Evidence for flash floods over deserts from loss of coherence in InSAR imagery, J. Geophys. Res.-Atmos., 117, D20101, https://doi.org/10.1029/2012JD017580, 2012. a
Sharon, D.: The spottiness of rainfall in a desert area, J. Hydrol., 17, 161–175, https://doi.org/10.1016/0022-1694(72)90002-9, 1972. a, b
Shmilovitz, Y., Morin, E., Rinat, Y., Haviv, I., Carmi, G., Mushkin, A., and Enzel, Y.: Linking frequency of rainstorms, runoff generation and sediment transport across hyperarid talus-pediment slopes, Earth Surf. Proc. Land., 45, 1644–1659, https://doi.org/10.1002/esp.4836, 2020. a
Skinner, C. B. and Poulsen, C. J.: The role of fall season tropical plumes in enhancing Saharan rainfall during the African Humid Period, Geophys. Res. Lett., 43, 349–358, https://doi.org/10.1002/2015GL066318, 2016. a, b, c
Sodemann, H.: Beyond Turnover Time: Constraining the Lifetime Distribution of Water Vapor from Simple and Complex Approaches, J. Atmos. Sci., 77, 413–433, https://doi.org/10.1175/JAS-D-18-0336.1, 2020. a
Sodemann, H., Schwierz, C., and Wernli, H.: Interannual variability of Greenland winter precipitation sources: Lagrangian moisture diagnostic and North Atlantic Oscillation influence, J. Geophys. Res.-Atmos., 113, D03107, https://doi.org/10.1029/2007JD008503, 2008. a, b, c, d
Sonntag, C., Klitzsch, E., Loehnert, E. P., El-Shazly, E. M., Munnich, K. O., Junghans, C., Thorweihe, U., Weistroffer, K., and Swailem, F. M.: Palaeoclimatic information from deuterium and oxygen-18 in carbon-14-dated north Saharian groundwaters. Groundwater formation in the past, in: Isotope hydrology 1978: Proceedings of an international symposium on Isotope hydrology, jointly organized by tha IAEA and the UNESCO. Vol II, International Atomic Energy Agency, Vienna, 569–581, ISBN 92-0-040179-1, 1978. a
Specht, N. F., Claussen, M., and Kleinen, T.: Simulated range of mid-Holocene precipitation changes from extended lakes and wetlands over North Africa, Clim. Past, 18, 1035–1046, https://doi.org/10.5194/cp-18-1035-2022, 2022. a
Sprenger, M. and Wernli, H.: The LAGRANTO Lagrangian analysis tool – version 2.0, Geosci. Model Dev., 8, 2569–2586, https://doi.org/10.5194/gmd-8-2569-2015, 2015. a
USGS Landsat Missions: Detector Striping, u.S. Geological Survey (USGS), https://www.usgs.gov/landsat-missions/detector-striping, last access: 14 March 2014. a
Villiger, L. and Aemisegger, F.: Water isotopic characterisation of the cloud–circulation coupling in the North Atlantic trades – Part 2: The imprint of the atmospheric circulation at different scales, Atmos. Chem. Phys., 24, 957–976, https://doi.org/10.5194/acp-24-957-2024, 2024. a
Warner, T. T.: Desert Meteorology, Cambridge University Press, ISBN 978-0521100489, 2004. a
Wasko, C. and Guo, D.: Understanding event runoff coefficient variability across Australia using the hydroEvents R package, Hydrol. Process., 36, 1–14, https://doi.org/10.1002/hyp.14563, 2022. a
Webster, P. and Fasullo, J.: MONSOON | Dynamical Theory, in: Encyclopedia of Atmospheric Sciences, edited by: Holton, J. R., Academic Press, Oxford, 1370–1386, ISBN 978-0-12-227090-1, https://doi.org/10.1016/B0-12-227090-8/00236-0, 2003. a
Wernli, H. and Davies, H. C.: A Lagrangian-based analysis of extratropical cyclones. I: The method and some applications, Q. J. Roy. Meteor. Soc., 123, 467–489, https://doi.org/10.1002/qj.49712353811, 1997. a
Wernli, H. and Schwierz, C.: Surface Cyclones in the ERA-40 Dataset (1958–2001). Part I: Novel Identification Method and Global Climatology, J. Atmos. Sci., 63, 2486–2507, https://doi.org/10.1175/JAS3766.1, 2006. a
Wheater, H. S.: Modelling hydrological processes in arid and semi-arid areas: an introduction, International Hydrology Series, Cambridge University Press, 1–20, https://doi.org/10.1017/CBO9780511535734.002, 2007. a
Wolfe, R.: Terra & Aqua Moderate Resolution Imaging Spectroradiometer (MODIS), level-1 and Atmosphere Archive & Distribution System, Distributed Active Archive Center (LAADS DAAC), NASA, https://ladsweb.modaps.eosdis.nasa.gov/missions-and-measurements/modis/ (last access: 14 March 2023), 2023. a
Xu, H.: Modification of normalised difference water index (NDWI) to enhance open water features in remotely sensed imagery, Int. J. Remote Sens., 27, 3025–3033, https://doi.org/10.1080/01431160600589179, 2006. a
Yair, A. and Kossovsky, A.: Climate and surface properties: Hydrological response of small arid and semi-arid watersheds, Geomorphology, 42, 43–57, https://doi.org/10.1016/S0169-555X(01)00072-1, 2002. a
Yokochi, R., Ram, R., Zappala, J. C., Jiang, W., Adar, E., Bernier, R., Burg, A., Dayan, U., Lu, Z.-T., Mueller, P., Purtschert, R., and Yechieli, Y.: Radiokrypton unveils dual moisture sources of a deep desert aquifer, P. Natl. Acad. Sci. USA, 116, 16222–16227, https://doi.org/10.1073/pnas.1904260116, 2019. a
Zambrano-Bigiarini, M., Nauditt, A., Birkel, C., Verbist, K., and Ribbe, L.: Temporal and spatial evaluation of satellite-based rainfall estimates across the complex topographical and climatic gradients of Chile, Hydrol. Earth Syst. Sci., 21, 1295–1320, https://doi.org/10.5194/hess-21-1295-2017, 2017. a
Zhou, C., Gao, W., Hu, J., Du, L., and Du, L.: Capability of IMERG V6 Early, Late, and Final Precipitation Products for Monitoring Extreme Precipitation Events, Remote Sensing, 13, 689, https://doi.org/10.3390/rs13040689, 2021. a
Zhou, L., Hua, W., Nicholson, S. E., and Clark, J. P.: Interannual teleconnections in the Sahara temperatures associated with the North Atlantic Oscillation (NAO) during boreal winter, Clim. Dynam., 62, 1123–1143, https://doi.org/10.1007/s00382-023-06962-w, 2023. a
Zoccatelli, D., Marra, F., Armon, M., Rinat, Y., Smith, J. A., and Morin, E.: Contrasting rainfall-runoff characteristics of floods in desert and Mediterranean basins, Hydrol. Earth Syst. Sci., 23, 2665–2678, https://doi.org/10.5194/hess-23-2665-2019, 2019. a, b
Zurqani, H. A., Al-Bukhari, A., Aldaikh, A. O., Elfadli, K. I., and Bataw, A. A.: Geospatial Mapping and Analysis of the 2019 Flood Disaster Extent and Impact in the City of Ghat in Southwestern Libya Using Google Earth Engine and Deep Learning Technique, Springer International Publishing, Cham, 205–226, ISBN 978-3-030-97810-5, https://doi.org/10.1007/978-3-030-97810-5_10, 2022. a