the Creative Commons Attribution 4.0 License.
the Creative Commons Attribution 4.0 License.
 | 11 Mar 2025
Annual memory in the terrestrial water cycle
Ross A. Woods
Bailey J. Anderson
Anna Luisa Hemshorn de Sánchez
Markus Hrachowitz
The water balance of catchments will, in many cases, strongly depend on its state in the recent past (e.g. previous days). Processes causing significant hydrological memory may persist at longer timescales (e.g. annual). The presence of such memory could prolong drought and flood risks and affect water resources over long periods, but the global universality, strength, and origin of long memory in the water cycle remain largely unclear. Here, we quantify annual memory in the terrestrial water cycle globally using autocorrelation applied to annual time series of water balance components. These time series of streamflow, global gridded precipitation, and GLEAM potential and actual evaporation, along with a GRACE (Gravity Recovery and Climate Experiment)-informed global terrestrial water storage reconstruction, indicate that, at annual timescales, memory is typically absent in precipitation but strong in terrestrial water stores (root zone moisture and groundwater). Outgoing fluxes (streamflow and evaporation) positively scale with storage, and so they also tend to hold substantial annual memory. As storage mediates flow extremes, such memory often also occurs in annual extreme flows and is especially strong for low flows and in large catchments. Our model experiments show that storage–discharge relationships that are hysteretic and strongly non-linear are consistent with these observed memory behaviours, whereas non-hysteretic and linear drainage fails to reconstruct these signals. Thus, a multi-year slow dance of terrestrial water stores and their outgoing fluxes is common; it is not simply mirroring precipitation memory and appears to be caused by hysteretic storage and drainage mechanisms that are incorporable in hydrological models.
- Article
(5597 KB) - Full-text XML
- BibTeX
- EndNote


The temporal variability of weather, (subsurface) hydrological processes, and land surface conditions can cause streamflow to vary by orders of magnitude over time, leading to droughts and floods and affecting water resources for society and ecosystems (Van Loon, 2015; Blöschl et al., 2020; Berghuijs et al., 2017; Kreibich et al., 2022). Temporal autocorrelation in streamflow time series tends to be strong at short (e.g. daily) timescales because, often, streamflow strongly depends on catchment storage (e.g. Kirchner, 2009; Spence et al., 2010; McNamara et al., 2011; Riegger and Tourian, 2014), which, compared to precipitation, changes relatively gradually with time (e.g. Lischeid et al., 2021; Li et al., 2024). At longer timescales (e.g. 1 year or longer), streamflow can also be autocorrelated (e.g. Mudelsee, 2007; Godsey et al., 2014). This autocorrelation may be interpreted as evidence of the persistent influence of the prior hydroclimatic state of a catchment on current hydrologic conditions. Signals of past climate, which are detectable in streamflow records for long periods, are known as “catchment-state persistence” or “catchment memory” (de Lavenne et al., 2022; Orth and Seneviratne, 2013). Catchment memory has the potential to prolong the risks of droughts (Sutanto and Van Lanen, 2022), may lead to recorded flood-rich and flood-poor periods (Blöschl et al., 2020), and could affect water availability for society and ecosystems (Klemeš et al., 1981). These long- and short-term components of water storage often largely determine how streamflow responds to precipitation and, for instance, may cause different hydrologic responses to the same precipitation amounts (e.g. Kirchner, 2024).
Long memory, defined here as a signal which persists for more than 1 year, is not uncommon in streamflow records, but it is unclear whether and to what extent this characteristic is present across catchments. Following its discovery in annual flow records of the Nile River (Hurst, 1951), more widespread evidence of long memory in annual flows has been reported for many rivers worldwide (e.g. Mudelsee 2007; Labat, 2008; Kantelhardt et al., 2006; Montanari, 2003; Markonis et al., 2018; Szolgayova et al., 2014; Milly and Dunne, 2002; de Lavenne et al., 2022). Low flows and floods have been reported to sometimes be significantly clustered in time (Gudmundsson et al., 2011; Blöschl et al., 2020; Lun et al., 2020; Sutanto and Van Lanen, 2022), suggesting the possibility of memory effects, even for streamflow extremes. However, globally, it remains mostly unquantified how universal long memory is across the water cycle and to what extent it occurs in extreme flows.
Mass conservation dictates that streamflow memory cannot occur in full isolation but must interact with other water balance components:
In this example catchment water balance (ignoring potential inter-basin groundwater flows or land–ocean transfers), S is storage, P is precipitation, Q is streamflow, E is evaporation, and t is time. This continuity equation implies that long memory in one component is physically connected with other components. Such connections have also been demonstrated previously. For example, Milly and Dunne (2002) show that, for several catchments, interannual carry-over of storage cascades into the memory of annual flows. Godsey et al. (2014) show how, in several catchments, seasonal low flows are significantly correlated with both the current year's and the previous year's snowpacks. Yet, in most cases, such connections remain largely unexplored as most large-scale assessments of streamflow memory do not simultaneously analyse other water balance components (e.g. Mudelsee 2007; Labat, 2008; Kantelhardt et al., 2006; Montanari, 2003; Markonis et al., 2018; Szolgayova et al., 2014).
Long memory in hydro-climatological variables has been quantified beyond streamflow. For example, precipitation can be affected by large-scale multi-year climate oscillations (e.g. El Niño–Southern Oscillation (ENSO), North Atlantic Oscillation, Pacific Decadal Oscillation) (Ropelewski and Halpert, 1987; Jong et al., 2016). Such persistence of states in the ocean–atmosphere system (e.g. ENSO, Pacific Decadal Oscillation) can be a contributor to multi-annual persistence in precipitation and streamflow (Verdon et al., 2004; McKerchar, and Henderson, 2003; Ward et al., 2014), but global analysis suggests that significant memory in annual precipitation is uncommon (Sun et al., 2018). Instead, in regional and semi-global studies, autocorrelation rapidly declines in precipitation time series (Markonis and Koutsoyiannis, 2016; Kantelhardt et al., 2006; Fraedrich and Blender, 2003; Potter, 1979). While evapotranspiration is the second-largest terrestrial water flux (Dorigo et al., 2021), its long memory has not been systematically quantified globally.
Terrestrial liquid-water storage mostly consists of groundwater and soil moisture. Aquifers in arid regions can exhibit long-term memory as they integrate precipitation variabilities, the effects of which persist over long periods (e.g. Opie et al., 2020). Groundwater often strongly fluctuates seasonally (Strassberg et al., 2007), but long time series can also exhibit multi-year drying or wetting trends (e.g. Rodell et al., 2018; Jasechko et al., 2024) that likely hold significant long memory. Furthermore, Gravity Recovery and Climate Experiment (GRACE) data can be used to forecast trends in global land water storage for the following year (Li et al., 2024), indicating significant long memory. Nevertheless, long groundwater memory remains mostly undocumented at global scales. Soil moisture storage memory has mostly been analysed for shorter timescales (e.g. Orth and Seneviratne, 2012; Martínez-Fernández et al., 2021), while its long memory remains unclear globally.
Here, we simultaneously quantify the annual memory of different water balance components to reveal where this memory originates and how it cascades between processes. We assess to what extent this memory occurs in global precipitation, temperature, soil moisture, total terrestrial water storage, streamflow, and evaporation time series. We subsequently use empirical and model tests to establish which catchment factors shape the observed memory behaviours.
2.1 Global data
We use streamflow data from 15 029 catchments from the Global Streamflow Indices and Metadata Archive (GSIM), a worldwide collection of metadata and indices derived from streamflow time series (Do et al., 2018a; Gudmundsson et al., 2018). Gridded precipitation time series are from the Global Precipitation Climatology Centre (GPCC) V7 0.5° data set for 1981–2020 (Becker et al., 2013; Schneider et al., 2008), and 2 m global land surface temperature data for the period 1981–2020 at 0.5° are from the Global Historical Climate Network (GHCN) Climate Anomaly Monitoring System (CAMS) (Fan and van den Dool, 2008). We also use 0.25° GLEAM V3.8a estimates of actual evaporation, potential evaporation, and root zone soil moisture over the period 1981–2020 (Martens et al., 2017). In GLEAM, potential evaporation is based on the Priestley and Taylor equation, and actual evaporation is based on potential evaporation multiplied by an evaporative stress factor based on observations of microwave vegetation optical depth (VOD) and estimates of root zone soil moisture (Martens et al., 2017). We use long-term (i.e. 1981–2022) 0.25° resolution monthly terrestrial water storage estimates over the land surface from GTWS-MLrec (Yin et al., 2023), which is a reconstruction that uses a set of machine-learning models with several predictors and GRACE (Yin et al., 2023). We exclude data from Greenland, Iceland, and Antarctica from our analysis due to their unique climatic and environmental conditions, which differ significantly from those of other regions.
2.2 Annual memory and autocorrelation
We quantify memory as the autocorrelation of annual values (mean, minimum, maximum) of hydrological fluxes or stores at a 1-year lag time (Fig. 1). To compute autocorrelation, we linearly detrend time series of annual values and then calculate autocorrelation ρy at lags of 1 year as follows:
ρy measures the linear correlation between the detrended time series of variable y at year t and at year t−1. ρy can range from −1 to 1, where larger positive values indicate a stronger tendency for adjacent values to be similar. We calculate ρy for time series with at least 20 years of continuous data. We test the probability of accepting the null hypothesis that the residuals yt are uncorrelated (p value < 0.1 for statistical significance, consistently with Sun et al., 2018).
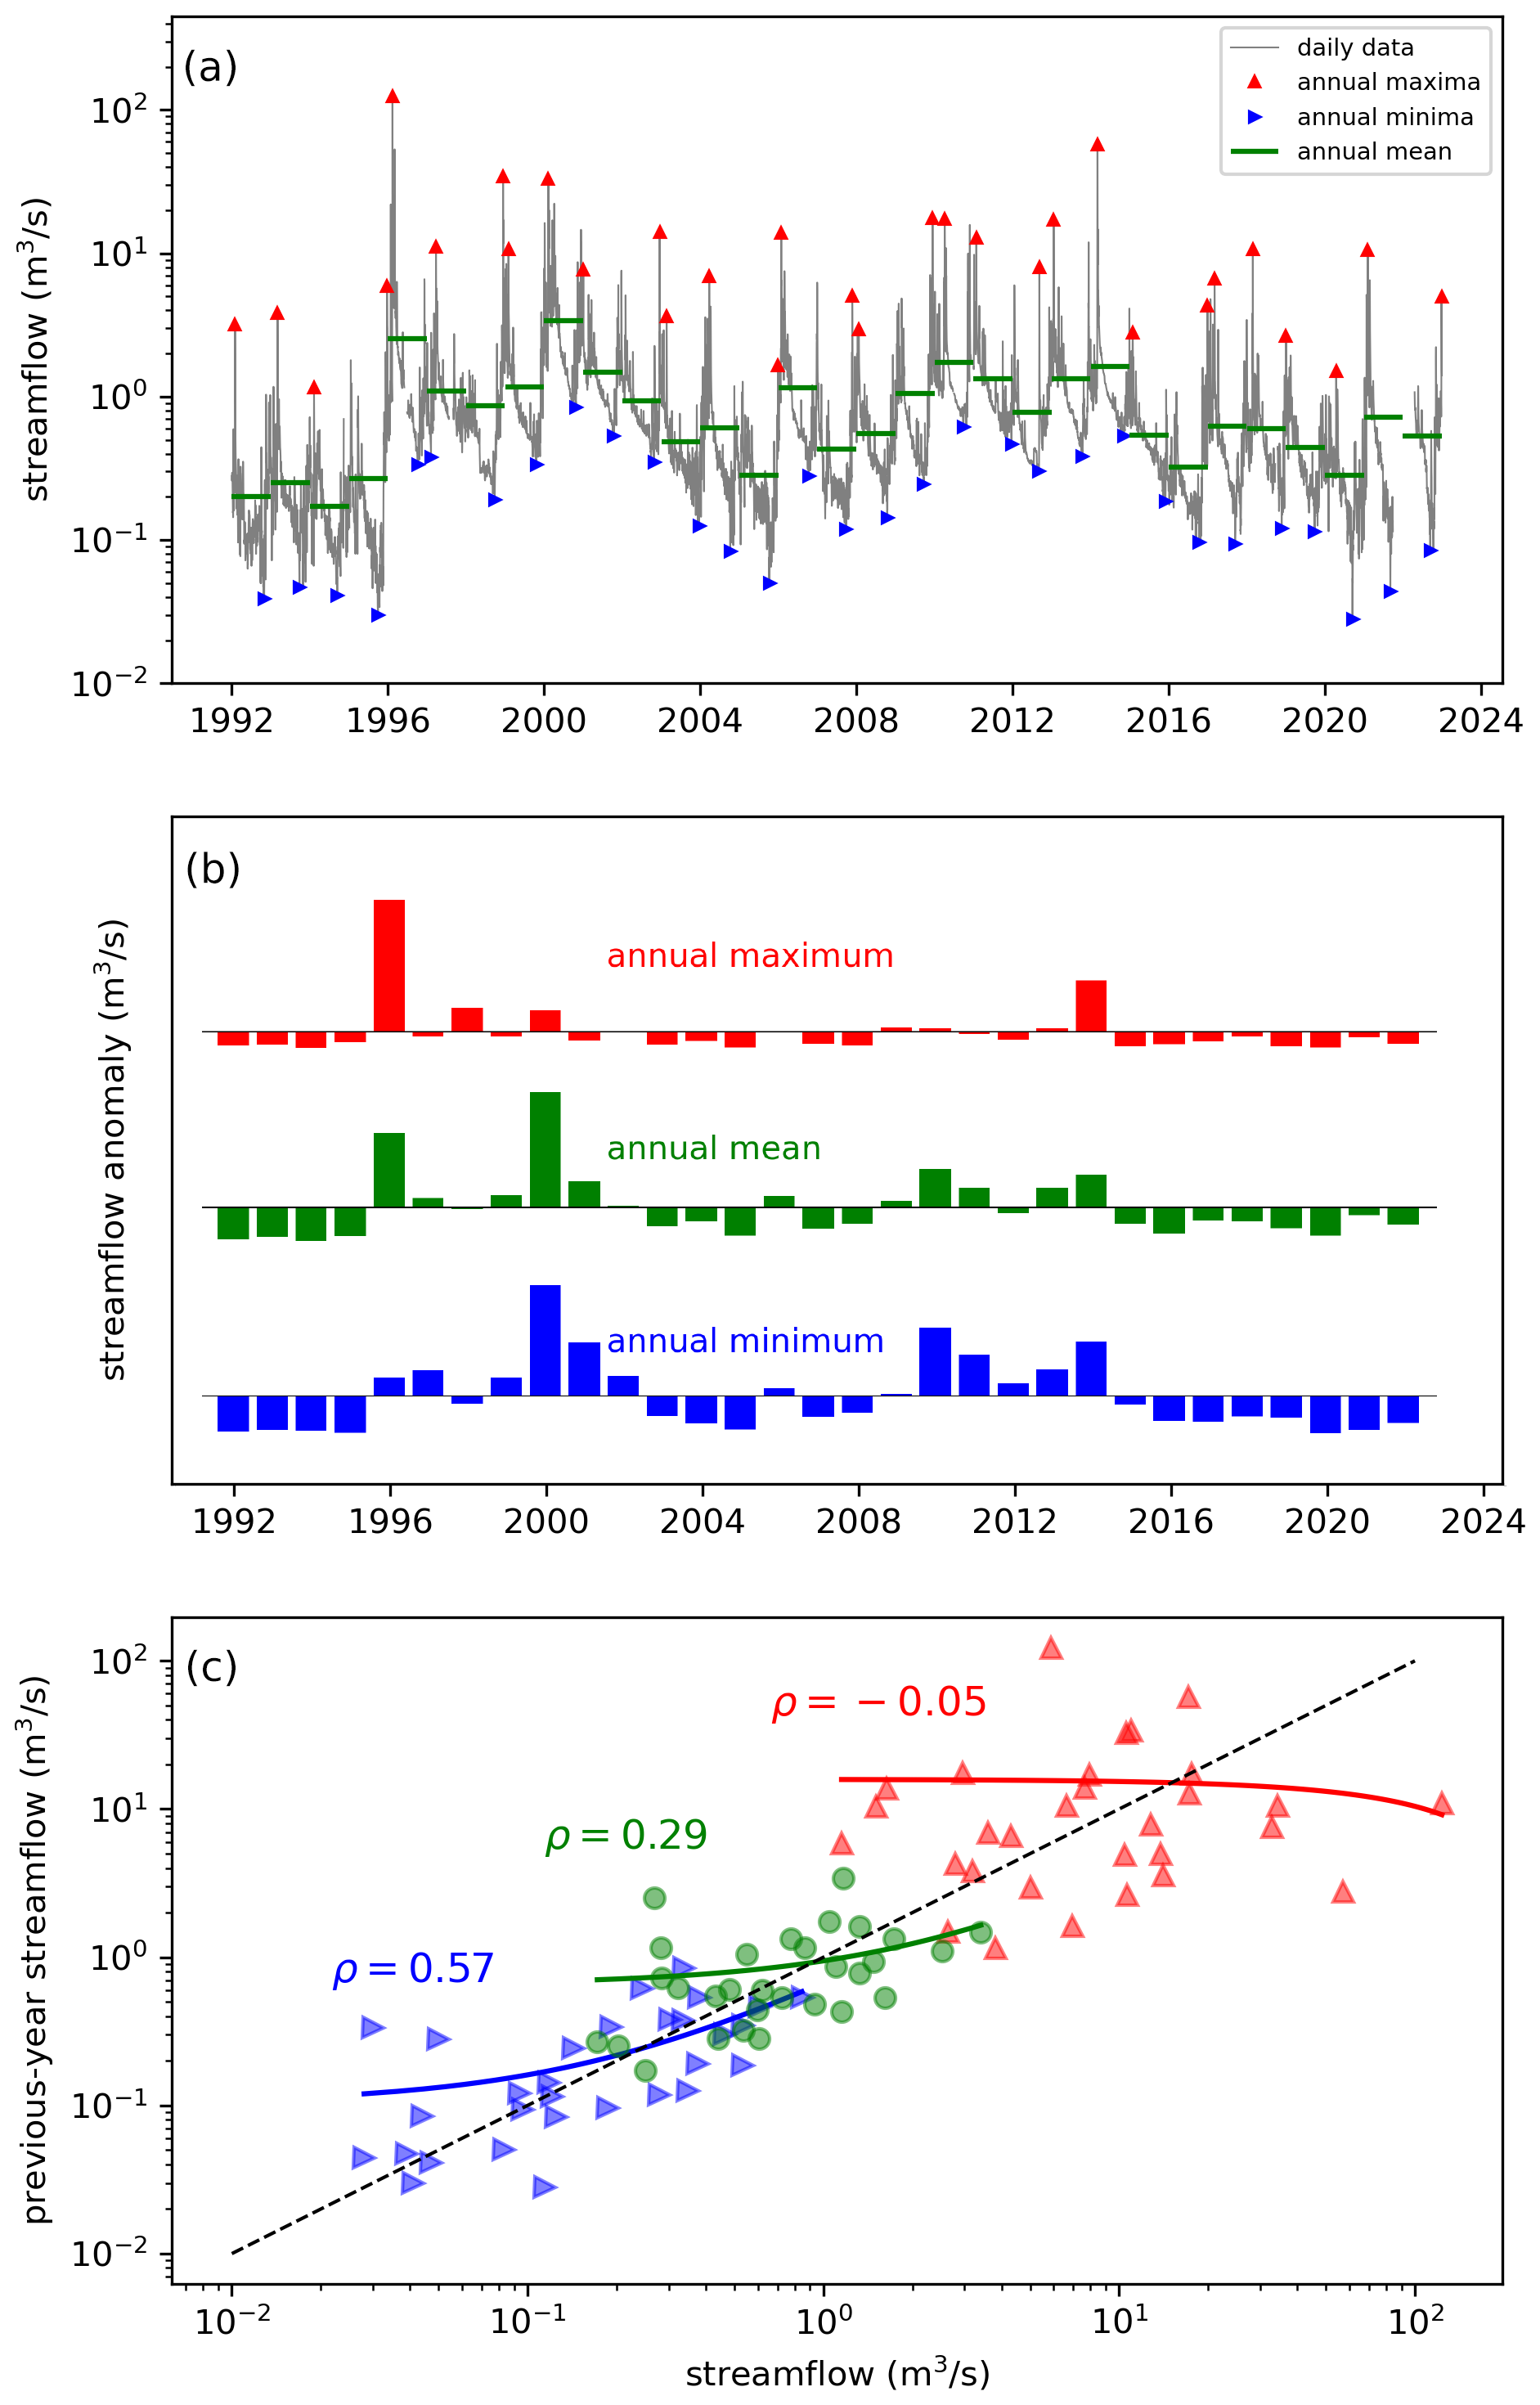
Figure 1Example streamflow time series of the Kaap (Suidkaap) River in South Africa (25.73° S, 30.98° E), highlighting the memory in annual mean, minimum, and maximum flows. From these daily time series, annual streamflow indices (mean, maximum, minimum) are selected (a). The associated annual anomalies of these streamflow indices (i.e. annual deviations from their mean value) already suggest that years with above- or below-average rates tend to follow one another (b). Correlation coefficients between each year's streamflow indices and the previous year's streamflow indices quantify the autocorrelation of the mean (0.29), minimum (0.57), and maximum (−0.05) annual flow rates. Note that these correlations are based on linear regressions, but these linear regressions appear to be non-linear on logarithmic axes. For this river, annual mean and annual minimum flows hold substantial memory, whereas annual maximum flows are largely uncorrelated (and even show some, statistically insignificant, negative autocorrelation).
A strong autocorrelation may not be hydrologically significant if it is associated with small volumes of water relative to other terms in the water balance. Therefore, we also express memory in terms of water volumes. These memory volumes Vy can be calculated based on the autocorrelation ρy. Specifically, ρy is essentially equivalent to the slope of a linear regression between yt and yt−1 and thereby also expresses an elasticity of yt to yt−1:
Thus, ρy approximately expresses the unit change in yt associated with a unit change in yt−1. To calculate the mean memory volume, we calculate the mean absolute annual anomaly of a variable y and multiply this with the autocorrelation of ρy:
where Vy is the mean annual memory volume of process y, and is the standard deviation of the anomaly of process y. Calculating Vy for several water balance components (e.g. ) allows us to trace, in terms of water volumes, how much long memory occurs on average in different components of the water cycle.
2.3 Model experiments
To further understand catchment functioning, we test how different model representations of drainage structures align with empirically derived memory behaviours. Our model experiments seek the most compact representation capable of replicating emergent behaviour across the many catchments. We examine different levels of model complexity and evaluate when the model's behaviour aligns broadly with the observed memory signatures. These model experiments, which rely on the empirical results, are discussed in detail in Sect. 3.2.2.
3.1 Memory of water balance components
Globally, terrestrial precipitation tends to have no significant annual memory (Fig. 2a) as its autocorrelation is, on average, weak (mean ρP = 0.006), and only 12 % of grid cells globally have significant positive autocorrelation at a 90 % confidence interval (i.e. p value < 0.10). This pattern of overall weak autocorrelation is in line with earlier analysis that reports autocorrelation as being statistically significant for ∼ 14 % of the global land surface (Sun et al., 2018). The absence of systematic long memory in precipitation time series does not indicate that long memory never occurs as, for example, the El Niño–Southern Oscillation (ENSO) has widespread effects on regional precipitation (Ropelewski and Halpert, 1987). However, the effects of such multi-year climate cycles appear to not result in widespread annual memory in precipitation time series globally. Due to this weak precipitation memory (Fig. 2a), the memory volume also tends to be small (Fig. 2b). Memory volumes are below 5 mm yr−1 in over 96 % of the grid cells, indicating that only a small water volume statistically relates to the previous year's precipitation rate. Thus, while precipitation is the water source of other water balance components, its memory (as indicated by both the weak autocorrelation and the small associated memory volumes) is unlikely to be the direct cause of systematic annual memory elsewhere in the water cycle.
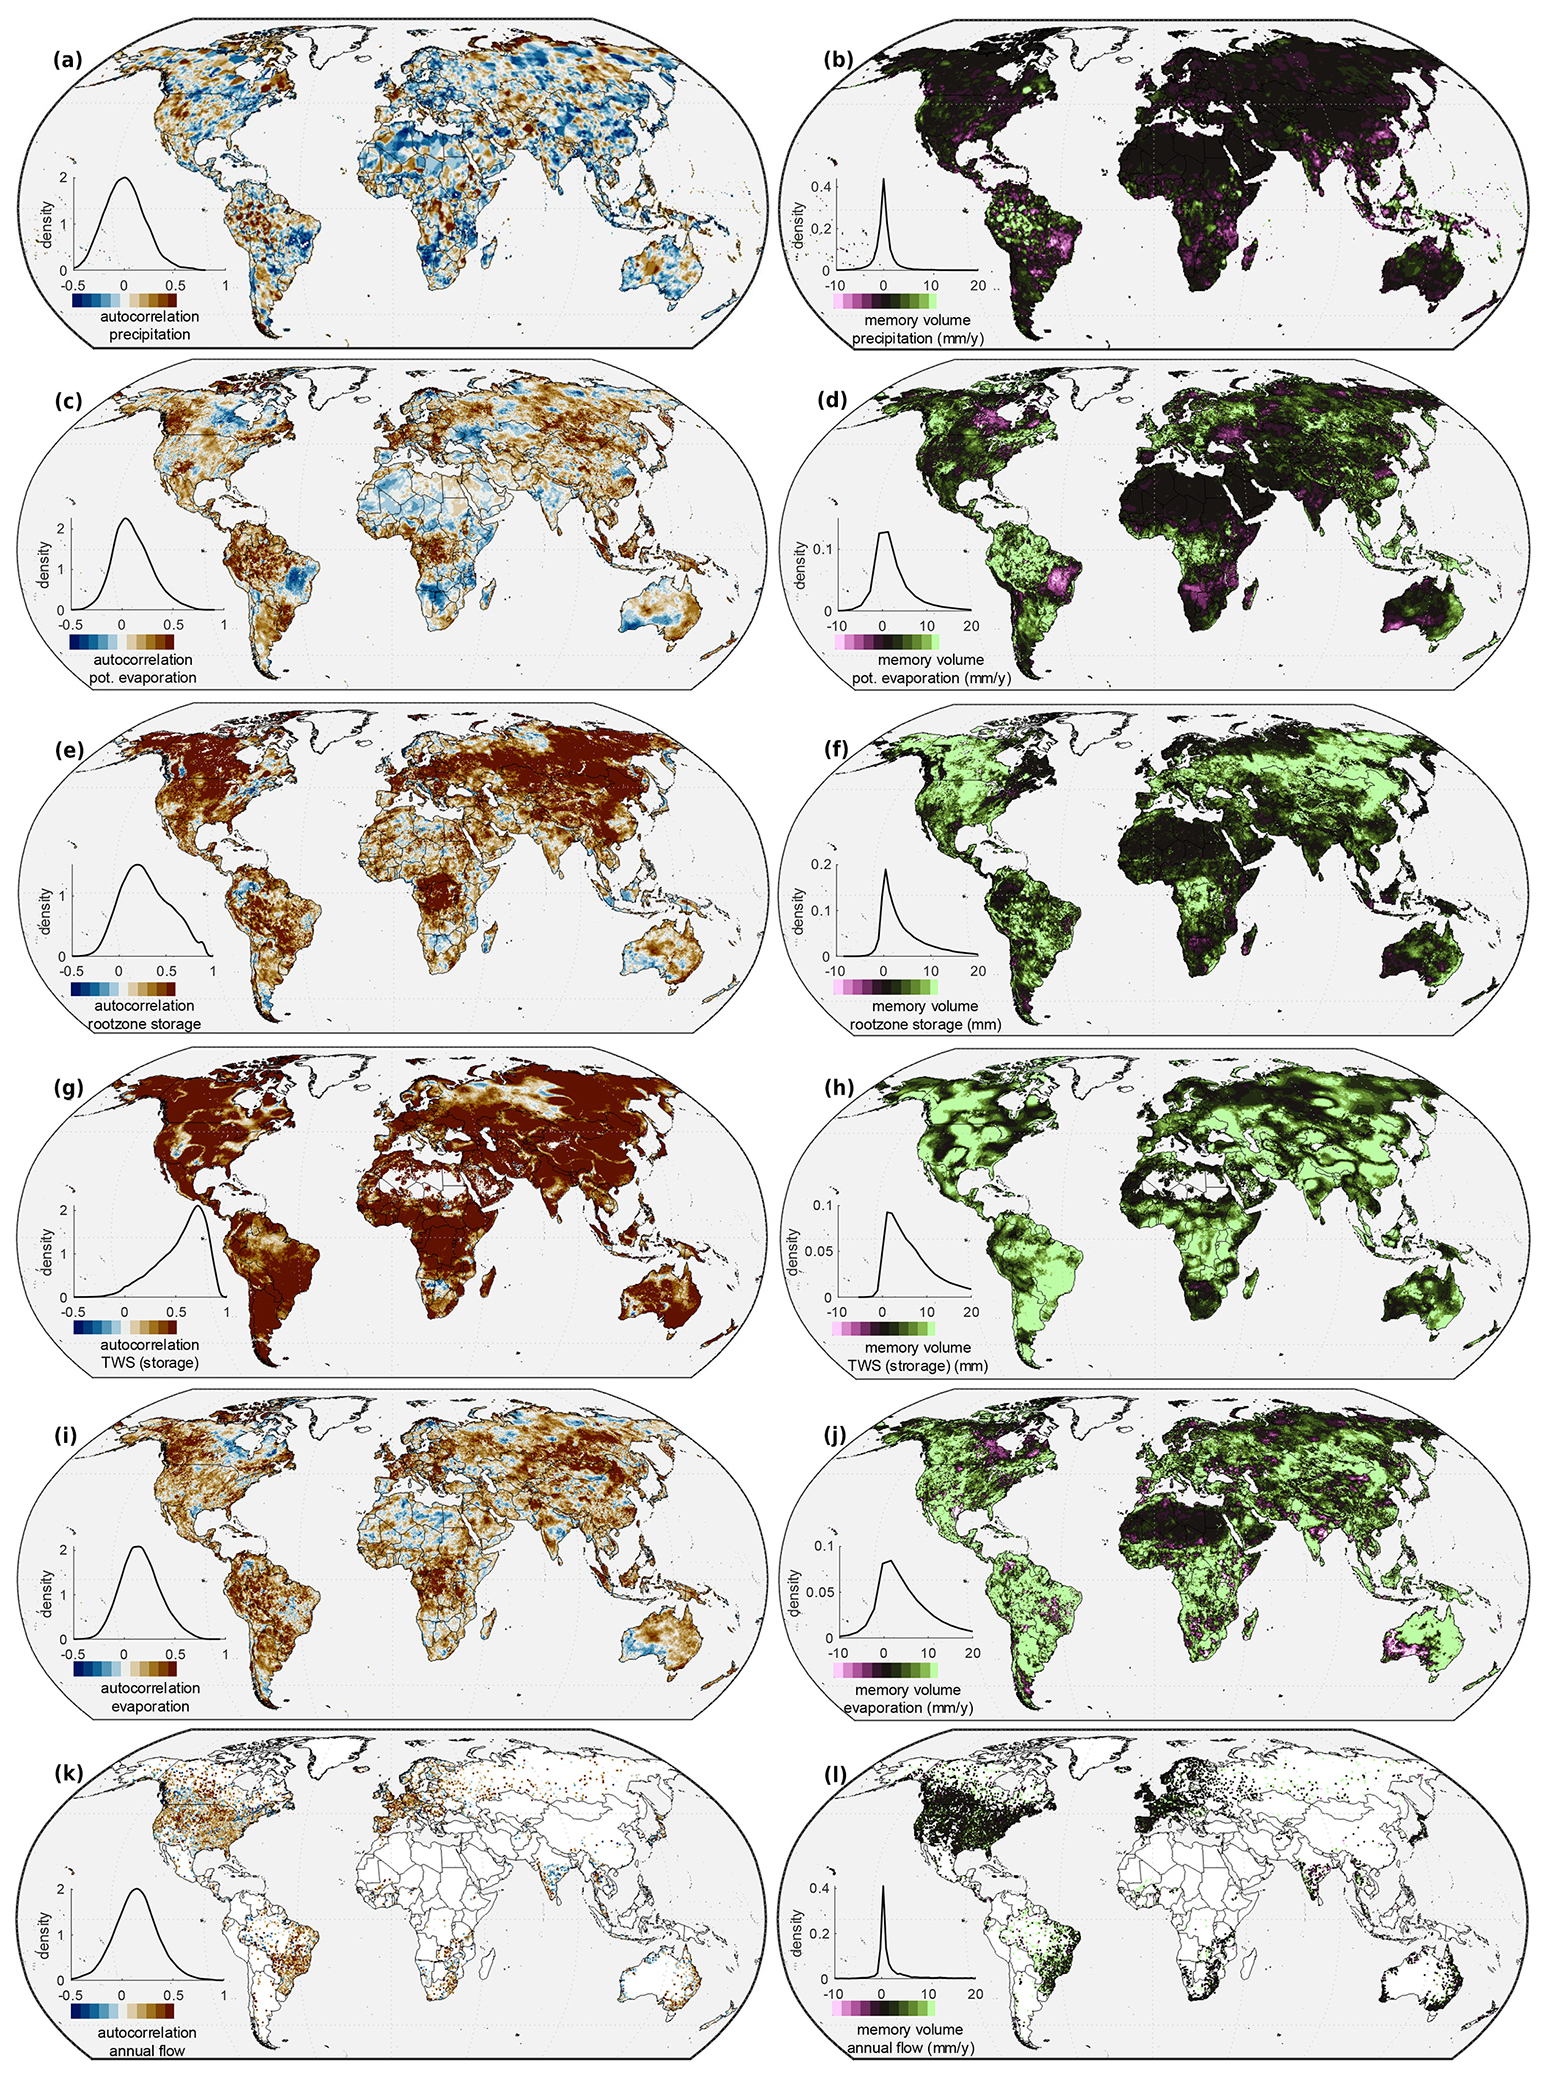
Figure 2Spatial and frequency distributions of annual memory in terrestrial water fluxes and stores (left column) and associated memory volumes (right column). Memory is, on average, absent in precipitation time series (a, b) and weak in potential evaporation (c, d). Root zone storage (e, f) and, in particular, terrestrial water storage (TWS) (g, h) exhibit strong memory. Outgoing fluxes still hold annual memory, both in evaporation (i, j) and in streamflow (k, l). Density plots of the autocorrelation and memory volumes also indicate that most memory, both in terms of volume and in terms of autocorrelation strength, tends to occur in terrestrial water storage (a–l).
Annual memory in water balance components can also originate from the memory of other atmospheric conditions that drive evaporation, such as potential evaporation or temperature; however, neither of these show particularly strong long memory. GLEAM (Priestley–Taylor based) potential evaporation tends to have some more memory (mean = 0.09) than precipitation, and this memory is significant for 26 % of the land surface (Fig. 2c). The annual variability in potential evaporation tends to be relatively small (compared to precipitation variability); thus, the potential water volumes associated with it are also generally small in volume (Fig. 2d). Air temperature tends to have weak autocorrelation (mean ρT = 0.01; not shown here). The overall weaker memory in climatic forcing compared to evaporation and streamflow (shown below) suggests that annual memory elsewhere in the water cycle does not simply mirror memory in forcing time series and therefore also originates from other processes.
More substantial annual memory arises globally once precipitation accumulates in storage. Both root zone soil moisture (mean ρSM = 0.29) and terrestrial water storage (mean ρTWS = 0.48) tend to be strongly autocorrelated. There are distinct regional differences in the annual memory of these storages (Fig. 2e–h), with stronger memory in the overall store (terrestrial water storage) than in the relatively shallower root zone (here 250 cm, but note that root zone estimates vary strongly between studies, e.g. Wang-Erlandsson et al., 2016; Stocker et al., 2023). Root zone soil moisture is consistently autocorrelated and associated with larger volumes of water that carry over to subsequent years (10.7 mm) compared to precipitation and potential evaporation time series. The strength and associated storage volumes further increase if we consider total terrestrial water storage, highlighting the role of larger long-term fluctuations than typically observed in the unsaturated zone. Terrestrial water storage has mean memory volumes of 12.9 mm. Areas with negative autocorrelation in root zone storage frequently overlap with regions of negatively autocorrelated precipitation and grasslands. We hypothesize that the limited root zone storage capacity in these regions is insufficient to buffer against variability in precipitation patterns. As a result, the temporal variability in precipitation is mirrored in the root zone storage, allowing the precipitation's negative autocorrelation to propagate through the system.
Outgoing fluxes, streamflow and evaporation, also exhibit substantial annual memory, although less strongly than storage. GLEAM evaporation data indicate that positive autocorrelation is also a common feature of evaporation globally (Fig. 2i) as 79 % of grid cells have positive autocorrelation, whereby 67 % of all cells are significant. The average autocorrelation value (ρE = 0.16) and associated memory values (mean VE = 5.7 mm) are typically higher than in precipitation (and other forcing) time series but are lower than in storage. Regional differences in GLEAM potential evaporation memory are substantially correlated with regional differences in the long memory of GLEAM evaporation (Spearman correlation coefficient rs = 0.62). However, evaporation memory appears to be further mediated by storage as this is also positively correlated with evaporation memory and because catchments with no potential evaporation memory still exhibit substantial evaporation memory. The estimated linear relationship between evaporation memory as a function of potential evaporation memory is , which shows that, for values equalling zero, ρE tends to hold memory. Regional variations in root zone storage memory are correlated with regional differences in the memory of GLEAM evaporation (rs = 0.35; estimated linear relationship: ). Thus, annual memory in actual evaporation seems to be controlled both by memory in potential evaporation and by storage memory, reflecting the interplay between energy and water supply (e.g. Milly, 1994).
Streamflow records indicate that positive autocorrelation is a common feature of streamflow globally (Fig. 2k). The vast majority (79 %) of catchments show signs of positive annual memory (i.e. positive autocorrelation). The average autocorrelation value (ρQ = 0.16) indicates that annual flow rates are often significantly related to their preceding year's values. The volumes of water associated with this are generally also smaller than in the storage memory volume (mean VQ = 2.9 mm) (Fig. 2l). These patterns vary regionally, with regions of stronger autocorrelation (e.g. western Europe, Prairie Pothole region of the United States, eastern Australia, most of Brazil and Russia, coastal western India) and regions of weaker or negative autocorrelation (e.g. western Australia, inland India) (Fig. 2k) and with large parts of Earth's surface having a few gauging stations where it remains unquantified how common annual memory is.
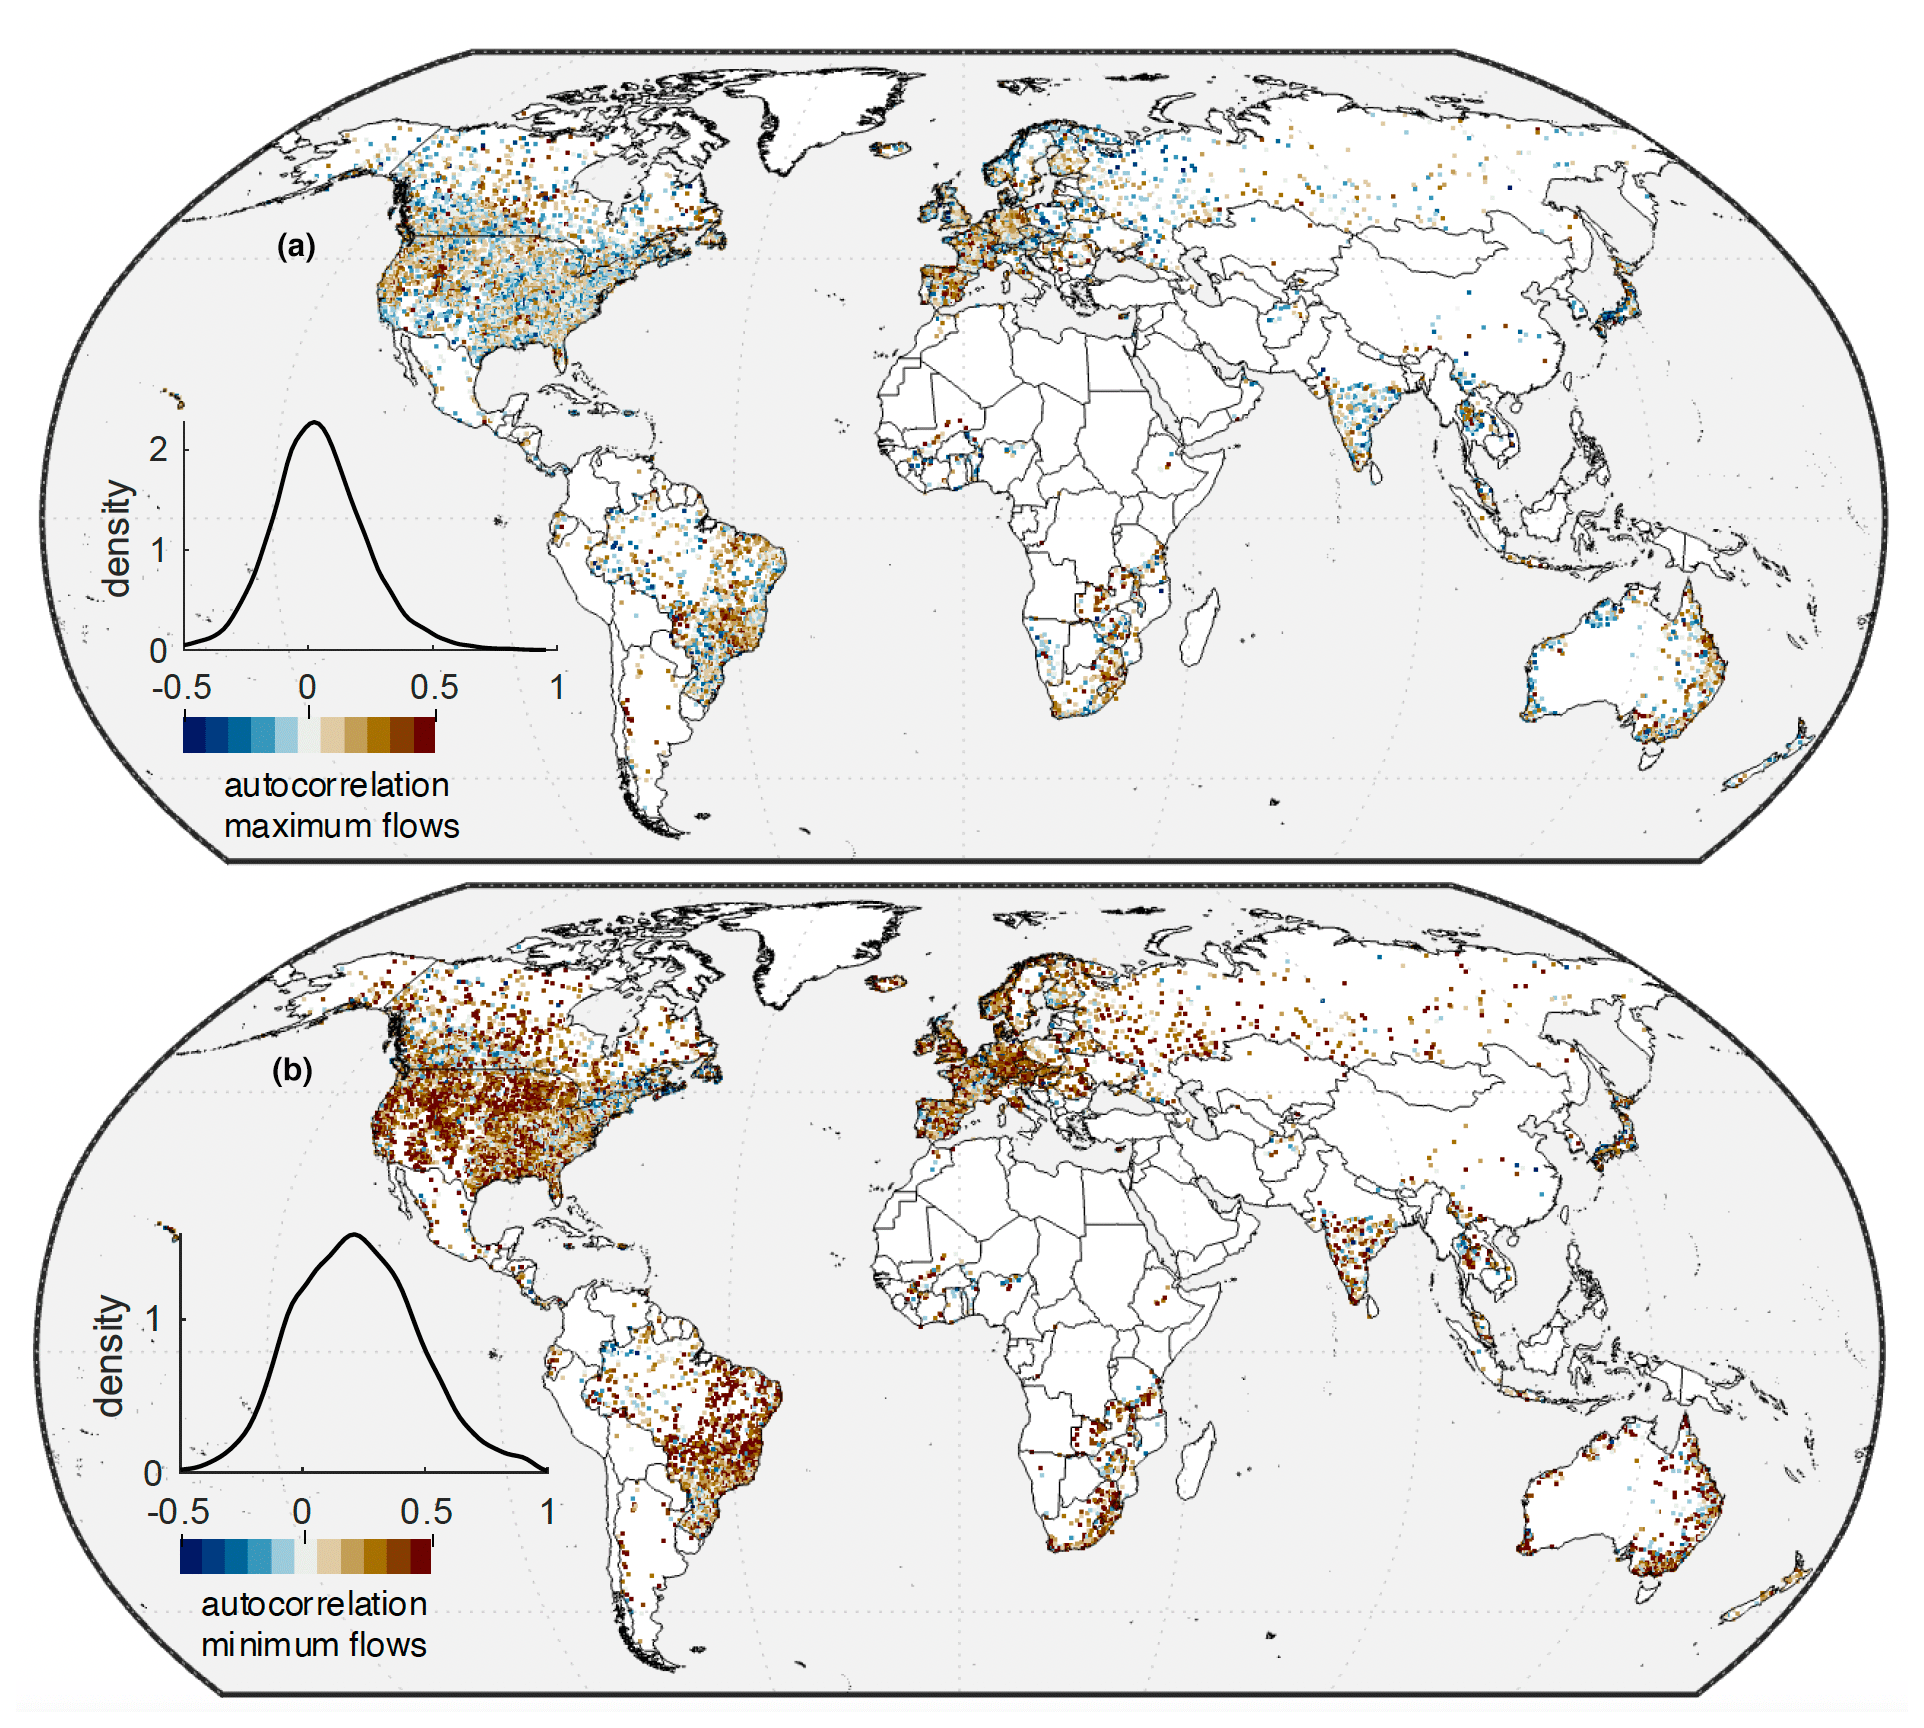
Figure 3Spatial and frequency distributions of memory in annual extreme flows across the study catchments. Annual memory of annual maximum flows (a) and annual minimum flows (b) is typically present but varies regionally. A 1-year-lag autocorrelation of annual minimum flows is typically strong (mean = 0.22) compared to annual maximum flows (mean = 0.07) across the 15 209 study catchments.
Annual memory in outgoing fluxes also occurs in extreme flows. Worldwide, memory is especially strong and common for annual minimum daily flows (Fig. 3a). These annual low flows have, on average, a stronger autocorrelation (mean ) than annual mean flows (Figs. 2k and 3a). This relatively strong memory likely reflects the fact that low flows tend to be more directly sourced from groundwater-sustained baseflow and are relatively less influenced by shorter-term precipitation variability (Van Loon, 2015). Therefore, they more directly represent the strongly autocorrelated signal of terrestrial water storage. Autocorrelation is weakly present for annual maximum flows (Fig. 3b; mean ). Annual maximum flows almost always arise through the co-occurrence of high precipitation (rainfall plus snowmelt) and baseflow or soil moisture (Berghuijs et al., 2016, 2019; Berghuijs and Slater, 2023). While these antecedent conditions tend to hold memory, this is less the case for precipitation, resulting in relatively weak autocorrelation in annual maximum flows globally.
3.2 Physical controls on memory
The spatial patterns indicate that places with stronger memory in annual mean flows also tend to have stronger memory in annual low- and high-flow conditions (Figs. 2k, 3, and 4). This relationship between the memory of different flow extremes is further substantiated by the Spearman rank correlation coefficients between the autocorrelation of annual flows, which is especially strong for annual minimum flows (rs = 0.54) but is also present for annual maximum flows (rs = 0.36) (Fig. 4b; note that rank correlations of the plotted binned points are visibly much stronger but vary depending on the details of the binning – here, each bin contains 2 % of the data). The consistent variation in memory between annual mean, high, and low flows across different catchments suggests that these memory effects are not happening independently from one another but are (at least partly) underlain by similar driving mechanisms and, potentially, similar catchment attributes. In storage, the effects of (at annual timescales, largely random) temporal variations in precipitation (and outgoing fluxes) are integrated over time (Eq. 1). The typically randomly varying precipitation inputs are integrated into more predictable storage patterns that often persist over longer timescales (Klemeš, 1974). The strong memory of storage subsequently leads to memory of outgoing fluxes of evaporation and streamflow.
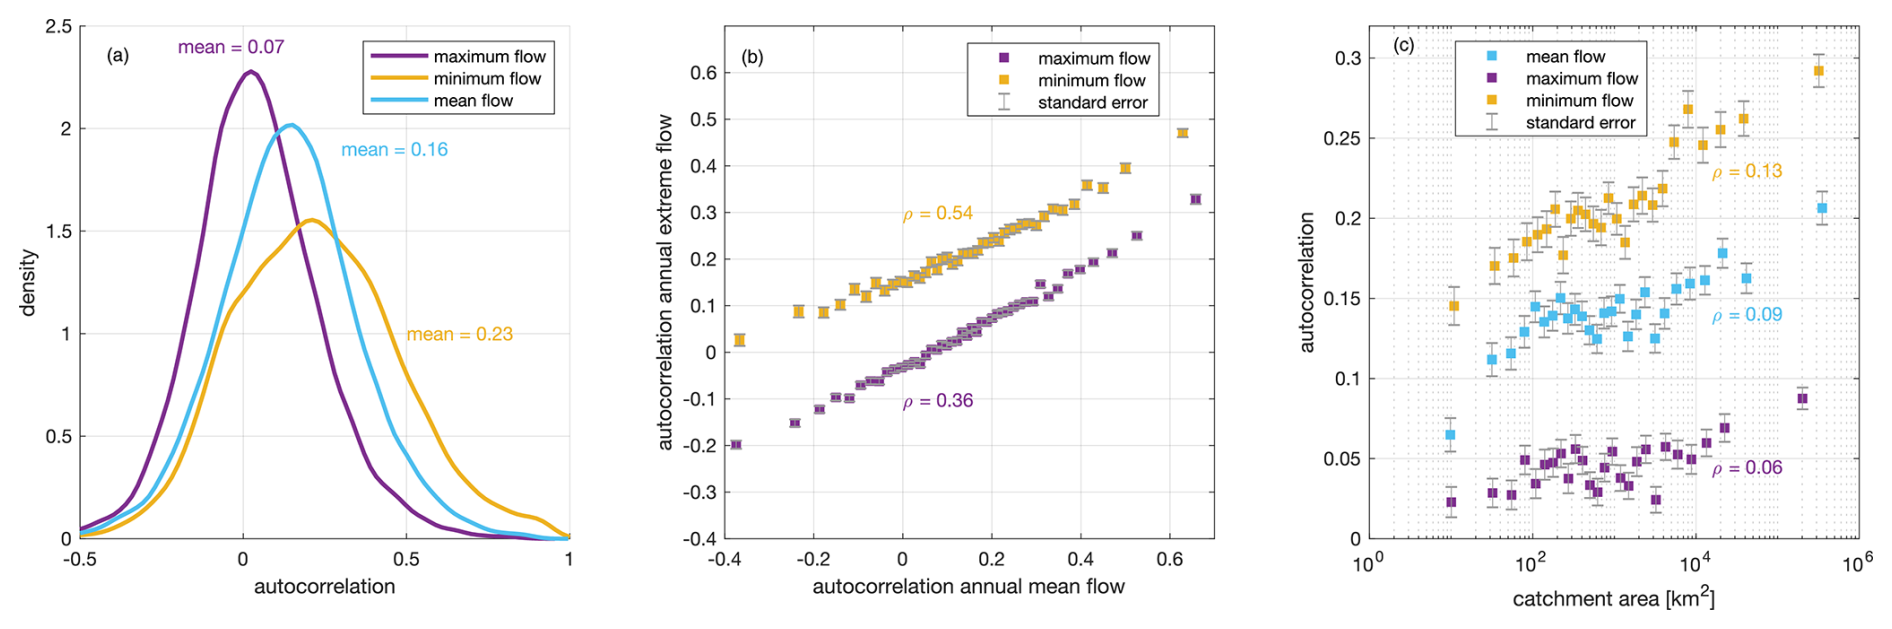
Figure 4Variations in annual memory are largely consistent across the flow regime and scale with catchment size. A 1-year-lag autocorrelation differs between mean and extreme flows (a). Memory of annual extreme flows is generally larger when the same catchment also has stronger autocorrelation of annual mean flows (b), as shown by the binned plots (each bin contains 2 % of the data). Overall, memory grows with catchment size: the largest catchments tend to have approximately twice as much memory as the smallest catchments (c). The error bars display the standard error of the mean for each bin. Spearman rank correlations (rs) are shown for the unbinned values. The rank correlations of the plotted binned points are visibly much stronger but vary depending on the details of the binning.
3.2.1 Empirical links to catchment attributes
Correlation analysis of the memory strength with catchment attributes shows that larger catchments tend to have a substantially stronger long memory (Fig. 4c). This scaling effect is not the only factor determining the strength of autocorrelation (also indicated by relatively weak Spearman correlation coefficients for mean flows (rs = 0.09, p value < 0.01), low flows (rs = 0.06, p value < 0.01), and high flows (rs = 0.13, p value < 0.01)); there is a clear tendency toward overall stronger memory for larger catchments. The 369 largest catchments in the data set exceed sizes of 100 000 km2 and cover almost 30 % of Earth's land surface. In these large catchments (Fig. 5), memory, on average, approximately doubles compared to that which is typical for the smallest catchments (Fig. 4c). This finding is consistent for annual minimum, maximum, and mean flows. This growth in memory across larger catchments is empirically consistent with earlier studies which attributed this to spatial aggregation effects (Mudelsee, 2007). Larger catchments often have more substantial alluvial aquifers, potentially enhancing memory effects.
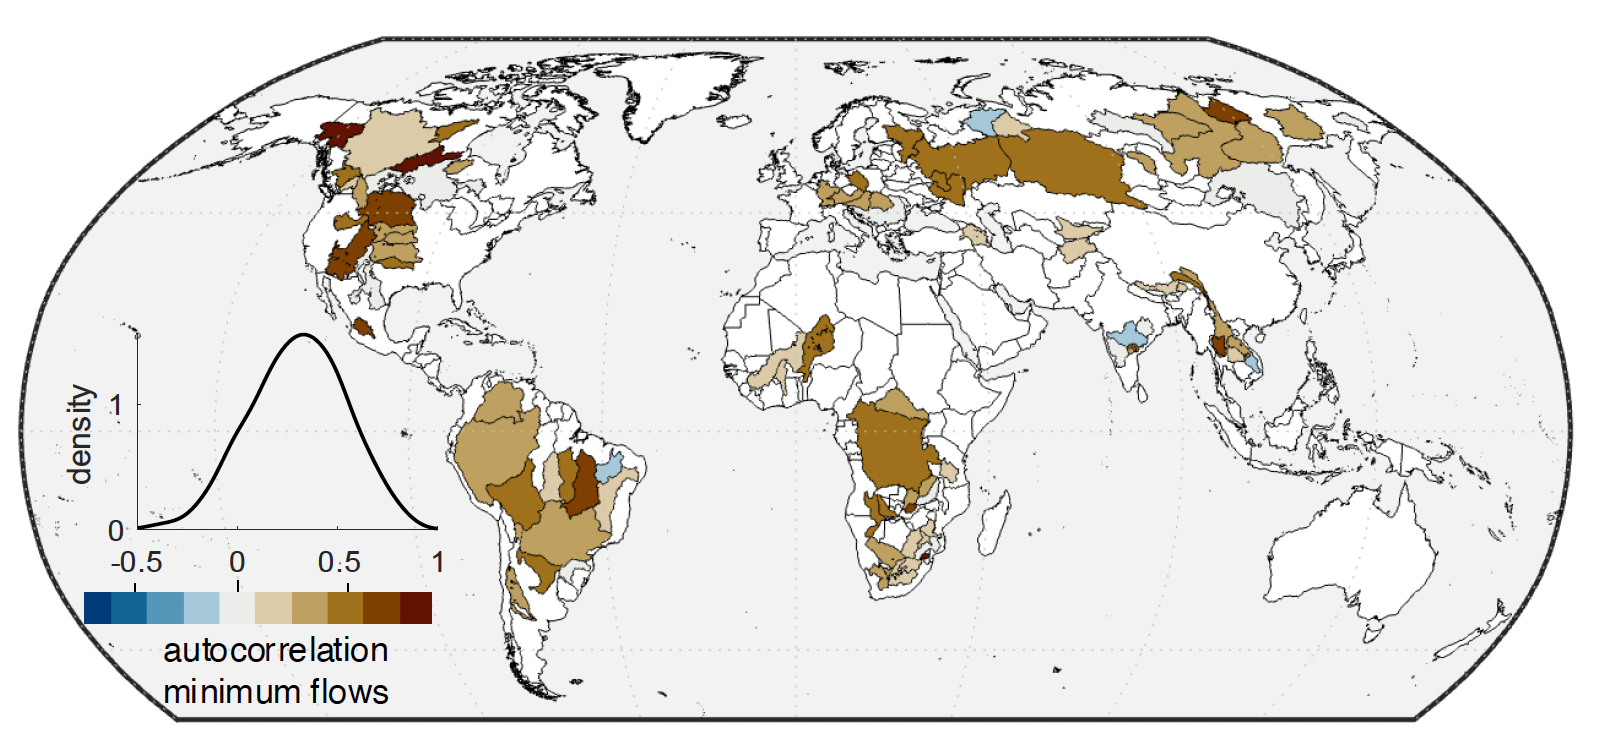
Figure 5Spatial and frequency distribution of memory in annual low-flow rates across 369 catchments, whose total area exceeds 100 000 km2; 88 % of these larger catchments have positive autocorrelation, and this autocorrelation tends to be relatively strong on average (mean = 0.30).
Spearman correlations with several other catchment properties (Do et al., 2018a), such as dam number per unit area (0.01; p value = 0.07), population density (rs = −0.003; p value = 0.18), drainage density (rs = −0.04; p value < 0.01), and slope (rs = −0.05; p value < 0.01), all exhibit weaker correlations with long memory of annual mean flows. These results indicate that links between, for example, drainage structure and groundwater flow (e.g. Luijendijk, 2022) and travel times of water and catchment slopes (e.g. Jasechko et al., 2016; Cardenas 2007) affect long memory, but rigorously testing this requires more directed analyses and is likely to be better explored at regional and local scales. Overall, from these generally weak correlations, it is hard to distinguish what catchment factors drive long memory, and the results suggest that long memory can arise across a very wide variety of catchment conditions.
The empirical patterns presented (Figs. 2–5) are subject to observational and model uncertainties. Global precipitation data sets often contain significant uncertainties, which propagate to derived data products such as soil moisture storage and evaporation (Khan et al., 2018). Storage time series from GTWS-MLrec combine GRACE observational time series with machine-learning models – partially trained on meteorological data – to extend terrestrial water storage estimates to periods preceding satellite observations (Yin et al., 2023). Streamflow time series, while relatively independent indicators of long-term hydrological variability, may also partially reflect processes like riverbed aggradation and degradation (Slater et al., 2019), which likely exhibit long-term memory effects. As a result, local-scale memory behaviour is likely to carry considerable uncertainty. In the following sections, we concentrate on the broader patterns that emerge across multiple catchments which are likely to be largely unaffected by local data uncertainties.
3.2.2 Catchment functioning driving memory: model experiments
To further understand the drivers of memory in catchments, we consider the fact that the data have shown several key memory signatures that represent typical catchment behaviour:
-
Memory in annual mean streamflow arises despite no annual memory in precipitation time series.
-
Memory is stronger for annual minimum flows than for annual mean flows.
-
Memory is weaker for annual maximum flow conditions than for annual mean flow
-
Memory in storage is substantially stronger than in streamflow.
We seek to explain how catchments function to be consistent with these memory signatures and search for explanations constructed with the smallest set of elements that can reproduce these signatures (i.e. we follow Occam's razor). In this search, we use synthetic model experiments that do not aim to mimic the behaviour of any particular catchment realistically but, instead, provide elementary representations of catchment functioning that capture the typical behaviour of catchments. By starting with the simplest model, we combine a top-down modelling approach (Klemeš, 1983; Sivapalan et al., 2003) with a search for model structures that are consistent with emergent behaviour across many catchments, consistently with the concept of “functional relationships” proposed by Gnann et al. (2023). We explore various levels of model complexity (Fig. 6) and test when the model behaviour becomes broadly consistent with the observed memory signatures. If a simple model can broadly explain the signatures, we will deliberately ignore all the catchment heterogeneity and complexity that is ubiquitous in real-world catchments but that appears not to be central in the key memory behaviours.
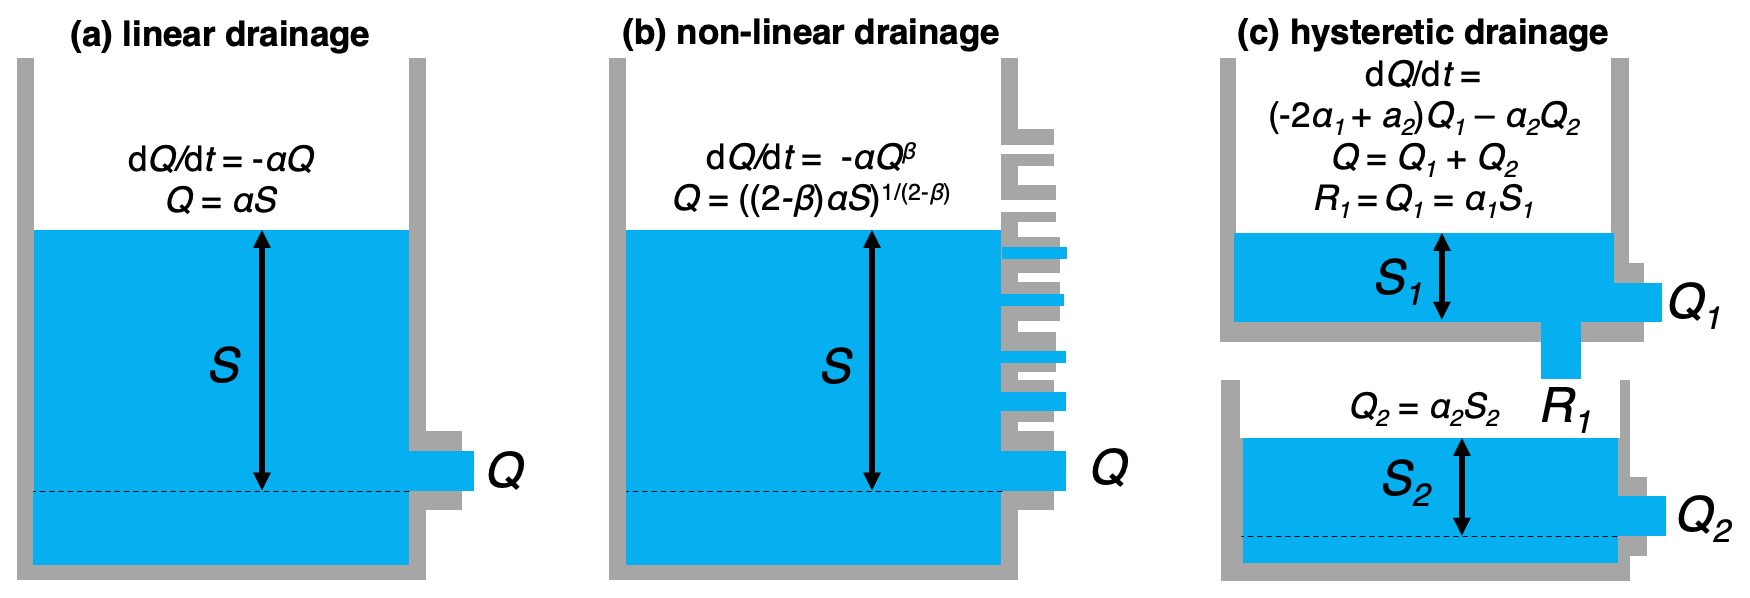
Figure 6Overview of catchment structures used in model experiments. The simplest model (linear drainage) (a) is expanded to include drainage non-linearity (b) and hysteresis (c).
The models we develop are forced by synthetic rainfall forcing without significant autocorrelation at annual timescales. Synthetic 500-year randomized daily rainfall time series vary in size at a daily scale according to a gamma distribution (shape parameter = 0.2; scale parameter = 10). In addition, annual precipitation rates vary randomly (normally distributed), with a standard deviation of 20 %. We exclude, in the interest of simplicity, evapotranspiration from the models (Fig. 6). We understand that real-world catchments evaporate part (and often even most) of their incoming precipitation (Budyko, 1974; Dorigo et al., 2021), but streamflow memory arises across a broad range of climate conditions (Figs. 2a and 3). This variety of climates – and, thus, long-term water balances – suggests that no substantial evaporation is needed to generate long memory. In addition, evaporative fluxes can be modelled using a variety of representations (e.g. Zhao et al., 2013; Knoben et al., 2018). Therefore, we do not explore its role in these experiments but encourage using this as a potentially interesting avenue for further studies on long memory.
Linear drainage
Arguably one of the simplest catchment representations is linear drainage (Fig. 6), where
A linear reservoir drains water at rate Q [L T−1], directly proportional to its (effective) water storage S [L] but at a rate dependent on the (fixed) drainage constant α [T−1].
Logically, linear reservoirs have been reported to yield some memory effects, but these effects tend to occur at shorter than annual timescales. Many real-world catchments have linear drainage timescales of weeks (e.g. Beck et al., 2013; Botter et al., 2013; Brutsaert et al., 2008), and variations in α can help, for example, to distinguish erratic regimes (with enhanced intra-seasonal streamflow variability) from persistent regimes (with more regular flow patterns) (Botter et al., 2013). However, findings on the persistence of flow regimes by Botter et al. (2013) represent memory effects of the system at sub-annual timescales. Our model experiments indicate that linear drainage does not capture annual streamflow memory unless drainage timescales become much longer than the typically reported timescales of weeks (Fig. 7). In addition, long memory does not vary substantially across flow conditions and is not stronger in storage than in streamflow because streamflow rates directly mirror storage conditions (Fig. 7; Eq. 8). Thus, linear drainage (unsurprisingly) fails to reproduce most of the identified key memory signatures. We also note that model experiments suggest that absolute rates of autocorrelation can be sensitive to the forcing pattern as results vary slightly between simulations. This suggests that earlier reported local autocorrelation values (e.g. Figs. 2 and 3) are not an intrinsically stable metric of catchment behaviour at the scale of an individual catchment but will vary, even when forcing statistics appear to be rather stable.
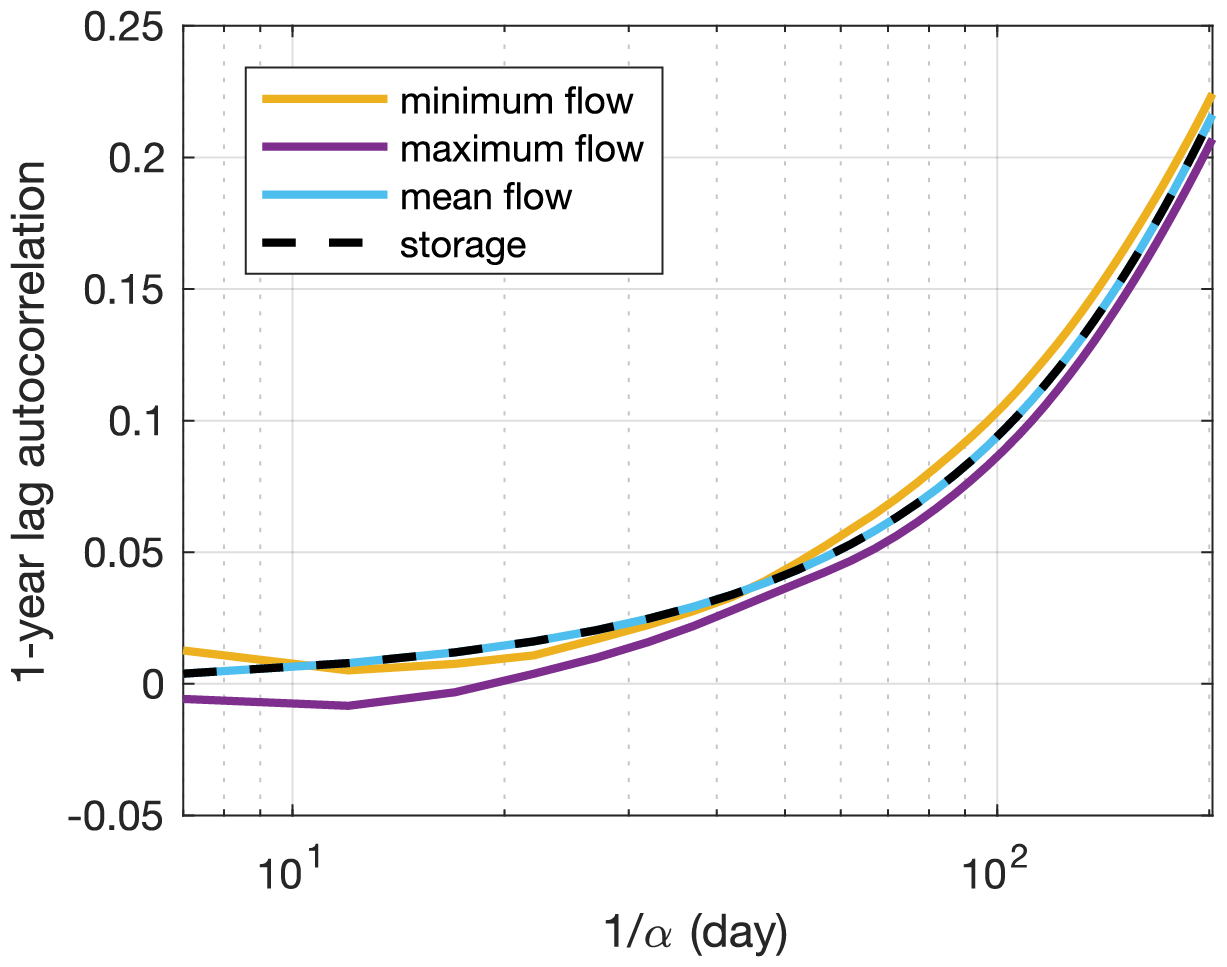
Figure 7Example of the scaling of drainage timescales (x axis) and 1-year-lag autocorrelation (y axis) for annual mean flow, annual maximum flow, annual minimum flow, and annual mean storage for linear drainage. The slow growth of autocorrelation with drainage timescale indicates that it is only for much longer than typically observed drainage timescales (e.g. > 100 d) that substantial (> 0.1) autocorrelation is generated. In addition, long memory does not vary substantially across flow conditions and is not stronger in storage than in streamflow.
Non-linear drainage
A catchment representation that is one step more complex can also have non-linear drainage (e.g. Brutsaert and Nieber, 1977; Harman et al., 2009; Kirchner, 2009), where
Here, β [–] and α [] are recession constants. For β = 1, drainage behaviour is linear, and Eqs. (7) and (8) would become equivalents to Eqs. (5) and (6). However, for β > 1, which is commonly observed, drainage timescales become longer at low flows compared to at high flows. For β < 1, the opposite occurs, but this behaviour is less commonly observed in real-world catchments (e.g. Bogaart et al., 2016; Berghuijs et al., 2016). Equation (7) can be rewritten as follows:
where , and a0 [T−1] is the drainage constant at the mean streamflow rate . This allows for the expression of non-linear drainage in terms of a recession timescale [T] and drainage non-linearity β [–] (McMillan et al., 2014).
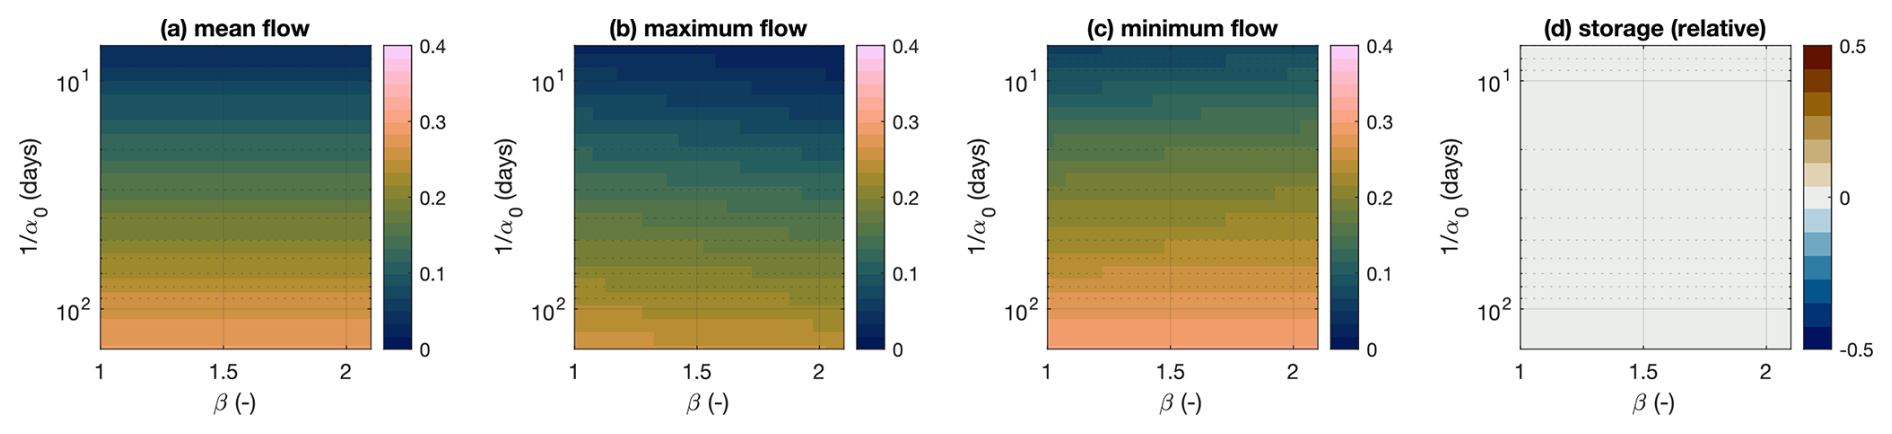
Figure 8Memory generated in non-linear drainage conditions as a function of the normalized drainage timescale () and the drainage non-linearity (β). Colours indicate 1-year-lag autocorrelation for annual mean flow (a); annual maximum flow (b); annual minimum flow (c); and the memory of annual mean storage minus the memory of annual mean flows (d), which shows no substantial differences. The latter emphasizes that there is no clear memory difference between storage and streamflow. Note that the y axes displaying the drainage timescale are logarithmic.
Our model experiments (Fig. 8) indicate that longer (normalized) recession timescales () lead to memory in annual mean streamflow (Fig. 8a), largely independently of the degree of drainage non-linearity (β). In addition, these simulations show stronger memory in low flows than in mean and high flows (Fig. 8a–c), whereby the low flows exhibit more memory when drainage becomes more non-linear, whereas high flows show decreasing memory under more non-linear drainage. Memory in storage and streamflow is still nearly equivalent (Fig. 8d). The latter is shown by the differences between annual mean storage and annual mean flow all being very close to zero (Fig. 8d). Combinations of α and β that are derived from streamflow time series across many catchments (e.g. Bogaart et al., 2016; Berghuijs et al., 2016) tend to be mostly outside the range expected to yield substantial annual memory. These inferences suggest that drainage non-linearity by itself is not yet a mechanism that can solely be responsible for all the observed long-memory signatures.
Hysteretic drainage
Non-linearity can cause some annual memory (Fig. 8), but the non-hysteretic catchment representations (i.e. with a unique storage–discharge relationship) used thus far cause storage and outflows to be similarly autocorrelated (Fig. 8d). A model of two (in series) connected reservoirs that both linearly drain water but at two different timescales results in hysteretic drainage(e.g. Fovet et al., 2015; Gharari et al., 2018), where
Drainage timescales of the upper reservoir (parameterized by α1 [T−1]) broadly reflect (typically faster) runoff generation in and over the unsaturated zone, whereas drainage timescales from the lower reservoir (parameterized by α2 [T−1]) broadly reflect (typically slower) groundwater drainage. Recharge R1 [L T−1] from the upper box (where all precipitation enters) toward the lower box is also set at a rate of Q1 [L T−1], which means that half of the drainage from the upper reservoir passes through the lower reservoir before becoming streamflow. This simplified relationship is broadly consistent with estimates that just over half of the global river flow originates from groundwater (Xie et al., 2024).
In this hysteretic (and, thus, non-linear) drainage setup, a catchment can have a fast streamflow response in the upper reservoir while also exhibiting an underlying lower-frequency streamflow variation driven by the lower reservoir. Half of the drainage from the upper reservoir passes through the lower reservoir before becoming streamflow; therefore, long-term averages of Q1 and Q2 must be similar. This also implies that the mean storage volumes of the two reservoirs are related to one another according to the ratio of the two drainage timescales: . Thus, when the lower reservoir has a substantially longer drainage timescale than the upper reservoir, most water will be stored in the lower reservoir, and this storage will vary more slowly than the upper reservoir. Consequently, in this setup, memory can become substantially stronger in overall storage (S1+S2) than in streamflow (Q1+Q2).
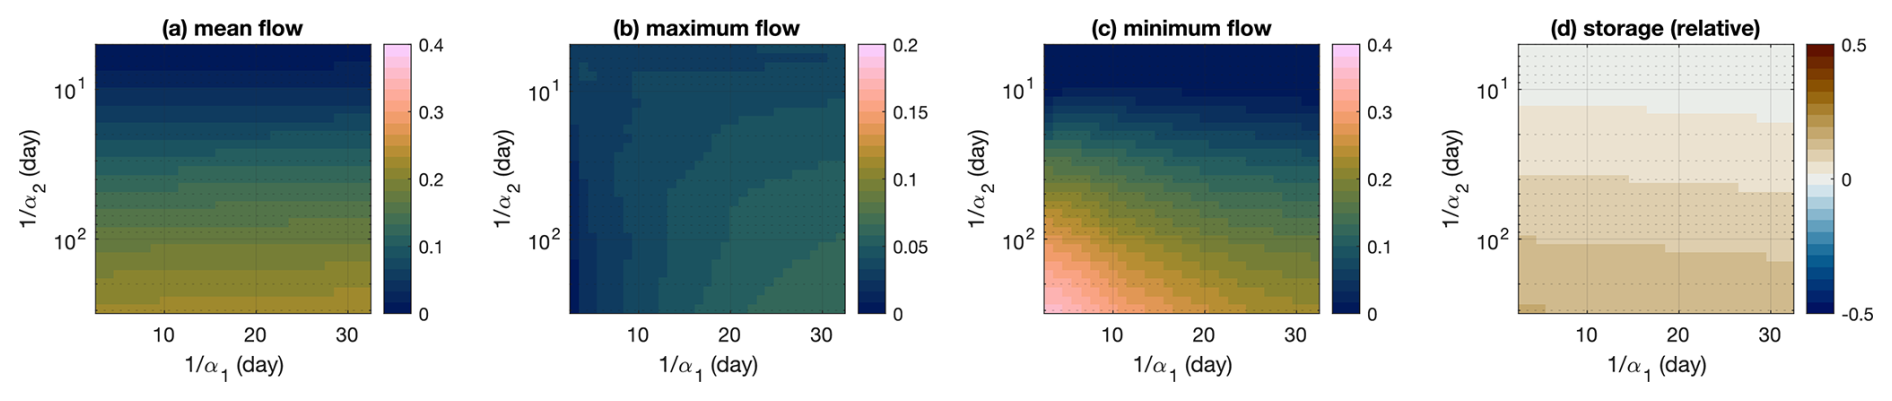
Figure 9Memory generated in hysteretic drainage conditions. The axes indicate variations in the drainage timescales of both reservoirs, whereas colours indicate 1-year-lag autocorrelation for annual mean flow (a), annual maximum flow (b), annual minimum flow (c), and the memory of annual mean storage minus that of annual mean flow (d). Note that the y axes are logarithmic.
Our model experiments indicate that, especially for sufficiently long drainage timescales of the lower reservoir, streamflow can exhibit annual memory in streamflow (Fig. 9a). This memory in annual mean flows is largely independent of the faster-draining upper reservoir. When the drainage in the upper reservoir is much faster than in the lower reservoir, several other simulated memory signatures also become consistent with the observations. Namely, memory becomes stronger for annual low flows than for annual mean flows (Fig. 9a–c) because low flows are more determined by the slower lower reservoir. In addition, memory is much weaker for annual maximum flow conditions than for annual mean flow because high flows are more determined by the faster upper reservoir (which holds less memory). Furthermore, annual memory in storage is substantially stronger than in streamflow because most storage is present in the lower reservoir (Fig. 9d), and this storage varies across longer timescales than overall streamflow (of which only 50 % originates from this slower reservoir).
Our simulations suggest that hysteresis is central to the observed memory signatures. We acknowledge that these simulations are overly simplified catchment representations and do not constitute a detailed and accurate model for any specific catchment. However, they demonstrate how some basic mechanisms (which are also encodable in more complex and detailed models) can lead to behaviour that is consistent with the observed memory signatures. Bucket-type spatially lumped models are widely employed in catchment modelling (for a good overview, see Knoben et al., 2019). More complex (spatially distributed) model structures could also be explored to examine their degree of non-linearity and hysteresis. In addition, the model outcomes also reflect those of detailed model implementations in real-world catchments where the addition of a groundwater component that allowed for very low-frequency fluctuations in groundwater flows helped to simultaneously improve streamflow and water storage predictions substantially (e.g. Hulsman et al., 2021).
Long memory was discovered decades ago in annual flow records of the Nile River, and, later, more widespread evidence of long memory in annual flows was reported for many rivers worldwide. The presence of such memory could prolong drought and flood risks and affect water resources over long periods, but the global universality, strength, and origin of long memory in the water balance components and hydrological extremes remain largely unquantified. Here, we quantified annual memory in the terrestrial water cycle using autocorrelation applied to annual time series of water balance components globally. The global gridded and catchment-scale data sets used here indicate that annual memory is typically weak in incoming terrestrial fluxes and forcing but becomes strong in terrestrial water stores and cascades into outgoing fluxes. Annual memory is not limited to annual streamflow rates but often extends toward annual extreme flows and is especially strong for low flows and in large catchments. Our model experiments indicate that this memory arises with the increasing non-linearity of catchment response, but storage–discharge relationships also need to account for hysteresis effects to produce all observed memory signatures. Incorporating these dynamics may be important to produce multi-year low-frequency variations in the terrestrial water cycle, as recently demonstrated by Hulsman et al. (2021), and could also have implications for our understanding of other processes that may be affected by memory of water stores and fluxes, such as vegetation dynamics (Koirala et al., 2017) and atmospheric CO2 growth rates (Humphrey et al., 2018).
GPCC data are available from https://psl.noaa.gov/data/gridded/data.gpcc.html (Schneider et al., 2015), GLEAM data are available from https://www.gleam.eu, last access: 16 February 2024 (Martens et al., 2017), GSIM data are available from https://doi.org/10.1594/PANGAEA.887477 (Do et al., 2018b), and GTWS-MLrec data are available from https://doi.org/10.5281/zenodo.10040927 (Yin, 2023).
WRB initiated the study, performed all analyses, and led the writing. All the authors contributed to refining the analyses and writing.
At least one of the (co-)authors is a member of the editorial board of Hydrology and Earth System Sciences. The peer-review process was guided by an independent editor, and the authors also have no other competing interests to declare.
Publisher's note: Copernicus Publications remains neutral with regard to jurisdictional claims made in the text, published maps, institutional affiliations, or any other geographical representation in this paper. While Copernicus Publications makes every effort to include appropriate place names, the final responsibility lies with the authors.
We thank James Kirchner for the constructive comments.
This paper was edited by Mariano Moreno de las Heras and reviewed by Michael Roderick and one anonymous referee.
Beck, H. E., Van Dijk, A. I., Miralles, D. G., De Jeu, R. A., Bruijnzeel, L. A., McVicar, T. R., and Schellekens, J.: Global patterns in base flow index and recession based on streamflow observations from 3394 catchments, Water Resour. Res., 49, 7843–7863, https://doi.org/10.1002/2013WR013918, 2013.
Becker, A., Finger, P., Meyer-Christoffer, A., Rudolf, B., Schamm, K., Schneider, U., and Ziese, M.: A description of the global land-surface precipitation data products of the Global Precipitation Climatology Centre with sample applications including centennial (trend) analysis from 1901–present, Earth Syst. Sci. Data, 5, 71–99, https://doi.org/10.5194/essd-5-71-2013, 2013.
Berghuijs, W. R. and Slater, L. J.: Groundwater shapes North American river floods, Environ. Res. Lett., 18, 034043, https://doi.org/10.1088/1748-9326/acbecc, 2023.
Berghuijs, W. R., Hartmann, A., and Woods, R. A.: Streamflow sensitivity to water storage changes across Europe, Geophys. Res. Lett., 43, 1980–1987, https://doi.org/10.1002/2016GL067927, 2016.
Berghuijs, W. R., Aalbers, E. E., Larsen, J. R., Trancoso, R., and Woods, R. A.: Recent changes in extreme floods across multiple continents, Environ. Res. Lett., 12, 114035, https://doi.org/10.1088/1748-9326/aa8847, 2017.
Berghuijs, W. R., Harrigan, S., Molnar, P., Slater, L. J., and Kirchner, J. W.: The relative importance of different flood-generating mechanisms across Europe, Water Resour. Res., 55, 4582–4593, https://doi.org/10.1029/2019WR024841, 2019.
Blöschl, G., Kiss, A., Viglione, A., Barriendos, M., Böhm, O., Brázdil, R., Coeur, D., Demarée, G., Llasat, M.C., Macdonald, N., Retsö, D., Roald, L., Schmocker-Fackel, P., Amorim, I., Belínová, M., Benito, G., Bertolin, C., Camuffo, D., Cornel, D., Doktor, R., Elleder, L., Enzi, S., Garcia, J. C., Glaser, R., Hall, J., Haslinger, K., Hofstätter, M., Komma, J., Limanówka, D., Lun, D., Panin, A., Parajka, J., Petric ́ H., Rodrigo, F. S., Rohr, C., Schönbein, J., Schulte, L., Silva, L. P., Toonen, W. H. J., Va- lent, P., Waser, J., and Wetter, O.: Current European flood-rich period exceptional compared with past 500 years, Nature, 583, 560–566, https://doi.org/10.1038/s41586-020-2478-3, 2020.
Bogaart, P. W., van der Velde, Y., Lyon, S. W., and Dekker, S. C.: Streamflow recession patterns can help unravel the role of climate and humans in landscape co-evolution, Hydrol. Earth Syst. Sci., 20, 1413–1432, https://doi.org/10.5194/hess-20-1413-2016, 2016.
Botter, G., Basso, S., Rodriguez-Iturbe, I., and Rinaldo, A.: Resilience of river flow regimes, P. Natl. Acad. Sci. USA, 110, 12925–12930, https://doi.org/10.1073/pnas.1311920110, 2013.
Brutsaert, W.: Long-term groundwater storage trends estimated from streamflow records: Climatic perspective, Water Resour. Res., 44, W02409, https://doi.org/10.1029/2007WR006518, 2008.
Brutsaert, W. and Nieber, J. L.: Regionalized drought flow hydrographs from a mature glaciated plateau, Water Resour. Res., 13, 637–643, https://doi.org/10.1029/WR013i003p00637, 1977.
Budyko, M. I.: Climate and Life, Academic Press, New York, 508 pp., 1974.
Cardenas, M. B.: Potential contribution of topography-driven regional groundwater flow to fractal stream chemistry: Residence time distribution analysis of Tóth flow, Geophys. Res. Lett., 34, L05403, https://doi.org/10.1029/2006GL029126, 2007.
de Lavenne, A., Andréassian, V., Crochemore, L., Lindström, G., and Arheimer, B.: Quantifying multi-year hydrological memory with Catchment Forgetting Curves, Hydrol. Earth Syst. Sci., 26, 2715–2732, https://doi.org/10.5194/hess-26-2715-2022, 2022.
Do, H. X., Gudmundsson, L., Leonard, M., and Westra, S.: The Global Streamflow Indices and Metadata Archive (GSIM) – Part 1: The production of a daily streamflow archive and metadata, Earth Syst. Sci. Data, 10, 765–785, https://doi.org/10.5194/essd-10-765-2018, 2018a.
Do, H. X., Gudmundsson, L., Leonard, M., and Westra, S.: The Global Streamflow Indices and Metadata Archive – Part 1: Station catalog and Catchment boundary, PANGAEA [data set], https://doi.org/10.1594/PANGAEA.887477, 2018b.
Dorigo, W., Dietrich, S., Aires, F., Brocca, L., Carter, S., Cretaux, J. F., Dunkerley, D., Enomoto, H., Forsberg, R., Güntner, A., Hegglin, M. I., Hollmann, R., Hurst, D. F., Johannessen, J. A., Kummerow, C., Lee, T., Luojus, K., Looser, U., Miralles, D. G., Pellet, V., Recknagel, T., Vargas, C. R., Schneider, U., Schoeneich, P., Schröder, M., Tapper, N., Vuglinsky, V., Wagner, W., Yu, L., Zappa, L., Zemp, M., and Aich, V.: Closing the water cycle from observations across scales: Where do we stand?, B. Am. Meteorol. Soc., 102, E1897–E1935, https://doi.org/10.1175/BAMS-D-19-0316.1, 2021.
Fan, Y. and Van den Dool, H.: A global monthly land surface air temperature analysis for 1948–present, J. Geophys. Res.-Atmos., 113, D01103, https://doi.org/10.1029/2007JD008470, 2008.
Fovet, O., Ruiz, L., Hrachowitz, M., Faucheux, M., and Gascuel-Odoux, C.: Hydrological hysteresis and its value for assessing process consistency in catchment conceptual models, Hydrol. Earth Syst. Sci., 19, 105–123, https://doi.org/10.5194/hess-19-105-2015, 2015.
Fraedrich, K. and Blender, R.: Scaling of atmosphere and ocean temperature correlations in observations and climate models, Phys. Rev. Lett., 90, 108501–108501, https://doi.org/10.1103/PhysRevLett.90.108501, 2003.
Gharari, S. and Razavi, S.: A review and synthesis of hysteresis in hydrology and hydrological modeling: Memory, path-dependency, or missing physics?, J. Hydrol., 566, 500–519, https://doi.org/10.1016/j.jhydrol.2018.06.037, 2018.
Gnann, S., Reinecke, R., Stein, L., Wada, Y., Thiery, W., Müller Schmied, H., Satoh, Y., Pokhrel, Y., Ostberg, S., Koutroulis, A., Hanasaki, N., Grillakis, M., Gosling, S. N., Burek, P., Bierkens, M. F. P., and Wagener, T.: Functional relationships reveal differences in the water cycle representation of global water models, Nature Water, 1, 1079–1090, https://doi.org/10.1038/s44221-023-00160-y, 2023.
Godsey, S. E., Kirchner, J. W., and Tague, C. L.: Effects of changes in winter snowpacks on summer low flows: case studies in the Sierra Nevada, California, USA, Hydrol. Process., 28, 5048–5064, https://doi.org/10.1002/hyp.9943, 2014.
Gudmundsson, L., Tallaksen, L. M., Stahl, K., and Fleig, A. K.: Low-frequency variability of European runoff, Hydrol. Earth Syst. Sci., 15, 2853–2869, https://doi.org/10.5194/hess-15-2853-2011, 2011.
Gudmundsson, L., Do, H. X., Leonard, M., and Westra, S.: The Global Streamflow Indices and Metadata Archive (GSIM) – Part 2: Quality control, time-series indices and homogeneity assessment, Earth Syst. Sci. Data, 10, 787–804, https://doi.org/10.5194/essd-10-787-2018, 2018.
Harman, C. J. and Sivapalan, M.: Similarity frame- work to assess controls on subsurface flow dynamics in hillslopes, Water Resour. Res., 45, W01417, https://doi.org/10.1029/2008WR007067, 2009.
Hulsman, P., Hrachowitz, M., and Savenije, H. H.: Improving the representation of long-term storage variations with conceptual hydrological models in data-scarce regions, Water Resour. Res., 57, e2020WR028837, https://doi.org/10.1029/2020WR028837, 2021.
Hurst, H. E.: Long-term storage capacity of reservoirs, T. Am. Soc. Civ. Eng., 116, 770–799, https://doi.org/10.1061/TACEAT.0006518, 1951.
Humphrey, V., Zscheischler, J., Ciais, P., Gudmundsson, L., Sitch, S., and Seneviratne, S. I.: Sensitivity of atmospheric CO2 growth rate to observed changes in terrestrial water storage, Nature, 560, 628–631, https://doi.org/10.1038/s41586-018-0424-4, 2018.
Jasechko, S., Kirchner, J. W., Welker, J. M., and McDonnell, J. J.: Substantial proportion of global streamflow less than three months old, Nat. Geosci., 9, 126–129, https://doi.org/10.1038/ngeo2636, 2016.
Jasechko, S., Seybold, H., Perrone, D., Fan, Y., Shamsudduha, M., Taylor, R. G., Fallatah, O., and Kirchner, J. W.: Rapid groundwater decline and some cases of recovery in aquifers globally, Nature, 625, 715–721, https://doi.org/10.1038/s41586-023-06879-8, 2024.
Jong, B. T., Ting, M., and Seager, R.: El Niño's impact on California precipitation: Seasonality, regionality, and El Niño intensity, Environ. Res. Lett., 11, 054021, https://doi.org/10.1088/1748-9326/11/5/054021, 2016.
Kantelhardt, J. W., Koscielny-Bunde, E., Rybski, D., Braun, P., Bunde, A., and Havlin, S.: Long-term persistence and multifractality of precipitation and river runoff records, J. Geophys. Res., 111, D01106, https://doi.org/10.1029/2005JD005881, 2006.
Khan, M. S., Liaqat, U. W., Baik, J., and Choi, M.: Stand-alone uncertainty characterization of GLEAM, GLDAS and MOD16 evapotranspiration products using an extended triple collocation approach, Agr. Forest Meteorol., 252, 256–268, https://doi.org/10.1016/j.agrformet.2018.01.022, 2018.
Kirchner, J. W.: Catchments as simple dynamical systems: Catchment characterization, rainfall-runoff modeling, and doing hydrology backward, Water Resour. Res., 45, https://doi.org/10.1029/2008WR006912, 2009.
Kirchner, J. W.: Characterizing nonlinear, nonstationary, and heterogeneous hydrologic behavior using ensemble rainfall–runoff analysis (ERRA): proof of concept, Hydrol. Earth Syst. Sci., 28, 4427–4454, https://doi.org/10.5194/hess-28-4427-2024, 2024.
Knoben, W. J. M., Freer, J. E., Fowler, K. J. A., Peel, M. C., and Woods, R. A.: Modular Assessment of Rainfall–Runoff Models Toolbox (MARRMoT) v1.2: an open-source, extend- able framework providing implementations of 46 conceptual hydrologic models as continuous state-space formulations, Geosci. Model Dev., 12, 2463–2480, https://doi.org/10.5194/gmd-12- 2463-2019, 2019.
Kreibich, H., Van Loon, A. F., Schröter, K., Ward, P. J., Maz- zoleni, M., Sairam, N., Abeshu, G. W., Agafonova, S., AghaKouchak, A., Aksoy, H., Alvarez-Garreton, C., Aznar, B., Balkhi, L., Barendrecht, M. H., Biancamaria, S., Bos-Burgering, L., Bradley, C., Budiyono, Y., Buytaert, W., Capewell, L., Carlson, H., Cavus, Y., Couasnon, A., Coxon, G., Daliakopoulos, I., de Ruiter, M. C., Delus, C., Erfurt, M., Esposito, G., François, D., Frappart, F., Freer, J., Frolova, N., Gain, A. K., Grillakis, M., Grima, J. O., Guzmán, D. A., Huning, L. S., Ionita, M., Khar- lamov, M., Khoi, D. N., Kieboom, N., Kireeva, M., Koutroulis, A., Lavado-Casimiro, W., Li, H., Llasat, M. C., Macdonald, D., Mård, J., Mathew-Richards, H., McKenzie, A., Mejia, A., Mendiondo, E. M., Mens, M., Mobini, S., Mohor, G. S., Nagavciuc, V., Ngo-Duc, T., Nguyen, H. T. T., Nhi, P. T. T., Petrucci, O., Quan, N. H., Quintana-Seguí, P., Razavi, S., Ridolfi, E., Riegel, J., Sadik, M. S., Savelli, E., Sazonov, A., Sharma, S., Sörensen, J., Souza, F. A. A., Stahl, K., Steinhausen, M., Stoelzle, M., Szalinska, W., Tang, Q., Tian, F., Tokarczyk, T., Tovar, C., Tran, T. V. T., Van Huijgevoort, M. H. J., van Vliet, M. T. H., Vorogushyn, S., Wagener, T., Wang, Y., Wendt, D. E., Wickham, E., Yang, L., Zambrano-Bigiarini, M., Blöschl, G., and Di Baldassarre, G.: The challenge of unprecedented floods and droughts in risk management, Nature, 608, 80–86, https://doi.org/10.1038/s41586-022-04917-5, 2022.
Klemeš, V.: The Hurst phenomenon: A puzzle?, Water Resour. Res., 10, 675–688, https://doi.org/10.1029/WR010i004p00675, 1974.
Klemeš, V.: Conceptualization and scale in hydrology, J. Hydrol., 65, 1–23, https://doi.org/10.1016/0022-1694(83)90208-1, 1983.
Klemeš, V., Srikanthan, R., and McMahon, T. A.: Long-memory flow models in reservoir analysis: What is their practical value?, Water Resour. Res., 17, 737–751, https://doi.org/10.1029/WR017i003p00737, 1981.
Knoben, W. J. M., Freer, J. E., Fowler, K. J. A., Peel, M. C., and Woods, R. A.: Modular Assessment of Rainfall–Runoff Models Toolbox (MARRMoT) v1.2: an open-source, extendable framework providing implementations of 46 conceptual hydrologic models as continuous state-space formulations, Geosci. Model Dev., 12, 2463–2480, https://doi.org/10.5194/gmd-12-2463-2019, 2019.
Koirala, S., Jung, M., Reichstein, M., de Graaf, I. E., Camps-Valls, G., Ichii, K., Papale, D., Ráduly, B., Schwalm, C. R., Tramontana, G., and Carvalhais, N.: Global distribution of groundwater-vegetation spatial covariation, Geophys. Res. Lett., 44, 4134–4142, https://doi.org/10.1002/2017GL072885, 2017.
Labat, D.: Wavelet analysis of the annual discharge records of the world's largest rivers, Adv. Water Resour., 31, 109–117, https://doi.org/10.1016/j.advwatres.2007.07.004, 2008.
Li, F., Kusche, J., Sneeuw, N., Siebert, S., Gerdener, H., Wang, Z., Chao, N., Chen, G., and Tian, K.: Forecasting next year's global land water storage using GRACE data, Geophys. Res. Lett., 51, e2024GL109101, https://doi.org/10.1029/2024GL109101, 2024.
Lischeid, G., Dannowski, R., Kaiser, K., Nützmann, G., Steidl, J., and Stüve, P.: Inconsistent hydrological trends do not necessarily imply spatially heterogeneous drivers, J. Hydrol., 596, 126096, https://doi.org/10.1016/j.jhydrol.2021.126096, 2021.
Luijendijk, E.: Transmissivity and groundwater flow exert a strong influence on drainage density, Earth Surf. Dynam., 10, 1–22, https://doi.org/10.5194/esurf-10-1-2022, 2022.
Lun, D., Fischer, S., Viglione, A., and Blöschl, G.: Detecting flood-rich and flood-poor periods in annual peak discharges across Europe, Water Resour. Res., 56, e2019WR026575, https://doi.org/10.1029/2019WR026575, 2020.
McNamara, J. P., Tetzlaff, D., Bishop, K., Soulsby, C., Seyfried, M., Peters, N. E., Aulenbach, B. T., and Hooper, R.: Storage as a metric of catchment comparison, Hydrol. Process., 25, 3364–3371, https://doi.org/10.1002/hyp.8113, 2011.
Markonis, Y. and Koutsoyiannis, D.: Scale-dependence of persistence in precipitation records, Nat. Clim. Change, 6, 399–401, https://doi.org/10.1038/nclimate2894, 2016.
Markonis, Y., Moustakis, Y., Nasika, C., Sychova, P., Dimitriadis, P., Hanel, M., Máca, P., and Papalexiou, S. M.: Global estimation of long-term persistence in annual river runoff, Adv. Water Resour., 113, 1–12, https://doi.org/10.1016/j.advwatres.2018.01.003, 2018.
Martínez-Fernández, J., González-Zamora, A., and Almendra-Martín, L.: Soil moisture memory and soil properties: An analysis with the stored precipitation fraction, J. Hydrol., 593, 125622, https://doi.org/10.1016/j.jhydrol.2020.125622, 2021.
Martens, B., Miralles, D. G., Lievens, H., van der Schalie, R., de Jeu, R. A. M., Fernández-Prieto, D., Beck, H. E., Dorigo, W. A., and Verhoest, N. E. C.: GLEAM v3: satellite-based land evaporation and root-zone soil moisture, Geosci. Model Dev., 10, 1903–1925, https://doi.org/10.5194/gmd-10-1903-2017, 2017.
McKerchar, A. I. and Henderson, R. D.: Shifts in flood and low-flow regimes in New Zealand due to interdecadal climate variations, Hydrol. Sci. J., 48, 637–654, https://doi.org/10.1623/hysj.48.4.637.51412, 2003.
McMillan, H., Gueguen, M., Grimon, E., Woods, R., Clark, M., and Rupp, D. E.: Spatial variability of hydrological processes and model structure diagnostics in a 50 km2 catchment, Hydrol. Process., 28, 4896–4913, https://doi.org/10.1002/hyp.9988, 2014.
Milly, P. C. D.: Climate, soil water storage, and the average annual water balance, Water Resour. Res., 30, 2143–2156, https://doi.org/10.1029/94WR00586, 1994.
Milly, P. C. D. and Dunne, K. A.: Macroscale water fluxes 2, Water and energy supply control of their interannual variability, Water Resour. Res., 38, 1206, https://doi.org/10.1029/2001/WR000760, 2002.
Mudelsee, M.: Long memory of rivers from spatial aggregation, Water Resour. Res., 43, W01202, https://doi.org/10.1029/2006WR005721, 2007.
Montanari, A.: Long-range dependence in hydrology, in: Theory and applications of long-range dependence, edited by: Doukhan, P., Oppenheim, G., and Taqqu, M. S., Birkhäuser, Boston, MA, USA, 461–472, 2003.
Opie, S., Taylor, R. G., Brierley, C. M., Shamsudduha, M., and Cuthbert, M. O.: Climate–groundwater dynamics inferred from GRACE and the role of hydraulic memory, Earth Syst. Dynam., 11, 775–791, https://doi.org/10.5194/esd-11-775-2020, 2020.
Orth, R. and Seneviratne, S. I.: Analysis of soil moisture memory from observations in Europe, J. Geophys. Res.-Atmos, 117, 461–472, https://doi.org/10.1029/2011JD017366, 2012.
Orth, R. and Seneviratne, S. I.: Propagation of soil moisture memory to streamflow and evapotranspiration in Europe, Hydrol. Earth Syst. Sci., 17, 3895–3911, https://doi.org/10.5194/hess-17-3895-2013, 2013.
Potter, K. W.: Annual precipitation in the northeast United States: Long memory, short memory, or no memory?, Water Resour. Res., 15, 340–346, https://doi.org/10.1029/WR015i002p00340, 1979.
Riegger, J. and Tourian, M. J.: Characterization of runoff-storage relationships by satellite gravimetry and remote sensing, Water Resour. Res., 50, 3444–3466, https://doi.org/10.1002/2013WR013847, 2014.
Rodell, M., Famiglietti, J. S., Wiese, D. N., Reager, J. T., Beaudoing, H. K., Landerer, F. W., and Lo, M. H.: Emerging trends in global freshwater availability, Nature, 557, 651–659, https://www.nature.com/articles/s41586-018-0123-1 (last access: 12 January 2024), 2018.
Ropelewski, C. F. and Halpert, M. S.: Global and regional scale precipitation patterns associated with the El Niño/Southern Oscillation, Mon. Weather Rev., 115, 1606–1626, https://doi.org/10.1175/1520-0493(1987)115<1606:GARSPP>2.0.CO;2, 1987.
Schneider, U., Fuchs, T., Meyer-Christoffer, A., and Rudolf, B.: Global precipitation analysis products of the GPCC, Global Precipitation Climatology Centre (GPCC), DWD, Internet Publikation, https://psl.noaa.gov/data/gridded/data.gpcc.html (last access: 15 December 2023), 112, 3819–3837, 2008.
Schneider, U., Becker, A., Finger, P, Meyer-Christoffer, A., Rudolf, B., and Ziese, M.: GPCC Full Data Monthly Product Version 7.0 at 0.5°: Monthly Land-Surface Precipitation from Rain-Gauges built on GTS-based and Historic Data, Global Precipitation Climatology Centre [data set], https://doi.org/10.5676/DWD_GPCC/FD_M_V7_050 (last access: 12 January 2024), 2015.
Sivapalan, M., Blöschl, G., Zhang, L., and Vertessy, R.: Downward approach to hydrological prediction, Hydrol. Process., 17, 2101–2111, https://doi.org/10.1002/hyp.1425, 2003.
Slater, L. J., Khouakhi, A., and Wilby, R. L.: River channel conveyance capacity adjusts to modes of climate variability, Sci. Rep., 9, 12619, https://doi.org/10.1038/s41598-019-48782-1, 2019.
Spence, C., Guan, X. J., Phillips, R., Hedstrom, N., Granger, R., and Reid, B.: Storage dynamics and streamflow in a catchment with a variable contributing area, Hydrol. Process., 24, 2209–2221, https://doi.org/10.1002/hyp.7492, 2010.
Stocker, B. D., Tumber-Dávila, S. J., Konings, A. G., Anderson, M. C., Hain, C., and Jackson, R. B.: Global patterns of water storage in the rooting zones of vegetation, Nat. Geosci., 16, 250–256, https://doi.org/10.1038/s41561-023-01125-2, 2023.
Strassberg, G., Scanlon, B. R., and Rodell, M.: Comparison of seasonal terrestrial water storage variations from GRACE with groundwater-level measurements from the High Plains Aquifer (USA), Geophys. Res. Lett., 34, L14402, https://doi.org/10.1029/2007GL030139, 2007.
Sun, F., Roderick, M. L., and Farquhar, G. D.: Rainfall statistics, stationarity, and climate change, P. Natl. Acad. Sci. USA, 115, 2305–2310, https://doi.org/10.1073/pnas.1705349115, 2018.
Sutanto, S. J. and Van Lanen, H. A.: Catchment memory explains hydrological drought forecast performance, Sci. Rep., 12, 2689, https://doi.org/10.1038/s41598-022-06553-5, 2022.
Szolgayova, E., Laaha, G., Blöschl, G., and Bucher, C.: Factors influencing long range dependence in streamflow of European rivers, Hydrol. Process., 28, 1573–1586, https://doi.org/10.1002/hyp.9694, 2014.
Van Loon, A. F.: Hydrological drought explained, WIREs Water, 2, 359–392, https://doi.org/10.1002/wat2.1085, 2015.
Verdon, D. C., Wyatt, A. M., Kiem, A. S., and Franks, S. W.: Multidecadal variability of rainfall and streamflow: Eastern Australia, Water Resour. Res., 40, W10201, https://doi.org/10.1029/2004WR003234, 2004.
Wang-Erlandsson, L., Bastiaanssen, W. G. M., Gao, H., Jägermeyr, J., Senay, G. B., van Dijk, A. I. J. M., Guerschman, J. P., Keys, P. W., Gordon, L. J., and Savenije, H. H. G.: Global root zone storage capacity from satellite-based evaporation, Hydrol. Earth Syst. Sci., 20, 1459–1481, https://doi.org/10.5194/hess-20-1459-2016, 2016.
Ward, P. J., Jongman, B., Kummu, M., Dettinger, M. D., Sperna Weiland, F. C., and Winsemius, H. C.: Strong influence of El Niño Southern Oscillation on flood risk around the world, P. Natl. Acad. Sci. USA, 111, 15659–15664, https://doi.org/10.1073/pnas.1409822111, 2014.
Xie, J., Liu, X., Jasechko, S., Berghuijs, W. R., Wang, K., Liu, C., Reichstein, M., Jung, M., and Koirala, S.: Majority of global river flow sustained by groundwater, Nat. Geosci., 17, 770–777, https://doi.org/10.1038/s41561-024-01483-5, 2024.
Yin, J.: GTWS-MLrec: Global terrestrial water storage reconstruction by machine learning from 1940 to present, in: Earth System Science Data, Zenodo [data set], https://doi.org/10.5281/zenodo.10040927, 2023.
Yin, J., Slater, L. J., Khouakhi, A., Yu, L., Liu, P., Li, F., Pokhrel, Y., and Gentine, P.: GTWS-MLrec: global terrestrial water storage reconstruction by machine learning from 1940 to present, Earth Syst. Sci. Data, 15, 5597–5615, https://doi.org/10.5194/essd-15-5597-2023, 2023.
Zhao, L., Xia, J., Xu, C. Y., Wang, Z., Sobkowiak, L., and Long, C.: Evapotranspiration estimation methods in hydrological models, J. Geogr. Sci., 23, 359–369, https://doi.org/10.1007/s11442-013-1015-9, 2013.