the Creative Commons Attribution 4.0 License.
the Creative Commons Attribution 4.0 License.
 | 11 Mar 2025
Distribution, trends, and drivers of flash droughts in the United Kingdom
Jamie Hannaford
Maliko Tanguy
Flash droughts have been the subject of a great deal of scientific attention in the last decade, but the greatest emphasis has been on relatively dry climates. Here, we characterise this type of rapid-onset drought events in a more humid setting, the United Kingdom (UK), for the period 1969–2021. Our results show that flash droughts have affected both the wetter regions of the north-west and the drier regions of the south-east in every season over the last 5 decades. Nevertheless, the spatio-temporal distribution of flash droughts is highly variable in the UK, with important regional and seasonal contrasts. Central and northern regions are generally the most frequently affected by flash droughts in comparison to the south-eastern region. Overall, there are non-significant trends in the frequency of flash droughts in winter, summer, and autumn. However, we found a significant increase in the number of flash droughts recorded in spring. We also analysed the relative contribution of the atmospheric evaporative demand (AED) and precipitation to flash drought development in the UK. Our findings show that flash drought occurrence responds primarily to precipitation variability in all seasons but particularly in winter and autumn. In spring and summer, the AED is important as a secondary driver for triggering flash droughts, especially in the drier regions of the south-east. Furthermore, the trends observed in AED contribution evidence that its relevance is rising significantly in spring, also in the south-eastern UK in summer. The atmospheric and oceanic conditions related to flash drought development were also examined. Remarkable anomalies in sea level pressure and 500 hPa geopotential height associated with the presence of high-pressure systems are noted in all seasons during the development of the main flash droughts affecting the UK. Similarly, flash droughts typically develop under the negative phase of the North Atlantic Oscillation in winter and autumn, while in summer and spring the positive phase is dominant. We also found positive anomalies in sea surface temperature during the development of flash droughts in spring and summer, while mixed anomalies are observed in winter and autumn. This study presents a detailed characterisation of the flash drought phenomenon in the UK, providing useful information for drought assessment and management and a climatology of flash droughts that can be used as a baseline against which future changes in flash drought occurrence can be assessed.
- Article
(12696 KB) - Full-text XML
- BibTeX
- EndNote


Drought is one of the most damaging natural hazards worldwide, with significant impacts on natural and socio-economic systems (Mishra and Singh, 2010; Wilhite, 2000; Wilhite and Glantz, 1985). It is also widely regarded as a very complex phenomenon – its development is usually slow, cascading through the diverse sectors affected over periods that range from months to years (Wilhite and Pulwarty, 2017). However, recent studies have demonstrated that some droughts events, commonly termed as “flash droughts”, can develop on much shorter timescales (Otkin et al., 2018). Flash droughts are distinguished by an unusually rapid development associated with strong precipitation deficits that are often accompanied by increases in atmospheric evaporative demand (AED) related, for example, to heatwave episodes (Pendergrass et al., 2020). Such rapid-onset drought events affect both humid and dry regions, causing important agriculture and environment impacts, particularly alongside elevated temperatures – including rapid decreases in soil moisture that result in agricultural stress and increase the risk of wildfires and rapid declines in river flow that can lead to impacts on aquatic wildlife (e.g. fish kills) and water quality problems like algal blooms, as well as localised challenges in meeting public water supply. In addition, flash droughts pose particular challenges for decision-making and drought management and communication due to their rapid onset (Otkin et al., 2022).
Nowadays, the study of flash droughts is a topic of great interest to the scientific community and water managers. This interest is becoming even greater in the current context of climate change, where numerous studies suggest an increase in the frequency and severity of this type of events in different regions around the world (Mishra et al., 2021; Noguera et al., 2022; Wang and Yuan, 2021; Yuan et al., 2018, 2019). Many efforts have been made in recent years to analyse flash drought phenomena using different approaches based on very diverse metrics (e.g. soil moisture, AED, precipitation, and climatic water balance) (Lisonbee et al., 2021). Thus, several studies have assessed this phenomenon in various regions of the world over the last 2 decades from different perspectives (Walker et al., 2023). Despite progress in the understanding of this phenomenon, there are still many issues that are poorly understood, particularly those related to the drivers and mechanisms involved in triggering flash droughts. This is further complicated by the large seasonal and spatial variations in the characteristics of flash droughts, particularly marked between water-limited (i.e. dry areas where evapotranspiration is constrained by water availability) and energy-limited (i.e. humid areas characterised by a high water availability) regions (Mukherjee and Mishra, 2022; Noguera et al., 2021). Furthermore, most of the literature on flash droughts focuses exclusively on a few regions (i.e. mainly the United States and China) (Christian et al., 2024). As a result, there are still important gaps in the knowledge of the characteristics of flash droughts in many regions of the world.
The greatest attention on flash droughts has been in dry (i.e. water-limited) regions as flash droughts are, intuitively, expected to have less impact in humid regions due to perceived high water availability. However, while they may be seemingly less damaging, flash droughts can also have very severe implications in humid regions (Zhu and Wang, 2021), and their frequency and rate of intensity may also increase in the currently context of global warming (Christian et al., 2023; Yuan et al., 2023). Some global studies suggest potential hotspots in regions characterised by an energy-limited regime, such as northern Europe, where precipitation is the main driver controlling flash drought occurrence (Mukherjee and Mishra, 2022). Other studies at regional scale also found a high frequency of flash droughts in Europe during the last 3 decades, which is mainly led by a notable increase in flash drought events mainly associated with rising temperatures (Shah et al., 2022).
Our study focuses on the United Kingdom (UK), a temperate oceanic, mild and mostly humid region characterised by a predominance of energy-limited conditions (Hulme and Barrow, 1997; Mayes and Wheeler, 1997) but with significant variations including some more water-limited areas in the south-east (Kay et al., 2013) – an area with a particularly fine balance between water supply and demand that already experiences significant water stress (Folland et al., 2015). Hence, while the UK is generally regarded as a wet country, it is regularly affected by severe droughts with major agricultural, hydrological and environmental impacts (Barker et al., 2019; Pribyl, 2020; Spraggs et al., 2015). Although most severe droughts affecting the UK are commonly related to long-term precipitation deficits (Marsh et al., 2007; Todd et al., 2013; Barker et al., 2019), dry spells in the short term combined with anomalous increases in AED can have important agricultural, hydrological and environmental implications (Wreford and Neil Adger, 2010). Some studies broadly distinguish between “multiannual” droughts that primarily affect south-east England (e.g. 2004–2006; 2010–2012) and within-year “summer” droughts that can affect all areas (e.g. 1995, 2003) (Barker et al., 2019; Marsh et al., 2007). Many droughts are in fact a combination of these “types”. It is certainly the case that some of the most testing historical droughts, including the “benchmark” 1976 drought, have involved heatwave conditions associated with very high AED. Recent examples include the 2018 and 2022 summer drought (Barker et al., 2024; Turner et al., 2021), which caused severe impacts on fluvial and terrestrial ecosystems, water supply, or crop yields as a result of a lack in precipitation that was exacerbated by rapid increases in AED.
Thus, drought dynamics over the UK are quite complex, affecting the region at different regional and temporal scales (Tanguy et al., 2021). This complexity is a consequence of the diverse synoptic mechanisms controlling climate variability but also of the strong ocean–atmosphere interactions and the orographic configuration (Mayes and Wheeler, 2013). Among others, the strong influence of large-scale drivers such as the North Atlantic Oscillation (NAO) is well recognised for driving precipitation variability over the UK, especially in northern and western regions and during winter months (Fowler and Kilsby, 2002; Lavers et al., 2010; Murphy and Washington, 2001; West et al., 2019, 2021b). Some studies have also shown that other large-scale circulation patterns such as the East Atlantic pattern and the Scandinavian pattern play a secondary role in modulating precipitation in the UK (Bueh and Nakamura, 2007; Hannaford et al., 2011; Ummenhofer et al., 2017; West et al., 2021a), while there is also an underlying role for slowly varying modes of ocean–atmosphere variability such as the Atlantic Multidecadal Oscillation and the El Niño–Southern Oscillation (ENSO) (Folland et al., 2015; Svensson and Hannaford, 2019). While there is a good general understanding of these mechanisms in driving rainfall variability, their role in droughts is complex, and hence there is a gap in the understanding of the drivers of both multi-annual and short-term droughts.
Although numerous studies have analysed drought phenomena in the UK, most drought studies in the UK have focused on long timescales (e.g 12 months), while droughts developing in the short term have received comparatively little attention. Therefore, it is essential to understand the characteristics of flash drought in these regions and any emerging trends, as well as unravelling the process and mechanisms controlling its occurrence. In this study, we present a detailed characterisation of the flash drought phenomenon in the UK, making a comprehensive, national-scale analysis of flash droughts in this region and one which can serve as a test bed for other relatively wet locations which may expect to see increases in short-term drought severity in future (Parry et al., 2024; Tanguy et al., 2023). To achieve this goal, we address several objectives: (i) to characterise the spatial and temporal occurrence of flash droughts over the UK, (ii) to analyse the observed trends in their frequency over the last 5 decades, (iii) to assess the role of the different meteorological factors involved in this type of drought events, and (iv) to identify the atmospheric and oceanic conditions under which flash droughts develop.
2.1 Meteorological data
We employed high-spatial-resolution and high-temporal-resolution gridded precipitation and potential evapotranspiration (PET) data for the UK over the period 1969–2021. On the one hand, daily precipitation data at 1 km2 were obtained from the Met Office Hadley Centre for Climate Science and Services (Met Office et al., 2018). All details on the creation and validation of the gridded precipitation data are provided by Hollis et al. (2019). On the other hand, daily PET data at 1 km2 were obtained from Environmental Information Data Centre (EIDC) (Brown et al., 2023). PET data were obtained from maximum and minimum air temperature, relative humidity, sunshine duration, and wind speed by means of Penman–Monteith equation, providing a robust metric of atmospheric evaporative demand (AED). Additional details about the creation, validation, and computation of gridded dataset are in Robinson et al. (2023). Daily information of precipitation and AED was aggregated weekly to calculate the climatic water balance (i.e. the difference between precipitation and AED), which was used to obtain the Standardized Precipitation Evapotranspiration Index (SPEI) (Vicente-Serrano et al., 2010).
2.2 Flash drought identification
We used the SPEI to identify flash droughts as it is sensitive to the variability of precipitation and AED (Tomas-Burguera et al., 2020), thus considering the main meteorological drivers that trigger flash droughts. The SPEI is based on the standardisation of the difference between precipitation and AED (i.e. climatic water balance), providing comparable values in time and space (Beguería et al., 2014). In addition, the SPEI is a multiscalar index that allows us to fit the computation timescale to the temporal response of the diverse natural and human systems affected by drought. Thus, many studies have used the SPEI to analyse the response of hydrological (Lorenzo-Lacruz et al., 2010; Peña-Gallardo et al., 2019a; Vicente-Serrano and López-Moreno, 2005), agricultural (Peña-Gallardo et al., 2018b, 2019b; Potop et al., 2012), and environmental (Peña-Gallardo et al., 2018a; Vicente-Serrano et al., 2013, 2014; Zhang et al., 2017) systems to drought. Moreover, several studies have also demonstrated the good performance of the SPEI for flash drought assessment (Hunt et al., 2014; Noguera et al., 2020, 2021) and monitoring (Noguera et al., 2023).
In this study, we identified flash drought events over the UK following the definition suggested by Noguera et al. (2020). For this purpose, we calculated the SPEI at a 1-month timescale and high temporal resolution (i.e. weekly data frequency). The use of a short timescale allows us to capture short-term anomalies characteristic of flash droughts, while avoiding consideration of the meteorological anomalies' record in the long term. To identify rapid and anomalous changes in humidity conditions associated with flash drought onset (Otkin et al., 2018; Svoboda et al., 2002), this method focuses on identifying quickly declines in SPEI values over short periods that reach a certain severity (moderately dry conditions). Thus, a flash drought is defined as a decline in SPEI 1-month values equal to or higher than 2 z units over a 4-week period, ending in a SPEI value equal to or less than −1.28 z units (corresponding to a return period of 10 years) (Fig. A1). The 4-week period established for the identification of the events, corresponding to the development phase, allows us to capture rapid variations in humidity conditions that persist long enough to expect some impact (Noguera et al., 2020), which agrees with some of the most widely used definitions for assessing of flash droughts (Anderson et al., 2013; Chen et al., 2019; Christian et al., 2019; Osman et al., 2021; Mukherjee and Mishra, 2022). Applying this definition, we identified all flash drought events that occurred in the UK over the period 1969–2021 at seasonal scale (winter: DJF; spring: MAM; summer: JJA, autumn: SON), as well as for the growing season (MAMJJAS). We assigned flash droughts seasonally based on the week in which their onset was identified.
Given the large climatic differences across the UK, we conduct the flash drought analysis at a regional scale. There is a strong south-east–north-west gradient in precipitation across the UK, with values ranging from >3000 to < 600 mm annually (Mayes and Wheeler, 2013). This strong gradient results in important differences between the drought patterns observed in the wetter north-west and the drier south-east. In order to assess the possible regional differences in flash drought characteristics, we considered three regions: North-West, Transition, and South-East (Fig. A2). The regional division used here is derived from Tanguy et al. (2021), who used a k-mean clustering technique to divide the UK into three regions based on long-term (1862–2015) precipitation patterns. This delineates a wetter (i.e. North-West) and a drier (i.e. South-East) region, as well as a transitional (i.e. Transition) region between both. Since flash droughts are primarily driven by precipitation variability (Hoffmann et al., 2021; Koster et al., 2019), it is expected to be the most important factor controlling their characteristics and spatio-temporal behaviour in the UK.
2.3 Assessment of the AED contribution
To unravel the contribution of AED to the SPEI, we calculated the index allowing precipitation to vary according to the observed climate evolution while the AED remained at its mean value, which is the average AED of each weekly series for the period 1969–2021. This version of the index (hereafter referred to as SPEI_PRE) that only responds to precipitation variability was compared with the original SPEI series. In order to determine the relative contribution of AED to the development of flash droughts, we considered that the difference between zero and SPEI_PRE was due to precipitation variability, while the difference between SPEI_PRE and SPEI was due to the contribution of AED. The differences were expressed as percentages, and for those weekly data in which SPEI_PRE was equal to or less than SPEI, the AED contribution was considered 0 %. This type of approach has been used in numerous studies to calculate the relative contribution of different variables in triggering drought conditions (Cook et al., 2014; Noguera et al., 2022; Scheff and Frierson, 2014; Williams et al., 2015; Zhao and Dai, 2015).
Given that our objective is to analyse the role of the AED as a driver of flash drought development, we examined the contribution of the AED in the weekly data corresponding to the onset of each of the flash drought events identified, as it captures the cumulative anomaly in the climatic balance over the 4-week period of the development phase. Furthermore, we specifically analysed the spatial and temporal patterns of the AED contribution to the development of flash droughts for the three regions considered and on a seasonal scale over the period 1969–2021.
2.4 Atmospheric and oceanic data
To analyse the atmospheric mechanism underlying flash drought occurrence in the UK, we focused on the atmospheric conditions recorded during the development phase (i.e. the 4 weeks prior to flash drought onset). In order to present a set of events representative of the atmospheric conditions typically associated with the triggering of flash droughts, we focus on the events with the largest area affected. For this purpose, we selected the top-10 flash droughts identified in each season (winter: DJF, spring: MAM, summer: JJA and autumn: SON) for the period 1969–2021 according to the number of the total pixels that recorded flash drought conditions in a given week.
We employed daily sea level pressure (SLP) and 500 hPa geopotential height (Z500) data obtained from the National Centers for Environmental Prediction (NCEP)–National Center for Atmospheric Research (NCAR) reanalysis (Kalnay et al., 1996) for the domain study (25–70° N, 45° W–45° E) over the period 1969–2021 at 5° spatial resolution. To illustrate the synoptic situations associated with flash droughts, we calculated SLP and Z500 anomalies during the development of the top-10 flash droughts identified in each. The anomalies are relative to the average SLP and Z500 over the period 1969–2021. We also evaluated the possible seasonal relationship between flash drought occurrence and the main large-scale circulation patterns affecting the UK: the North Atlantic Oscillation (NAO). For this purpose, we calculated the NAO index (NAOi) following the approach proposed by Jones et al. (1997), which is based on the differences between normalised SLP at the points 36° N, 5° W (Gibraltar, United Kingdom) and 65° N, 20° W (Reykjavik, Iceland). We then computed the average anomalies recorded in NAOi during the development of the top-10 flash droughts identified in each season over the period 1969–2021.
To examine the possible link between the development of flash droughts and oceanic conditions, we analysed sea surface temperature (SST) anomalies during the development phase of the top-10 flash droughts identified in each season (winter: DJF, spring: MAM, summer: JJA and autumn: SON) for the period 1982–2021 according to the percentage of the UK area affected in a given week. We used daily SST anomaly data obtained from the National Centers for Environmental Prediction (NCEP)–National Center for Atmospheric Research (NCAR) reanalysis for the domain study (25–70° N, 45° W–45° E) over the period 1982–2021 at 0.25° spatial resolution. In this case we focus on the period 1982–2021 instead of 1969–2021 due to the temporal availability of the data.
2.5 Trend calculation
We examined the magnitude of change in the frequency of flash droughts in the UK using a linear regression analysis between the time series (independent variable) and flash droughts series (dependent variable). We also employed this approach to calculate the magnitude of change in precipitation, AED, and AED contribution to flash drought development. Then, to assess the significance of the trends over the period 1969–2021, we employed the nonparametric Mann–Kendall statistic. Autocorrelation was included in the trend analysis using the modified Mann–Kendall trend test, which returned corrected p values after accounting for temporal pseudoreplication (Hamed and Ramachandra Rao, 1998; Yue and Wang, 2004).
3.1 Spatial distribution and trends
The spatial distribution of flash droughts in the UK shows a large seasonal variability and important regional differences (Fig. 1). In winter, the highest number of flash droughts is recorded in Northern Ireland and central UK, while the southern and north-eastern region are less frequently affected. Large areas along the north–south axis of the UK and Northern Ireland are highly affected by flash droughts in spring, with more than 15 events reported over the study period. By contrast, south-eastern and north-western regions are generally the least affected by flash droughts during the spring. In summer, there is a clear gradient from the south-east, where a low number of flash droughts are found (5–10 events), to the north-west of the UK, where the highest number of events is found. Northern Ireland and south-western UK are more frequently affected by flash droughts in autumn, whereas there are a lower number of events in the south-eastern and northern regions.
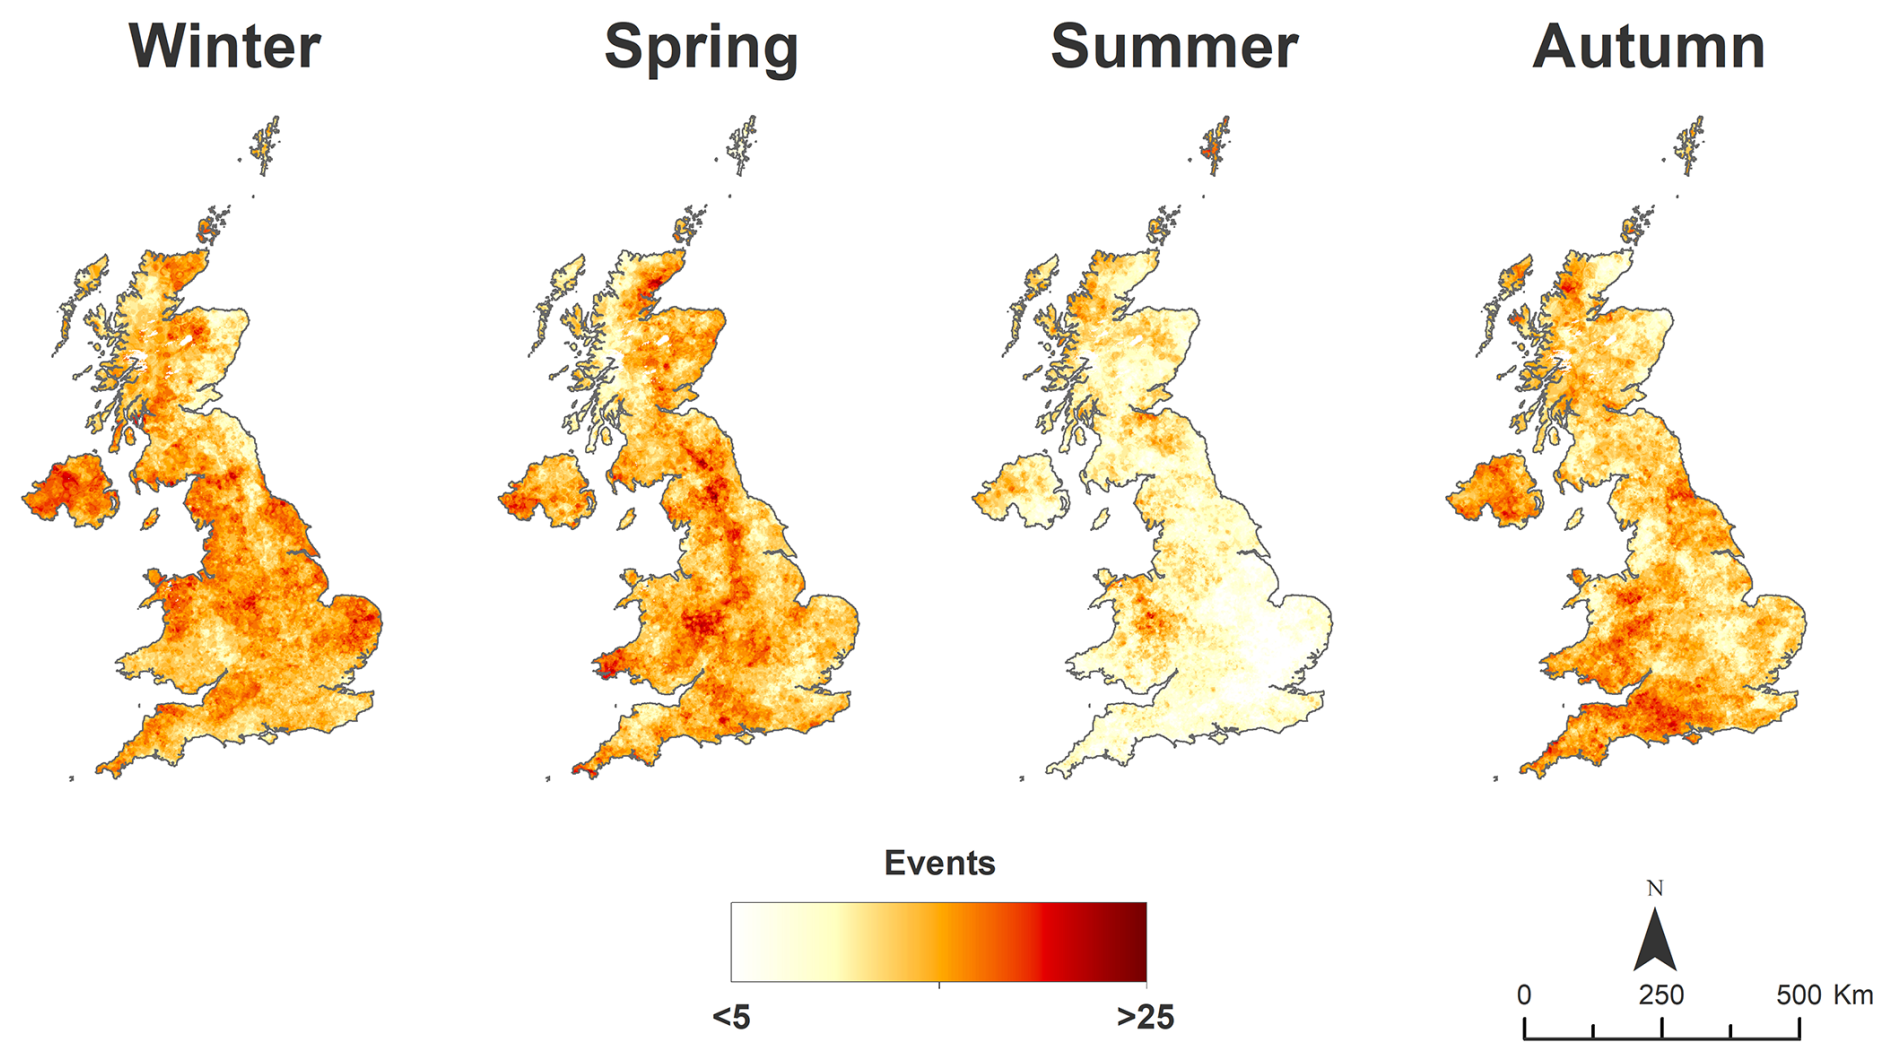
Figure 1Seasonal spatial distribution of the total number of flash droughts in the United Kingdom for the period 1969–2021.
Focussing on the growing season, when the impacts related to flash droughts are expected to be greater, it is possible to recognise large areas affected by flash droughts along the north–south axis of the UK (Fig. 2). Among others, the west of the UK and Northern Ireland are the most affected areas, with more than 35 events recorded, whereas the south-eastern UK is the least frequently affected by flash droughts. The average number of events occurring for the whole of the UK is around 28 events during the growing season for the period 1969–2021, although there are some relevant differences between regions. In general, the Transition (TRAN) and North-West (NW) regions are affected more frequently compared to the South-East (SE) region. Also, the SE region shows the higher variability due to the contrasts observed in the average number of flash droughts recorded across the region.
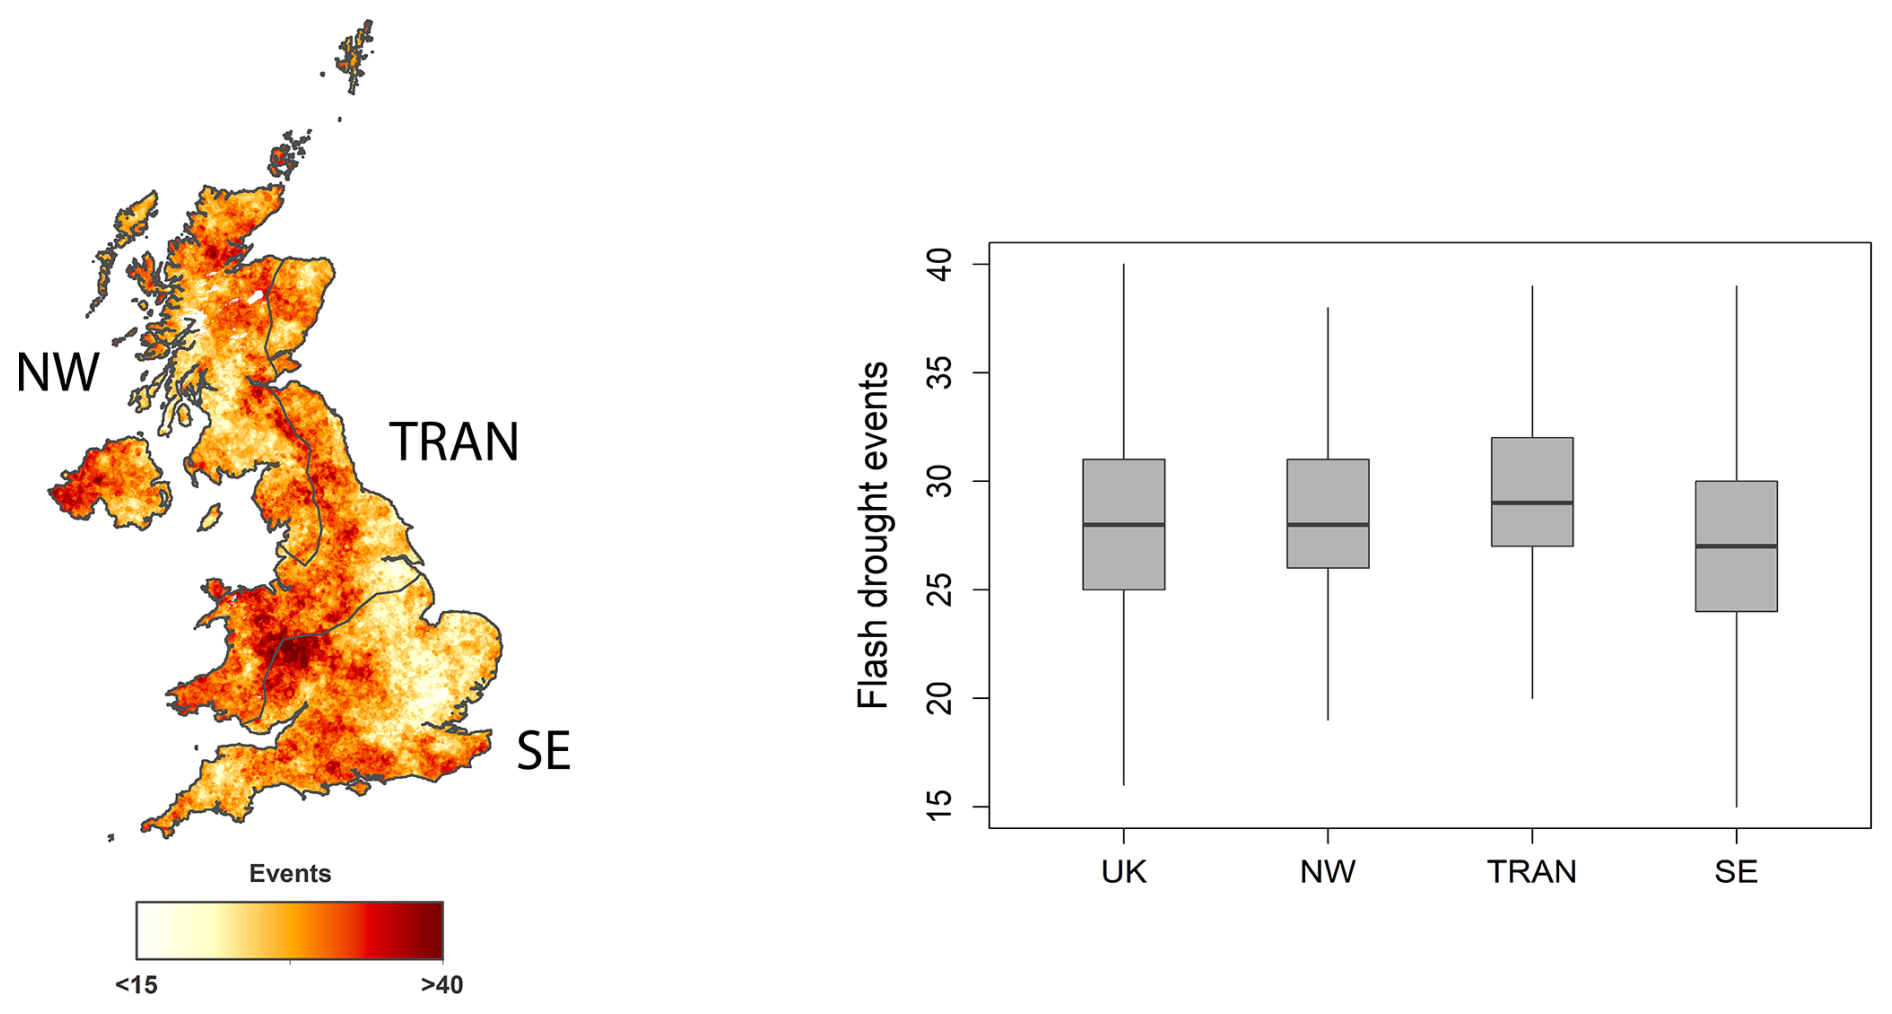
Figure 2Spatial distribution of the total number of flash droughts during the growing season (from March to September) in the United Kingdom for the period 1969–2021.
Figure 3 shows the evolution of the average frequency of flash droughts in the UK for each season over the period 1969–2021. The seasonal series show a high interannual variability, highlighting the period around the late 1980s and early 1990s, when the UK was frequently affected by flash droughts in all seasons. Overall, non-significant trends are observed, with negative and non-significant trends in winter, summer, and autumn. In contrast, there is a positive and significant increase in the number of flash droughts in spring. At the regional scale, seasonal series also reflect a high variability and generally non-significant trends (Fig. A3). In winter, the Transition (TRAN) and South-East (SE) regions show no relevant changes in the frequency of flash droughts, while a slight and non-significant decrease in the number of events is reported in the North-West (NW) region. Conversely, positive trends are observed in spring in all regions, although these trends are only significant in NW and TRAN regions. In summer, there are important differences between the NW and TRAN regions, with a negative and even significant trend in the case of the TRAN region and positive and non-significant trend in the SE region. The autumn series show negative and non-significant trends in all regions but especially in SW and TRAN regions due to the high occurrence of flash droughts in the early decades of the series.
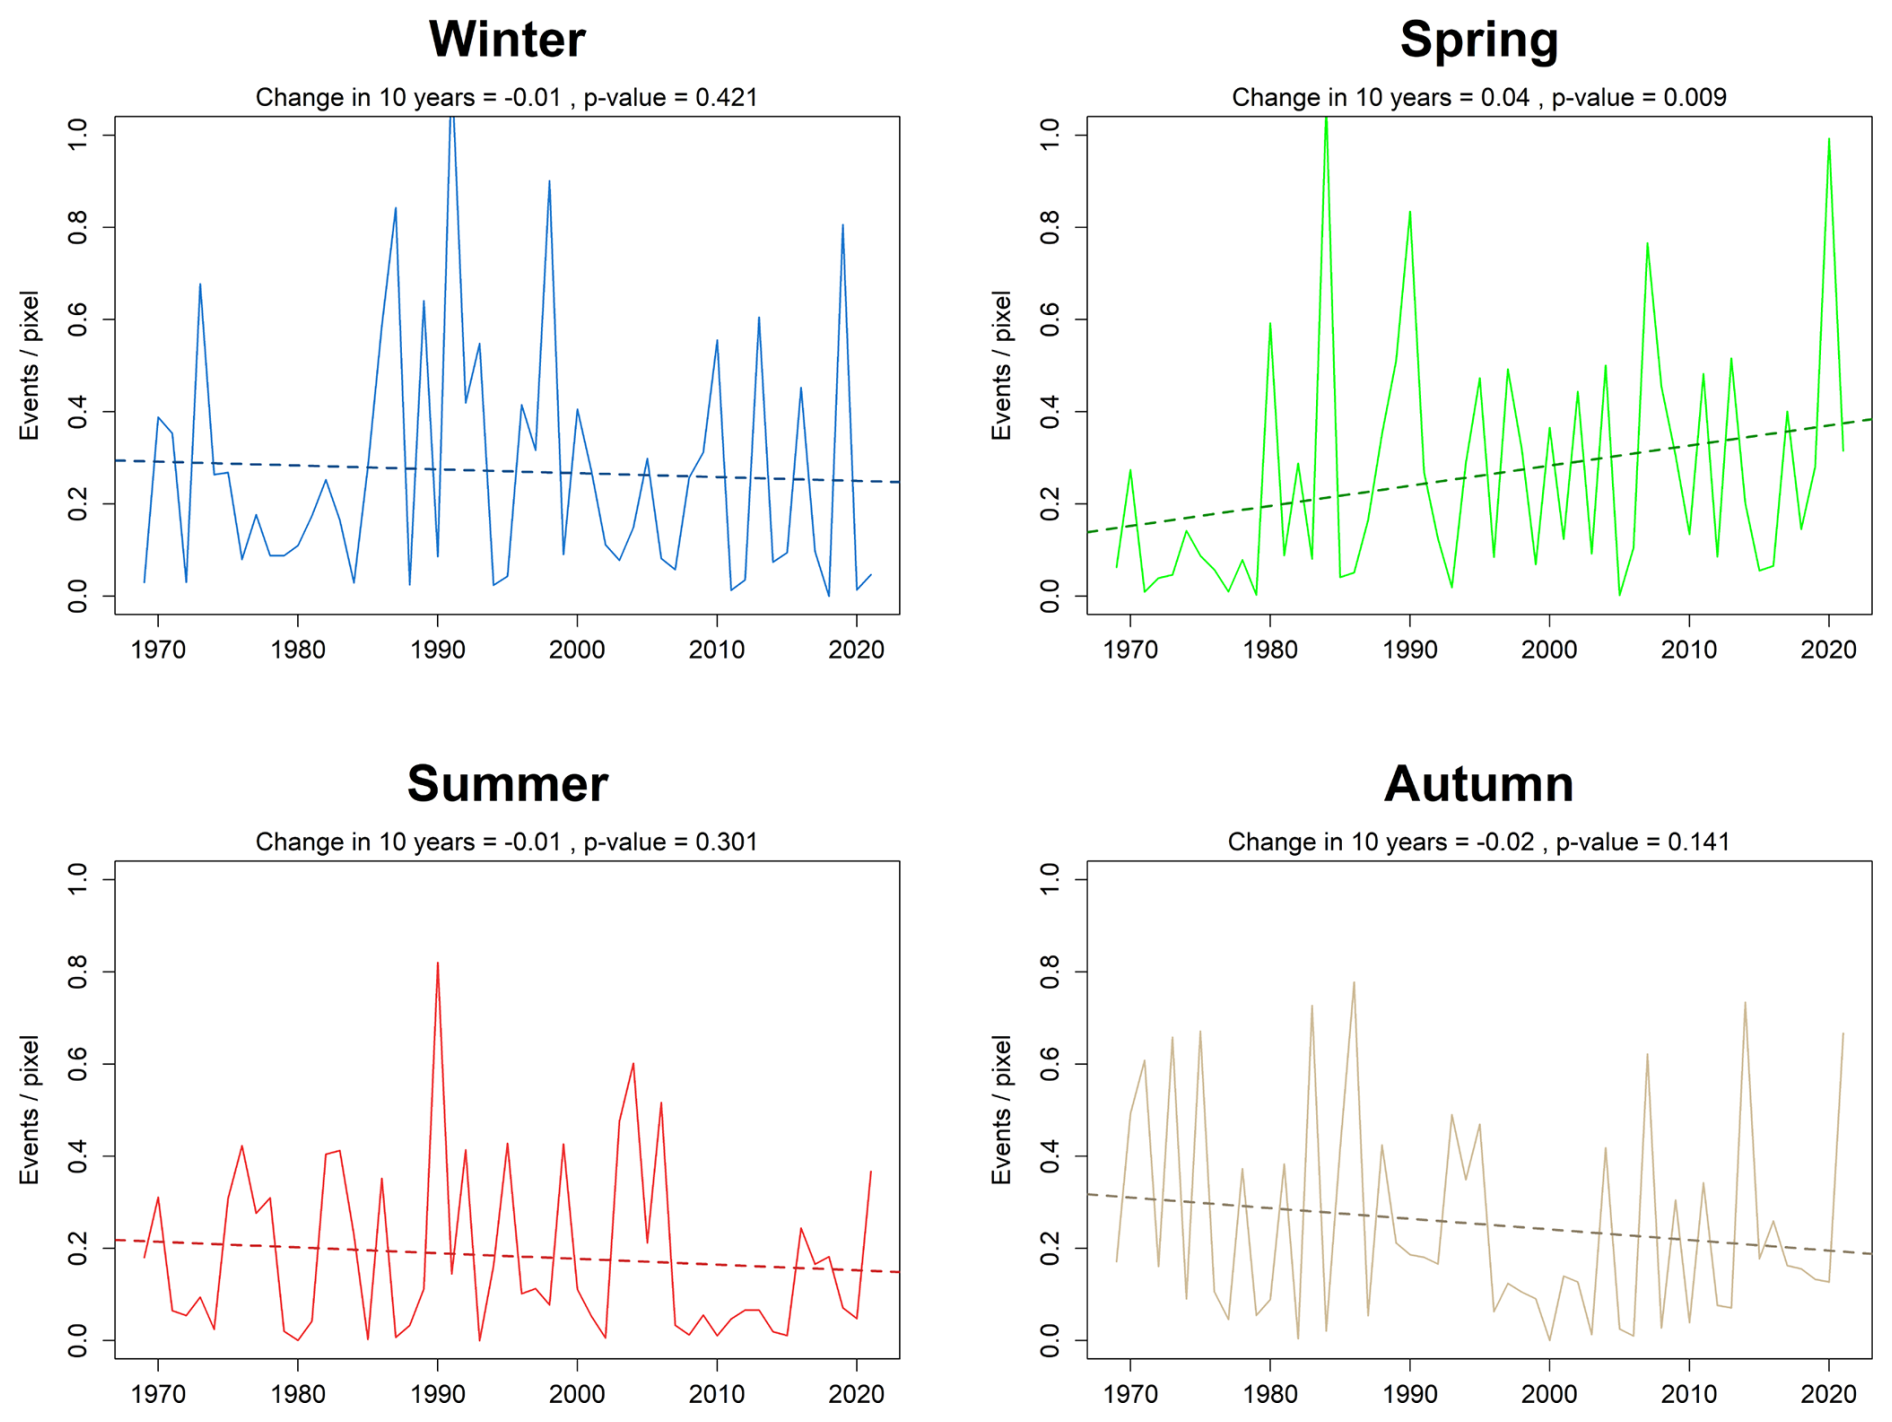
Figure 3Seasonal evolution of the number of flash droughts (events / pixel) in the United Kingdom for the period 1969–2021.
The spatial distribution of the seasonal trends in flash droughts for the period 1969–2021 is depicted in the Fig. 4. In general, there are important spatial and seasonal differences in the trends observed. Non-significant trends are recorded in winter months for most of the UK, and only a few small areas in the north show a significant trend. In spring, there is a clear dominance of positive trends, which are significant in some areas across the UK. Negative and non-significant trends predominate in summer months, except for the south-eastern UK, where positive and generally non-significant trends are noted. In autumn, negative and non-significant trends are also recorded for most of the UK, except for a few small areas in northern region.
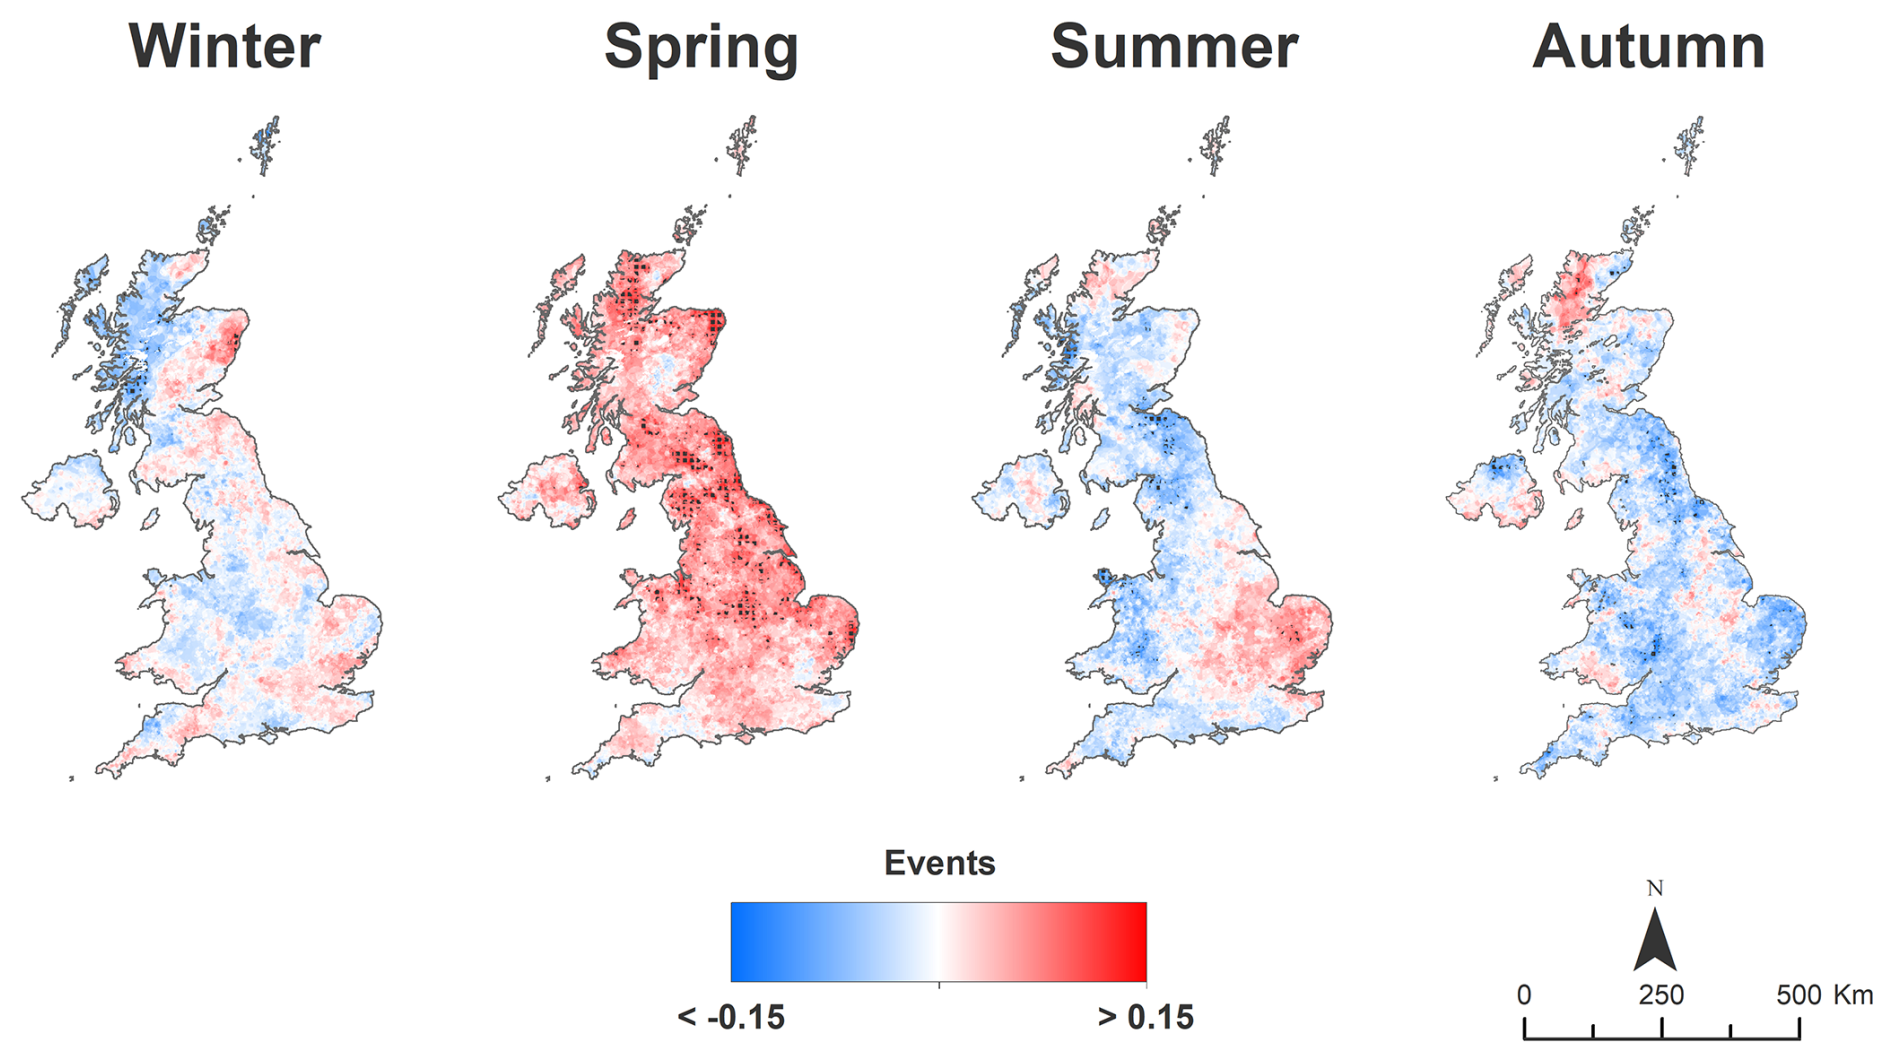
Figure 4Spatial distribution of the seasonal magnitudes of change per decade in flash drought events in the United Kingdom for the period 1969–2021. Dotted areas represent those areas in which significant trends are reported.
During the growing season, non-significant trends are noted for the whole of the UK, although there are important spatial differences in the magnitude and sign of the trends (Fig. 5). Positive trends were generally reported in eastern and northern regions, with significant increases observed in some areas around the south-eastern and northern UK. By contrast, negative and non-significant trends predominate over the west of the UK. There are also important differences in the average frequency of events identified during the growing season in each region, although non-significant increases are observed. Notable periods of high flash drought occurrence were observed in 1980–1990 over the NW and TRAN regions and in 2000–2010 over the TRAN and SW regions.
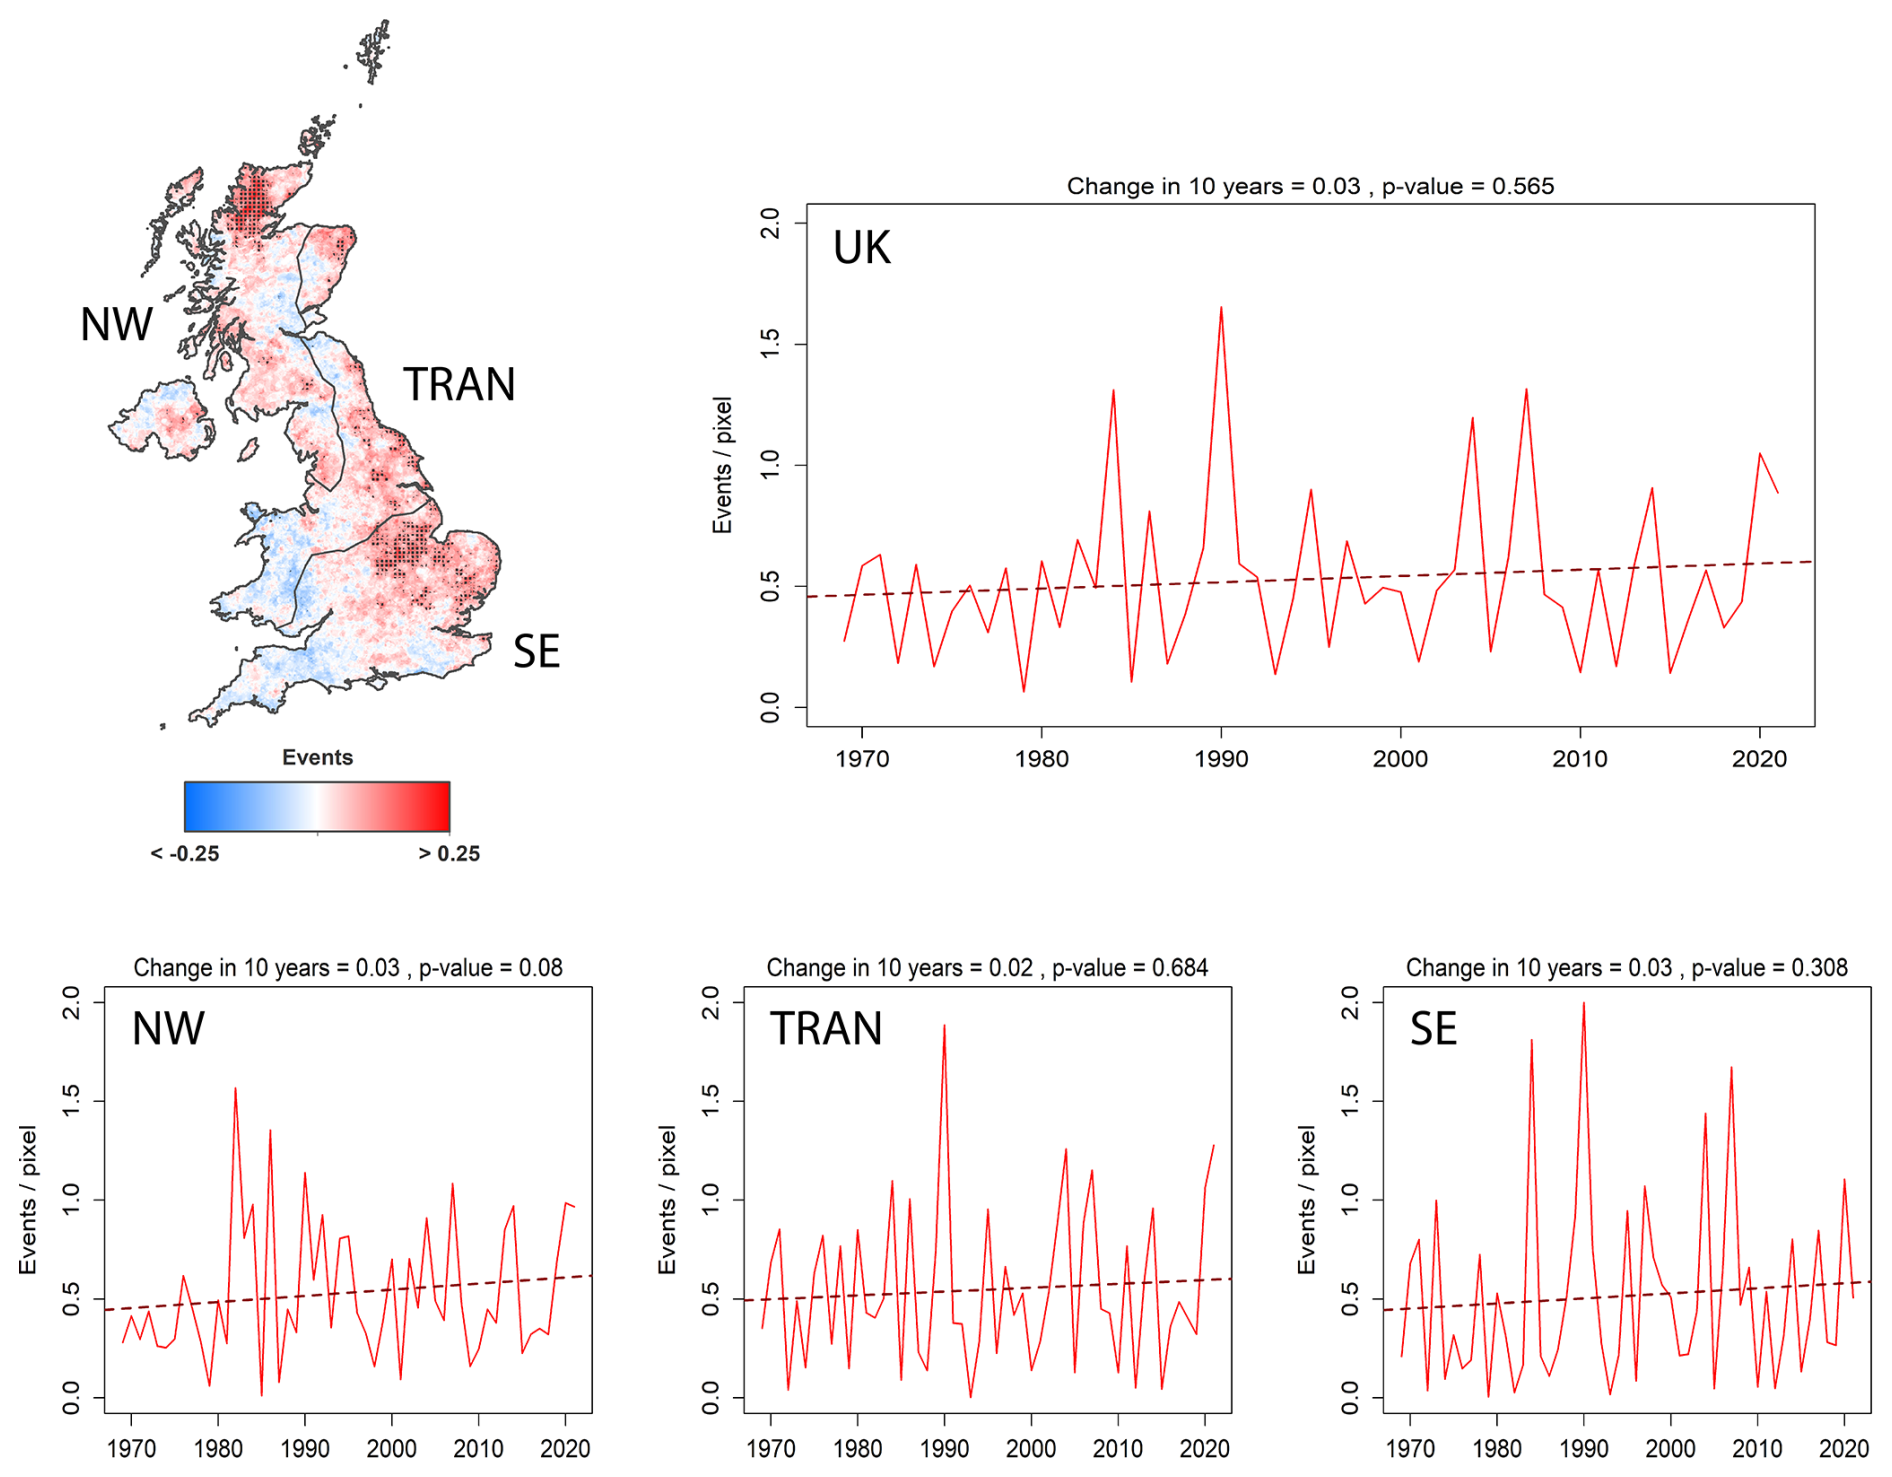
Figure 5Magnitude of change per decade in flash drought frequency (events / pixel) during the growing season (from March to September) over the United Kingdom for the period 1969–2021. Dotted areas represent those areas in which significant trends are reported.
3.2 Flash drought response to precipitation and AED
Figure 6 shows the seasonal spatial distribution of the average contribution of the AED to flash drought development in the UK for the period 1969–2021. As expected, the contribution of the AED to flash drought development shows large spatial and seasonal contrasts as a result of the large climatic variability of the UK (Fig. A4). In general, the average AED contribution exhibits a strong spatial coherence with the average precipitation at seasonal scale (Fig. A4a). In winter, when the precipitation is very high and AED rarely exceeds 50 mm, the average AED contribution is close to zero over most of the UK, except for some areas in the east. The maximum values of the AED contribution are found in spring months, with large areas over the central, eastern, and especially south-eastern UK exceeding 15 %. In these areas, the average precipitation reaches its seasonal minimum, while the AED increases notably compared to the winter months. The AED contribution in summer also depicts average values around 15 % in a few areas of the south, where the average precipitation is lower and the average AED reaches its maximum values (Fig. A4b), but in general most of the UK shows a low average AED contribution to flash drought development. In autumn, as precipitation increases and AED decreases, most of the UK shows average AED contribution values close to zero, with only some areas in the east showing higher average values (5 %–10 %).
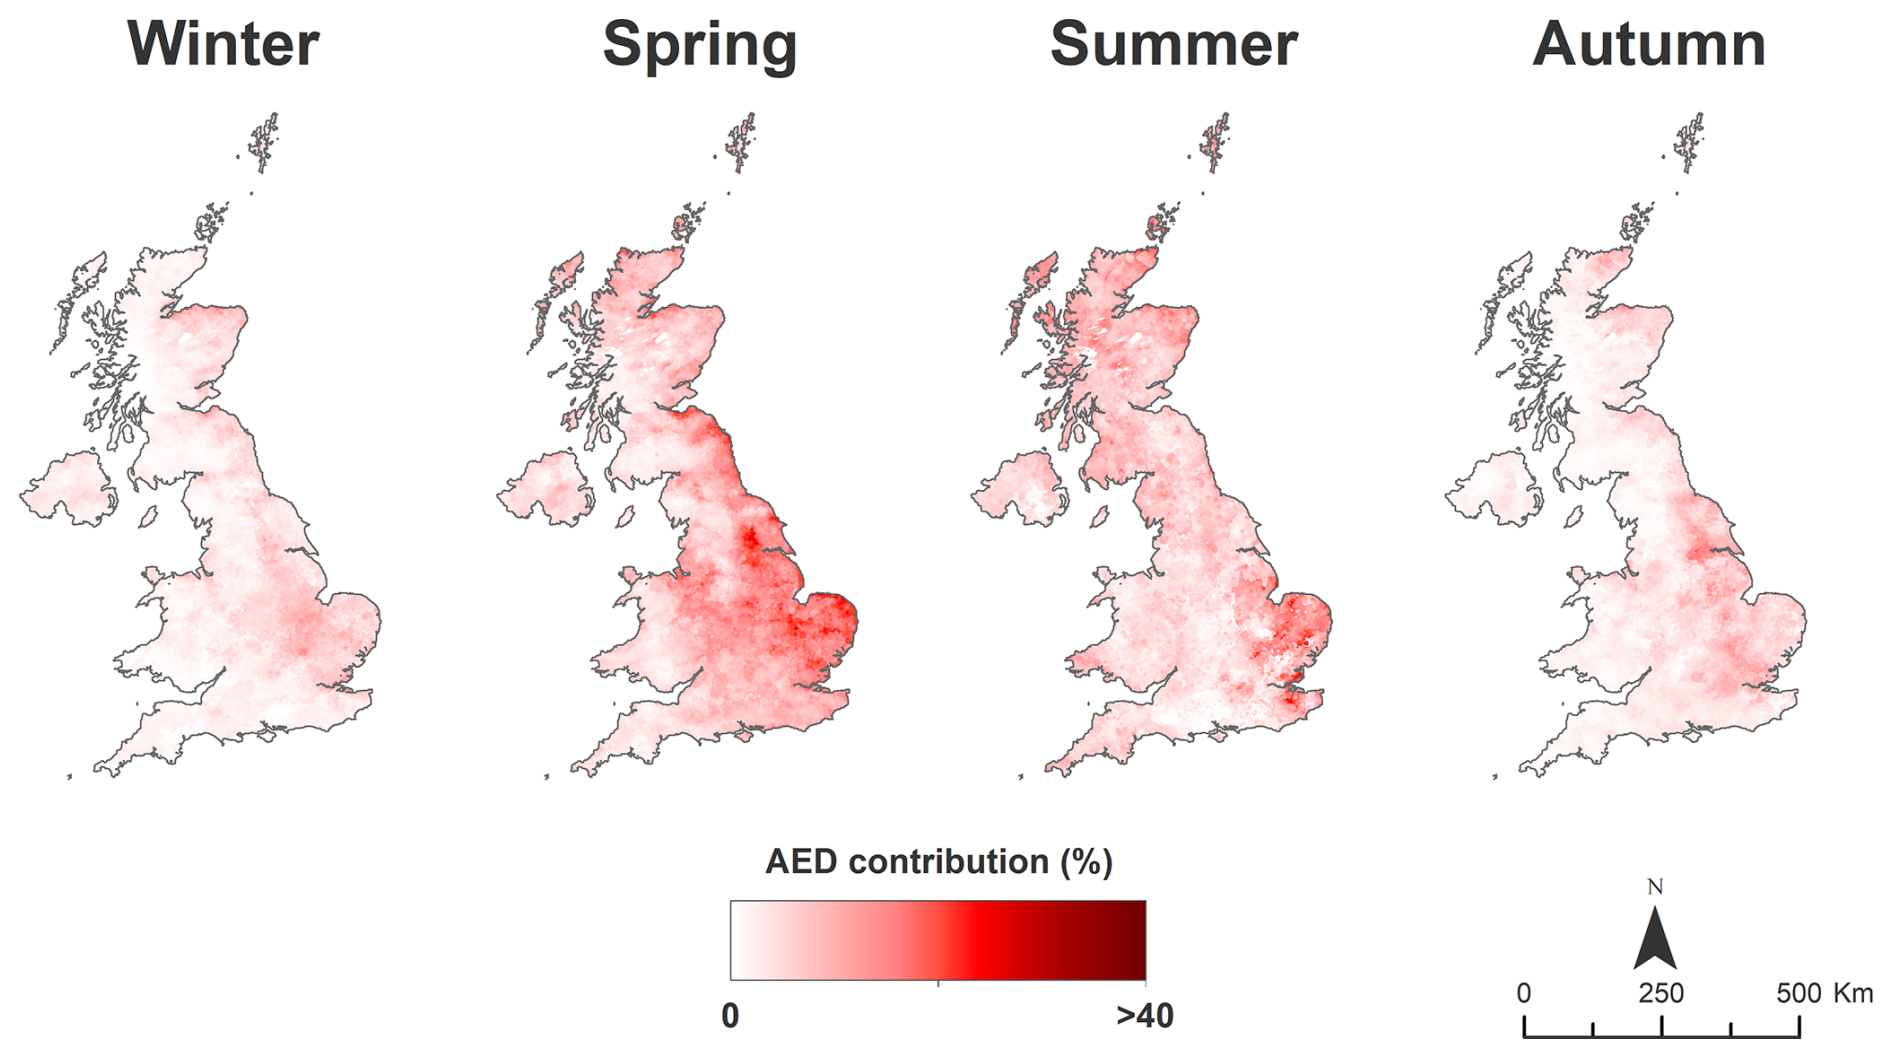
Figure 6Seasonal spatial distribution of the average contribution of AED to flash drought development in the United Kingdom for the period 1969–2021.
The evolution of the average AED contribution to flash drought development also exhibits important interannual variations in each season over the period 1969–2021 (Fig. 7). There is a significant increase in AED contribution in spring, which has been particularly notable since the early 1990s. No relevant changes are noted in winter and autumn, while there is a slight and non-significant increase in AED contribution in summer. In general, the reported changes in the average AED contribution to flash drought show a consistent relationship with the trends observed in the average rainfall and AED at seasonal scale (Fig. A5). For example, spring, the only season with a significant increase in AED contribution, is the only season that does not show an increase in rainfall, which also coincides with a significant increase in AED.
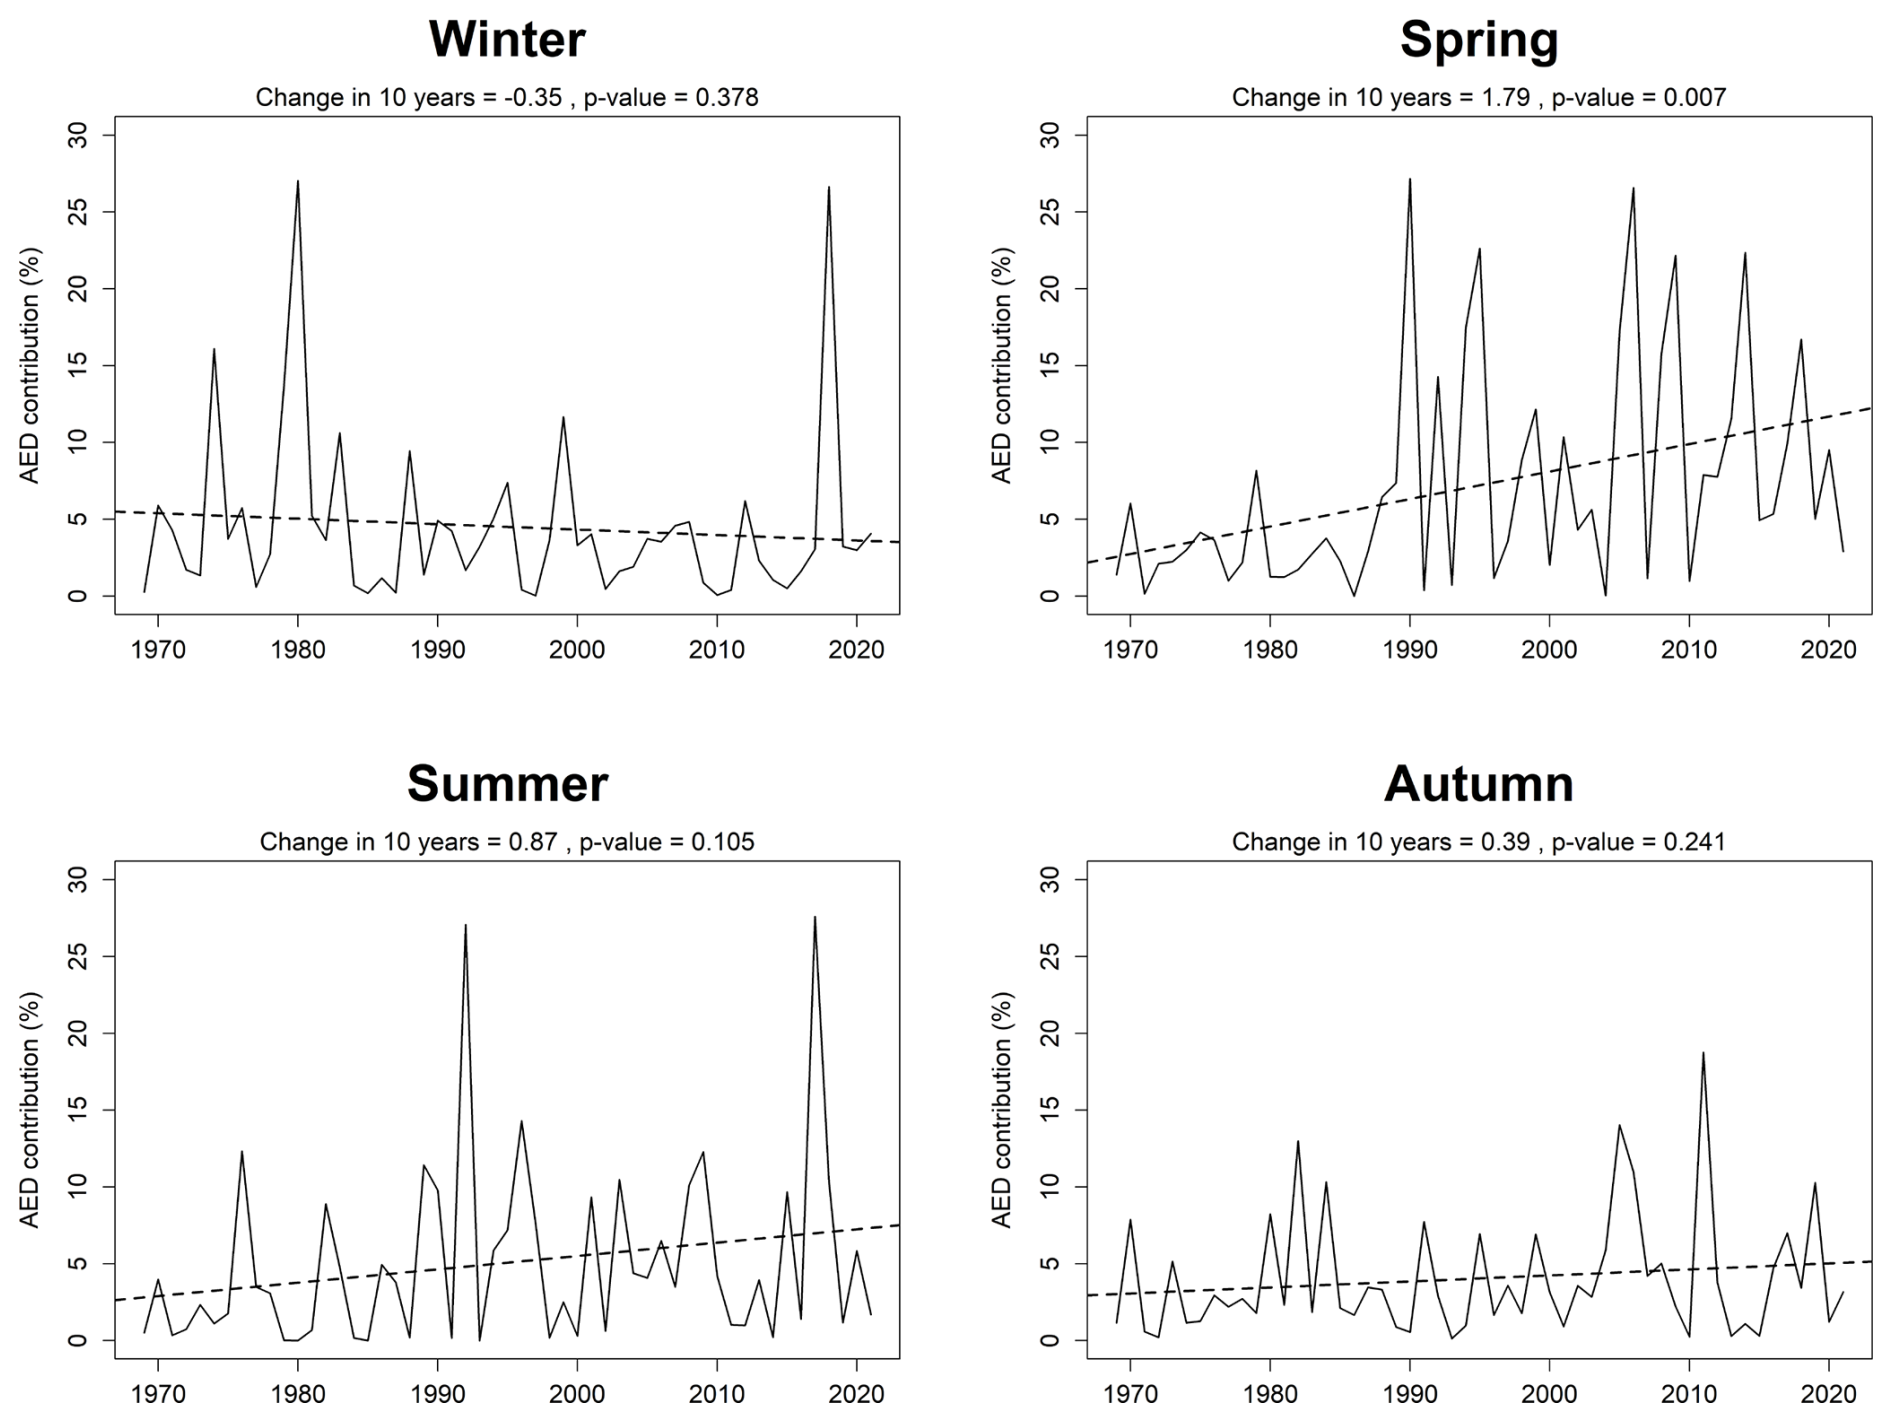
Figure 7Seasonal evolution of the average contribution of AED to flash drought development in the United Kingdom for the period 1969–2021.
At regional scale, some relevant differences in the evolution of the AED contribution are noted (Fig. A6). A decrease in AED contribution is recorded in TRAN and SE region in winter, although only the SE region exhibits a significant trend. By contrast, all regions show an increase in AED contribution in spring, which is significant in NW and TRAN regions. In summer, a general increase in AED contribution is recorded, but this increase is only significant in SE region. In autumn, a significant decrease in AED contribution is recorded in NW region, while regions TRAN and SE show non-significant increases. In general, there is also a clear regional relationship between the evolution of AED contribution and precipitation and AED patterns in each region (Figs. A7 and A8).
3.3 Atmospheric and oceanic conditions during flash drought development
Figure 8 shows the seasonal composites of 500 hPa geopotential height (Z500) and sea level pressure (SLP) anomalies during the development of the top-10 flash droughts recorded in each season for the period 1969–2021. Overall, notable positive Z500 anomalies are recorded during flash drought development over the UK and western Europe in all seasons, exceeding 50 m in summer and spring or even 100 m in winter and autumn. Similarly, high SLP anomalies are recorded during flash drought development in all seasons, although there are some seasonal variations. The highest anomalies in SLP are recorded in winter, with values higher than 10 hPa around the UK. Notable anomalies in SLP are also noted in spring and autumn, exceeding 6 hPa. In summer, the positive anomalies reach the lowest values (2–4 hPa).
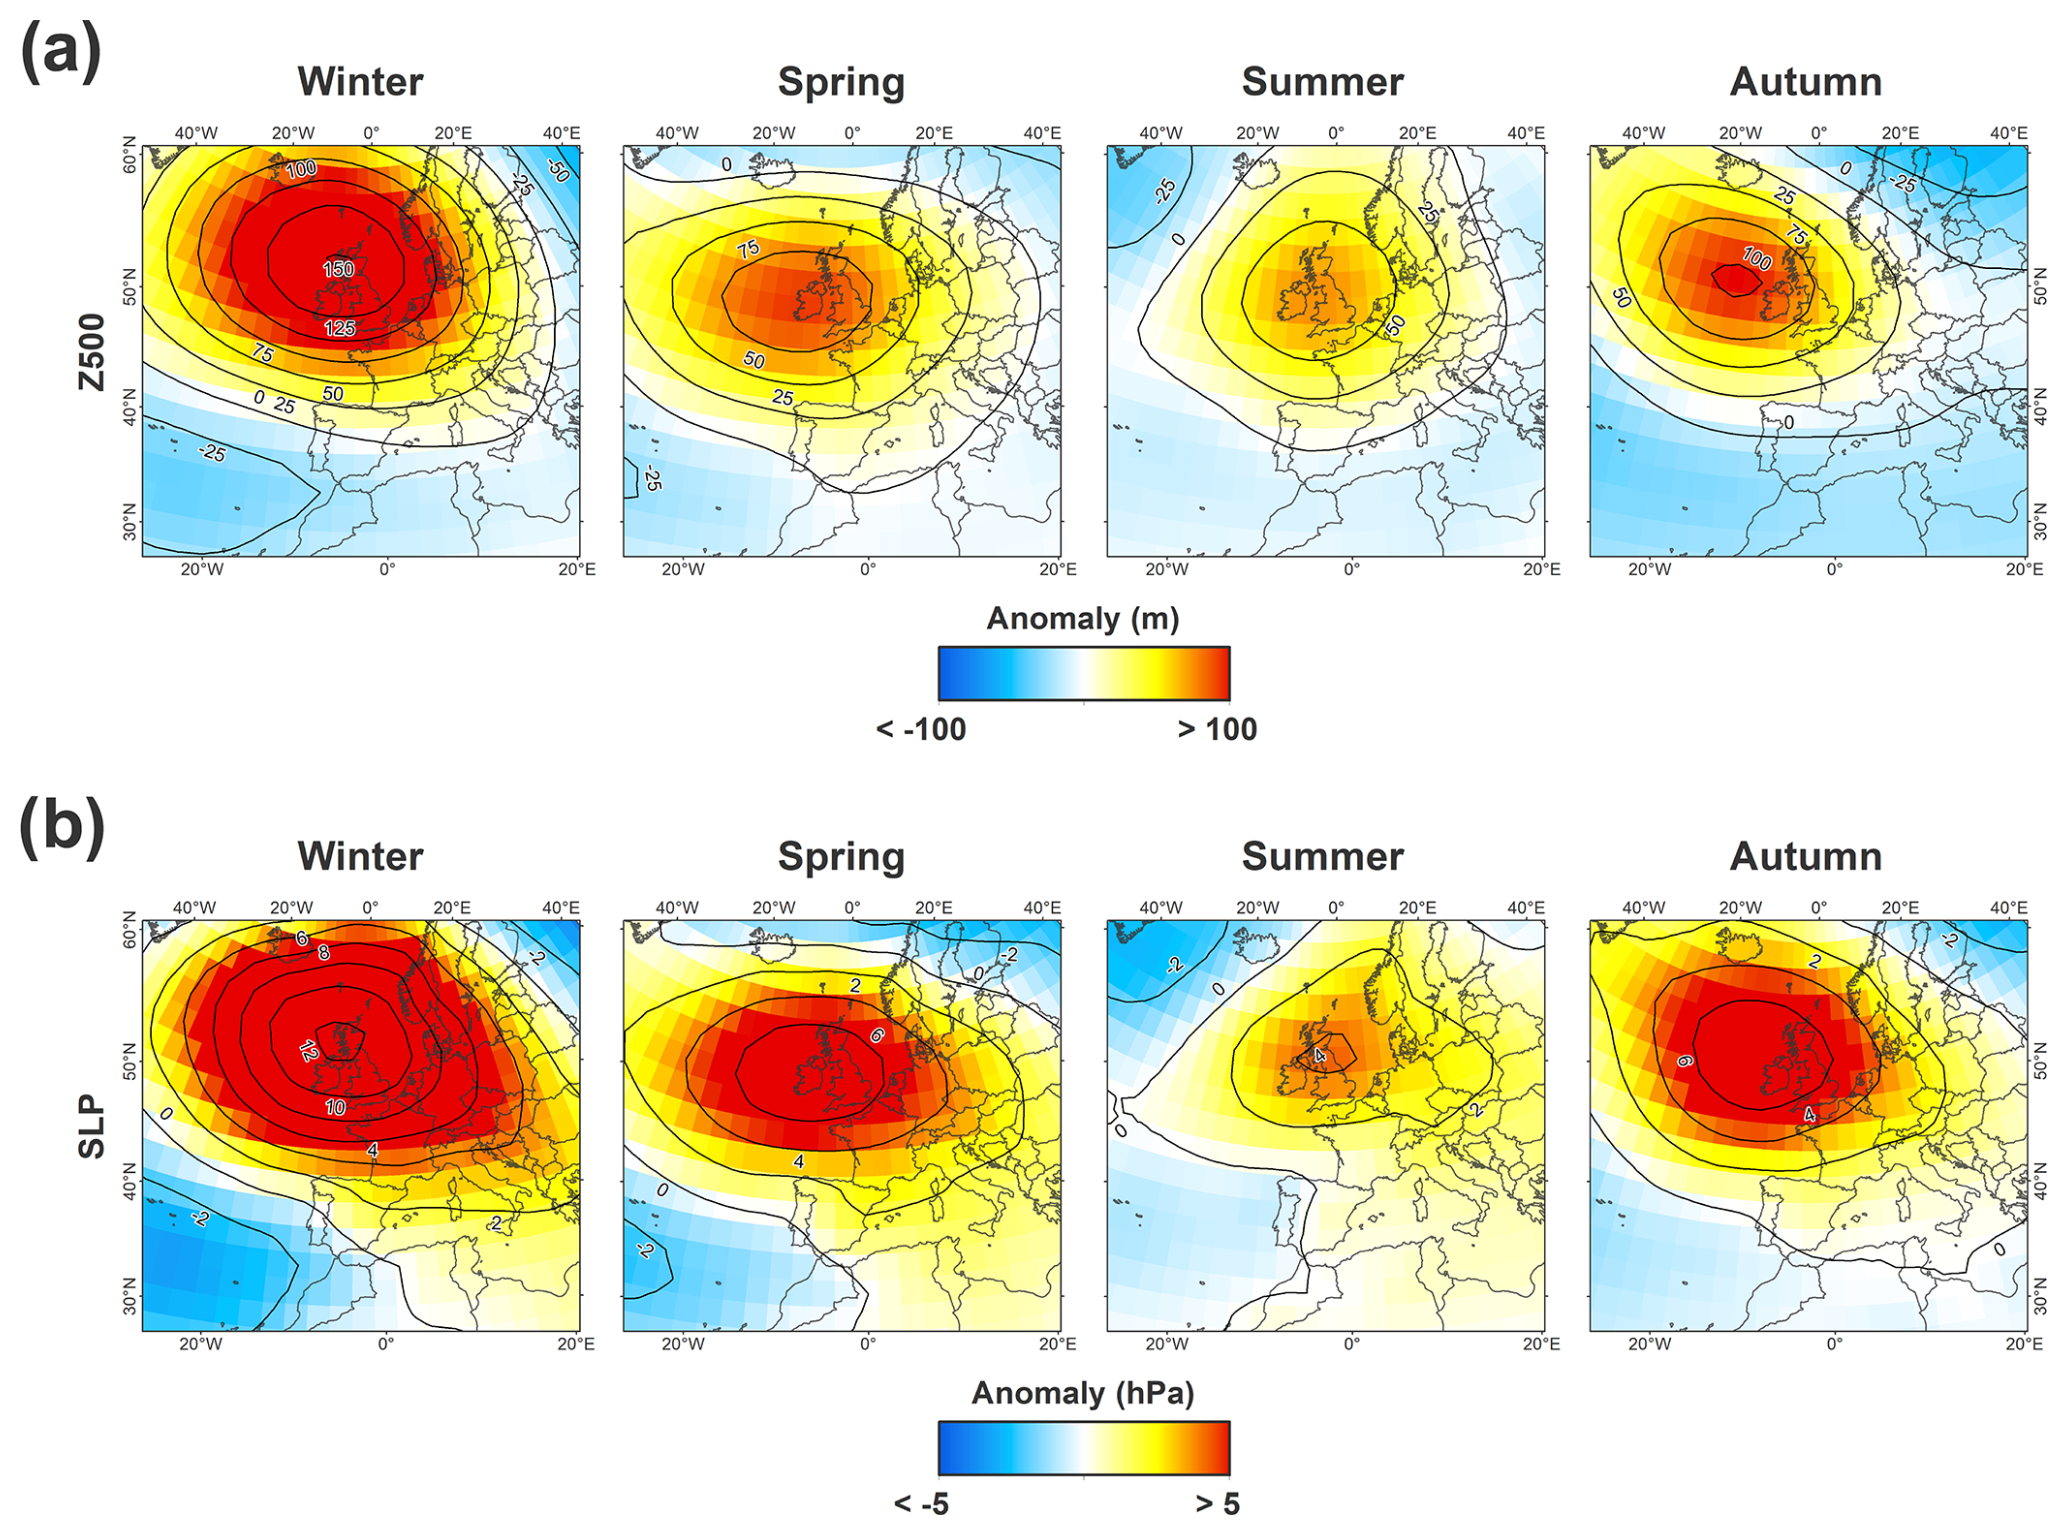
Figure 8Seasonal composites of (a) Z500 and (b) SLP anomalies during the development of the top-10 flash droughts of each season over the United Kingdom for the period 1969–2021.
The average anomalies in the North Atlantic Oscillation index (NAOi) during the development of the top-10 flash droughts of each season are presented in Fig. 9. Important seasonal differences are noted in the NAO phase during the development of flash droughts, with a marked contrast between winter–autumn and summer–spring months. In winter and autumn, remarkable and negative anomalies in NAOi are recorded, with average values around −1 but in some cases less than −2. By contrast, positive and moderate NAOi anomalies dominate during the development of the flash droughts in spring and summer months.
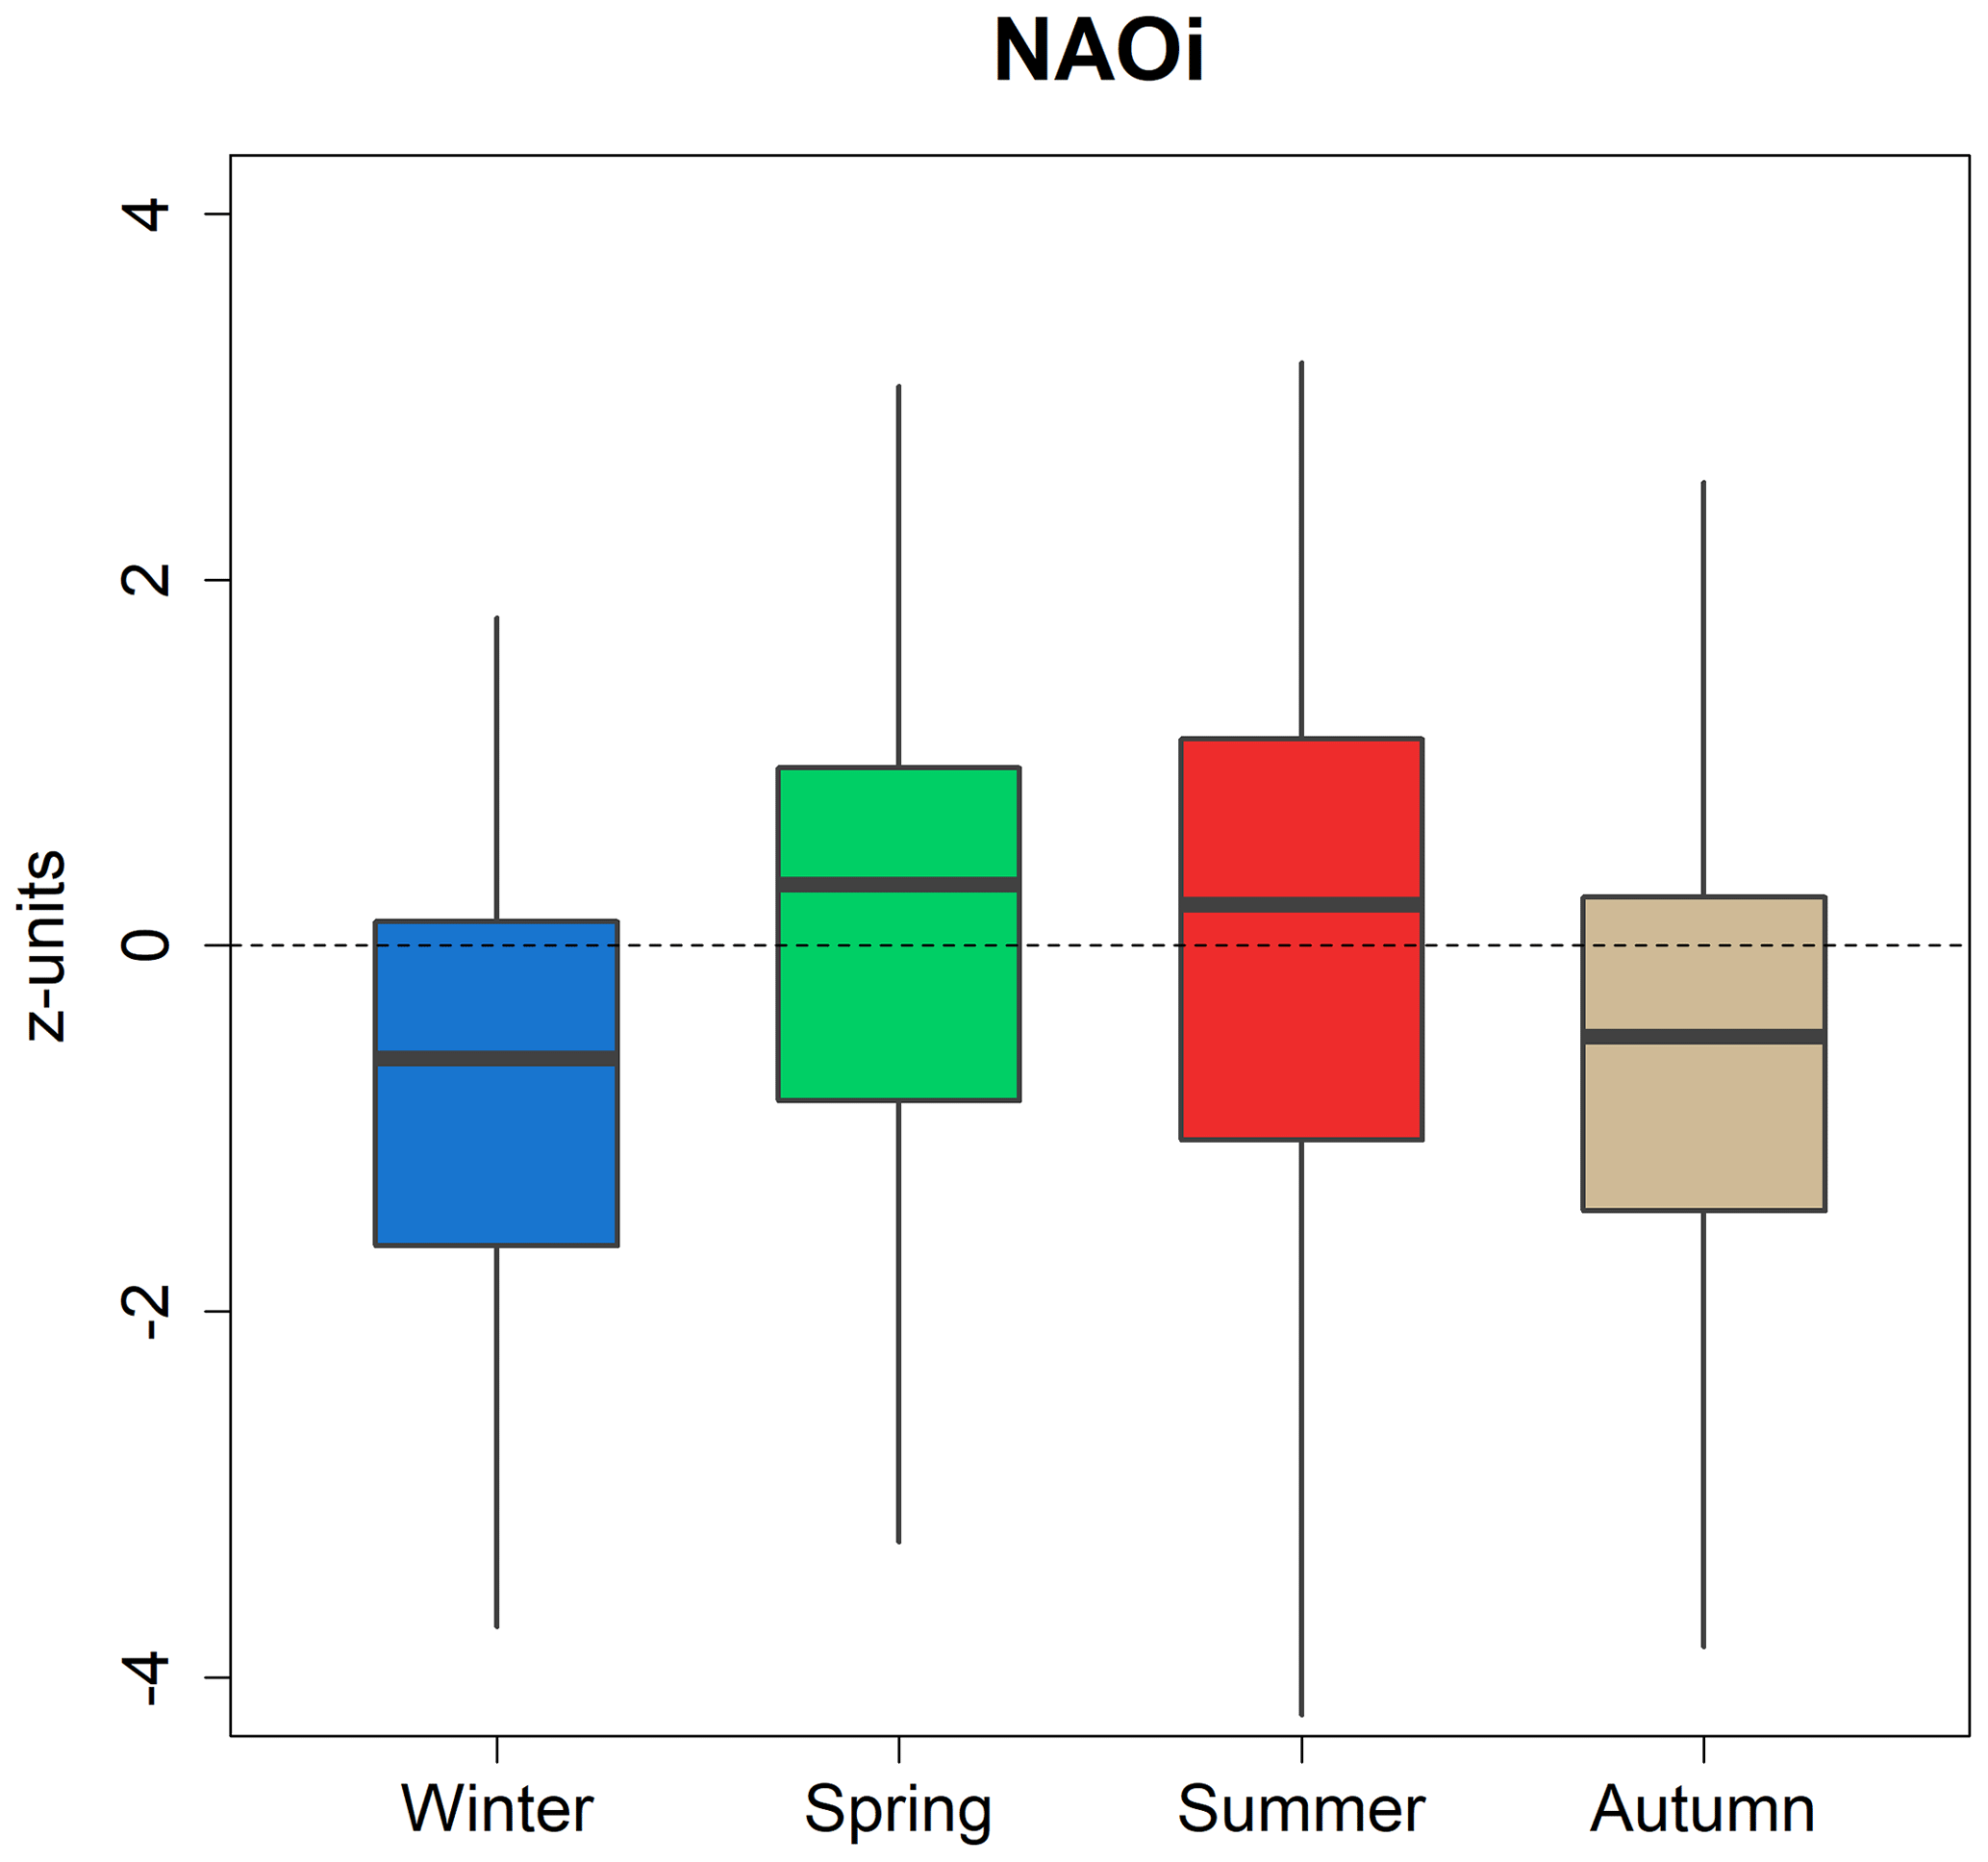
Figure 9Seasonal North Atlantic Oscillation index (NAOi) values during the development of the top-10 flash droughts of each season over the United Kingdom for the period 1969–2021.
Finally, the seasonal anomalies in sea surface temperature (SST) are examined during the development of the top-10 flash droughts recorded in each season for the period 1982–2021 (Fig. 10). Positive SST anomalies are generally recorded during the development of the flash drought in spring and summer over the Atlantic Ocean around the UK and the western Europe coast, with anomalies generally exceeding 1 °C in summer. By contrast, we found a higher spatial variability in SST during winter and autumn, with both positive and negative anomalies recorded during the development of flash droughts in these seasons over the Atlantic Ocean around the UK. Positive and notable anomalies exceeding 1 °C are also observed over some areas of the Arctic Ocean in all seasons.
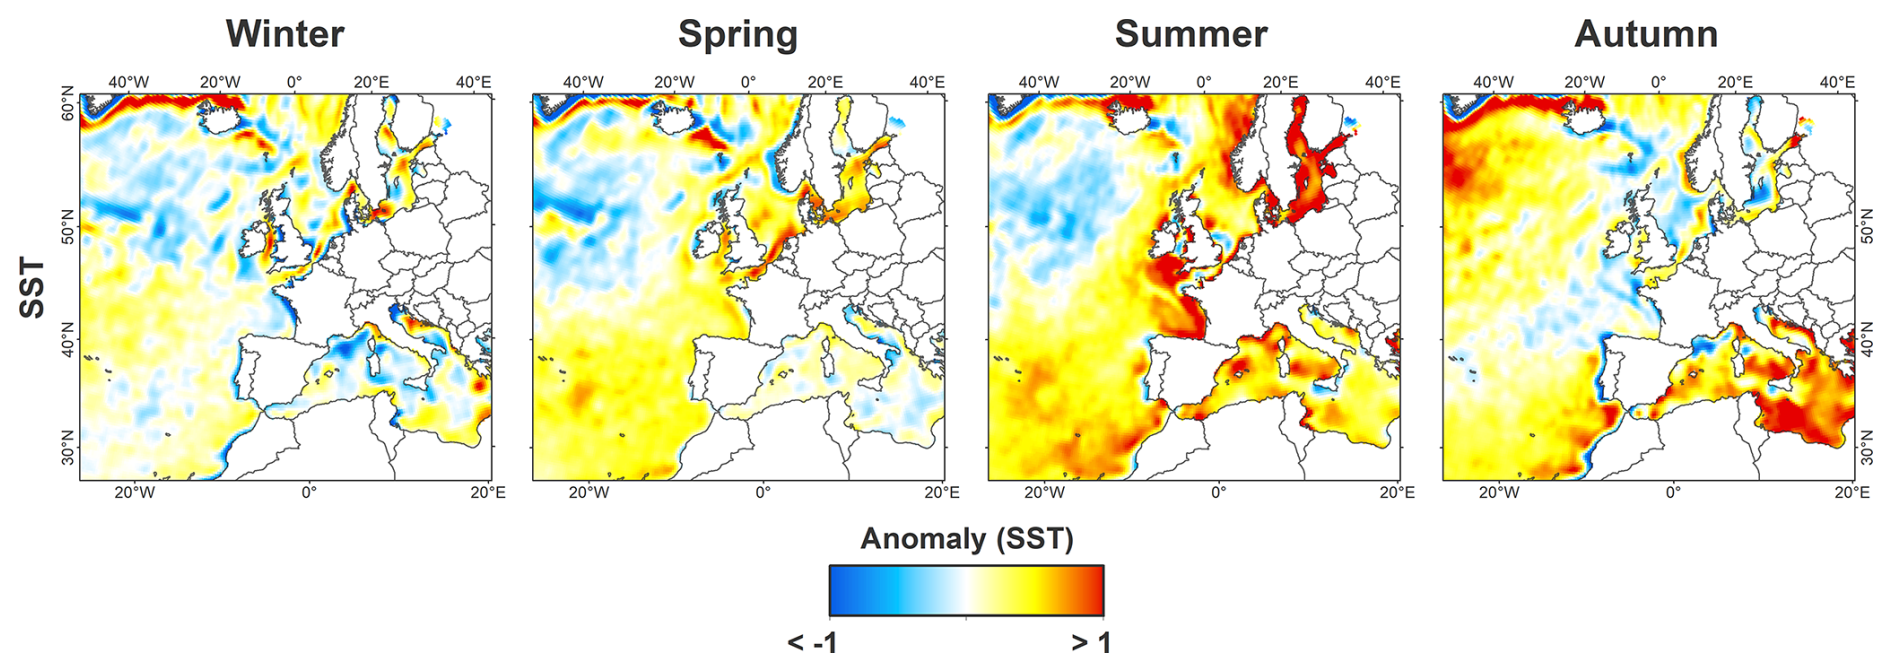
Figure 10Seasonal anomalies (°C) in sea surface temperature (SST) during the development of the top-10 flash droughts of each season over the United Kingdom for the period 1982–2021.
4.1 Characteristics and trends of flash droughts in the UK
This study analysed the occurrence of flash droughts in the UK over a long-term period. The results indicate that flash drought is characterised by a high variability, with important regional and seasonal differences. Droughts exhibit a great spatio-temporal variability in the UK (Tanguy et al., 2021), and this complexity also extends to flash drought patterns. However, the patterns of these rapid-onset droughts occurring at short timescales differ from those found by previous studies focussing on long-term droughts (Burke and Brown, 2010; Dobson et al., 2020; Rahiz and New, 2012). Our findings show that both the wetter regions of the North-West and the drier areas of the South-East were affected by flash drought in all seasons over the last 5 decades. Overall, the highest frequency of flash droughts is noted in Wales and Northern Ireland, while the lowest number of events is observed south-eastern regions. The high number of events recorded in some humid regions of the central and northern UK may be a response to the frequent occurrence of short dry periods compared to the south-eastern regions, where rainfall is notably lower and less variable, so these rapid dry spells may be less frequent in the south-east but more relevant in terms of impacts. For example, Tanguy et al. (2021) found that north-western regions tend to be more frequently affected by short-term droughts, while the south-eastern regions are less frequently affected by droughts but with greater severity. In late autumn and winter, it is expected that flash droughts have little environmental impact as deficits built up during short dry periods are quickly replenished by wet periods, although these dry spells may still be relevant from a hydrological point of view given the quick response (∼1 month) of UK catchments to rainfall scarcity, especially in the north (Barker et al., 2016). Conversely, flash droughts occurring in spring, summer, and early autumn (i.e. the growing season), which are more common in the central and western UK, are expected to have important environmental and agricultural implications. During this period, vegetation demands more water, and precipitation deficits are often accompanied by increased temperatures leading to vegetation stress (Pribyl, 2020), with significant environmental and agricultural impacts, as evidenced by recent summer half-year droughts (Barker et al., 2024; Turner et al., 2021).
In general, there are no compelling major increases in the frequency of flash droughts for the period 1969–2021. Previous studies focussing on long-term drought (e.g. 3-, 6-, and 12-month timescales) also reported few changes in drought occurrence over most of the UK (Tanguy et al., 2021; Vicente-Serrano et al., 2021). Nevertheless, we found a notable and significant increase in the number of flash droughts recorded in spring. Recent studies based on soil moisture data from reanalysis suggest an increase in flash drought frequency associated with the rise of evaporative demand in the last few years at European scale (Shah et al., 2022). In this case, we noted some parallels between the trends in flash droughts and the recent evolution of rainfall and AED over the UK at seasonal scale (see Fig. A5). Thus, the only season in which precipitation has not increased and AED has risen significantly (i.e. spring) is the only one that shows a general increase in flash drought frequency. Conversely, the seasons in which the average precipitation has increased show generally negative and non-significant trends. Therefore, there is a seasonal consistency between flash drought frequency and the spatio-temporal patterns noted in rainfall and AED over the UK. During the growing season, when the impacts of this kind of events are expected to be greater, we observed significant increases in the eastern regions due to the increase in the number of events observed in spring and summer over these areas, although there is no clear trend for the whole of the UK, as well as for each of the regions considered.
4.2 Meteorological drivers underlying flash droughts
Flash droughts in the UK are strongly driven by precipitation variability, particularly in winter and autumn. During these cold and wet months when AED is very low (Mayes and Wheeler, 2013), drought triggering depends almost exclusively on the occurrence of marked deficits in rainfall, and AED is irrelevant, with a few exceptions. The results evidence that the AED role is mainly limited to the drier regions of the south-east in spring and summer, when rising temperature (e.g. associated with heatwave episodes) combined with precipitation deficit can exacerbate pressure on water resources, amplifying drought impacts (Turner et al., 2021). In contrast, in humid regions such as northern UK, AED has a minor role in triggering droughts. In these regions characterised by energy-limited conditions, under normal (wet) conditions, an increase in AED would have no impact (Vicente-Serrano et al., 2020). Thus, it is expected that AED only plays a relevant role in driving drought conditions during very dry periods, as rainfall is a key factor determining the effect of AED on drought (Tomas-Burguera et al., 2020). Indeed, there is a clear spatial relationship between mean precipitation (e.g. Fig. A4a) and the AED contribution to flash drought (e.g. Fig. 6), which shows the same north-west–south-east gradient observed in rainfall distribution.
Although rainfall is the primary factor controlling flash drought variability in the UK, we found that the role of AED is becoming more relevant in triggering summer and spring flash droughts. This is particularly evidenced in spring, when a significant increase in AED is noted, but also in the south-eastern region in summer. Curiously, the maximum percentages of AED contribution to flash drought development are generally found in spring rather than in summer. This pattern can be explained by the notable increase in AED contribution in spring since the late 1980s due to the general rise of AED in this season (Blyth et al., 2019; Robinson et al., 2017) but also by the anomalous higher-than-average precipitation recorded during summer (Kendon et al., 2022) in the recent few years. In fact, spring was the driest season in the UK over the last 5 decades. The trends observed in AED contribution may be relevant to understanding recent trends in flash droughts frequency in summer and particularly in spring. We found that those seasons and regions where AED contribution increased generally show positive trends in flash drought frequency. Similarly, previous studies have linked the increase in the frequency and severity of flash droughts in some regions of the world to the growing relevance of AED as a driver of drought conditions under global warming (Mishra et al., 2021; Noguera et al., 2022; Yuan et al., 2018, 2019).
4.3 Atmospheric and oceanic conditions involved in flash drought development
The atmospheric and oceanic conditions preceding the onset of flash droughts in each season were examined in order to identify the possible mechanism behind the strong anomalies related to this type of events (Fig. A9). Typically, flash droughts develop in the presence of high-pressure systems over the UK. Remarkable anomalies in SLP and Z500 are noted during the development of flash droughts in all seasons but particularly in winter. The observed patterns typically correspond to the northward displacement of the Azores High, resulting in blocking situations that prevent the arrival of humid air masses and consequently inhibit precipitation (Richardson et al., 2018). In winter and autumn, the location of the pressure fields corresponds to the typical patterns of the negative phase of the NAO. Thus, the development of flash droughts in autumn and especially in winter is commonly associated with strong negative anomalies in NAOi. Numerous studies have demonstrated the relationship between the negative phase of the NAO and the absence of precipitation during these seasons (Fowler and Kilsby, 2002; Murphy and Washington, 2001; West et al., 2021b), particularly in north-western regions (West et al., 2019). In addition, the negative phase of the NAO in winter usually coincides with cold periods (Hall and Hanna, 2018), which would reinforce the negligible role of the AED compared to that of rainfall and can explain the negative anomalies observed in AED during these months (Fig. A9). On the contrary, positive anomalies in NAOi are generally recorded in spring and summer, although these anomalies are highly variable. During these months there is not a strong relationship between precipitation variability and NAO phase (West et al., 2021b), particularly in summer, and the anomalies recorded are generally more variable. The NAO is the main large-scale atmospheric circulation pattern that controls precipitation variability (West et al., 2021a), and its link with drought is well known (West et al., 2022). The anomalies observed during the previous weeks to flash droughts onset confirm that flash drought development is also closely connected with the NAO phase, especially in winter.
Flash droughts usually develop during period of positive SST over the Atlantic Ocean around the UK and western European coasts in spring and summer, while no clear patterns of SST anomalies are recorded for winter and autumn flash droughts. The influence of SST on drought is quite complex given the strong ocean–atmosphere interactions and its crucial role in modulating large-scale atmospheric circulation patterns (Robertson et al., 2000). Several studies showed how SST anomalies over the Atlantic Ocean can have an important role in driving precipitation and, consequently, drought variability over Europe in the long term (Ionita et al., 2015; Rimbu et al., 2001). Recent studies also noted that SST anomalies can play certain role driving drought events developing in the short-term as flash droughts (Ma et al., 2024). In the case of the UK, SST patterns over the Atlantic Ocean are very important in promoting drought occurrence due to their influence on atmospheric circulation, including the NAO (Kingston et al., 2013; Svensson and Hannaford, 2019). Here, we found some similarities with the patterns observed in other studies, which showed a connection between drought occurrence in the UK and periods characterised by positive SST anomalies in the eastern Atlantic Ocean and the Arctic Ocean prior to the onset of spring and summer drought (Kingston et al., 2013; McCarthy et al., 2019). This seems to suggest that these anomalies may have some relevance in favouring the development of flash droughts, although this issue requires further research.
4.4 Limitations and future work
Despite the consistency of the flash drought patterns with the meteorological observations, as well as the ocean–atmospheric conditions, there are some issues that should be carefully considered in interpreting our findings. Firstly, adopting an approach for flash drought identification based exclusively on meteorological data does not provide a measure of drought impacts. In addition to meteorological data, a comprehensive assessment of drought conditions would ideally require the use of different data sources, including data on vegetation activity, soil moisture, streamflow variability, or crop yield (Otkin et al., 2022). However, these datasets usually have some limitations (e.g. relatively short records), so we decided to focus on meteorological data, which allowed us to conduct our study over the long-term. Future work could link flash drought occurrence, as reported here, with hydrological drought responses and agricultural or environmental impacts. Moreover, by applying a method focused solely on the rate of intensification of the development phase to identify flash droughts, it is expected that in some cases short-term deficits could quickly be offset by wet periods, reducing their overall impact, especially if the development of the event was preceded by wet conditions. This issue is more likely to occur in late autumn and winter, when wet and cold conditions are dominant and vegetation activity is lower.
Another important point that should be considered is related to the complex dynamics of precipitation in the UK (Hulme and Barrow, 1997; Mayes and Wheeler, 1997), which is characterised by large variations. Given the large variability of precipitation in the UK, the period selected for the analysis had important implications for the trends observed. This is particularly important in summer season when a high interdecadal variability is observed. For example, given the occurrence of unusual wet summers since 2007 (Kendon et al., 2022), positive trends in precipitation have been recorded over the last decades, as well as increases in stream flows (Hannaford, 2015). In contrast, other studies focussing on very long records (i.e. period 1776–2002) found a decrease in summer precipitation over England and Wales (Mills, 2005). Therefore, although summer has become wetter if we consider the last few decades, these trends are strongly determined by the period selected and could vary notably when looking at longer records.
Future work should focus on addressing whether the observed trends are simply due to natural climate variability or whether these increases could be attributed to anthropogenic forcing contributing to rising temperatures and the relevance of the AED to flash drought development. In this way, large ensembles could be considered in the future to examine possible trends according to natural variability (e.g. Deser and Phillips, 2023). Furthermore, it would be necessary to analyse future projections of these trends under different greenhouse emission scenarios to disentangle the possible effects of climate change on the occurrence of flash droughts in the UK. Another key issue that should be analysed in future studies is the response of the different systems affected by drought and how flash drought conditions propagate through these systems in the UK. The response of crops, natural vegetation, soil moisture, and river flows should be analysed to elucidate how the meteorological anomalies identified in this study translate into impacts, as the response of the different affected systems is expected to vary considerably over time and space. There are increasing efforts to establish databases on the environmental and social impacts of drought, which could also be linked to flash drought (e.g. building on previous approaches applied for droughts more generally such as Bachmair et al., 2015; Parsons et al., 2019).
In this research, we present for the first time a climatology of flash droughts in the UK, providing a detailed characterisation of their spatial and temporal patterns. Likewise, we analysed the trends in the seasonal occurrence of flash droughts for the period 1969–2021. We also show the role played by AED on flash drought triggering, as well as its evolution over the last 5 decades. Finally, we analysed the atmospheric and oceanic conditions recorded during flash drought development and their possible links with large-scale atmospheric patterns such as the NAO. The main conclusions from this study are as follows:
-
Flash drought occurrence in the UK is characterised by a high spatial and seasonal variability, affecting both the wetter regions of the North-West and the drier regions of the South-East.
-
There is a notable and significant increase in flash droughts in spring, but non-significant trends (positive/negative) are noted in winter, summer, and autumn.
-
Flash droughts in the UK are mainly driven by rainfall variability, while the AED has a minor role in triggering flash drought. In spring, there is a significant increase in AED contribution, which could explain the positive and significant trends observed in the number of events in this season.
-
Positive and remarkable anomalies in SLP and Z500 are noted during the flash drought development in all seasons. These anomalies are associated with the presence of high-pressure systems around the UK, which prevent the arrival of humid air masses and, consequently, inhibit precipitation.
-
The North Atlantic Oscillation (NAO) strongly controls flash drought occurrence over the UK, particularly in winter and autumn months.
-
Positive anomalies in sea surface temperatures (SSTs) are observed over the Atlantic Ocean around the UK during flash drought development in spring and summer, while mixed anomalies are noted in winter and autumn.
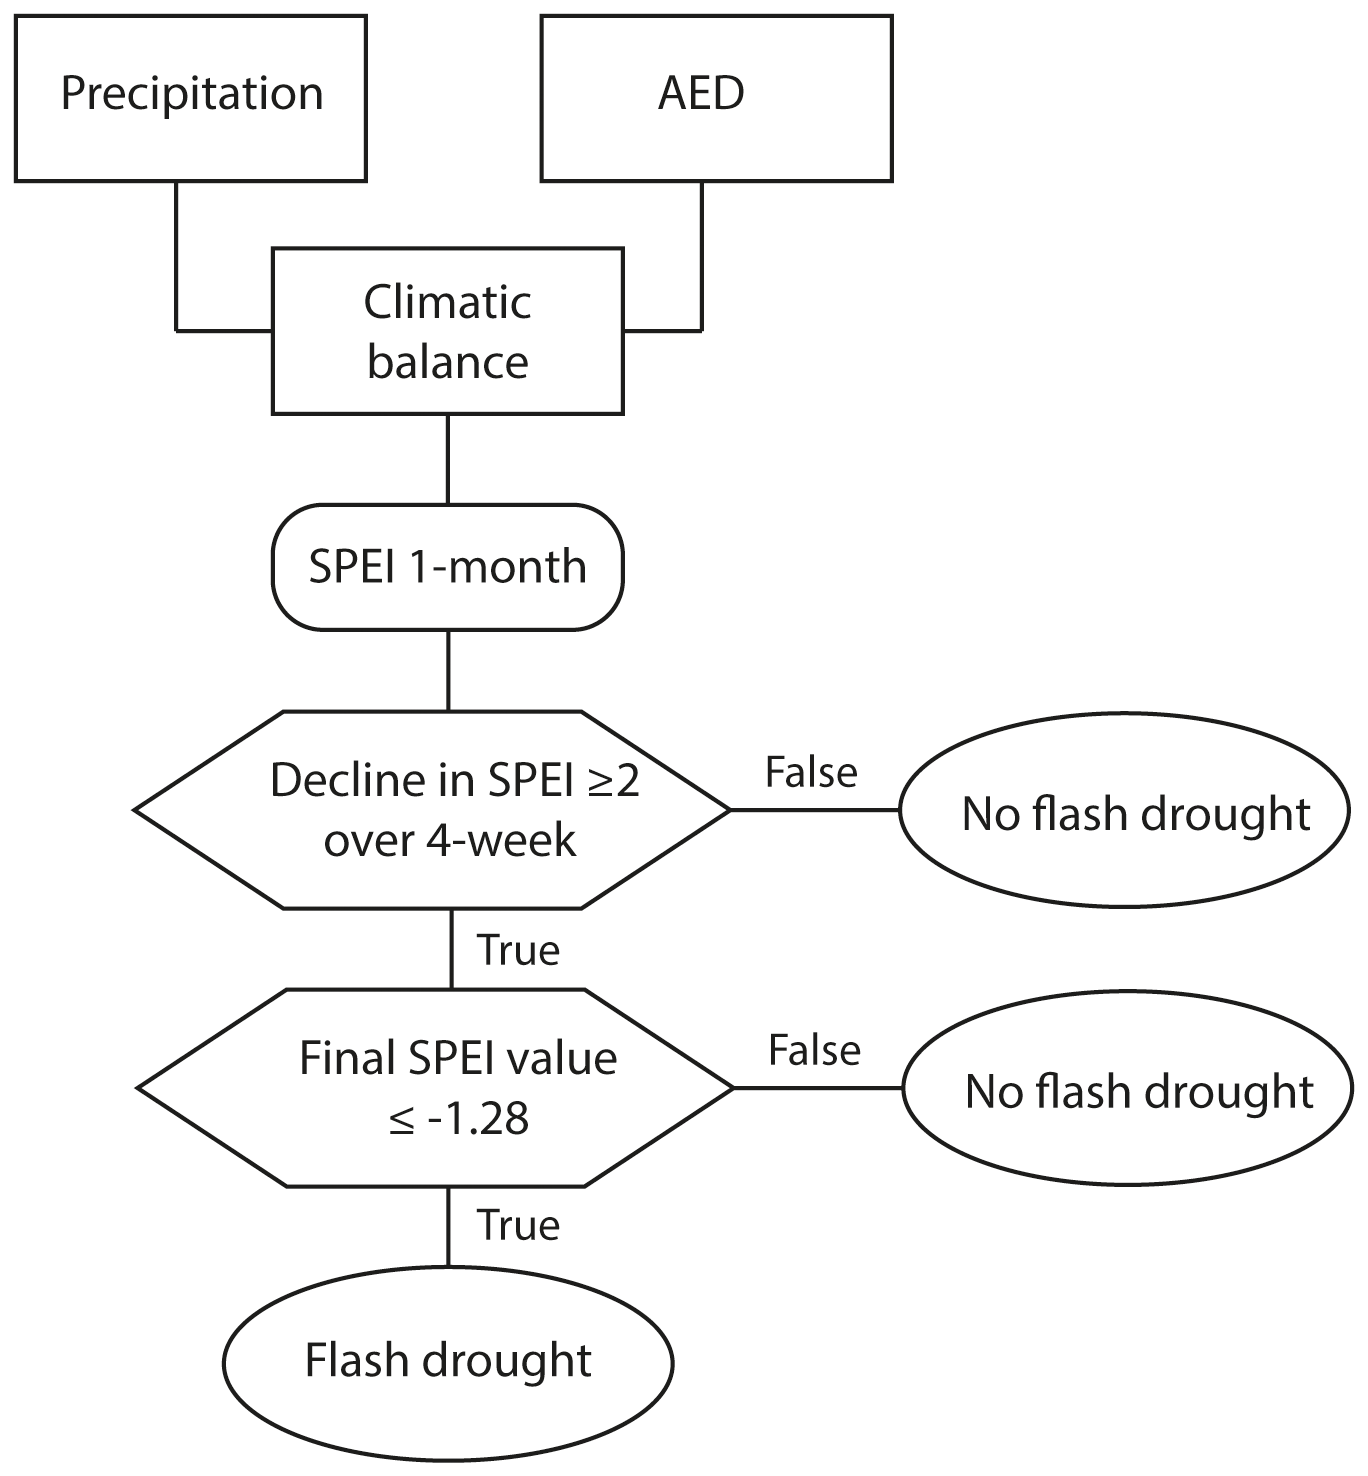
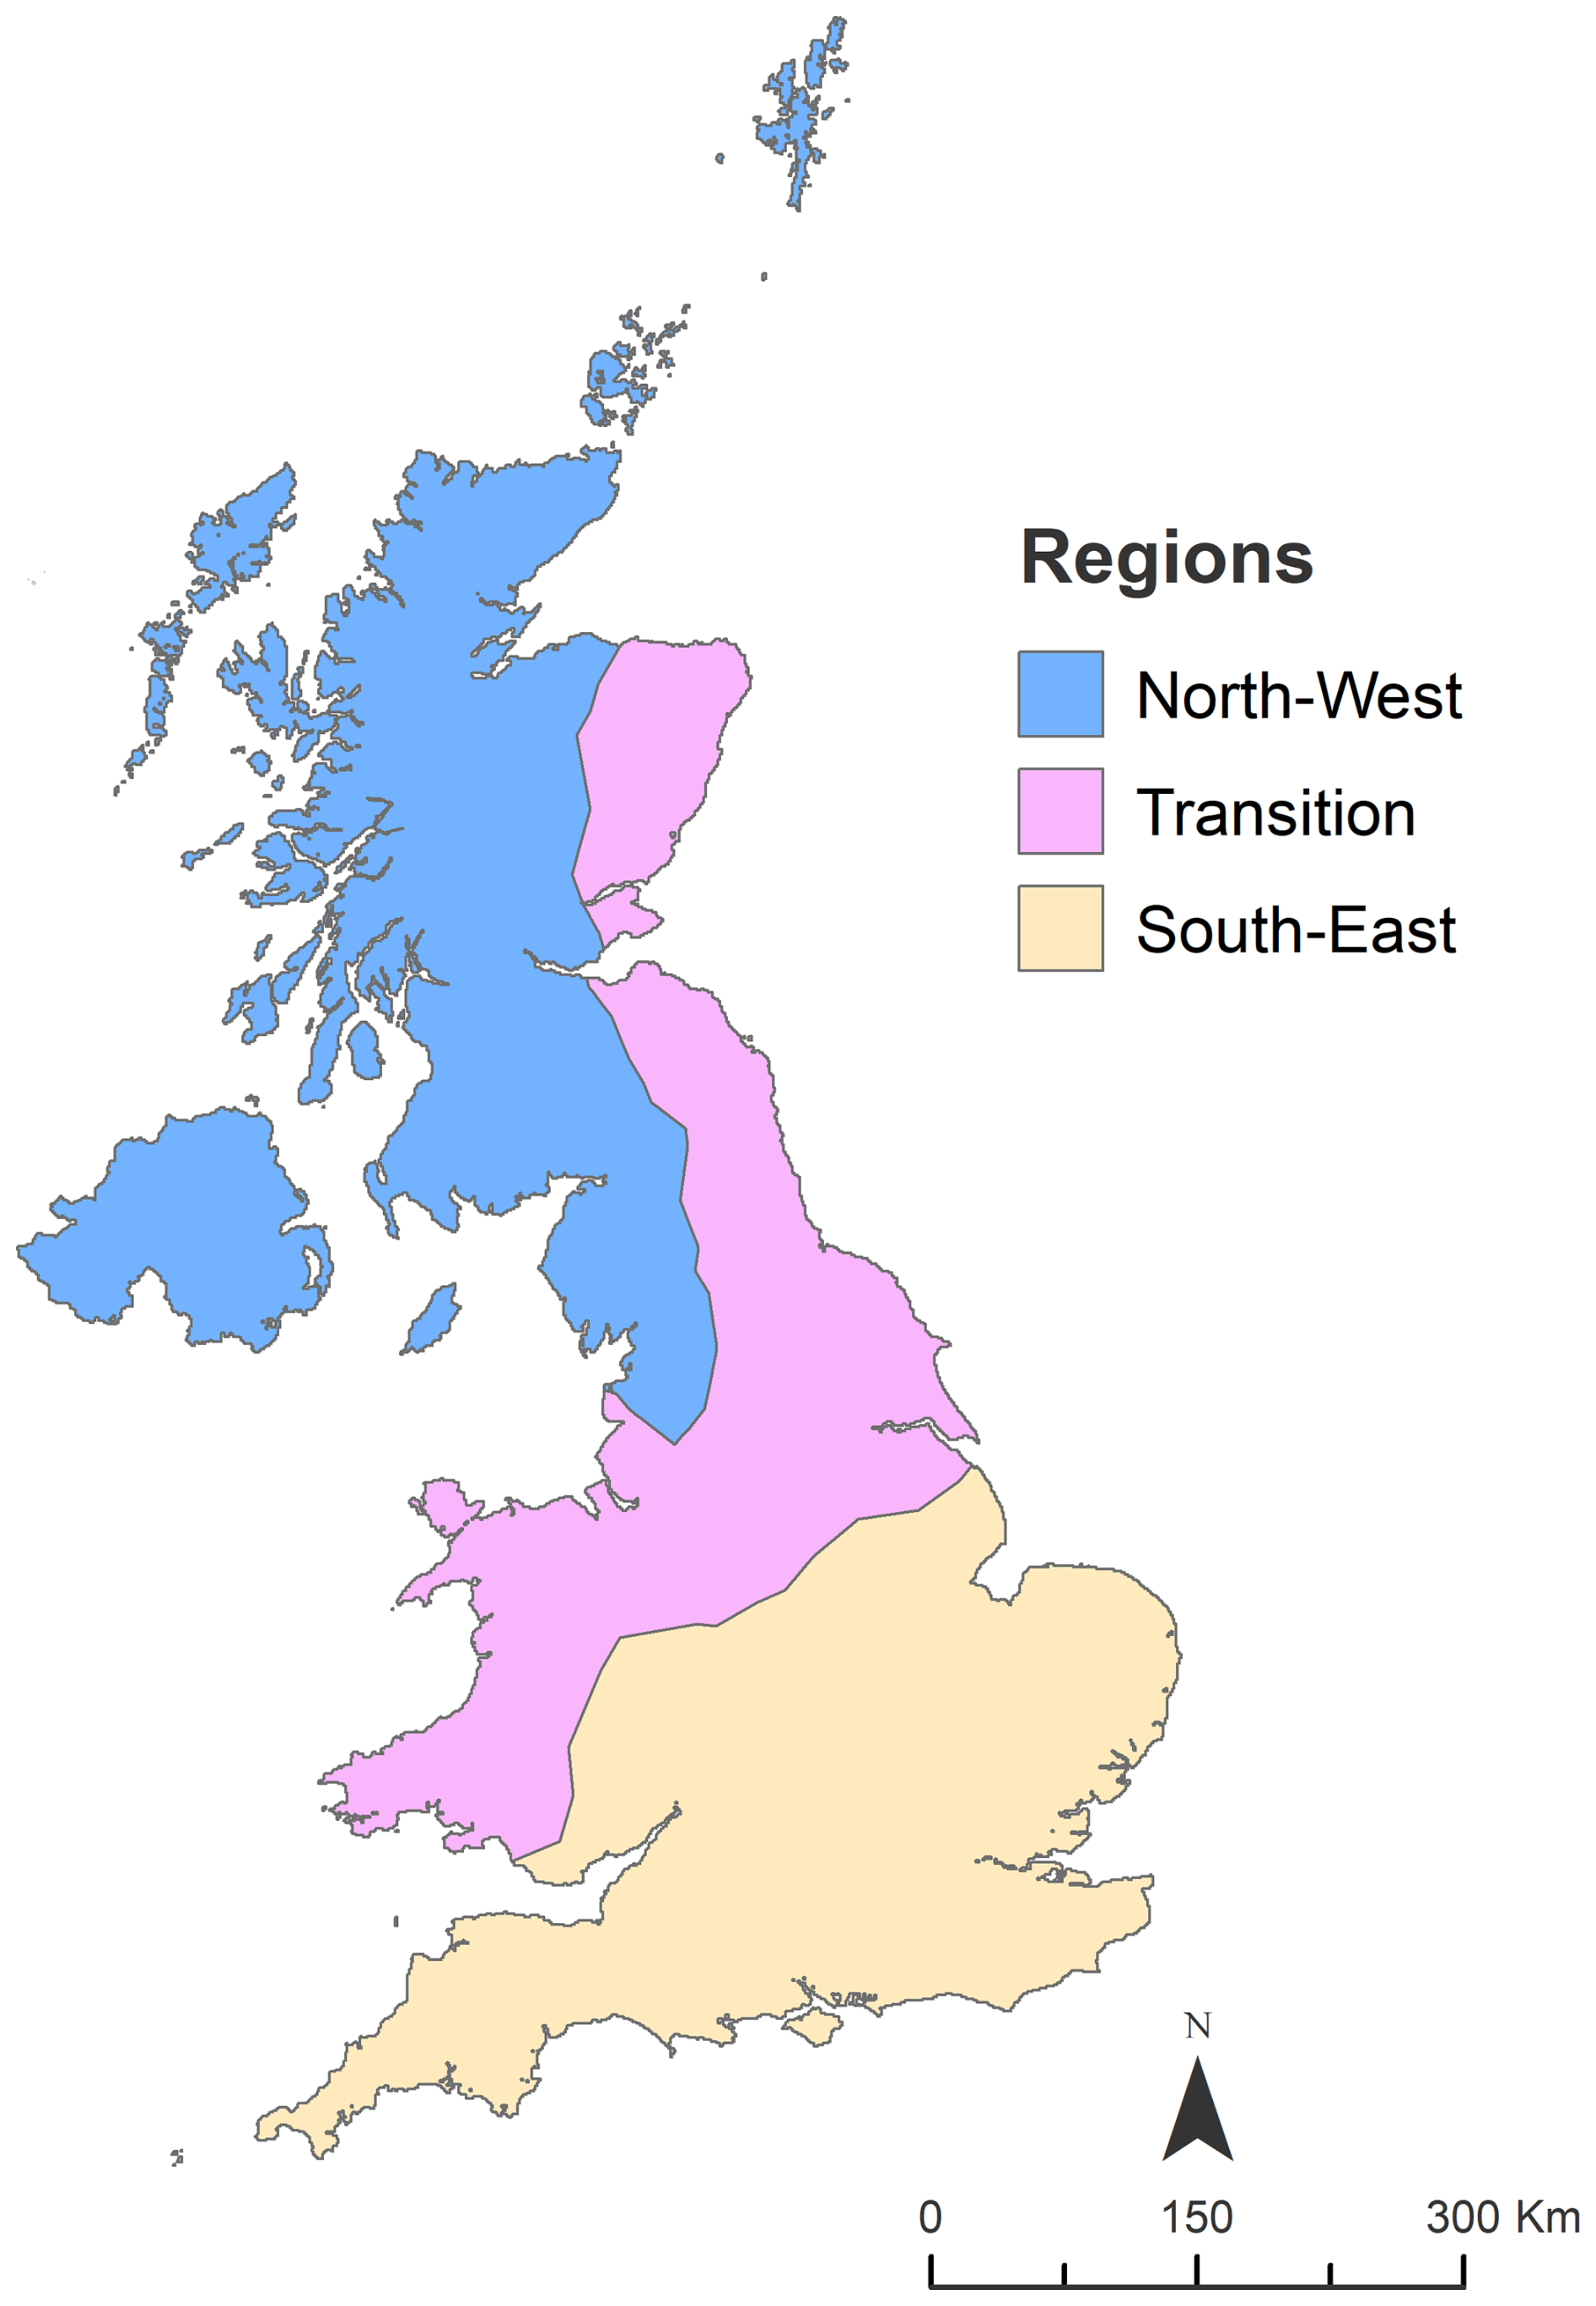
Figure A2Regional delimitation based on Tanguy et al. (2021).
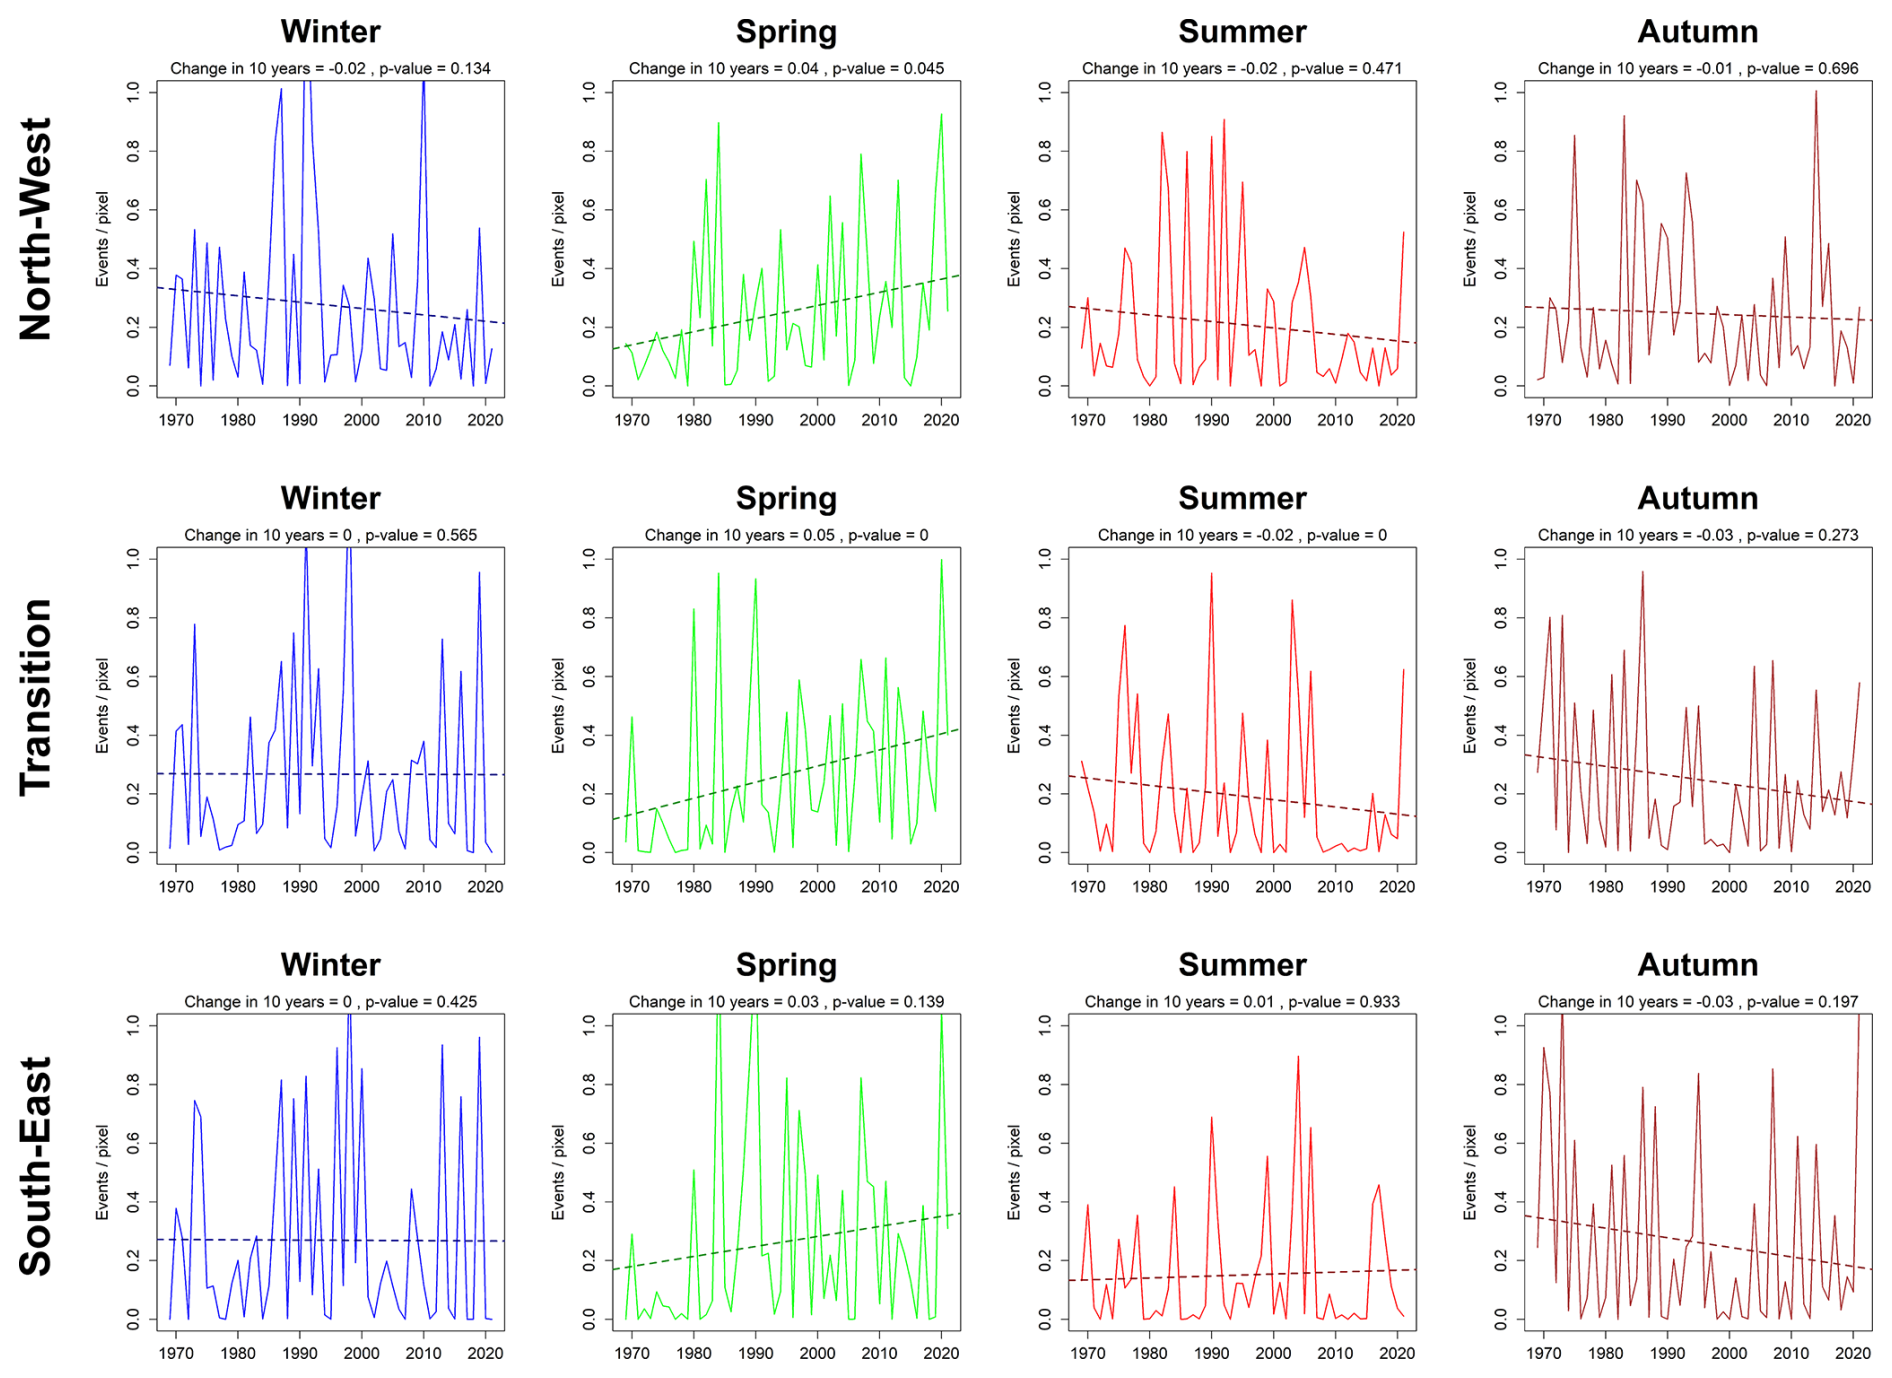
Figure A3Seasonal evolution of the number of flash droughts (events / pixel) in the United Kingdom for the period 1969–2021 by regions.
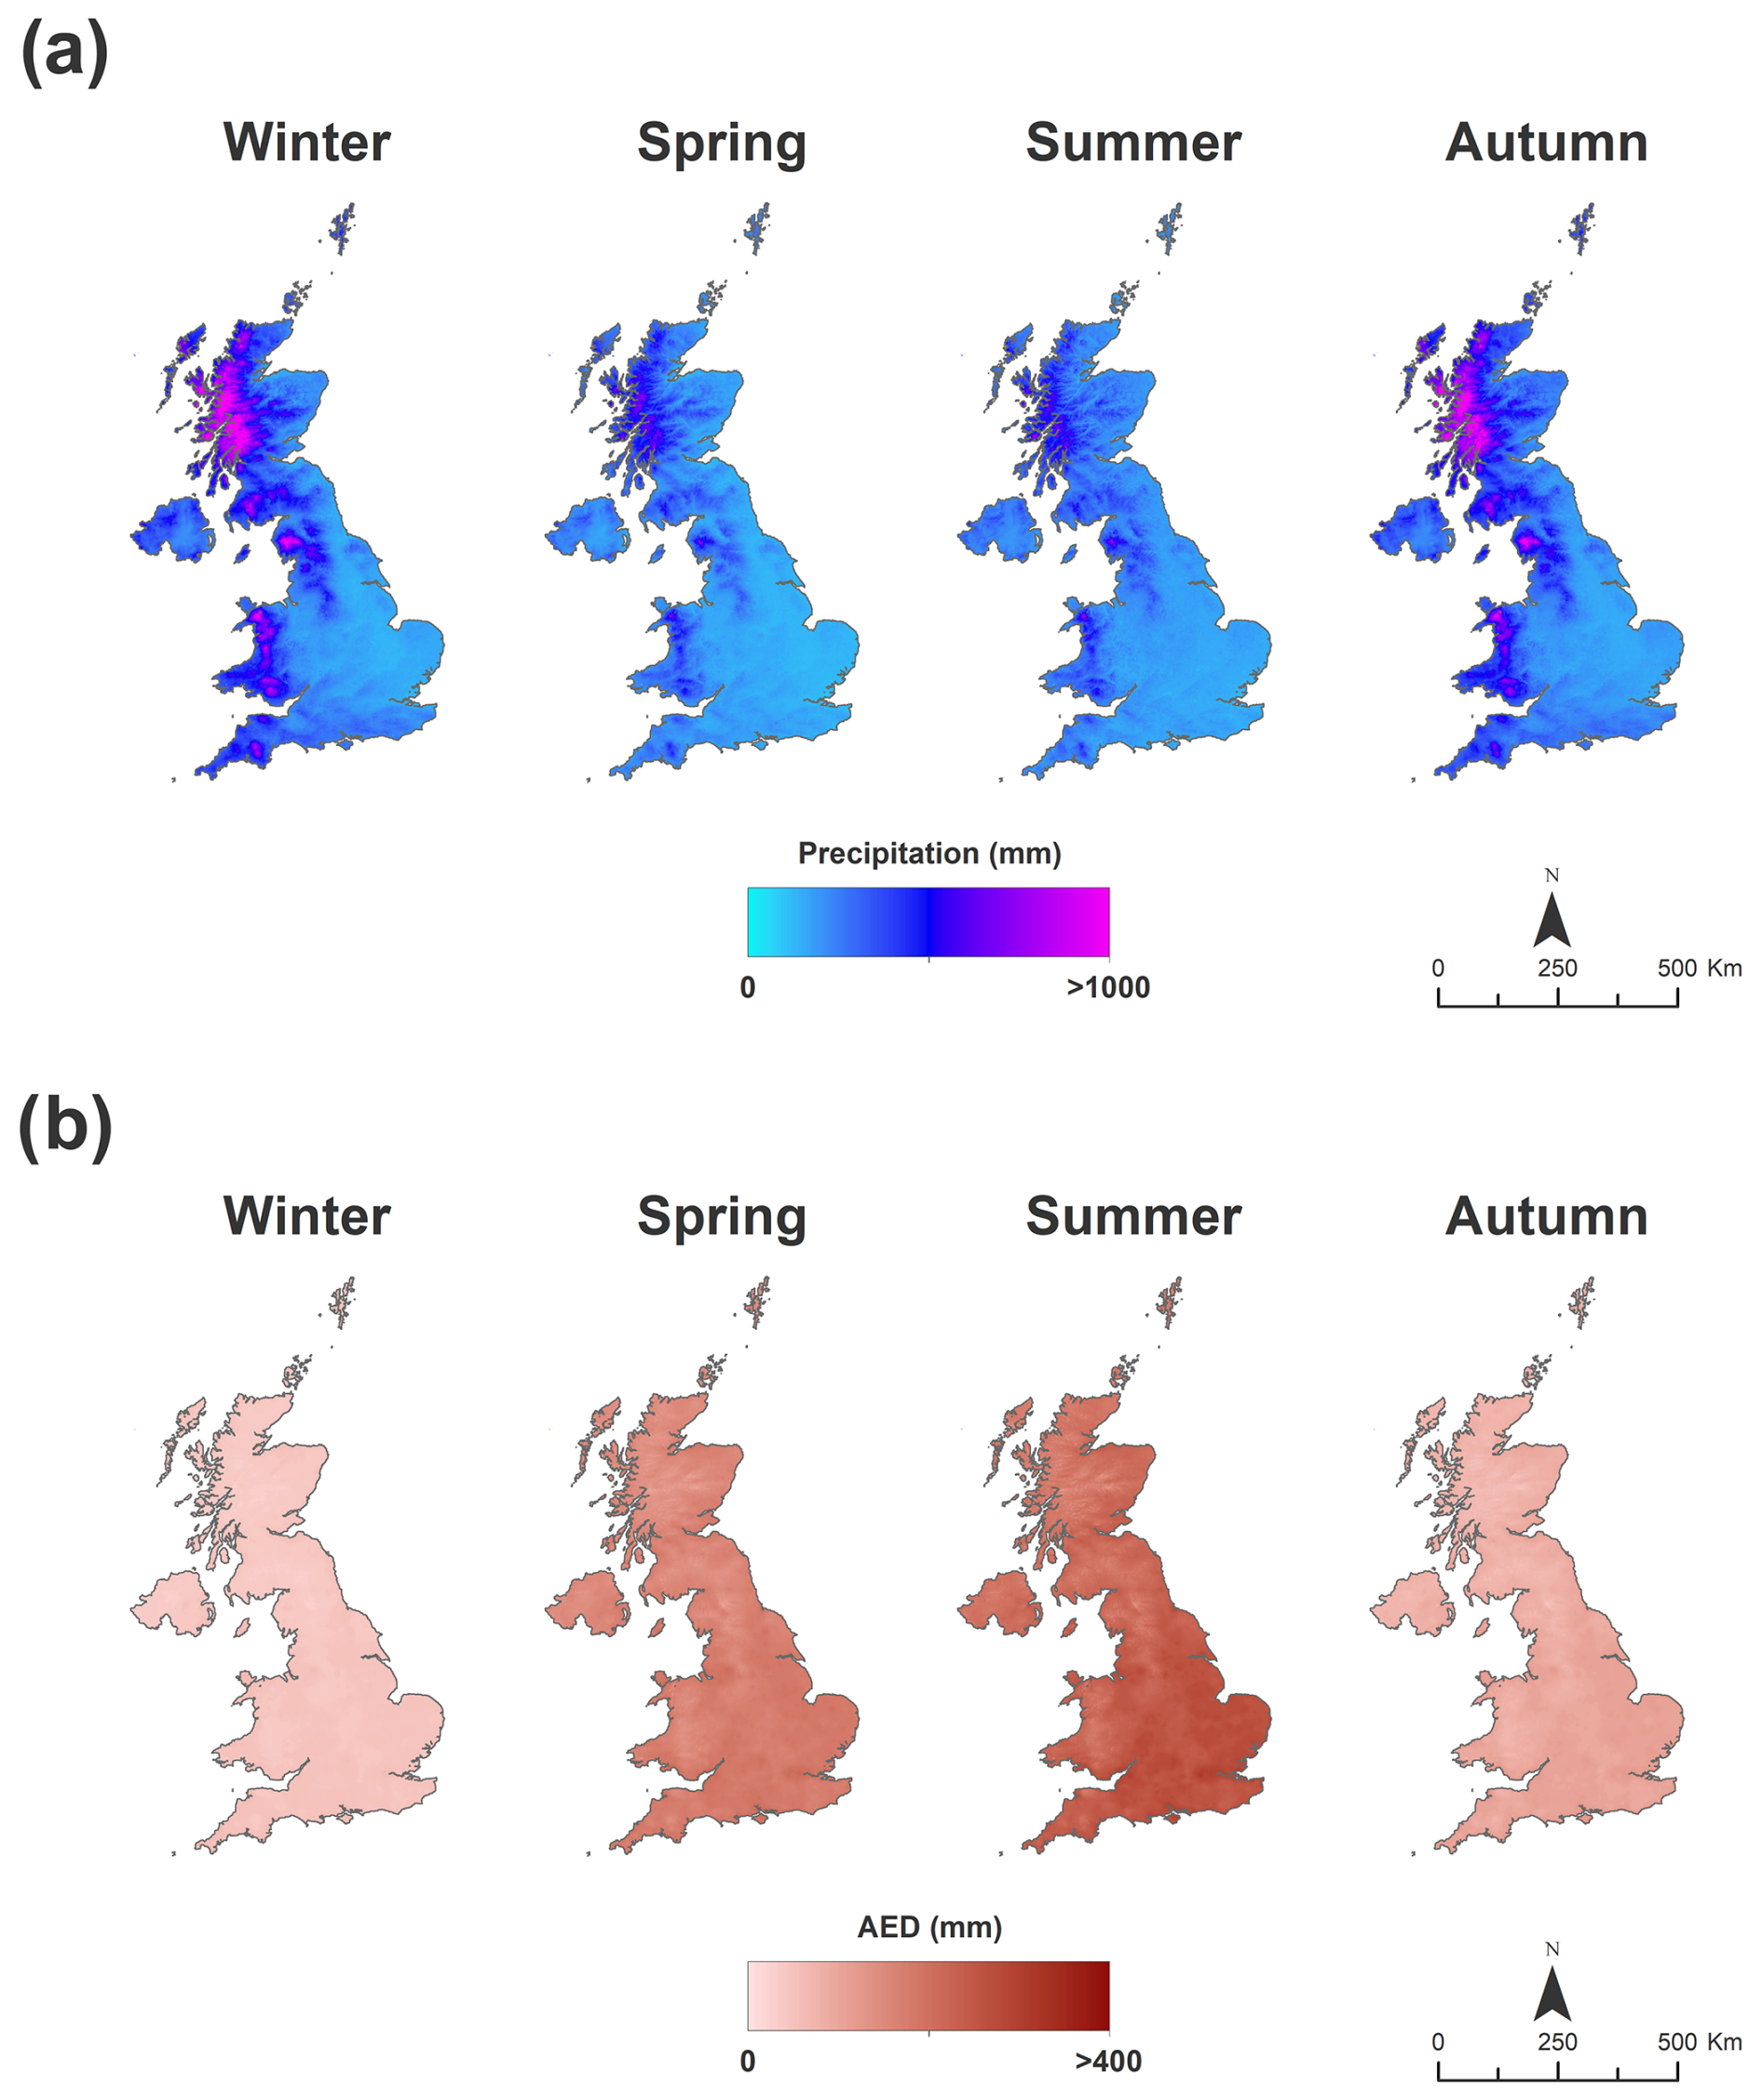
Figure A4Seasonal spatial distribution of the average (a) precipitation and (b) AED in the United Kingdom over the period 1969–2021.
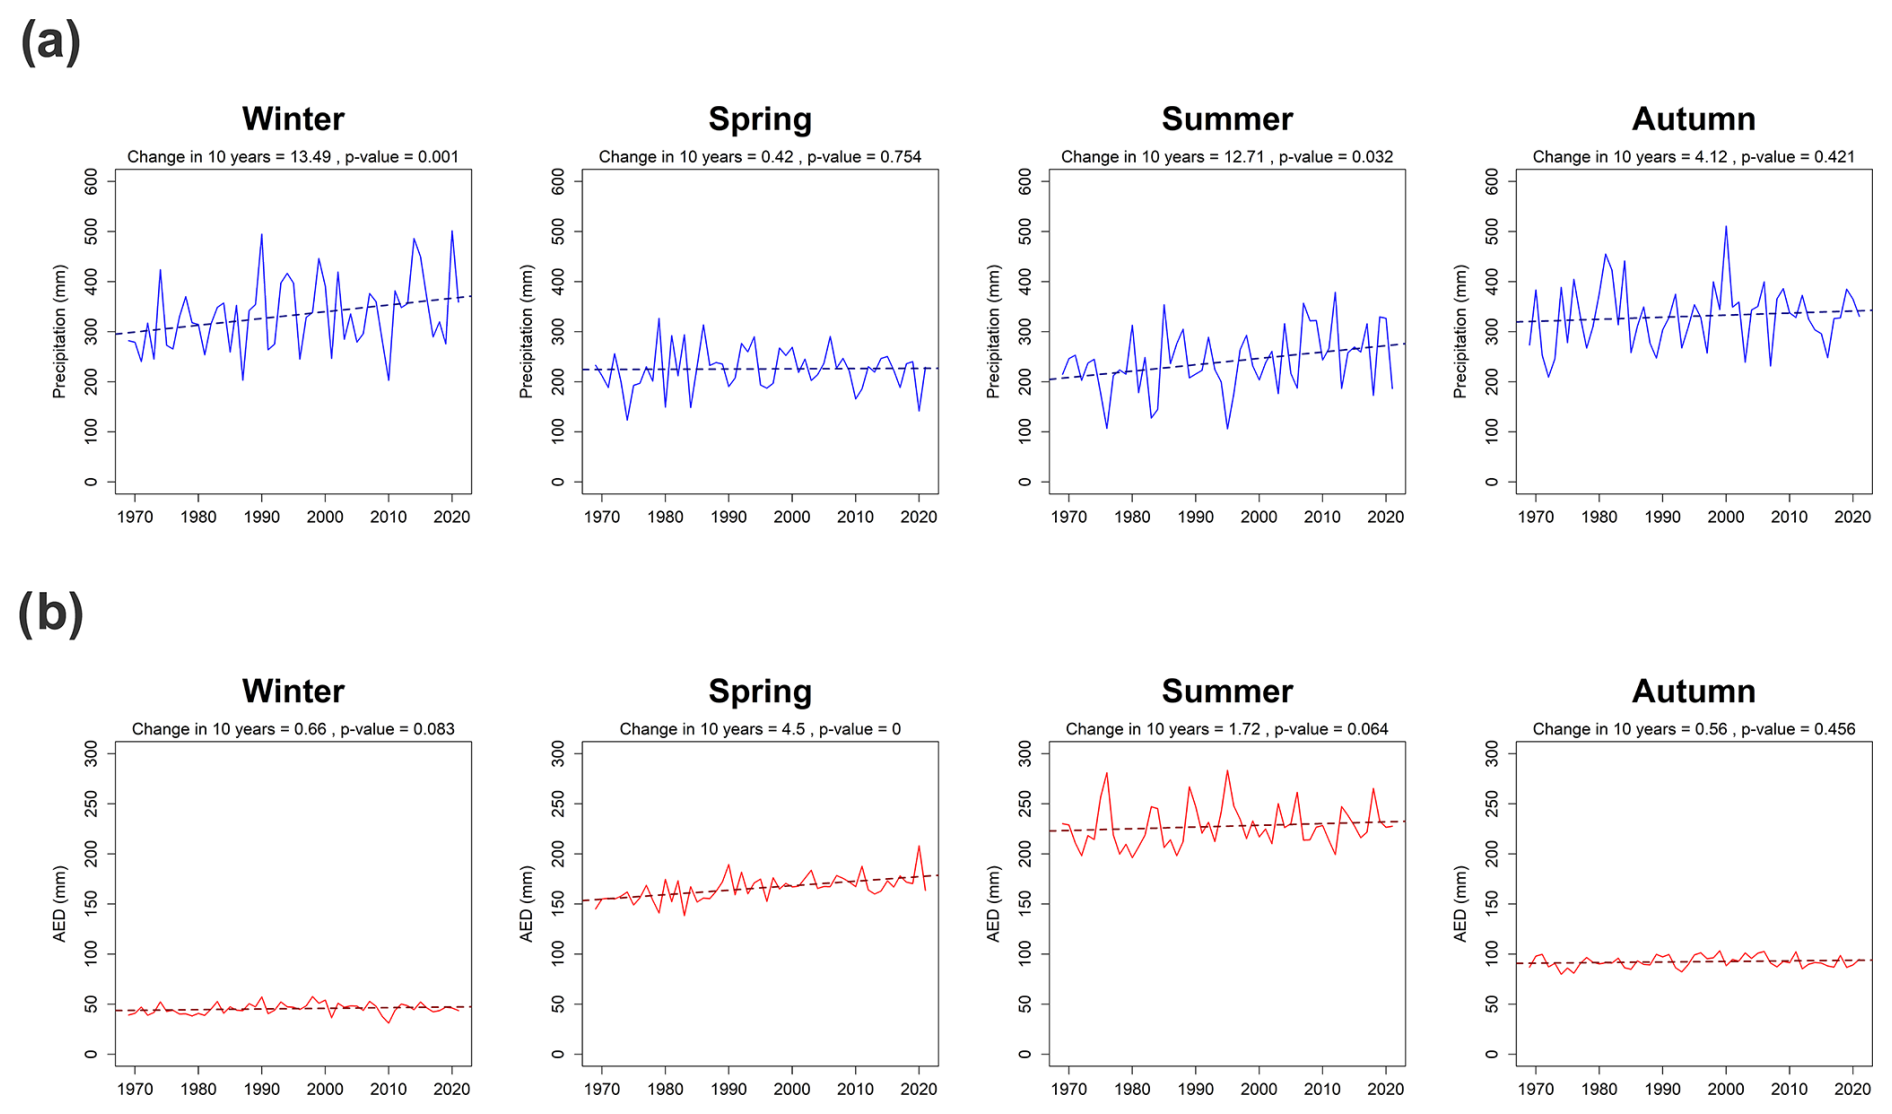
Figure A5Seasonal evolution of the average (a) precipitation and (b) AED in the United Kingdom for the period 1969–2021.
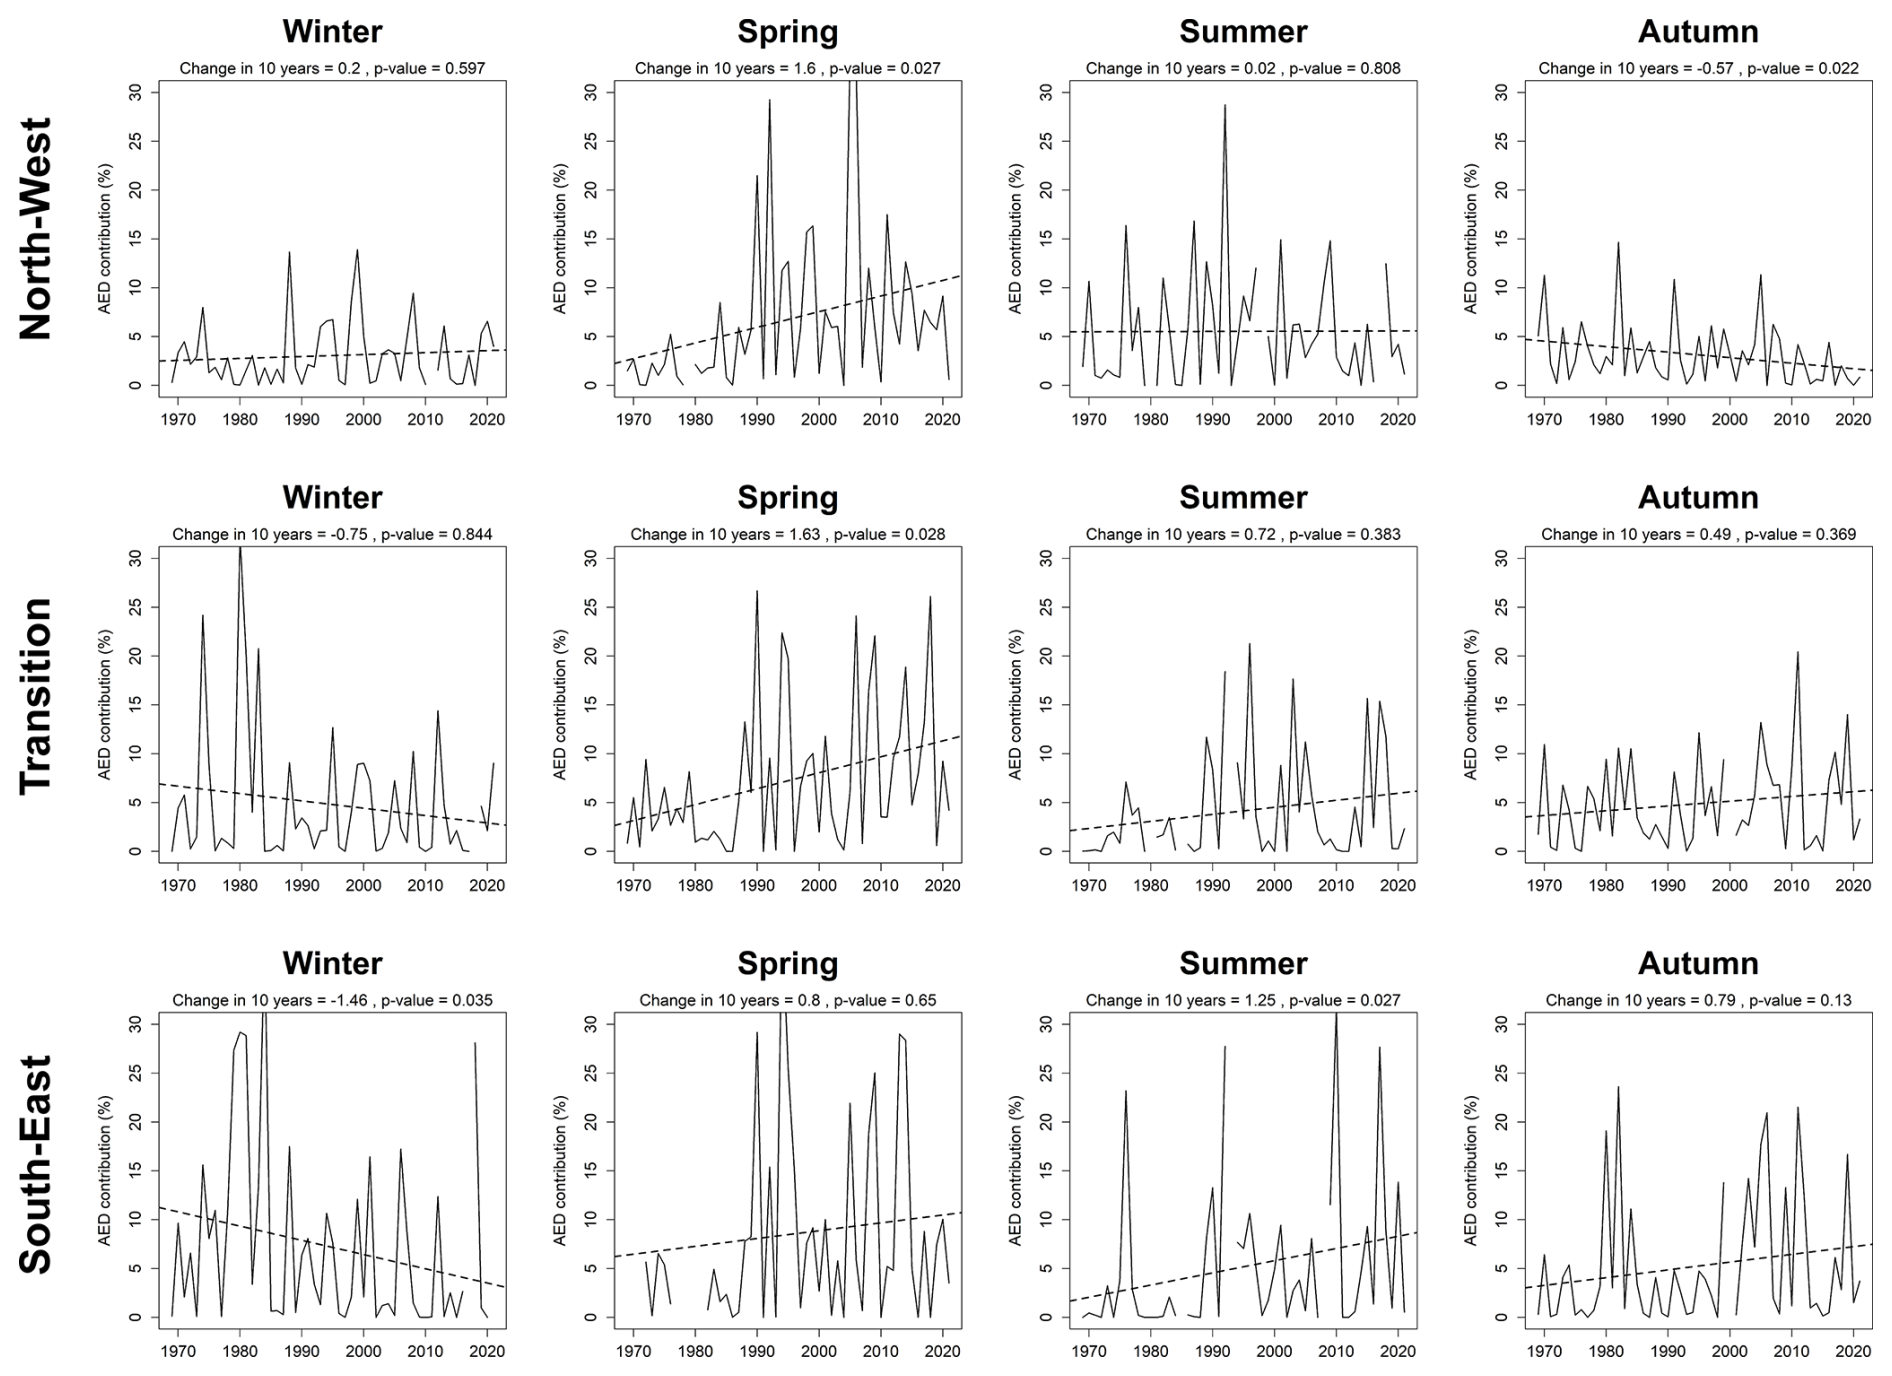
Figure A6Seasonal evolution of the average contribution of AED to flash drought development in the United Kingdom for the period 1969–2021 by regions. Missing values correspond to years in which no event is identified.
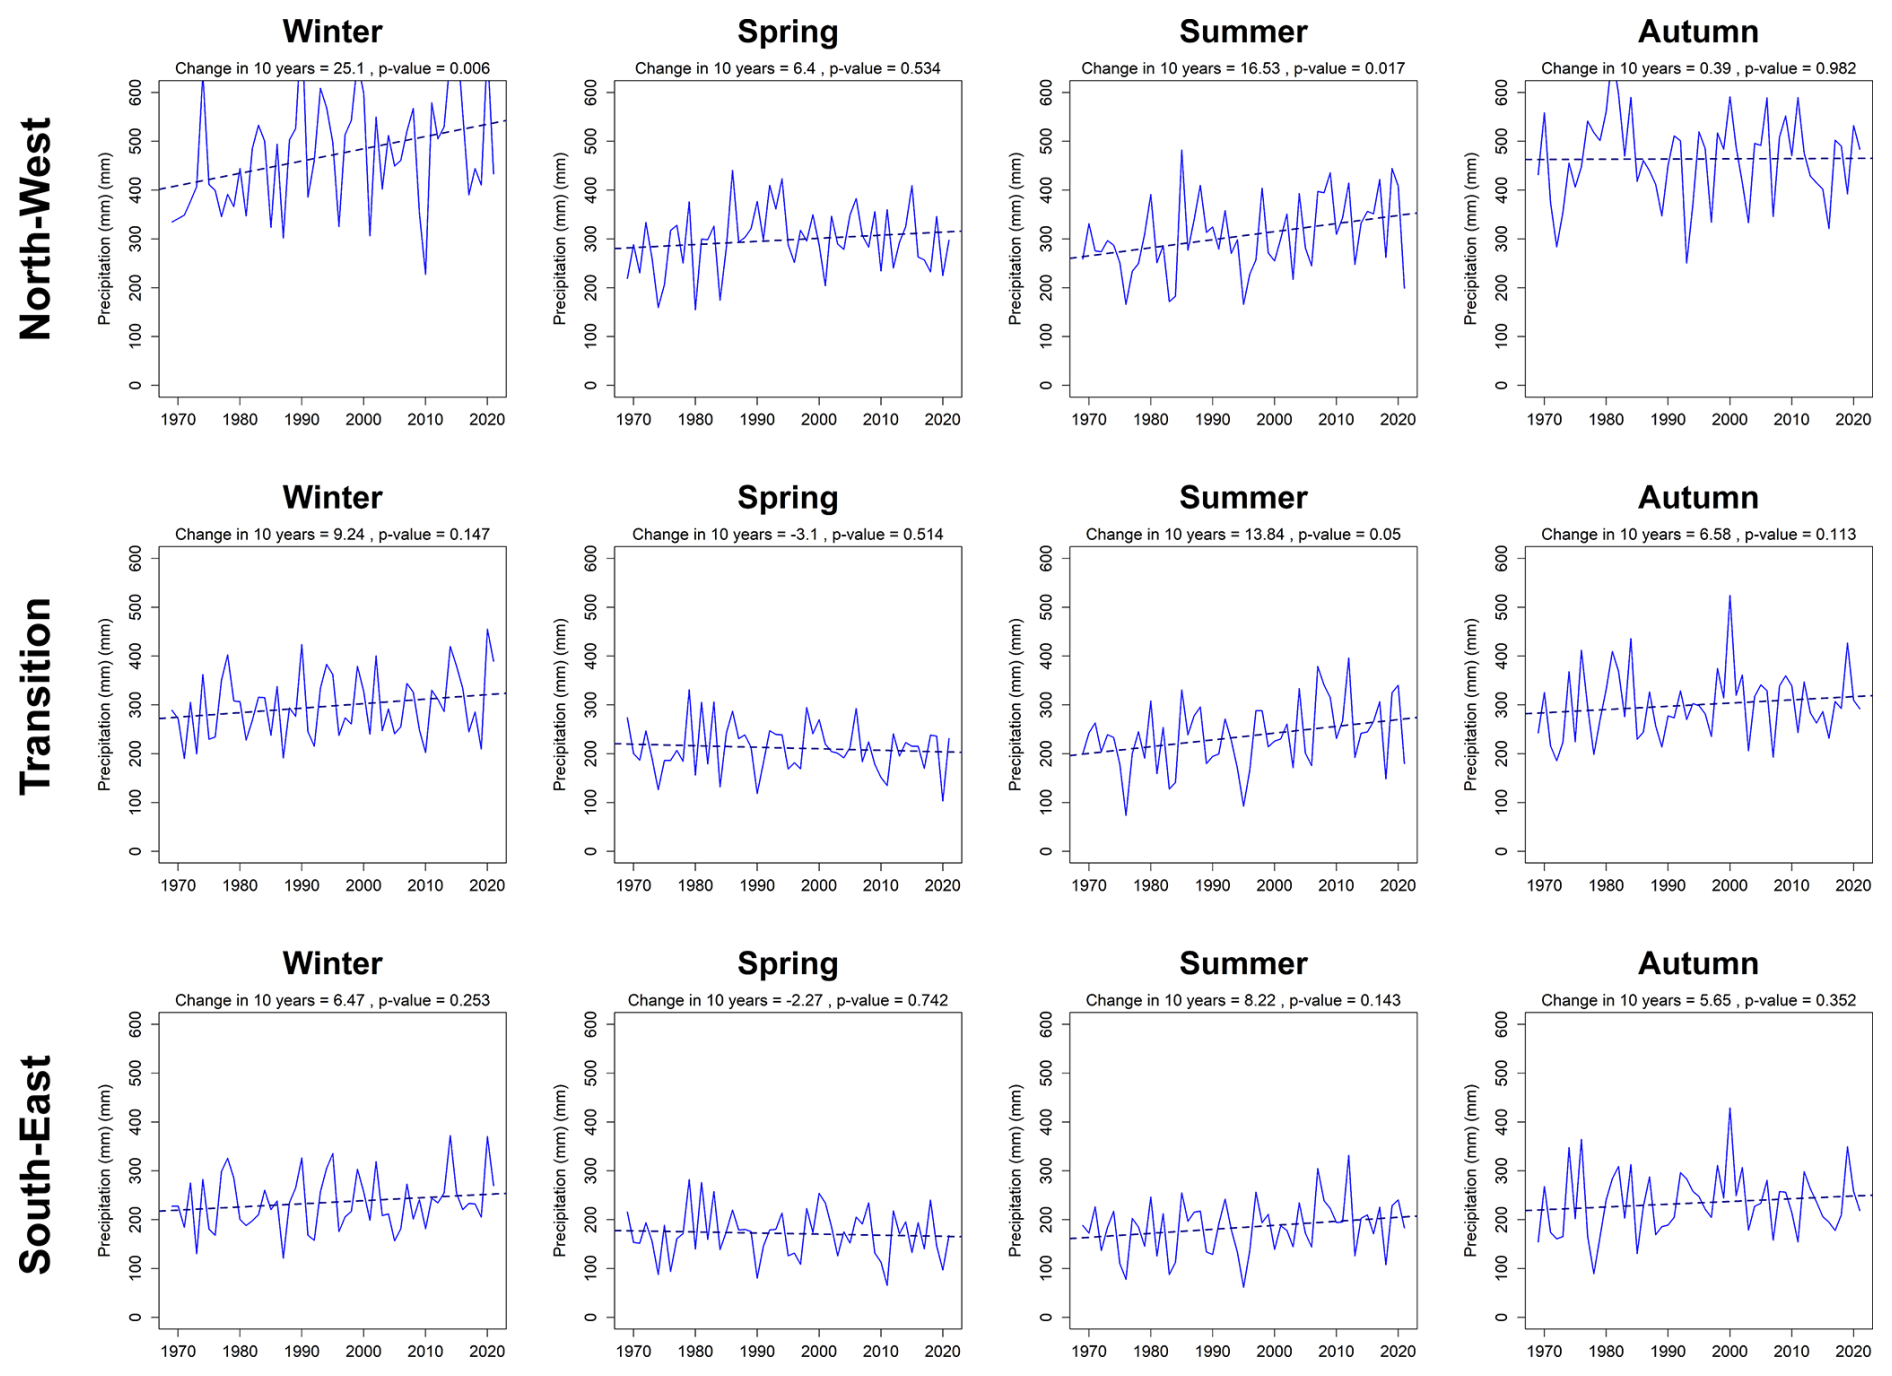
Figure A7Seasonal evolution of the average precipitation in the United Kingdom for the period 1969–2021 by regions.
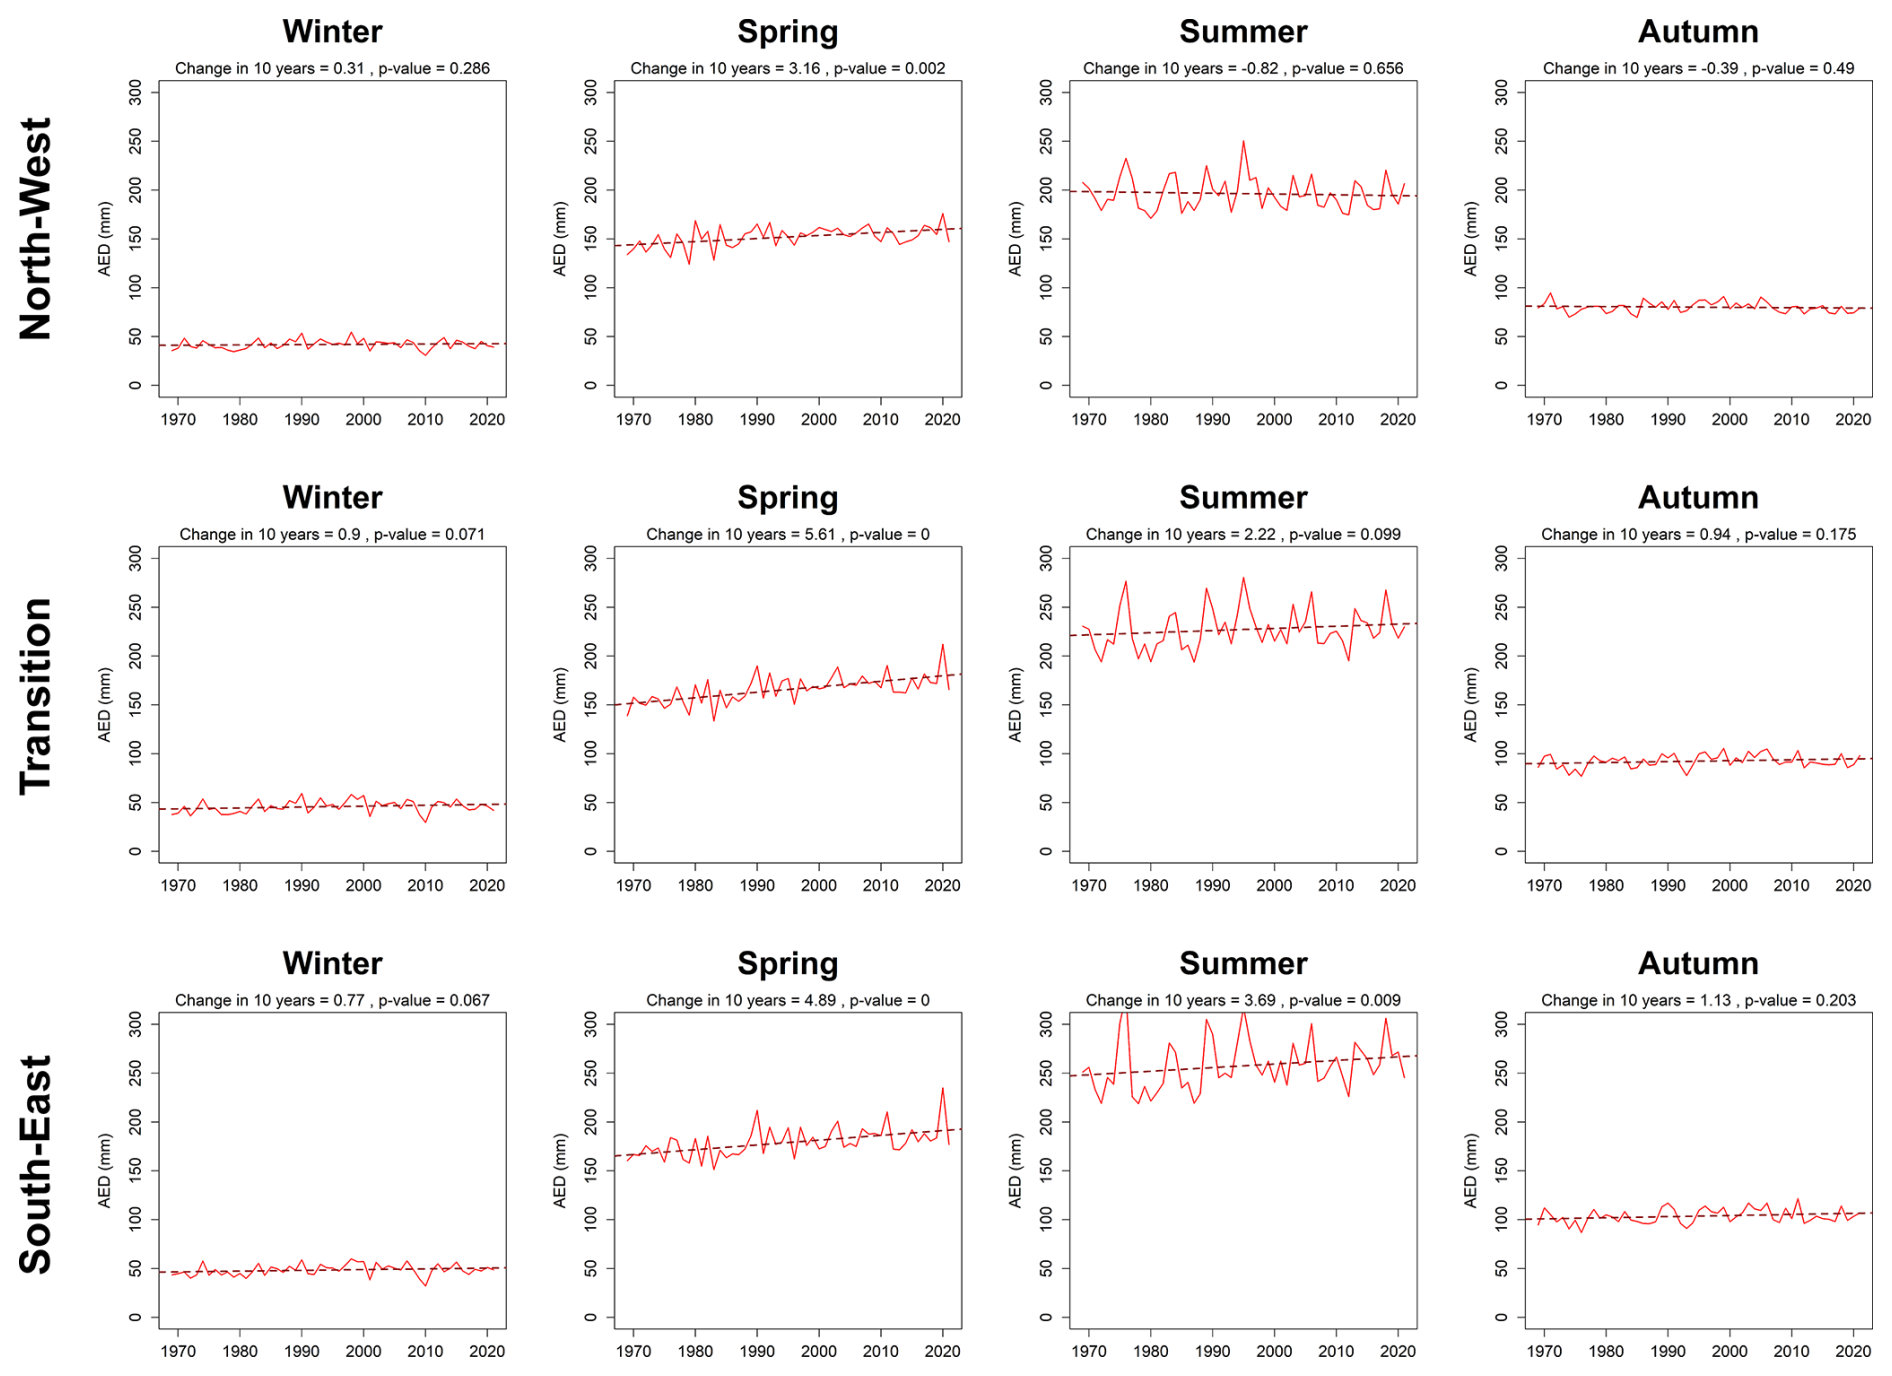
Figure A8Seasonal evolution of the average AED in the United Kingdom for the period 1969–2021 by regions.
Figure A9Seasonal anomalies in precipitation and AED (%) during the development of the top-10 flash droughts of each season over the United Kingdom for the period 1969–2021.
All information used in this study is open access. To calculate the SPEI, we employed daily precipitation and AED data. Precipitation data were obtained from Met Office Hadley Centre for Climate Science and Services, available at https://catalogue.ceda.ac.uk/uuid/4dc8450d889a491ebb20e724debe2dfb (Met Office et al., 2018), while AED data were obtained from the Environmental Information Data Centre (EIDC), available at https://doi.org/10.5285/beb62085-ba81-480c-9ed0-2d31c27ff196 (Brown et al., 2023). To analyse the atmospheric and oceanic conditions during flash drought development, we employed daily sea level pressure (SLP), 500 hPa geopotential height (Z500), and sea surface temperature (SST) from the National Centers for Environmental Prediction (NCEP)–National Center for Atmospheric Research (NCAR), available at https://psl.noaa.gov/data/ (Kalnay et al., 1996).
All authors contributed to the conceptualisation and design of the research, as well as to the preparation and revision of the manuscript. IN conducted the data processing, analysis, and visualisation and led the preparation of the manuscript.
The contact author has declared that none of the authors has any competing interests.
Publisher's note: Copernicus Publications remains neutral with regard to jurisdictional claims made in the text, published maps, institutional affiliations, or any other geographical representation in this paper. While Copernicus Publications makes every effort to include appropriate place names, the final responsibility lies with the authors.
This article is part of the special issue “Drought, society, and ecosystems (NHESS/BG/GC/HESS inter-journal SI)”. It is not associated with a conference.
The authors would like to thank the Hydro-JULES programme for supporting this research. We would also like to thank Germano Ribeiro Neto; an anonymous reviewer; and the editor, Gemma Coxon, for their constructive comments that helped improve the paper.
This research has been supported by the Natural Environment Research Council (Hydro-JULES Programme (grant no. NE/S017380/1)).
This paper was edited by Gemma Coxon and reviewed by Germano Ribeiro Neto and one anonymous referee.
Anderson, M., Hain, C., Otkin, J., Zhan, X., Mo, K., Svoboda, M., Wardlow, B., and Pimstein, A.: An Intercomparison of Drought Indicators Based on Thermal Remote Sensing and NLDAS-2 Simulations with U.S. Drought Monitor Classifications, J. Hydrometeorol., 14, 1035–1056, https://doi.org/10.1175/JHM-D-12-0140.1, 2013.
Bachmair, S., Kohn, I., and Stahl, K.: Exploring the link between drought indicators and impacts, Nat. Hazards Earth Syst. Sci., 15, 1381–1397, https://doi.org/10.5194/nhess-15-1381-2015, 2015.
Barker, L. J., Hannaford, J., Chiverton, A., and Svensson, C.: From meteorological to hydrological drought using standardised indicators, Hydrol. Earth Syst. Sci., 20, 2483–2505, https://doi.org/10.5194/hess-20-2483-2016, 2016.
Barker, L. J., Hannaford, J., Parry, S., Smith, K. A., Tanguy, M., and Prudhomme, C.: Historic hydrological droughts 1891–2015: systematic characterisation for a diverse set of catchments across the UK, Hydrol. Earth Syst. Sci., 23, 4583–4602, https://doi.org/10.5194/hess-23-4583-2019, 2019.
Barker, L. J., Hannaford, J., Magee, E., Turner, S., Sefton, C., Parry, S., Evans, J., Szczykulska, M., and Haxton, T.: An appraisal of the severity of the 2022 drought and its impacts, Weather, 99, 208–219, https://doi.org/10.1002/WEA.4531, 2024.
Beguería, S., Vicente-Serrano, S. M., Reig, F., and Latorre, B.: Standardized precipitation evapotranspiration index (SPEI) revisited: Parameter fitting, evapotranspiration models, tools, datasets and drought monitoring, Int. J. Climatol., 34, 3001–3023, https://doi.org/10.1002/joc.3887, 2014.
Blyth, E. M., Martínez-de la Torre, A., and Robinson, E. L.: Trends in evapotranspiration and its drivers in Great Britain: 1961 to 2015, Progress in Physical Geography: Earth and Environment, 43, 666–693, https://doi.org/10.1177/0309133319841891, 2019.
Brown, M. J., Robinson, E. L., Kay, A. L., Chapman, R., Bell, V. A., and Blyth, E. M.: Potential evapotranspiration derived from HadUK-Grid 1 km gridded climate observations 1969–2022 (Hydro-PE HadUK-Grid), NERC EDS Environmental Information Data Centre [data set], https://doi.org/10.5285/beb62085-ba81-480c-9ed0-2d31c27ff196, 2023.
Bueh, C. and Nakamura, H.: Scandinavian pattern and its climatic impact, Q. J. Roy. Meteor. Soc., 133, 2117–2131, https://doi.org/10.1002/QJ.173, 2007.
Burke, E. J. and Brown, S. J.: Regional drought over the UK and changes in the future, J. Hydrol., 394, 471–485, https://doi.org/10.1016/J.JHYDROL.2010.10.003, 2010.
Chen, L. G., Gottschalck, J., Hartman, A., Miskus, D., Tinker, R., and Artusa, A.: Flash drought characteristics based on U.S. drought monitor, Atmosphere (Basel), 10, 498, https://doi.org/10.3390/ATMOS10090498, 2019.
Christian, J. I., Basara, J. B., Otkin, J., Hunt, E., Wakefield, R. A., Flanagan, P. X., and Xiao, X.: A Methodology for Flash Drought Identification: Application of Flash Drought Frequency across the United States, J. Hydrometeorol., 20, 833–846, https://doi.org/10.1175/JHM-D-18-0198.1, 2019.
Christian, J. I., Martin, E. R., Basara, J. B., Furtado, J. C., Otkin, J. A., Lowman, L. E. L., Hunt, E. D., Mishra, V., and Xiao, X.: Global projections of flash drought show increased risk in a warming climate, Commun. Earth Environ., 4, 1–10, https://doi.org/10.1038/s43247-023-00826-1, 2023.
Christian, J. I., Hobbins, M., Hoell, A., Otkin, J. A., Ford, T. W., Cravens, A. E., Powlen, K. A., Wang, H., and Mishra, V.: Flash drought: A state of the science review, WIREs Water, 11, e1714, https://doi.org/10.1002/WAT2.1714, 2024.
Cook, B. I., Smerdon, J. E., Seager, R., and Coats, S.: Global warming and 21st century drying, Clim. Dynam., 43, 2607–2627, https://doi.org/10.1007/s00382-014-2075-y, 2014.
Deser, C. and Phillips, A. S.: A range of outcomes: the combined effects of internal variability and anthropogenic forcing on regional climate trends over Europe, Nonlin. Processes Geophys., 30, 63–84, https://doi.org/10.5194/npg-30-63-2023, 2023.
Dobson, B., Coxon, G., Freer, J., Gavin, H., Mortazavi-Naeini, M., and Hall, J. W.: The Spatial Dynamics of Droughts and Water Scarcity in England and Wales, Water Resour. Res., 56, e2020WR027187, https://doi.org/10.1029/2020WR027187, 2020.
Folland, C. K., Hannaford, J., Bloomfield, J. P., Kendon, M., Svensson, C., Marchant, B. P., Prior, J., and Wallace, E.: Multi-annual droughts in the English Lowlands: a review of their characteristics and climate drivers in the winter half-year, Hydrol. Earth Syst. Sci., 19, 2353–2375, https://doi.org/10.5194/hess-19-2353-2015, 2015.
Fowler, H. J. and Kilsby, C. G.: Precipitation and the North Atlantic Oscillation: a study of climatic variability in northern England, Int. J. Climatol., 22, 843–866, https://doi.org/10.1002/JOC.765, 2002.
Hall, R. J. and Hanna, E.: North Atlantic circulation indices: links with summer and winter UK temperature and precipitation and implications for seasonal forecasting, Int. J. Climatol., 38, e660–e677, https://doi.org/10.1002/JOC.5398, 2018.
Hamed, K. H. and Ramachandra Rao, A.: A modified Mann-Kendall trend test for autocorrelated data, J. Hydrol., 204, 182–196, https://doi.org/10.1016/S0022-1694(97)00125-X, 1998.
Hannaford, J.: Climate-driven changes in UK river flows: A review of the evidence, Prog. Phys. Geog., 39, 29–48, https://doi.org/10.1177/0309133314536755, 2015.
Hannaford, J., Lloyd-Hughes, B., Keef, C., Parry, S., and Prudhomme, C.: Examining the large-scale spatial coherence of European drought using regional indicators of precipitation and streamflow deficit, Hydrol. Process., 25, 1146–1162, https://doi.org/10.1002/HYP.7725, 2011.
Hoffmann, D., Gallant, A. J. E., and Hobbins, M. T.: Flash Drought in CMIP5 Models, J. Hydrometeorol., 22, 1439–1454, https://doi.org/10.1175/JHM-D-20-0262.1, 2021.
Hollis, D., McCarthy, M., Kendon, M., Legg, T., and Simpson, I.: HadUK-Grid – A new UK dataset of gridded climate observations, Geosci. Data J., 6, 151–159, https://doi.org/10.1002/GDJ3.78, 2019.
Hulme, M. and Barrow, E. (Eds.): Climates of the British Isles: Present, Past and Future, Routledge, London, https://doi.org/10.4324/9781315870793, 1997.
Hunt, E., Svoboda, M., Wardlow, B., Hubbard, K., Hayes, M., and Arkebauer, T.: Monitoring the effects of rapid onset of drought on non-irrigated maize with agronomic data and climate-based drought indices, Agr. Forest Meteorol., 191, 1–11, https://doi.org/10.1016/j.agrformet.2014.02.001, 2014.
Ionita, M., Boroneanţ, C., and Chelcea, S.: Seasonal modes of dryness and wetness variability over Europe and their connections with large scale atmospheric circulation and global sea surface temperature, Clim. Dynam., 45, 2803–2829, https://doi.org/10.1007/S00382-015-2508-2, 2015.
Jones, P. D., Jonsson, T., and Wheeler, D.: Extension to the North Atlantic Oscillation using early instrumental pressure observations from gibraltar and south-west Iceland, Int. J. Climatol., 17, 1433–1450, https://doi.org/10.1002/(sici)1097-0088(19971115)17:13<1433::aid-joc203>3.3.co;2-g, 1997.
Kalnay, E., Kanamitsu, M., Kistler, R., Collins, W., Deaven, D., Gandin, L., Iredell, M., Saha, S., White, G., Woollen, J., Zhu, Y., Chelliah, M., Ebisuzaki, W., Higgins, W., Janowiak, J., Mo, K. C., Ropelewski, C., Wang, J., Leetmaa, A., Reynolds, R., Jenne, R., and Joseph, D.: The NCEP/NCAR 40 year reanalysis project, B. Am. Meteorol. Soc., 77, 437–471, https://doi.org/10.1175/1520-0477(1996)077<0437:TNYRP>2.0.CO;2, 1996 (data available at: https://psl.noaa.gov/data/, last access: 5 May 2024).
Kay, A. L., Bell, V. A., Blyth, E. M., Crooks, S. M., Davies, H. N., and Reynard, N. S.: A hydrological perspective on evaporation: historical trends and future projections in Britain, J. Water Clim. Change, 4, 193–208, https://doi.org/10.2166/WCC.2013.014, 2013.
Kendon, M., McCarthy, M., Jevrejeva, S., Matthews, A., Sparks, T., Garforth, J., and Kennedy, J.: State of the UK Climate 2021, Int. J. Climatol., 42, 1–80, https://doi.org/10.1002/JOC.7787, 2022.
Kingston, D. G., Fleig, A. K., Tallaksen, L. M., and Hannah, D. M.: Ocean–Atmosphere Forcing of Summer Streamflow Drought in Great Britain, J. Hydrometeorol., 14, 331–344, https://doi.org/10.1175/JHM-D-11-0100.1, 2013.
Koster, R. D., Schubert, S. D., Wang, H., Mahanama, S. P., and Deangelis, A. M.: Flash drought as captured by reanalysis data: Disentangling the contributions of precipitation deficit and excess evapotranspiration, J. Hydrometeorol., 20, 1241–1258, https://doi.org/10.1175/JHM-D-18-0242.1, 2019.
Lavers, D., Prudhomme, C., and Hannah, D. M.: Large-scale climatic influences on precipitation and discharge for a British river basin, Hydrol. Process., 24, 2555–2563, https://doi.org/10.1002/HYP.7668, 2010.
Lisonbee, J., Woloszyn, M., and Skumanich, M.: Making sense of flash drought: definitions, indicators, and where we go from here, Journal of Applied and Service Climatology, 2021, 1–19, https://doi.org/10.46275/JOASC.2021.02.001, 2021.
Lorenzo-Lacruz, J., Vicente-Serrano, S. M., López-Moreno, J. I., Beguería, S., García-Ruiz, J. M., and Cuadrat, J. M.: The impact of droughts and water management on various hydrological systems in the headwaters of the Tagus River (central Spain), J. Hydrol., 386, 13–26, https://doi.org/10.1016/j.jhydrol.2010.01.001, 2010.
Ma, F., Yuan, X., Li, H., and Wang, Y.: Flash Drought in the South of Yangtze River and the Potential Impact of North Atlantic Sea Surface Temperature, J. Geophys. Res.-Atmos., 129, e2023JD039820, https://doi.org/10.1029/2023JD039820, 2024.
Marsh, T., Cole, G., and Wilby, R.: Major droughts in England and Wales, 1800–2006, Weather, 62, 87–93, https://doi.org/10.1002/WEA.67, 2007.
Mayes, J. and Wheeler, D.: Regional climates of the British Isles, Routledge, London, https://doi.org/10.4324/9780203437926, 1997.
Mayes, J. and Wheeler, D.: Regional weather and climates of the British Isles – Part 1: Introduction, Weather, 68, 3–8, https://doi.org/10.1002/WEA.2041, 2013.
McCarthy, M., Christidis, N., Dunstone, N., Fereday, D., Kay, G., Klein-Tank, A., Lowe, J., Petch, J., Scaife, A., and Stott, P.: Drivers of the UK summer heatwave of 2018, Weather, 74, 390–396, https://doi.org/10.1002/WEA.3628, 2019.
Met Office, Hollis, D., McCarthy, M., Kendon, M., Legg, T., and Simpson, I.: HadUK-Grid gridded and regional average climate observations for the UK, Centre for Environmental Data Analysis [data set], http://catalogue.ceda.ac.uk/uuid/4dc8450d889a491ebb20e724debe2dfb/ (last access: 5 May 2024), 2018.
Mills, T. C.: Modelling precipitation trends in England and Wales, Meteorol. Appl., 12, 169–176, https://doi.org/10.1017/S1350482705001611, 2005.
Mishra, A. K. and Singh, V. P.: A review of drought concepts, J. Hydrol., 391, 202–216, https://doi.org/10.1016/J.JHYDROL.2010.07.012, 2010.
Mishra, V., Aadhar, S., and Mahto, S. S.: Anthropogenic warming and intraseasonal summer monsoon variability amplify the risk of future flash droughts in India, npj Climate and Atmospheric Science, 4, 1–10, https://doi.org/10.1038/s41612-020-00158-3, 2021.
Mukherjee, S. and Mishra, A. K.: A Multivariate Flash Drought Indicator for Identifying Global Hotspots and Associated Climate Controls, Geophys. Res. Lett., 49, e2021GL096804, https://doi.org/10.1029/2021GL096804, 2022.
Murphy, S. J. and Washington, R.: United Kingdom and Ireland precipitation variability and the North Atlantic sea-level pressure field, Int. J. Climatol., 21, 939–959, https://doi.org/10.1002/JOC.670, 2001.
Noguera, I., Domínguez-Castro, F., and Vicente-Serrano, S. M.: Characteristics and trends of flash droughts in Spain, 1961–2018, Ann. NY Acad. Sci., 1472, 155–172, https://doi.org/10.1111/nyas.14365, 2020.
Noguera, I., Domínguez-Castro, F., and Vicente-Serrano, S. M.: Flash Drought Response to Precipitation and Atmospheric Evaporative Demand in Spain, Atmosphere-Basel, 12, 165, https://doi.org/10.3390/atmos12020165, 2021.
Noguera, I., Vicente-Serrano, S. M., and Domínguez-Castro, F.: The Rise of Atmospheric Evaporative Demand Is Increasing Flash Droughts in Spain During the Warm Season, Geophys. Res. Lett., 49, e2021GL097703, https://doi.org/10.1029/2021GL097703, 2022.
Noguera, I., Domínguez-Castro, F., Vicente-Serrano, S. M., and Reig, F.: Near-real time flash drought monitoring system and dataset for Spain, Data Brief, 47, 108908, https://doi.org/10.1016/J.DIB.2023.108908, 2023.
Osman, M., Zaitchik, B. F., Badr, H. S., Christian, J. I., Tadesse, T., Otkin, J. A., and Anderson, M. C.: Flash drought onset over the contiguous United States: sensitivity of inventories and trends to quantitative definitions, Hydrol. Earth Syst. Sci., 25, 565–581, https://doi.org/10.5194/hess-25-565-2021, 2021.
Otkin, J., Svoboda, M., Hunt, E., Ford, T. W., Anderson, M., Hain, C., and Basara, J. B.: Flash droughts: A review and assessment of the challenges imposed by rapid-onset droughts in the United States, B. Am. Meteorol. Soc., 99, 911–919, https://doi.org/10.1175/BAMS-D-17-0149.1, 2018.
Otkin, J., Woloszyn, M., Wang, H., Svoboda, M., Skumanich, M., Pulwarty, R., Lisonbee, J., Hoell, A., Hobbins, M. T., Haigh, T., and Cravens, A. E.: Getting ahead of Flash Drought: From Early Warning to Early Action, B. Am. Meteorol. Soc., 103, E2188–E2202, https://doi.org/10.1175/BAMS-D-21-0288.1, 2022.
Parry, S., Mackay, J. D., Chitson, T., Hannaford, J., Magee, E., Tanguy, M., Bell, V. A., Facer-Childs, K., Kay, A., Lane, R., Moore, R. J., Turner, S., and Wallbank, J.: Divergent future drought projections in UK river flows and groundwater levels, Hydrol. Earth Syst. Sci., 28, 417–440, https://doi.org/10.5194/hess-28-417-2024, 2024.
Parsons, D. J., Rey, D., Tanguy, M., and Holman, I. P.: Regional variations in the link between drought indices and reported agricultural impacts of drought, Agr. Syst., 173, 119–129, https://doi.org/10.1016/J.AGSY.2019.02.015, 2019.
Peña-Gallardo, M., Vicente-Serrano, S., Camarero, J., Gazol, A., Sánchez-Salguero, R., Domínguez-Castro, F., El Kenawy, A., Beguería-Portugés, S., Gutiérrez, E., de Luis, M., Sangüesa-Barreda, G., Novak, K., Rozas, V., Tíscar, P., Linares, J., Martínez del Castillo, E., Ribas Matamoros, M., García-González, I., Silla, F., Camisón, Á., Génova, M., Olano, J., Longares, L., Hevia, A., Galván, J., Peña-Gallardo, M., Vicente-Serrano, S. M., Camarero, J. J., Gazol, A., Sánchez-Salguero, R., Domínguez-Castro, F., El Kenawy, A., Beguería-Portugés, S., Gutiérrez, E., De Luis, M., Sangüesa-Barreda, G., Novak, K., Rozas, V., Tíscar, P. A., Linares, J. C., Martínez del Castillo, E., Ribas Matamoros, M., García-González, I., Silla, F., Camisón, Á., Génova, M., Olano, J. M., Longares, L. A., Hevia, A., and Galván, J. D.: Drought Sensitiveness on Forest Growth in Peninsular Spain and the Balearic Islands, Forests, 9, 524, https://doi.org/10.3390/f9090524, 2018a.
Peña-Gallardo, M., Vicente-Serrano, S. M., Domínguez-Castro, F., Quiring, S., Svoboda, M., Beguería, S., and Hannaford, J.: Effectiveness of drought indices in identifying impacts on major crops across the USA, Climate Res., 75, 221–240, https://doi.org/10.3354/cr01519, 2018b.
Peña-Gallardo, M., Vicente-Serrano, S. M., Hannaford, J., Lorenzo-Lacruz, J., Svoboda, M., Domínguez-Castro, F., Maneta, M., Tomas-Burguera, M., and El Kenawy, A.: Complex influences of meteorological drought time-scales on hydrological droughts in natural basins of the contiguous Unites States, J. Hydrol., 568, 611–625, https://doi.org/10.1016/j.jhydrol.2018.11.026, 2019a.
Peña-Gallardo, M., Vicente-Serrano, S. M., Quiring, S., Svoboda, M., Hannaford, J., Tomas-Burguera, M., Martín-Hernández, N., Domínguez-Castro, F., and El Kenawy, A.: Response of crop yield to different time-scales of drought in the United States: Spatio-temporal patterns and climatic and environmental drivers, Agr. Forest Meteorol., 264, 40–55, https://doi.org/10.1016/j.agrformet.2018.09.019, 2019b.
Pendergrass, A. G., Meehl, G. A., Pulwarty, R., Hobbins, M. T., Hoell, A., AghaKouchak, A., Bonfils, C. J. W., Gallant, A. J. E., Hoerling, M., Hoffmann, D., Kaatz, L., Lehner, F., Llewellyn, D., Mote, P., Neale, R. B., Overpeck, J. T., Sheffield, A., Stahl, K., Svoboda, M., Wheeler, M. C., Wood, A. W., and Woodhouse, C. A.: Flash droughts present a new challenge for subseasonal-to-seasonal prediction, Nat. Clim. Change, 10, 191–199, https://doi.org/10.1038/S41558-020-0709-0, 2020.
Potop, V., Možný, M., and Soukup, J.: Drought evolution at various time scales in the lowland regions and their impact on vegetable crops in the Czech Republic, Agr. Forest Meteorol., 156, 121–133, https://doi.org/10.1016/J.AGRFORMET.2012.01.002, 2012.
Pribyl, K.: A survey of the impact of summer droughts in southern and eastern England, 1200–1700, Clim. Past, 16, 1027–1041, https://doi.org/10.5194/cp-16-1027-2020, 2020.
Rahiz, M. and New, M.: Spatial coherence of meteorological droughts in the UK since 1914, Area, 44, 400–410, https://doi.org/10.1111/J.1475-4762.2012.01131.X, 2012.
Richardson, D., Fowler, H. J., Kilsby, C. G., and Neal, R.: A new precipitation and drought climatology based on weather patterns, Int. J. Climatol., 38, 630–648, https://doi.org/10.1002/JOC.5199, 2018.
Rimbu, N., Le Treut, H., Janicot, S., Boroneant, C., and Laurent, C.: Decadal precipitation variability over Europe and its relation with surface atmospheric circulation and sea surface temperature, Q. J. Roy. Meteor. Soc., 127, 315–329, https://doi.org/10.1002/QJ.49712757204, 2001.
Robertson, A. W., Mechoso, C. R., and Kim, Y. J.: The influence of Atlantic sea surface temperature anomalies on the North Atlantic oscillation, J. Climate, 13, 122–138, https://doi.org/10.1175/1520-0442(2000)013<0122:TIOASS>2.0.CO;2, 2000.
Robinson, E. L., Blyth, E. M., Clark, D. B., Finch, J., and Rudd, A. C.: Trends in atmospheric evaporative demand in Great Britain using high-resolution meteorological data, Hydrol. Earth Syst. Sci., 21, 1189–1224, https://doi.org/10.5194/hess-21-1189-2017, 2017.
Robinson, E. L., Brown, M. J., Kay, A. L., Lane, R. A., Chapman, R., Bell, V. A., and Blyth, E. M.: Hydro-PE: gridded datasets of historical and future Penman–Monteith potential evaporation for the United Kingdom, Earth Syst. Sci. Data, 15, 4433–4461, https://doi.org/10.5194/essd-15-4433-2023, 2023.
Scheff, J. and Frierson, D. M. W.: Scaling Potential Evapotranspiration with Greenhouse Warming, J. Climate, 27, 1539–1558, https://doi.org/10.1175/JCLI-D-13-00233.1, 2014.
Shah, J., Hari, V., Rakovec, O., Markonis, Y., Samaniego, L., Mishra, V., Hanel, M., Hinz, C., and Kumar, R.: Increasing footprint of climate warming on flash droughts occurrence in Europe, Environ. Res. Lett., 17, 064017, https://doi.org/10.1088/1748-9326/AC6888, 2022.
Spraggs, G., Peaver, L., Jones, P., and Ede, P.: Re-construction of historic drought in the Anglian Region (UK) over the period 1798–2010 and the implications for water resources and drought management, J. Hydrol., 526, 231–252, https://doi.org/10.1016/J.JHYDROL.2015.01.015, 2015.
Svensson, C. and Hannaford, J.: Oceanic conditions associated with euro-atlantic high pressure and uk drought, Environ. Res. Commun., 1, 101001, https://doi.org/10.1088/2515-7620/ab42f7, 2019.
Svoboda, M., LeComte, D., Hayes, M., Heim, R. R., Gleason, K., Angel, J., Rippey, B., Tinker, R., Palecki, M., Stooksbury, D., Miskus, D., and Stephens, S.: The Drought Monitor, B. Am. Meteorol. Soc., 83, 1181–1190, https://doi.org/10.1175/1520-0477-83.8.1181, 2002.
Tanguy, M., Haslinger, K., Svensson, C., Parry, S., Barker, L. J., Hannaford, J., and Prudhomme, C.: Regional Differences in Spatiotemporal Drought Characteristics in Great Britain, Front. Environ. Sci., 9, 639649, https://doi.org/10.3389/FENVS.2021.639649, 2021.
Tanguy, M., Chevuturi, A., Marchant, B. P., Mackay, J. D., Parry, S., and Hannaford, J.: How will climate change affect the spatial coherence of streamflow and groundwater droughts in Great Britain?, Environ. Res. Lett., 18, 064048, https://doi.org/10.1088/1748-9326/ACD655, 2023.
Todd, B., Macdonald, N., Chiverrell, R. C., Caminade, C., and Hooke, J. M.: Severity, duration and frequency of drought in SE England from 1697 to 2011, Climatic Change, 121, 673–687, https://doi.org/10.1007/S10584-013-0970-6, 2013.
Tomas-Burguera, M., Vicente-Serrano, S. M., Peña-Angulo, D., Domínguez-Castro, F., Noguera, I., and El Kenawy, A.: Global Characterization of the Varying Responses of the Standardized Precipitation Evapotranspiration Index to Atmospheric Evaporative Demand, J. Geophys. Res.-Atmos., 125, e2020JD033017, https://doi.org/10.1029/2020JD033017, 2020.
Turner, S., Barker, L. J., Hannaford, J., Muchan, K., Parry, S., and Sefton, C.: The 2018/2019 drought in the UK: a hydrological appraisal, Weather, 76, 248–253, https://doi.org/10.1002/WEA.4003, 2021.
Ummenhofer, C. C., Seo, H., Kwon, Y. O., Parfitt, R., Brands, S., and Joyce, T. M.: Emerging European winter precipitation pattern linked to atmospheric circulation changes over the North Atlantic region in recent decades, Geophys. Res. Lett., 44, 8557–8566, https://doi.org/10.1002/2017GL074188, 2017.
Vicente-Serrano, S. M. and López-Moreno, J. I.: Hydrological response to different time scales of climatological drought: an evaluation of the Standardized Precipitation Index in a mountainous Mediterranean basin, Hydrol. Earth Syst. Sci., 9, 523–533, https://doi.org/10.5194/hess-9-523-2005, 2005.
Vicente-Serrano, S. M., Beguería, S., and López-Moreno, J. I.: A multiscalar drought index sensitive to global warming: The standardized precipitation evapotranspiration index, J. Climate, 23, 1696–1718, https://doi.org/10.1175/2009JCLI2909.1, 2010.
Vicente-Serrano, S. M., Gouveia, C., Camarero, J. J., Beguería, S., Trigo, R., Lopez-Moreno, J. I., Azorín-Molina, C., Pasho, E., Lorenzo-Lacruz, J., Revuelto, J., Moran-Tejeda, E., and Sanchez-Lorenzo, A.: Response of vegetation to drought time-scales across global land biomes, P. Natl. Acad. Sci. USA, 110, 52–57, https://doi.org/10.1073/pnas.1207068110, 2013.
Vicente-Serrano, S. M., Camarero, J. J., and Azorín-Molina, C.: Diverse responses of forest growth to drought time-scales in the Northern Hemisphere, Global Ecol. Biogeogr., 23, 1019–1030, https://doi.org/10.1111/geb.12183, 2014.
Vicente-Serrano, S. M., McVicar, T. R., Miralles, D. G., Yang, Y., and Tomas-Burguera, M.: Unraveling the influence of atmospheric evaporative demand on drought and its response to climate change, WIREs Clim. Change, 11, e632, https://doi.org/10.1002/wcc.632, 2020.
Vicente-Serrano, S. M., Domínguez-Castro, F., Murphy, C., Hannaford, J., Reig, F., Peña-Angulo, D., Tramblay, Y., Trigo, R. M., Mac Donald, N., Luna, M. Y., Mc Carthy, M., Van der Schrier, G., Turco, M., Camuffo, D., Noguera, I., García-Herrera, R., Becherini, F., Della Valle, A., Tomas-Burguera, M., and El Kenawy, A.: Long-term variability and trends in meteorological droughts in Western Europe (1851–2018), Int. J. Climatol., 41, E690–E717, https://doi.org/10.1002/JOC.6719, 2021.
Walker, D. W., Vergopolan, N., Cavalcante, L., Smith, K. H., Agoungbome, S. M. D., Almagro, A., Apurv, T., Dahal, N. M., Hoffmann, D., Singh, V., and Xiang, Z.: Flash Drought Typologies and Societal Impacts: A Worldwide Review of Occurrence, Nomenclature, and Experiences of Local Populations, Weather Clim. Soc., 16, 3–28, https://doi.org/10.1175/WCAS-D-23-0015.1, 2023.
Wang, Y. and Yuan, X.: Anthropogenic Speeding Up of South China Flash Droughts as Exemplified by the 2019 Summer-Autumn Transition Season, Geophys. Res. Lett., 48, e2020GL091901, https://doi.org/10.1029/2020GL091901, 2021.
West, H., Quinn, N., and Horswell, M.: Regional rainfall response to the North Atlantic Oscillation (NAO) across Great Britain, Hydrol. Res., 50, 1549–1563, https://doi.org/10.2166/NH.2019.015, 2019.
West, H., Quinn, N., and Horswell, M.: Monthly rainfall signatures of the north atlantic oscillation and east atlantic pattern in Great Britain, Atmosphere-Basel, 12, 1533, https://doi.org/10.3390/atmos12111533, 2021a.
West, H., Quinn, N., Horswell, M., Yuan, N., Cheung, K. K. W., and Shukla, R.: Spatio-Temporal Variability in North Atlantic Oscillation Monthly Rainfall Signatures in Great Britain, Atmosphere-Basel, 12, 763, https://doi.org/10.3390/ATMOS12060763, 2021b.
West, H., Quinn, N., and Horswell, M.: The Influence of the North Atlantic Oscillation and East Atlantic Pattern on Drought in British Catchments, Front. Environ. Sci., 10, 754597, https://doi.org/10.3389/FENVS.2022.754597, 2022.
Wilhite, D. A.: Drought as a natural hazard: concepts and definitions, Drought Mitigation Center Faculty Publications, UK, ISBN 9781315830896, 2000.
Wilhite, D. A. and Glantz, M. H.: Understanding: the Drought Phenomenon: The Role of Definitions, Water Int., 10, 111–120, https://doi.org/10.1080/02508068508686328, 1985.
Wilhite, D. A. and Pulwarty, R. S. (Eds.): Drought and Water Crises, 2nd edn., CRC Press, Boca Raton, https://doi.org/10.1201/b22009, 2017.
Williams, A. P., Seager, R., Abatzoglou, J. T., Cook, B. I., Smerdon, J. E., and Cook, E. R.: Contribution of anthropogenic warming to California drought during 2012–2014, Geophys. Res. Lett., 42, 6819–6828, https://doi.org/10.1002/2015GL064924, 2015.
Wreford, A. and Neil Adger, W.: Adaptation in agriculture: historic effects of heat waves and droughts on UK agriculture, Int. J. Agric. Sustain., 8, 278–289, https://doi.org/10.3763/IJAS.2010.0482, 2010.
Yuan, X., Wang, L., and Wood, E. F.: Anthropogenic Intensification of Southern African Flash Droughts as Exemplified by the 2015/16 Season, B. Am. Meteorol. Soc., 99, S86–S90, https://doi.org/10.1175/BAMS-D-17-0077.1, 2018.
Yuan, X., Wang, L., Wu, P., Ji, P., Sheffield, J., and Zhang, M.: Anthropogenic shift towards higher risk of flash drought over China, Nat. Commun., 10, 1–8, https://doi.org/10.1038/s41467-019-12692-7, 2019.
Yuan, X., Wang, Y., Ji, P., Wu, P., Sheffield, J., and Otkin, J. A.: A global transition to flash droughts under climate change, Science, 380, 187–191, https://doi.org/10.1126/science.abn6301, 2023.
Yue, S. and Wang, C. Y.: The Mann-Kendall test modified by effective sample size to detect trend in serially correlated hydrological series, Water Resour. Manag., 18, 201–218, https://doi.org/10.1023/B:WARM.0000043140.61082.60, 2004.
Zhang, Q., Kong, D., Singh, V. P., and Shi, P.: Response of vegetation to different time-scales drought across China: Spatiotemporal patterns, causes and implications, Global Planet. Change, 152, 1–11, https://doi.org/10.1016/j.gloplacha.2017.02.008, 2017.
Zhao, T. and Dai, A.: The magnitude and causes of global drought changes in the twenty-first century under a low-moderate emissions scenario, J. Climate, 28, 4490–4512, https://doi.org/10.1175/JCLI-D-14-00363.1, 2015.
Zhu, Q. and Wang, Y.: The Diagnosis about Spatiotemporal Characteristics and Driving Factors of Flash Drought and Its Prediction over Typical Humid and Semiarid Basins in China, J. Hydrometeorol., 22, 2783–2798, https://doi.org/10.1175/JHM-D-21-0062.1, 2021.