the Creative Commons Attribution 4.0 License.
the Creative Commons Attribution 4.0 License.
 | 20 Feb 2024
Key ingredients in regional climate modelling for improving the representation of typhoon tracks and intensities
Patrick Olschewski
Jianhui Wei
Zhan Tian
Laixiang Sun
Harald Kunstmann
Patrick Laux
There is evidence of an increased frequency of rapid intensification events of tropical cyclones (TCs) in global offshore regions. This will not only result in increased peak wind speeds but may lead to more intense heavy precipitation events, leading to flooding in coastal regions. Therefore, high impacts are expected for urban agglomerations in coastal regions such as the densely populated Pearl River Delta (PRD) in China. Regional climate models (RCMs) such as the Weather Research and Forecasting (WRF) model are state-of-the-art tools commonly applied to predict TCs. However, typhoon simulations are connected with high uncertainties due to the high number of parameterization schemes of relevant physical processes (including possible interactions between the parameterization schemes) such as cumulus (CU) and microphysics (MP), as well as other crucial model settings such as domain setup, initial times, and spectral nudging. Since previous studies mostly focus on either individual typhoon cases or individual parameterization schemes, in this study a more comprehensive analysis is provided by considering four different typhoons of different intensity categories with landfall near the PRD, i.e. Typhoon Neoguri (2008), Typhoon Hagupit (2008), Typhoon Hato (2017), and Typhoon Usagi (2013), as well as two different schemes for CU and MP, respectively. Moreover, the impact of the model initialization and the driving data is studied by using three different initial times and two spectral nudging settings. Compared with the best-track reference data, the results show that the four typhoons show some consistency. For track bias, nudging only horizontal wind has a positive effect on reducing the track distance bias; for intensity, compared with a model explicitly resolving cumulus convection, i.e. without cumulus parameterization (CuOFF; nudging potential temperature and horizontal wind; late initial time), using the Kain–Fritsch scheme (KF; nudging only horizontal wind; early initial time) configuration shows relatively lower minimum sea level pressures and higher maximum wind speeds, which means stronger typhoon intensity. Intensity shows less sensitivity to two MP schemes compared with the CuOFF, nudging, and initial time settings. Furthermore, we found that compared with the CuOFF, using the KF scheme shows a relatively larger latent heat flux and higher equivalent potential temperature, providing more energy to typhoon development and inducing stronger TCs. This study could be used as a reference to configure WRF with the model's different combinations of schemes for historical and future TC simulations and also contributes to a better understanding of the performance of principal TC structures.
- Article
(5141 KB) - Full-text XML
-
Supplement
(5583 KB) - BibTeX
- EndNote


Climate change influences extreme weather and climate events. Tropical cyclones (TCs) are one extreme event that shows a significant response to global warming. Over the past 4 decades, there is evidence of a globally increased frequency of TC rapid intensification events in global offshore regions, and the number of annual global TC landfalls with major landfall intensity (LI ≥ 50 m s−1) has nearly doubled (Li et al., 2023; Wang and Toumi, 2022). According to the IPCC Sixth Assessment Report (AR6), the impact of global warming can be observed in the average and maximum precipitation rates associated with TCs, showing an upward trend across the globe (Seneviratne et al., 2021). Moreover, the occurrence of intense TCs rises with global warming, as well as an increase in average peak TC wind speeds and the maximum wind speeds (MWSs) of the most severe TCs on a global scale. This may pose significant social threats to the regions affected by the TCs (Knutson et al., 2020; Murakami et al., 2017).
Guangdong Province is located in the southeastern coastal region of China and is the area where TC activity is most frequent, with the greatest impact and the longest duration throughout the year (Tang et al., 2014). The Pearl River Delta (PRD) region, which is located in the south of Guangdong, is one of the most prosperous economic areas with its gross domestic product (GDP) of more than USD 1 trillion and a population exceeding 70 million individuals in 2021 (Statistical Bureau of Guangdong Province, 2023). According to historical data and meteorological observations, the PRD region is typically affected by an average of 3–5 typhoons per year (Hong Kong Observatory, 2023). TCs often have substantial societal impacts; for example, the strong winds associated with TCs can cause structural damage to buildings, especially in regions in which construction land is highly concentrated. TC characteristics also affect storm surge and wave runup along the coast (Hsu et al., 2023). For example, when Typhoon Hato made landfall, it caused a maximum storm surge of 2.79 m in Zhuhai, causing significant damage to areas such as Zhuhai, Hong Kong, and Macau and resulting in 24 deaths and an economic loss of USD 6.82 billion (Hong Kong Observatory, 2017). Besides, with global warming, the effects of typhoon intensity increase have had an impact on wave and storm surges, especially considering the alterations to coastlines due to land reclamation (Zhang et al., 2023). Above all, accurate prediction of typhoons is of great social significance for the development of the region.
Regional climate models (RCMs) such as the Weather Research and Forecasting model (WRF) are commonly used to forecast tropical cyclones (TC). This is possible because TCs are mesoscale atmospheric systems, and high-resolution models are able to represent convection and the other physical processes of a TC system relatively well (Moon et al., 2018). For example, Gutmann et al. (2018) reproduced 30 out of 32 named storms using WRF and simulated the TC tracks, storm radii, and translation speeds well, despite the MWS being simulated lower than observed. Other researchers pointed out the accurate prediction of TC characteristics because WRF can reasonably capture atmospheric circulation patterns such as subtropical high, steering flows, and vertical wind shear (Xu et al., 2023), which is highly related to the motion and structure of Typhoon Lekima. Besides, the heat energy exchange between ocean and air, especially latent heat flux, is an important energy source for TCs which is also highly related to TC intensity. During the TC intensification stages, the latent heat flux from the ocean to the atmosphere increases (Chen et al., 2014), and TCs absorb latent heat, increasing the available potential energy. Later, a part of the latent energy is released in convective clouds, increasing the kinetic energy (Ma et al., 2015). Sun et al. (2019) concluded that WRF produced relatively good performances in intensity as it is able to roughly resolve the ocean–TC interactions through latent and sensible heat energy exchange. Above all, the simulation of typhoons using high-resolution regional climate models can capture TC characteristics and has already been widely applied in various fields. Track prediction could be used for regional exposure extent, and disaster early warning, rainfall, and wind prediction could also be used for city disaster management and defence. Furthermore, it is also an important tool for dynamically downscaling climate models with around 100–200 km grid spacing, e.g. participants of the Coupled Model Intercomparison Project Phase 6 (CMIP6) multimodel projections, to project future TC activities e.g. genesis, frequency, intensity, tracks, precipitation, and future TC-induced flood risk analysis. Compared with WRF, these coupled models are too coarse and are limited in capturing the detailed atmospheric circulation patterns and ocean–TC interactions, which affect TC tracks and intensity.
However, previous research (e.g. Sun et al., 2015) mentioned that WRF itself shows many uncertainties in simulating TCs because of different configurations in the horizontal grid spacing (Gentry and Lackmann, 2010; Sun et al., 2015); a combination of physical schemes such as cumulus (CU), microphysics (MP), and planetary boundary layer (PBL) parameterization schemes (Sun et al., 2019; Delfino et al., 2022; Bhattacharya et al., 2017; Khain et al., 2016; Shepherd and Walsh, 2017; Zhang and Wang, 2018; Zhang et al., 2022); initial and boundary conditions (Raktham et al., 2015; Xu et al., 2023); initial times (Delfino et al., 2022); spectral nudging settings (Mori et al., 2014; Moon et al., 2018); and substrate conditions (Zhang et al., 2023, 2019) after landfall. For example, as for horizontal grid spacing, Gentry and Lackmann (2010) conducted sensitivity simulations of Hurricane Ivan (2004) using horizontal resolutions between 12–2 km, and the results demonstrated that the model solution for the structure and intensity exhibits partial convergence at grid spacings ranging from 8–4 km, indicating that these spacings could be suitable for operational numerical weather prediction (NWP) applications, and intensity differences of only around 10 hPa between them. Sun et al. (2013) used WRF to simulate Typhoon Shanshan (2006) with changes in horizontal grid spacing at grey-zone resolutions (7.5–1 km), and the results revealed that the intensity of the TC shows a relatively small change as the grid spacing decreases from 5–3 km, while a significant increase was found from 3–1 km. However, the fine resolution has a larger bias in intensity compared with the coarser resolution. The former two examples used nested domains to conduct simulations; however, Gutmann et al. (2018) directly used a single large 4 km domain to simulate 32 TCs and concluded that the model can realistically reproduce most of the major TCs. One single convection-permitting domain with a resolution of 4.5 km shows no significant difference compared to the results of Delfino et al. (2022), who simulated Typhoon Haiyan using an inner domain 5 km simulation, nested in a 25 km outer domain. Above all, the horizontal resolution shows a great impact on TC intensity. Former studies already did extensive research on the analysis of TC sensitivities. However, previous studies on typhoon parameterization sensitivity mainly focused on individual typhoon cases, which may lack representativeness. Although some researchers have selected multiple typhoons for their studies, their research primarily focuses on conducting experimental studies on individual parameterizations because of computational costs. Therefore, it is of great importance to understand the sensitivity of numerous model configurations for different intensities of TCs before application in future impacts.
Convective processes, such as CU convection, play a crucial role in the life span of TCs and serve as the primary source of energy for their occurrence and development (Camargo and Wing, 2016). Convective processes influence sensible and latent heat and momentum transport and then affect the vertical structures of atmospheric temperature and humidity fields (Anthes, 1977; Li et al., 2018; Zhang et al., 2021), which greatly influences TC intensity and track (Sun et al., 2019). Because the resolution of the model is relatively coarse and cannot explicitly represent the convection process, some researchers developed different CU parameterization schemes to represent these processes. Prior research usually compares different CU schemes to investigate the influence of parameterizations on the track and intensity of simulated TCs (Delfino et al., 2022; Sun et al., 2019, 2015; Li et al., 2018). Most of the results show that, compared with other schemes, using the Kain–Fritsch (KF; Kain, 2004) scheme is in best agreement with the observation because it reasonably represents shallow and deep convection above the ocean surface. Other researchers applied WRF specifically permitting convection using horizontal resolutions below 5 km (CuOFF; Gutmann et al., 2018; Gentry and Lackmann, 2010). However, models may not fully resolve convective motions at the grey-zone resolution of 1–10 km despite the explicit representation of processes (Bryan et al., 2003). Based on previous findings (Li et al., 2018), the utilization of a 2 km grid spacing in simulations with the CuOFF setting and a 4 km grid spacing in simulations using the KF scheme, both show an accurate reproduction of observed Typhoon Haiyan. Above all, in this study, we conducted sensitivity tests using the KF scheme, as well as applying WRF as a convection-permitting model, to simulate TCs of different intensities using a single 5 km domain to find a configuration that can realistically reproduce TC intensity and structure.
Previous research (e.g. Sun et al., 2015, 2019) illustrated that MP schemes also show an impact on TC simulations which may be induced by different explicitly resolved moisture species and physical processes involved in the phase changes (Thompson et al., 2008). Based on the previous research, two schemes (WRF single-moment six-class (denoted WSM6; Hong et al., 2004) and New Thompson (denoted Thompson; Thompson et al., 2008)) are commonly used in WRF simulation. These two schemes have the same number of mass variables, but Thompson also takes the number of concentrations for rain and ice species into consideration, which may impact the rainfall process in the TC system, thus impacting the latent heat release and therefore the intensity. As mentioned previously by Sun et al. (2019), these two schemes show a difference in simulated MWS and minimum sea level pressure (MSLP) for Typhoon Hagupit because of the differences in latent and sensible heat flux between ocean and air. In this study, we tested TCs of different intensities for different combinations of CU and MP parameterization schemes.
As for the initial times, researchers use different initial times, e.g. 6–12 h for short-time simulations, and still lack consensus on the spin-up time (Liu et al., 2023), imposing large uncertainty on simulations, especially for extreme events. Mooney et al. (2019) summarized accurately how representing strong TC intensity at the initial time is important in subsequent TC simulations. In this study, we selected the initial time according to different TC intensities. Based on the definition of TC intensity, the three stages before a TC reaches typhoon intensity are chosen based on 6 h observation records of TCs (e.g. CMA; Ying et al., 2014): the last time of tropical depression (TD), the beginning time of tropical storm (TS), and the beginning time of severe tropical storm (ST) to determine the optimal initial time for typhoon simulation. Different TCs have different lengths of intensification periods before attaining typhoon intensity. Therefore, simulating different TC cases may also show if model performance is only related to the duration of spin-up time or also related to the initial TC intensity.
Spectral nudging is a technique that consists of driving RCMs on selected spatial scales corresponding to those produced by the driving fields and prevents large and unrealistic departures between the driving fields and the RCM fields at the driving fields' spatial scales (Omrani et al., 2012). This technique is commonly used for WRF simulations and plays a crucial role in enhancing the performance of dynamical downscaling in TC simulations (Mori et al., 2014; Delfino et al., 2022; Chen et al., 2020; Moon et al., 2018; Cha et al., 2011; Kueh et al., 2019). Extensive research concluded that the spectral nudging technique exhibits the ability to improve track bias by influencing large-scale steering flow which has a great impact on TC tracks. For example, Delfino et al. (2022) pointed out that the nudging technique can improve the mean track bias of Typhoon Haiyan by 20 km. However, compared with the track improvement, the nudging technique shows detrimental effects on TC intensities. For example, Cha et al. (2011) demonstrated that spectral nudging leads to a reduction in the intensities of simulated typhoons by inhibiting the development process of typhoons. TC intensities are also influenced by small-scale processes. These intrinsic small-scale processes are reproduced by the WRF model and the nudging technique impedes their development process, because this information does not exist in the large-scale driving field. Previous researchers mainly focused on broadening nudging intervals (Cha et al., 2011), using small weighting and different cut-off wavelengths (Moon et al., 2018; Mai et al., 2020; Gómez and Miguez-Macho, 2017), to improve performance. However, few publications focus on the sensitivity of nudged components. Different researchers nudged different variables which may also cause uncertainties in the results. For example, Delfino et al. (2022) nudged the horizontal and vertical wind components, the potential temperature, and the geopotential height above the PBL. Kueh et al. (2019) applied the nudging technique to the horizontal wind components, potential temperature, and water vapour mixing ratio above the PBL. Moon et al. (2018) pointed out that the effect of humidity is not as significant as in other fields. Chen et al. (2020) only nudged the model horizontal wind above 500 hPa to provide a realistic steering flow and to prevent an influence on the inner core circulations of the simulated TCs. Although differences exist regarding included variables, all the publications consistently use this technique above the PBL. Furthermore, the nudging effect is dependent on the region of the TC track, and the technique was especially effective for TCs that occurred to the east of the western North Pacific (WNP) and turned near northeast Asia (Moon et al., 2018). However, for most of the TC tracks located outside of the South China Sea (SCS), the effect of the technique on TCs formed in the SCS region is not clear, which accounts for approximately 30 % of the total number of TCs affecting China (Cao et al., 2020). Above all, in this study, we conducted sensitivity tests for nudging different variables above 500 hPa and its impact on TC intensity and track while also considering TC genesis.
The main objective of this study is to analyse the uncertainties from different combinations of schemes in WRF to represent TCs Neoguri (2008), Hagupit (2008), Hato (2017), and Usagi (2013), affecting the PRD region with different intensities and genesis locations. More specifically, it is analysed (i) how sensitive the typhoons belonging to specific intensity categories or genesis locations are to two CU (KF and CuOFF) settings and two MP (WSM6 and Thompson) parameterization schemes, three initialization times (TD, TS, ST), and two spectral nudging variables (UV, PT + UV). (ii) It is explored why the chosen combination of schemes is better than the rest from a thermodynamic perspective.
This section consists of four subsections. First the models used in the study and the experimental design are introduced, followed by an overview of typhoon cases and the introduction of the data used for validation and the tracking algorithm for TC detection.
2.1 Model description and experimental design
In this study, the Advanced Research Weather Research and Forecasting (WRF-ARW) model version 4.3.3 (Skamarock et al., 2019) was used to conduct typhoon simulations. Based on previous sensitivity research on horizontal resolution (Gutmann et al., 2018; Sun et al., 2013; Gentry and Lackmann, 2010), the model was set up with one single 5 km domain to better reproduce TC intensity and structure. The centre point was located at 18.5∘ N, 124.0∘ E, with a regional grid of 550×950 covering all typhoon tracks (Fig. 1). The model top was at 50 hPa, and 52 sigma layers were used in the vertical. For short-wave radiation and long-wave radiation, in this study, we used the Dudhia scheme (Dudhia, 1989) and the Rapid Radiative Transfer Model scheme (RRTM) (Mlawer et al., 1997). For the planetary boundary layer scheme, the Yonsei University nonlocal PBL scheme (Hong et al., 2006) with a surface boundary layer scheme based on Zhang and Anthes (1982) was used. For the land surface scheme, we used the unified Noah Land Surface Model (Chen and Dudhia, 2001). The initial and boundary conditions were interpolated from the European Centre for Medium-Range Weather Forecasts (ECMWF) Reanalysis version 5 (ERA5) with spatial resolution and 6 h temporal resolution (Hersbach et al., 2020). The land surface information was obtained from the Moderate Resolution Imaging Spectroradiometer (MODIS) satellite dataset with 20 land use classifications.
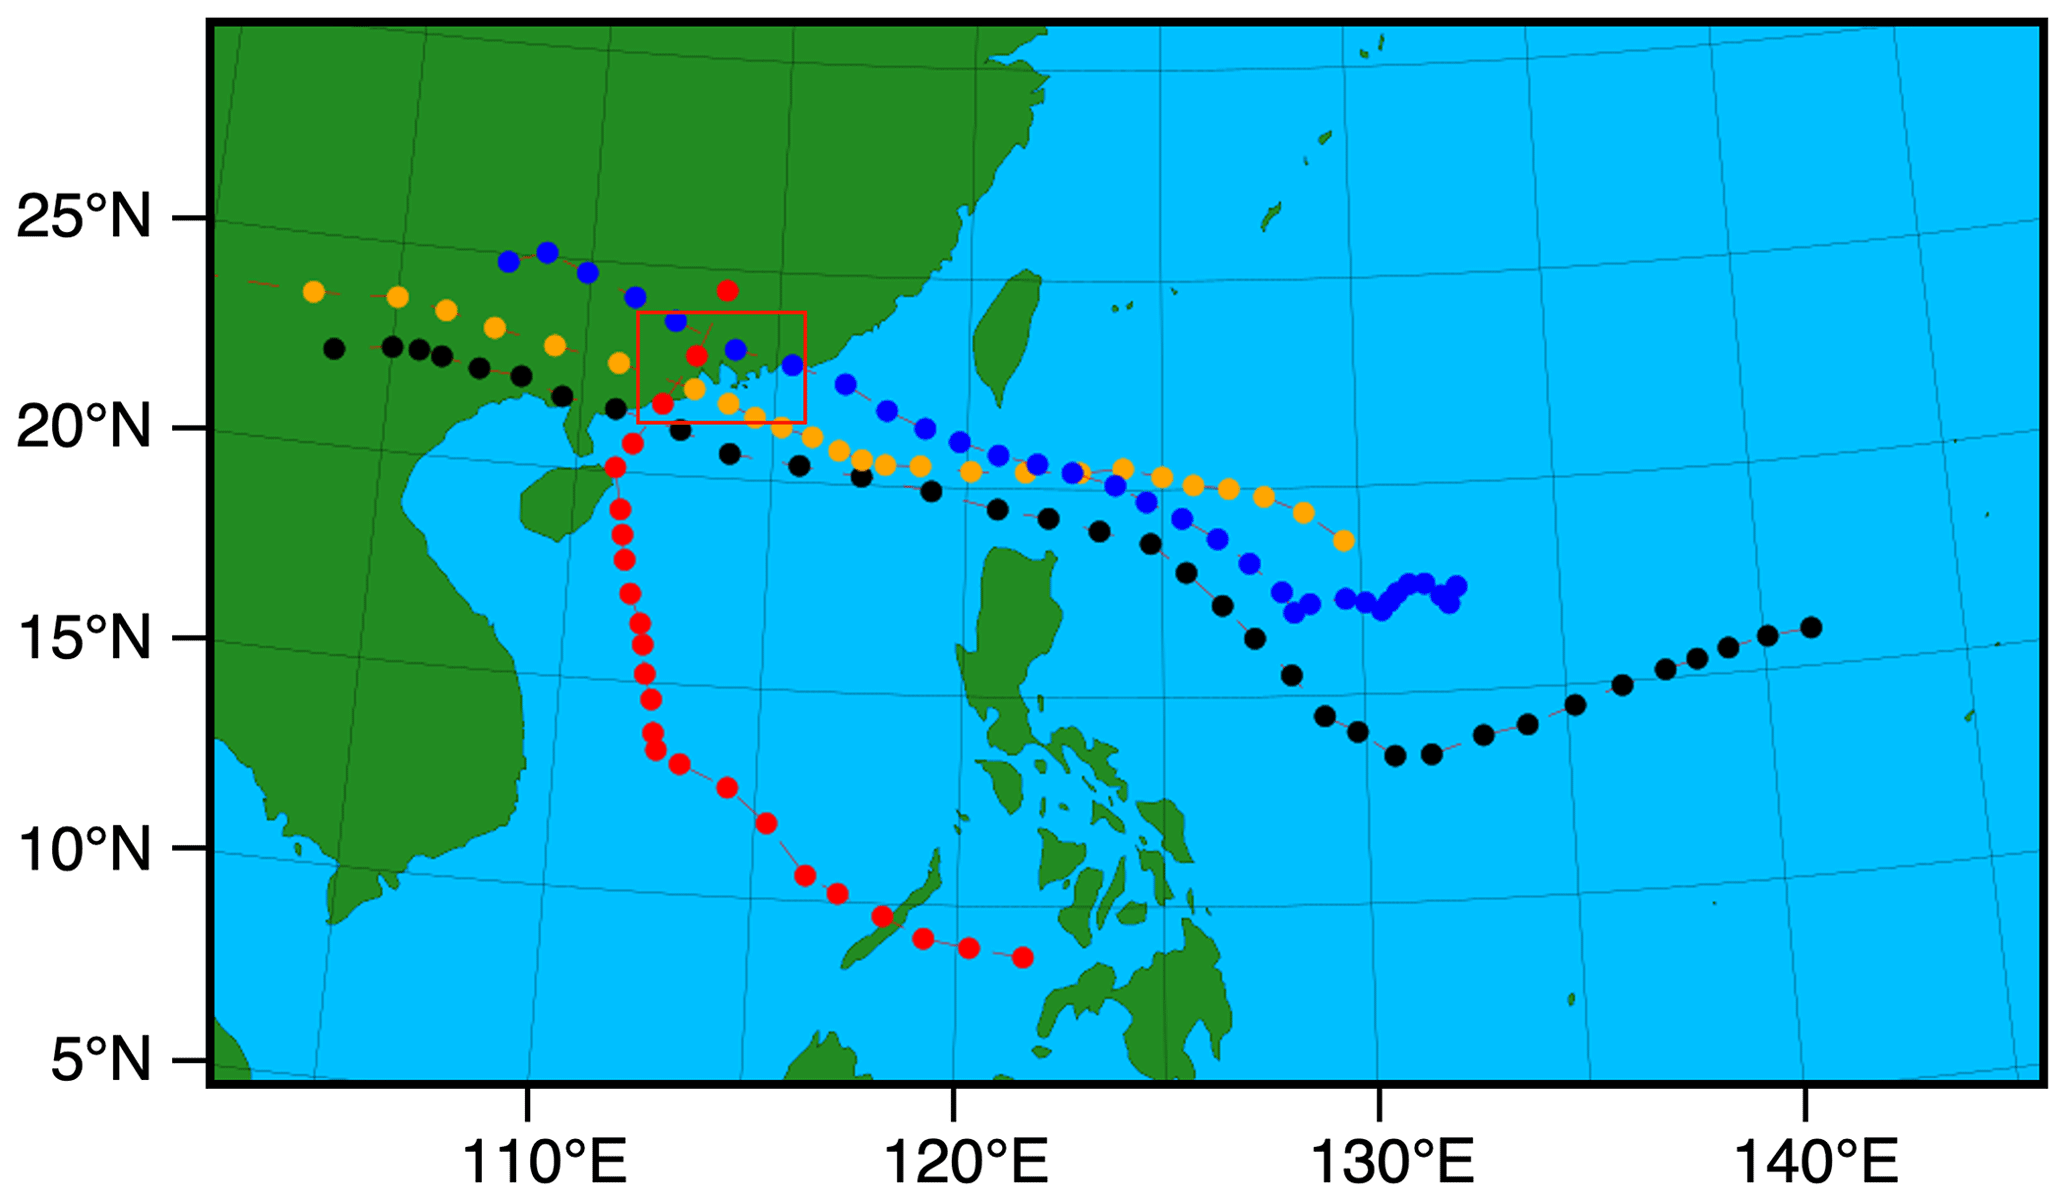
Figure 1The domain used in this study with a single 5 km horizontal resolution. The dashed red line represents Neoguri's full track from TD formation based on China Meteorological Administration (CMA) data; the black line represents Hagupit, the orange line represents Hato, and the blue line represents Usagi. The PRD region (as shown in the area within the red box) is located at around 21–24∘ N and 111.5–115.5∘ E.
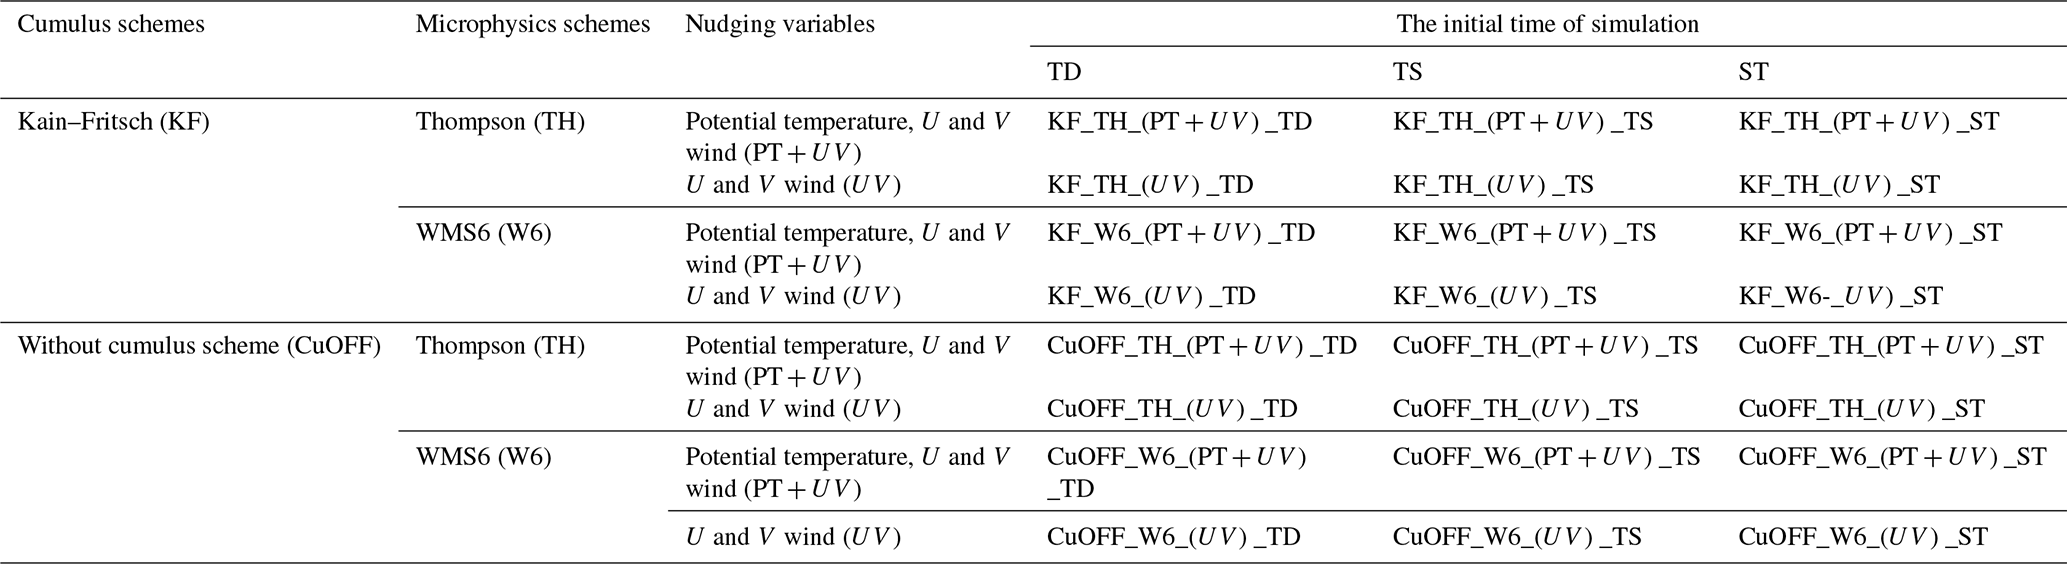
In this study, all applied configurations are given in Table 1. Since the 5 km spatial resolution is within the grey zone for the CU scheme, we compare the impact of the KF scheme and a CuOFF model for the different TCs. In terms of the MP scheme, WSM6 and Thompson are tested in this study. For spectral nudging, we conducted parallel experiments involving two distinct approaches: in one experiment only the horizontal wind above 500 hPa is nudged, while in the other simultaneously both horizontal wind and potential temperature above 500 hPa are nudged. For the initial time, we define the starting time of the simulation based on the TC intensity in an attempt to assess which initial time will produce the more accurate results.
Table 1The abbreviations of configurations used in the sensitivity experiments.
2.2 Overview of typhoon cases
For this study, we chose different intensities of TCs based on the Saffir–Simpson scale (Simpson, 1974) which affect the PRD region and induced compound flood events (e.g. TC-induced heavy rainfall, strong wind-induced storm surge, accompanied by the occurrence of astronomical tide). We also considered the origin of TC genesis: one TC originated in the SCS region, and the latter three TCs were formed in the northwest Pacific Ocean. Based on this, we chose Typhoon Neoguri (2008), Typhoon Hagupit (2008), Typhoon Hato (2017), and Typhoon Usagi (2013). Figure 1 and Table 2 briefly describe the four TC cases.
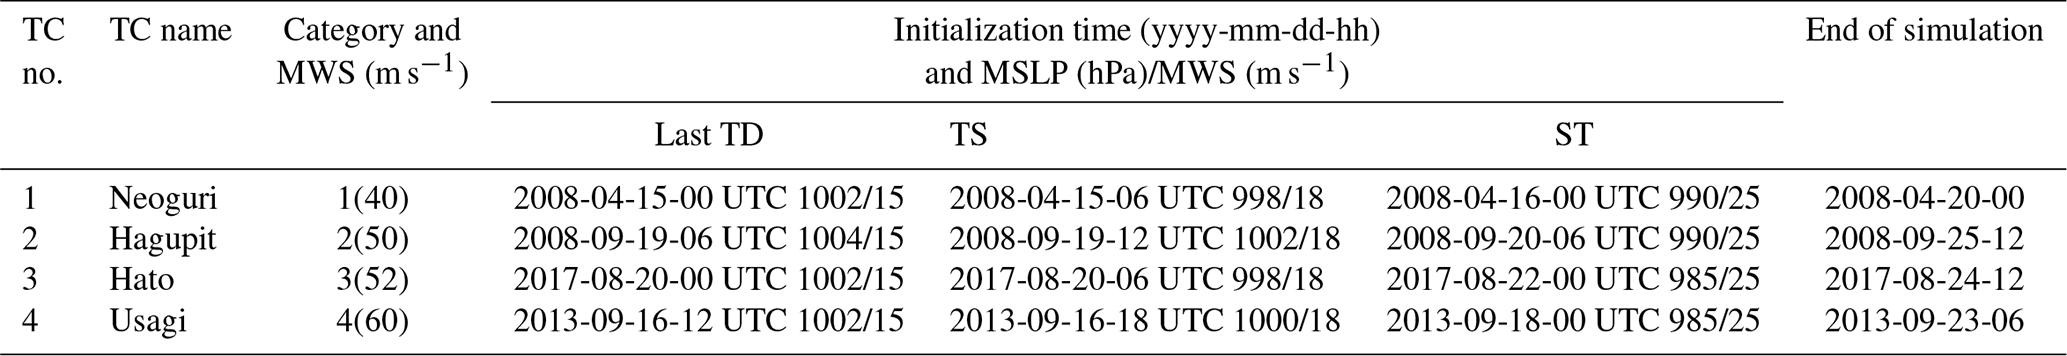
As shown in Fig. 1 and Table 2, on 15 April 2008 00:00 UTC Typhoon Neoguri originated off the west coast of Mindanao island. Moving westward, it traverses the Sulu Sea and then gradually shifts its direction to the northwest. It reached typhoon intensity over the middle of the SCS region on 16 April 2008 06:00 UTC and advanced toward the north. After traversing the east of Hainan island, its intensity gradually diminished. One of the main differences between Typhoon Neoguri and the other considered storms is that the latter three TCs formed in the northwest Pacific Ocean where they gained more energy and attained relatively higher intensity.
Typhoon Hagupit originated at the west of the Mariana Islands around 17 September 2008 12:00 UTC and then proceeded to move in a west-southwest direction. Later, it intensified into a typhoon moving toward the northwest around 21 September 2008 06:00 UTC. Gradually, the typhoon proceeded in a west-northwest direction and crossed the northern coastline of Luzon island. After landfall, Hagupit weakened and then continued to move west-northwest.
Typhoon Hato originated over the sea east of the Philippines around 19 August 2017 18:00 UTC and moved westward. After passing the Luzon Strait, it attained typhoon intensity over the northern part of the South China Sea around 22 August 2017 09:00 UTC and further intensified into a Severe Typhoon (STY) around 23 August 2017 00:00 UTC. Three hours later (23 August 2017 03:00 UTC), it attained Super Typhoon (SuperTY) intensity. Typhoon Hato made landfall along the southern coast of Zhuhai in Guangdong Province. After hitting the southern part of China, Hato rapidly weakened to TD intensity.
Typhoon Usagi formed as a TD southwest of Okinotorishima Island around 16 September 2013 06:00 UTC and slowly moved eastward. After turning westward over the same ocean, it strengthened into TS intensity. Moving slowly westward, Usagi was upgraded to typhoon intensity east of the Philippines around 18 September 2013 12:00 UTC. It developed rapidly and reached STY intensity around 19 September 2013 06:00 UTC and SuperTY intensity another 6 h later (19 September 2013 12:00 UTC). Keeping its west-northwestward track, Usagi passed through the Luzon Strait and entered the SCS. It made landfall in the southern part of China with typhoon intensity the next day and was weakened to TD intensity.
2.3 Validation
The previous research summarized that in the WNP basin, the best-track datasets are inconsistent in various aspects, including wind averaging times, storm position, and intensity (Ying et al., 2014). Here, we use three reference datasets from different agencies including the China Meteorological Administration (CMA; Ying et al., 2014; Lu et al., 2021), the World Meteorological Organization (WMO) Regional Specialized Meteorological Centre in Tokyo, Japan (JMA, 2023; https://www.jma.go.jp/jma/jma-eng/jma-center/rsmc-hp-pub-eg/Besttracks/e_format_bst.html, last access: 14 February 2024), and the Oceanographic Data Center, Chinese Academy of Sciences (CAS; Wang, 2023), to validate the model performance. All datasets include the time, category, longitude, latitude, MWS, and MSLP information of the TCs.
To evaluate the performance of simulated rainfall in terms of temporal and spatial patterns, we used GPM IMERG Final Precipitation L3 V06 data with a half-hourly time resolution and spatial resolution (Huffman et al., 2019). These data are commonly used for the validation of TC rainfall simulations.
In order to analyse the thermodynamic differences between different combinations of schemes, the equivalent potential temperature (θe) is calculated based on Holton (1972):
where T is the temperature, p denotes the atmospheric pressure, R= 287.05 J kg−1 K−1 is the gas constant for dry air, and cp= 1004 J kg−1 K−1 represents the specific heat capacity at constant pressure for dry air; note that Lv0= 2.555×10⁶ J kg−1 denotes the latent heat of condensation, and q refers to the specific humidity.
2.4 Tracking algorithm
The tracking algorithm used in this study is adopted from Gutmann et al. (2018). However, in this study, the 400 km × 400 km evaluation box around the storm centre is substituted by a 4∘ × 4∘ box on a regular long–lat grid. The tracks are initiated at a point where the sea level pressure (SLP) is 27 hPa below long-term SLP and where wind speed is more than 25 m s−1 in WRF, which is then used for the detection of TC location. The MWS and precipitation rates are the local maximum values around the storm centre in the 4∘ × 4∘ evaluation region. The MSLP detected by the algorithm is the minimum pressure in the region.
The results are presented as tracks of the four typhoons, MSLP, MWS, rainfall, latent heat flux, and equivalent potential temperature sensitivity for different configurations in WRF.
3.1 TC tracks
Figure 2 shows that the typhoon tracks simulated by the 24 experiments for the four typhoons of different intensities and genesis locations were consistent with the track information from the CAS, CMA, and JMA best tracks. The best tracks of the four typhoons plotted in Fig. 2 start around the formation of the TD, showing the different genesis locations of the four typhoons. Within the TC formation phase, some deviations can be detected for the three best tracks; however, after attaining typhoon intensity, they are mostly consistent in terms of typhoon tracks. The simulation results plotted in Fig. 2 start when the prerequisites of the typhoon-tracking algorithm are met.
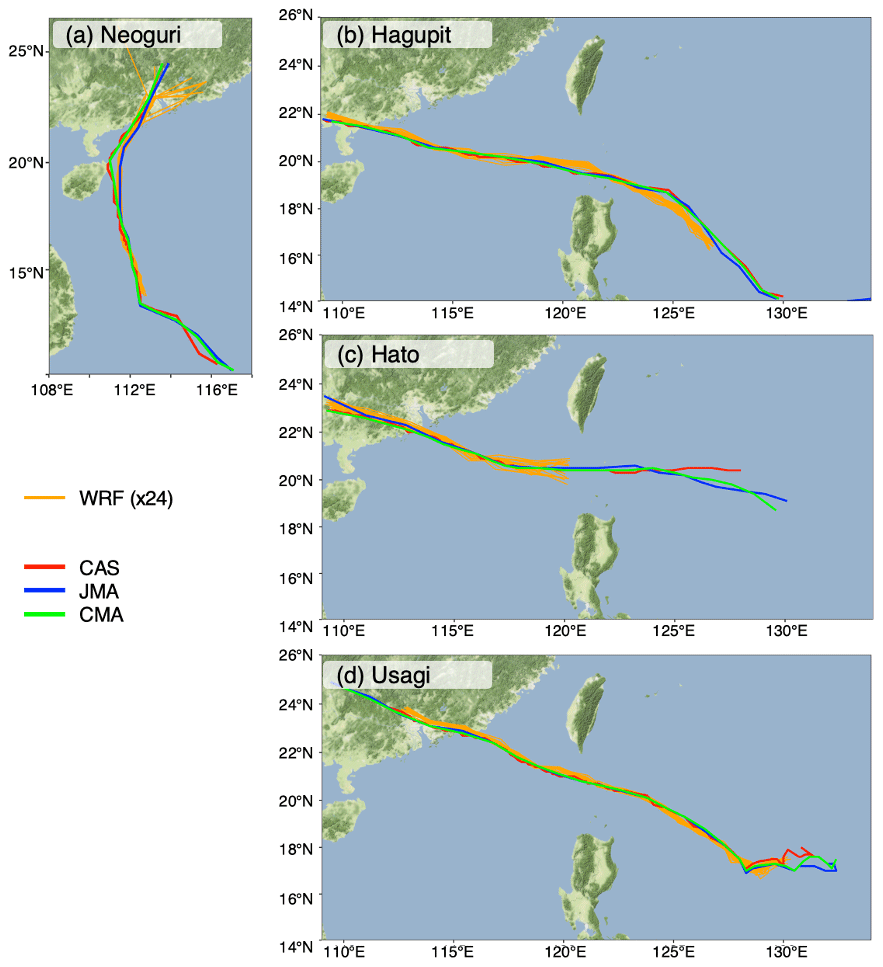
Figure 2Comparison of WRF simulation results and observed tracks of typhoons (a) Neoguri, (b) Hagupit, (c) Hato, and (d) Usagi. Red, green, and blue lines denote CAS, CMA, and JMA best tracks, respectively. The orange lines in each subplot denote the 24 experimental results.
From Fig. 2a, no large differences between the 24 experiments can be seen, and the simulated tracks inherit a large consistency with the best tracks. Because of the influence of the nudged environmental steering flow, typhoons gradually move northward after formation. However, around 20∘ N, the three best tracks show a slight shift to the west which could not be captured by all the model simulation results. In addition, after landfall, the simulated tracks vary remarkably, which may be due to the sensitivity of the 24 settings to the land surface.
Typhoon track prediction could be significantly enhanced by nudging horizontal wind, which influences large-scale circulation patterns and steering flow. This finding is in accordance with previous studies (e.g. Mori et al., 2014; Delfino et al., 2022; Chen et al., 2020; Moon et al., 2018; Cha et al., 2011; Kueh et al., 2019). To show the nudging effects on tracks in the SCS region, we conducted an additional sensitivity test without nudging (W6-KF-00-TD) for the four TCs. Supplement Figure S1a shows that for Typhoon Neoguri, without nudging, the simulated track shifts to the west, passing through the middle of Hainan island with a track bias of more than 2∘. Thus, the nudging technique also shows improvement in the SCS region.
Figure 2b–d show that the tracks of typhoons Hagupit, Hato, and Usagi inherit a certain degree of similarity. The genesis location of the TCs was east of the Philippine islands, and, subsequently, the TCs gradually moved toward the west and crossed the ocean between Taiwan and the Philippine islands. Figure 2b–d show that there are only slight differences between the 24 experiments. Also, the simulated tracks are in good agreement with the best tracks. For Typhoon Hagupit, in Fig. S1b, the no-nudging track is shifted to the north, past Taiwan island, and the landfall location is east of the PRD region, compared with the best track. As for Typhoon Hato, in Fig. S1c, the no-nudging track is shifted to the northern region, and the bias regarding the best track is around 1–2∘ which also shows that the nudging technique could improve the track accuracy. For Typhoon Usagi, in Figure S1d, the no-nudging track is shifted to the north in the early stages, then shifted to the south and close to the best tracks; however, it subsequently shifted back north and finally depicts landfall far away from the PRD region.
Compared with CMA, the average bias is around 0–0.6∘, except for two experiments of Hagupit (TH_CuOFF_(UV)_ST, W6_CuOFF_(PT + UV)_ST), inheriting a bias of 0.6–0.8∘. Lui et al. (2021) show the WRF performance of Typhoon Hato in mean track bias within 1.5∘ compared with Hong Kong Observatory's (HKO) best track. Overall, the simulated tracks of simulations nudging horizontal wind above 500 hPa, which may reasonably capture the larger-scale circulation patterns, are close to the best tracks. Additionally, nudging potential temperature, as well as the different initial times, CU, and MP schemes, did not show remarkable differences in track bias. Compared with the other three TCs, Neoguri, which is generated in the SCS region, also shows large track improvement.
3.2 TC intensity
Figure 3a–d show observed and simulated MSLP for Typhoon Neoguri classified by the MP and CU configurations, spectral nudging settings, and initial times. Figure 3a–d show that compared with the MSLP of the three best tracks the 24 simulated experiments could reproduce the MSLP changes with time. MSLP decreased from 12:00 UTC on 16 April, reaching its lowest value around 970 hPa and rising back from 12:00 UTC on 17 April. In the simulation, Typhoon Neoguri's lowest MSLP is approximately 5–10 hPa higher than what is recorded in the historical data of the three best-track datasets. Compared with the experiments by Potty et al. (2012), MSLP did not descend below 990 hPa for Neoguri, indicating a less intense TC. The intensity bias already exists in the data used as the initial data (Mooney et al., 2019), partially attributed to its coarse resolution and impact on later simulations. In this study, we use ERA5 with a 0.25∘ horizontal resolution, the bias is still inevitable despite its relatively high resolution compared to other reanalysis datasets.
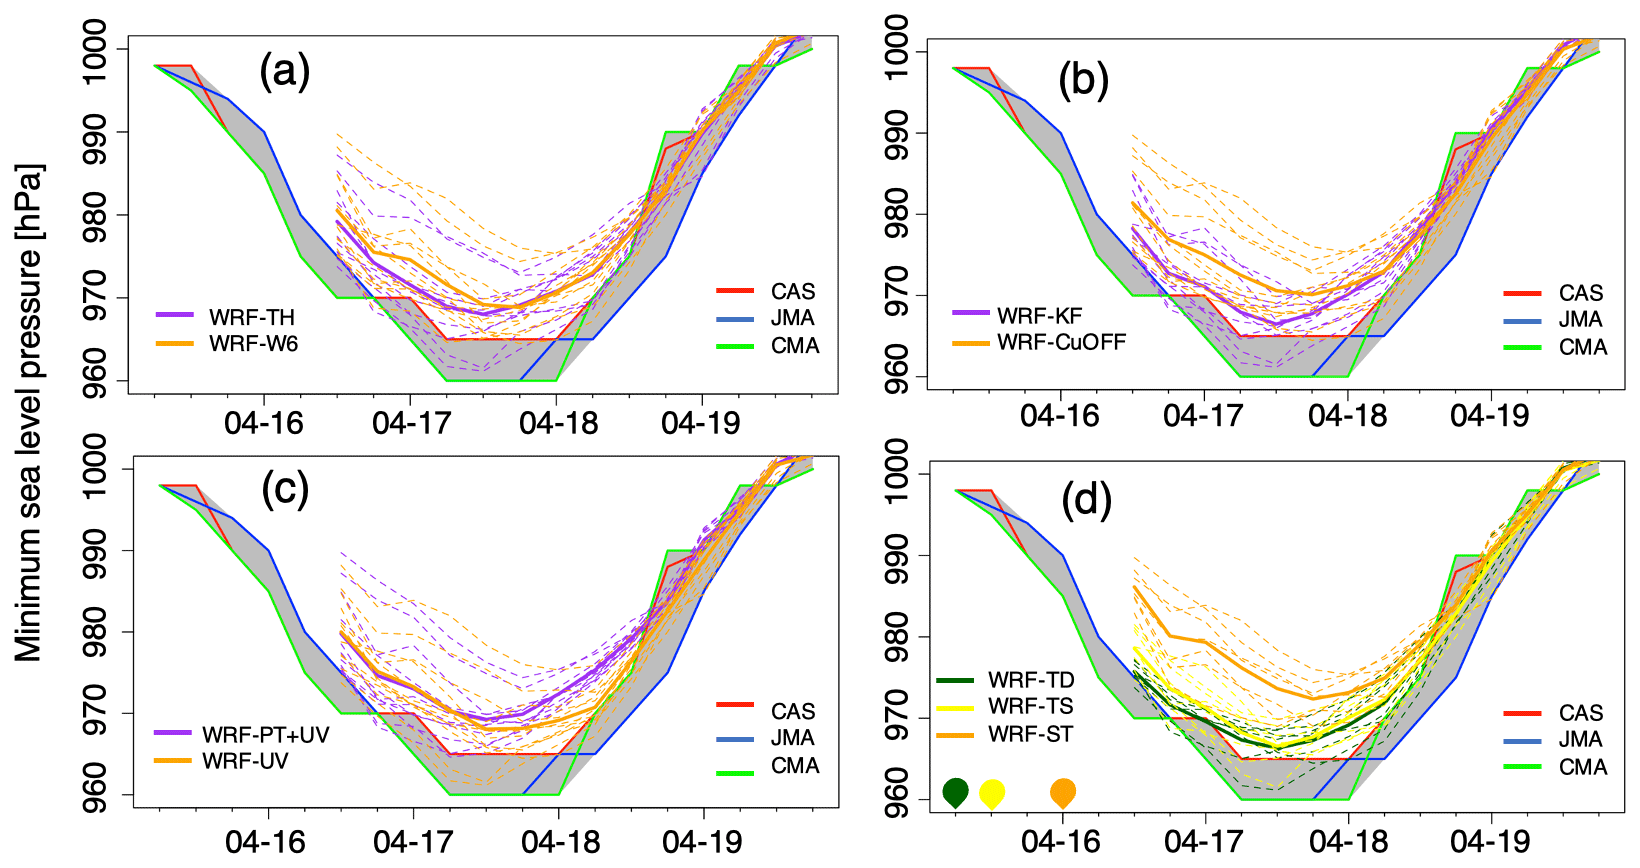
Figure 3Comparison of WRF simulation results and observed MSLP (unit: hPa) time series for Typhoon Neoguri during the simulation period from 12:00 UTC 16 April to 00:00 UTC 20 April 2008. (a) for the MP schemes TH and W6; (b) for CU settings KF and CuOFF; and (c) for nudging settings PT + UV and UV; and (d) for different initial times, TD, TS, and ST. The bold solid line represents the ensemble mean of experiments. The three solid dots indicate the simulation initial times: orange for TD, yellow for TS, and green for ST. The shaded regions illustrate the observed MSLP ranges from three best-track historical datasets.
As mentioned by Laux et al. (2017), the ensemble mean has been widely used to balance out the errors and to avoid random errors from individual members. In this study, we use the ensemble mean to demonstrate the different setting's influence on intensity. Each set has at least 12 experiments, which exceeds the minimum requirement of 10 cases.
Figure 3a illustrates that compared with W6 the TH ensemble mean demonstrates stronger TC, exhibiting an MSLP that is approximately 1–4 hPa lower during the phase of typhoon intensification. When typhoons start weakening, the MSLP values align. Overall, at the intensification stage of Typhoon Neoguri, using the TH microphysics scheme results in a comparatively higher intensity compared with W6.
Figure 3b shows that compared with CuOFF the KF ensemble mean exhibits a lower MSLP value, with differences reaching up to 3–5 hPa during the phase of typhoon intensification. When the typhoons start weakening, the MSLP value from the CuOFF ensemble mean remains higher in the first 12 h of the weakening stage. This higher intensity simulated by KF is consistent with the previous simulations by Li et al. (2018) using the 4 km horizontal resolution domain.
Figure 3c demonstrates that the UV ensemble mean is largely comparable to PT + UV during the typhoon intensification phase. However, while PT + UV starts weakening earlier, the UV ensemble mean maintains a high intensity, showing a sustained difference of 3–5 hPa even 12 h later.
Figure 3d illustrates that TD and TS which start 24 and 6 h earlier have a lower MSLP value compared to ST, with differences reaching 8–10 hPa during the phase of typhoon intensification. When the typhoons start weakening, the MSLP value from the TD experiments' ensemble mean remains higher in the first 24 h of the weakening stage.
Figure S2a–d display the sensitivity of the MWS for Typhoon Neoguri classified according to the MP and CU configurations, spectral nudging settings, and initial times. However, it can be seen from the figure that the values inherit some uncertainty in the different validation data because of wind averaging times, storm position, and storm intensity (Ying et al., 2014). These factors result in only marginal differences in the MWS of Typhoon Neoguri. Contrary to MSLP, MWS exhibits a similar intensity compared with the observation, which may be related to the model representing the relationship between wind speed and sea level pressure. This phenomenon aligns with other research mentioning that the drag coefficient governs the wind–pressure relationship (WPR), and most of the simulated points in the figure show 20 m s−1 higher MWS at the same MSLP compared to the reference (Kueh et al., 2019, Fig. 4c).
Above all, for Typhoon Neoguri, during the intensification stage, simulations using TH, KF, TD, and TS result in a stronger TC within 10 hPa compared with W6, CuOFF, and ST. During the weakening phase of the typhoon, using UV in the simulations leads to a 3–5 hPa stronger TC compared to the use of PT + UV.
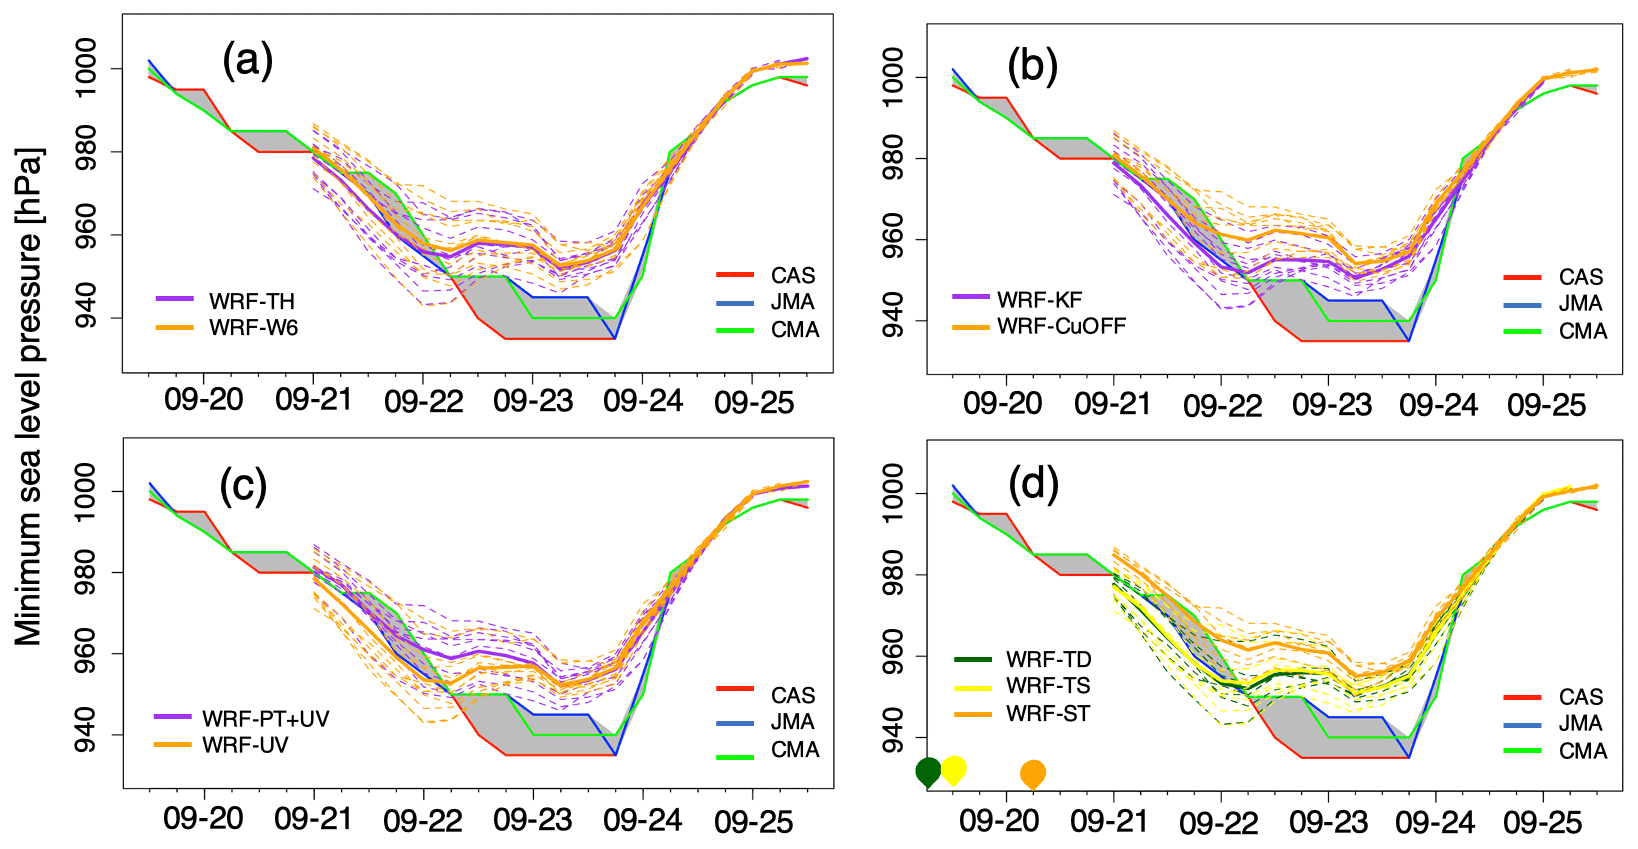
Figure 4a–d display the MSLP sensitivity for Typhoon Hagupit categorized according to MP and CU configurations, spectral nudging settings, and initial times. Compared with Typhoon Neoguri, Typhoon Hagupit exhibits a longer intensification period and higher intensity. Figure 4a–d demonstrate that compared with the three best tracks the simulations could replicate the MSLP temporal changes. Specifically, the MSLP decreases from 00:00 UTC on 21 September to approximately 958 hPa, maintains this intensity for around 24 h, and then begins to rise back from 12:00 UTC on September 23. The lowest MSLP value in the simulations is around 5–10 hPa higher than that recorded in the best tracks. Compared with the CU, nudging, and initial time settings, different MP schemes show consistent temporal changes in MSLP. For the CU settings, at the start time, the difference in MSLP is minor with ca. 1 hPa. Over time, KF experiments exhibit a more pronounced intensification than CuOFF. Regarding nudging settings, simulations that are nudging only horizontal wind show a 3–5 hPa higher intensity during the intensification period. For the initial time, Typhoon Hagupit experiences a longer intensification period compared with Neoguri. As for the late initial time (e.g. ST), a spin-up time of 12–18 h is allowed for both Neoguri and Hagupit, as commonly used in prior research (e.g. Zhang et al., 2017). Despite this, the simulations indicate a weaker intensity, suggesting that both the duration and the initial intensity of the TC are critical factors. As mentioned before, the accuracy in representing initial TC intensity is crucial for the subsequent simulation. Starting earlier may result in a small absolute intensity bias and allow the model to capture more small-scale processes due to longer spin-up time. This potentially benefits the intensification process, thus generating stronger TCs.
Figure S3a–d present the MWS sensitivity for Typhoon Hagupit classified by the MP and CU parameterization schemes, spectral nudging settings, and initial times. These figures illustrate that compared with the three best tracks, the simulated results could also reproduce the MWS temporal changes. Specifically, the MWS increases from 00:00 UTC on 21 September to around 50 m s−1 and decreases from 12:00 UTC on 23 September. Figure S3a–d show that simulations in intensity are in alignment with the MSLP of Hagupit.
Figure 5a–d display the sensitivity of Typhoon Hato in terms of MSLP categorized according to the MP and CU configurations, spectral nudging settings, and initial times. In contrast to Hagupit, Hato undergoes a shorter intensification period but exhibits a stronger overall intensity, indicating a more rapid intensification process. The three best tracks exhibit significant variations in the lowest recorded MSLP, reaching 950 hPa recorded by CMA, which is 20 hPa lower than that recorded by JMA. At the start time, the intensities of observation and simulation are closely aligned, and WRF is capable of capturing the subsequent rapid intensification process. The ensemble means of the different settings generally align with the range of the MSLP recorded by three observed datasets. For simulations of Typhoon Hato, compared to W6 (CuOFF, PT + UV, TD), TH (KF, UV, TD, or TS) exhibits a lower MSLP within 10 hPa during the typhoon intensification stage.
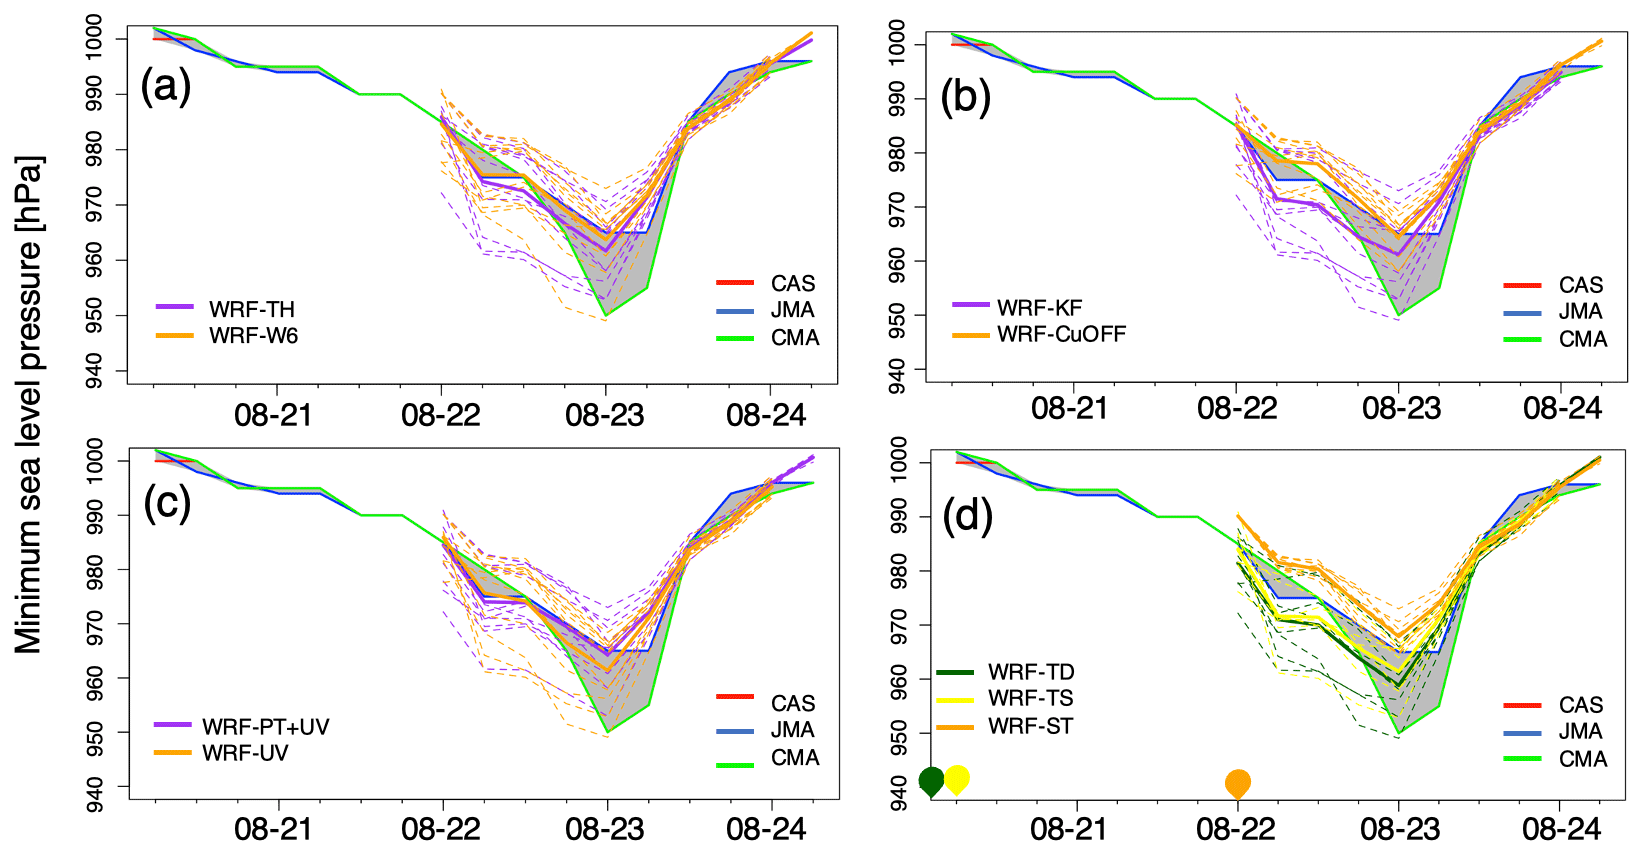
Figure S4a–d illustrate the sensitivity of Typhoon Hato in terms of MWS classified by MP and CU configurations, spectral nudging settings, and initial times. The three best tracks exhibit significant differences at 00:00 UTC on 23 August, which is the peak period of the typhoon. The CMA data indicate a MWS of 45 m s−1, which is 10 m s−1 higher than the one recorded by JMA. The ensemble means of most configurations demonstrate a higher MWS compared with the observed range of the three datasets during the intensification period. Compared to W6 (CuOFF, PT + UV, TD), TH (KF, UV, TD, or TS) shows an around 10 m s−1 higher MWS during the typhoon intensification stage.
Overall, for Typhoon Hato, using TH (KF, UV, TD, or TS) settings resulted in a lower MSLP within 10 hPa and higher MWS within 10 m s−1, thus indicating a more intense typhoon intensity. In a previous study, the average MSLP bias was approximately 40 hPa without data assimilation (Lu et al., 2019). The configurations used in our study are quite comparable to this previous research.
Figure 6a–d present the sensitivity of Typhoon Usagi in terms of MSLP classified by the MP and CU configurations, spectral nudging settings, and initial times. In comparison to the previous three TCs, Usagi exhibits the highest intensity and longest duration. During the first several hours, the MSLP is around 10 hPa lower compared with the observation. However, during the rapid intensification process, although WRF generally captures this process, the simulated intensity is significantly weaker than observed, with a bias of around 30 hPa at the lowest MSLP. As shown in previous research by Gentry and Lackmann (2010), the intensities are often underestimated. This especially applies to stronger TCs, because the coarse resolution may not fully resolve the intensification process, e.g. mixing processes between the TC eye and eyewall that are influenced by small-scale processes like vortex Rossby waves and buoyant eyewall convection processes (Gentry and Lackmann, 2010). Nevertheless, they also noted that 8 km is sufficient when aiming at realistically simulating the TC vortex.
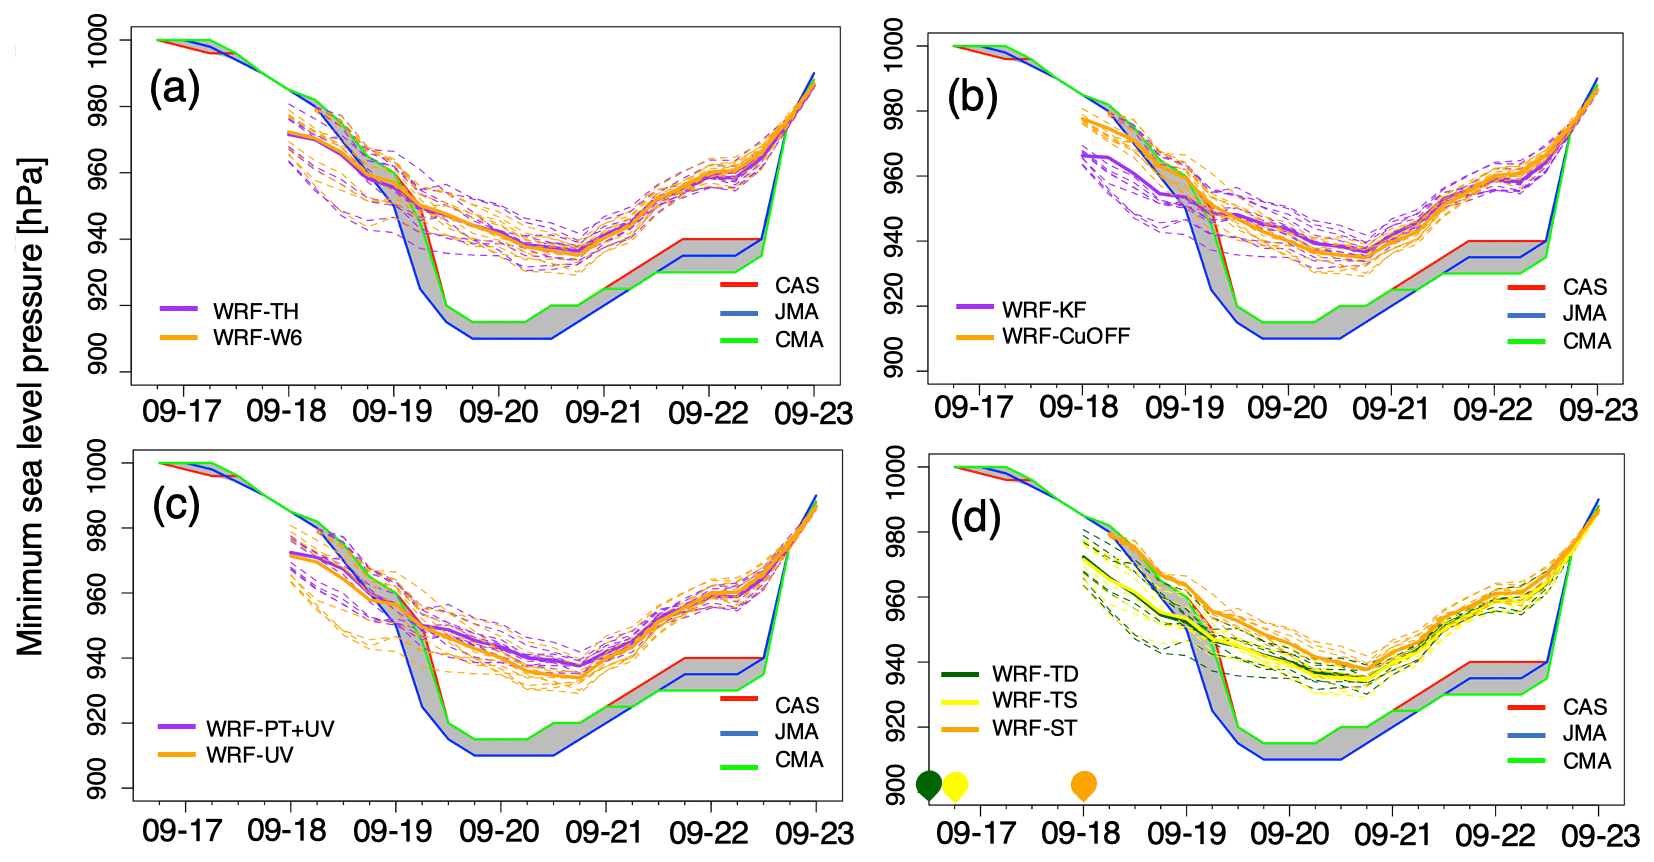
For the MP scheme, TH and W6 demonstrate similar MSLP values as depicted in Fig. 6a. Regarding the CU configurations, on the first day, KF has a lower MSLP than CuOFF within 20 hPa. However, the CuOFF experiences a quicker intensification than KF. In the stage of steady MSLP, CuOFF even has a slightly lower value than KF as shown in Fig. 6b. Figure 6c–d show that PT + UV and ST exhibit higher MSLP relative to UV, TD, and TS in the intensification period.
Figure S5a–d illustrate the sensitivity of Typhoon Usagi in terms of MWS classified by the MP and CU configurations, spectral nudging settings, and initial times. Initially, the MWS values are approximately 15 m s−1 higher than observed. However, during the later intensification period, the MWS is less pronounced compared to the observed data, which is consistent with MSLP. For the MP schemes, TH and W6 show similar values in Fig. S5a. For CU settings, on the first day, KF has a higher MWS than CuOFF. However, the decrease of CuOFF is relatively quicker than KF. In the stage of steady MWS, CuOFF even has a slightly higher value indicating a stronger typhoon than KF, as shown in Fig. S5b. Figure S5c–d show that PT + UV and ST show a lower MWS compared to UV, TD, and TS in the intensification period. Overall, for Typhoon Usagi, using KF (UV, TD, or TS) settings resulted in a relatively lower MSLP and higher MWS, indicating a higher typhoon intensity during the intensification period.
Above all, for TCs of different intensities, with different MP and CU configurations, spectral nudging settings, and initial times, in general, they show consistency in terms of intensity. Nevertheless, notable differences do exist. For four TCs, using KF (UV, TD, or TS) settings leads to a lower MSLP and higher MWS, resulting in a higher typhoon intensity. However, the influence of MP scheme variations on TC intensity, particularly during the intensification period, is relatively minor compared to the effects of CU settings, spectral nudging, and initial times, especially for stronger TCs like Usagi. The TC cases show low sensitivity to the microphysical scheme, which is consistent with previous research (Raktham et al., 2015).
Additionally, we conducted comparisons between individual experiments to test the performance of the combination of different settings. Figure 7a–d depict the temporal average of bias in MSLP and MWS for typhoons Neoguri, Hagupit, Hato, and Usagi based on 24 individual experiments compared with CMA, which uses 2 min mean MWS. In the case of Typhoon Neoguri, as illustrated in Fig. 7a, TH_KF_(UV)_TS inherited less bias in MSLP, approximately 0.8 hPa. However, this setup shows an overestimation in MWS by about 6.5 m s−1, suggesting that the TH_KF_(UV)_TS combination tends to produce a stronger typhoon compared to other combinations. These findings align with previous ensemble mean results, where the combination of TH, KF, UV, and TS results in a lower MSLP and higher MWS. However, the average intensity for Typhoon Neoguri is stronger than observed. In contrast, W6_KF_(PT + UV)_ST, W6_ CuOFF_(PT + UV)_ST, and W6_CuOFF_(UV)_ST have less bias in MWS of around 2 m s−1; however, they exhibit an average overestimation in MSLP of about 6.5 hPa. This suggests these combinations might produce a weaker typhoon compared with most other combinations. All three configurations share ST and W6 settings. Compared with previous combinations, using TH_KF_ (PT + UV)_TS, TH_KF_(UV)_ST, and W6_KF_(UV)_TD shows a low combined bias in both MSLP and MWS. A common feature in these configurations is the inclusion of the KF setting.
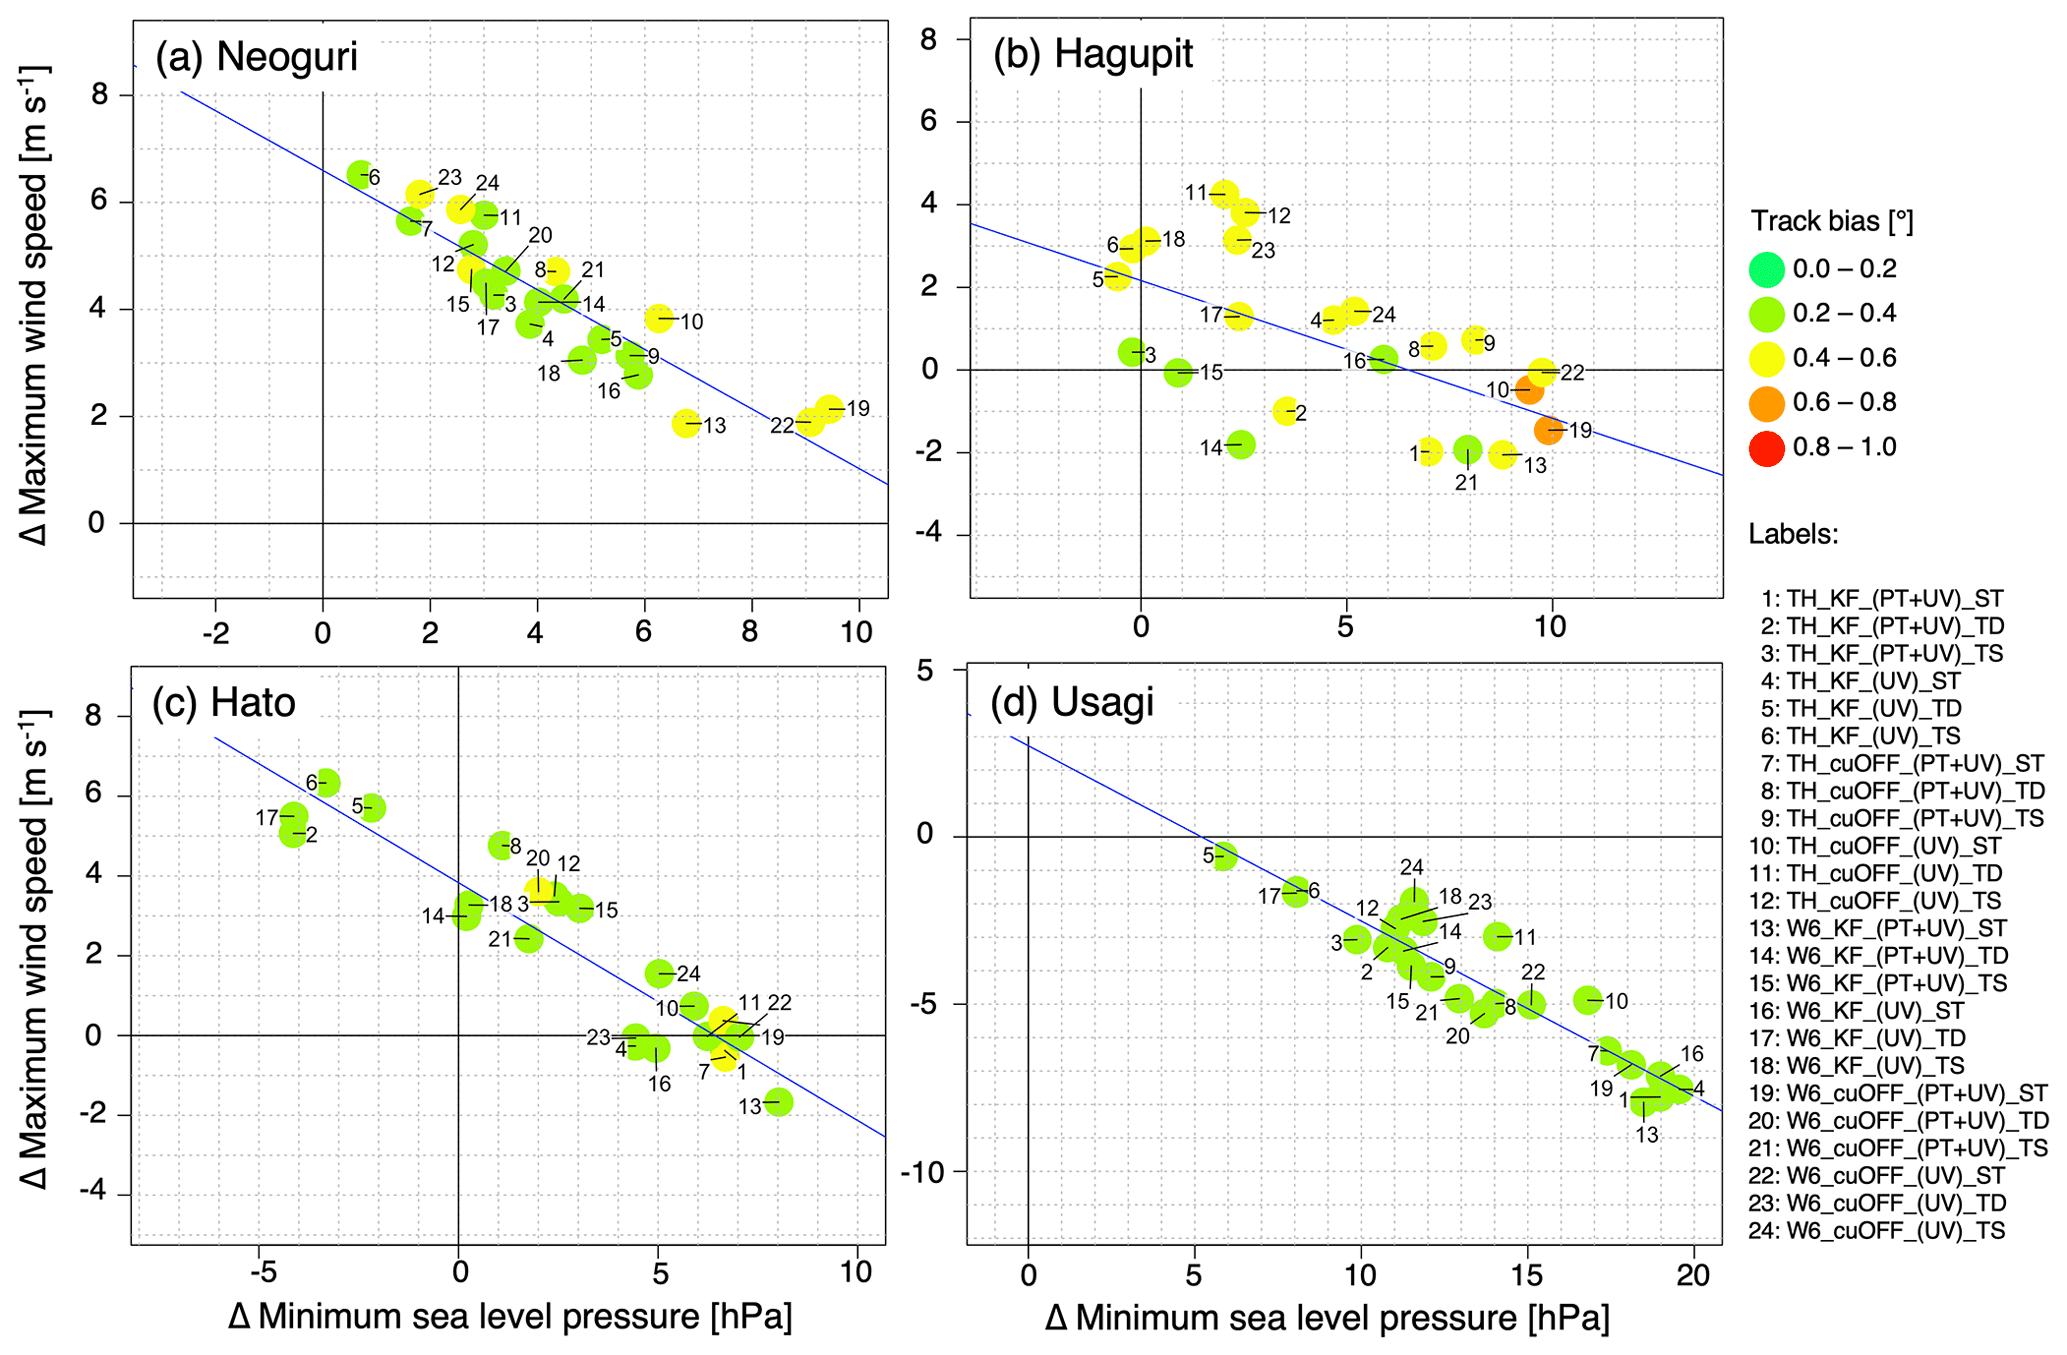
Figure 7Temporal average of bias for the track (colours), MSLP (x axis), and MWS (y axis) for (a) Typhoon Neoguri, (b) Typhoon Hagupit, (c) Typhoon Hato, and (d) Typhoon Usagi compared with CMA.
In the analysis of Typhoon Hagupit, as depicted in Fig. 7b, both TH_KF_(PT + UV)_TS and W6_KF_(PT + UV)_TS show less mean bias in MSLP and MWS. The commonality between these two configurations is the use of KF, PT + UV, and TS. The MP configurations exert less influence on both MSLP and MWS. Compared with a previous simulation study of Typhoon Hagupit (Sun et al., 2019), depicting mean MWS and MSLP simulation biases of 6 m s−1 and 11.3 hPa using JMA data as a reference, the simulation bias in intensity is relatively low.
In the case of Typhoon Hato, as presented in Fig. 7c, W6_KF_ (PT + UV)_TD, W6_KF_(UV)_TS, and W6_CuOFF_ (PT + UV)_TS configurations exhibit lower mean bias compared to the 21 other experiments. This suggests that the TS setting significantly improves the simulation results. A previous study shows an MSLP of around 950 hPa at the peak time, resulting in a bias exceeding 20 hPa when compared to the best track data from HKO (Lui et al., 2021).
In the case of Typhoon Usagi, as indicated in Fig. 7d, because the typhoon has a very high intensity and differs from the previous three TCs, 24 experiments show consistent underestimation of both MSLP and MWS. Notably, TH_KF_(UV)_TD, TH_KF_(UV)_TS, and W6_KF_(UV)_TD yielded comparatively better results. Therefore, using KF, UV, TD, or TS combinations will have better results for stronger TCs. Specifically for Usagi, the UV setting could produce a stronger typhoon, indicating that nudging PT might dampen the intensity of stronger typhoons, aligning with previous research (Cha et al., 2011). However, Cha et al. (2011) utilized an intermittent spectral nudging method to reduce this negative effect. Our study posits that nudging only horizontal wind speed can simultaneously maintain the benefits of improved track bias while avoiding adverse effects that may arise from nudging additional variables like potential temperature. The latter can interfere with intrinsic small-scale processes reproduced by the WRF model, as the nudging technique impedes their development process due to the absence of such detailed information in the large-scale driving field as previously discussed in the introduction.
Overall, our findings indicate that for weaker typhoons, the use of KF, UV, TD, or TS combinations tends to result in an overestimation of MWS. However, in the case of Super Typhoon Usagi, the KF, UV, TD, or TS combinations could reach higher intensity, although there is still some level of underestimation. Additionally, we also compared individual experiments with JMA and CAS data, as shown in Figs. S6 and S7.
Based on the ensemble mean, there is a noticeable decrease in bias. Nevertheless, some biases remain at approximately 7 hPa for MSLP or 3.37 m s−1 for the 10 m wind speed (Di et al., 2019). In comparison with prior studies, the ensemble bias in our study does not exceed 7 hPa for MSLP, and 3.37 m s−1 for the MWS, which lies well within the bias margins considered acceptable in previous research, with Super Typhoon Usagi being the exception.
In Fig. 8, our analysis focuses on the simulated wind speed time series across 24 different experiments specifically within the grid cell nearest to the Zhuzilin station. This station is located in the megacity Shenzhen within the PRD region and could be used for future evaluation. The primary objective of this analysis is to examine the sensitivity of strong wind speeds to various configurations in coastal urban cities, as it has significant implications for predicting storm surges and other disasters.
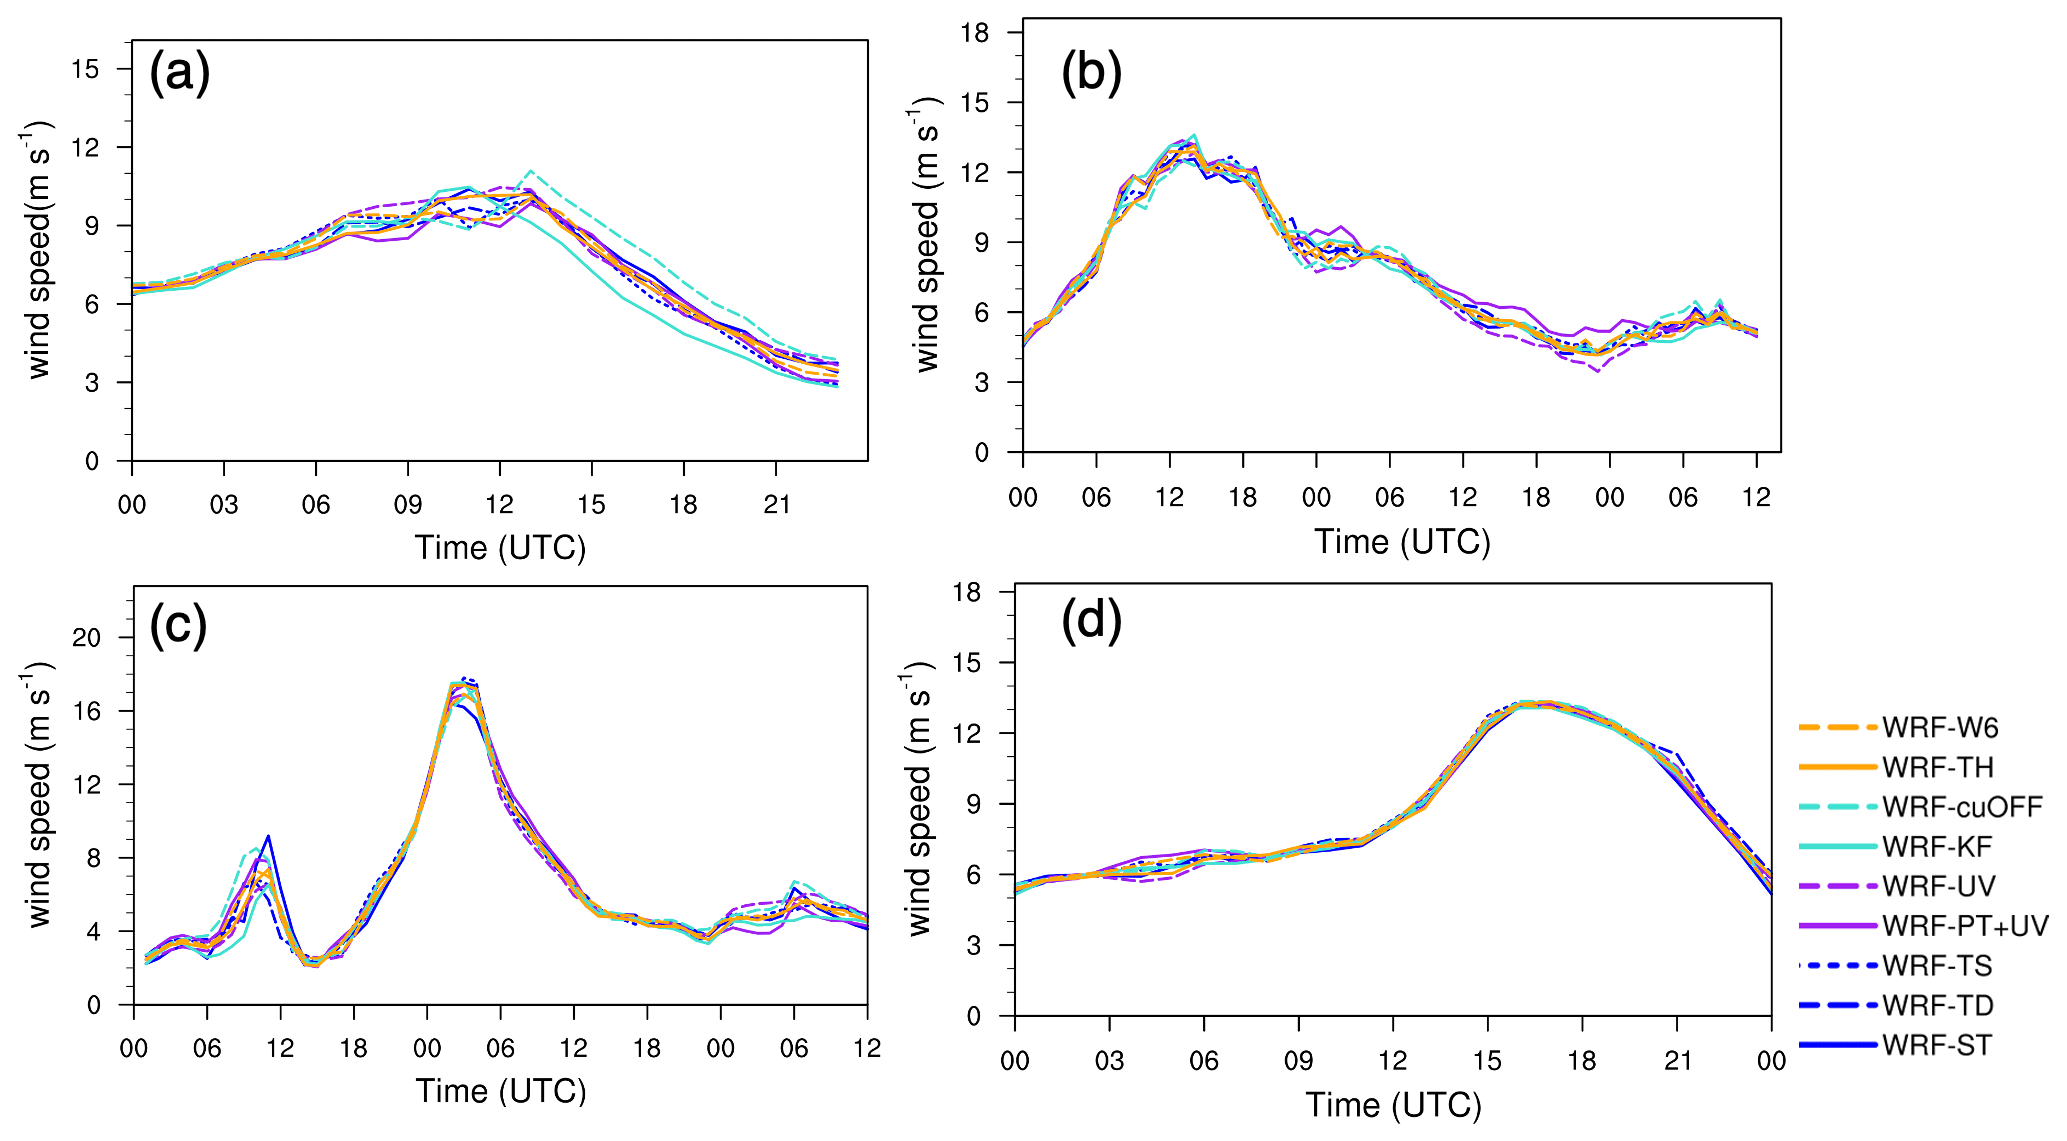
Figure 8Intercomparison of simulated wind speed (m s−1) time series (24 WRF experiments) of the grid cell closest to Zhuzilin station in the PRD region for (a) Typhoon Neoguri, (b) Typhoon Hagupit, (c) Typhoon Hato, and (d) Typhoon Usagi.
For Typhoon Neoguri, the wind speed in the TH scheme is approximately 1 m s−1 higher than in the W6 scheme. For CU, during the intensification stage of the typhoon, the KF scheme exhibits strong wind speeds but decreases rapidly after 12:00 UTC. Conversely, CuOFF reaches its peak at 13:00 UTC on 19 April. Then, the wind speed decreases while CuOFF remains 2 m s−1 higher than KF. Nudging only UV resulted in a 2 m s−1 higher wind speed at peak time. For different initial times, ST showed a 1 m s−1 higher wind speed. Regarding Typhoon Hagupit, all simulations in Fig. 8b exhibit increasing wind speed, reaching a peak around 12:00 UTC, followed by a uniform decline thereafter. Nudging PT + UV shows a 2 m s−1 higher wind speed compared to when only UV is nudged, particularly during the period of wind speed reduction. Other configurations do not show significant differences. Regarding Typhoon Hato, ST is relatively weaker compared to simulations with early initial time. This discrepancy might be associated with the broader radial extent of winds around 15 m s−1 from TD and TS. Because the simulated location of the typhoon is similar as shown in Fig. 2 and Fig. 7. For Typhoon Usagi, the wind speed is 3–4 m s−1 higher for PT + UV compared to only nudging UV at the start. In other periods, the wind speeds from the 24 experiments are quite similar. Overall, while there are deviations in the simulated wind speeds among different experiments, the general trend remains consistent, and the average difference in wind speed is within 2 m s−1. However, it's important to mention that these simulation results still require validation against data from meteorological stations.
3.3 TC precipitation
The rainfall amount is influenced by the convection process and can thus serve as an indicator of the convection process and TC strength (Gao and Chiu, 2010). In this study, we compare accumulated rainfall during the typhoon period from various MP and CU configurations, spectral nudging settings, and initial times, and we compare it with GPM data as depicted in Fig. 9 for Typhoon Neoguri. The spatial distribution of accumulated rainfall closely aligns with the typhoon tracks shown in Fig. 2. All the simulations display similar spatial characteristics, markedly different from the no-nudging simulations, which show a westward shift in track (Fig. S1) and rainfall region (not shown). Compared with GPM rainfall data, the spatial pattern and magnitude of typhoon rainfall are consistent, indicating that the simulation results are reasonable.
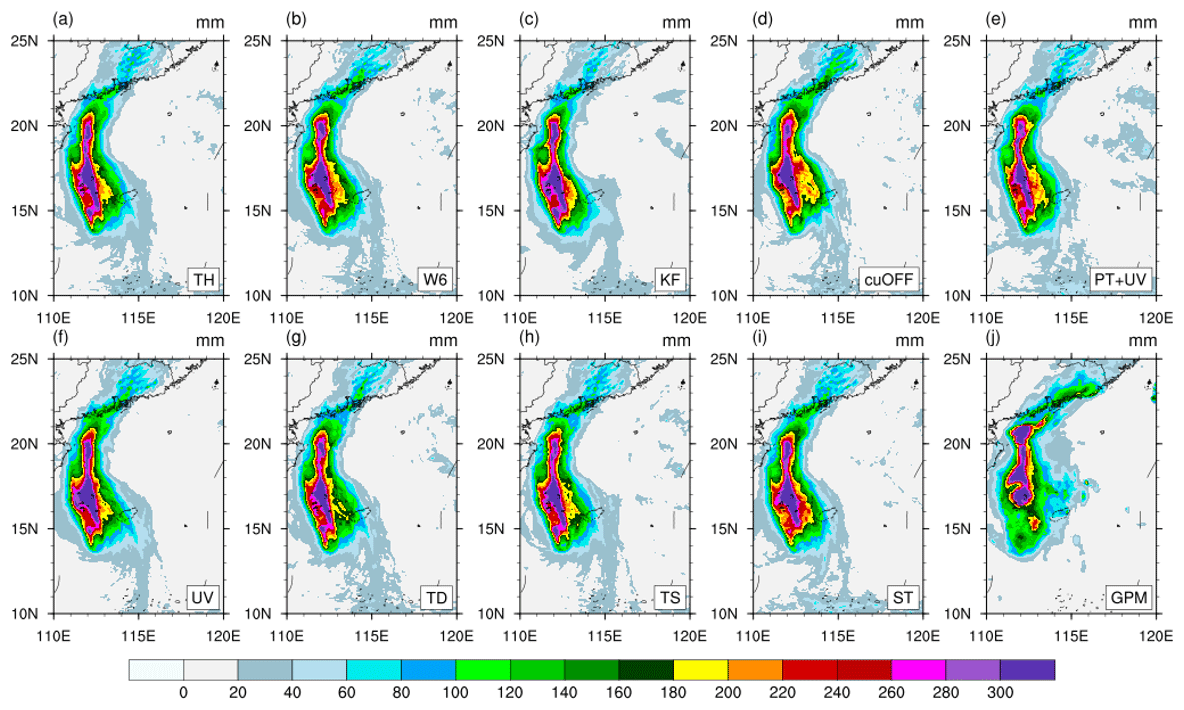
Figure 9Spatial patterns of accumulated rainfall (mm) for Typhoon Neoguri from 12:00 UTC on 16 April 2008 to 00:00 UTC on 20 April 2008 for (a–b) TH, W6; (c–d) KF, CuOFF; (e–f) PT + UV, UV; (g–i) TD, TS, ST, and (j) GPM.
The MP schemes examined in this study use varied moisture species and physical processes for phase changes to model the formation of rainfall (Xu et al., 2023). Notably, the TH scheme, when compared to W6, results in heavier rainfall over the ocean near 15∘ N, as depicted in Fig. 9a–b. Figure 3a illustrates the intensity is higher in TH relative to W6. This increase in intensity is likely related to more rainfall, which releases more latent heat flux into mass. This release supports vertical processes and transfers more air to upper levels, consequently leading to a decrease in the MSLP.
Regarding CU settings, before crossing 15∘ N, the KF scheme shows more rainfall than CuOFF, consistent with a stronger TC intensity observed in Fig. 3b. Afterwards, CuOFF exhibits a more extensive rainfall region compared to KF, particularly along the coastal region, shows more rainfall. The KF scheme triggers more convective processes than CuOFF which is insufficient to faithfully capture the entire range of convective motions (Bryan et al., 2003), inducing more rainfall as well as a lower MSLP. Under UV settings compared to PT + UV, the rainfall area is broader, with precipitation totals exceeding 300 mm. As the TC moves through these areas, TC intensities are higher with UV than with PT + UV, as shown in Fig. 3c. Additionally, in the coastal region of Guangdong, UV records about 100–120 mm of accumulated rainfall, while PT + UV shows around 80–100 mm. Unlike the difference in physical processes in CU and MP, nudging is a technique primarily influencing simulated large-scale fields. Nudging PT + UV more effectively inhibits the TC intensity. For varying initial times, before crossing 15∘ N, TD and TS simulations exhibit a greater rainfall amount compared to ST, which is also consistent with Fig. 3d, because an earlier start may give the small-scale process more time to develop. Overall, the accumulated rainfall from simulated TC is closely associated with the simulated track and intensity.
We further assessed the simulated rainfall time series of the grid cell closest to Zhuzilin station, as illustrated in Fig. 10. According to Fig. 10a, the WRF model could capture the typhoon-induced rainfall process. However, compared with GPM data with two peak periods, the model only simulates a single peak in precipitation. Regarding the peak hourly rainfall rate, the span across 24 experiments is approximately 16–31 mm, with GPM around 25 mm. Nevertheless, it is also important to compare these results with actual station data for validation.
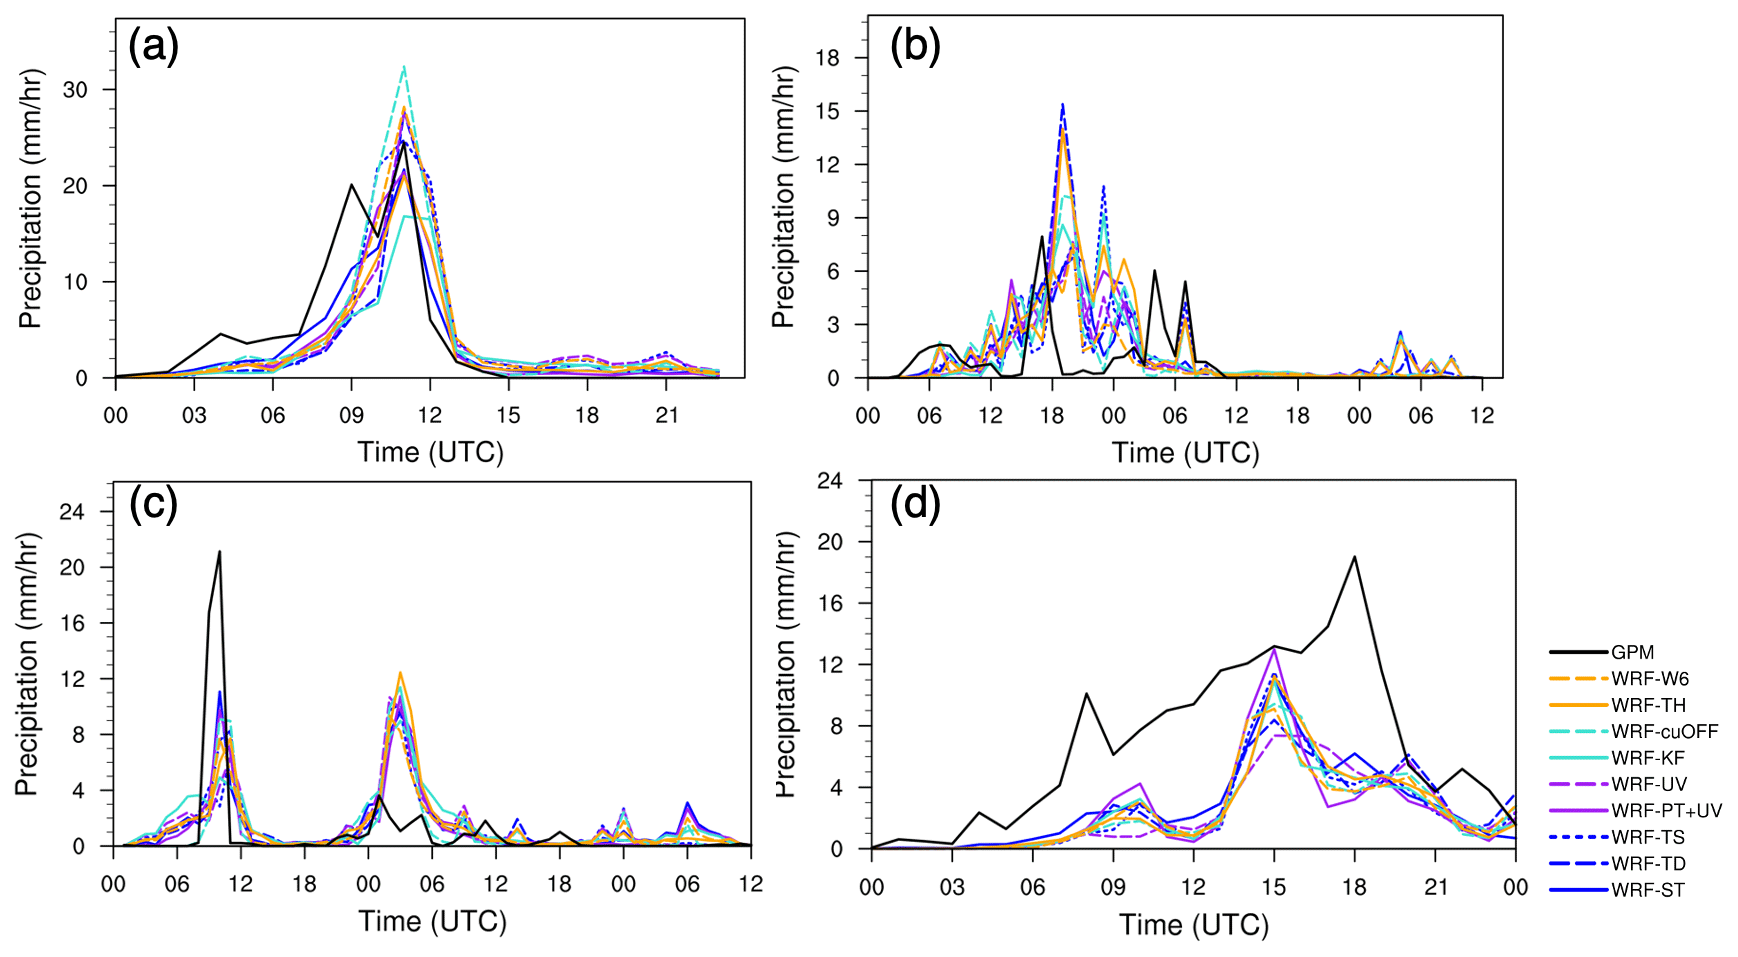
Figure 10Intercomparison of simulated hourly rainfall (mm h−1) time series (24 WRF experiments) of the grid cell closest to Zhuzilin station in the PRD region for (a) Typhoon Neoguri, (b) Typhoon Hagupit, (c) Typhoon Hato, and (d) Typhoon Usagi.
For Typhoon Hagupit, as depicted in Fig. S8, the simulated spatial pattern and magnitude of the accumulated typhoon rainfall are generally consistent with observations. However, the simulation shows a narrower area of the maximum precipitation compared with GPM data. As the typhoon approached landfall west of the PRD, the rainfall at the specific grid cell is relatively modest in comparison to other typhoon cases. The simulations show an overestimated 60–80 mm precipitation, whereas GPM indicates 20–40 mm (Fig. S8). This discrepancy could be attributed to a slight eastward shift of the landfall region in the simulation, as illustrated in Fig. 2b. Figure 10b demonstrates that WRF could capture the typhoon-induced rainfall process. However, it also shows a delayed peak in precipitation and a larger magnitude compared to GPM data. The larger simulated rainfall magnitude could be associated with the eastward shift of the TC track.
For Typhoon Hato, as shown in Fig. S9, like Hagupit, GPM has a relatively broader rainfall area compared to the simulations. As for coastal regions, the simulations exhibit overestimated rainfall compared to GPM data. As shown in Fig. 10c, there is a bimodal rainfall distribution. During the first rainfall peak, the simulations consistently underestimate the rainfall rate; however, in the second peak, the rainfall is overestimated. However, when compared with the ground observation from Lu et al. (2019), the simulation results are substantiated as reasonable.
As shown in Fig. S10, Typhoon Usagi shows a similarity between simulated rainfall and GPM data, particularly in terms of the magnitude and extent of the maximum precipitation area when passing the ocean. Upon reaching the coastal regions, the simulated results exhibit some underestimation in the PRD region. For the grid cell nearest to Zhuzilin station, the simulated TC has a longer duration of continuous rainfall time; however, it tends to underestimate the hourly rainfall rate.
The rainfall intensity over the ocean shows some correlation with TC intensity, however, when it comes to the coastal regions, which inhabit a large population, there is no obvious relationship with TC intensity. There exists a difference in rainfall rate from different configurations which might be induced by the influence of the size of the spiral band, which should be further studied.
3.4 Physical changes
Sun et al. (2019) identifies latent heat flux as the main heat source for TC development and they also speculate that the simulated latent heat flux is related to the simulated TC intensity. Convective processes, by influencing sensible and latent heat and momentum transport, affect the vertical structures of the atmospheric temperature and humidity fields. In our research, we further investigate whether CU settings induced differences in latent heat flux (Fig. 11). In Fig. 11a, for Typhoon Neoguri, compared with CuOFF, KF consistently shows a relatively larger latent heat flux within the track of TCs. As shown in Fig. 11b–d, the same phenomenon also occurred along the paths of the other three typhoons. The absolute value of latent heat flux is around 300 W m−2, and the difference is approximately 20–30 W m−2, which is about 10 %.
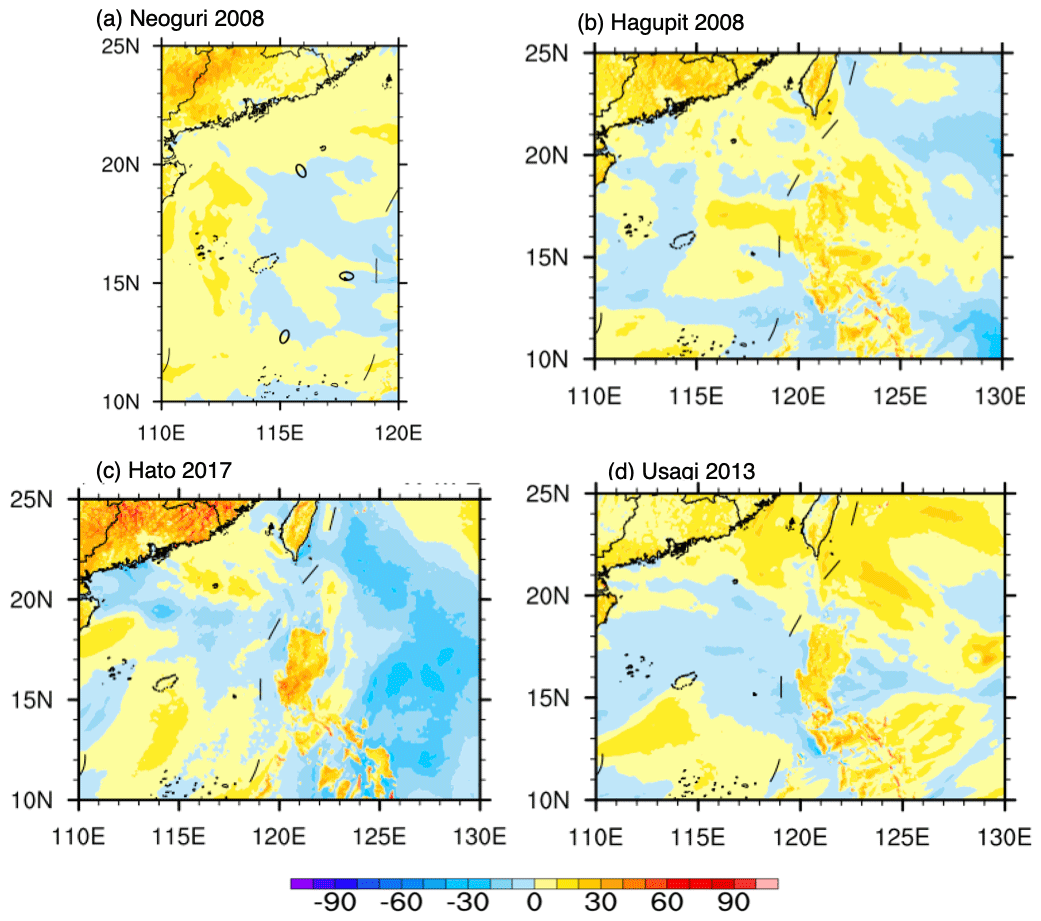
Figure 11Spatial patterns of simulated latent heat flux (W m−2) average difference between KF and CuOFF for typhoons (a) Neoguri, (b) Hagupit, (c) Hato, and (d) Usagi.
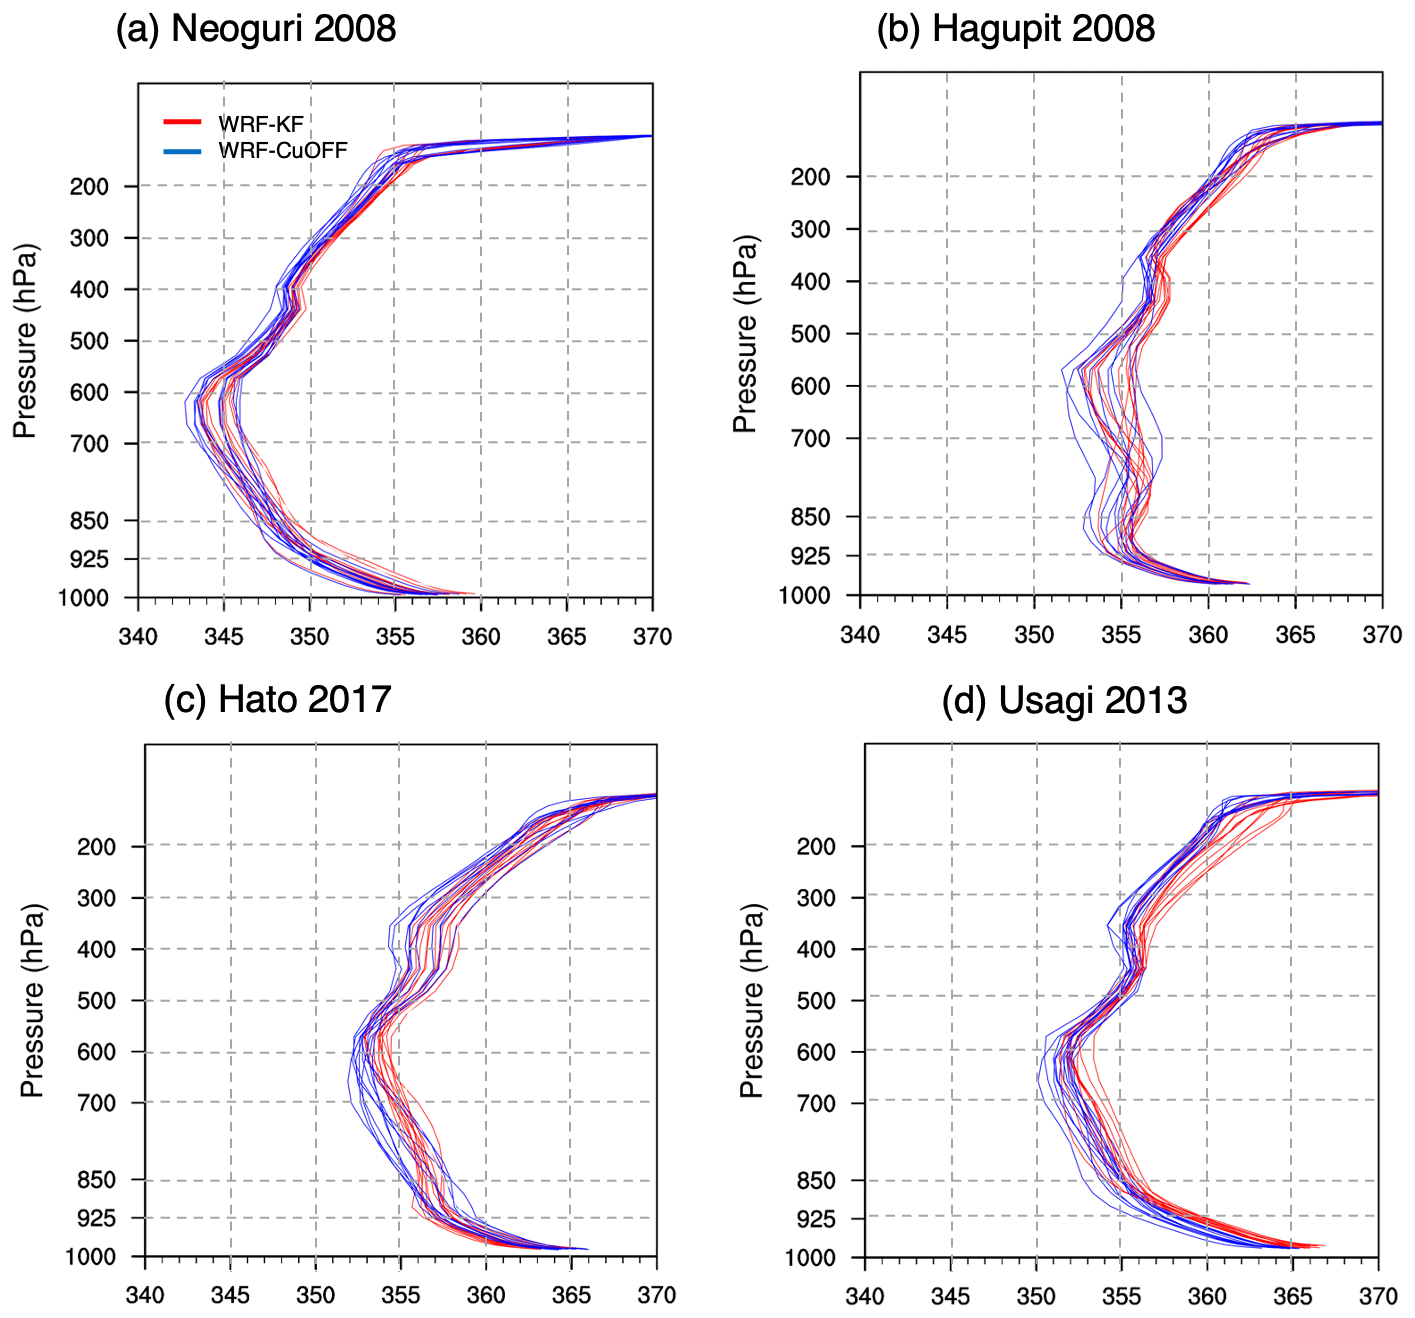
Figure 12Equivalent potential temperature (θe) vertical distribution between KF (red) and CuOFF (blue) for (a) Typhoon Neoguri on 17 April 00:00 UTC, (b) Hagupit on 22 September 12:00 UTC, (c) Hato on 23 August 00:00 UTC, and (d) Usagi on 18 September 12:00 UTC.
We further analysed the vertical structures of θe, which is a variable that combines temperature, pressure, and humidity and is a thermodynamic parameter used to assess the moist static energy content of an air mass, which is closely related to the TC intensity (Ma et al., 2013). The field could show that a more intense TC is related to the warmer core of the TC because of two processes. Firstly, higher latent heat flux between ocean and air induces more air ascending in the eyewall and releases more latent heat as vapour within rising air parcels condenses. The second process is related to subsidence in the eye of the storm, causing further warming in the eye through compressional heating, potentially lowering the surface pressure (Gentry and Lackmann, 2010). θe is also used as a criterion for convective instability (CI). As shown in Fig. 12a–d, KF has a higher θe in all layers, and CI reaches higher layers compared with CuOFF, allowing more heat to be transported from the lower to the upper atmosphere. This results in a significantly warmer core structure of the typhoon. Based on these results, we speculate that the KF scheme generates stronger ocean–TC interactions which stimulate TC development. Compared with CuOFF, KF then transports heat energy to the upper layer, resulting in differences in the simulated convective process, further generating heavier precipitation (Fig. 9c–d). The rainfall leads to variations in latent heat release, which, in turn, impacts the convective process and shows the stronger intensity of typhoons, which is consistent with the wind-induced heat exchange (WISHE) mechanism (Emanuel, 1986).
As mentioned by Cha et al. (2011), nudging might weaken TC intensity. In this study, we also investigated the impact of nudging on the TC intensity. As shown in Fig. S11, compared with PT + UV, UV and no-nudging show a higher θe at all layers and higher CI height. Nudging PT + UV results in a decrease in the simulated typhoon intensities. However, exclusively nudging horizontal wind can alleviate the inhibiting effect. Nudging horizontal wind could have a positive effect on reducing the track distance bias; however, nudging too many variables may not lead to further improvements on the tracks and even inhibit the TC development during the intensification period.
In this study, we use the WRF V4.3 model to analyse the sensitivity of typhoons Neoguri, Hagupit, Hato, and Usagi to various settings, including different MP, CU, nudging, and initial time settings. These four typhoons were selected as instances of different TC categories (based on the Saffir–Simpson scale), causing compound flood events in the PRD region.
The results led to the following conclusions:
-
For the track simulations, nudging only horizontal wind could reasonably capture the large-scale circulation patterns, leading to simulated tracks closely aligned with the best-track reference datasets. This was evident in all TCs, including Neoguri, which is solely generated in the SCS region and also shows a large track improvement.
-
For intensity, the four selected TCs show consistency. Compared with CuOFF (PT + UV; ST), using KF (UV; TD or TS) settings resulted in lower MSLP and higher MWS, indicating a higher typhoon intensity. Compared with the CU, nudging, and initial times, the TC cases show low sensitivity to the MP, which is consistent with previous research. Physical changes between CU configurations show that, from the perspective of energy, KF has a larger latent heat flux between ocean and air, which allows for an increased energy provision to the TC system. Moreover, a higher equivalent potential temperature indicates that the larger moist static energy in the TC system, which may partly transfer to kinetic energy, may induce a stronger TC during the intensification period. Therefore, especially for the simulation of super typhoons, this study proposes to use a KF, UV, TD, or TS configuration combination, although the intensities are still underestimated.
-
Although the different simulation results show a large difference in MWS and SLP, the differences are not very pronounced on land in the coastal regions.
There remain limitations of this study. Due to the lack of observation stations, the simulated results around coastal regions still need to be validated. Besides, the WRF performance could be improved with data assimilation when more observation data become available. Furthermore, there still remains a variety of uninvestigated CU and MP settings, PBL schemes, and different surface flux options that impact TCs.
Future work will apply these model configurations with different CMIP6 projection results using the pseudo-global warming (PGW) approach to improve our understanding of potential future changes in TCs and also utilize these results for hydrodynamical models, such as Delft3D, from which the cities' disaster management and defence could potentially benefit.
The data used in this study can be accessed by contacting the first author. The WRF results can be accessed upon request. ERA5 data were downloaded from the European Centre for Medium-Range Weather Forecasts (ECMWF), as well as Copernicus Climate Change Service (C3S) at Climate Data Store (CDS; Hersbach et al., 2020) to derive the WRF. GPM IMERG Final Precipitation L3 Half Hourly 0.1∘ × 0.1∘ V06 (GPM_3IMERGHH) data were downloaded from the Earthdata database, available at https://doi.org/10.5067/GPM/IMERG/3B-HH/06 (Huffman et al., 2019), and three TC track datasets are from the Oceanographic Data Centre, Chinese Academy of Sciences (CASODC) (https://doi.org/10.12157/IOCAS.20210804.001, Wang, 2023); the China Meteorological Administration (CMA) (Ying et al., 2014; Lu et al., 2021); and the World Meteorological Organization (WMO) Regional Specialized Meteorological Centre in Tokyo, Japan (JMA) (https://www.jma.go.jp/jma/jma-eng/jma-center/rsmc-hp-pub-eg/trackarchives.html, JMA, 2013), used to verify the simulation results. The WRF model is available at https://doi.org/10.5065/1DFH-6P97 (Skamarock et al., 2019).
The supplement related to this article is available online at: https://doi.org/10.5194/hess-28-761-2024-supplement.
The study's conceptualization was a collaborative effort involving QS, PO, and PL. QS took on the responsibilities of experiment execution and initial manuscript drafting. Subsequently, both QS and PO were involved in the comprehensive tasks of data analysis, visualization, and validation. PO, PL, LS, and ZT contributed significantly to the meticulous review and editing process. PO also played a pivotal role in the development of the typhoon tracking algorithm. JW provided essential support for the model operation. PL and HK provided invaluable supervision throughout the study. PL undertook project administration, while HK facilitated the acquisition of funding. It is important to emphasize that all authors actively participated in the interpretation of the results and made substantial contributions to the paper's refinement.
The contact author has declared that none of the authors has any competing interests.
Publisher’s note: Copernicus Publications remains neutral with regard to jurisdictional claims made in the text, published maps, institutional affiliations, or any other geographical representation in this paper. While Copernicus Publications makes every effort to include appropriate place names, the final responsibility lies with the authors.
This article is part of the special issue “Attributing and quantifying the risk of hydrometeorological extreme events in urban environments”. It is not associated with a conference.
We thank the following institutions for providing data: Oceanographic Data Centre, Chinese Academy of Sciences (CASODC) (http://msdc.qdio.ac.cn, last access: 14 February 2024), the China Meteorological Administration (CMA) (https://tcdata.typhoon.org.cn/, last access: 14 February 2024, and the World Meteorological Organization (WMO) Regional Specialized Meteorological Centre in Tokyo, Japan (JMA) (https://www.jma.go.jp/, last access: 14 February 2024).
This study was conducted in the framework of the Sino-German project Mitigating the Risk of Compound Extreme Flooding Events MitRiskFlood, funded by MOST (grant no. 2019YFE0124800) and the German Ministry of Education and Research (BMBF) (grant no. 01LP2005A). Qi Sun is supported financially by the Chinese Scholarship Council (CSC).
The article processing charges for this open-access publication were covered by the Karlsruhe Institute of Technology (KIT).
This paper was edited by Qinghua Ye and reviewed by two anonymous referees.
Anthes, R. A.: A Cumulus Parameterization Scheme Utilizing a One-Dimensional Cloud Model, Mon. Weather Rev., 105, 270–286, https://doi.org/10.1175/1520-0493(1977)105<0270:ACPSUA>2.0.CO;2, 1977.
Bhattacharya, S. K., Kotal, S. D., Roy Bhowmik, S. K., and Kundu, P. K.: Sensitivity of WRF-ARW Model to Cumulus Parameterisation Schemes in Prediction of TC Intensity and Track Over the North Indian Ocean, in: Tropical Cyclone Activity over the North Indian Ocean, edited by: Mohapatra, M., Bandyopadhyay, B. K., and Rathore, L. S., Springer International Publishing, Cham, 295–306, https://doi.org/10.1007/978-3-319-40576-6_20, 2017.
Bryan, G. H., Wyngaard, J. C., and Fritsch, J. M.: Resolution Requirements for the Simulation of Deep Moist Convection, Mon. Weather Rev., 131, 2394–2416, https://doi.org/10.1175/1520-0493(2003)131<2394:RRFTSO>2.0.CO;2, 2003.
Camargo, S. J. and Wing, A. A.: Tropical cyclones in climate models, WIREs Clim. Change, 7, 211–237, https://doi.org/10.1002/wcc.373, 2016.
Cao, X., Wu, R., and Bi, M.: Contrasting contributions of flows on different time scales to tropical cyclone tracks over the South China Sea, Environ. Res. Lett., 15, 034003, https://doi.org/10.1088/1748-9326/ab6fbd, 2020.
Cha, D.-H., Jin, C.-S., Lee, D.-K., and Kuo, Y.-H.: Impact of intermittent spectral nudging on regional climate simulation using Weather Research and Forecasting model, J. Geophys. Res., 116, D10103, https://doi.org/10.1029/2010JD015069, 2011.
Chen, F. and Dudhia, J.: Coupling an Advanced Land Surface–Hydrology Model with the Penn State–NCAR MM5 Modeling System. Part I: Model Implementation and Sensitivity, Mon. Weather Rev., 129, 569–585, https://doi.org/10.1175/1520-0493(2001)129<0569:CAALSH>2.0.CO;2, 2001.
Chen, J., Wang, Z., Tam, C.-Y., Lau, N.-C., Lau, D.-S. D., and Mok, H.-Y.: Impacts of climate change on tropical cyclones and induced storm surges in the Pearl River Delta region using pseudo-global-warming method, Sci. Rep.-UK, 10, 1965, https://doi.org/10.1038/s41598-020-58824-8, 2020.
Chen, S., Li, W., Lu, Y., and Wen, Z.: Variations of latent heat flux during tropical cyclones over the South China Sea: Variations of latent heat flux during tropical cyclones, Meteorol. Appl., 21, 717–723, https://doi.org/10.1002/met.1398, 2014.
Delfino, R. J., Bagtasa, G., Hodges, K., and Vidale, P. L.: Sensitivity of simulating Typhoon Haiyan (2013) using WRF: the role of cumulus convection, surface flux parameterizations, spectral nudging, and initial and boundary conditions, Nat. Hazards Earth Syst. Sci., 22, 3285–3307, https://doi.org/10.5194/nhess-22-3285-2022, 2022.
Di, Z., Gong, W., Gan, Y., Shen, C., and Duan, Q.: Combinatorial Optimization for WRF Physical Parameterization Schemes: A Case Study of Three-Day Typhoon Simulations over the Northwest Pacific Ocean, Atmosphere, 10, 233, https://doi.org/10.3390/atmos10050233, 2019.
Dudhia, J.: Numerical Study of Convection Observed during the Winter Monsoon Experiment Using a Mesoscale Two-Dimensional Model, J. Atmos. Sci., 46, 3077–3107, https://doi.org/10.1175/1520-0469(1989)046<3077:NSOCOD>2.0.CO;2, 1989.
Emanuel, K. A.: An Air-Sea Interaction Theory for Tropical Cyclones. Part I: Steady-State Maintenance, J. Atmos. Sci., 43, 585–605, https://doi.org/10.1175/1520-0469(1986)043<0585:AASITF>2.0.CO;2, 1986.
Gao, S. and Chiu, L. S.: Surface latent heat flux and rainfall associated with rapidly intensifying tropical cyclones over the western North Pacific, Int. J. Remote Sens., 31, 4699–4710, https://doi.org/10.1080/01431161.2010.485149, 2010.
Gentry, M. S. and Lackmann, G. M.: Sensitivity of Simulated Tropical Cyclone Structure and Intensity to Horizontal Resolution, Mon. Weather Rev., 138, 688–704, https://doi.org/10.1175/2009MWR2976.1, 2010.
Gómez, B. and Miguez-Macho, G.: The impact of wave number selection and spin-up time in spectral nudging: Wave Number Selection and Spin-up Time in Spectral Nudging, Q. J. Roy. Meteor. Soc., 143, 1772–1786, https://doi.org/10.1002/qj.3032, 2017.
Gutmann, E. D., Rasmussen, R. M., Liu, C., Ikeda, K., Bruyere, C. L., Done, J. M., Garrè, L., Friis-Hansen, P., and Veldore, V.: Changes in Hurricanes from a 13-Yr Convection-Permitting Pseudo–Global Warming Simulation, J. Climate, 31, 3643–3657, https://doi.org/10.1175/JCLI-D-17-0391.1, 2018.
Hersbach, H., Bell, B., Berrisford, P., Hirahara, S., Horányi, A., Muñoz-Sabater, J., Nicolas, J., Peubey, C., Radu, R., Schepers, D., Simmons, A., Soci, C., Abdalla, S., Abellan, X., Balsamo, G., Bechtold, P., Biavati, G., Bidlot, J., Bonavita, M., Chiara, G., Dahlgren, P., Dee, D., Diamantakis, M., Dragani, R., Flemming, J., Forbes, R., Fuentes, M., Geer, A., Haimberger, L., Healy, S., Hogan, R. J., Hólm, E., Janisková, M., Keeley, S., Laloyaux, P., Lopez, P., Lupu, C., Radnoti, G., Rosnay, P., Rozum, I., Vamborg, F., Villaume, S., and Thépaut, J.: The ERA5 global reanalysis, Q. J. Roy. Meteor. Soc., 146, 1999–2049, https://doi.org/10.1002/qj.3803, 2020.
Holton, J. R.: An Introduction to Dynamic Meteorology [M], New York, Academic Press, 319 pp., ISBN 978-0-12-384866-6, 1972.
Hong Kong Observatory: Super Typhoon Hato (1713) Report, https://www.hko.gov.hk/en/informtc/hato17/report.htm (last access: 14 Feburary 2024), 2017.
Hong Kong Observatory: Guangdong-Hong Kong-Macao Greater Bay Area Climate Bulletin, https://www.hko.gov.hk/en/cis/GBAClimat.htm (last access: 14 Feburary 2024), 2023.
Hong, S.-Y., Dudhia, J., and Chen, S.-H.: A Revised Approach to Ice Microphysical Processes for the Bulk Parameterization of Clouds and Precipitation, Mon. Weather Rev., 132, 103–120, https://doi.org/10.1175/1520-0493(2004)132<0103:ARATIM>2.0.CO;2, 2004.
Hong, S.-Y., Noh, Y., and Dudhia, J.: A New Vertical Diffusion Package with an Explicit Treatment of Entrainment Processes, Mon. Weather Rev., 134, 2318–2341, https://doi.org/10.1175/MWR3199.1, 2006.
Hsu, C.-E., Serafin, K. A., Yu, X., Hegermiller, C. A., Warner, J. C., and Olabarrieta, M.: Total water levels along the South Atlantic Bight during three along-shelf propagating tropical cyclones: relative contributions of storm surge and wave runup, Nat. Hazards Earth Syst. Sci., 23, 3895–3912, https://doi.org/10.5194/nhess-23-3895-2023, 2023.
Huffman, G. J., Stocker, E. F., Bolvin, D. T., Nelkin, E. J., and Tan, J.: GPM IMERG Final Precipitation L3 Half Hourly 0.1 degree × 0.1 degree V06, Greenbelt, MD, Goddard Earth Sciences Data and Information Services Center (GES DISC) [data set], https://doi.org/10.5067/GPM/IMERG/3B-HH/06, 2019.
JMA – Japan Meteorological Agency: Best Track Data, JMA [data set], https://www.jma.go.jp/jma/jma-eng/jma-center/rsmc-hp-pub-eg/trackarchives.html (last access: 14 Feburary 2024), 2013.
Kain, J. S.: The Kain–Fritsch Convective Parameterization: An Update, J. Appl. Meteorol., 43, 170–181, https://doi.org/10.1175/1520-0450(2004)043<0170:TKCPAU>2.0.CO;2, 2004.
Khain, A., Lynn, B., and Shpund, J.: High resolution WRF simulations of Hurricane Irene: Sensitivity to aerosols and choice of microphysical schemes, Atmos. Res., 167, 129–145, https://doi.org/10.1016/j.atmosres.2015.07.014, 2016.
Knutson, T., Camargo, S. J., Chan, J. C. L., Emanuel, K., Ho, C.-H., Kossin, J., Mohapatra, M., Satoh, M., Sugi, M., Walsh, K., and Wu, L.: Tropical Cyclones and Climate Change Assessment: Part II: Projected Response to Anthropogenic Warming, B. Am. Meteorol. Soc., 101, E303–E322, https://doi.org/10.1175/BAMS-D-18-0194.1, 2020.
Kueh, M.-T., Chen, W.-M., Sheng, Y.-F., Lin, S. C., Wu, T.-R., Yen, E., Tsai, Y.-L., and Lin, C.-Y.: Effects of horizontal resolution and air–sea flux parameterization on the intensity and structure of simulated Typhoon Haiyan (2013), Nat. Hazards Earth Syst. Sci., 19, 1509–1539, https://doi.org/10.5194/nhess-19-1509-2019, 2019.
Laux, P., Nguyen, P. N. B., Cullmann, J., Van, T. P., and Kunstmann, H.: How many RCM ensemble members provide confidence in the impact of land-use land cover change: RCM Ensemble Simulations To Estimate The Impact Of LULCC, Int. J. Climatol., 37, 2080–2100, https://doi.org/10.1002/joc.4836, 2017.
Li, F., Song, J., and Li, X.: A preliminary evaluation of the necessity of using a cumulus parameterization scheme in high-resolution simulations of Typhoon Haiyan (2013), Nat. Hazards, 92, 647–671, https://doi.org/10.1007/s11069-018-3218-y, 2018.
Li, Y., Tang, Y., Wang, S., Toumi, R., Song, X., and Wang, Q.: Recent increases in tropical cyclone rapid intensification events in global offshore regions, Nat. Commun., 14, 5167, https://doi.org/10.1038/s41467-023-40605-2, 2023.
Liu, Y., Zhuo, L., and Han, D.: Developing spin-up time framework for WRF extreme precipitation simulations, J. Hydrol., 620, 129443, https://doi.org/10.1016/j.jhydrol.2023.129443, 2023.
Lu, J., Feng, T., Li, J., Cai, Z., Xu, X., Li, L., and Li, J.: Impact of Assimilating Himawari-8-Derived Layered Precipitable Water With Varying Cumulus and Microphysics Parameterization Schemes on the Simulation of Typhoon Hato, J. Geophys. Res.-Atmos., 124, 3050–3071, https://doi.org/10.1029/2018JD029364, 2019.
Lu, X., Yu, H., Ying, M., Zhao, B., Zhang, S., Lin, L., Bai, L., and Wan, R.: Western North Pacific Tropical Cyclone Database Created by the China Meteorological Administration, Adv. Atmos. Sci., 38, 690–699, https://doi.org/10.1007/s00376-020-0211-7, 2021.
Lui, Y. S., Tse, L. K. S., Tam, C.-Y., Lau, K. H., and Chen, J.: Performance of MPAS-A and WRF in predicting and simulating western North Pacific tropical cyclone tracks and intensities, Theor. Appl. Climatol., 143, 505–520, https://doi.org/10.1007/s00704-020-03444-5, 2021.
Ma, Z., Fei, J., Huang, X., and Cheng, X.: The effects of ocean feedback on tropical cyclone energetics under idealized air-sea interaction conditions: OCEAN FEEDBACK ON TC ENERGETICS, J. Geophys. Res.-Atmos., 118, 9778–9788, https://doi.org/10.1002/jgrd.50780, 2013.
Ma, Z., Fei, J., Huang, X., and Cheng, X.: Contributions of Surface Sensible Heat Fluxes to Tropical Cyclone. Part I: Evolution of Tropical Cyclone Intensity and Structure, J. Atmos. Sci., 72, 120–140, https://doi.org/10.1175/JAS-D-14-0199.1, 2015.
Mai, X., Qiu, X., Yang, Y., and Ma, Y.: Impacts of Spectral Nudging Parameters on Dynamical Downscaling in Summer over Mainland China, Front. Earth Sci., 8, 574754, https://doi.org/10.3389/feart.2020.574754, 2020.
Mlawer, E. J., Taubman, S. J., Brown, P. D., Iacono, M. J., and Clough, S. A.: Radiative transfer for inhomogeneous atmospheres: RRTM, a validated correlated-k model for the longwave, J. Geophys. Res.-Atmos., 102, 16663–16682, https://doi.org/10.1029/97JD00237, 1997.
Moon, J., Cha, D., Lee, M., and Kim, J.: Impact of Spectral Nudging on Real-Time Tropical Cyclone Forecast, J. Geophys. Res.-Atmos., 123, 12647–12660, https://doi.org/10.1029/2018JD028550, 2018.
Mooney, P. A., Mulligan, F. J., Bruyère, C. L., Parker, C. L., and Gill, D. O.: Investigating the performance of coupled WRF-ROMS simulations of Hurricane Irene (2011) in a regional climate modeling framework, Atmos. Res., 215, 57–74, https://doi.org/10.1016/j.atmosres.2018.08.017, 2019.
Mori, N., Kato, M., Kim, S., Mase, H., Shibutani, Y., Takemi, T., Tsuboki, K., and Yasuda, T.: Local amplification of storm surge by Super Typhoon Haiyan in Leyte Gulf, Geophys. Res. Lett., 41, 5106–5113, https://doi.org/10.1002/2014GL060689, 2014.
Murakami, H., Vecchi, G. A., Delworth, T. L., Wittenberg, A. T., Underwood, S., Gudgel, R., Yang, X., Jia, L., Zeng, F., Paffendorf, K., and Zhang, W.: Dominant Role of Subtropical Pacific Warming in Extreme Eastern Pacific Hurricane Seasons: 2015 and the Future, J. Climate, 30, 243–264, https://doi.org/10.1175/JCLI-D-16-0424.1, 2017.
Omrani, H., Drobinski, P., and Dubos, T.: Spectral nudging in regional climate modelling: how strongly should we nudge?, Q. J. Roy. Meteor. Soc., 138, 1808–1813, https://doi.org/10.1002/qj.1894, 2012.
Potty, J., Oo, S. M., Raju, P. V. S., and Mohanty, U. C.: Performance of nested WRF model in typhoon simulations over West Pacific and South China Sea, Nat. Hazards, 63, 1451–1470, https://doi.org/10.1007/s11069-011-0074-4, 2012.
Raktham, C., Bruyère, C., Kreasuwun, J., Done, J., Thongbai, C., and Promnopas, W.: Simulation sensitivities of the major weather regimes of the Southeast Asia region, Clim. Dynam., 44, 1403–1417, https://doi.org/10.1007/s00382-014-2156-y, 2015.
Seneviratne, S. I., Zhang, X., Adnan, M., Badi, W., Dereczynski, C., Di Luca, A., Ghosh, S., Iskandar, I., Kossin, J., Lewis, S., Otto, F., Pinto, I., Satoh, M., Vicente-Serrano, S. M., Wehner, M., and Zhou, B.: Weather and Climate Extreme Events in a Changing Climate. In Climate Change 2021: The Physical Science Basis. Contribution of Working Group I to the Sixth Assessment Report of the Intergovernmental Panel on Climate Change, edited by: Masson-Delmotte, V., Zhai, P., Pirani, A., Connors, S. L., Péan, C., Berger, S., Caud, N., Chen, Y., Goldfarb, L., Gomis, M. I., Huang, M., Leitzell, K., Lonnoy, E., Matthews, J. B. R., Maycock, T. K., Waterfield, T., Yelekçi, O., Yu, R., and Zhou, B., Cambridge University Press, Cambridge, United Kingdom and New York, NY, USA, 1513–1766, https://doi.org/10.1017/9781009157896.013, 2021.
Shepherd, T. J. and Walsh, K. J.: Sensitivity of hurricane track to cumulus parameterization schemes in the WRF model for three intense tropical cyclones: impact of convective asymmetry, Meteorol. Atmos. Phys., 129, 345–374, https://doi.org/10.1007/s00703-016-0472-y, 2017.
Simpson, R. H.: The hurricane disaster – Potential scale, Weatherwise, 27, 169–186, https://doi.org/10.1080/00431672.1974.9931702, 1974.
Skamarock, W. C., Klemp, J. B., Dudhia, J., Gill, D. O., Liu, Z., Berner, J., Wang, W., Powers, J. G., Duda, M. G., Barker, D. M., and Huang, X.-Y.: A Description of the Advanced Research WRF Model Version 4, UCAR/NCAR [code], https://doi.org/10.5065/1DFH-6P97, 2019.
Statistical Bureau of Guangdong Province: 2021 Guangdong Province National Economic and Social Development Statistical Bulletin, http://district.ce.cn/newarea/roll/202203/04/t20220304_37376155.shtml (last access: 14 February 2024), 2022.
Sun, J., He, H., Hu, X., Wang, D., Gao, C., and Song, J.: Numerical Simulations of Typhoon Hagupit (2008) Using WRF, Weather Forecast., 34, 999–1015, https://doi.org/10.1175/WAF-D-18-0150.1, 2019.
Sun, Y., Yi, L., Zhong, Z., Hu, Y., and Ha, Y.: Dependence of model convergence on horizontal resolution and convective parameterization in simulations of a tropical cyclone at gray-zone resolutions: RESOLUTION AND CONVECTION IN TC SIMULATION, J. Geophys. Res.-Atmos., 118, 7715–7732, https://doi.org/10.1002/jgrd.50606, 2013.
Sun, Y., Zhong, Z., and Lu, W.: Sensitivity of Tropical Cyclone Feedback on the Intensity of the Western Pacific Subtropical High to Microphysics Schemes, J. Atmos. Sci., 72, 1346–1368, https://doi.org/10.1175/JAS-D-14-0051.1, 2015.
Tang, D. L. and Sui, G. J.: Typhoon Impact and Crisis Management, Springer-Verlag, Berlin, Heidelberg, https://doi.org/10.1007/978-3-642-40695-9, 2014.
Thompson, G., Field, P. R., Rasmussen, R. M., and Hall, W. D.: Explicit Forecasts of Winter Precipitation Using an Improved Bulk Microphysics Scheme. Part II: Implementation of a New Snow Parameterization, Mon. Weather Rev., 136, 5095–5115, https://doi.org/10.1175/2008MWR2387.1, 2008.
Wang, S. and Toumi, R.: More Tropical Cyclones Are Striking Coasts with Major Intensities at Landfall, Sci. Rep.-UK, 12, 5236, https://doi.org/10.1038/s41598-022-09287-6, 2022.
Wang, Y.: A dataset of typhoon tracks in offshore China (1945–2022), Marine science data center of the Chinese Academy of Sciences [data set], https://doi.org/10.12157/IOCAS.20210804.001, 2023.
Xu, F., Yuan, H., Lin, L., and Chen, W.: Convective-scale ensemble forecasts of the heavy precipitation of Typhoon Lekima (2019) in Zhejiang Province, Atmos. Res., 283, 106543, https://doi.org/10.1016/j.atmosres.2022.106543, 2023.
Ying, M., Zhang, W., Yu, H., Lu, X., Feng, J., Fan, Y., Zhu, Y., and Chen, D.: An Overview of the China Meteorological Administration Tropical Cyclone Database, J. Atmos. Ocean. Tech., 31, 287–301, https://doi.org/10.1175/JTECH-D-12-00119.1, 2014.
Zhang, C. and Wang, Y.: Why is the simulated climatology of tropical cyclones so sensitive to the choice of cumulus parameterization scheme in the WRF model?, Clim. Dynam., 51, 3613–3633, https://doi.org/10.1007/s00382-018-4099-1, 2018.
Zhang, D. and Anthes, R. A.: A High-Resolution Model of the Planetary Boundary Layer – Sensitivity Tests and Comparisons with SESAME-79 Data, J. Appl. Meteorol., 21, 1594–1609, https://doi.org/10.1175/1520-0450(1982)021<1594:AHRMOT>2.0.CO;2, 1982.
Zhang, H., Shen, Y., and Tang, J.: Wave and storm surge evolutions in the Pearl River Estuary with large-scale land reclamation impacts, Ocean Eng., 273, 113977, https://doi.org/10.1016/j.oceaneng.2023.113977, 2023.
Zhang, X., Duan, Y., Wang, Y., Wei, N., and Hu, H.: A high-resolution simulation of Supertyphoon Rammasun (2014) – Part I: Model verification and surface energetics analysis, Adv. Atmos. Sci., 34, 757–770, https://doi.org/10.1007/s00376-017-6255-7, 2017.
Zhang, Z., Arnault, J., Wagner, S., Laux, P., and Kunstmann, H.: Impact of Lateral Terrestrial Water Flow on Land-Atmosphere Interactions in the Heihe River Basin in China: Fully Coupled Modeling and Precipitation Recycling Analysis, J. Geophys. Res.-Atmos., 124, 8401–8423, https://doi.org/10.1029/2018JD030174, 2019.
Zhang, Z., Arnault, J., Laux, P., Ma, N., Wei, J., and Kunstmann, H.: Diurnal cycle of surface energy fluxes in high mountain terrain: High-resolution fully coupled atmosphere-hydrology modelling and impact of lateral flow, Hydrol. Process., 35, e14454, https://doi.org/10.1002/hyp.14454, 2021.
Zhang, Z., Arnault, J., Laux, P., Ma, N., Wei, J., Shang, S., and Kunstmann, H.: Convection-permitting fully coupled WRF-Hydro ensemble simulations in high mountain environment: impact of boundary layer- and lateral flow parameterizations on land–atmosphere interactions, Clim. Dynam., 59, 1355–1376, https://doi.org/10.1007/s00382-021-06044-9, 2022.
Zhang, Z., Laux, P., Baade, J., Arnault, J., Wei, J., Wang, X., Liu, Y., Schmullius, C., and Kunstmann, H.: Impact of alternative soil data sources on the uncertainties in simulated land-atmosphere interactions, Agr. Forest Meteorol., 339, 109565, https://doi.org/10.1016/j.agrformet.2023.109565, 2023.