the Creative Commons Attribution 4.0 License.
the Creative Commons Attribution 4.0 License.
 | 16 Feb 2024
Soil water sources and their implications for vegetation restoration in the Three-Rivers Headwater Region during different ablation periods
Zongxing Li
Juan Gui
Qiao Cui
Jian Xue
Fa Du
Lanping Si
Amid global warming, the timely supplementation of soil water is crucial for the effective restoration and protection of the ecosystem. It is therefore of great importance to understand the temporal and spatial variations of soil water sources. The research collected 2451 samples of soil water, precipitation, river water, ground ice, supra-permafrost water, and glacier snow meltwater in June, August, and September 2020. The goal was to quantify the contribution of various water sources to soil water in the Three-Rivers Headwater Region (China) during different ablation periods. The findings revealed that precipitation, ground ice, and snow meltwater constituted approximately 72 %, 20 %, and 8 % of soil water during the early ablation period. The snow is fully liquefied during the latter part of the ablation period, with precipitation contributing approximately 90 % and 94 % of soil water, respectively. These recharges also varied markedly with altitude and vegetation type. The study identified several influencing factors on soil water sources, including temperature, precipitation, vegetation, evapotranspiration, and the freeze–thaw cycle. However, soil water loss will further exacerbate vegetation degradation and pose a significant threat to the ecological security of the “Chinese Water Tower”. It emphasizes the importance of monitoring soil water, addressing vegetation degradation related to soil water loss, and determining reasonable soil and water conservation and vegetation restoration models.
- Article
(7530 KB) - Full-text XML
-
Supplement
(616 KB) - BibTeX
- EndNote


Soil water is an important water resource, forming a link between precipitation, surface water, and groundwater, and is an essential component in the formation, transformation, and consumption of water resources. It substantially impacts regional water resource distribution patterns, the ecosystem, and river runoff as key factors in terrestrial hydrological cycles and environmental succession (Beyer et al., 2018; Cheng, 2020; Liu et al., 2023; Tan et al., 2017). Soil water plays a fundamental role in controlling the exchange of water and heat between the land surface and atmosphere, which has been widely applied to study regional microclimates, energy, and material balance, and global climate change (Spennemann et al., 2018; Sprenger et al., 2017; Lin et al., 2023). Moreover, soil water is directly involved in physiological activities and promotes productivity and carbon sequestration capacity. It is sensitive to the interactions between soil and vegetation that alters soil physicochemical properties, internal structures, and material composition (Geris et al., 2017; Li et al., 2017; Marchionni et al., 2021). Consequently, soil water sources can be affected by many factors, such as climate, vegetation, soil type, and topography (Martínez García et al., 2014; Sun et al., 2023). Understanding the spatial–temporal changes in soil water sources is essential for better protection of water and the environment. Thus, studying soil water sources has become a hot topic in international hydrology and soil science.
Research on soil water has progressed in a series of studies related to hydro-meteorological, hydro-climatological, ecological, and biogeochemical processes. Permafrost can affect inter-annual changes in soil water, and its degradation, including the increasing active layer thickness and disappearance, would decrease ecosystem resilience (G. Liu et al., 2021). Soil water has also been extensively studied in the Three-Rivers Headwater Region (TRHR) (Li et al., 2020; Wang et al., 2012; Song et al., 2019). Cao and Jin (2021) analyzed the distribution characteristics of soil water and its relationship with temperature and precipitation in the TRHR. Precipitation has a more pronounced impact on soil water in the alpine steppe compared to the alpine meadow, particularly in lower-altitude areas. Chen et al. (2021) constructed the spatial–temporal changes in soil water and its influencing factors from 2003 to 2020. Xiang et al. (2016) analyzed the groundwater storage changes and their influence on soil water in the TRHR. Guo et al. (2022) concluded that the main factors influencing soil water changes in the headwater region of the Yellow River were the normalized vegetation index (NDVI) and precipitation, followed by air temperature and wind speed. Land degradation significantly reduced soil water by 4.5 %–6.1 % at a depth of 0–100 cm and increased the annual mean soil surface temperature by 0.8 ∘C under global warming in this region (Xue et al., 2017).
The TRHR is undergoing a glacier retreat, permafrost degradation, precipitation increase, snowfall decrease, water conservation decreases, and soil erosion intensification with global warming (Li et al., 2021). These changes have caused large fluctuations in soil water, bringing great uncertainty to vegetation growth and causing challenges in vegetation restoration. Thus, there is an urgent need to quantify soil water sources to improve the effectiveness of ecological restoration in permafrost regions.
However, field observations are too sparse to satisfy the need for quantifying soil water sources in the TRHR. As natural tracers, stable isotopes can be applied in water cycle studies to trace precipitation, soil water, groundwater, and plant water (Wang, 2021). Monitoring the stable isotope characteristics of soil water could provide information about water sources, changes in soil water, and moisture cycling (Sprenger et al., 2017). Using 2451 samples of soil water, precipitation, river water, ground ice, supra-permafrost water, and glacier snow meltwater collected in June, August, and September 2020, this study (a) analyzed the spatiotemporal distribution of δ2H and δ18O in soil water at different ablation stages, (b) determined the hydrological processes of soil water and its variation, (c) quantified the major sources and their contributions to soil water, and (d) confirmed the corresponding implications for ecosystem protection. The result presents new observational evidence of soil water sources in the “Chinese Water Tower”. It provides a scientific basis for establishing a complex interplay between soil, water, and vegetation as a theoretical basis for developing water–soil conservation and vegetation restoration programs in cold regions, especially in the permafrost region.
2.1 Study region
The Three-Rivers Headwater Region (TRHR) (31∘39′–36∘12′ N, 89∘45′–102∘23′ E; 2610–6920 m a.s.l.) is the source region of the Yangtze River (YZR), Yellow River (YLR), and Lancangjiang River (LCR) and is a significant freshwater resource in China and Asia (Fig. 1). The TRHR is 36.3×10⁴ km2 and accounts for approximately 50.4 % of the total area of Qinghai Province. The region has a plateau continental climate, with an annual average temperature of −5.38 to 4.14∘ and annual precipitation of 262.2–772.8 mm. The radiation is abundant, with total annual sunlight as high as 2300–2900 h due to the high altitude. The permafrost is extensively developed and is well distributed in the YZR, with a depth averaging between 50 and 120 m, whereas the permafrost is discontinuous and sporadic, with a depth below 50 m in the YLR and LCR (Zhang et al., 2001). The YLR, YZR, and LCR cover 167 000, 159 000, and 37 000 km2, accounting for 46 %, 44 %, and 10 % of the total area of the TRHR, respectively. The YLR, YZR, and LCR contribute approximately 49 %, 25 %, and 15 % of the total runoff and supply up to 600×108 m3 a−1 in freshwater resources. Additionally, more than 180 rivers, 1800 lakes, 2000×108 m3 of glaciers, and 73 300 km2 of wetlands are found in the TRHR. Protecting the ecosystems of the TRHR and maintaining and improving their water–soil conservation functions and water containment are of vital importance to the stable supply of water resources, as well as to climate stability, ecological security, and sustainable economic and social development throughout Asia. The country's largest national park, the Three-Rivers Headwater National Park, was established as a restorative practice region for constructing an eco-friendly society and beautifying China.
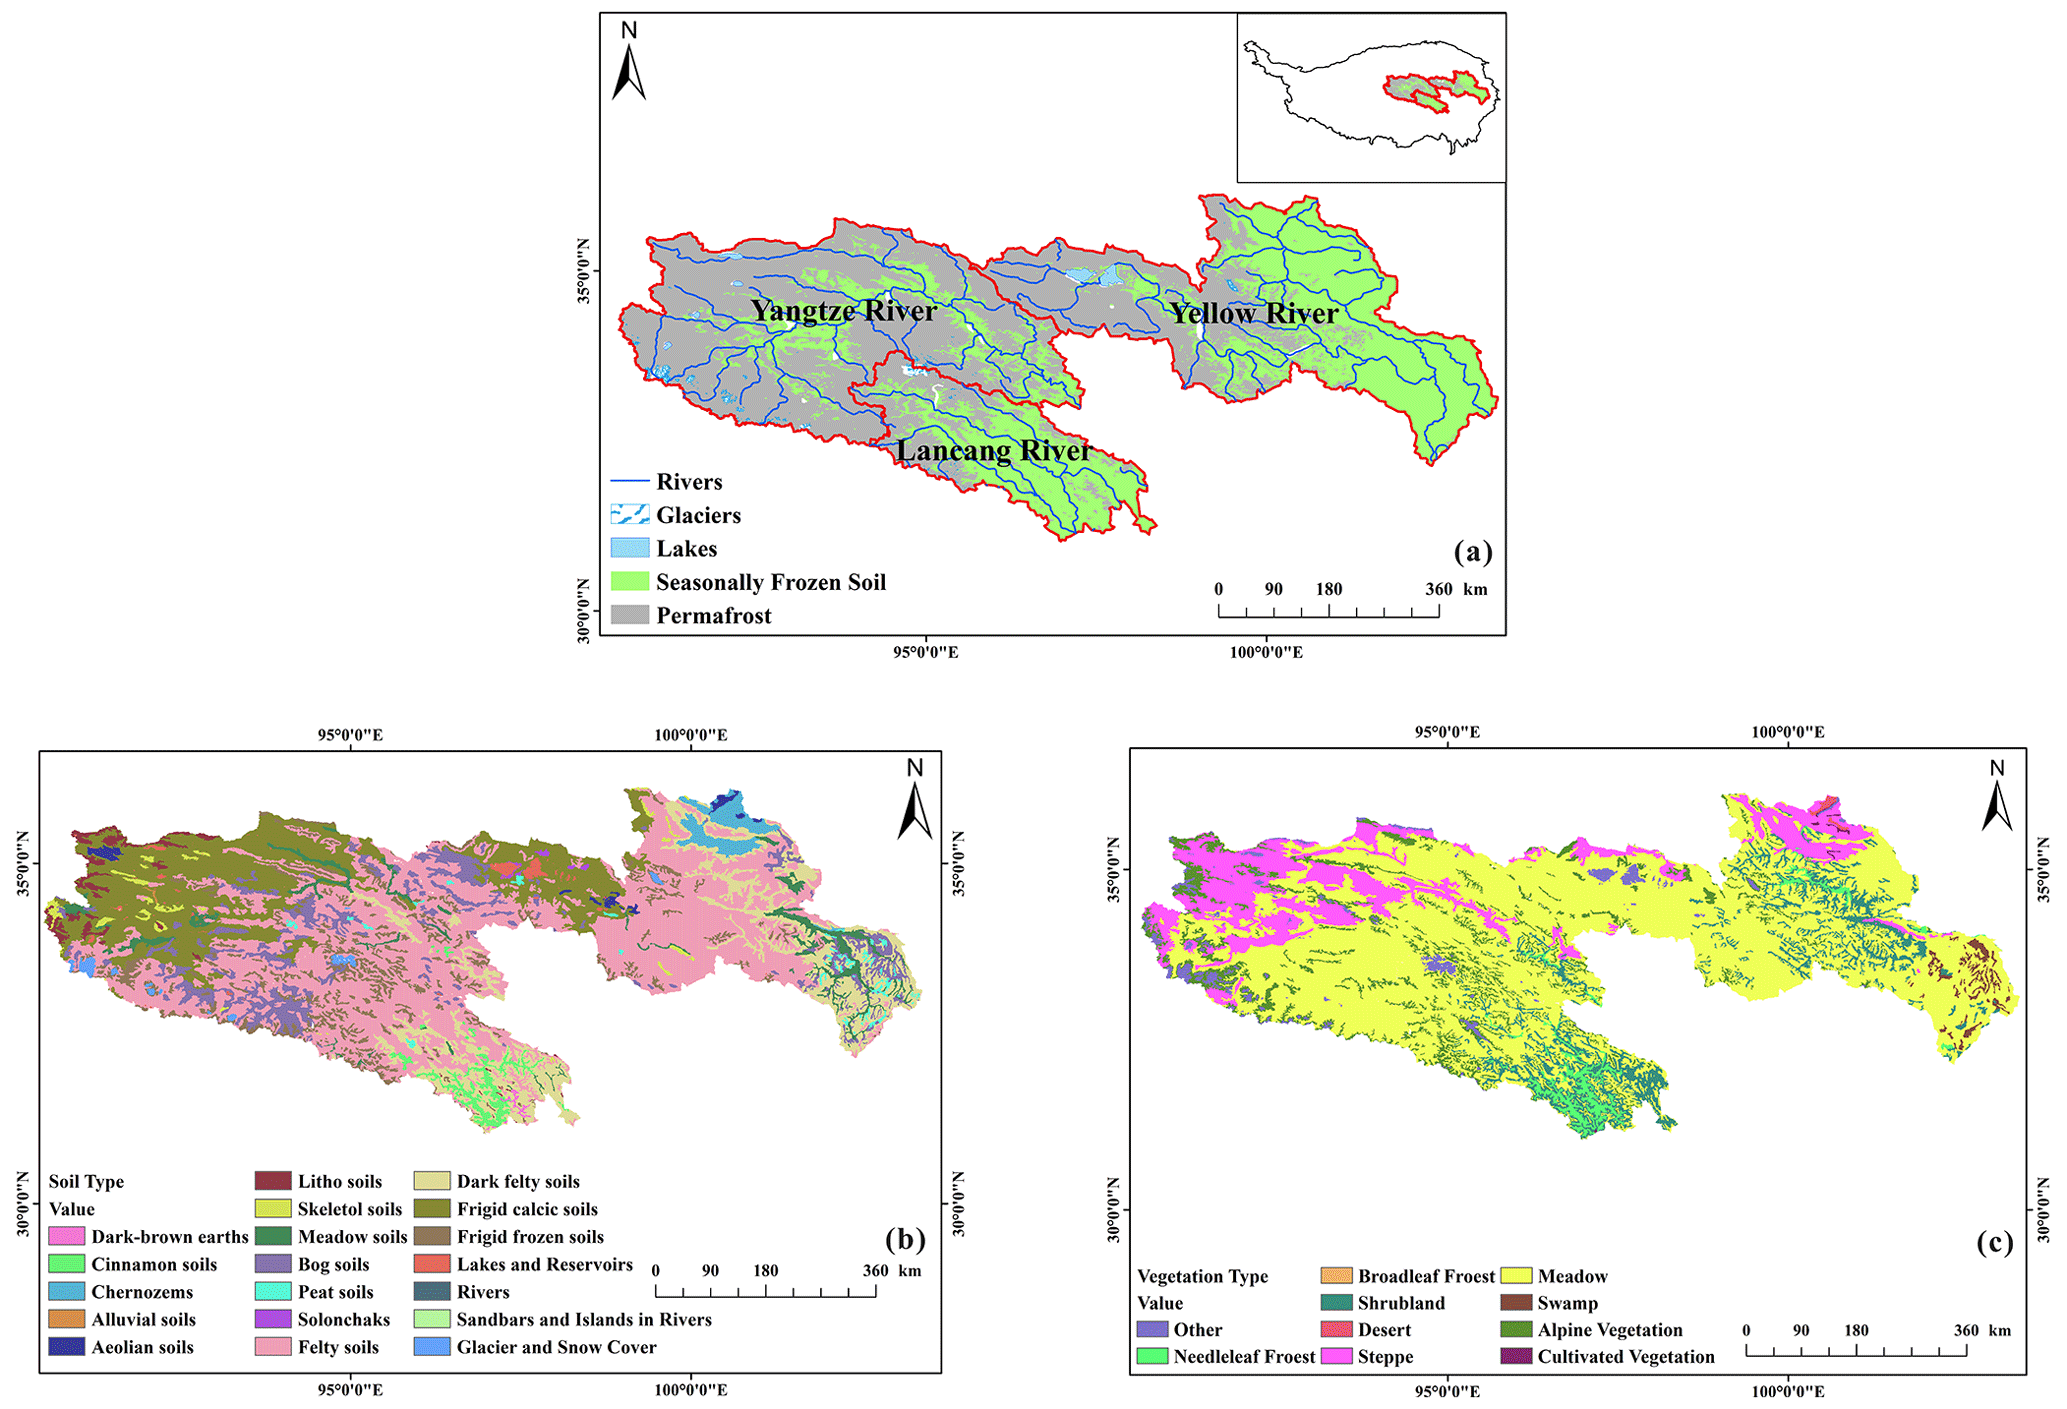
Figure 1Distribution maps of permafrost and seasonal frozen soil (a), soil types (b), and vegetation types (c) in the study region.
Grasslands are the main ecosystems in the TRHR and comprise approximately 70 % of the regional vegetation area. The grasses are typical for alpine meadows and alpine steppes, dominated by Kobresia capillifolia, Kobresia humilis, Stipa purpurea, Elymus dahuricus, etc. Other vegetation types are temperate steppe and alpine desert with small distributions, dominated by Stipa spp., Achnatherum splendens, Carex spp., Thylacospermum caespitosum, Androsace tapete, Oxytropis sp., and Saussurea subulata, respectively (Fan et al., 2010). The ecosystems in the TRHR are characterized by diversity, fragility, sensitivity, and weak carrying and restoration capacities. Most of the soils are thin and coarse in texture. From high altitude to low altitude, the soil types are alpine desert soil, alpine meadow soil, alpine steppe soil, mountain meadow soil, grey-cinnamon soil, castanozems, and mountain forest soil, respectively. The alpine meadow soil is the primary soil type in the region, and other intrazonal soils are also commonly developed.
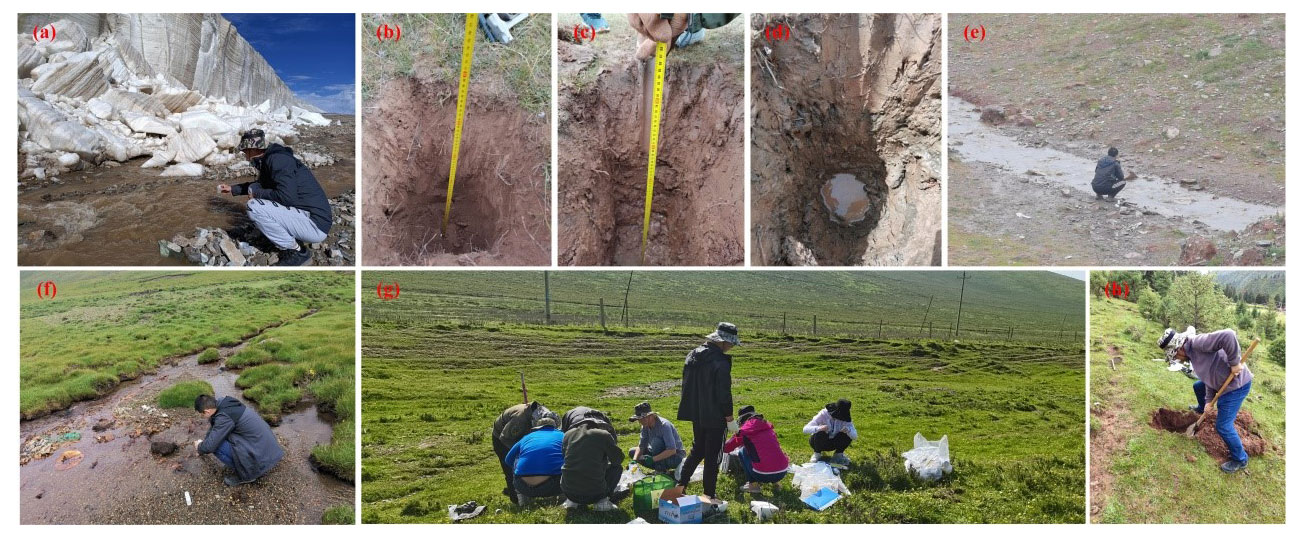
Figure 2The work photo for sampling glacier snow meltwater (a), soil in grassland (b), soil in meadow (c), supra-permafrost water (d), river water (e), tributary water (f), vegetation (g), and soil in forests (h).
2.2 Data and methods
2.2.1 Samples: collection and preparation
Primary data were collected through fieldwork in June, August, and September 2020. It was used to explore seasonal patterns and their influence on soil and water sources. A scientific understanding of vegetation restoration in the Chinese Water Tower (Fig. 2) was developed from these soil–water source data. A total collection of 2451 samples included soil water, ground ice, precipitation, river water, supra-permafrost water, and glacier snow meltwater in the TRHR, with spatial and temporal frequency sampling (Fig. 3). The sampling details are described in the following sections:
-
Soil samples. The soil profile was excavated, and its thickness was determined based on the actual thickness of the soil layer. Samples were collected at 20 cm intervals from 79, 70, and 93 sampling sites in June, August, and September, respectively (Fig. 3). Meanwhile, soil temperature was measured in ∘C, and the test range was from −40 to 100 ∘C, ±0.5 ∘C. Soil moisture was measured as a % (m3 m−3), with a test range of 0 % to 100 % and a response time of less than 2 s. Three parallel samples were collected from each layer for soil water stable isotope analysis. The samples were collected from 2 cm below the surface to avoid being affected by contact with the atmosphere. For preservation, a total of 741 soil samples were collected and stored in HDPE bottles sealed with parafilm.
-
Precipitation samples. At Zhimenda (34.14∘ N, 92.26∘ E; 3540 m), Tuotuohe (34.22∘ N, 92.24∘ E; 4533 m), Zaduo (32.53∘ N, 95.17∘ E; 4066.4 m), Dari (33.45∘ N, 99.39∘ E; 3967 m), and Maduo (34.55∘ N, 98.13∘ E; 4272.3 m) stations, a total of 375 precipitation event-scale samples were collected from June 2019 to July (Fig. 3). All precipitation occurring from 20:00 LT on the first day of the event to 20:00 LT the next day was collected. During sample collection, precipitation, air temperature, wind speed, and relative humidity were recorded at the corresponding national meteorological stations. To avoid evaporation, the sample was collected immediately after the event.
-
Ground ice. To collect ground ice samples, a 1 m deep soil profile of the active permafrost layer was dug at each of the sampling sites to locate permafrost ground ice (Fig. 3). In June, August, and September, 66, 40, and 37 ground ice samples were obtained, respectively. These samples were preserved in pre-cleaned HDPE bottles sealed with parafilm and kept frozen. The outer layer of each ice sample was chipped off to avoid contamination from the soil.
-
River water. River water (259, 231, and 186 samples in June, August, and September, respectively) was collected to analyze the spatial and temporal relationship between soil and river water. River water samples were collected 20 cm below the river surface and stored in HDPE bottles sealed with parafilm.
-
Supra-permafrost water. Supra-permafrost water is mainly stored in the active permafrost layer (Li et al., 2020). To study the hydraulic connection between supra-permafrost water and soil water, 125, 161, and 130 samples were collected at different altitudes during June, August, and September, respectively. First, a 1 m deep profile of the active permafrost layer was manually dug at each sampling site. Second, the collected water samples were immediately filtered with a 0.45 µm Millipore filtration membrane at the bottom of each profile and then stored in HDPE bottles sealed with parafilm.
-
Glacier snow meltwater. At Jianggudiru (33.45∘ N, 91∘ E; 5281 m), Dongkemadi (33∘ N, 92∘ E; 5423 m), and Yuzhufeng glaciers (35.63∘ N, 94.22∘ E; 5180 m) in the headwaters of the Yangtze River (Fig. 1); Halong glacier (34.62∘ N, 99.78∘ E; 5050 m) in the headwaters of the Yellow River; and Yangzigou glacier (33.46∘ N, 94.85∘ E; 5260 m) in the headwaters of the Lancangjiang River, 27, 32, and 41 samples were collected from streams flowing out of the glacier front during June, August, and September, respectively, and stored in HDPE bottles sealed with parafilm.
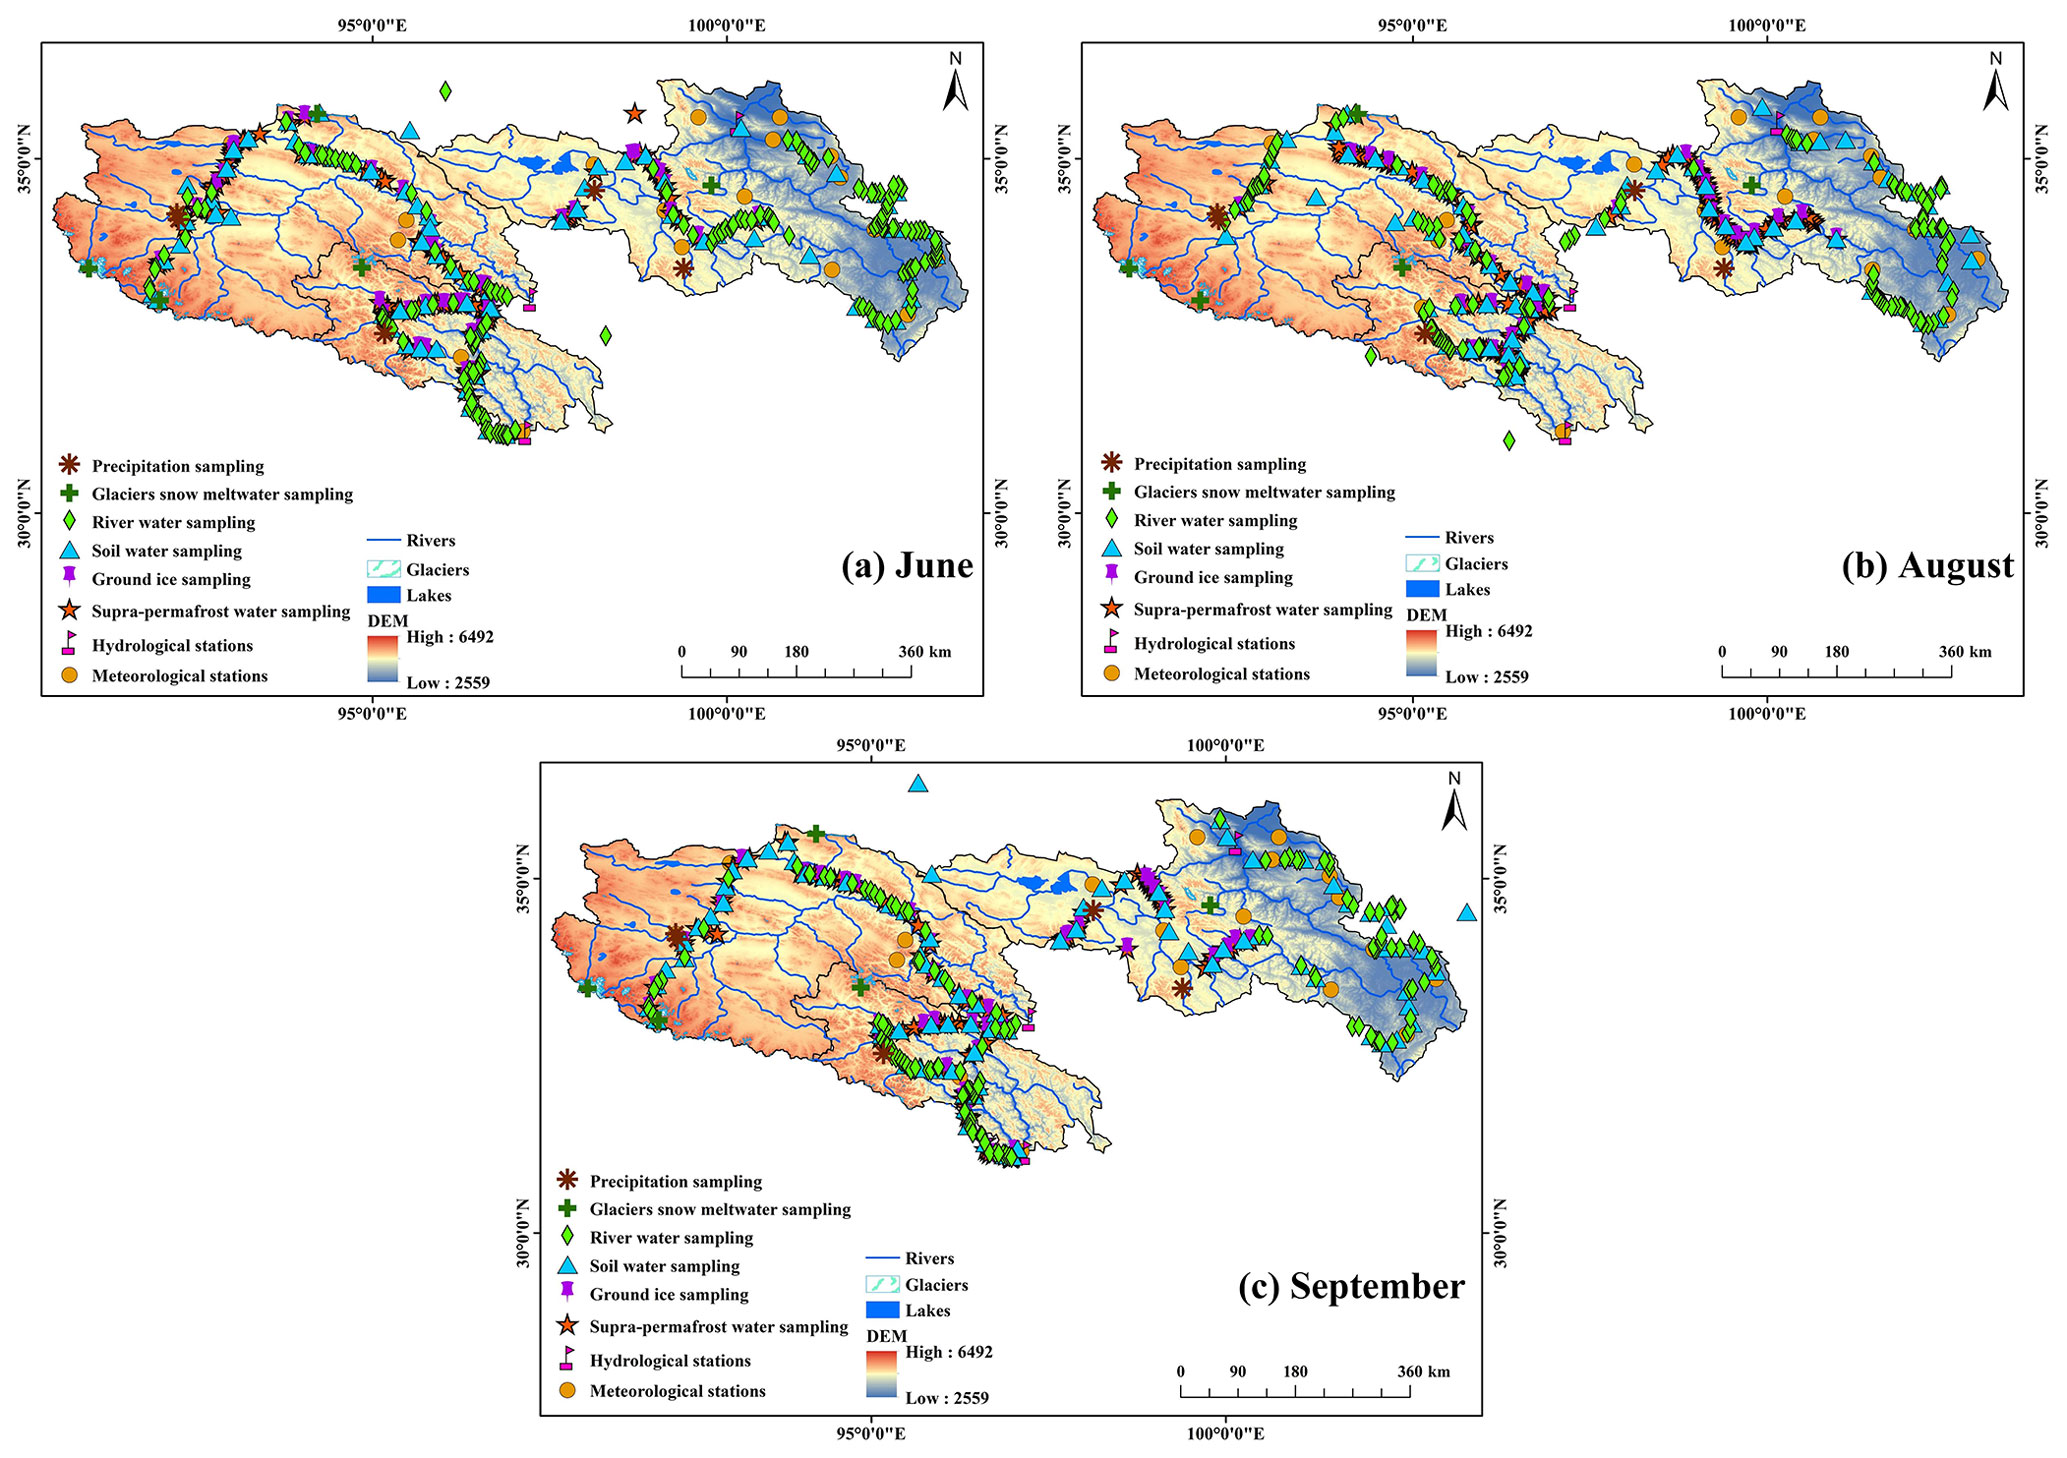
Figure 3Distribution of sampling sites for soils and waters in June (a), August (b), and September (c).
Before analysis, all samples were stored at 4 ∘C in a refrigerator, without evaporation. Soil water had to be extracted from the soil. We used a cryogenic freezing vacuum extraction system (LI-2000, Liga United Technology Co., Ltd., Beijing, China) to extract soil water, as it can achieve complete extraction and has high precision (Li et al., 2016). Test tubes containing soil samples were installed on the extraction line and frozen with liquid nitrogen. After 10 min, the line was checked to ensure no leaks. After it was completely sealed, the larger test tube was heated using a heating sleeve at 95 ∘C, and the smaller test tube was frozen with liquid nitrogen (−196 ∘C). Due to the temperature gradient, water vapor moved from the larger test tube to the smaller one and condensed into ice. The extraction process took 2 h and had an efficiency above 98 %. Water samples were analyzed for δ18O and 2H through laser absorption spectroscopy (DLT-100 liquid water isotope analyzer, Los Gatos Research, Mountain View, CA, USA) at the Key Laboratory of Ecohydrology of Inland River Basin, Northwest Institute of Eco-Environment and Resources, CAS. The results are reported relative to the Vienna Standard Mean Ocean Water (VSMOW). Measurement precisions for δ18O and δ2H were better than 0.5 ‰ and 0.2 ‰, respectively.
In addition, air temperature, precipitation, evaporation, and ground temperature in the TRHR were mainly obtained from the China Meteorological Data Network (http://data.cma.cn/, last access: 15 March 2023). The normalized vegetation index (NDVI) is derived from MODIS data, downloaded from the NASA website (https://search.earthdata.nasa.gov/, last access: 15 March 2023), with a spatial resolution of 0.05∘ and a temporal resolution of 16 d, and the data are given in HDF (hierarchical data format).
2.2.2 Tracer methods
The end-member mixing analysis (EMMA) tracer approach has been widely used for analyzing potential soil water sources (Li et al., 2016; Guan et al., 2010). The EMMA tracer method assumes that (i) the tracer concentration in a potential water source varies significantly in time and space, (ii) the chemical properties of the selected tracer are stable, and (iii) changes occur as a result of water mixing. Tracer techniques involve graphical analyses in which chemical and isotopic parameters represent the designated end members. Essentially, the changing composition of the studied water likely results from intersections during its passage through each landscape. Tracers can be used to determine the sources and flow paths. Both the two- and three-component methods can be described by a uniform equation:
where Qt is the total runoff discharge, Qm is the discharge of component m, and is the tracer j incorporated in the component m. In addition, the global meteoric water line (GMWL), local meteoric water line (LMWL), and evaporation line (LEL) have been used to analyze the relationship between soil water and other waters in the TRHR.
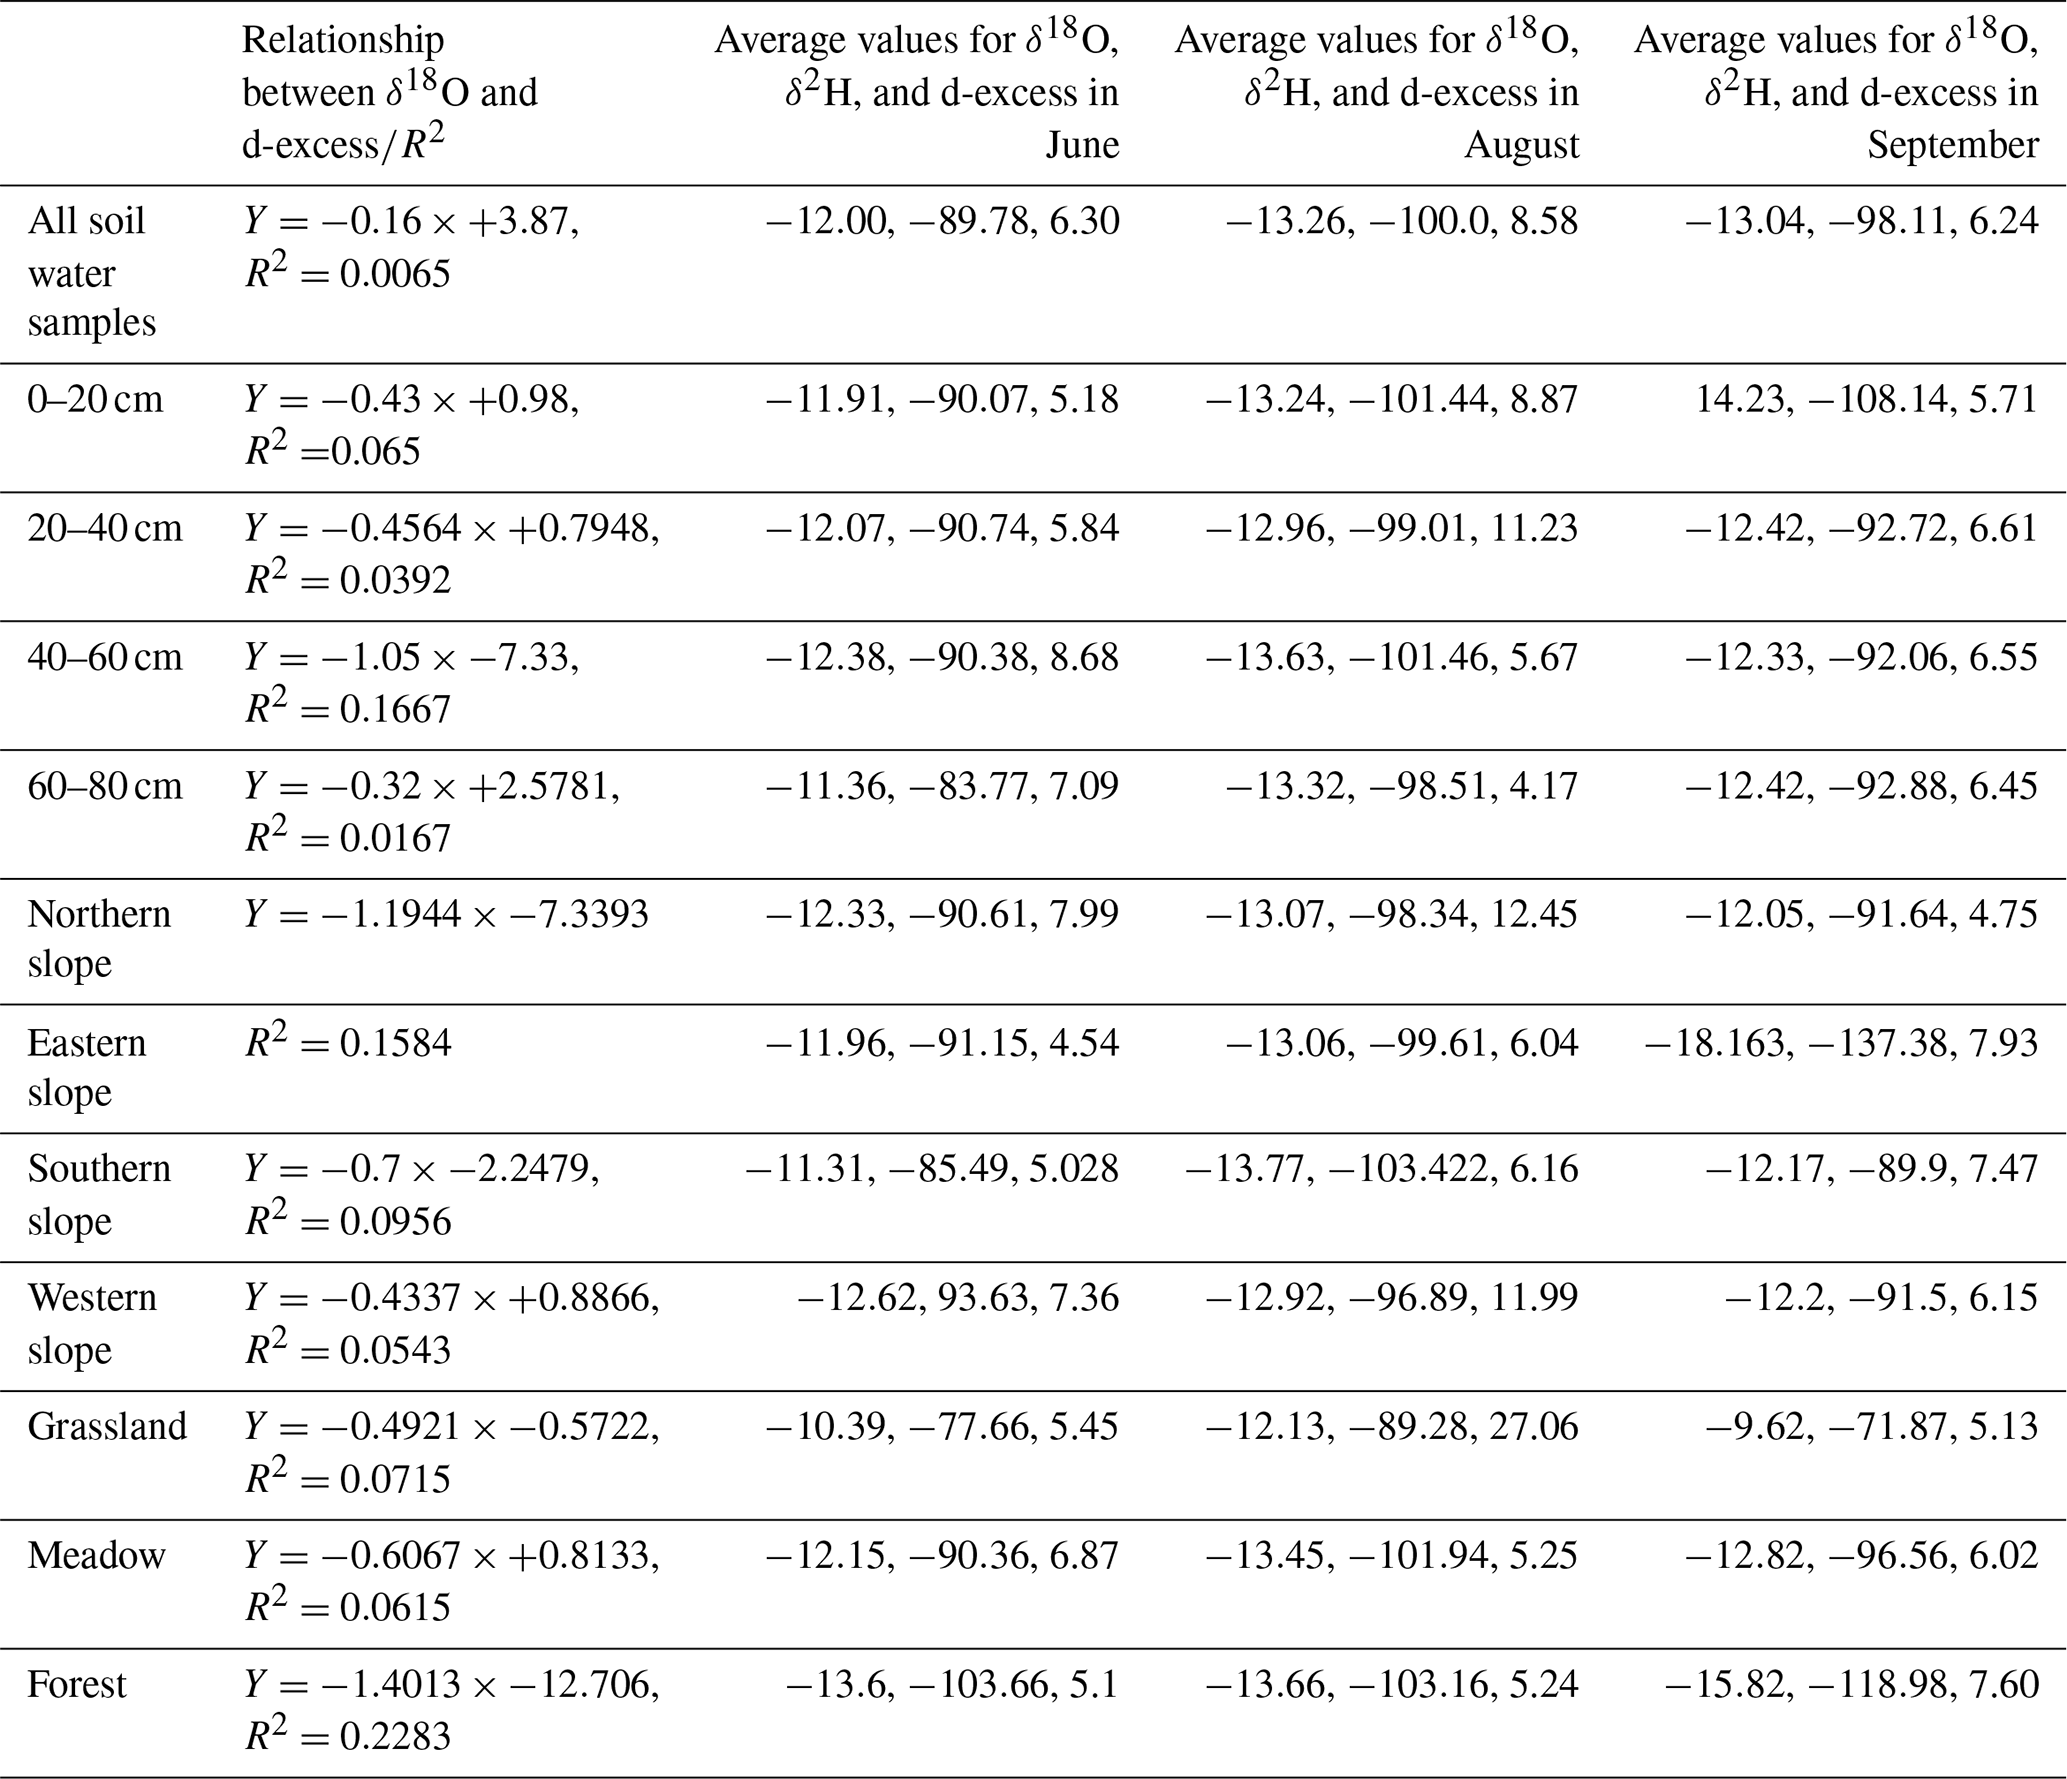
Table 1The average values of stable isotopes and relationship between δ18O and d-excess for soil waters in TRHR.
3.1 δ18O and δ2H of soil water in different ablation periods
Soil water stable isotopes showed significant changes in the early ablation period (June), the substantial ablation period (August), and the end of ablation (September). The average value of δ18O and δD was relatively higher in June and lower in August. It again became higher in September, while exhibiting an opposite trend for d-excess (Table 1). There were two reasons for this variation: (1) precipitation gradually increased in June, reaching a maximum in August, and then decreased, and (2) the effect of evapotranspiration on soil water also showed seasonal variations. Soil water stable isotopes in different ablation periods showed apparent regional differences, reflecting that precipitation was the main source of soil water and that differences in precipitation stable isotopes were reflected in the soil water. The temporal variation of stable isotopes in the 20–80 cm layer was progressively negative in the surface soil (0–20 cm). This was due to its high susceptibility to perturbation and environmental changes (Table 1). Soil water stable isotopes on the eastern slope were increasingly negative from June to September, while the other slope directions were consistent with the TRHR (Table 1). Moreover, the soil water isotopes in meadow and grassland areas were increasingly negative from the beginning to the end of ablation, while they were continuously negative in forest areas. These facts show the stochastic nature of soil and water changes as indicators of environmental changes.
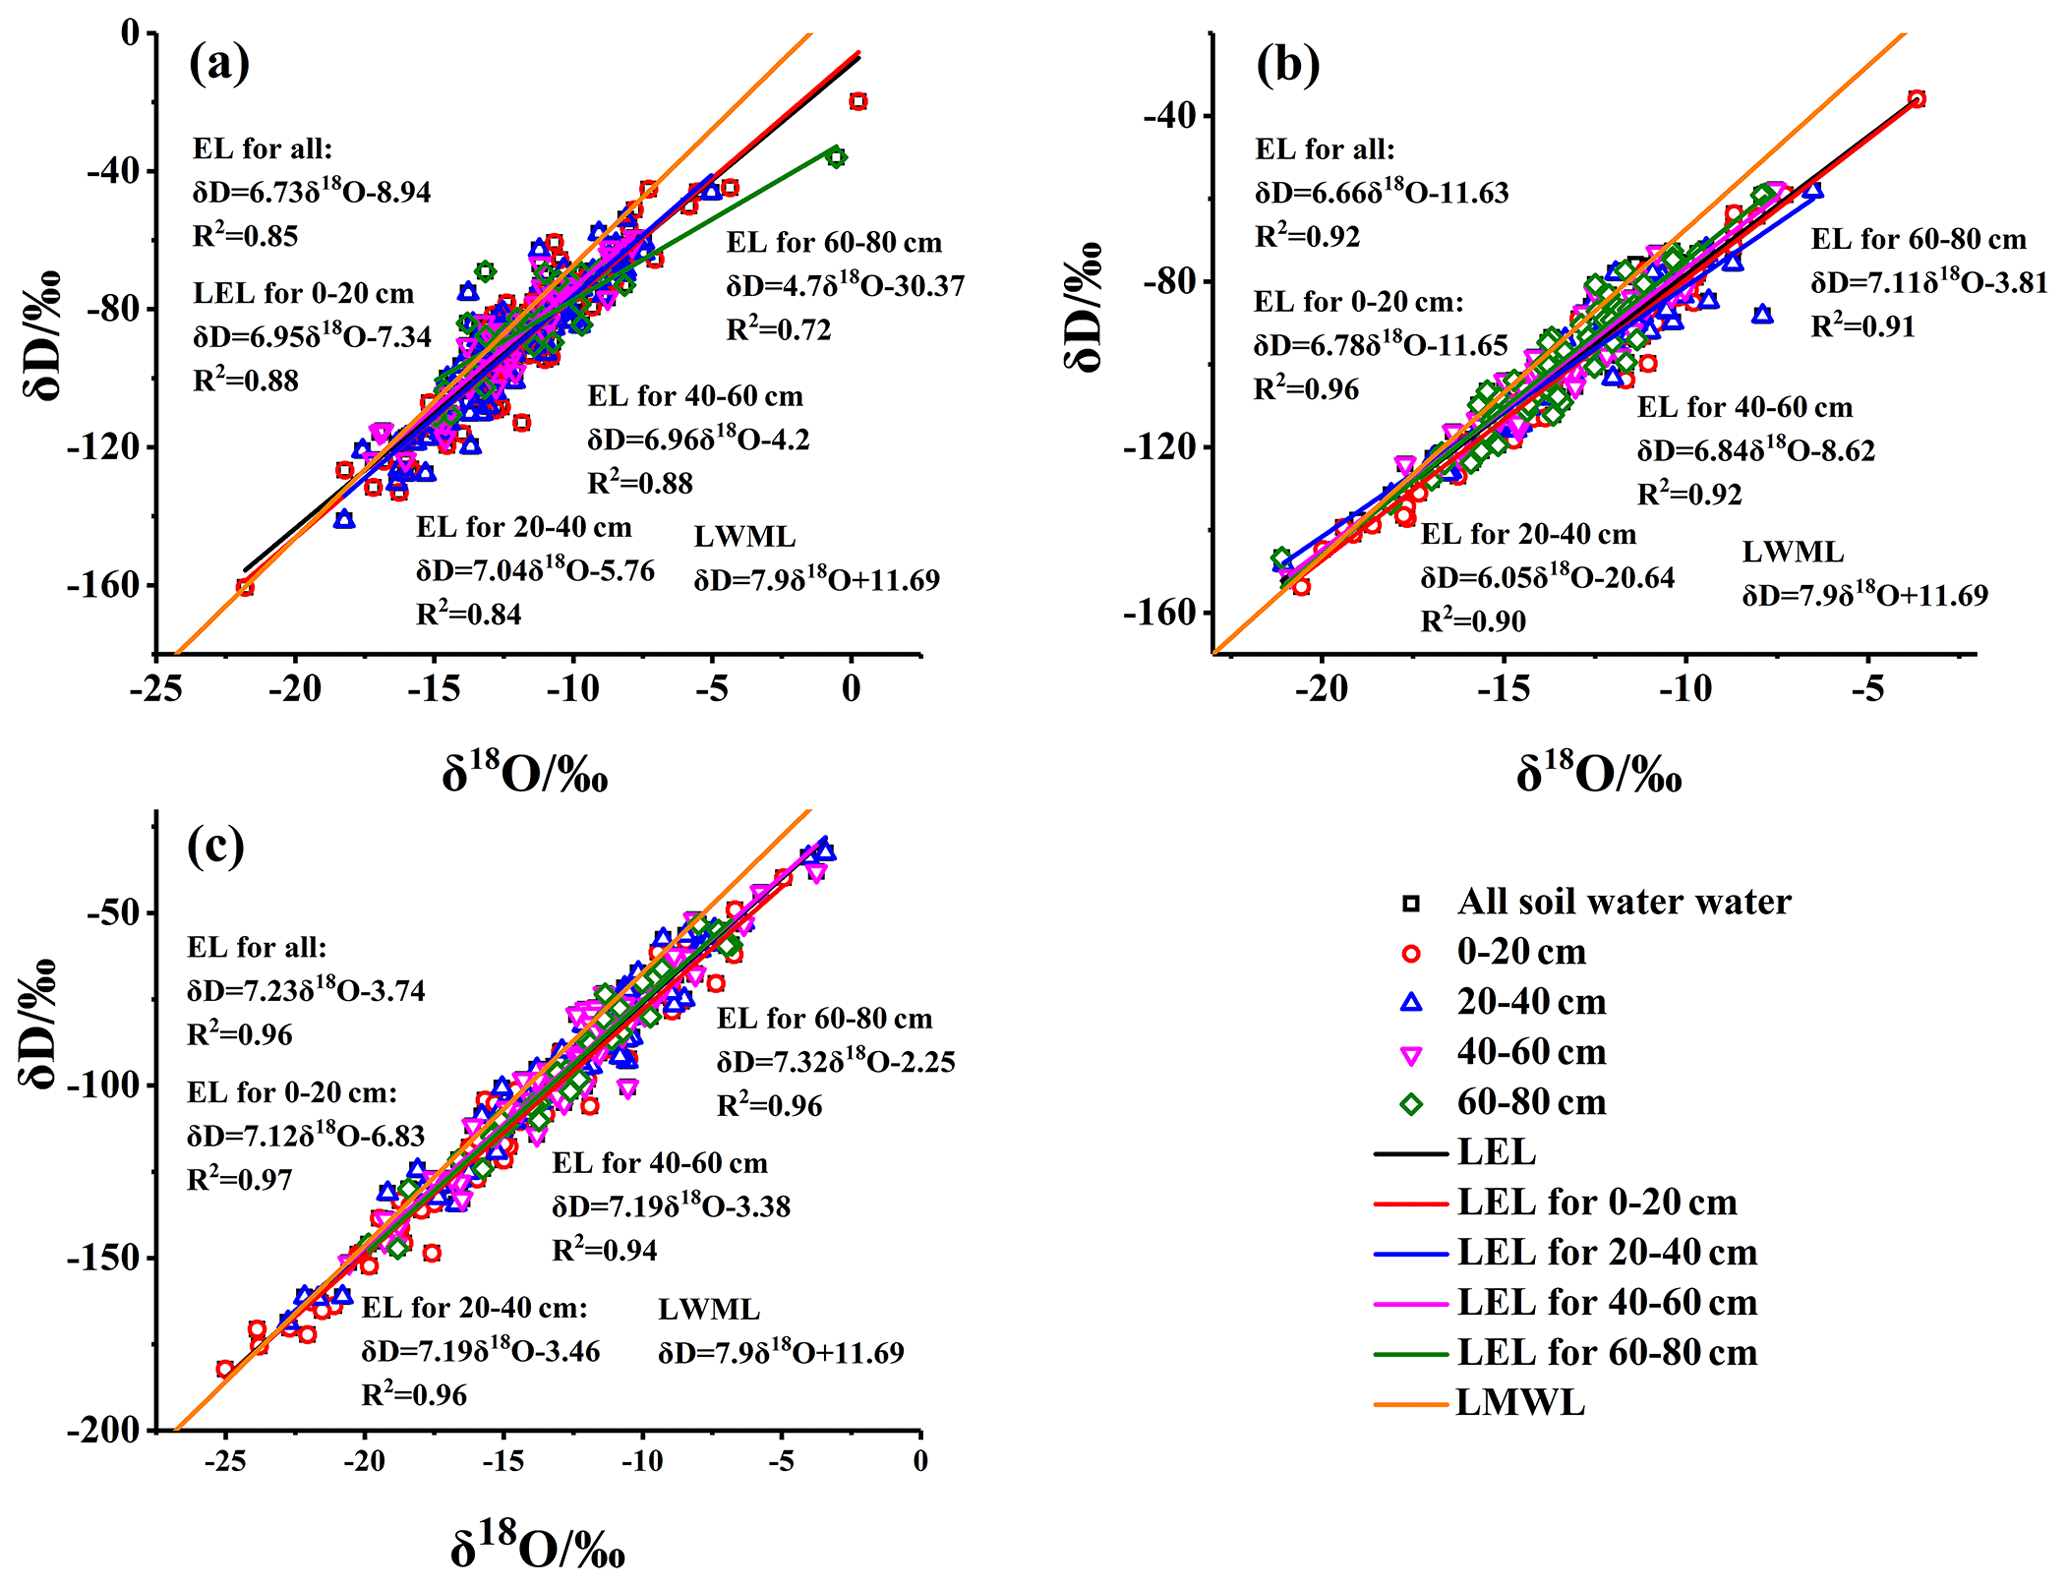
Figure 4Plot of δD versus δ18O and LEL for soil water at different soil layers in June (a), August (b), and September (c).
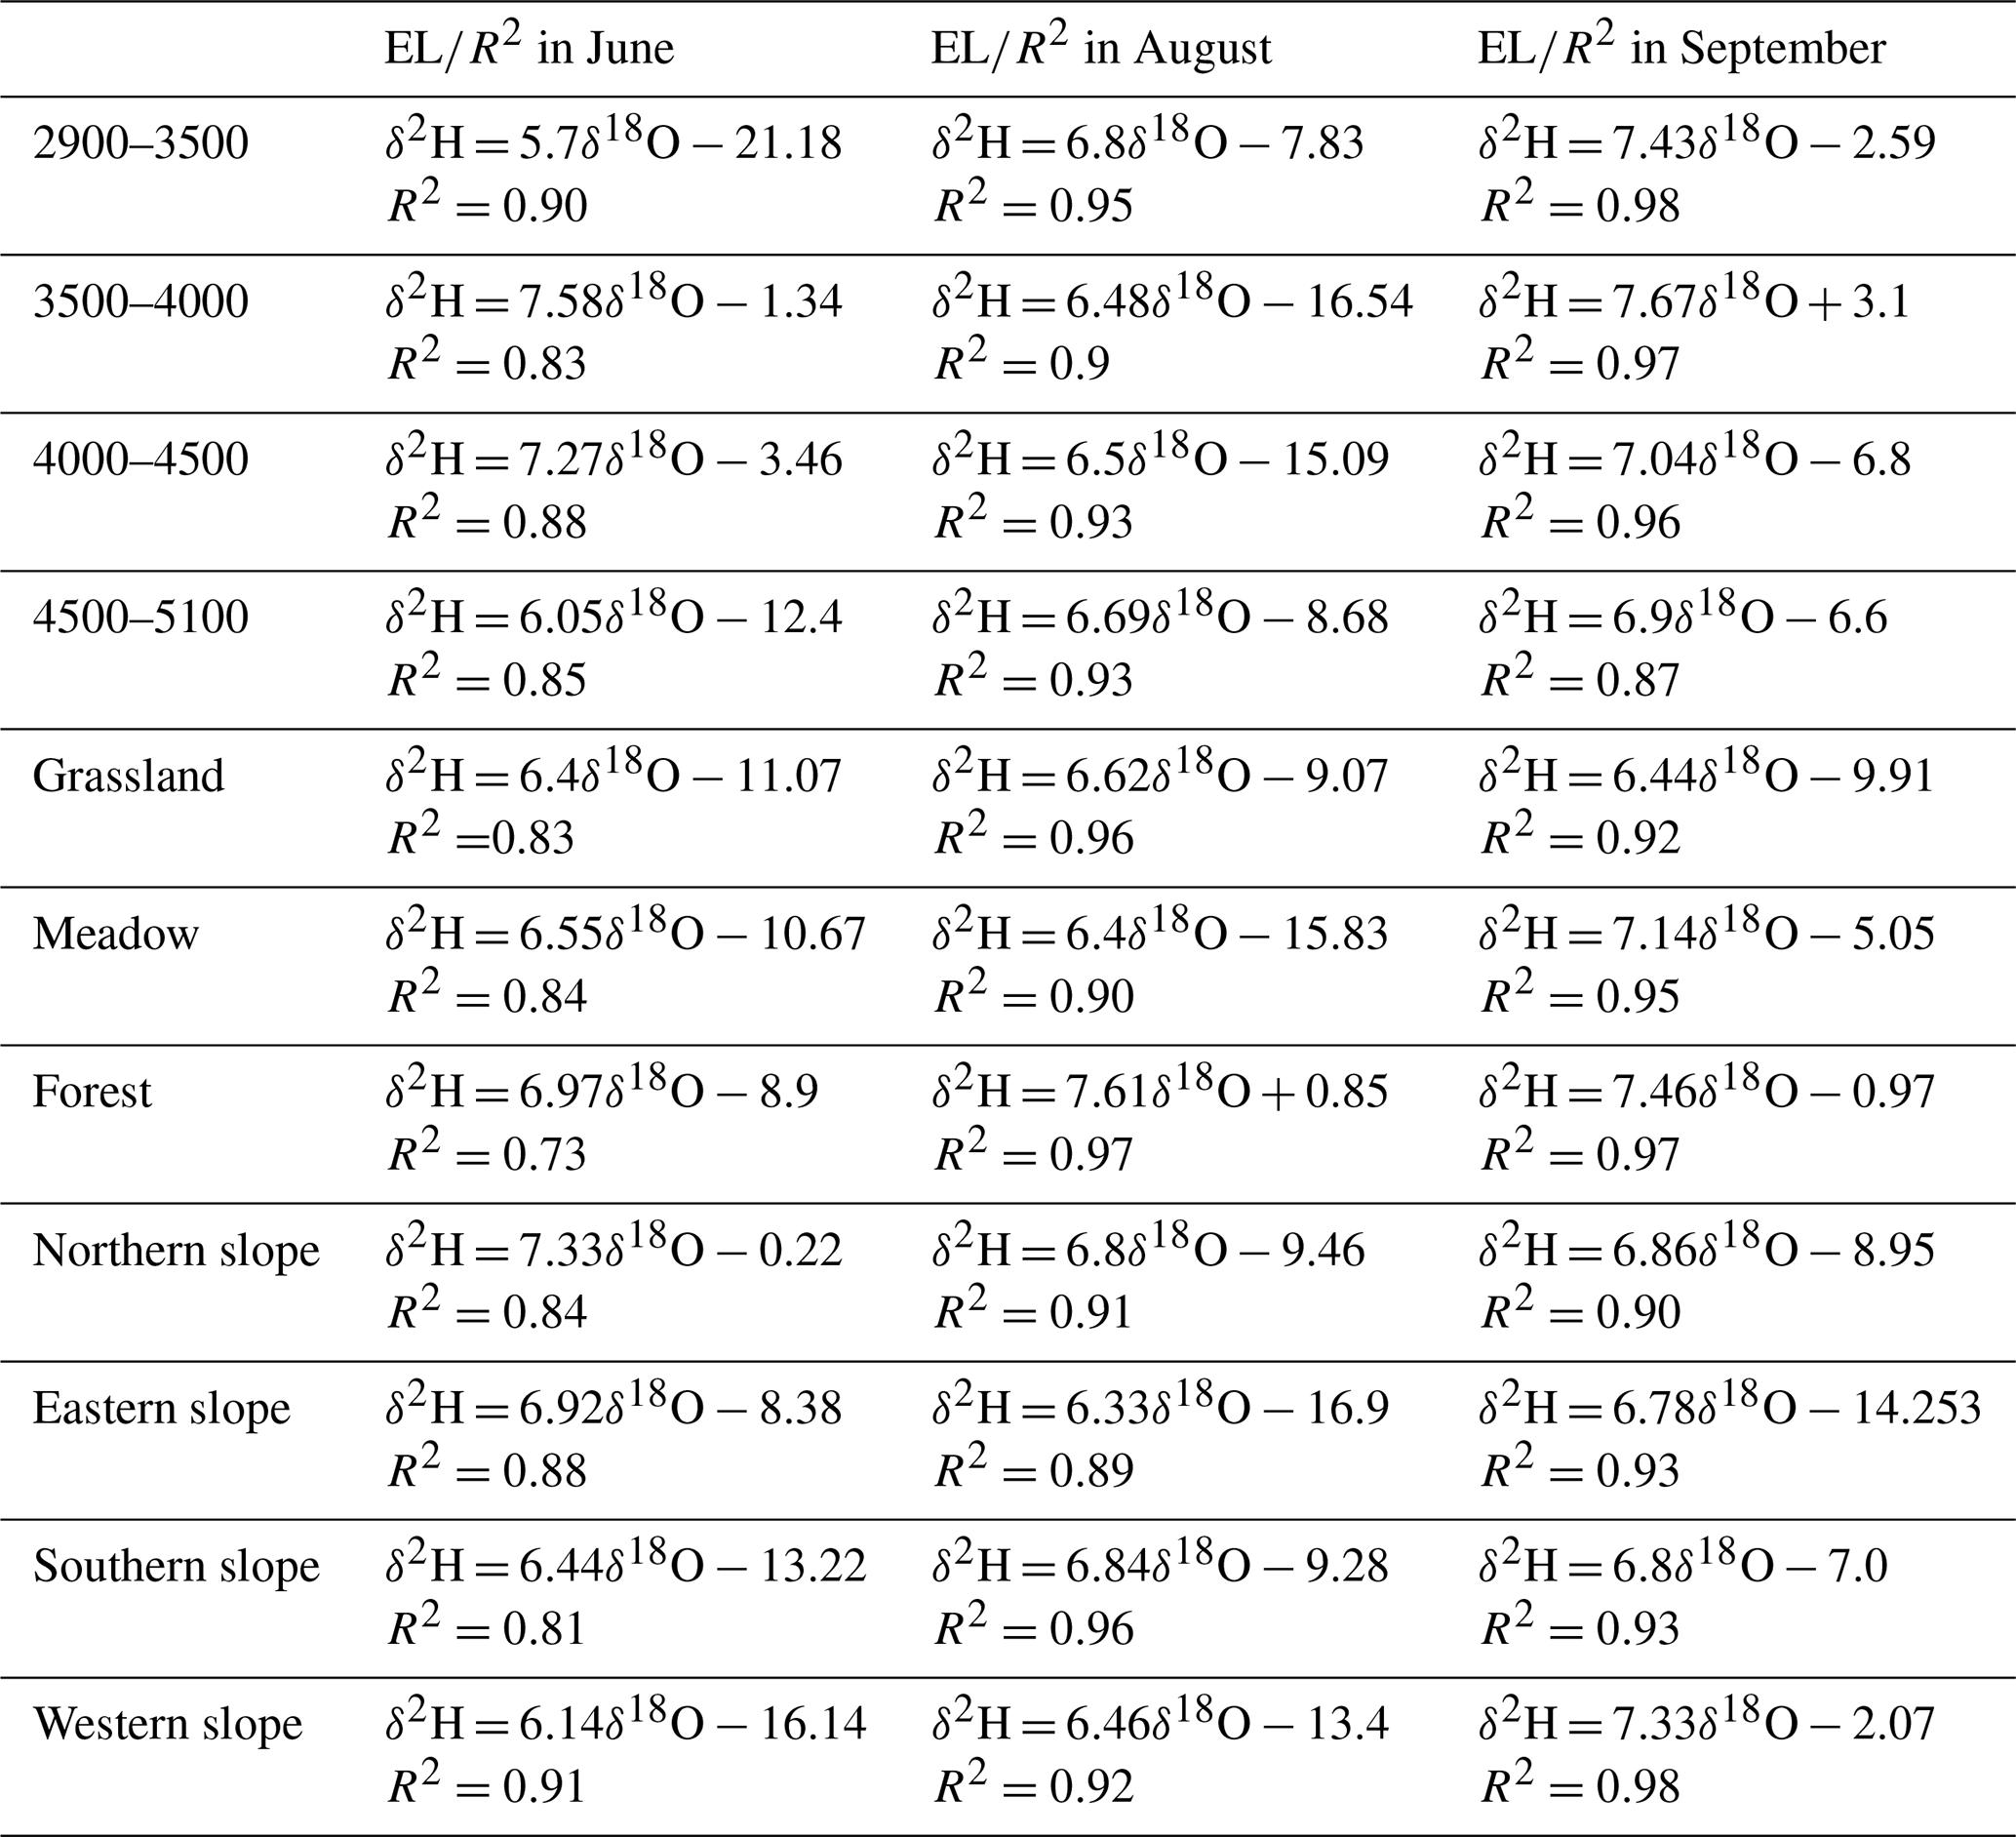
As Fig. 4 shows, the slope and intercept for LEL were the lowest in the strong ablation period and then higher in the early ablation and end ablation periods, which reflects the seasonal variation of the influence from evaporation or non-equilibrium dynamic fractionation. The slope and intercept of LEL for the 0–40 cm layer were the lowest during the heavy ablation period. They were relatively high at the beginning and end of ablation, whereas the slope and intercept of the 40–80 cm layer increased (Fig. 4). This reflected that the soil layer above 40 cm was greatly affected by the environment. Its variation was more sensitive to environmental changes, while the deeper soil layer was relatively stable. For different altitudes, the slope and intercept of LEL increased continuously from the beginning to the end of ablation at 3000–3500 and 4500–5100 m, while at 3500–4500 m the slope and intercept were the lowest during the heavy ablation period and relatively high at the beginning and end of ablation (Table 2). In the grassland, forest, and scrub areas, the slope and intercept of LEL were higher during the heavy ablation period and lower at the beginning and end of ablation, while the opposite was evident in the meadow areas (Table 2). More interestingly, the slope and intercept of LEL on the northern and eastern slopes were lower during the heavy ablation period and higher at the beginning and end of the ablation period, while on the southern and western slopes, they gradually increased and reached the maximum at the end of ablation (Table 2). These changes again reflected the multiplicity and complexity of factors influencing soil water and suggested that conducting soil water source research should be predicated on continuous systematic sampling on a regional scale.
3.2 Relationship between soil water and surface waters in different ablation periods
In the study region, the LMWL was δ2H = 7.90δ18O + 12.43 ( N=375) based on event-level precipitation. As Fig. 5 shows, soil water was primarily located on the LMWL, suggesting that precipitation was the major soil water source, and some soil water was plotted below the LMWL owing to high evaporation. The δ18O and δ2H values varied among precipitation, ground ice, and snow meltwater in the early ablation period. This suggested that in June, as the supra-permafrost water, ground ice meltwater, glacier and snow meltwater, and precipitation combined to recharge soil water, snow meltwater recharge was mainly in the area above 4000 m. In the heavy ablation period, soil water was located on the LMWL in August, with some sampling sites below it because of stronger evaporation (Fig. 5). At this time of year, the snowpack had melted away, and the ground ice in the active layer was melting rapidly, with precipitation and ground ice meltwater recharging the soil water. Soil water lay below the LMWL, and the lower slope reflected the influence of evaporation at the end of ablation, while the absence of snow meltwater and melted ground ice in areas below 4000 m meant that precipitation was the dominant soil water source (Fig. 5). These variations reflected seasonal variability in soil water sources and suggested that freeze–thaw cycles were a key influence on soil water variability.
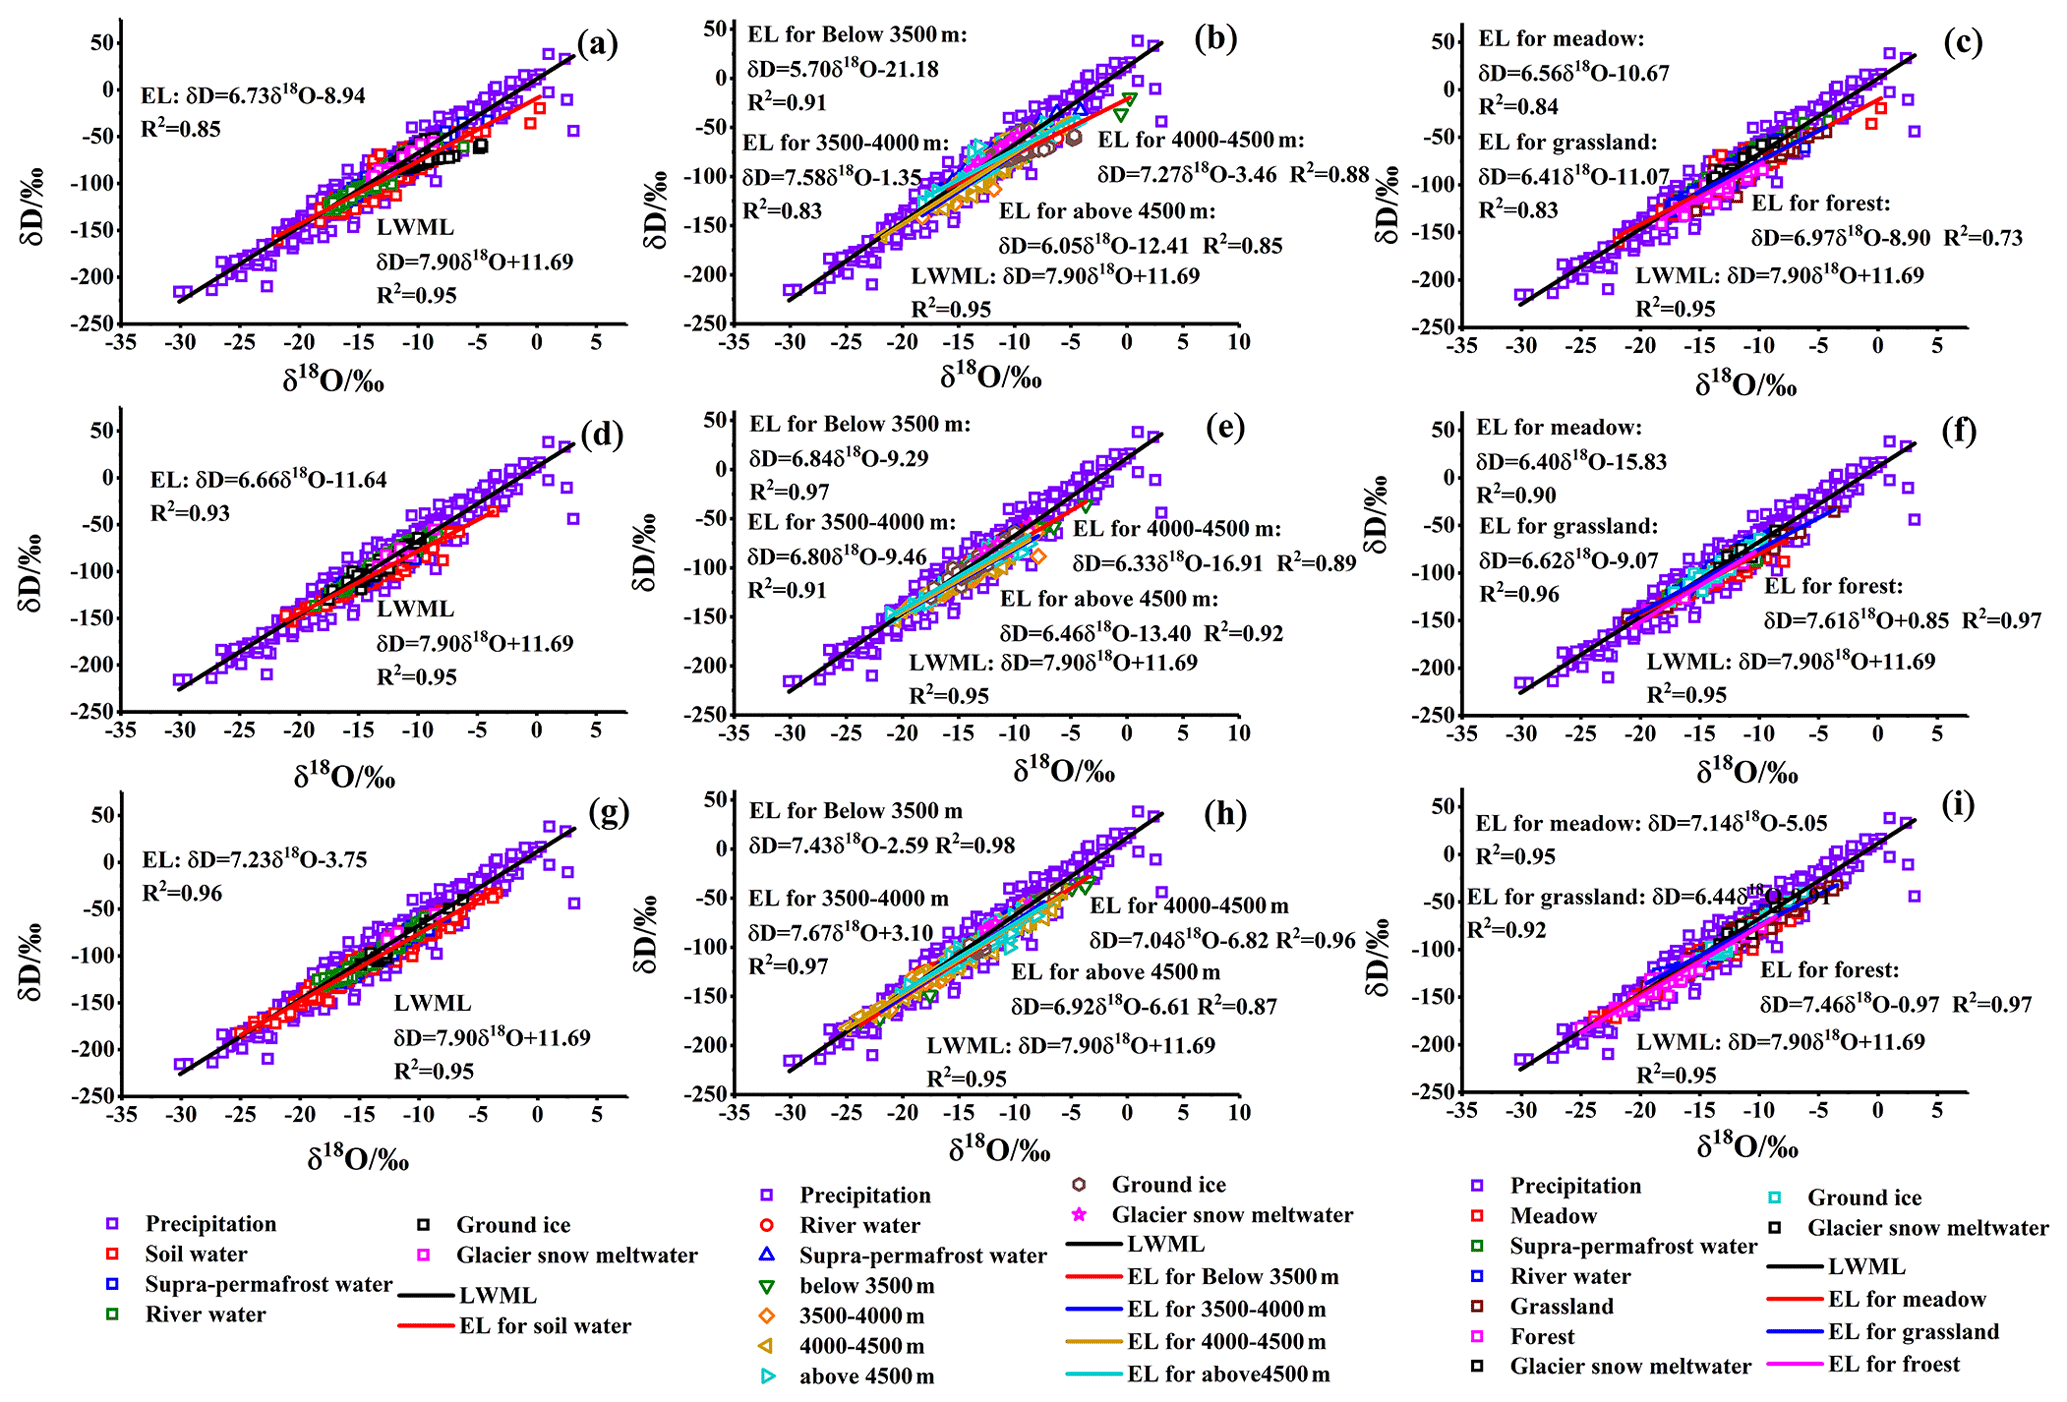
Figure 5Hydraulic connections between soil water and other waters for all samples (a), different altitudes (b), and vegetation (c) in June; all samples (d), different altitudes (e), and vegetation (f) in August; and all samples (g), different altitudes (h), and vegetation (i) in September.
Interestingly, soil water, supra-permafrost, and river water showed a clustered distribution at all ablation stages in the TRHR, reflecting a close hydraulic connection (Fig. 5). Precipitation first recharged soil water due to permafrost distribution, while some soil water transformed into supra-permafrost water. Then some soil and supra-permafrost water recharged the runoff, reflecting the uniqueness of the hydrological process in cold regions. These observations showed that various recharge sources with significant seasonal variations influence soil water sources. The relationship between soil water and the LMWL varied significantly at different altitudes (Fig. 5). Reflecting the variation of soil water sources at different altitudes in the end ablation period, soil water was mainly recharged by precipitation in areas below 4000 m, while it was also recharged by ground ice meltwater strongly influenced by evaporation, resulting in a relatively positive soil water stable isotope. In the early ablation period, the order of altitude was close to the LMWL: from 3500–4000, 4000–4500 m, above 4500 m, and below 3500 m, confirming the variability of soil water sources at different altitudes (Fig. 5). On the one hand, precipitation in the area below 4500 m was primarily liquid, while above it was mostly snow, which is strongly affected by evaporation when it melts, resulting in a relatively positive soil water stable isotope and lower recharge to soil water. Conversely, precipitation in June was relatively low, while the temperature in the lower-altitude area rose faster and evaporation was strong, which led to a positive soil water stable isotope. In the heavy ablation period, the distance between the LEL of soil water and the LMWL was comparable at different altitudes, being slightly closer below 3500 m and slightly further apart at 4000–4500 m, reflecting less altitudinal variability in soil water sources at this time of year, with abundant precipitation dominating the soil water sources and intense evaporation becoming an important factor influencing soil water dynamics (Fig. 5).
The relationship between soil water isotope and the LMWL also varied significantly by vegetation, with grassland isotope being farthest from the LMWL, followed by meadows and forests at the early and end ablation periods. In contrast, it was farthest for meadows, followed by grassland and forests in a heavy ablation period (Fig. 5). These variations indicated that: (1) forests had relatively little effect on shallow soil water content due to the predominant use of groundwater and the lower effect of evapotranspiration under the shade of the trees; (2) under relatively low precipitation, the low soil water in grassland, combined with the effect of evapotranspiration, resulted in relatively positive soil water stable isotopes; (3) soil water stable isotopes were positive when the meadow was growing, and evapotranspiration was intense in the wet season. Evapotranspiration mainly dominated the influence of vegetation on soil water sources. These changes indicated the stochastic nature of the soil water sources and the multiplicity of influencing factors.
3.3 Soil water sources in different ablation periods
Based on the EMMA model, there were significant differences in the d-excess and δ18O concentrations of ground ice, precipitation, snow meltwater, and soil water during different ablation periods (Fig. 6). Accordingly, these δ18O and d-excess data were selected for analysis because they could effectively characterize the sources. There were large spatiotemporal variations in the δ18O and d-excess concentrations. Soil water was plotted on a triangle spanning the three end members, suggesting that soil water was a mixture of them in the early ablation period (Fig. 6). Therefore, precipitation was considered the first end member, whereas soil water was plotted on a straight line spanning the two end members, suggesting that soil water was a mixture of precipitation and ground ice in the heavy and end ablation periods (Fig. 6). The intersection between the LMWL and the LEL is considered to be the isotopic value of the initial water body that recharges the soil water, and the corresponding δ18O and δ2H were −17.63 ‰ and −127.61 ‰, −18.81 ‰ and −136.94 ‰, and −23.04 ‰ and −170.36 ‰ during the early, heavy, and end ablation periods in the TRHR, respectively. These values were extremely close to the corresponding mean monthly precipitation values, reflecting that precipitation was the main source of soil water.
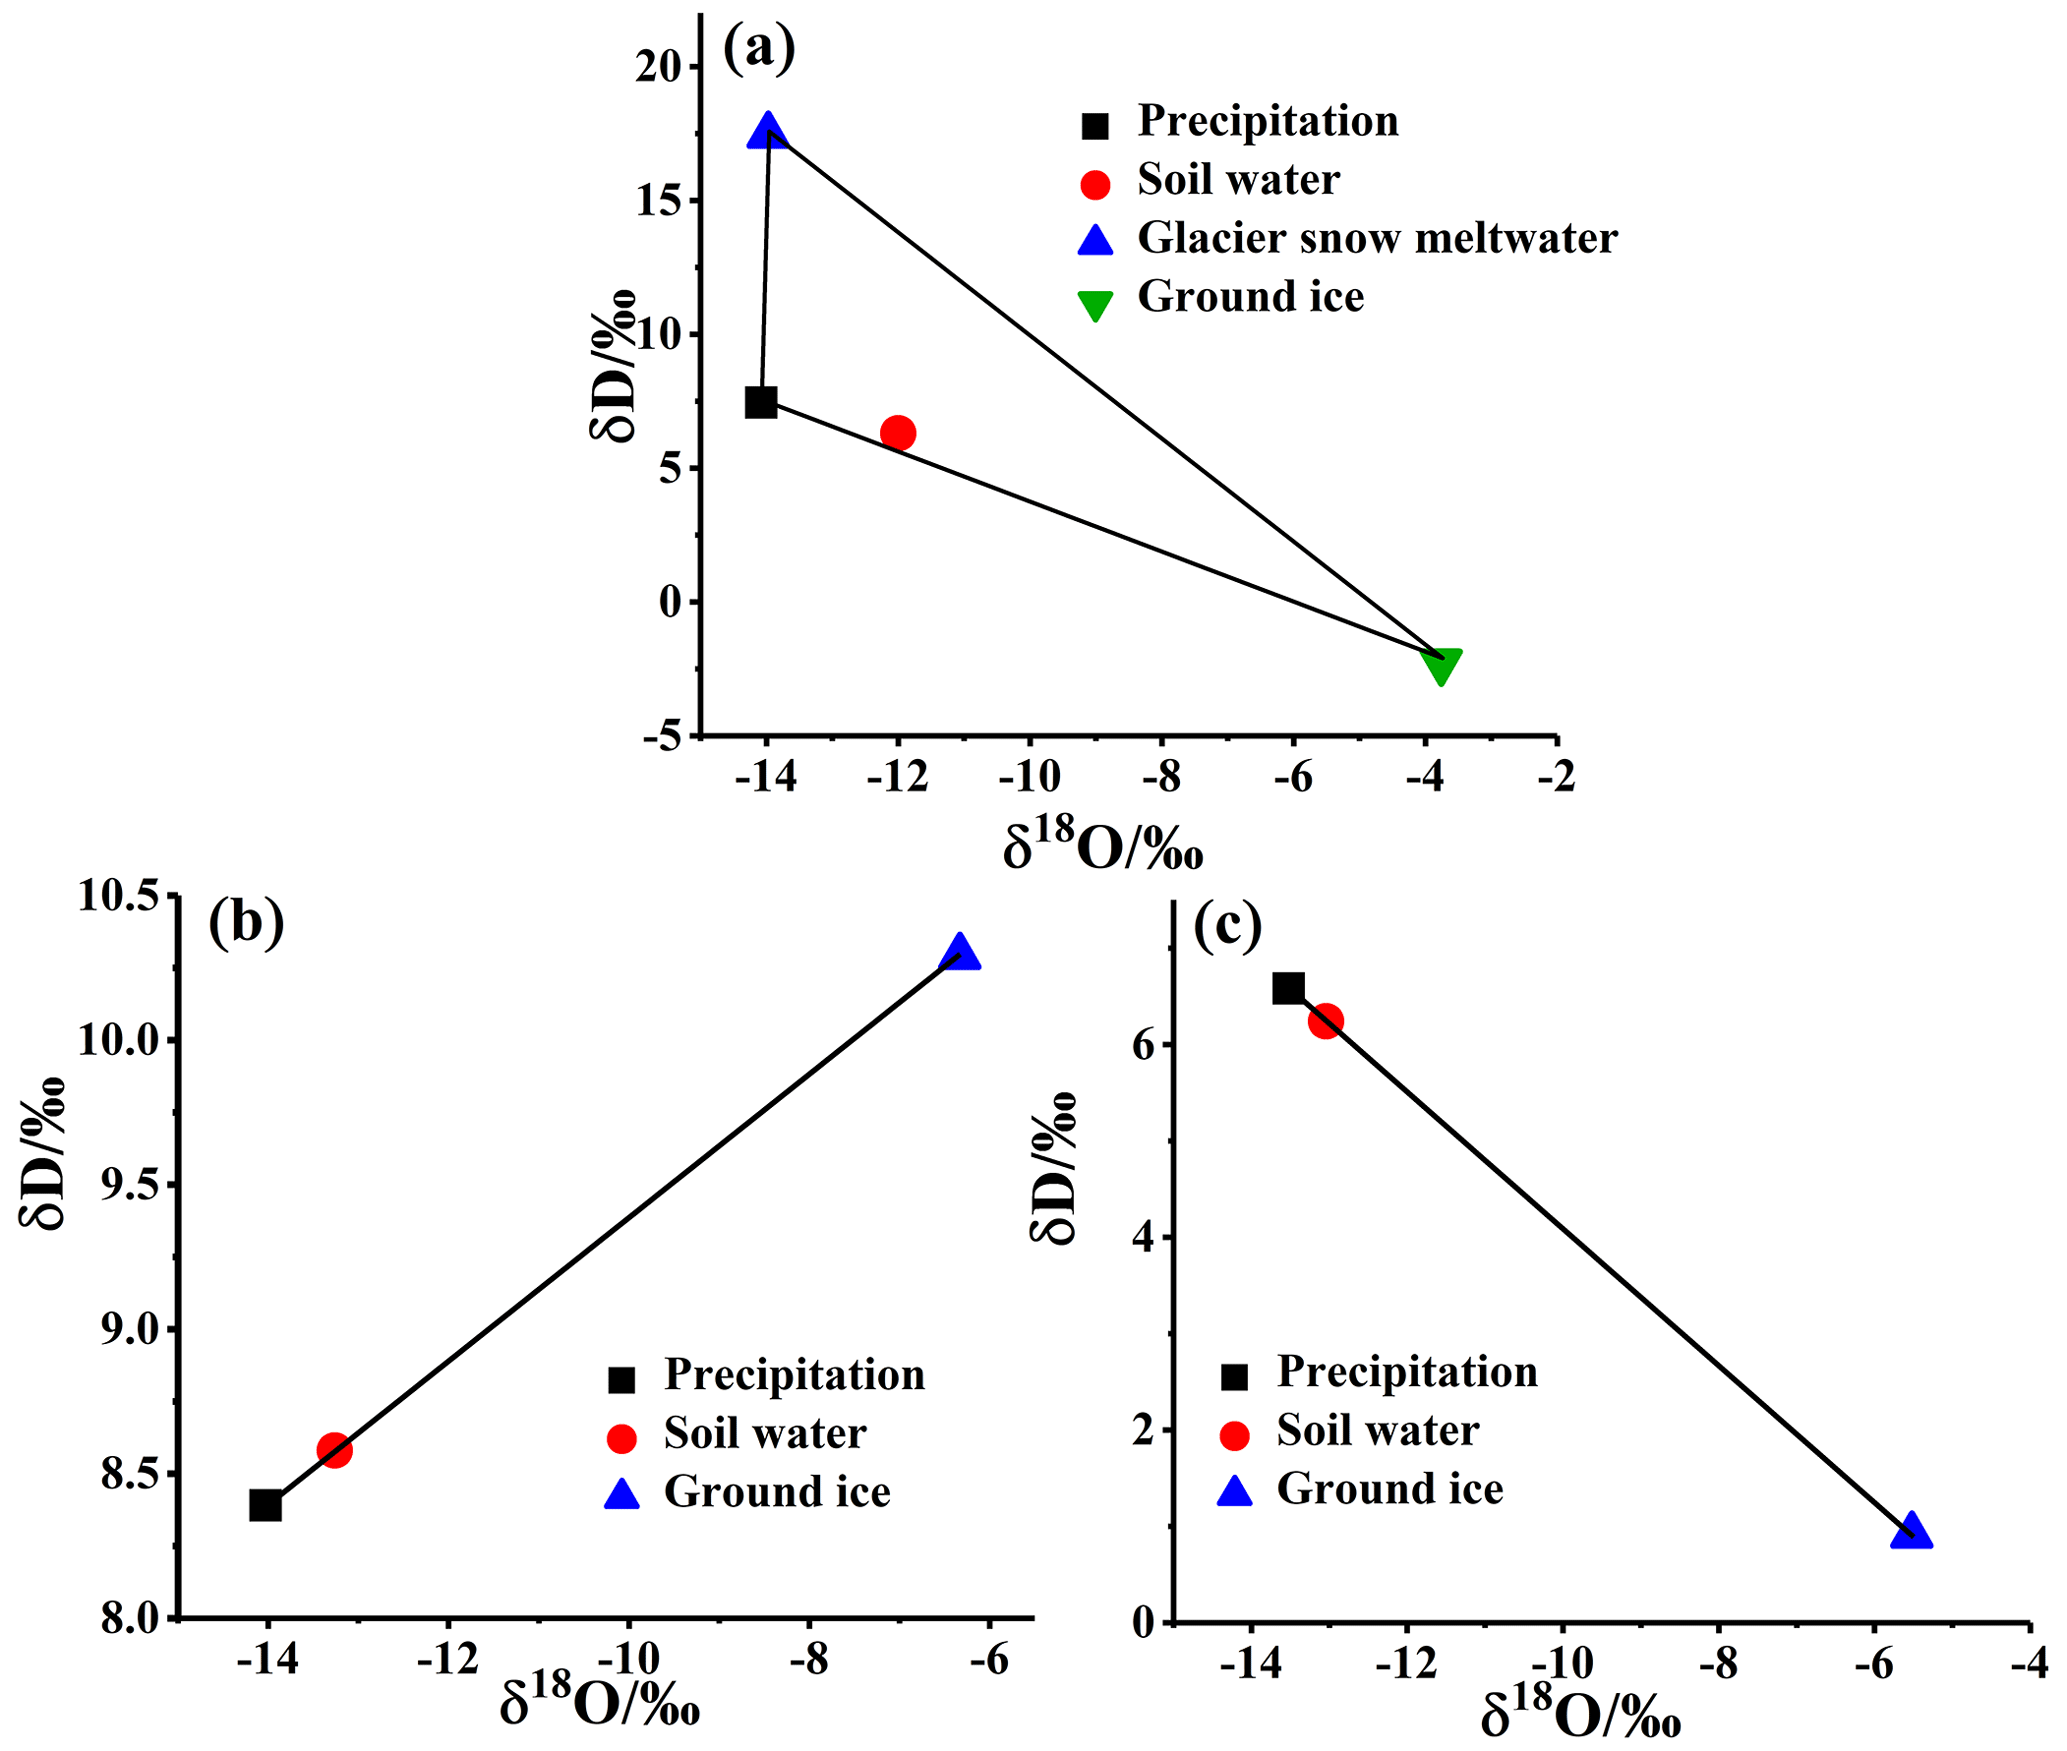
Figure 6Three-end element diagram in June (a) and two-end element diagram in August (b) and September (c) using the mean values of δ18O and d-excess for soil water.
Based on this calculation, precipitation, ground ice water, and glacier snow meltwater accounted for approximately 72 %, 20 %, and 8 % of soil water during the early ablation period, respectively (Fig. 7). Moreover, the recharge pattern showed a significant variation in different altitudes, with no snow meltwater recharge below 4000 m due to snow melting depletion and a higher snow meltwater recharge at higher elevations. The maximum ground ice meltwater recharge occurred at 3500–4000 m and decreased with increasing altitude. This showed that the change in altitude of snow and ground ice meltwater was a key factor affecting the source of soil water during the early ablation period. Regarding different vegetation types, the contribution of ground ice meltwater was higher in meadow areas. In contrast, snow meltwater recharge was relatively high in grassland areas and mainly in precipitation recharge in forest areas. Ground ice and snow meltwater recharge were significantly higher on shaded slopes than on sunny slopes (Fig. 7).
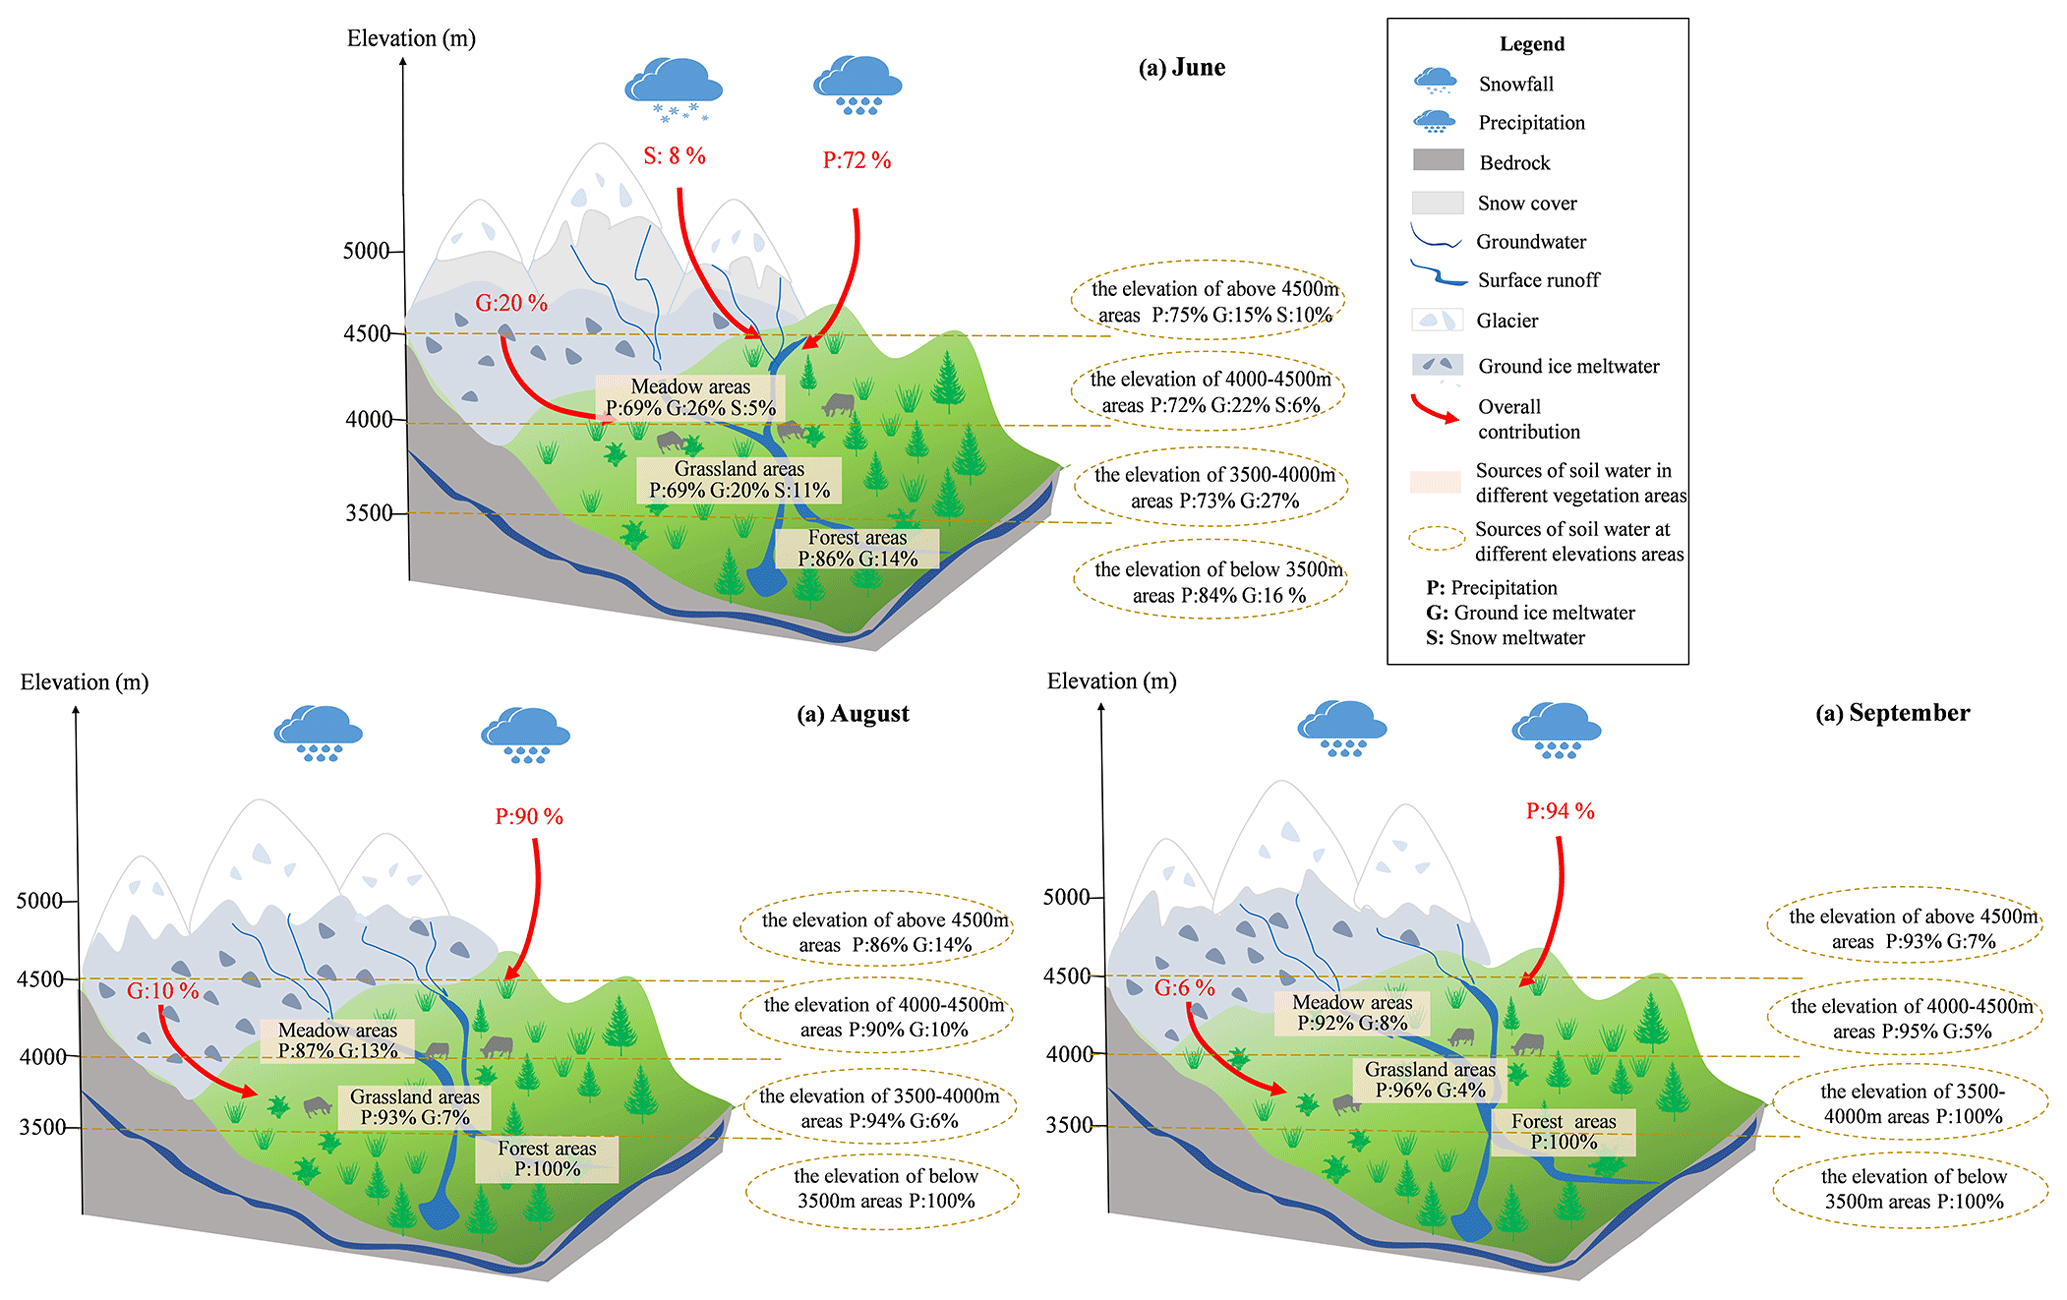
Figure 7Concept map for contribution from precipitation, snow meltwater and ground ice to soil water in the whole study region, different altitudes, and different vegetation in June (a), August (b), and September (c).
In the heavy ablation period, precipitation and ground ice accounted for approximately 90 % and 10 % of soil water in the TRHR, respectively. Snow was completely melted at this time of year, and the recharge of soil water by precipitation decreased with increasing altitude, while ground ice meltwater gradually increased, with all soil water recharged by precipitation in the regions lower than 3500 m. The forested soil water was fully recharged by precipitation, while the meadow area was recharged by ground ice meltwater at a higher rate than the grassland area, with the rate on the shaded slope being greater than that on the sunny slope (Fig. 7).
According to the EMMA model, precipitation and ground ice accounted for approximately 94 % and 6 % of soil water in the TRHR, respectively, during the end-ablation period. All ground ice in soils below 4000 m at this time of year was lost, and all soil water was recharged by precipitation, with a small amount of ground ice water recharge occurring in the higher-altitude areas. There was only a small amount of recharge from ground ice meltwater on shady slopes, which was still higher in meadow areas than in grassland areas (Fig. 7).
4.1 Influencing factors on soil water sources in different ablation periods
The above analysis shows that there are multiple sources of soil water. For the same reason, various factors influence soil water sources, including temperature, precipitation, vegetation, evapotranspiration, and the freeze–thaw cycle. As mentioned above, soil water is mainly recharged by precipitation and ground ice meltwater. The amount of ground ice is challenging to measure, but it can be estimated by high or low ground temperatures. As Fig. S1 in the Supplement shows, spatial correlations of soil moisture with air and ground temperatures were analyzed during the sampling period. Interestingly, there was a positive correlation in the early ablation period because the active layer of permafrost was in the process of melting. The higher the ground temperature, the faster the ground ice melts, causing an increase in soil water, especially at lower altitudes. The liquid water produced by ground ice melting and the snow meltwater on the surface would move down to the upper limit of permafrost, and the precipitation will also move downward when the active layer completely melts, which increases the soil water in the active layer (Jiao et al., 2014). Liquid soil water increased in the cold months under increasing soil temperature and ground ice melting, while changes in the warm months were the results of competition between positive precipitation and adverse soil temperature effects in permafrost regions. The active permafrost layer melted slowly at higher altitudes, and evaporation increased with higher ground temperatures. Wen et al. (2020) also reported that temperature increases reduced the shallow soil water in cold regions. In the heavy ablation period, soil water exhibited a clear negative correlation with ground temperatures, with the end of thawing the active permafrost layer and the weakening effect of permafrost ground ice on soil water, and the higher the temperature, the stronger the evaporation and lower the soil water. Most regions displayed a clear positive correlation in September, with only a few lower-altitude areas showing a negative correlation. Two phenomena can account for this: (1) the top layer of soil at higher altitudes starts to freeze at night and thaws during the day, thus increasing soil water, and (2) soil water at lower altitudes is affected by evaporation and decreases again. These facts also indicate that changes in freeze–thaw processes have an important influence on the evolution of soil water. During the thawing phase of the active permafrost layer, the increase in precipitation or soil water led to an increase in the thawing rate of frozen soil, accompanied by an increase in water infiltration as the frozen soil continued to thaw, leading to an increase in deep soil water and a decrease in surface soil water (Ma et al., 2021). Under freeze–thaw cycles, the adequate soil water in the root layers of different alpine meadows was ranked as follows: non-degraded meadow > moderately degraded meadow > seriously degraded meadow (Lv et al., 2022). Xue et al. (2017) found that permafrost degradation significantly reduced soil water by 4.5 %–6.1 % at a depth of 0–100 cm and increased the annual mean surface soil temperature by 0.8 ∘C in the headwater region of the Yangtze River.
Precipitation infiltration is considered the primary source of soil water in the active permafrost layer during the freeze–thaw process, which is considered a major factor and imposes limitations (Cao et al., 2018). In June, the spatial variation of soil water and precipitation in most regions, especially at high altitudes, showed a negative correlation, while only a few low-altitude regions showed a positive correlation (Fig. S2). On the one hand, this indicated that precipitation in high-altitude regions was mainly in the form of snowfall, which does not easily recharge soil water directly, and that the active permafrost layer melts slowly. There is also the phenomenon of alternating between freezing and thawing, such that the more precipitation there is, the less the soil water changes. On the other hand, all the permafrost in low-altitude regions melted by June, and soil water was mainly recharged by precipitation, such that the more precipitation there was, the higher the soil water. The correlation between soil water and precipitation was low during the warm season in permafrost areas and high in seasonal frozen areas because permafrost may help maintain soil water stability. In contrast, permafrost degradation would reduce the regulating capacity of soil water, affecting the Tibetan Plateau ecosystem and hydrological cycle.
Soil water changes in August exhibited a negative correlation with precipitation. During this period, the active layer of permafrost melted. However, the source of soil water was mainly precipitation. More precipitation resulted in a higher quantity of soil water (Fig. S2). Most areas showed a positive correlation in September. Only a few high-altitude areas displayed a negative correlation; due to the lower temperature, precipitation in high-altitude areas was mainly snowfall, which had less effect on soil water recharge, while the lower-altitude areas still showed a positive correlation with rainfall, which directly recharged soil water. Deng et al. (2019) also indicated that soil water increased with precipitation in most regions of the TRHR. Based on observations in the TRHR, the soil water at 10, 20, and 30 cm increased by 0.47 %, 0.46 %, and 0.41 %, respectively, when the precipitation increased by 1 mm, while the soil water at 10, 20, and 30 cm decreased by 3.8 % d−1, 3.3 % d−1, and 2.3 % d−1, respectively, when the number of days without precipitation increased by 1 d. The average soil water during 2003–2020 was 20 %, increasing at a rate of 0.5 % per 10 years, and its changes were influenced by precipitation and temperature in the TRHR (Chen et al., 2021). In addition, the effect of snow cover on soil water thawing was greater than that on freezing, and the effect on shallow swamp soils was greater than that on shallow meadow soils (Chang et al., 2012).
Evapotranspiration is the reverse process of soil water recharge. Soil water, in general, showed a significant negative correlation with evapotranspiration in June, August, and September in the TRHR, indicating that stronger evapotranspiration results in less soil water (Fig. S3). Based on observations under simulated warming conditions at the Chengduo station in the TRHR, the soil temperature increased by 2.50 and 1.36∘ at the soil depth of 0–15 and 15–30 cm, respectively, while the soil water decreased by 0.07 % and 0.09 % at the soil depth of 0–15 and 15–30 cm, respectively (Shiting et al., 2019). Cao and Jin (2021) also concluded that soil water is negatively correlated with air temperature and positively correlated with precipitation.
4.2 Soil water sources and implications for vegetation restoration
As the limiting factor determining ecosystem stability in cold regions, there may be complex feedback relationships between vegetation and soil water. This is of great significance for improving understanding of the hydrological process, soil and water conservation, and water resource utilization. As Fig. S4 shows, the correlation between soil water and vegetation index in June was positive, and the correlations were more significant in higher-altitude regions. On the one hand, the vegetation had just resumed growth during this period, and the growth was slow with the relatively weak evapotranspiration. The soil was dry after a freezing period, and the vegetation had a higher capacity to hold water. The active permafrost layer was still melting, and ground ice melting increased the soil water, accompanied by continuous vegetation growth. In the early stage of vegetation growth, the upper soil layer had a high water-holding capacity, the infiltration rate of precipitation was slow through the surface layer to the soil depths, and there was a more uniform spatial distribution of soil water with an evident water-holding function. Z. Liu et al. (2021) also thought that the thawing of frozen soil increased the soil water in the root zone, regulated root respiration, and brought the vegetation into the growing season. Wei et al. (2022) also indicated that NDVI and surface soil water were positively correlated in the Loess Plateau, with a more significant mutual feedback relationship.
Soil water displayed a negative correlation with vegetation index in most areas in August, reflecting better vegetation growth, stronger evapotranspiration, and lower soil water content, as the active permafrost layer had all melted by that time of year. Vegetation was in an active growth phase. Soil water showed a negative correlation with the vegetation index at most lower elevation areas in September, reflecting better vegetation growth, stronger evapotranspiration, and lower soil water. Some higher elevations showed a positive correlation, reflecting the effects of the freeze–thaw cycle.
The vegetation indices were closely associated with soil water, which played a key role in the active layer thickness–vegetation relationship, especially at depths of 30–40 cm in the northeastern Qinghai–Tibetan Plateau (Jin et al., 2020). Thus, precipitation and vegetation were the main factors that caused soil moisture variation in summer and autumn, while the soil freeze–thaw cycle was the main contributing factor in spring (Ma et al., 2021). Based on observations in the permafrost region, the mean surface soil water in the alpine meadow was higher than that in the alpine steppe, while soil water variability in the cold alpine steppe was larger than that in the alpine meadow, which decreased with depth (Yang et al., 2011). The soil water reduced rapidly after vegetation degeneration, especially at soil depths of 0–30 cm, and so global warming and permafrost degradation tend to decrease topsoil water in the Tibetan Plateau (Wang et al., 2012).
The soil water in the alpine steppe and temperate steppe was mainly affected by air temperature, and the influencing factors for alpine meadows and shrubs were precipitation and NDVI. The effect of different vegetation types on the surface soil water varied widely, and the higher the vegetation cover, the greater the increase in soil water (Gaj et al., 2016). The surface soil water appeared to be significantly reduced by vegetation degradation. The more vegetation was degraded, the faster water was lost (Wang et al., 2010; Jeppesen et al., 2020). The soil water continued to decrease, and permafrost degradation increased the evaporation of soil water, resulting in further soil water loss. It is necessary to vigorously implement ecological protection and construction projects, natural forest protection projects, and projects to convert cropland to forest and grassland to counter these effects. Such strategies could effectively deal with ecological problems such as decreased water conservation capacity, increased soil erosion, and vegetation degradation caused by future permafrost degradation. In the Qilian Mountains, water loss has a clear positive relationship with soil water and a negative relationship with soil temperature for shrubland, grassland, and spruce forests. Lu et al. (2020) also concluded that community cover was sensitive to surface soil water and increased as a function of soil water from 1.1 %–10.0 % and gradually tended to saturate. There was a significant positive correlation between summer net primary production (NPP) and soil water in the watershed, but their interactions manifested spatial heterogeneity (Yue et al., 2021). Thus, the high soil water could support more plants with varied vegetation types (Jiao et al., 2020).
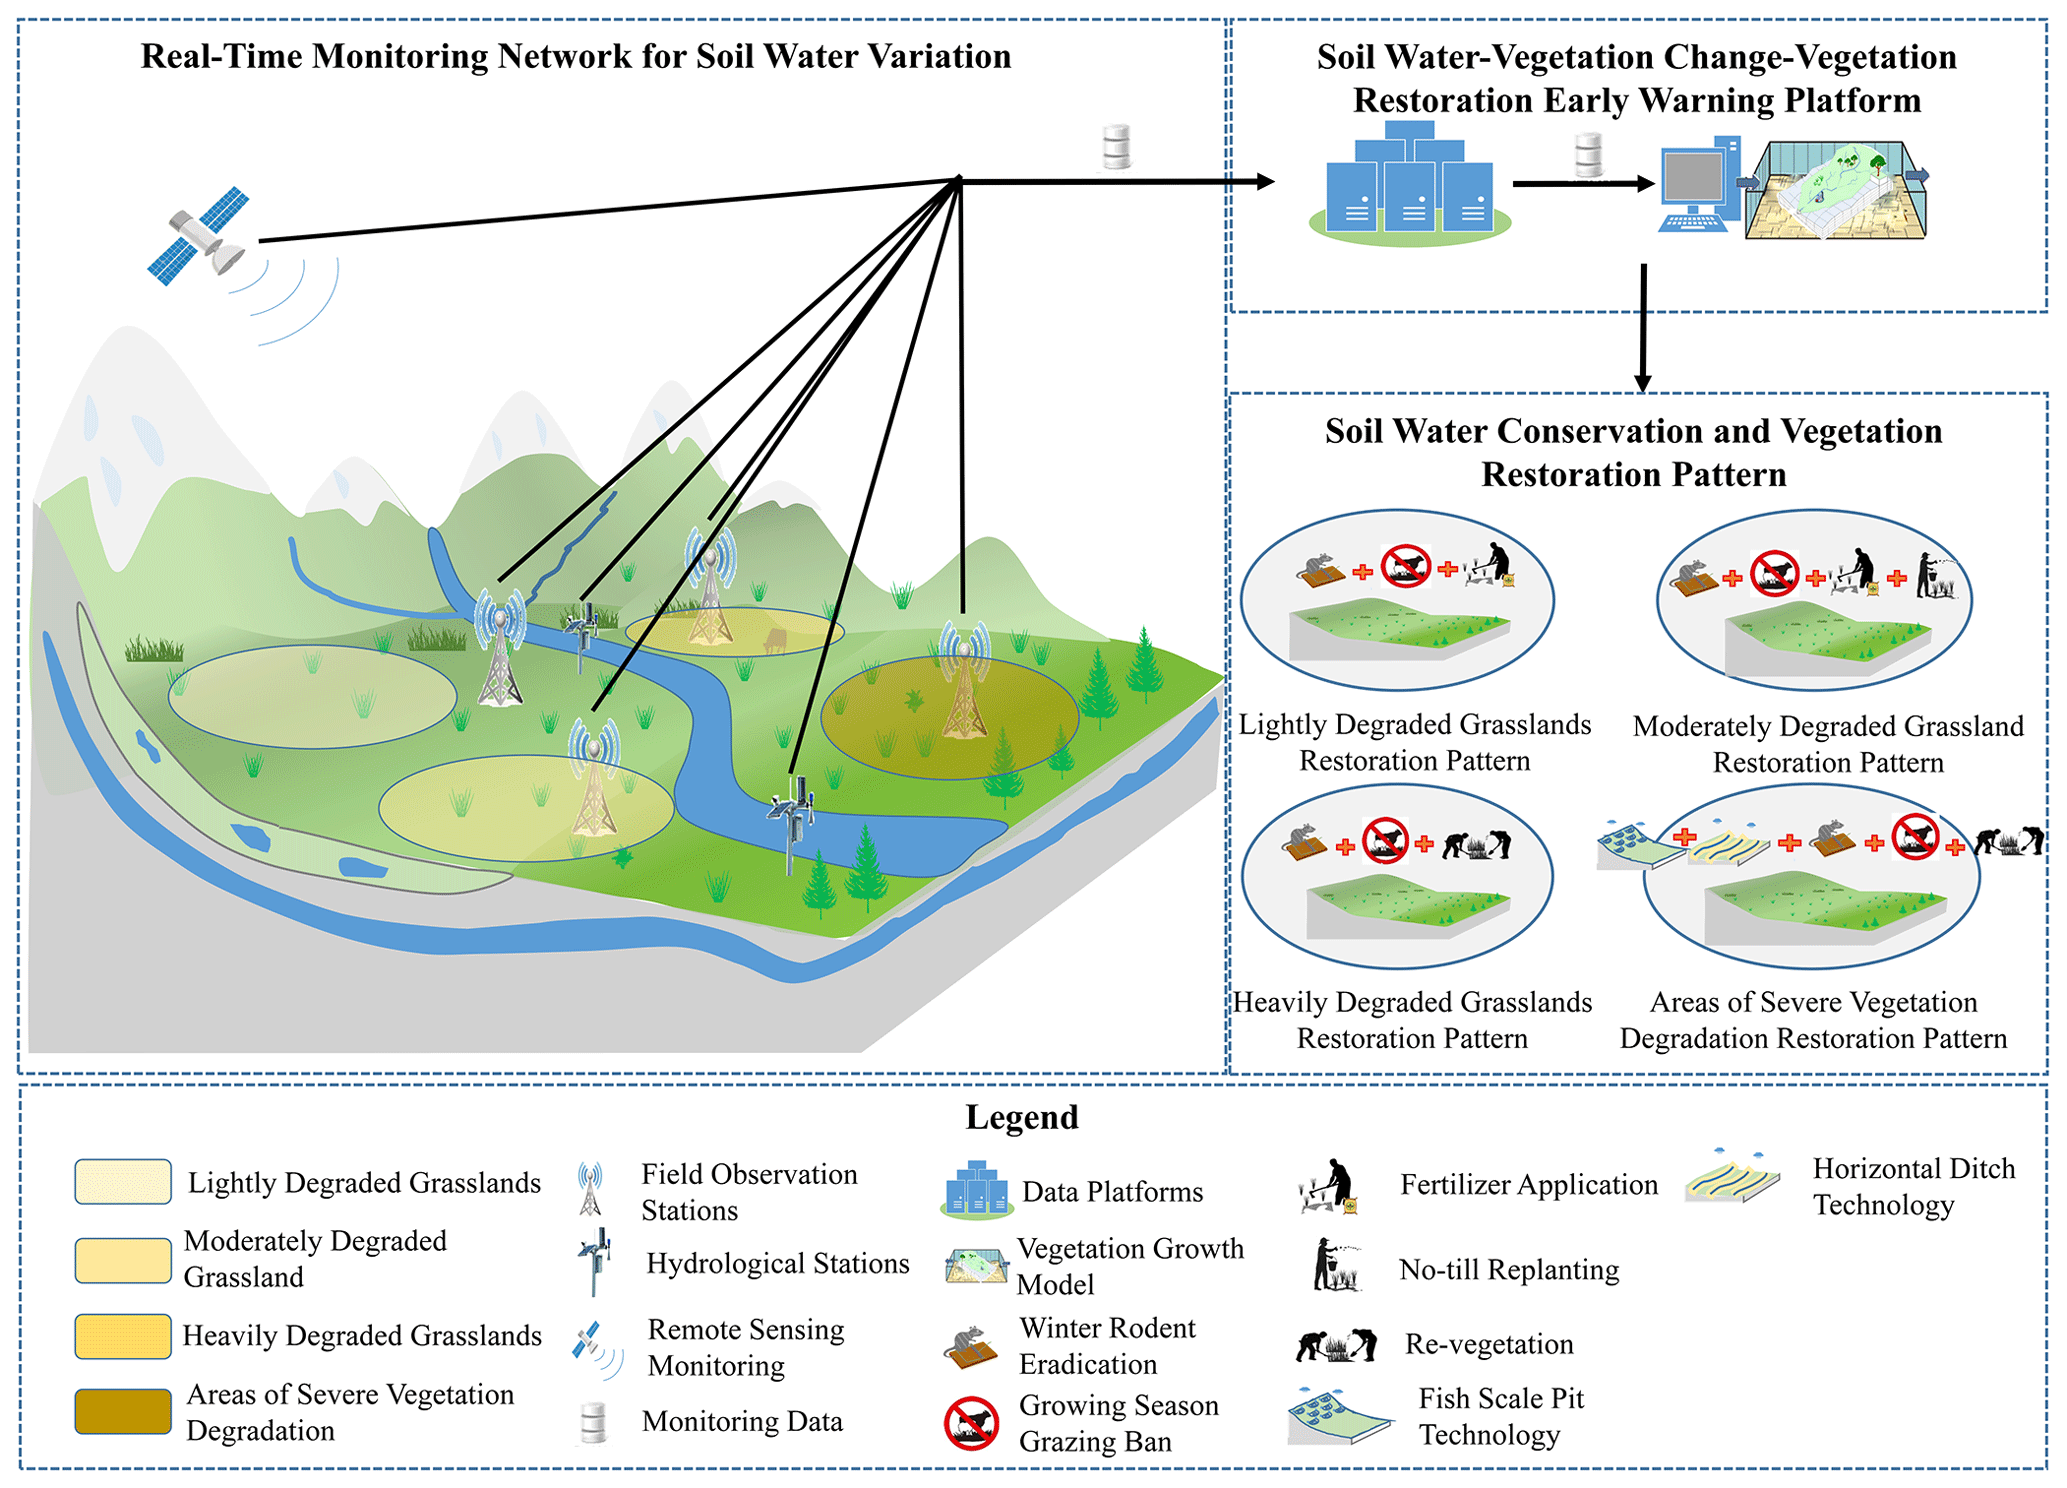
Figure 8Concept diagram for real-time monitoring network for soil water, soil water-vegetation change-vegetation restoration early warning platform and the different soil water conservation and vegetation restoration patterns in Three-River Headwater Region.
As mentioned above, the variability of soil water has further increased under warming, becoming the most critical factor affecting vegetation growth, especially as soil water loss will further exacerbate vegetation degradation and pose a great threat to ecological security in the Chinese Water Tower. Yue et al. (2022) also found that, under future climate change, only timely supplementation of soil water could promote net primary productivity growth, improve vegetation productivity, and effectively restore and protect the ecosystem. Therefore, active measures should be taken in the following five areas (Fig. 8).
-
Build a real-time observation network for soil water variation relying on ground-based meteorological observation stations, hydrological stations, and field observation stations, combined with remote sensing monitoring, to provide data support for the formulation of scientific and reasonable water–soil conservation and vegetation restoration measures.
-
Conduct an in-depth investigation into the influence mechanism of soil water on vegetation growth. Develop the construction of vegetation growth models that integrate soil water dynamics and vegetation carrying capacity. Establish a soil water–vegetation change–vegetation restoration early warning platform, enabling real-time alerts for vegetation degradation. Provide a scientific foundation for the restoration of degraded vegetation.
-
Determine scientifically the most suitable time for vegetation restoration. The melting of the active permafrost layer and the change in soil water show seasonality. In lower-altitude regions, vegetation enters the growing season in June, and so restoration work should be implemented by the end of May to promote seed germination. In higher-altitude regions, vegetation enters the growing season around the end of June, and to improve the survival rate of vegetation, rapid seed germination and breeding techniques should be developed. Mature seedlings should be directly transplanted to make full use of the short growing season and improve the effectiveness of vegetation restoration.
-
Take restoration measures according to different degrees of degradation. There are significant differences in soil water and its environmental effects in grasslands. The integrated pattern of winter rodent eradication + growing season grazing ban + fertilizer application technology is for lightly degraded grasslands, which can significantly improve the vegetation cover and height of grasses and maintain a stable increase in soil water. The integrated pattern of winter rodent control + growing season grazing ban, fertilizer application, and no-till replanting is for moderately degraded grassland, which not only significantly increases the cover, height, amount of good forage, and above-ground vegetation of grassland but also promotes water-holding capacity. The integrated pattern of winter rodent eradication, growing season grazing ban, fertilizer application, and re-vegetation technology is used in heavily degraded grasslands to restore vegetation and to ensure that soil water is stable enough to support vegetation growth.
-
For areas of severe vegetation degradation, focus on the adequate compensation of precipitation in time and space. Change the micro-topography to collect rainwater in the form of runoff or artificially produced flow, including fish-scale pit and horizontal ditch technologies, to achieve the objectives of water storage and moisture conservation, increasing the survival rate of vegetation and improving ecological water use.
Based on 2451 samples of soil and surface water collected in the Three-Rivers Headwater Region, China, the sources of soil water in different ablation periods were calculated. The results indicated that precipitation, ground ice, and snow meltwater accounted for approximately 72 %, 20 %, and 8 % of soil water during the early ablation period, respectively, and that there is no snow meltwater recharge below 4000 m due to snow melting depletion. In the heavy ablation period, precipitation and ground ice contributed to 90 % and 10 % of soil water, respectively. The precipitation recharge decreased with increasing altitude, while ground ice gradually increased, accounting for about 94 % and 6 % of soil water from precipitation and ground ice, respectively, during the ablation end period, and the small amount of recharge from ground ice mainly occurred above 4000 m.
Soil water loss will further exacerbate vegetation degradation with global warming and pose a significant threat to the ecological security of the Chinese Water Tower. So, it is urgent to build a real-time soil water observation network, construct a soil water–vegetation change–vegetation restoration early warning platform, determine the most suitable time for vegetation restoration, and apply appropriate soil water conservation and vegetation recovery programs.
The raw/processed data required to reproduce these findings cannot be shared at this time as the data also form part of an ongoing study. Data will be available upon request when all relevant results are completed.
The supplement related to this article is available online at: https://doi.org/10.5194/hess-28-719-2024-supplement.
ZL led the write-up of the manuscript with significant contribution. ZL and JG developed the research and designed the experiments. ZL, JG, QC, and JX collected the water samples. LS analyzed data. All authors discussed the results and contributed to the preparation of the manuscript.
The contact author has declared that none of the authors has any competing interests.
Publisher's note: Copernicus Publications remains neutral with regard to jurisdictional claims made in the text, published maps, institutional affiliations, or any other geographical representation in this paper. While Copernicus Publications makes every effort to include appropriate place names, the final responsibility lies with the authors.
This study was supported by the National Nature Science Foundation of China (grant no. 42077187), the Top Talent Project of Gansu province, Chinese Academy of Sciences Young Crossover Team Project (grant no. JCTD-2022-18), the National Key Research and Development Program of China (grant no. 2020YFA0607702), the “Western Light” Key Laboratory Cooperative Research Cross-Team Project of Chinese Academy of Sciences, and the Innovative Groups in Gansu Province (grant no. 20JR10RA038).
This paper was edited by Fuqiang Tian and reviewed by two anonymous referees.
Beyer, M., Hamutoko, J. T., Wanke, H., Gaj, M., and Koeniger, P.: Examination of deep root water uptake using anomalies of soil water stable isotopes, depth-controlled isotopic labeling and mixing models, J. Hydrol., 566, 122–136, https://doi.org/10.1016/j.jhydrol.2018.08.060, 2018.
Cao, R. F. and Jin, X. M.: Distribution Characteristics of Soil Moisture in the Three Rivers Headwaters Region, China, J. Environ. Inform. Lett., 6, 55–65, https://doi.org/10.3808/jeil.202100067, 2021.
Cao, W., Sheng, Y., Wu, J., Wang, S., and Ma, S.: Seasonal variation of soil hydrological processes of active layer in source region of the Yellow River, Adv. Water Sci., 29, 1–10, https://doi.org/10.14042/j.cnki.32.1309.2018.01.001, 2018.
Chang, J., Wang, G. X., Gao, Y. Y., and Wang, Y. B.: Impacts of snow cover change on soil water-heat processes of swamp and meadow in Permafrost Region, Qinghai-Tibetan Plateau, Acta Ecolog. Sin., 32, 7289–7301, https://doi.org/10.11733/j.issn.1007-0435.2021.Z1.023, 2012.
Chen, G. Q., Zhu, C. X., Li, S. Y., Zhou, B. R., Li F., Cao X. Y., and Zhou, H. K.: Remote Sensing Model Constructions and Spatial-temporal Changes of Soil Moisture in the Three-River Headwaters Region, Acta Agrest. Sin., 29, 199–207, https://doi.org/10.11733/j.issn.1007-0435.2021.Z1.023, 2021.
Cheng, H.: Future Earth and Sustainable Developments, Innovation, 1, 100055, https://doi.org/10.1016/j.xinn.2020.100055, 2020.
Deng, M., Meng, X., Li, Z., Lyv, Y., Lei, H., Zhao, L., Zhao, S., Ge, J., and Jing, H.: Responses of soil moisture to regional climate change over the Three Rivers Source Region on the Tibetan Plateau, Int. J. Climatol., 40, 2403–2417, https://doi.org/10.1002/joc.6341, 2019.
Fan, J., Shao, Q., Liu, J., Wang, J., Chen, Z., Zhong, H., Xu, X., and Liu, R.: Dynamic Changes of Grassland Yield in Three River Headwater Region from 1988 to 2005, Acta Agrest. Sin., 18, 5–10, https://doi.org/10.11733/j.issn.1007-0435.2010.01.002, 2010.
Gaj, M., Beyer, M., Koeniger, P., Wanke, H., Hamutoko, J. T., and Himmelsbach, T.: In situ unsaturated zone water stable isotope (2H and 18O) measurements in semi-arid environments: a soil water balance, Hydrol. Earth Syst. Sci., 20, 715–731, https://doi.org/10.5194/hess-20-715-2016, 2016.
Geris, J., Tetzlaff, D., McDonnell, J. J., and Soulsby, C.: Spatial and temporal patterns of soil water storage and vegetation water use in humid northern catchments, Sci. Total Environ., 595, 486–493, https://doi.org/10.1016/j.scitotenv.2017.03.275, 2017.
Guan, X. J., Westbrook, C. J., and Spence, C.: Shallow soil moisture–ground thaw interactions and controls – Part 1: Spatiotemporal patterns and correlations over a subarctic landscape, Hydrol. Earth Syst. Sci., 14, 1375–1386, https://doi.org/10.5194/hess-14-1375-2010, 2010.
Guo, L., Zhu, B., Jin, H., Zhang, Y., Min, Y., He, Y., and Shi, H.: Spatial-Temporal Variation Characteristics and Influencing Factors of Soil Moisture in the Yellow River Basin Using ESA CCI SM Products, Atmosphere, 13, 962, https://doi.org/10.3390/atmos13060962, 2022.
Jeppesen, E., Beklioğlu, M., Özkan, K., and Akyürek, Z.: Salinization Increase due to Climate Change Will Have Substantial Negative Effects on Inland Waters: A Call for Multifaceted Research at the Local and Global Scale, Innovation, 1, 100030, https://doi.org/10.1016/j.xinn.2020.100030, 2020.
Jiao, L., An, W., Li, Z., Gao, G., and Wang, C.: Regional variation in soil water and vegetation characteristics in the Chinese Loess Plateau, Ecol. Indic., 115, 106399, https://doi.org/10.1016/j.ecolind.2020.106399, 2020.
Jiao, Y. L., Li R., Zhao L., Wu T. H., Xiao Y., Hu G. J., and Qiao Y. P.: Processes of soil thawing-freezing and features of soil moisture migration in the permafrost active layer, J. Glaciol. Geocryol., 36, 237–247, https://doi.org/10.7522/j.issn.1000-0240.2014.0030, 2014.
Jin, X., Jin, H.-J., Wu, X., Luo, D.-L., Yu, S., Li, X., He, R.-X., Wang, Q., and Knops, J. M. H.: Permafrost Degradation Leads to Biomass and Species Richness Decreases on the Northeastern Qinghai-Tibet Plateau, Plants, 9, 1453, https://doi.org/10.3390/plants9111453, 2020.
Li, J., Zhou, Z., Wang, H., Liu, J., Jia, Y., Hu, P., and Xu, C.-Y.: Development of WEP-COR model to simulate land surface water and energy budgets in a cold region, Hydrol. Res., 50, 99–116, https://doi.org/10.2166/nh.2017.032, 2017.
Li, T., Chen, Y. Z., Han, L. J., Cheng, L. H., Lv, Y. H., Fu, B. J., Feng, X. M., and Wu, X.: Shortened duration and reduced area of frozen soil in the Northern Hemisphere, Innovation, 2, 100146, https://doi.org/10.1016/j.xinn.2021.100146, 2021.
Li, Z., Feng, Q., Wang, Q. J., Song, Y., Cheng, A., and Li, J.: Contribution from frozen soil meltwater to runoff in an in-land river basin under water scarcity by isotopic tracing in northwestern China, Global Planet. Change, 136, 41–51, https://doi.org/10.1016/j.gloplacha.2015.12.002, 2016.
Li, Z., Ma, J., Song, L., Gui, J., Xue, J., Zhang, B., Gao, W., and Li, Z.: Investigation of soil water hydrological process in the permafrost active layer using stable isotopes, Hydrol. Process., 34, 2810–2822, https://doi.org/10.1002/hyp.13765, 2020.
Lin, J., Ma, R., Sun, Z., and Tang, L.: Assessing the Connectivity of a Regional Fractured Aquifer Based on a Hydraulic Conductivity Field Reversed by Multi-Well Pumping Tests and Numerical Groundwater Flow Modeling, J. Earth Sci., 34, 1926–1939, https://doi.org/10.1007/s12583-022-1674-5, 2023.
Liu, G., Wu, X., Zhao, L., Wu, T., Hu, G., Li, R., Qiao, Y., and Wu, X.: Soil water content in permafrost regions exhibited smaller interannual changes than non-permafrost regions during 1986–2016 on the Qinghai-Tibetan Plateau, Catena, 207, 105668, https://doi.org/10.1016/j.catena.2021.105668, 2021.
Liu, Q., Liu, Y., Jin, M., Zhou, J., and Ferré, P. A.: Improving the Estimation of Salt Distribution during Evaporation in Saline Soil by HP1 Model, J. Earth Sci., 34, 1567–1576, https://doi.org/10.1007/s12583-021-1447-6, 2023.
Liu, Z., Wang, S., and Chen, B.: Spatial and temporal variations of frozen ground and its vegetation response in the eastern segment of China-Mongolia-Russia economic corridor from 2000 to 2015, Acta Geogr. Sin., 76, 1231–1244, https://doi.org/10.11821/dlxb202105014, 2021.
Lu, F.-S., Ade, L.-J., Cheng, Y.-X., and Hou, F.-J.: Relationship between soil moisture and vegetation cover in Qilian Mountain alpine steppe, Acta Pratacult. Sin., 29, 23–32, https://doi.org/10.11686/cyxb2020015, 2020.
Lv, M., Wang, Y., and Gao, Z.: The change process of soil hydrological properties in the permafrost active layer of the Qinghai–Tibet Plateau, Catena, 210, 105938, https://doi.org/10.1016/j.catena.2021.105938, 2022.
Ma, D., Luo, S. Q., Guo, D. L., Lyu, S. H., Meng, X. H., Chen, B. L., and Luo, L. H.: Simulated effect of soil freeze-thaw process on surface hydrologic and thermal fluxes in frozen ground region of the Northern Hemisphere, Sci. Cold Arid Reg., 13, 18–29, 2021.
Marchionni, V., Fatichi, S., Tapper, N., Walker, J. P., Manoli, G., and Daly, E.: Assessing vegetation response to irrigation strategies and soil properties in an urban reserve in southeast Australia, Landsc. Urban Plan., 215, 104198, https://doi.org/10.1016/j.landurbplan.2021.104198, 2021.
Martínez García, G., Pachepsky, Y. A., and Vereecken, H.: Effect of soil hydraulic properties on the relationship between the spatial mean and variability of soil moisture, J. Hydrol., 516, 154–160, https://doi.org/10.1016/j.jhydrol.2014.01.069, 2014.
Shiting, Y., Guangxin, L. U., Xin, L. I., Ning, D., Yingcheng, W., Dongzhu, Z., Gang, F. U., Junbang, W., and Huakun, Z.: Effects of Simulated Warming on Soil Moisture of Alpine Meadow at Chengduo of Yushu Prefecture, Qinghai Province, Ecol. Environ. Sci., 28, 2176–2184, https://doi.org/10.16258/j.cnki.1674-5906.2019.11.005, 2019.
Song, L. L., Li, Z. J., Tian, Q., Wang, L. F., He, J., Yuan, R. F., Gui, J., Zhang, B. J., and Lv, Y. M.: Variation and relationship between soil moisture and environmental factors in the source region of the Yangtze River from 2005 to 2016, Sci. Cold Arid Reg., 11, 184–193, 2019.
Spennemann, P. C., Salvia, M. M., Ruscica, R. C., Sörensson, A. A., Grings, F. M., and Karszenbaum, H.: Land-atmosphere interaction patterns in southeastern South America using satellite products and climate models, Int. J. Appl. Earth Obs. Geoinf., 64, 96–103, https://doi.org/10.1016/j.jag.2017.08.016, 2018.
Sprenger, M., Tetzlaff, D., and Soulsby, C.: Soil water stable isotopes reveal evaporation dynamics at the soil–plant–atmosphere interface of the critical zone, Hydrol. Earth Syst. Sci., 21, 3839–3858, https://doi.org/10.5194/hess-21-3839-2017, 2017.
Sun, H., Sun, X., Wei, X. F., Huang, X., Ke, G., and Wei, H.: Geochemical Characteristics and Origin of Nuanquanzi Geothermal Water in Yudaokou, Chengde, Hebei, North China, J. Earth Sci., 34, 838–856, https://doi.org/10.1007/s12583-022-1635-z, 2023.
Tan, H., Liu, Z., Rao, W., Wei, H., Zhang, Y., and Jin, B.: Stable isotopes of soil water: Implications for soil water and shallow groundwater recharge in hill and gully regions of the Loess Plateau, China, Agricult. Ecosyst. Environ., 243, 1–9, https://doi.org/10.1016/j.agee.2017.04.001, 2017.
Wang, P.: Low-latitude forcing: A new insight into paleo-climate changes, Innovation, 2, 100145, https://doi.org/10.1016/j.xinn.2021.100145, 2021.
Wang, Y. B., Wang G. X., Wu, Q. B., Niu, F. J., Wang, G. X., and Cheng, H. Y.: The Impact of Vegetation Degeneration on Hydrology Features of Alpine Soil, J. Glaciol. Geocryol., 32, 989–998, https://doi.org/10.7522/j.issn.1000-0240.2010.0135, 2010.
Wang, Y. B., Niu, F. J., Wen, J., Wu, Q. B., and Zhang, W.: Study of the Soil Hydrological Process in the Source Regions of the Yangtze River, China, Adv. Mater. Res., 518–523, 4266–4272, https://doi.org/10.4028/www.scientific.net/AMR.518-523.4266, 2012.
Wei, X., Huang, Q., Huang, S., Leng, G., Qu, Y., Deng, M., Han, Z., Zhao, J., Liu, D., and Bai, Q.: Assessing the feedback relationship between vegetation and soil moisture over the Loess Plateau, China, Ecol. Indic., 134, 108493, https://doi.org/10.1016/j.ecolind.2021.108493, 2022.
Wen, J., Qin, R., Zhang, S., Yang, X., and Xu, M.-H.: Effects of long-term warming on the aboveground biomass and species diversity in an alpine meadow on the Qinghai-Tibetan Plateau of China, J. Arid Land, 12, 252–266, https://doi.org/10.1007/s40333-020-0064-z, 2020.
Xiang, L., Wang, H., Steffen, H., Wu, P., Jia, L., Jiang, L., and Shen, Q.: Groundwater storage changes in the Tibetan Plateau and adjacent areas revealed from GRACE satellite gravity data, Earth Planet. Sc. Lett., 449, 228–239, https://doi.org/10.1016/j.epsl.2016.06.002, 2016.
Xue, X., You, Q., Peng, F., Dong, S., and Duan, H.: Experimental Warming Aggravates Degradation-Induced Topsoil Drought in Alpine Meadows of the Qinghai–Tibetan Plateau, Land Degrad. Dev., 28, 2343–2353, https://doi.org/10.1002/ldr.2763, 2017.
Yang, Z., Hua, O., Zhang, X.-Z., Xu, X., Zhou, C.-P., and Yang, W.-B.: Spatial variability of soil moisture at typical alpine meadow and steppe sites in the Qinghai-Tibetan Plateau permafrost region, Environ. Earth Sci., 63, 477–488, https://doi.org/10.1007/s12665-010-0716-y, 2011.
Yue, D., Mu, X., Zhou, Y., Guo, X., Wei, L., and Guo, J.: Coupling relationship between net primary productivity and soil moisture content in the Shule River Basin, J. Lanzhou Univ. Nat. Sci., 57, 518–527 + 536, https://doi.org/10.13885/j.issn.0455-2059.2021.04.012, 2021.
Yue, D., Zhou, Y., Guo, J., Chao, Z., and Guo, X.: Relationship between net primary productivity and soil water content in the Shule River Basin, Catena, 208, 105770, https://doi.org/10.1016/j.catena.2021.105770, 2022.
Zhang, Q., Wang, Y., and Wang, Y. L.: Preliminary study on the components of the lower crust in east China Plateau during Yanshanian Period: Constraints on Sr and Nd isotopic compositions of adakite-like rocks, Acta Petrol. Sin., 17, 505–513, 2001.