the Creative Commons Attribution 4.0 License.
the Creative Commons Attribution 4.0 License.
 | 15 Feb 2024
Glaciers determine the sensitivity of hydrological processes to perturbed climate in a large mountainous basin on the Tibetan Plateau
The major rivers on the Tibetan Plateau supply important freshwater resources to riparian regions but have been undergoing significant climate change in recent decades. Understanding the sensitivities of hydrological processes to climate change is important for water resource management, but large divergences exist in previous studies because of the uncertainties of hydrological models and climate projection data. Meanwhile, the spatial pattern of local hydrological sensitivities was poorly explored despite the strong heterogeneity on the Tibetan Plateau. This study adopted the climate perturbation method to analyze the hydrological sensitivities of a typical large mountainous basin (Yarlung Tsangpo River, YTR) to climate change. We utilized the tracer-aided hydrological model Tsinghua Representative Elementary Watershed-Tracer-aided version (THREW-T) to simulate the hydrological and cryospheric processes in the YTR basin. Multiple datasets and internal stations were used to validate the model to provide confidence in the baseline simulation and the sensitivity analysis. Results indicated that (1) the THREW-T model performed well in simulating the streamflow, snow cover area (SCA), glacier mass balance (GMB) and stream water isotope, ensuring good representation of the key cryospheric processes and a reasonable estimation of the runoff components. The model performed acceptably in simulating the streamflow at eight internal stations located in the mainstream and two major tributaries, indicating that the spatial pattern of hydrological processes was reflected by the model. (2) Increasing temperature led to decreasing annual runoff, smaller inter-annual variation, more even intra-annual distribution and an earlier maximum runoff. It also influenced the runoff regime by increasing the contributions of rainfall and glacier melt overland runoff but decreasing the subsurface runoff and snowmelt overland runoff. Increasing precipitation had the opposite effect to increasing temperature. (3) The local runoff change in response to increasing temperature varied significantly, with a changing rate of −18.6 % to 54.3 % for 5∘ of warming. The glacier area ratio (GAR) was the dominant factor in the spatial pattern of hydrological sensitivities to both perturbed temperature and precipitation. Some regions had a non-monotonic runoff change rate in response to climate perturbation, which represented the most dynamic regions within the basin, as they kept shifting between energy- and water-limited stages. The GAR and mean annual precipitation (MAP) of the non-monotonic regions had a linear relation and formed the boundary of regions with different runoff trends in the GAR–MAP plot.
- Article
(4578 KB) - Full-text XML
-
Supplement
(797 KB) - BibTeX
- EndNote


The Tibetan Plateau (TP), known as the “Asian Water Tower”, is the source region of several major rivers in Asia (e.g., Yarlung Tsangpo–Brahmaputra Lantsang–Mekong, Indus, Ganges). The contributions of runoff in the source regions of TP rivers to the total runoff in whole basins range from 6 % to 60 % (Tang et al., 2019; L. Wang et al., 2021; Cao and Pan, 2014), sustaining the ecosystems and supplying valuable freshwater resources for downstream livelihoods (Immerzeel et al., 2010; Lutz et al., 2014). The sustainable socioeconomic development and the decision-making of water resource management in the riparian countries around the TP rely heavily on the runoff in the major river basins (Cui et al., 2023). Meanwhile, the TP is a typical high mountainous cryosphere characterized by large stores of frozen soil and frequent multiphase water transfer, resulting in complex hydrological processes and multiple water sources including rainfall, snowmelt and glacier melt (Li et al., 2019; Yao et al., 2022). The melting processes of frozen water are determined by the energy budget, and the runoff change on the TP is extremely sensitive to climate change (Gao et al., 2019). Consequently, understanding hydrological processes and estimating the runoff change on the TP is not only of great practical significance but is also a frontier scientific question in global change.
The TP has undergone significant climate change in recent decades, with a warming rate twice the global average level (Yao, 2019). Based on the recently released Coupled Model Intercomparison Project Phase 6 (CMIP6) (Eyring et al., 2016), warming levels of 1.5, 2 and 3 ∘C over the TP will be attained around the 2030s, 2050s and 2070s, respectively, and the precipitation is also likely to increase significantly (Cui et al., 2023). The hydrological cycling and water resources will change correspondingly; thus, it is important to understand the hydrological processes on the TP and the hydrological response to climate change. Plenty of studies have adopted hydrological models to project the runoff change on the TP in the future, but the reported trends and changing rates have varied considerably in existing studies. T. Wang et al. (2021) and Lutz et al. (2014) projected an increasing runoff trend till the end of the 21st century, while Cui et al. (2023) predicted the runoff to decrease before the 2030s and turn to an increasing trend after that. The primary reason for the divergence in existing studies is the model uncertainties. The parameters are usually inadequately constrained solely by the streamflow observation data because of the complex hydrological processes, resulting in large uncertainties in the estimation of the contributions of runoff components (Tian et al., 2020; Nan et al., 2021a), which influence the runoff projection significantly. For instance, Lutz et al. (2014) estimated the contribution of glacier melt to annual runoff as 0.86 %–40.59 % in the major TP rivers, resulting in an increasing runoff with climate warming, while Cui et al. (2023) estimated the contribution as 0.73 %–14.33 %, resulting in a decreasing trend in the near future. Nonetheless, recently developed hydrological models integrating key cryospheric processes (e.g., Cui et al., 2023) have proven effective tools for hydrological simulations on the TP, and the high-quality datasets of snow and glaciers (e.g., Chen et al., 2018; Hugonnet et al., 2021 can provide adequate validation for the corresponding models. Moreover, tracer-aided hydrological models integrating modules of tracer storage, mixture and transportation processes forced by the outputs of isotopic general circulation models (iGCMs) have proved to constrain the hydrological model uncertainties significantly (He et al., 2019; Birkel and Soulsby, 2015; Stadnyk and Holmes, 2023), especially for the separation of runoff components (Nan et al., 2021a, 2023). These developments of models and datasets have the potential to provide a more reasonable baseline for streamflow projection.
Another major source of runoff projection uncertainty is the uncertainty of climatic forcing data (Li et al., 2014). The climatic data in the future are generally generated by the GCMs, which cannot be directly adopted at the catchment scale because of the insufficient spatial resolution and accuracy, so downscaling and bias correction are necessary steps in using GCM data at the regional scale (Xu et al., 2019; Olsson et al., 2015). However, even when corrected by the observation data during the historical period, the divergence among the outputs of different GCMs is still significant. For example, the difference in the precipitation change over the TP among 22 CMIP6 products could be larger than 50 % (Cui et al., 2023). Bloschl and Montanari (2010) pointed out the large uncertainties of studies analyzing the impact of climate change and compared them to throwing dice. As an alternative method, producing hypothesized climate change scenarios by perturbing the current temperature and precipitation data has proven valuable in investigating the hydrological sensitivities to climate change (Aygun et al., 2020; Rasouli et al., 2015; Z. H. He et al., 2021). The range of climate perturbation is assumed based on the possible change range projected by an ensemble of GCMs, providing a possible runoff change range accordingly (Su et al., 2023; Z. H. He et al., 2021). The climate perturbation method also allows for a deeper analysis of the separate effect of each climatic factor and the compensation effects among them (He and Pomeroy, 2023).
Although plenty of studies have been conducted for the TP rivers to project the runoff change or analyze the hydrological sensitivities to climate change, most of them were conducted at the regional or basin scale (e.g., Su et al., 2023; Zhang et al., 2022b). The local hydrological response to climate change could significantly differ among small catchments due to the different geographical and meteorological characteristics (Bai et al., 2023), which is important for local water resource utilization and management (Zhang et al., 2015). Considering the strong heterogeneity in meteorological factors and land surface conditions in the large river basins on the TP (Y. W. Wang et al., 2021); Li et al., 2020), the local hydrological sensitivities to climate change should have strong variability over the TP. However, the spatial pattern and influence factors of the local hydrological sensitivities within the basin are poorly explored, partly due to the scarce hydrological stations for model validation, resulting in a lack of confidence in the spatial representation of hydrological processes.
Motivated by the mentioned background, this study utilized the spatially distributed tracer-aided hydrological model Tsinghua Representative Elementary Watershed-Tracer-aided version (THREW-T) developed by Nan et al. (2021b) in the Yarlung Tsangpo River basin, a typical large mountainous basin on the Tibetan Plateau, to explore its hydrological sensitivity to perturbed temperature and precipitation. Snow, glacier, isotope data and observation streamflow at nine stations were collected to validate the model. The spatial pattern of the local hydrological sensitivities and the influence factors were analyzed in particular. The main objectives of this study are as follows: (1) to test the performance of the THREW-T model in simulating all the hydrological and cryospheric processes in the Yarlung Tsangpo River basin, (2) to analyze the sensitivities of hydrological processes in the Yarlung Tsangpo River basin to a reasonable range of perturbed temperature and precipitation and (3) to analyze the spatial pattern and the influence factors of the local hydrological sensitivities.
2.1 Study area
This study focused on the Yarlung Tsangpo River (YTR) basin, the upstream part of the Brahmaputra River basin, located on the southern TP (Fig. 1). The YTR is one of the longest rivers originating from the TP (longer than 2000 km), extending in the range of 27–32∘ N and 82–97∘ E with an elevation extent of 2900–6900 m a.s.l. (above sea level). The mean annual precipitation and temperature in the YTR basin are around 500 mm and −0.2 ∘C, respectively. The YTR has four major tributaries, i.e., the Doxung Zangbo, Nianchu River, Lhasa River and Nyang River, from upstream to downstream. The precipitation is dominated by the South Asian monsoon in the Indian Ocean hydrosphere–atmosphere system, resulting in an obviously wet season from June to September. The outlet hydrological station along the mainstream is the Nuxia station, above which the drainage area is approximately 2×10⁵ km2, and around 1.5 % is covered by glaciers.
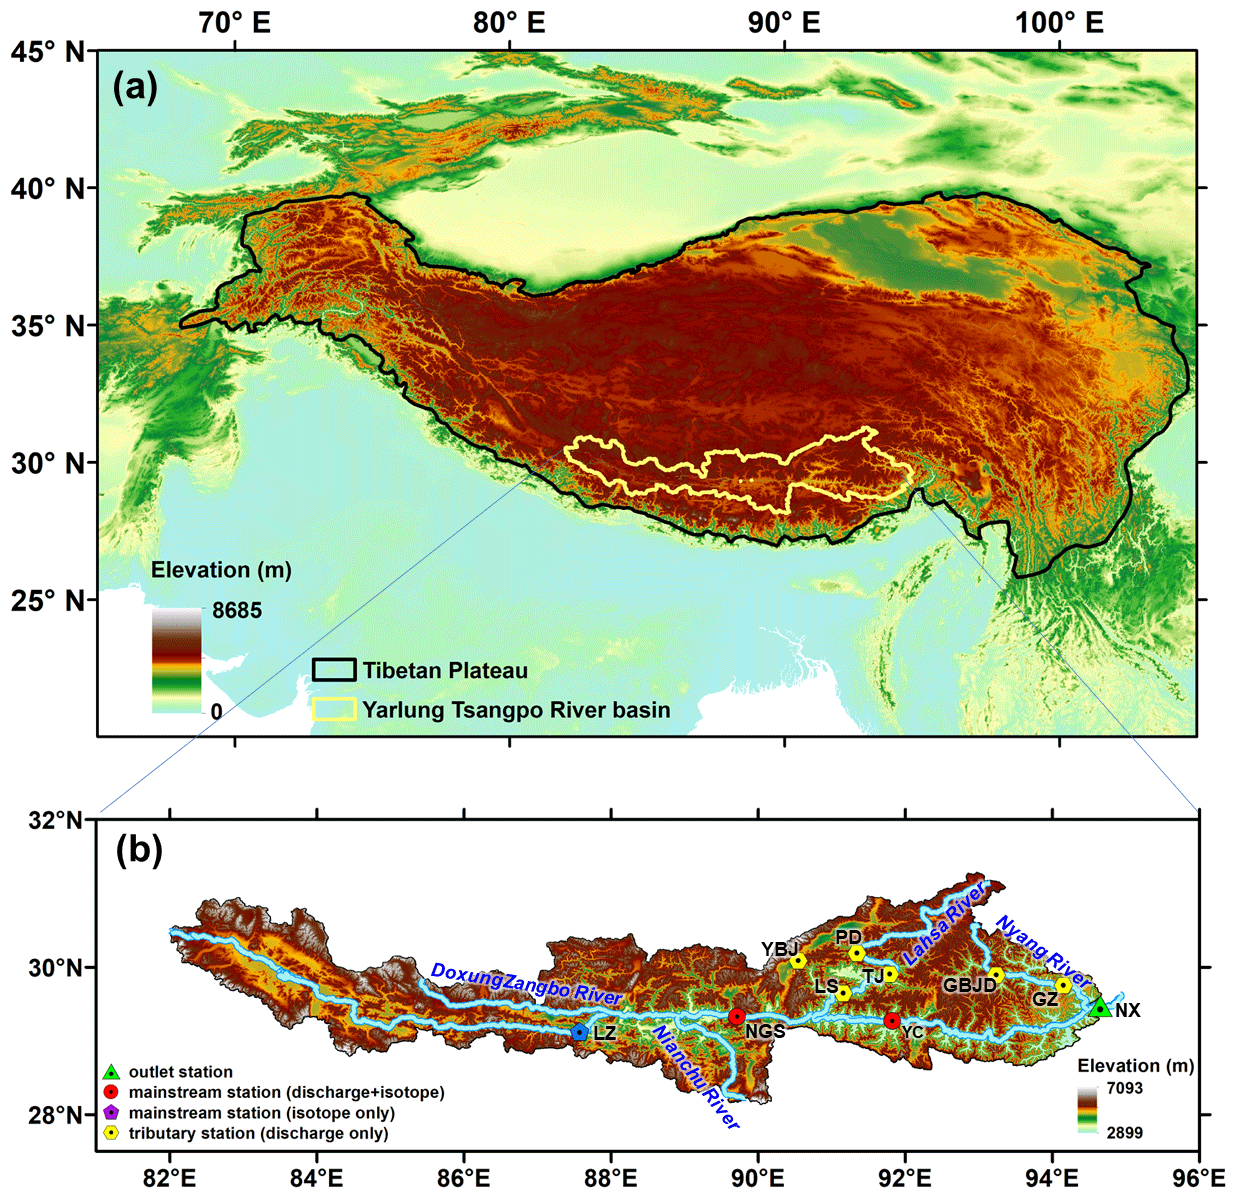
Figure 1Locations and topography of (a) the Tibetan Plateau and (b) the Yarlung Tsangpo River basin. The stations used for model validation are shown in panel (b). The abbreviations NX, YC, NGS, LZ, GZ, GBJD, LS, TJ, PD and YBJ represent the Nuxia, Yangcun, Nugesha, Lazi, Gengzhang, Gongbujiangda, Lahsa, Tangjia, Pangduo and Yangbajing stations, respectively.
2.2 Data
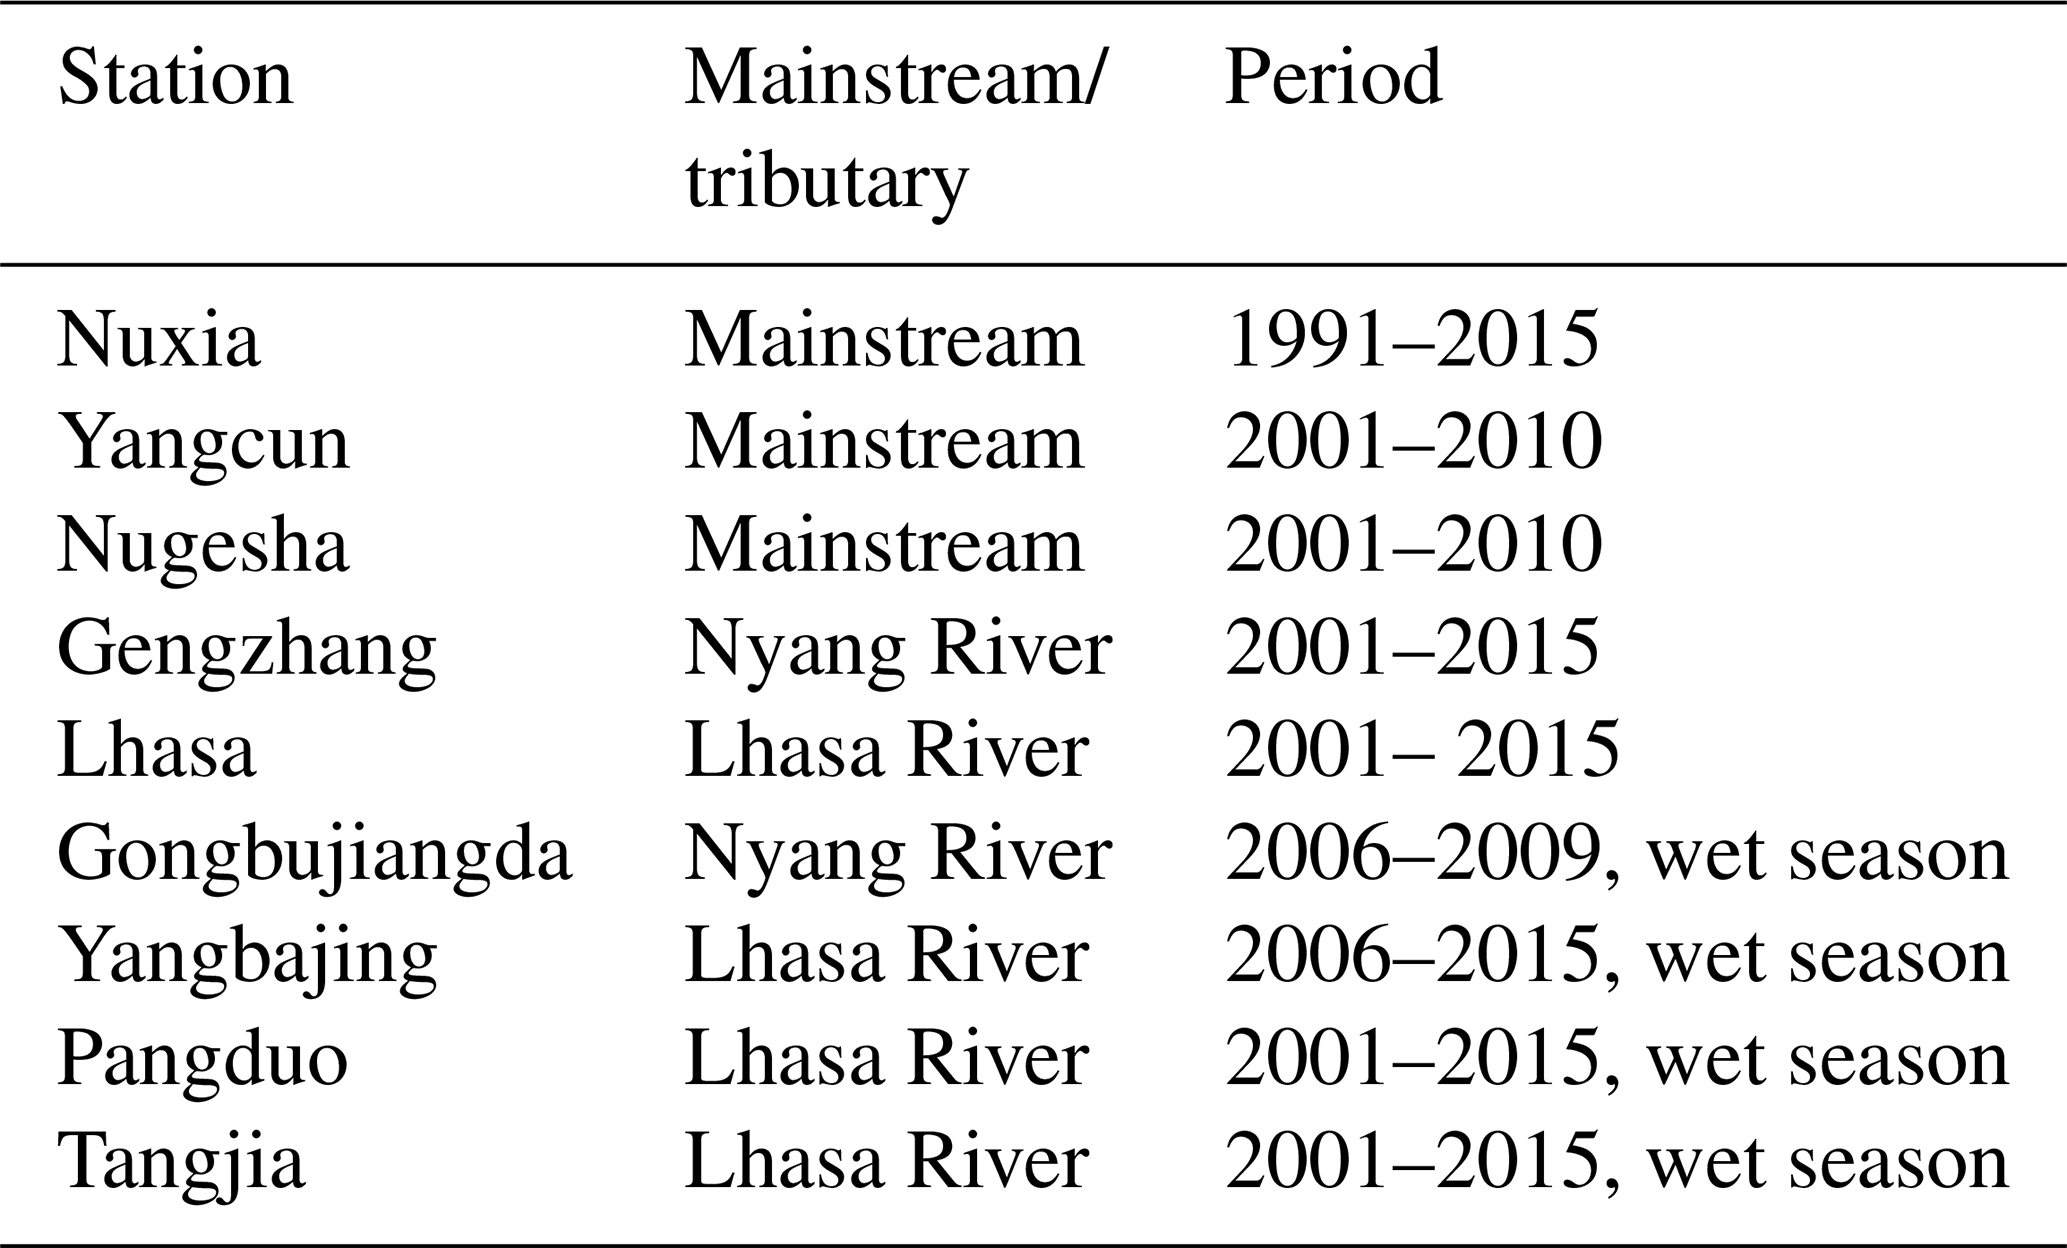
The 30 m resolution digital elevation model (DEM) data for the YTR basin were extracted from the Geospatial Data Cloud (https://www.gscloud.cn, last access: 1 January 2019). Daily precipitation, temperature and potential evapotranspiration data were extracted from the China Meteorological Forcing Dataset (CMFD, Yang and He, 2019) with 0.1∘ resolution. For the cryospheric processes, the Tibetan Plateau Snow Cover Extent (TPSCE) product (Chen et al., 2018) and the second glacier inventory dataset of China (Liu, 2012) were adopted to denote the snow and glacier coverage. The yearly glacier elevation change data with 0.5∘ resolution developed by Hugonnet et al. (2021) were used to represent the glacier mass balance. For the underlying conditions, the MODIS leaf area index (LAI) product MOD15A2H (Myneni et al., 2015) and the normalized difference vegetation index (NDVI) product MOD13A3 (Didan, 2015) were adopted to represent the vegetation coverages, and the Harmonized World Soil Database (HWSD, He, 2019) was used to estimate the soil property parameters. Daily streamflow data at nine stations were collected (Fig. 1 and Table 1).
Table 1The name, location and data period of the hydrological stations.
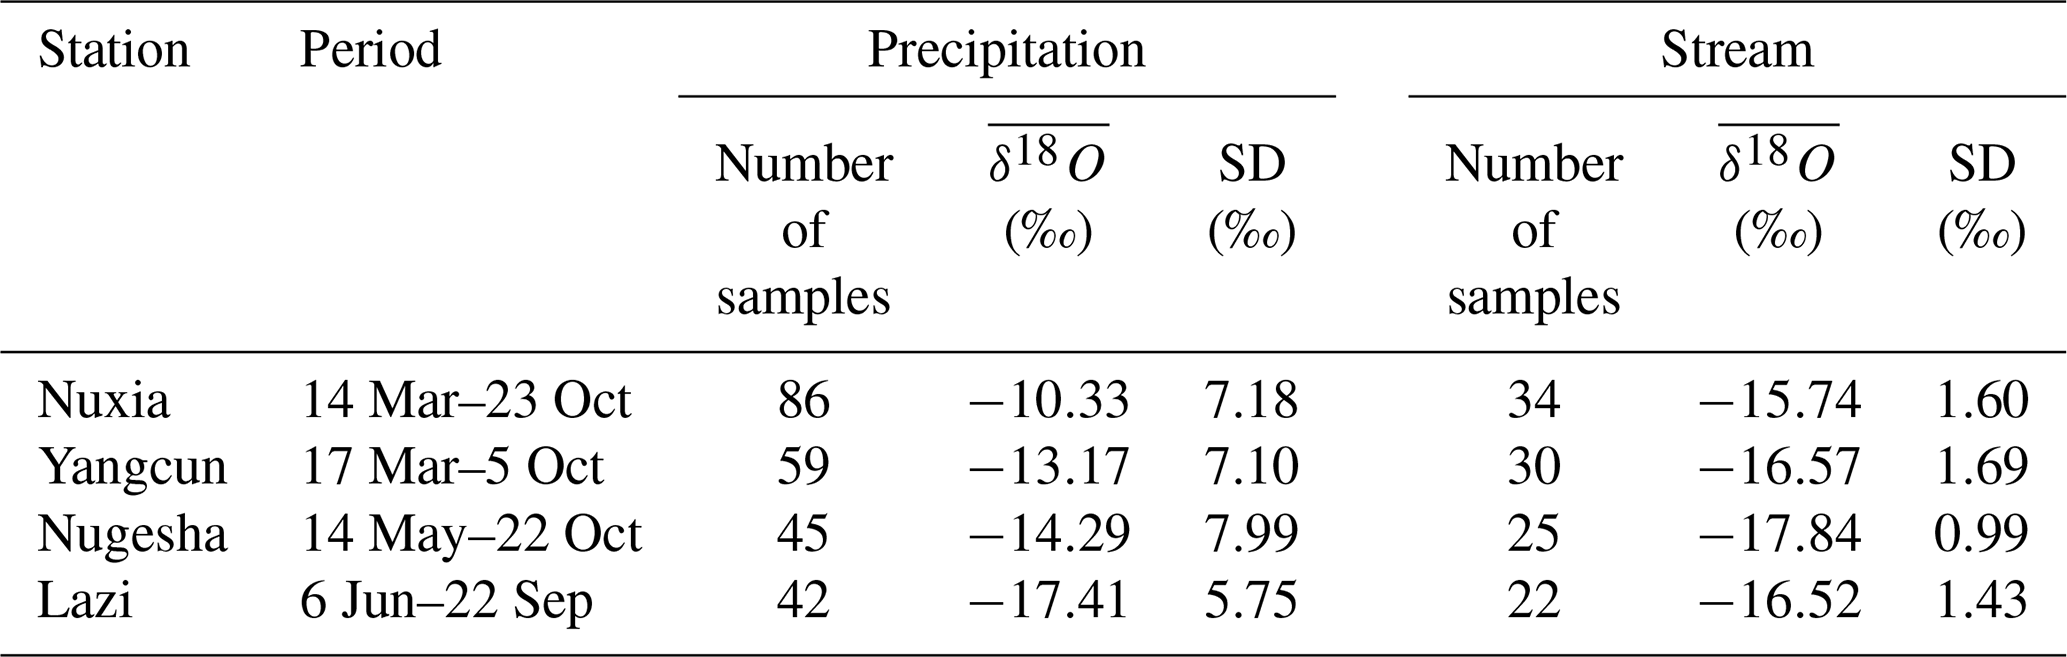
Grab samples of precipitation and stream water were collected in 2005 at four stations along the mainstream of the YTR, i.e., Lazi, Nugesha, Yangcun and Nuxia, from upstream to downstream, for isotope analysis (Table 2, Liu et al., 2007). The outputs of the Scripps Global Spectral Model with an isotope incorporated (isoGSM, Yoshimura et al., 2008) with 1.875∘ resolution were extracted to represent the spatiotemporal variation of a precipitation isotope in the YTR basin. According to our previous assessment based on the measurement precipitation isotope data, the isoGSM captured the seasonality of the precipitation isotope well but had systematic overestimation biases in the YTR basin, which were highly correlated with the altitude (Nan et al., 2021a). The corrected isoGSM in the YTR basin produced by Nan et al. (2022) was adopted in this study.
Table 2Summary of the measurement isotope data in the YTR basin during 2005.
2.3 The tracer-aided hydrological model
A distributed tracer-aided hydrological model, THREW-T, developed by Tian et al. (2006) and Nan et al. (2021b), was adopted to simulate the hydrological and isotopic processes in the YTR basin. The model uses the representative elementary watershed (REW) method for spatial discretization of basins, dividing the whole catchment into REWs based on DEM data. Each REW is further divided into two vertically distributed layers (i.e., surface and subsurface layers), including eight subzones (i.e., surface layer: vegetation zone, bare zone, main channel reach zone, sub-stream network zone, snow-covered zone and glacier-covered zone; subsurface layer: unsaturated zone and saturated zone) (Reggiani et al., 1999; Tian et al., 2006). This study divided the YTR basin into 297 REWs, with an average area of 694 km2, ranging from 162 to 2753 km2. More model details are provided in Tian et al. (2006).
A cryospheric module representing the evolutions of snowpack and glacier was incorporated into the model for application in cold regions. The total precipitation was partitioned into liquid and solid precipitation according to a temperature threshold, which was set as 0 ∘C. The degree-day factor method was used to calculate the meltwater. The snow water equivalent of each REW was updated based on the snowfall (i.e., the solid precipitation) and the snowmelt, and the snow cover area was then determined by the snow cover depletion curve (Fassnacht et al., 2016). To simulate the evolution of glaciers, each REW is further divided into several elevation bands to represent the change in temperature and precipitation along the altitudinal profile. The glacier within the intersection of each REW and elevation band is regarded as the representative unit for glacier simulation, similar to the discretization strategy adopted by Luo et al. (2013). For each glacier simulation unit, the model simulates the processes including the accumulation and snowmelt over a glacier, the turnover of snow to ice, and the ice melt. More details and equations of the cryospheric module are provided in Nan et al. (2021b) and Cui et al. (2023).
The tracer module was incorporated into the model to simulate the isotope composition of multiple water bodies. The Rayleigh equation was adopted to simulate the isotope fractionation during water evaporation and snowmelt processes (He et al., 2019; Hindshaw et al., 2011). The isotope composition of glacier meltwater was assumed to be constantly more depleted than the local precipitation isotope and was estimated by an offset parameter (Nan et al., 2022). The isotope compositions in each simulation unit were calculated based on the complete mixing assumption. The isotope composition of snowpack and snowmelt was updated based on the water and isotope mass balance of the snowpack, similarly to other water storages. Forced by the precipitation isotope composition, the model can simulate the isotope composition of all the water bodies, including stream water, soil water, groundwater and snowpack. More details and calculation equations of the tracer module are provided in Nan et al. (2021b).
The THREW-T model quantified the contributions of multiple runoff components based on the flow-pathway definition as reviewed by Z. He et al. (2021). The runoff was firstly divided into surface runoff and subsurface runoff (baseflow) based on the runoff generation pathway. The surface runoff was then further divided into three components induced by different water sources (rainfall, snowmelt and glacier melt). As a result, the total runoff was divided into four components: subsurface runoff, rainfall overland runoff, snowmelt overland runoff and glacier melt overland runoff.
2.4 Model calibration and evaluation
The model was run for 25 years from 1991 to 2015 and was calibrated toward four objectives: the discharge at Nuxia station from 2001 to 2015, the snow cover area (SCA) from 2001 to 2015, the average glacier mass balance (GMB) from 2001 to 2010 in the whole YTR basin and the stream water isotope at the four stations in 2005. The Nash–Sutcliffe efficiency (NSE) was set as the evaluation metric for objectives with strong seasonality (discharge and isotope), and the root mean square error (RMSE) was set as the evaluation metric for objectives essentially having fluctuations (SCA and GMB) (Schaefli and Gupta, 2007). The optimization objective function of the calibration procedure was calculated by combining the function of each objective with equal weights.
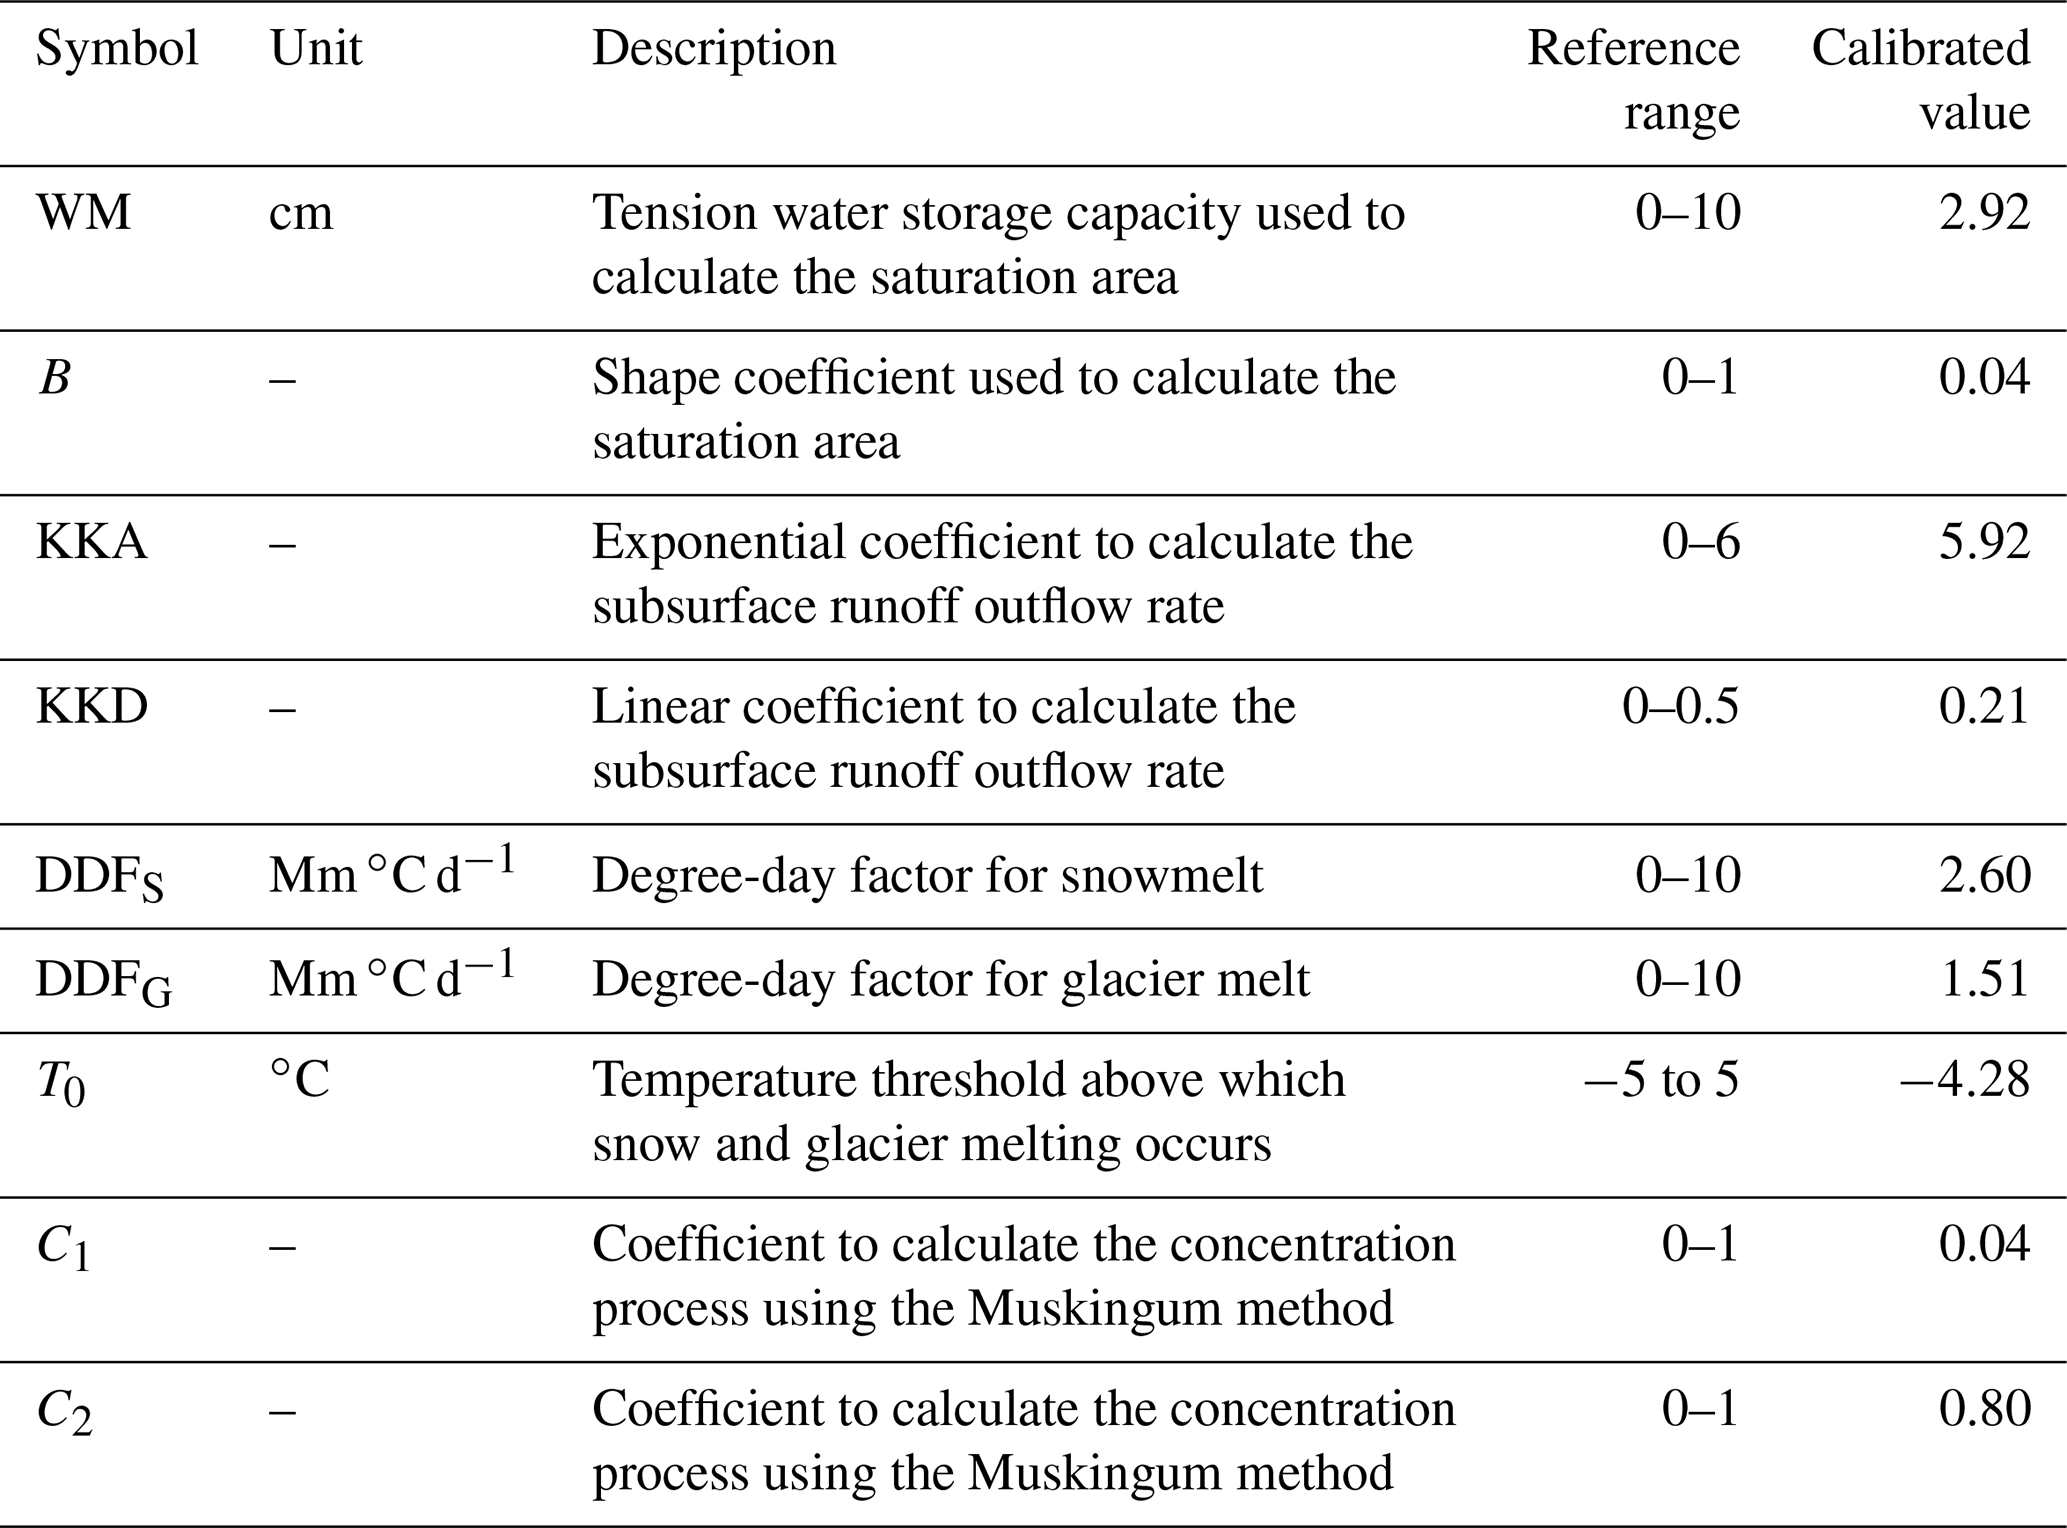
An automatic algorithm, the Python Surrogate Optimization Toolbox (pySOT, Eriksson et al., 2019), was adopted for model calibration. The pySOT algorithm uses radial basis functions (RBFs) as surrogate models to approximate the simulations, reducing the time for each model run. The symmetric Latin hypercube design (SLHD) method was used to generate parameter values, allowing an arbitrary number of design points. In each optimization run, the procedure stopped when a maximum number of allowed function evaluations was reached, which was set as 3000. In this study, the pySOT algorithm was repeated 100 times, and a final parameter set was selected from the calibrated parameter sets manually based on the overall performance on multiple objectives. The physical basis, reference ranges and calibrated values of the calibrated parameters in the THREW-T model are shown in Table 3.
Table 3Physical descriptions, reference ranges and calibrated values of the calibrated parameters in the THREW-T model.
Apart from the calibration functions, the model performances were additionally evaluated by four statistical metrics: logarithmic NSE (lnNSE), RMSE–observation standard deviation ratio (RSR), percent bias (PBIAS) and correlation coefficient (CC). The discharge simulation was evaluated by lnNSE to examine the simulation of the baseflow process. Our previous studies indicated that the discharge simulation performance during validation was highly correlated with that of the calibration period, partly due to the strong linearity of the precipitation–discharge relation in such a large basin, but large uncertainties existed in the discharge simulation at internal stations even when the discharge at an outlet station was simulated well (Nan et al., 2021b, 2022). Consequently, we not only conducted temporal validation based on the discharge data at Nuxia station during 1991–2000, but we also collected additional discharge data at eight internal stations to assess the spatial consistency of model performance. The RMSE and CC of the cumulative glacier mass balance since the beginning of the simulation period were also calculated to assess the glacier simulation considering the temporal interpolation adopted by Hugonnet et al. (2021) which led to uncertainty in the year-scale data.
Xs, Xo, and are the simulated, observed, mean of simulated and mean of observed hydrological variables, respectively, and n is the number of data.
2.5 Perturbed climatic scenario design
Daily temperature and precipitation data extracted from the CMFD dataset were set as the reference climate inputs. Linearly perturbed temperature and precipitation time series were adopted to represent the potential climate change ranges. Perturbed temperature input data were generated by adding 1∘ increments to the reference daily temperature. The maximum temperature increase was set as 5 ∘C, because the temperature in the YTR basin is projected to increase at 1 ∘C per 20 years and will increase by about 5 ∘C until the end of this decade (Cui et al., 2023). The influence of changing temperature on the potential evapotranspiration was estimated by the regression between the two factors (Eq. 7) which was developed by van Pelt et al. (2009) and widely adopted in the projection of potential evapotranspiration (e.g., Xu et al., 2019; Cui et al., 2023).
and are the mean daily temperature and potential evapotranspiration in each REW during the simulation period, respectively. T is the daily temperature generated by the perturbation method. α0 is determined by regressing the input daily potential evapotranspiration and temperature in each REW.
Perturbed precipitation input data were generated by multiplying the reference daily precipitation data from 80 % to 120 % by an increment of 10 %, similar to Su et al. (2023), who analyzed the runoff change in three basins on the TP in hypothesized climate change scenarios. Simulation during 2001–2015 was set as the reference scenario, because the data of most objectives or stations were available during this period. In total, one reference simulation, five simulations of perturbed temperature and four simulations of perturbed precipitation were conducted. To focus on the influence of climate perturbations on the hydrological processes, the changes in underlying conditions such as soil and vegetation were not considered. In each scenario, the standard deviations (SDs) of the simulated annual hydrological variables were calculated to represent the uncertainties introduced by natural climate variability. The t-test analysis of two paired samples was conducted for the annual hydrological variables produced by the reference scenario and each climate perturbation scenario to analyze the statistical significance of the changes. Apart from the basic hydrological variables, the concentration ratio (CR) and concentration period (CP) (Jiang et al., 2022a) were calculated by Eqs. (8)–(10) to characterize the runoff seasonality.
Ri is the runoff in the ith month, and Rx and Ry are the resulting vectors in the x and y directions, respectively. (i=1, 2, …, 12).
3.1 Model performance evaluation
Figure 2 shows the model performances on the four calibration objectives. The discharge was simulated well regarding both high-flow and baseflow processes, as indicated by the high NSE (0.82) and lnNSE (0.84). The occurring times of peak flow were captured by the model, showing consistency in the temporal dynamics of simulated and observed streamflow, but the simulated magnitudes of peak flow were slightly lower than the observation (Fig. 2a), partly due to the poor abilities of precipitation products to accurately capture the high precipitation at high elevations and the number of specific precipitation extreme events (Li et al., 2021; Jiang et al., 2022b; Xu et al., 2017). The performance of discharge simulation during the validation period was similar to that of the calibration period, with an NSE and lnNSE of 0.80 and 0.88, respectively, as shown in Fig. 2a. Nonetheless, the simulated annual runoff (302 mm yr−1) was very close to the observation (303 mm yr−1), indicating that the amount of total runoff was reproduced well. The simulated variation of SCA was smoother than the observation, but the seasonality was captured well, i.e., decreasing sharply in May and remaining extremely low from July to September (Fig. 2b). The low RMSE (<0.1) suggested that the model performed well in simulating the snow processes. The model successfully simulated the declining glacier (Fig. 2c), with an extremely high CC for the cumulative glacier mass balance (∼1). The model estimated the annual GMB in the YTR basin as −0.545 m yr−1, very close to the value extracted from the dataset of Hugonnet et al. (2021) (−0.554 m yr−1). The calibrated melting temperature threshold was rather low (−4.28 ∘C), which was partly due to the fact that melting processes were simulated at the daily step. The model simulated the variation of the stream isotope well, indicated by the high NSE, CC and low PBIAS, which provided confidence in the partitioning among the different runoff components (Nan et al., 2021a; He et al., 2019). The seasonality of the isotope was adequately captured, getting enriched in May, reaching a maximum in June and getting depleted in late June or early July (Fig. 2d). The fact that the model simultaneously satisfied four calibration objectives ensured proper representation of the hydrological and cryospheric processes and provided a reasonable baseline for the sensitivity analysis.
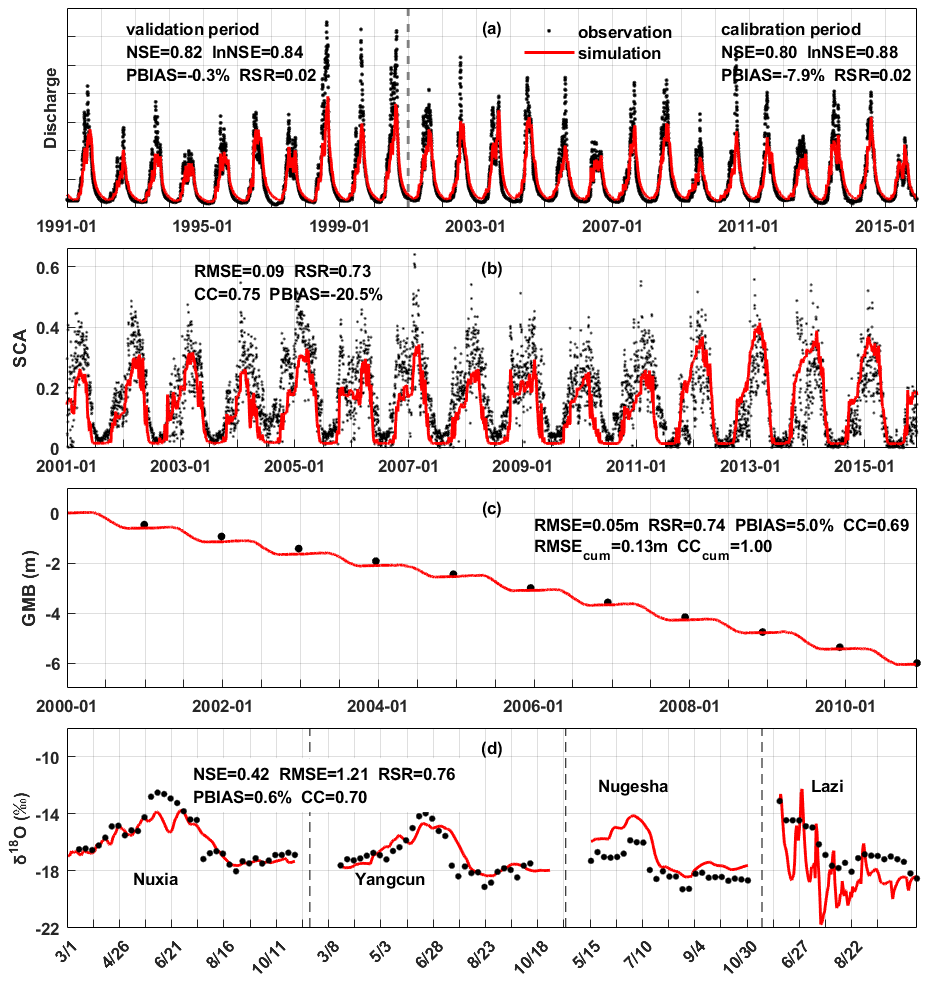
Figure 2The model performances on the calibration objectives. (a) The streamflow discharge at Nuxia station, (b) the snow cover area ratio in the YTR basin, (c) the average glacier mass balance in the YTR basin and (d) the stream water isotope at four stations in 2005.
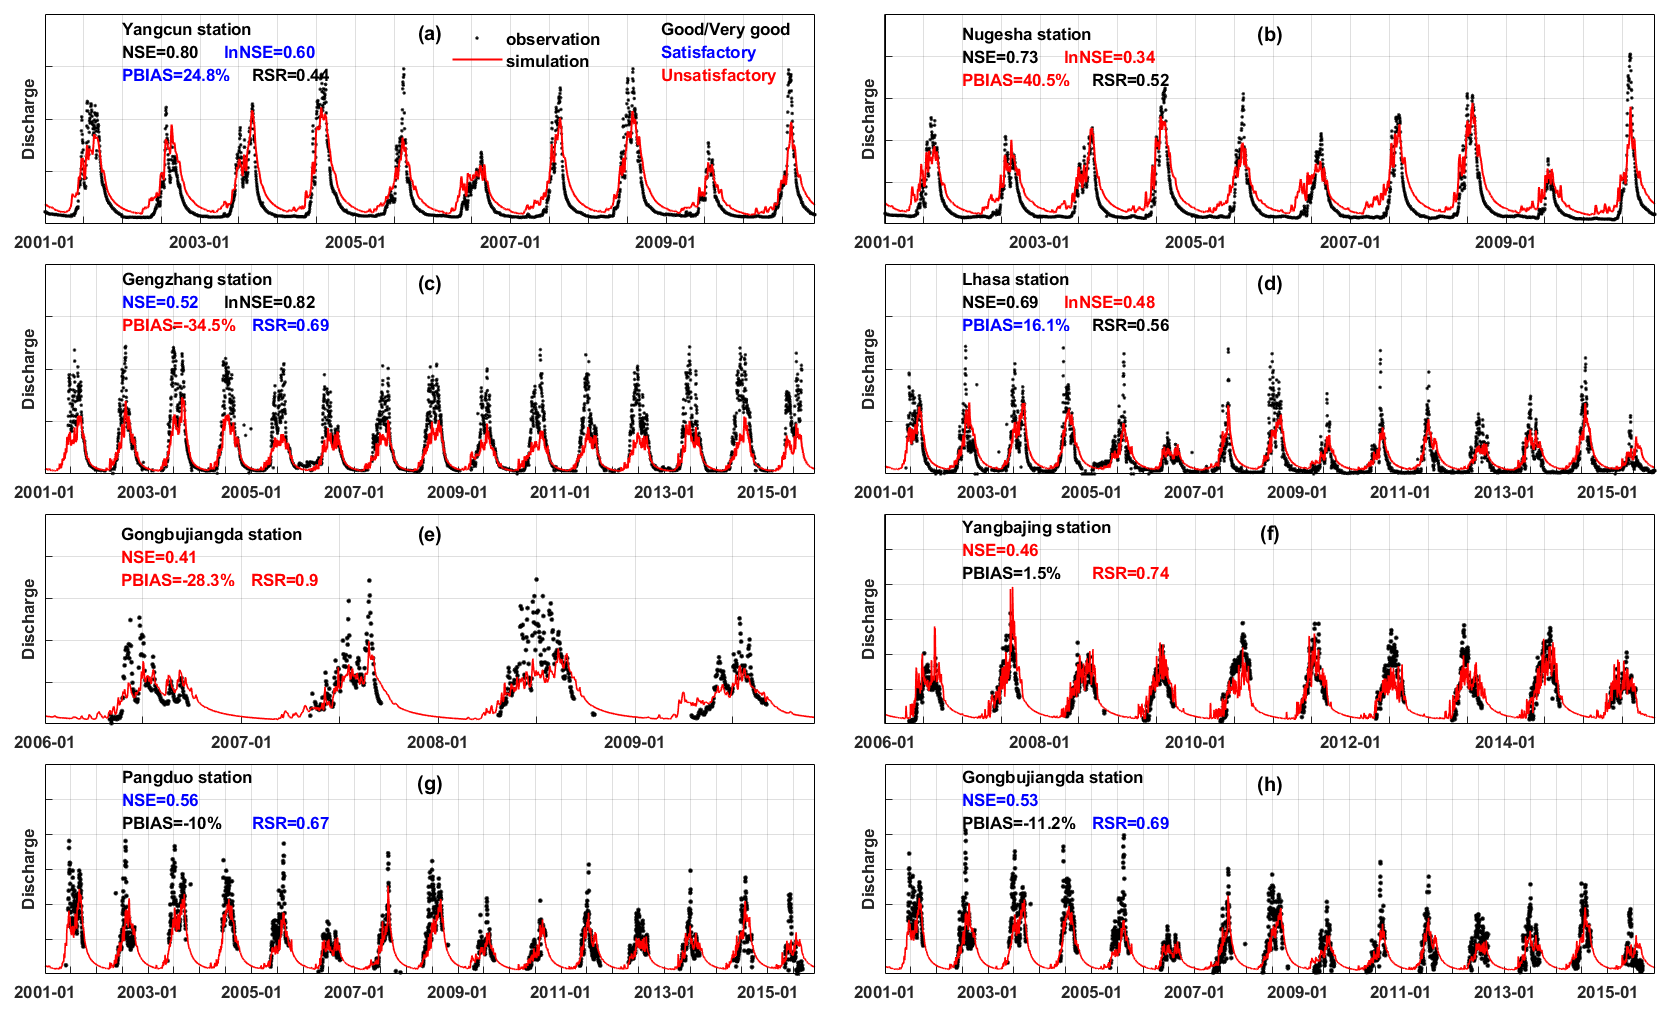
Figure 3 shows the streamflow simulation at eight internal stations. The performance ratings were evaluated based on four metrics following the guideline by Moriasi et al. (2007). At the two stations located along the mainstream (Yangcun and Nugesha), the high-flow processes were simulated well, as indicated by the high NSE, but the baseflows were overestimated (Fig. 3a and b). In contrast, the high-flow processes were underestimated at Gengzhang station, but the baseflows were reproduced well (Fig. 3c). The model produced fair performance in both high-flow and baseflow simulations at Lhasa station, showing a moderate NSE and lnNSE (Fig. 3d). For the four stations where only the data during the wet season were available, the PBIASs were at good levels (within ±15 %) except for Gongbujiangda station (Fig. 3e–h). Overall, the streamflow simulations at the internal stations were not as good as at the calibrated outlet station but were at acceptable levels, as indicated by at least one satisfactory metric except for Gongbujiangda station. The high-flow processes and runoff amount were reproduced relatively well, as indicated by the generally satisfactory NSE and PBIAS. However, the small timescale fluctuations and extremes were mostly not captured well, because the model was not calibrated toward metrics related to hydrological signatures (McMillan et al., 2017; Majone et al., 2022; Fenicia et al., 2018). Nonetheless, the validation based on the internal stations gave confidence in the spatial pattern of the hydrological processes and their sensitivities to the perturbed climate.
3.2 Sensitivities of hydrological variables to perturbed temperature and precipitation
The sensitivities of annual runoff, snow cover area and glacier mass balance to perturbed temperature and precipitation are shown in Fig. 4. The relationships between hydrological variables and precipitation or temperature showed strong linearity, which was similar to Su et al. (2023) analyzing the hydrological sensitivities in three other large basins on the TP (∼105 km2) but is different from Z. H. He et al. (2021), who conducted a similar analysis in a small boreal forest basin in Canada (603 km2). The annual runoff kept decreasing significantly with the increasing temperature at a rate of −2 mm ∘C−1 due to the increasing evaporation (Fig. 4a). The decreasing rate got small when the temperature increase was higher than 3 ∘C, partly because the controlling factor of evaporation changed from energy limitation to water limitation (Wang et al., 2022). The runoff change in response to increasing temperature was rather small compared to the intra-annual runoff variability. The snow cover area ratio significantly reduced with the increasing temperature at a rate of −1.5 % ∘C−1 because of the decreasing snowfall and increasing snowmelt and would be smaller than half of the reference scenario for 5 ∘C of warming (Fig. 4b). The glacier mass balance significantly got more negative with the increasing temperature because of the reducing accumulation and increasing meltwater at a rate of −0.16 m / ∘C−1 (Fig. 4c). Among the three variables, the glacier mass balance was most sensitive to the warming climate, the relative change of which could be 150 % for 5 ∘C of warming (Fig. 4d). The changes in runoff, snow cover area and glacier mass balance in response to increasing temperature were all statistically significant at the 0.01 significance level.
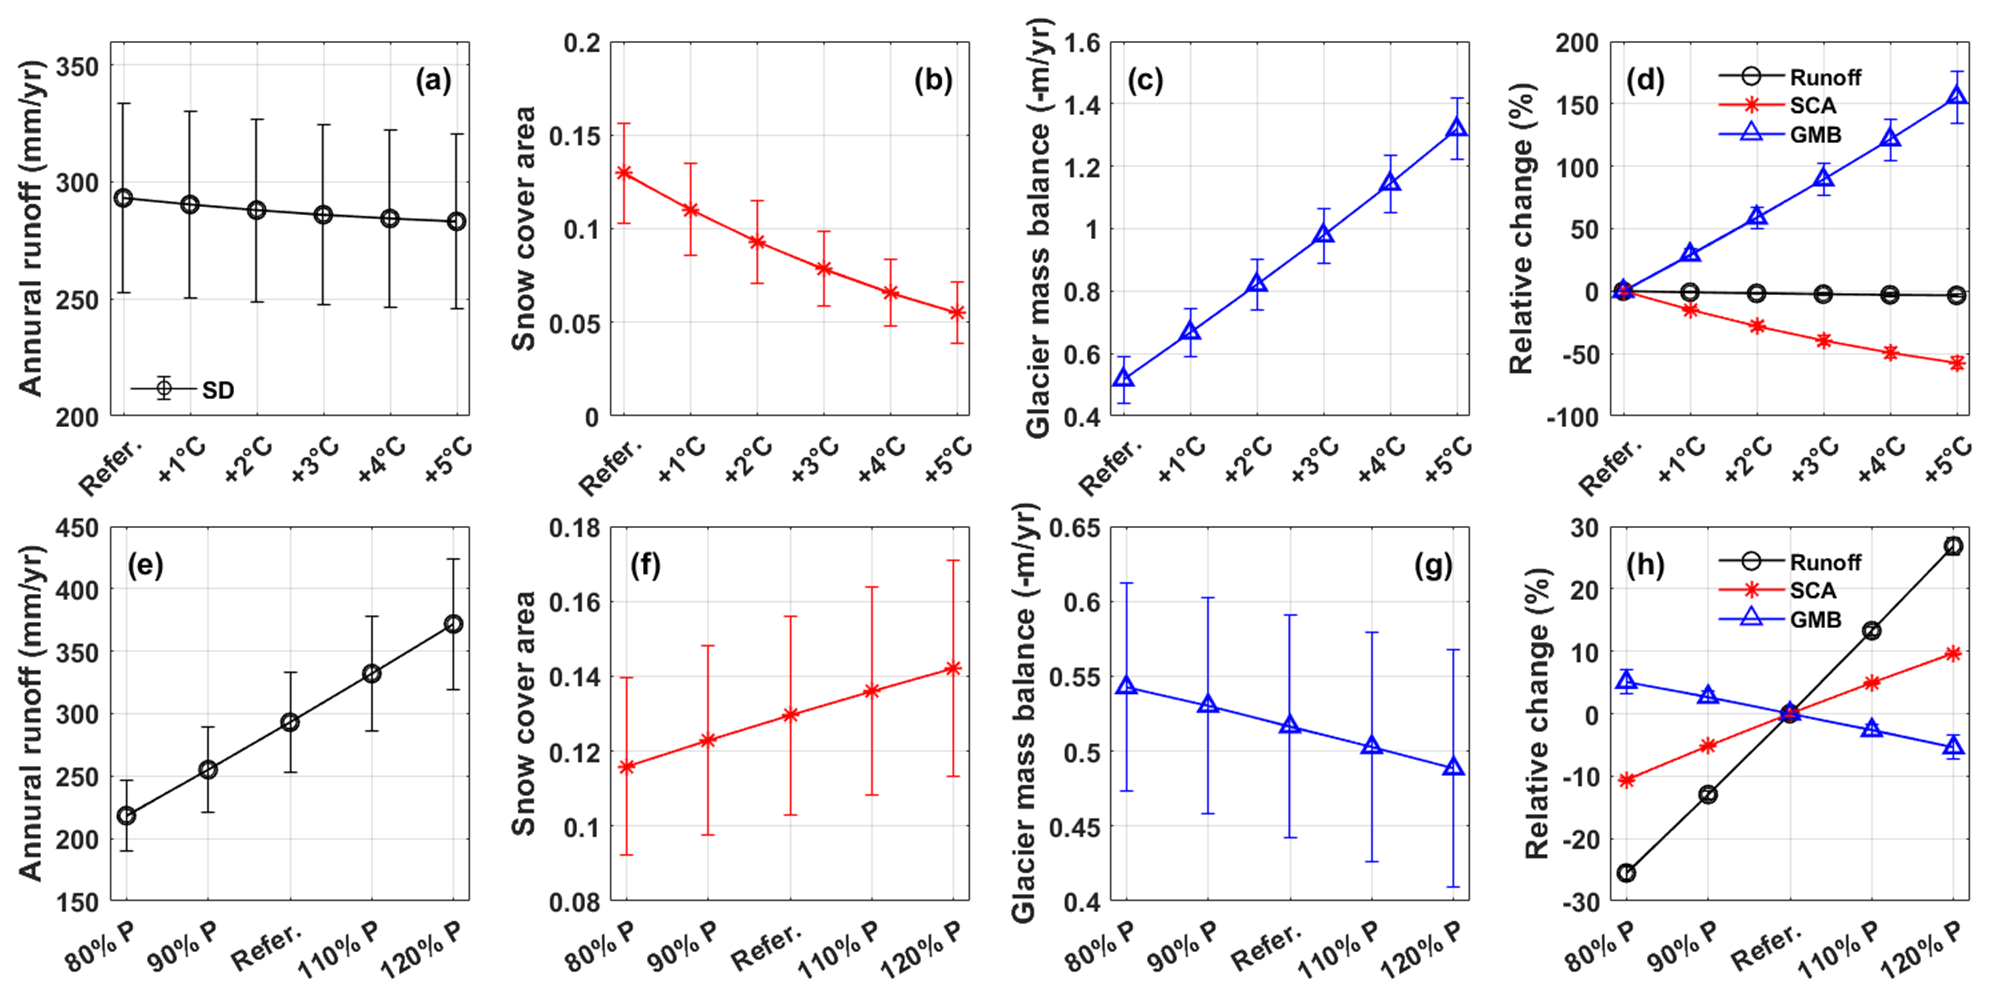
Figure 4The sensitivities of annual runoff, snow cover area and glacier mass balance to the perturbed temperature (a–d) and precipitation (e–g). Subplots (d) and (h) are the relative changes in runoff, SCA and GMB compared to the reference scenario.
The hydrological sensitivities to perturbed precipitation were opposite to those of temperature. The annual runoff increased at a rate of 38.4 mm per 10 % with the increasing precipitation (Fig. 4e). The relative change in runoff was larger than precipitation (Fig. 4h), indicating an increasing runoff coefficient with increasing precipitation. This also indicated a small relative change in evaporation in response to precipitation perturbation, again suggesting that the energy limitation played a more important role than water limitation in evaporation in the reference scenario. With the increasing precipitation, the snow cover area increased at 0.7 % per 10 %, and the glacier mass balance got more positive at 0.014 m per 10 % because of the larger amount of snowfall and snow or ice accumulation (Fig. 4f and g). Among the three variables, runoff had the highest sensitivity to perturbed precipitation, with a relative change rate of 13 % or 10 % (Fig. 4h), while the changes in snow cover area and glacier mass balance were within the range of ±10 % when precipitation changed by 20 %. The changes in runoff, snow cover area and glacier mass balance in response to perturbed precipitation were all statistically significant at the 0.01 significance level.
3.3 Sensitivities of runoff variation to perturbed temperature and precipitation
The sensitivities of inter- and intra-annual runoff variation to perturbed temperature and precipitation are shown in Fig. 5. The average monthly runoff was calculated based on the simulated hydrographs during the entire simulation period, and the inter-annual runoff variation was represented by the SD. The change in the inter-annual runoff variation was consistent with that of the total runoff. The inter-annual runoff variations were also lower in the scenarios with less runoff (increasing temperature or decreasing precipitation), showing the narrower ranges of the error bars in Fig. 5a and b and vice versa. Despite the decreasing runoff caused by increasing temperature, the average runoff for 5 ∘C of warming was still much higher than the lower error bar of the reference scenario (Fig. 5a), suggesting that the runoff change tendency caused by the increasing temperature was relatively small compared to the inherent runoff variability. By contrast, when precipitation increased by 20 %, the average annual runoff was higher than the runoff in wet years of the reference scenario (Fig. 5b), indicating that the trend of the precipitation change had a larger influence on the runoff than the inter-annual variation of precipitation.
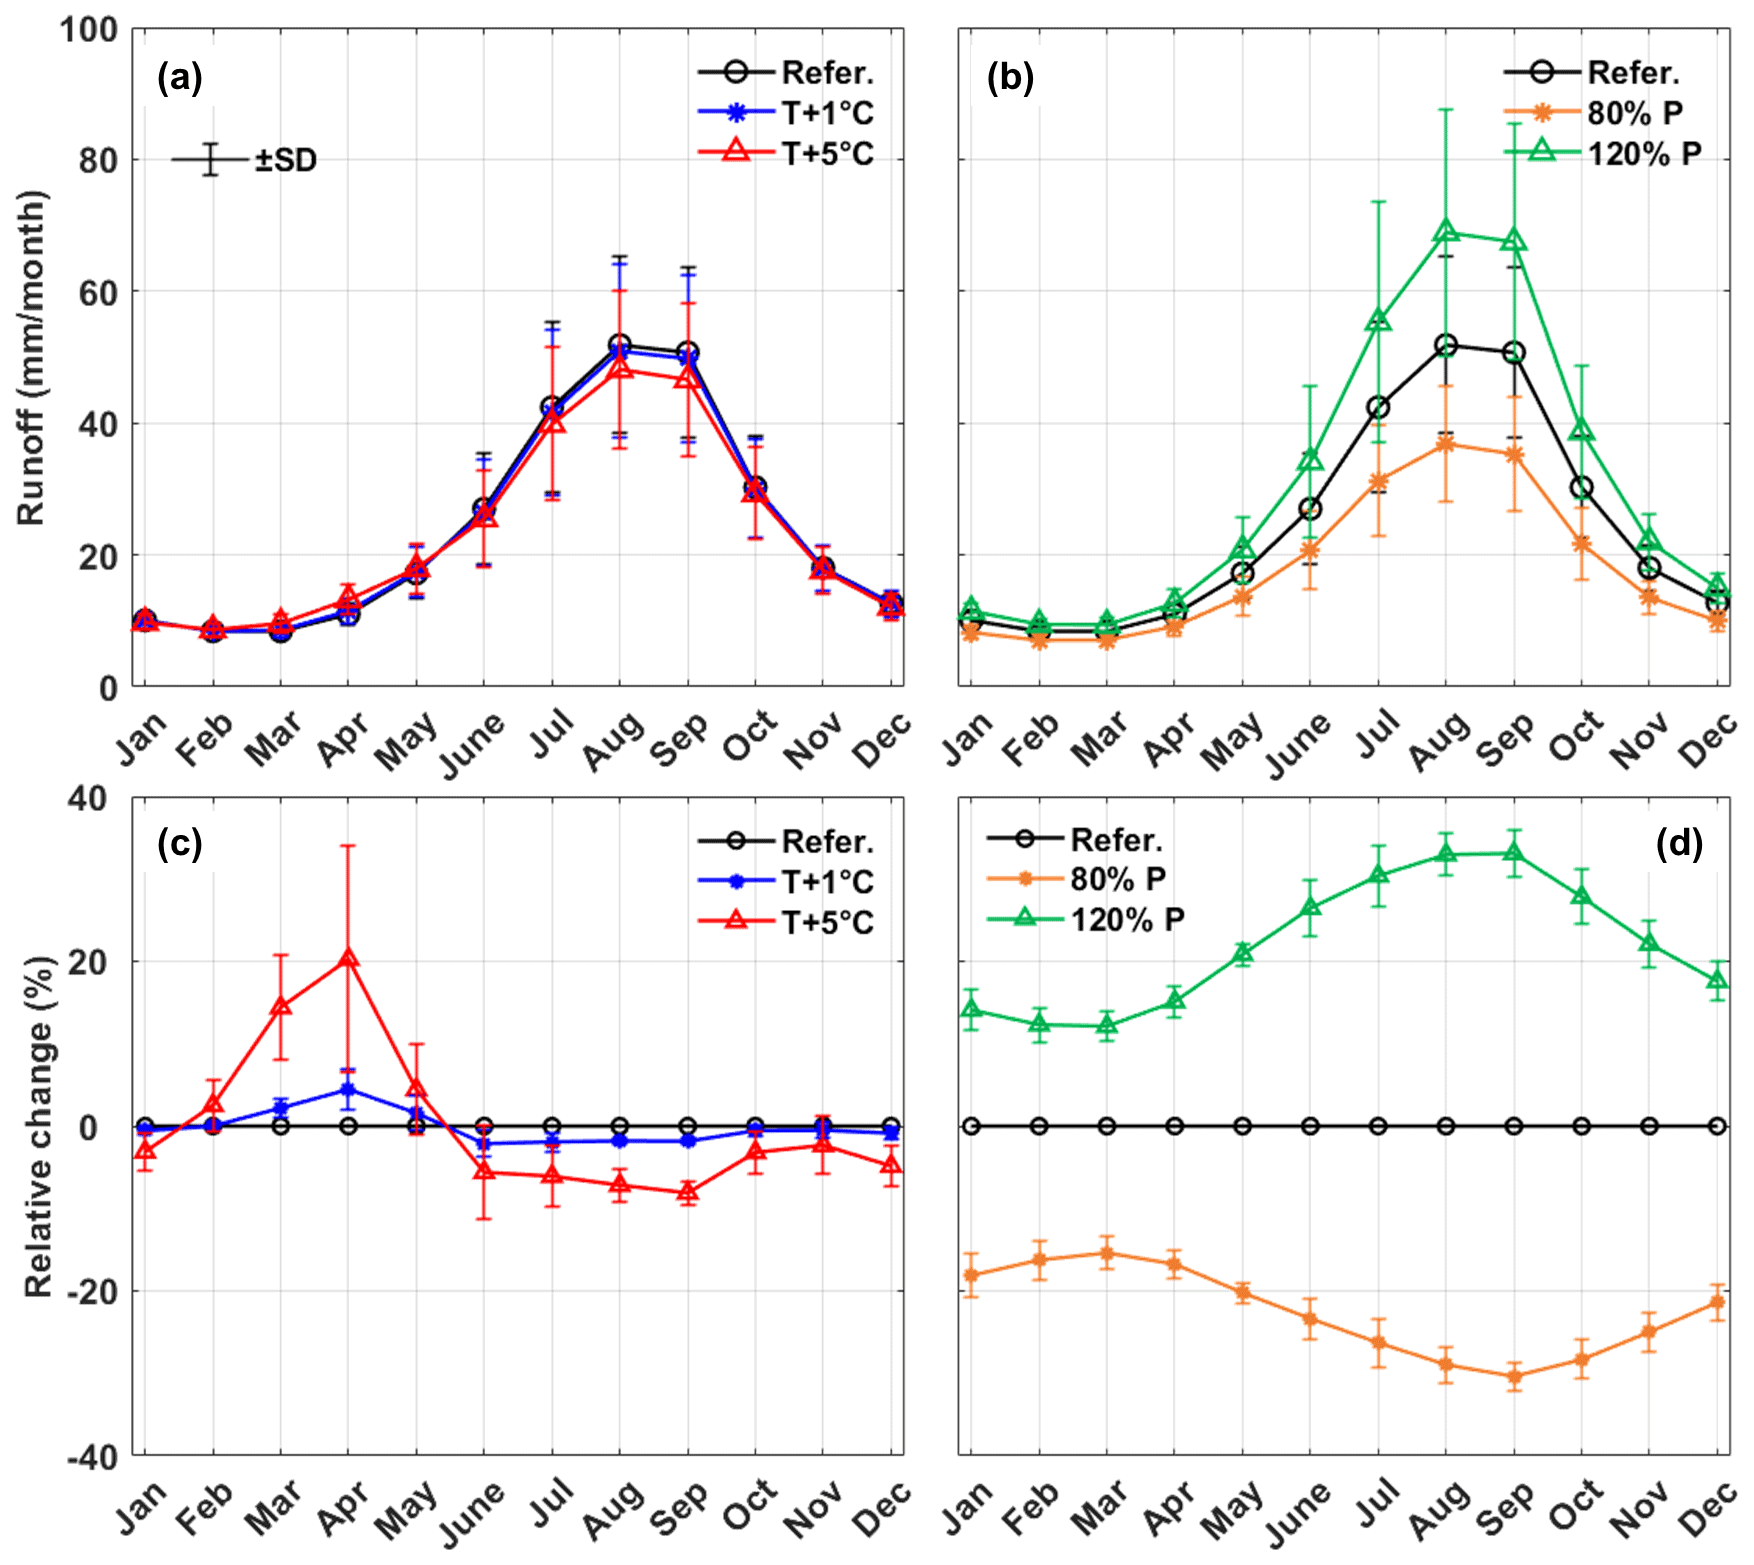
Figure 5Sensitivities of intra- and inter-annual streamflow variability to the perturbed temperature and precipitation. (a, b) Monthly runoff and (c, d) relative change in monthly runoff.
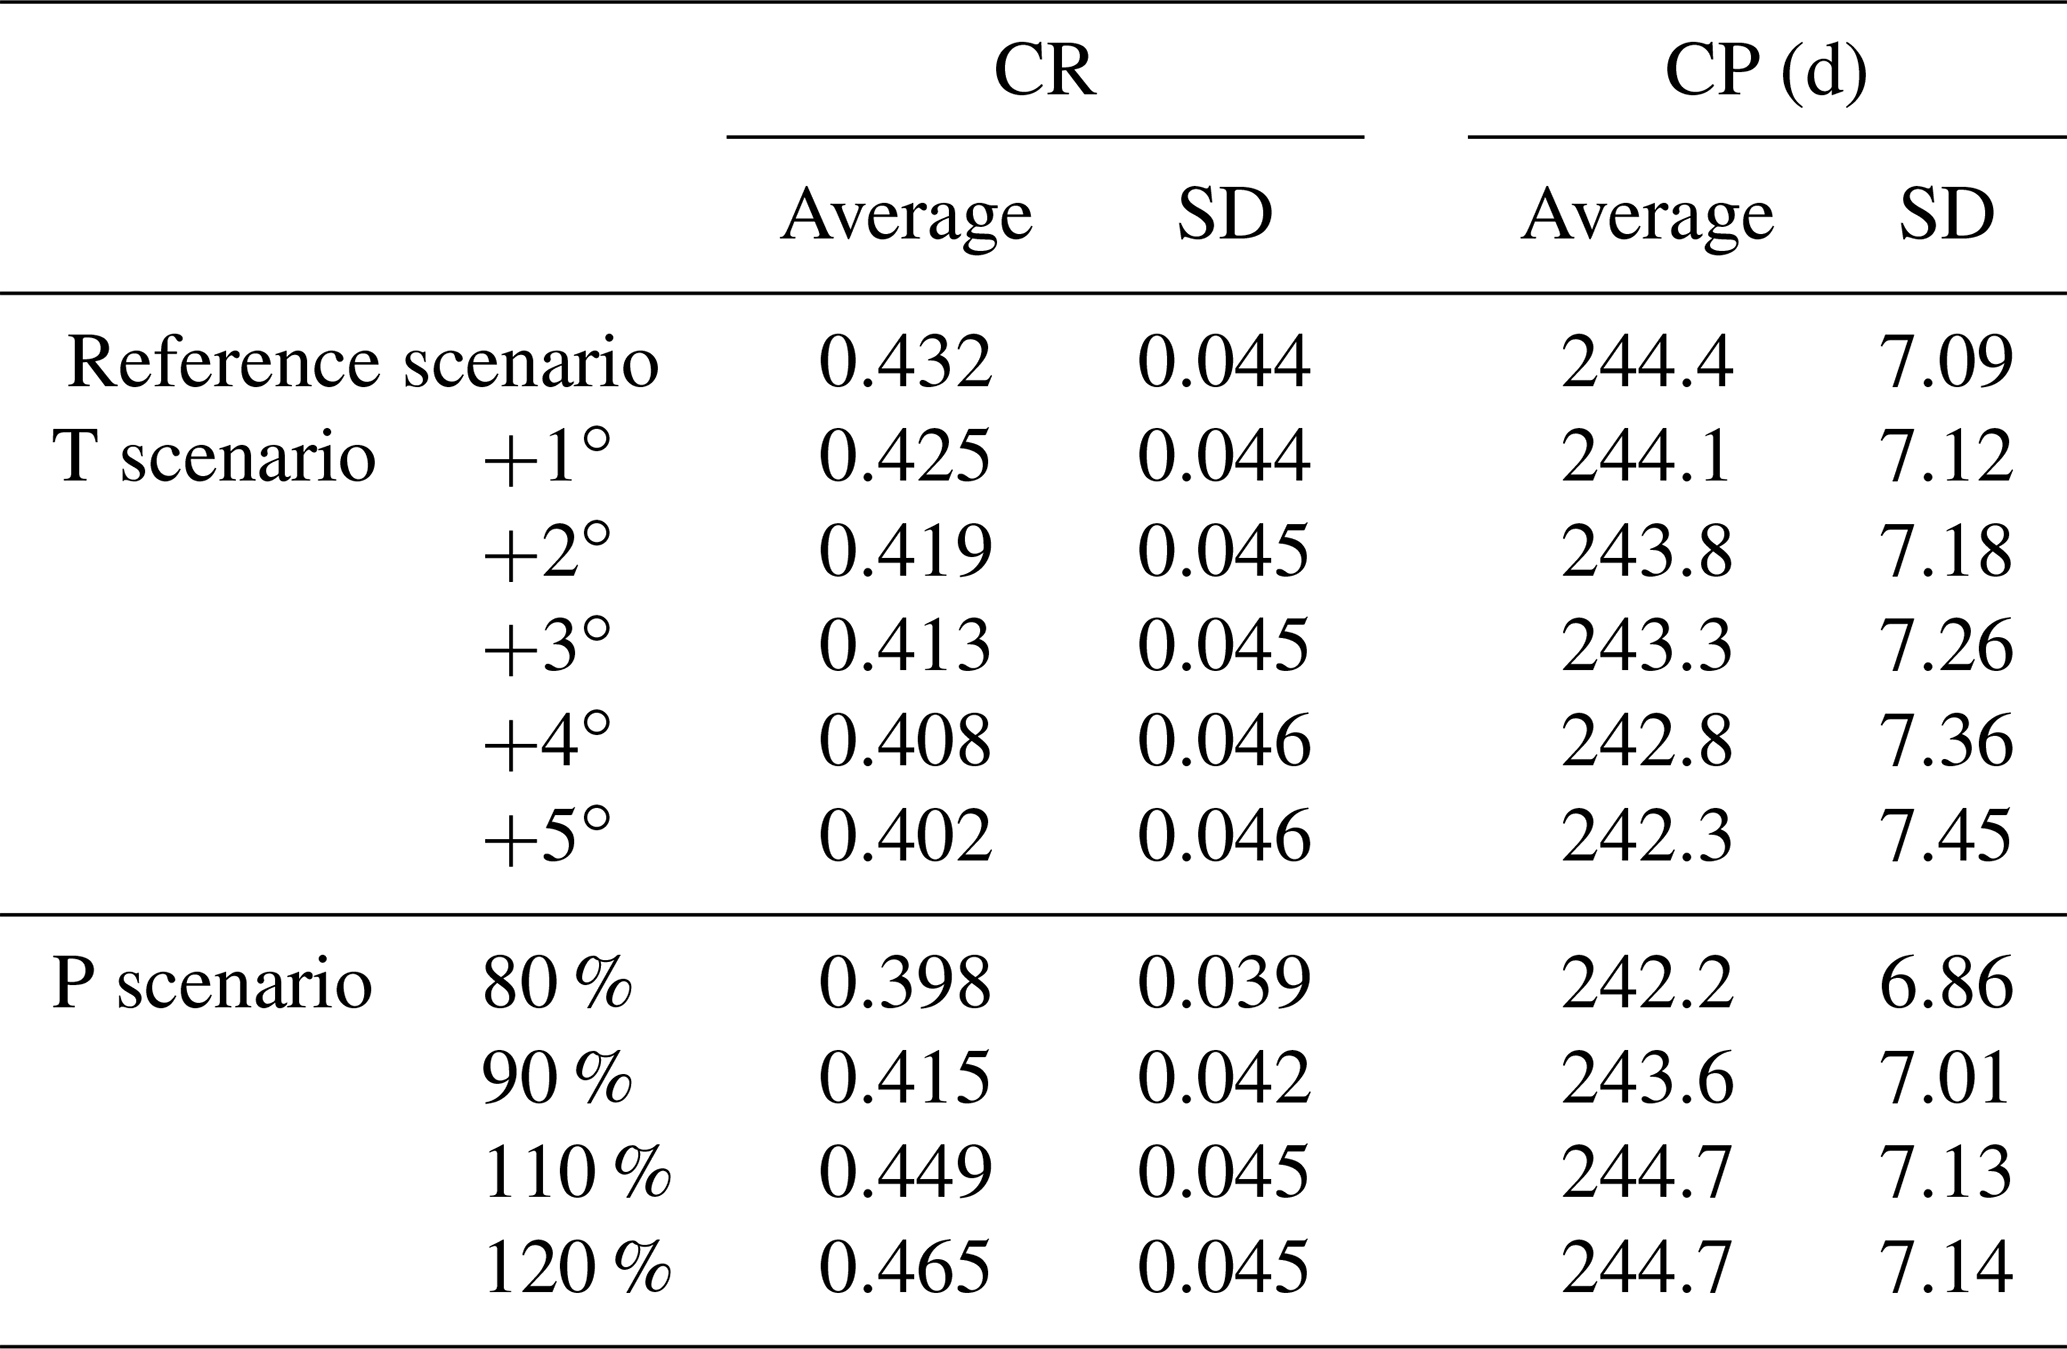
The sensitivities of monthly runoff were different among months. Although increasing temperature led to a decrease in the total runoff, it caused an increasing spring runoff. The monthly runoff in April increased most significantly, by 20 % for 5 ∘C of warming (Fig. 5e). This could be attributed to the increasing snowmelt, because the SCA decreased significantly during the same period (Fig. 2b). The monthly runoff in all 12 months changed accordingly to perturbed precipitation, but the change during the wet seasons (August to October) was the most significant (Fig. 5f). The different monthly runoff sensitivities in response to perturbed temperature and precipitation indicated that temperature changes influenced baseflow more, while precipitation changes had a higher impact on high-flow processes. As a result, increasing temperature caused a more even distribution of monthly runoff, while increasing precipitation had the opposite effect. Table 4 shows the concentration ratio (CR) and concentration period (CP) of runoff in different scenarios. The CR decreased from 0.432±0.044 to 0.402±0.046 for the warming of 5 ∘C, indicating a more even seasonal runoff distribution caused by increasing temperature. The CP decreased by around 2 d, indicating that climate warming would result in advance of maximum runoff. The SD of the CP slightly increased from 7.09 d in the reference scenario to 7.45 d for the warming of 5 ∘C. By contrast, the CR changed from 0.398±0.039 to 0.465±0.045 when precipitation increased from 80 % to 120 % of the reference, indicating that increasing precipitation made the distribution of runoff more concentrated. The CP advanced by 2.2 d in response to a 20 % decreasing precipitation but only regressed by 0.3 d in response to an increasing precipitation with the same magnitude. Similarly to the response to warming temperature, the SD of the CP also slightly increased in response to increasing precipitation. The change in the CR was significant at a significance level of 0.01 in all the scenarios, but the change in the CP was insignificant in some scenarios, including T +1 ∘C, 110 % P and 120 % P, with p values of 0.014, 0.02 and 0.12, respectively.
Table 4The concentration ratio (CR) and concentration period (CP) of runoff in different scenarios with perturbed temperature and precipitation.
3.4 Sensitivities of runoff components to perturbed temperature and precipitation
The contributions of runoff components in the YTR basin in scenarios with different temperature and precipitation are shown in Fig. 6. In the reference scenario, the subsurface runoff was the dominant component, contributing 67.8±1.7 % to the total runoff. Among the three surface runoff components, rainfall was the dominant water source, contributing 21.6±1.3 % to the total runoff. Glacier melt overland runoff had a considerable contribution to the runoff which contributed 7.4±1.4 % to the total runoff, while the contribution of snowmelt overland runoff was only 3.2±0.9 %. The annual subsurface runoff was 195.8±31.0 mm yr−1 (39.2±6.2 km3 yr−1), close to the amount (30 km3 yr−1) estimated by Yao et al. (2021) with the MODFLOW groundwater model. It should be noted that in our model all the glacier meltwater was assumed to generate surface runoff directly because of the impermeable glacier surface, while the snowmelt was assumed to be partitioned into two components (infiltration and surface runoff) (Nan et al., 2021b, 2023; Schaefli et al., 2005).
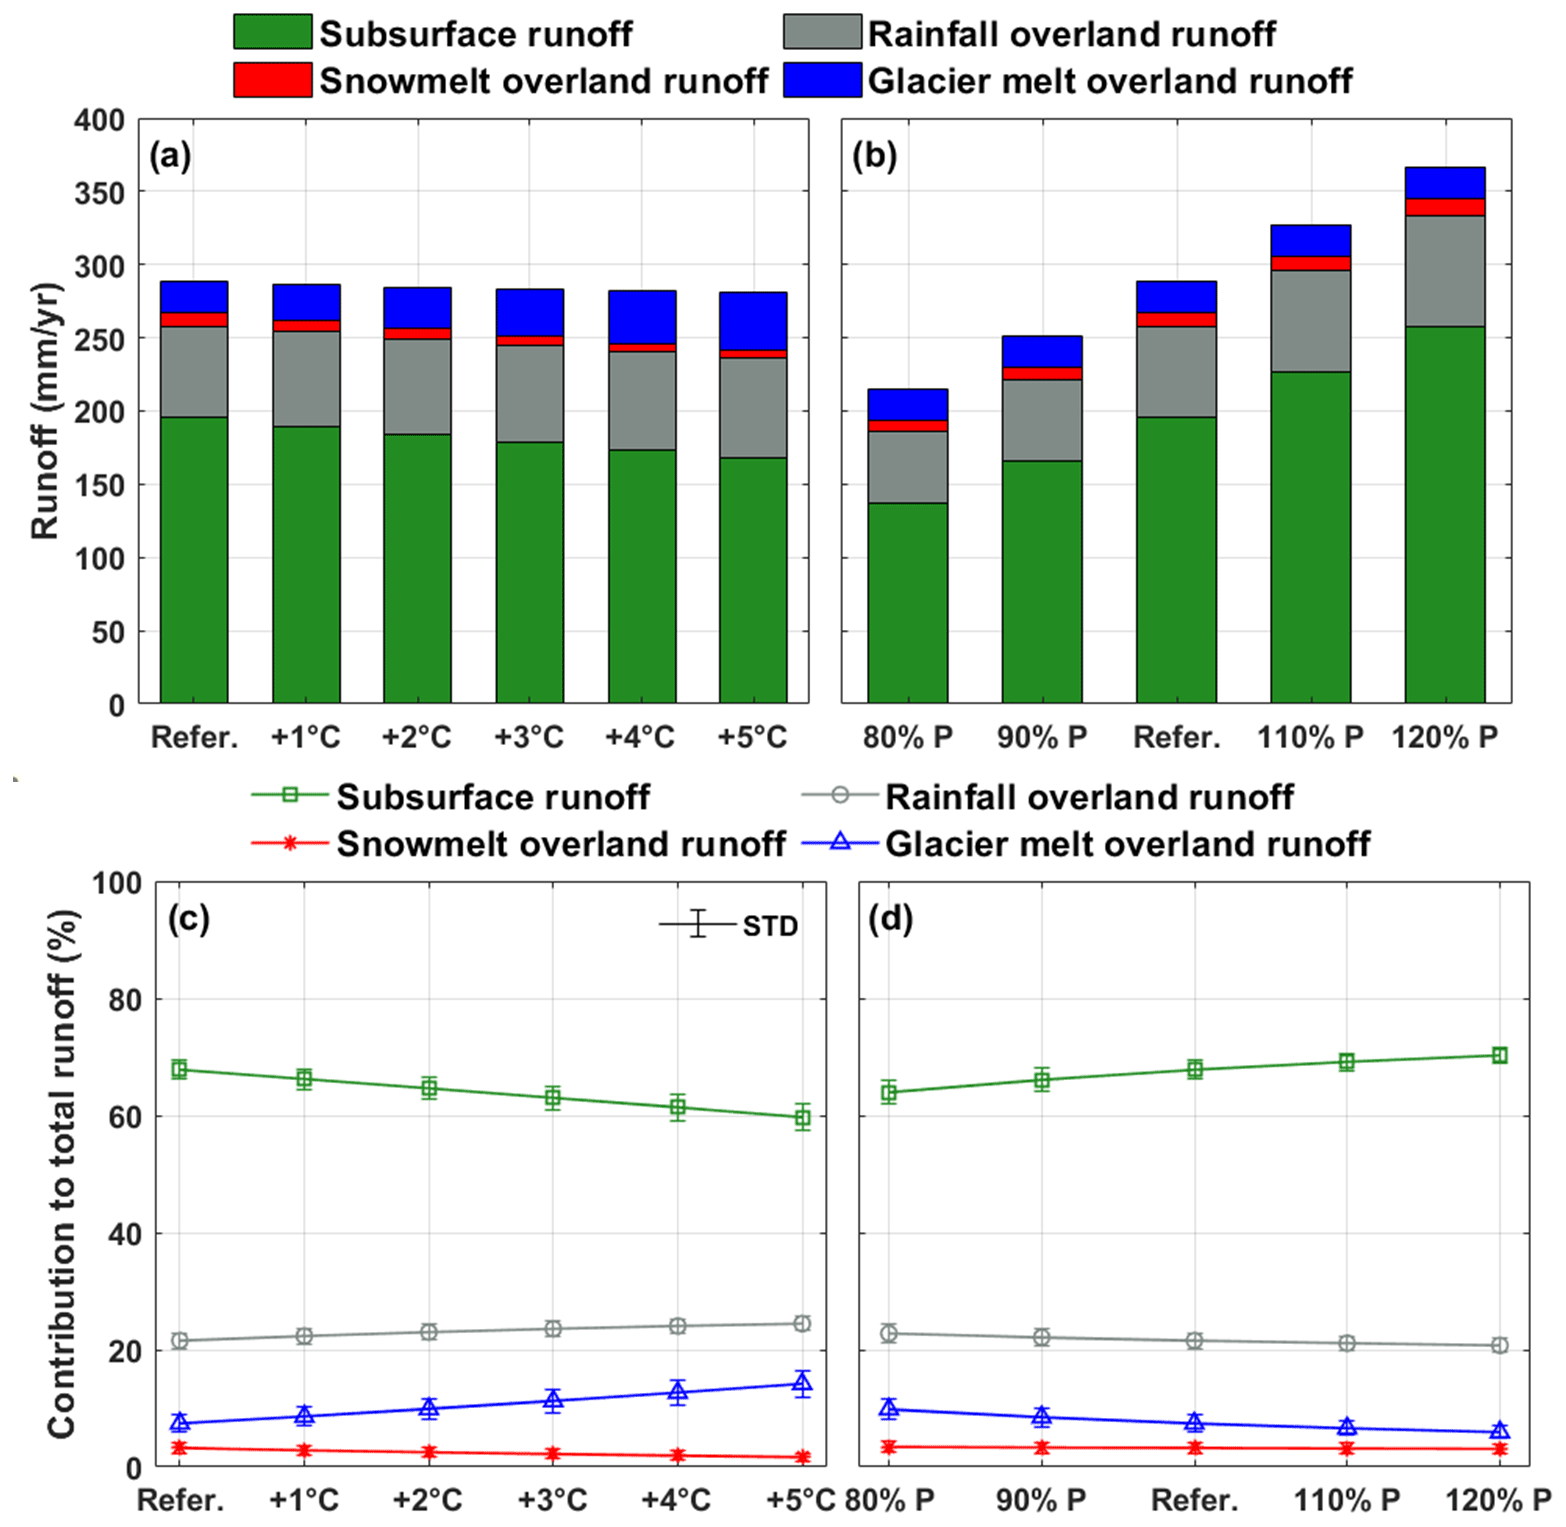
Figure 6Sensitivities of the runoff components to perturbed temperature and precipitation. (a, b) Numbers of runoff components and (c, d) contributions of runoff components to the total runoff.
With the increasing temperature, the amount and proportion of subsurface runoff decreased at −5.6 mm ∘C−1 and −1.6 % ∘C−1, because climate warming increased evaporation and consequently reduced the subsurface water storage and outflow. The rainfall and snowmelt overland runoff increased at 1.3 mm ∘C−1 (0.6 % ∘C−1) and decreased at −0.9 mm ∘C−1 (−0.3 % ∘C−1), respectively, because more rainfall was partitioned from total precipitation due to higher temperature. The glacier melt overland runoff increased significantly at 3.7 mm ∘C−1 (1.4 % ∘C−1) with the increasing temperature, and the contribution to the total runoff could be around 15 % for 5 ∘C of warming. The amount of all four runoff components increased with the increasing precipitation (Fig. 6b), with rates of 30.1 mm per 10 %, 6.8 mm per 10 %, 1.0 mm per 10 % and 0.1 mm per 10 % for subsurface, rainfall overland, snowmelt overland and glacier melt overland runoff, respectively. However, only the proportion of subsurface runoff increased at 1.6 % per 10 % with the increasing precipitation, while the proportions of the other three components all decreased, with rates of −0.5 % per 10 %, −0.1 % per 10 % and −1.0 % per 10 % for rainfall overland, snowmelt overland and glacier melt overland runoff, respectively (Fig. 6d), because there was a much higher increase in the total runoff. Overall, the contributions of runoff components were more sensitive to temperature perturbation than precipitation perturbation.
Figure 7 and Tables S1–S4 in the Supplement show the runoff components in the different seasons and their sensitivities to a perturbed climate. The subsurface runoff was the dominant component in all four seasons in the reference scenario, with contributions ranging from 53 % in summer to 99 % in winter. The contribution of snowmelt overland runoff was extremely low in the seasons except for spring because of the small SCA in summer and fall and the low temperature in winter. The contribution of snowmelt overland runoff in spring was close to that of rainfall overland runoff (Fig. 7e–h). The contribution of glacier melt overland runoff was around half that of rainfall overland runoff in all four seasons. With climate warming, the contribution of subsurface runoff decreased in all four seasons, while the contributions of rainfall and glacier melt overland runoff increased. The significantly increasing glacier melt and rainfall led to an increase in the total runoff in spring (Fig. 7a). The contribution of snowmelt overland runoff decreased in three seasons except for winter, during which its contribution slightly increased and got around 3 % for 5 ∘C of warming (Fig. 7h). With increasing precipitation, the amounts of the four components increased in all the seasons (Fig. 7i–l), but the contributions of the components remained nearly unchanged in spring, fall and winter (Fig. 7m and o–p). The contributions of the runoff components were only sensitive to perturbed precipitation in summer, during which subsurface runoff contributed more to the runoff with increasing precipitation, while the contributions of rainfall and glacier melt overland runoff decreased significantly (Fig. 7n).

Figure 7Sensitivities of the seasonal runoff components to perturbed temperature and precipitation. (a–d) Sensitivities of amounts of runoff components to perturbed temperature, (e–h) sensitivities of contributions of runoff components to perturbed temperature, (i–l) sensitivities of amounts of runoff components to perturbed precipitation and (m–p) sensitivities of contributions of runoff components to perturbed precipitation.
3.5 Spatial pattern of local hydrological sensitivities
Considering that the YTR basin is a large basin with a drainage area of 2×10⁵ km2, the spatial pattern of the local hydrological sensitivity was further analyzed with the assistance of the spatially distributed model structure. The runoff changes at the REW scale in four typical scenarios (i.e., 1 ∘C of warming, 5 ∘C of warming, precipitation changing to 80 % and 120 %) are shown in Fig. 8. All REWs have the same runoff trend with the precipitation perturbation (Fig. 8c and d). The runoff increase ranged from 12.2 % to 40.4 % when precipitation increased by 20 %. In most REWs, the runoff changed at higher rates than precipitation, with a few exceptions located in the tributaries of the Nyang River, the Lhasa River and the source region of the mainstream, showing shallow red/blue colors in Fig. 8c and d. By contrast, the REW-scale runoff changes in response to increasing temperature had strong spatial variability (Fig. 8a and b). Although the runoff at the basin outlet decreased with climate warming, the REW-scale runoff increased in about half of the REWs. For 5 ∘C of warming, the REW-scale runoff changes ranged from −18.6 % to 54.3 %. Most REWs with increasing runoff were located upstream of the mainstream, the Nianchu River, the Nyang River and the tributary of the Lhasa River (Fig. 8b).
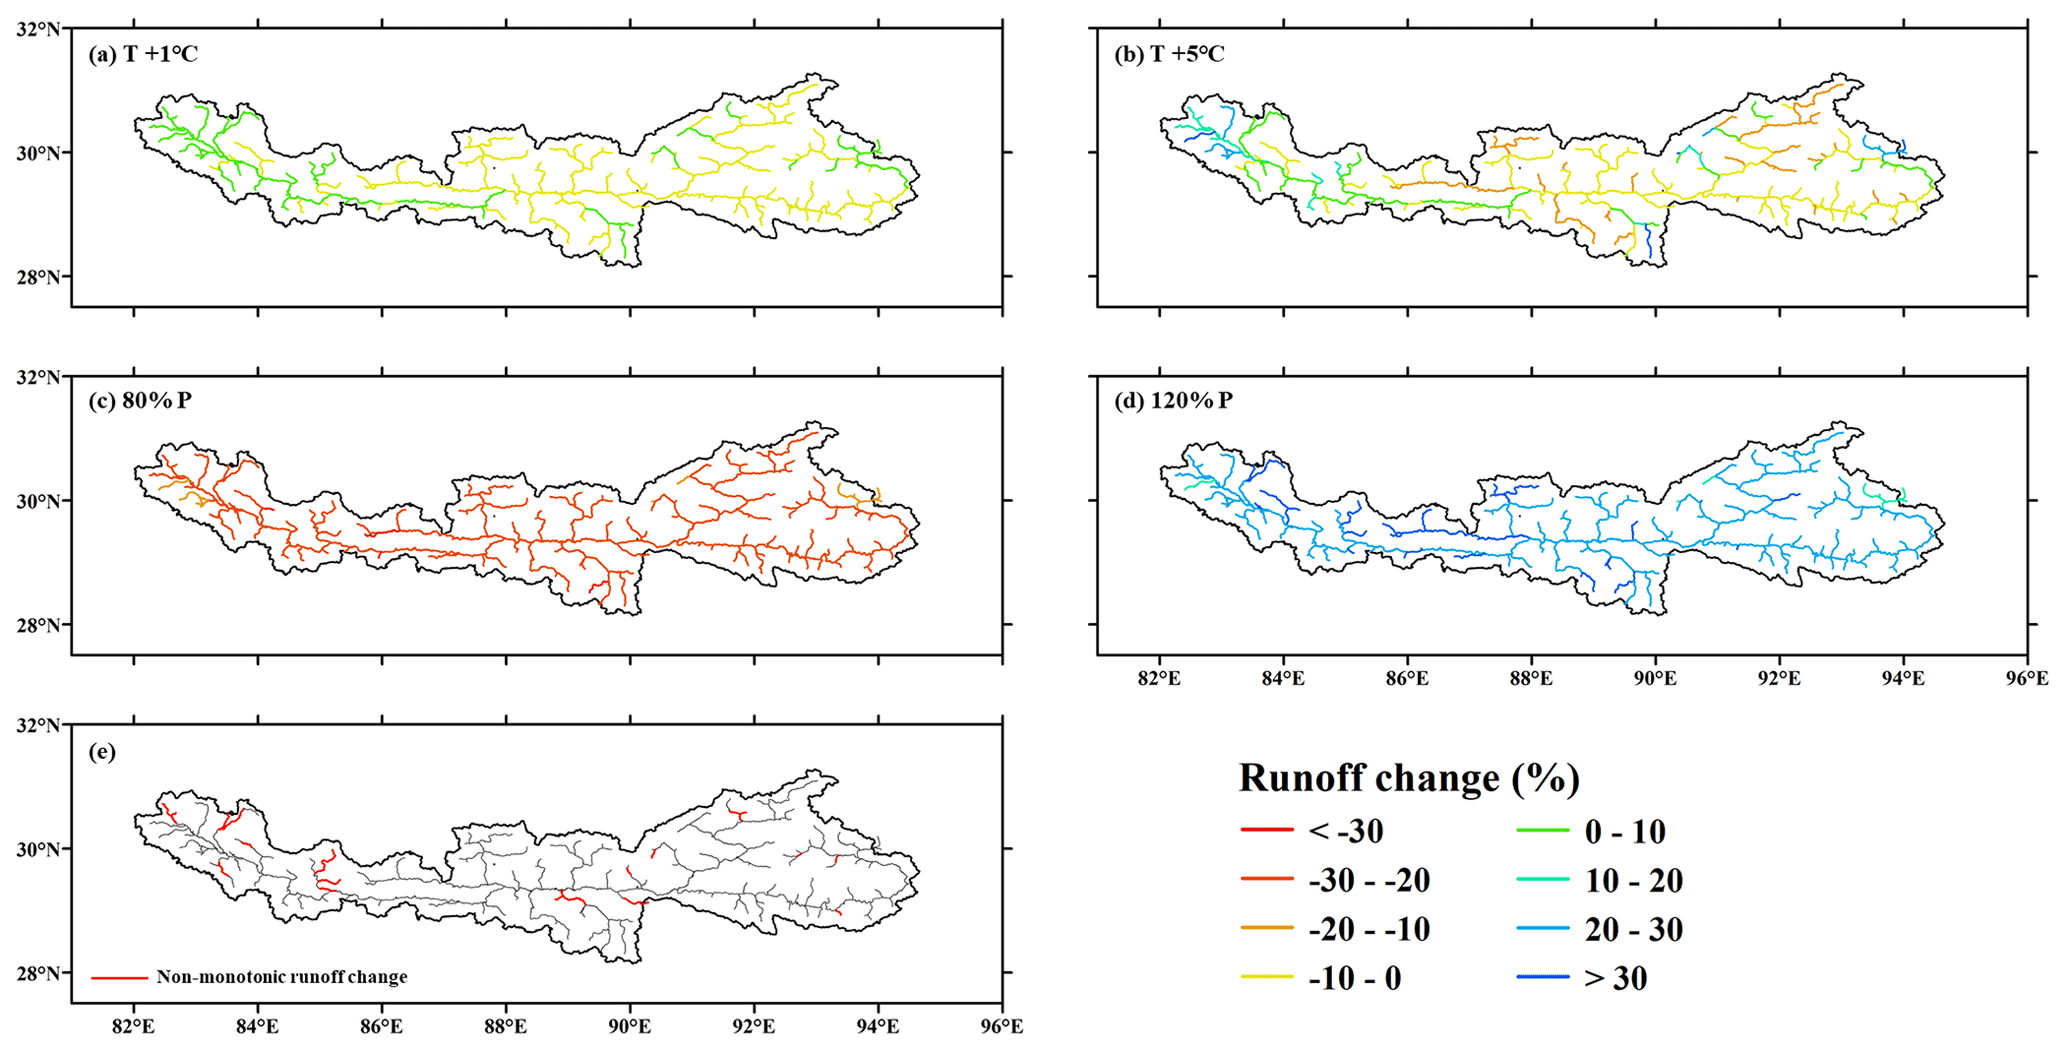
Figure 8The change in the REW-scale runoff in response to perturbed temperature and precipitation. (a, b) Runoff change in response to temperature perturbation, (c, d) runoff change in response to precipitation perturbation and (e) the locations of REWs showing non-monotonic runoff change in response to increasing temperature.
The statistical significance of runoff change in response to climate perturbation was analyzed. The runoff change in response to perturbed precipitation was significant in all the REWs, but things were different for the warming temperature scenarios. The number of REWs with insignificant change trends decreased with the temperature warming level. Specifically, the runoff change was insignificant (at a significance level of 0.01) in 26 % and 15 % of the whole basin for warming of 1 and 5 ∘C, respectively (Fig. S1 in the Supplement). The statistical significance in response to warming temperature was related to the runoff change magnitude and drainage area (Fig. S2). Consequently, although the runoff change at the basin outlet was rather small (decreasing by 0.9 % and 3.4 % for warming of 1 and 5 ∘C, respectively), it was still statistically significant.
The runoff in some REWs changed non-monotonically with increasing temperature; i.e., the runoff change trend was reversed in different temperature intervals. Most such non-monotonic REWs were located in the upstream region of the mainstream, with some others located in the major tributaries Nyang River, Lhasa River and Nianchu River (Fig. 8e). In about 75 % of the non-monotonic REWs, the runoff first decreased for 1 ∘C of warming and then changed to an increasing trend at higher warming levels, and the reserved trends occurred in the other 25 % of the REWs. The threshold temperature of trend turning differed among the non-monotonic REWs, which was 3 ∘C in about half of the REWs. The runoff change rates in response to increasing temperature were generally low in non-monotonic REWs, most within the range of ±1 % ∘C−1.
4.1 The influence factors of local hydrological sensitivities: the role of glaciers
Our results show the strong spatial variability of the REW-scale hydrological sensitivities to perturbed climate. Consequently, the influence factors of the local sensitivities are analyzed in this section. The basic characteristics, including mean annual temperature (MAT), mean annual precipitation (MAP), average elevation (ELE), drainage area (DRA) and glacier area ratio (GAR), were calculated for each REW as the potential factors. It should be noted that, considering the runoff concentration processes between the upstream and downstream REWs, the above characteristics were calculated not solely within each REW but for the total drainage area controlled by each REW. The correlations between the runoff change for temperature and precipitation increasing by 5 ∘C per 20 % and the potential influence factors were analyzed. The relationships between the two factors with the highest coefficients are shown in Fig. 9. Detailed data and relationships with the lower coefficients are shown in Table S5 and Fig. S3.
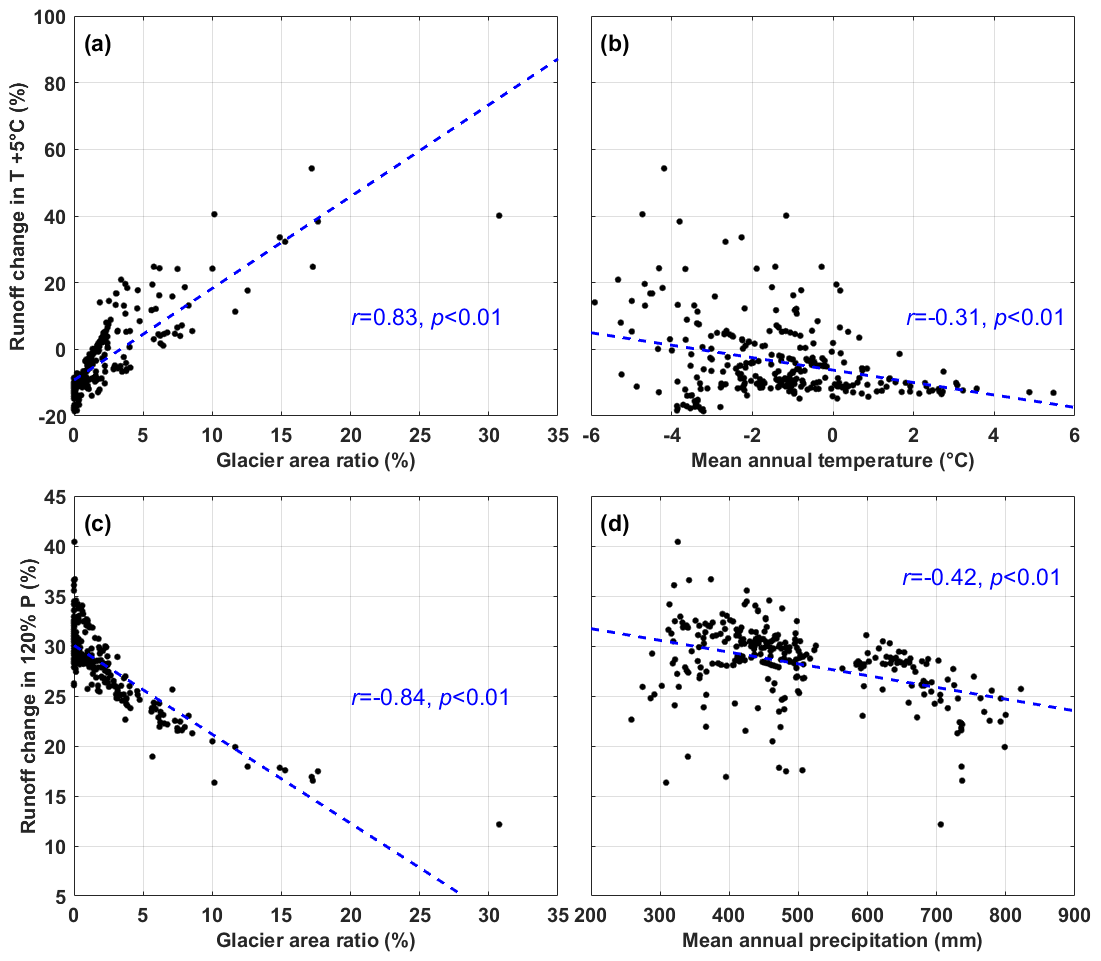
Figure 9The correlations between the hydrological sensitivities to climate perturbation and the dominant influence factors.
The GAR was the most correlated factor in the hydrological sensitivities with the perturbation of both temperature and precipitation, with coefficients higher than 0.8 (Fig. 9a and c). The runoff change for 5 ∘C of warming increased with the increasing GAR (Fig. 9a) because of the balance between the decreasing runoff caused by evaporation and the increasing runoff contributed by glacier melt. In REWs where the GAR was higher than a threshold, the increasing glacier melt could offset the increasing evaporation, and the runoff increased with climate warming. The threshold GAR was different among the REWs, ranging from 1 % to 5 %. For the REWs with GARs larger than 10 %, the runoff increase for 5 ∘C of warming could be higher than 20 %. The hydrological sensitivity to increasing temperature also had a weak but significant negative correlation (, p<0.01) with the MAT of the REW (Fig. 9b), which could be partly attributed to the interrelation between the GAR and the MAT; i.e., the GAR tended to be lower in warmer regions, and the runoff consequently decreased in response to the increasing temperature. A lower bound of runoff change could be observed in Fig. 9b for the REWs with relatively high MATs, again indicating the different limitation factors of evaporation; i.e., in relatively warm regions, the evaporation was limited by the water condition, so increasing the temperature did not cause more evaporation (Wang et al., 2022).
By contrast, the runoff change in response to increasing precipitation had a significant negative correlation (, p<0.01) with the GAR (Fig. 9c), mainly due to the spatial variability of the runoff components. In REWs with a larger GAR, the contribution of the precipitation-induced runoff was relatively low due to the large contribution of glacier melt runoff, and thus the influence of the increasing precipitation on runoff change was also small. It should be noted that, based on the regression line in Fig. 9c, the runoff change would be around zero in regions with a GAR higher than 35, which was a rather surprising inference. This might be due to the small sample of REWs with high GAR based on the current spatial discretization, resulting in the poor confidence in the end of the regression line. The runoff change in response to increasing temperature was also negatively correlated with the MAP (, p<0.01, Fig. 9d). The contribution of the subsurface runoff component was higher under wetter conditions (Fig. 6d), resulting in more evaporation and a lower runoff coefficient, which caused a relatively small increase in runoff similar to the finding by Z. H. He et al. (2021).
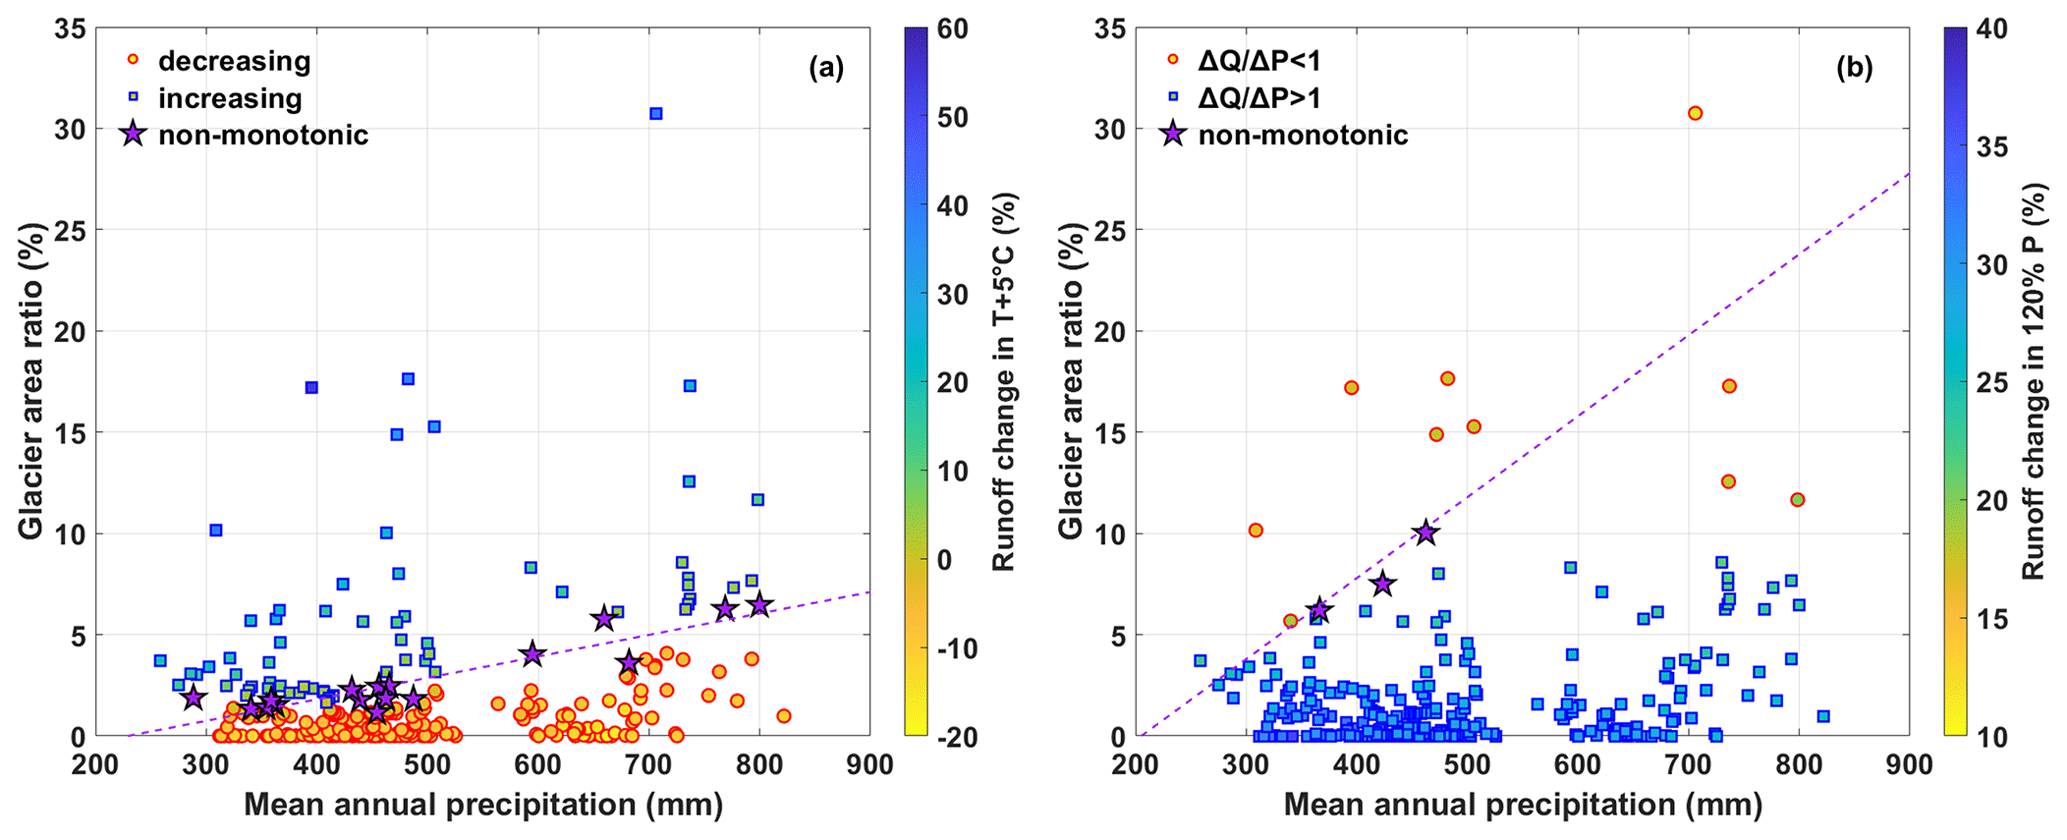
Figure 10The interrelation among the REW-scale glacier area ratio, mean annual precipitation and runoff change for (a) 5 ∘C of warming and (b) 120 % precipitation.
Our results indicate that the runoff in some REWs changed non-monotonically in response to the increasing temperature. The characteristics of these non-monotonic REWs were further analyzed. Interestingly, the GAR of non-monotonic REWs had a good linear relationship with their MAP (Fig. 10a). The regression equation of the linear relation was GAR (%) = 0.011 ⋅ MAP (mm) − 2.43 (r=0.92). Moreover, this regression line was the dividing line between the REWs where runoff increased with increasing temperature and those with opposite runoff trends in the GAR–MAP plot (Fig. 10a). The REWs located in the upper part of the plot had higher runoff-increasing rates. This indicated that the local hydrological sensitivity to increasing temperature was determined by the relationship between GAR and MAP. In wetter REWs with a larger MAP, more glaciers were needed to offset the decreasing runoff due to the increasing temperature and evaporation. These findings suggested the important role of glaciers in determining the runoff change in response to climate change. Similar characteristics were observed in the precipitation perturbation scenarios (Fig. 10b). The runoff change rate was different from the precipitation change rate in all the REWs and was consistently either higher or lower than the precipitation change rate in most of the REWs. However, there were three REWs shifting from to >1, the GAR and MAP of which also had a linear relationship, forming the boundary of REWs where runoff changed more significantly than precipitation and those with a lower runoff change rate. However, there were only three such non-monotonic REWs for precipitation perturbation scenarios, providing less confidence in the boundary line. As a result, there were some REWs lying lower than the boundary line but with a lower runoff change rate than precipitation (Fig. 10b).
4.2 Implications of the sensitivity analysis
The sensitivity analysis indicated the important role of glaciers in providing meltwater to offset the runoff decrease caused by climate warming. Our study showed that glacier meltwater had a limited contribution to the total runoff in the YTR basin, similar to some recent studies (Y. W. Wang et al., 2021); Cui et al., 2023), resulting in a decreasing runoff trend with increasing temperature. However, the spatial pattern analysis indicated that the role of glacier melt runoff could be rather significant in the regions with large areas covered by glaciers. For example, the runoff increased significantly in the Yangbajing tributary of the Lhasa River in response to increasing temperature (Fig. 8), consistent with previous research estimating a high contribution of glacier melt to runoff in this region (Lin et al., 2020; Wang et al., 2023). It is therefore necessary to address the spatial-scale issue when discussing the role of glacier meltwater in water resources.
Several studies have stressed the important role of glaciers on the TP as the largest global store of frozen water which supplied freshwater resources to downstream regions (Yao et al., 2022). This study quantitatively estimated the role of glacier meltwater in offsetting the decreasing runoff with increasing temperature and evaporation. Our results indicated that the influences of glaciers on hydrological processes were highly dependent on the spatial scale and the local meteorological characteristics. Specifically, the role of glacier meltwater would undoubtedly be more significant in regions with larger glacier cover areas (Luo et al., 2018; Zhao et al., 2019; Khanal et al., 2021). Meanwhile, the role of glaciers was smaller in wetter regions with higher precipitation because of the relatively low contribution of glacier meltwater to total runoff. Consequently, the regions with larger precipitation amounts but little glacier coverage will face a greater risk of water resource shortage in a warming future (Fig. 10a), and other regions will face similar conditions because of the shrinking glacier area. Our results also suggested a larger influence of precipitation change on runoff than that of temperature change (Fig. 4), and thus an accurate projection of precipitation is crucial for the assessment of water resources under climate change. Recent studies showed a decreasing precipitation trend after 2000 in the YTR basin (Li et al., 2016; Luan and Zhai, 2023), likely posing threats of water scarcity to the riparian regions and again highlighting the important role of glaciers in maintaining water resources.
Our results showed that the runoff responded to increasing temperature non-monotonically in some regions. These non-monotonic REWs represented the most dynamic regions within the basin, as they kept shifting between energy- and water-limited stages. Recent studies also projected the non-monotonic runoff change on the TP at increasing warming levels (Cui et al., 2023); i.e., the annual mean runoff for major rivers on the TP will significantly decrease by 0.1 %–3.2 % at a warming level of 1.5 ∘C and increase by 1.5 %–12 % at 3.0 ∘C in the future. Although seemingly similar, the two studies revealed two different phenomena. In particular, the non-monotonic runoff change projected by Cui et al. (2023) was driven by the output of climatic projection data of CMIP6 (Eyring et al., 2016), and the runoff change was dominated by the tendencies and periodicities of climate factors, especially precipitation (Wu et al., 2022). Our study analyzed the runoff change in response to climate warming with a fixed precipitation input, and the trend was the result of the comprehensive response of multiple water balance components to climate change. The local non-monotonic hydrological sensitivity was essentially a borderline condition of increasing and decreasing trends, which reflected the balance of increasing meltwater and evaporation in response to climate warming.
4.3 Limitations
This study explored the sensitivities of hydrological processes to climate change by designing temperature and precipitation perturbation scenarios rather than projecting future runoff using the forcing data from GCMs. The assumed climate perturbation method is widely used in runoff projection studies (Z. H. He et al., 2021; Su et al., 2023; Rasouli et al., 2014, 2015), with the advantage of avoiding the computation cost of correcting biases and downscaling GCMs to the regional scale (Piani et al., 2010; Xu et al., 2019). However, the assumed climate perturbation did not reflect the gradual process of climate change. Specifically, the temperature should go through relatively low warming levels before arriving at the assumed highest level, but the climate perturbation method actually assumed an abrupt climate change. Because of the relatively short simulation period, the potential trend turning of meltwater caused by the combined effect of increasing the melting rate and shrinking the glacier area cannot be reflected by the sensitivity analysis (Yao et al., 2022; Zhang et al., 2022a). We can expect that the role of glaciers when temperature increases by 5 ∘C in the future should be less than our results, because the glacier-covered area at that time will be less than the current condition (Yao et al., 2022). Meanwhile, the potential influences of temperature and precipitation change on soil and vegetation conditions (Boulanger et al., 2017) were not considered when designing the climate perturbation scenarios. In addition, because climate perturbation rather than the climate ensemble was used to force the model, the representation of uncertainties related to climate forcing was very simplified. Nonetheless, the simple sensitivity analysis in this study helped better understand the separate effect of changing temperature and precipitation on runoff and informed the role of glaciers in controlling the spatial pattern of runoff change.
Another limitation comes from the uncertainties of the hydrological model. Although validated by the measurement data of multiple objectives and several internal stations, the model still had potential uncertainties. First, as the most important forcing data, the common precipitation datasets in the YTR basin all had large uncertainties due to the lack of validation data in high-elevation regions (Xu et al., 2017), leading to uncertainties in hydrological simulation. The model underestimated the peak streamflow for most stations, which could be attributed to the underestimated precipitation during wet seasons by the CMFD dataset. Further correction of the precipitation product based on more station data could be helpful in removing the bias. Second, because of the complex hydrological processes and runoff components, the parameter equifinality problem usually existed in the hydrological model in large mountainous basins (Gupta et al., 2008; Nan et al., 2021a). He et al. (2019) indicated that the uncertainties of runoff component contributions could be nearly 20 % even when the simulations of streamflow, snow, glacier and isotope were satisfied simultaneously. The misestimation of the runoff regime would undoubtedly influence the sensitivity analysis. Third, the calibration procedure of this work was rather simple, based on a combination of an automatic algorithm and manual selection. The influences of the calibration scheme, the optimized objective function (Gupta et al., 2009; Majone et al., 2022) and the weights of multiple objectives (Tong et al., 2021) on hydrological sensitivities were not analyzed deeply. For instance, different types of evaluation metrics for multiple objectives were added together directly, which may result in different impacts on the integrated objective function. In addition, the use of the pySOT algorithm did not allow for a comprehensive hydrological uncertainty analysis, because it aimed to achieve the best fitness between the observations and model outputs. Lastly, the calibrated parameters were assumed to be spatially uniform within the whole basin to avoid introducing too many parameters. Although this is similar to several large-scale modeling studies (e.g., Cui et al., 2023; Lutz et al., 2014), the uniform parameter might be inadequate for representing the spatial variability of hydrological processes, which may influence some conclusions of the sensitivity analysis. For example, considering the potential spatial variability of the glacier melting rate, the characteristics of non-monotonic REWs in Fig. 10 may not form a straight line. Currently this work only considered the uncertainties introduced by natural climate variabilities. More works are needed in the future to analyze the parameter sensitivities and the uncertainties from calibration schemes.
This study adopted the tracer-aided hydrological model THREW-T in a typical large mountainous basin Yarlung Tsangpo River (YTR) on the Tibetan Plateau (TP). The model was validated against multiple objectives (streamflow, snow, glacier and isotope) and the streamflow at internal stations. The sensitivities of hydrological processes to perturbed temperature and precipitation were analyzed. The spatial pattern of local hydrological sensitivities and the influence factors were explored. Our main findings are as follows.
-
The THREW-T model performed well in simulating the streamflow, snow cover area (SCA), glacier mass balance (GMB) and stream water isotope, ensuring good representation of the key cryospheric processes and a reasonable estimation of the contributions of runoff components. The model performed acceptably in simulating the streamflow at eight internal stations located in the mainstream and two major tributaries, which indicated that the spatial pattern of the hydrological processes was reflected by the model and provided confidence in the sensitivity analysis.
-
Most hydrological characteristics responded to increasing temperature and precipitation in opposite ways. Increasing temperature led to decreasing annual runoff, SCA and GMB and changed the runoff variation showing a smaller inter-annual variation, a more even distributed intra-annual distribution and an earlier maximum runoff. It also influenced the runoff regime by increasing the contributions of rainfall and glacier melt overland runoff but decreasing the subsurface runoff and snowmelt overland runoff. Increasing precipitation had the opposite effects of increasing temperature.
-
The distribution of local hydrological sensitivities had a strong spatial variability. The local runoff change in response to increasing temperature varied significantly, with changing rates of −18.6 % to 54.3 % for 5 ∘C of warming. The glacier area ratio (GAR) was the dominant factor in the spatial pattern of hydrological sensitivities to both perturbed temperature and precipitation. Some regions had a non-monotonic runoff change rate in response to climate perturbation, which represented the most dynamic regions within the basin, as they kept shifting between energy- and water-limited stages. The GAR and mean annual precipitation (MAP) of the non-monotonic regions had a linear relation and formed the boundary of regions with different runoff trends in the GAR–MAP plot.
Code and data availability: the isotope data and the code of the THREW-T model used in this study are available from the corresponding author (tianfq@tsinghua.edu.cn). Other datasets are publicly available as follows: DEM (http://www.gscloud.cn/sources/details/310?pid=302, Geospatial Data Cloud Site, 2019), CMFD (https://doi.org/10.11888/AtmosphericPhysics.tpe.249369.file, Yang and He, 2019), glacier inventory data (https://doi.org/10.3972/glacier.001.2013.db, Liu, 2012), glacier elevation change data (https://doi.org/10.6096/13, Huggonnet et al., 2021), NDVI (https://doi.org/10.5067/MODIS/MOD13A3.006, Didan, 2015), LAI (https://doi.org/10.5067/MODIS/MOD15A2H.006, Myneni et al., 2015) and HWSD (https://data.tpdc.ac.cn/zh-hans/data/3519536a-d1e7-4ba1-8481-6a0b56637baf/?q=HWSD, He, 2019). Those datasets not publicly available are referred to in the main text (Chen et al., 2018; Liu et al., 2007).
The supplement related to this article is available online at: https://doi.org/10.5194/hess-28-669-2024-supplement.
YN conceived the idea and collected the data. YN and FT conducted the analysis and wrote the paper.
At least one of the (co-)authors is a member of the editorial board of Hydrology and Earth System Sciences. The peer-review process was guided by an independent editor, and the authors also have no other competing interests to declare.
Publisher's note: Copernicus Publications remains neutral with regard to jurisdictional claims made in the text, published maps, institutional affiliations, or any other geographical representation in this paper. While Copernicus Publications makes every effort to include appropriate place names, the final responsibility lies with the authors.
This article is part of the special issue “Hydrological response to climatic and cryospheric changes in high-mountain regions”. It is not associated with a conference.
This study has been supported by the National Natural Science Foundation of China (grant no. 92047301) and the Shuimu Tsinghua Scholar Program.
This paper was edited by Giulia Zuecco and reviewed by three anonymous referees.
Aygun, O., Kinnard, C., Campeau, S., and Krogh, S. A.: Shifting Hydrological Processes in a Canadian Agroforested Catchment due to a Warmer and Wetter Climate, Water, 12, 739, https://doi.org/10.3390/w12030739, 2020.
Bai, X. L., Zhao, W. Z., Liu, H., Zhang, Y. Y., Yang, Q. Y., Liu, J. T., and Chang, X. L.: Effects of precipitation changes and land-use alteration on streamflow: A comparative analysis from two adjacent catchments in the Qilian Mountains, arid northwestern China, Front. Environ. Sci., 11, 94, https://doi.org/10.3389/fenvs.2023.1097049, 2023.
Birkel, C. and Soulsby, C.: Advancing tracer-aided rainfall-runoff modelling: a review of progress, problems and unrealised potential, Hydrol. Process., 29, 5227–5240, https://doi.org/10.1002/hyp.10594, 2015.
Bloschl, G. and Montanari, A.: Climate change impacts-throwing the dice?, Hydrol. Process., 24, 374–381, https://doi.org/10.1002/hyp.7574, 2010.
Boulanger, Y., Taylor, A. R., Price, D. T., Cyr, D., McGarrigle, E., Rammer, W., Sainte-Marie, G., Beaudoin, A., Guindon, L., and Mansuy, N.: Climate change impacts on forest landscapes along the Canadian southern boreal forest transition zone, Landsc. Ecol., 32, 1415–1431, https://doi.org/10.1007/s10980-016-0421-7, 2017.
Cao, L. G. and Pan, S. M.: Changes in precipitation extremes over the “Three-River Headwaters” region, hinterland of the Tibetan Plateau, during 1960–2012, Quatern. Int., 321, 105–115, https://doi.org/10.1016/j.quaint.2013.12.041, 2014.
Chen, X., Long, D., Liang, S., He, L., Zeng, C., Hao, X., and Hong, Y.: Developing a composite daily snow cover extent record over the Tibetan Plateau from 1981 to 2016 using multisource data, Remote Sens. Environ., 215, 284–299, https://doi.org/10.1016/j.rse.2018.06.021, 2018.
Cui, T., Li, Y., Yang, L., Nan, Y., Li, K., Tudaji, M., Hu, H., Long, D., Shahid, M., Mubeen, A., He, Z., Yong, B., Lu, H., Li, C., Ni, G., Hu, C., and Tian, F.: Non-monotonic changes in Asian Water Towers' streamflow at increasing warming levels, Nat. Commun., 14, 1176–1176, https://doi.org/10.1038/s41467-023-36804-6, 2023.
Didan, K.: MOD13A3 MODIS/Terra vegetation Indices Monthly L3 Global 1 km SIN Grid V006, NASA EOSDIS Land Processes DAAC [data set], https://doi.org/10.5067/MODIS/MOD13A3.006, 2015.
Eriksson, D., Bindel, D., and Shoemaker, C. A.: pySOT and POAP: An event-driven asynchronous framework for surrogate optimization, arXiv [preprint], https://doi.org/10.48550/arXiv.1908.00420, 2019.
Eyring, V., Bony, S., Meehl, G. A., Senior, C. A., Stevens, B., Stouffer, R. J., and Taylor, K. E.: Overview of the Coupled Model Intercomparison Project Phase 6 (CMIP6) experimental design and organization, Geosci. Model Dev., 9, 1937–1958, https://doi.org/10.5194/gmd-9-1937-2016, 2016.
Fassnacht, S. R., Sexstone, G. A., Kashipazha, A. H., Ignacio Lopez-Moreno, J., Jasinski, M. F., Kampf, S. K., and Von Thaden, B. C.: Deriving snow-cover depletion curves for different spatial scales from remote sensing and snow telemetry data, Hydrol. Process., 30, 1708–1717, https://doi.org/10.1002/hyp.10730, 2016.
Fenicia, F., Kavetski, D., Reichert, P., and Albert, C.: Signature-Domain Calibration of Hydrological Models Using Approximate Bayesian Computation: Empirical Analysis of Fundamental Properties, Water Resour. Res., 54, 3958–3987, https://doi.org/10.1002/2017wr021616, 2018.
Gao, J., Yao, T. D., Masson-Delmotte, V., Steen-Larsen, H. C., and Wang, W. C.: Collapsing glaciers threaten Asia's water supplies, Nature, 565, 19–21, https://doi.org/10.1038/d41586-018-07838-4, 2019.
Geospatial Data Cloud Site: ASTER GDEM 30M, Geospatial Data Cloud Site [data set], http://www.gscloud.cn/sources/details/310?pid=302 (last access: 1 January 2019), 2019.
Gupta, H. V., Wagener, T., and Liu, Y.: Reconciling theory with observations: elements of a diagnostic approach to model evaluation, Hydrol. Process., 22, 3802–3813, https://doi.org/10.1002/hyp.6989, 2008.
Gupta, H. V., Kling, H., Yilmaz, K. K., and Martinez, G. F.: Decomposition of the mean squared error and NSE performance criteria: Implications for improving hydrological modelling, J. Hydrol., 377, 80–91, https://doi.org/10.1016/j.jhydrol.2009.08.003, 2009.
He, Y.: Pan-TPE soil map based on Harmonized World Soil Database (V1.2), National Tibetan Plateau Data Center [data set], https://data.tpdc.ac.cn/zh-hans/data/3519536a-d1e7-4ba1-8481-6a0b56637baf/?q=HWSD (last access: 1 January 2019), 2019.
He, Z., Unger-Shayesteh, K., Vorogushyn, S., Weise, S. M., Kalashnikova, O., Gafurov, A., Duethmann, D., Barandun, M., and Merz, B.: Constraining hydrological model parameters using water isotopic compositions in a glacierized basin, Central Asia, J. Hydrol., 571, 332–348, https://doi.org/10.1016/j.jhydrol.2019.01.048, 2019.
He, Z., Duethmann, D., and Tian, F.: A meta-analysis based review of quantifying the contributions of runoff components to streamflow in glacierized basins, J. Hydrol., 603, 126890 https://doi.org/10.1016/j.jhydrol.2021.126890, 2021.
He, Z. H. and Pomeroy, J. W.: Assessing hydrological sensitivity to future climate change over the Canadian southern boreal forest, J. Hydrol., 624, 129897, https://doi.org/10.1016/j.jhydrol.2023.129897, 2023.
He, Z. H., Pomeroy, J. W., Fang, X., and Peterson, A.: Sensitivity analysis of hydrological processes to perturbed climate in a southern boreal forest basin, J. Hydrol., 601, 126706, https://doi.org/10.1016/j.jhydrol.2021.126706, 2021.
Hindshaw, R. S., Tipper, E. T., Reynolds, B. C., Lemarchand, E., Wiederhold, J. G., Magnusson, J., Bernasconi, S. M., Kretzschmar, R., and Bourdon, B.: Hydrological control of stream water chemistry in a glacial catchment (Damma Glacier, Switzerland), Chem. Geol., 285, 215–230, https://doi.org/10.1016/j.chemgeo.2011.04.012, 2011.
Hugonnet, R., McNabb, R., Berthier, E., Menounos, B., Nuth, C., Girod, L., Farinotti, D., Huss, M., Dussaillant, I., Brun, F., and Kaab, A.: Accelerated global glacier mass loss in the early twenty-first century, Nature, 592, 726–731, https://doi.org/10.1038/s41586-021-03436-z (https://doi.org/10.6096/13 [data set]), 2021.
Immerzeel, W. W., van Beek, L. P. H., and Bierkens, M. F. P.: Climate Change Will Affect the Asian Water Towers, Science, 328, 1382–1385, https://doi.org/10.1126/science.1183188, 2010.
Jiang, Y., Xu, Z., and Xiong, L.: Runoff variation and response to precipitation on multi-spatial and temporal scales in the southern Tibetan Plateau, J. Hydrol.-Reg. Stud., 42, 101157, https://doi.org/10.1016/j.ejrh.2022.101157, 2022a.
Jiang, Y., Yang, K., Yang, H., Lu, H., Chen, Y., Zhou, X., Sun, J., Yang, Y., and Wang, Y.: Characterizing basin-scale precipitation gradients in the Third Pole region using a high-resolution atmospheric simulation-based dataset, Hydrol. Earth Syst. Sci., 26, 4587–4601, https://doi.org/10.5194/hess-26-4587-2022, 2022b.
Khanal, S., Lutz, A. F., Kraaijenbrink, P. D. A., van den Hurk, B., Yao, T., and Immerzeel, W. W.: Variable 21st Century Climate Change Response for Rivers in High Mountain Asia at Seasonal to Decadal Time Scales, Water Resour. Res., 57, e2020WR029266, https://doi.org/10.1029/2020wr029266, 2021.
Li, C., Sinha, E., Horton, D. E., Diffenbaugh, N. S., and Michalak, A. M.: Joint bias correction of temperature and precipitation in climate model simulations, J. Geophys. Res.-Atmos., 119, 13153–13162, https://doi.org/10.1002/2014jd022514, 2014.
Li, K., Tian, F., Khan, M. Y. A., Xu, R., He, Z., Yang, L., Lu, H., and Ma, Y.: A high-accuracy rainfall dataset by merging multiple satellites and dense gauges over the southern Tibetan Plateau for 2014–2019 warm seasons, Earth Syst. Sci. Data, 13, 5455–5467, https://doi.org/10.5194/essd-13-5455-2021, 2021.
Li, X., Yao, Z., Xiao, J., and Wang, H.: Analysis of the spatial-temporal variation characteristics of precipitation over the Tibetan Plateau from 1961 through 2010, J. Glaciol. Geocryol., 38, 1233–1240, 2016.
Li, Z. J., Li, Z. X., Song, L. L., Gui, J., Xue, J., Zhang, B. J., and Gao, W. D.: Hydrological and runoff formation processes based on isotope tracing during ablation period in the source regions of Yangtze River, Hydrol. Earth Syst. Sci., 24, 4169–4187, https://doi.org/10.5194/hess-24-4169-2020, 2020.
Li, Z. X., Feng, Q., Li, Z. J., Yuan, R. F., Gui, J., and Lv, Y. M.: Climate background, fact and hydrological effect of multiphase water transformation in cold regions of the Western China: A review, Earth-Sci. Revi., 190, 33–57, https://doi.org/10.1016/j.earscirev.2018.12.004, 2019.
Lin, L., Gao, M., Liu, J., Wang, J., Wang, S., Chen, X., and Liu, H.: Understanding the effects of climate warming on streamflow and active groundwater storage in an alpine catchment: the upper Lhasa River, Hydrol. Earth Syst. Sci., 24, 1145–1157, https://doi.org/10.5194/hess-24-1145-2020, 2020.
Liu, S.: The second glacier inventory dataset of China (version 1.0) (2006–2011), National Tibetan Plateau Data Center [data set], https://doi.org/10.3972/glacier.001.2013.db, 2012.
Liu, Z. F., Tian, L. D., Yao, T. D., Gong, T. L., Yin, C. L., and Yu, W. S.: Temporal and spatial variations of δ18O in precipitation of the Yarlung Zangbo River Basin, J. Geogr. Sci., 17, 317–326, https://doi.org/10.1007/s11442-007-0317-1, 2007.
Luan, L. and Zhai, P.: Changes in rainy season precipitation properties over the Qinghai-Tibet Plateau based on multi-source datasets, Progressus Inquisitiones de Mutatione Climatis, 19, 173–190, 2023.
Luo, Y., Arnold, J., Liu, S. Y., Wang, X. Y., and Chen, X.: Inclusion of glacier processes for distributed hydrological modeling at basin scale with application to a watershed in Tianshan Mountains, northwest China, J. Hydrol., 477, 72–85, https://doi.org/10.1016/j.jhydrol.2012.11.005, 2013.
Luo, Y., Wang, X. L., Piao, S. L., Sun, L., Ciais, P., Zhang, Y. Q., Ma, C. K., Gan, R., and He, C. S.: Contrasting streamflow regimes induced by melting glaciers across the Tien Shan–Pamir–North Karakoram, Sci. Rep., 8, 16470, https://doi.org/10.1038/s41598-018-34829-2, 2018.
Lutz, A. F., Immerzeel, W. W., Shrestha, A. B., and Bierkens, M. F. P.: Consistent increase in High Asia's runoff due to increasing glacier melt and precipitation, Nat. Clim. Change, 4, 587–592, https://doi.org/10.1038/nclimate2237, 2014.
Majone, B., Avesani, D., Zulian, P., Fiori, A., and Bellin, A.: Analysis of high streamflow extremes in climate change studies: how do we calibrate hydrological models?, Hydrology and Earth System Sciences, 26, 3863-3883, 10.5194/hess-26-3863-2022, 2022.
McMillan, H., Westerberg, I., and Branger, F.: Five guidelines for selecting hydrological signatures, Hydrol. Process., 31, 4757–4761, https://doi.org/10.1002/hyp.11300, 2017.
Moriasi, D. N., Arnold, J. G., Van Liew, M. W., Bingner, R. L., Harmel, R. D., and Veith, T. L.: Model evaluation guidelines for systematic quantification of accuracy in watershed simulations, T. ASABE, 50, 885–900, https://doi.org/10.13031/2013.23153, 2007.
Myneni, R., Knyazikhin, Y., and Park, T.: MOD15A2H MODIS/Terra Leaf Area Index/FPAR 8-Day L4 Global 500 m SIN Grid V006, NASA EOSDIS Land Processes DAAC [data set], https://doi.org/10.5067/MODIS/MOD15A2H.006, 2015.
Nan, Y., He, Z., Tian, F., Wei, Z., and Tian, L.: Can we use precipitation isotope outputs of isotopic general circulation models to improve hydrological modeling in large mountainous catchments on the Tibetan Plateau?, Hydrol. Earth Syst. Sci., 25, 6151–6172, https://doi.org/10.5194/hess-25-6151-2021, 2021a.
Nan, Y., Tian, L., He, Z., Tian, F., and Shao, L.: The value of water isotope data on improving process understanding in a glacierized catchment on the Tibetan Plateau, Hydrol. Earth Syst. Sci., 25, 3653–3673, https://doi.org/10.5194/hess-25-3653-2021, 2021b.
Nan, Y., He, Z., Tian, F., Wei, Z., and Tian, L.: Assessing the influence of water sampling strategy on the performance of tracer-aided hydrological modeling in a mountainous basin on the Tibetan Plateau, Hydrol. Earth Syst. Sci., 26, 4147–4167, https://doi.org/10.5194/hess-26-4147-2022, 2022.
Nan, Y., Tian, F., Li, Z., and Gui, J.: Longer simulation time step of the tracer-aided hydrological model estimates lower contribution of slow runoff components, J. Hydrol., 625, 129889, https://doi.org/10.1016/j.jhydrol.2023.129889, 2023.
Olsson, T., Jakkila, J., Veijalainen, N., Backman, L., Kaurola, J., and Vehvilainen, B.: Impacts of climate change on temperature, precipitation and hydrology in Finland – studies using bias corrected Regional Climate Model data, Hydrol. Earth Syst. Sci., 19, 3217–3238, https://doi.org/10.5194/hess-19-3217-2015, 2015.
Piani, C., Weedon, G. P., Best, M., Gomes, S. M., Viterbo, P., Hagemann, S., and Haerter, J. O.: Statistical bias correction of global simulated daily precipitation and temperature for the application of hydrological models, J. Hydrol., 395, 199–215, https://doi.org/10.1016/j.jhydrol.2010.10.024, 2010.
Rasouli, K., Pomeroy, J. W., Janowicz, J. R., Carey, S. K., and Williams, T. J.: Hydrological sensitivity of a northern mountain basin to climate change, Hydrol. Process., 28, 4191–4208, https://doi.org/10.1002/hyp.10244, 2014.
Rasouli, K., Pomeroy, J. W., and Marks, D. G.: Snowpack sensitivity to perturbed climate in a cool mid-latitude mountain catchment, Hydrological Processes, 29, 3925-3940, 10.1002/hyp.10587, 2015.
Reggiani, P., Hassanizadeh, S. M., Sivapalan, M., and Gray, W. G.: A unifying framework for watershed thermodynamics: constitutive relationships, Adv. Water Resour., 23, 15–39, https://doi.org/10.1016/s0309-1708(99)00005-6, 1999.
Schaefli, B. and Gupta, H. V.: Do Nash values have value?, Hydrol. Process., 21, 99–104, 2007.
Schaefli, B., Hingray, B., Niggli, M., and Musy, A.: A conceptual glacio-hydrological model for high mountainous catchments, Hydrol. Earth Syst. Sci., 9, 95–109, https://doi.org/10.5194/hess-9-95-2005, 2005.
Stadnyk, T. A. and Holmes, T. L.: Large scale hydrologic and tracer aided modelling: A review, J. Hydrol., 618, 129177, https://doi.org/10.1016/j.jhydrol.2023.129177, 2023.
Su, T., Miao, C. Y., Duan, Q. Y., Gou, J. J., Guo, X. Y., and Zhao, X.: Hydrological response to climate change and human activities in the Three-River Source Region, Hydrol. Earth Syst. Sci., 27, 1477–1492, https://doi.org/10.5194/hess-27-1477-2023, 2023.
Tang, Q. H., Lan, C., Su, F. G., Liu, X. C., Sun, H., Ding, J., Wang, L., Leng, G. Y., Zhang, Y. Q., Sang, Y. F., Fang, H. Y., Zhang, S. F., Han, D. M., Liu, X. M., He, L., Xu, X. M., Tang, Y., and Chen, D. L.: Streamflow change on the Qinghai-Tibet Plateau and its impacts, Chinese Sci. Bull., 64, 2807–2821, https://doi.org/10.1360/tb-2019-0141, 2019.
Tian, F., Hu, H., Lei, Z., and Sivapalan, M.: Extension of the Representative Elementary Watershed approach for cold regions via explicit treatment of energy related processes, Hydrol. Earth Syst. Sci., 10, 619–644, https://doi.org/10.5194/hess-10-619-2006, 2006.
Tian, F., Xu, R., Nan, Y., Li, K., and He, Z.: Quantification of runoff components in the Yarlung Tsangpo River using a distributed hydrological model, Adv. Water Sci., 31, 324–336, 2020.
Tong, R., Parajka, J., Salentinig, A., Pfeil, I., Komma, J., Szeles, B., Kuban, M., Valent, P., Vreugdenhil, M., Wagner, W., and Bloeschl, G.: The value of ASCAT soil moisture and MODIS snow cover data for calibrating a conceptual hydrologic model, Hydrol. Earth Syst. Sci., 25, 1389–1410, https://doi.org/10.5194/hess-25-1389-2021, 2021.
van Pelt, S. C., Kabat, P., ter Maat, H. W., van den Hurk, B. J. J. M., and Weerts, A. H.: Discharge simulations performed with a hydrological model using bias corrected regional climate model input, Hydrol. Earth Syst. Sci., 13, 2387–2397, https://doi.org/10.5194/hess-13-2387-2009, 2009.
Wang, L., Yao, T. D., Chai, C. H., Cuo, L., Su, F. G., Zhang, F., Yao, Z. J., Zhang, Y. S., Li, X. P., Qi, J., Hu, Z. D., Liu, J. S., and Wang, Y. W.: TP-River: Monitoring and Quantifying Total River Runoff from the Third Pole, B. Am. Meteorol. Soc., 102, E948–E965, https://doi.org/10.1175/bams-d-20-0207.1, 2021.
Wang, L., Han, S., Tian, F., Li, K., Li, Y., Tudaji, M., Cao, X., Nan, Y., Cui, T., Zheng, X., Hu, Z., Wang, W., and Yang, Y.: The Evaporation on the Tibetan Plateau Stops Increasing in the Recent Two Decades, J. Geophys. Res.-Atmos., 127, e2022JD037377, https://doi.org/10.1029/2022jd037377, 2022.
Wang, S., Liu, J., Pritchard, H. D., Ke, L., Qiao, X., Zhang, J., Xiao, W., and Zhou, Y.: Characterizing 4 decades of accelerated glacial mass loss in the west Nyainqentanglha Range of the Tibetan Plateau, Hydrol. Earth Syst. Sci., 27, 933–952, https://doi.org/10.5194/hess-27-933-2023, 2023.
Wang, T., Zhao, Y. T., Xu, C. Y., Ciais, P., Liu, D., Yang, H., Piao, S. L., and Yao, T. D.: Atmospheric dynamic constraints on Tibetan Plateau freshwater under Paris climate targets, Nat. Clim. Change, 11, 219–225, https://doi.org/10.1038/s41558-020-00974-8, 2021.
Wang, Y. W., Wang, L., Zhou, J., Yao, T. D., Yang, W., Zhong, X. Y., Liu, R. S., Hu, Z. D., Luo, L., Ye, Q. H., Chen, N. S., and Ding, H. T.: Vanishing Glaciers at Southeast Tibetan Plateau Have Not Offset the Declining Runoff at Yarlung Zangbo, Geophys. Res. Lett., 48, e2021GL094651, https://doi.org/10.1029/2021gl094651, 2021.
Wu, Y., Long, D., Lall, U., Scanlon, B. R., Tian, F., Fu, X., Zhao, J., Zhang, J., Wang, H., and Hu, C.: Reconstructed eight-century streamflow in the Tibetan Plateau reveals contrasting regional variability and strong nonstationarity, Nat. Commun., 13, 6416, https://doi.org/10.1038/s41467-022-34221-9, 2022.
Xu, R., Tian, F., Yang, L., Hu, H., Lu, H., and Hou, A.: Ground validation of GPM IMERG and TRMM 3B42V7 rainfall products over southern Tibetan Plateau based on a high-density rain gauge network, J. Geophys. Res.-Atmos., 122, 910–924, https://doi.org/10.1002/2016jd025418, 2017.
Xu, R., Hu, H. C., Tian, F. Q., Li, C., and Khan, M. Y. A.: Projected climate change impacts on future streamflow of the Yarlung Tsangpo-Brahmaputra River, Global Planet. Change, 175, 144–159, https://doi.org/10.1016/j.gloplacha.2019.01.012, 2019.
Yang, K. and He, J.: China meteorological forcing dataset (1979–2018), National Tibetan Plateau Data Center [data set], https://doi.org/10.11888/AtmosphericPhysics.tpe.249369.file, 2019.
Yao, T. D.: Tackling on environmental changes in Tibetan Plateau with focus on water, ecosystem and adaptation, Sci. Bull., 64, 417–417, https://doi.org/10.1016/j.scib.2019.03.033, 2019.
Yao, T. D., Bolch, T., Chen, D. L., Gao, J., Immerzeel, W., Piao, S., Su, F. G., Thompson, L., Wada, Y., Wang, L., Wang, T., Wu, G. J., Xu, B. Q., Yang, W., Zhang, G. Q., and Zhao, P.: The imbalance of the Asian water tower, Nat. Rev. Earth Environ., 3, 618–632, https://doi.org/10.1038/s43017-022-00299-4, 2022.
Yao, Y. Y., Zheng, C. M., Andrews, C. B., Scanlon, B. R., Kuang, X. X., Zeng, Z. Z., Jeong, S. J., Lancia, M., Wu, Y. P., and Li, G. S.: Role of Groundwater in Sustaining Northern Himalayan Rivers, Geophys. Res. Lett., 48, e2020GL092354, https://doi.org/10.1029/2020gl092354, 2021.
Yoshimura, K., Kanamitsu, M., Noone, D., and Oki, T.: Historical isotope simulation using Reanalysis atmospheric data, J. Geophys. Res.-Atmos., 113, D19108, https://doi.org/10.1029/2008jd010074, 2008.
Zhang, F., Zhang, H. B., Hagen, S. C., Ye, M., Wang, D. B., Gui, D. W., Zeng, C., Tian, L. D., and Liu, J. S.: Snow cover and runoff modelling in a high mountain catchment with scarce data: effects of temperature and precipitation parameters, Hydrol. Process., 29, 52–65, https://doi.org/10.1002/hyp.10125, 2015.
Zhang, T., Li, D., East, A. E., Walling, D. E., Lane, S., Overeem, I., Beylich, A. A., Koppes, M., and Lu, X.: Warming-driven erosion and sediment transport in cold regions, Nat. Rev. Earth Environ., 3, 832–851, https://doi.org/10.1038/s43017-022-00362-0, 2022a.
Zhang, T., Li, D. F., and Lu, X. X.: Response of runoff components to climate change in the source-region of the Yellow River on the Tibetan plateau, Hydrol. Process., 36, e14633, https://doi.org/10.1002/hyp.14633, 2022b.
Zhao, Q., Ding, Y., Wang, J., Gao, H., Zhang, S., Zhao, C., Xu, J., Han, H., and Shangguan, D.: Projecting climate change impacts on hydrological processes on the Tibetan Plateau with model calibration against the glacier inventory data and observed streamflow, J. Hydrol., 573, 60–81, https://doi.org/10.1016/j.jhydrol.2019.03.043, 2019.