the Creative Commons Attribution 4.0 License.
the Creative Commons Attribution 4.0 License.
 | 09 Feb 2024
River plastic transport affected by tidal dynamics
Louise J. Schreyers
Tim H. M. van Emmerik
Thanh-Khiet L. Bui
Khoa L. van Thi
Bart Vermeulen
Hong-Q. Nguyen
Nicholas Wallerstein
Remko Uijlenhoet
Martine van der Ploeg
Plastic is an emerging pollutant, and the quantities in rivers and oceans are expected to increase. Rivers are assumed to transport land-based plastic into the ocean, and the fluvial and marine transport processes have been relatively well studied to date. However, the processes controlling the transport in tidal rivers and estuaries, the interface between fluvial and marine systems, remain largely unresolved. For this reason, current estimates of riverine plastic pollution and export into the ocean remain highly uncertain. Hydrodynamics in tidal rivers and estuaries are influenced by tides and freshwater discharge. As a consequence, flow velocity direction and magnitude can change diurnally. In turn, this impacts the transport dynamics of solutes and pollutants, including plastics. Plastic transport dynamics in tidal rivers and estuaries remain understudied, yet the available observations suggest that plastics can be retained here for long time periods, especially during periods of low net discharge. Additional factors such as riparian vegetation and riverbank characteristics, in combination with bi-directional flows and varying water levels, can lead to an even higher likelihood of long-term retention. Here, we provide a first observation-based estimate of net plastic transport on a daily timescale in tidal rivers. For this purpose, we developed a simple Eulerian approach using sub-hourly observations of plastic transport and discharge during full tidal cycles. We applied our method to the highly polluted Saigon River, Vietnam, throughout six full tidal cycles in May 2022. We show that the net plastic transport is about 20 %–33 % of the total plastic transport. We found that plastic transport and river discharge are positively and significantly correlated (Pearson's R2 = 0.76). The net transport of plastic is higher than the net discharge (20 %–33 % and 16 %, respectively), suggesting that plastic transport is governed by factors other than water flow. Such factors include wind, varying plastic concentrations in the water, and entrapment of plastics downstream of the measurement site. The plastic net transport rates alternate between positive (seaward) net transport and negative (landward) net transport as a result of the diurnal inequality in the tidal cycles. We found that soft and neutrally buoyant items had considerably lower net transport rates than rigid and highly buoyant items (10 %–16 % vs. 30 %–38 %), suggesting that transport dynamics strongly depend on item characteristics. Our results demonstrate the crucial role of tidal dynamics and bi-directional flows in plastic transport dynamics. With this paper we emphasize the importance of understanding fundamental transport dynamics in tidal rivers and estuaries to ultimately reduce the uncertainties of plastic emission estimates into the ocean.
- Article
(4556 KB) - Full-text XML
- BibTeX
- EndNote


Exposure of terrestrial and aquatic ecosystems to plastic has gained considerable interest among the public and scientific community due to its potential negative effects on the environment (Rochman et al., 2016). While the environmental risks posed by plastics remain, to date, largely uncertain, its presence in the environment is widely perceived as undesirable from an economic, aesthetic, and ethical perspective (Borrelle et al., 2017; Koelmans et al., 2021; Beaumont et al., 2019). Effective and timely reduction strategies require understanding of the transfer dynamics of plastics across ecosystems and within environmental compartments (van Emmerik and Schwarz, 2020). Rivers are one of the main pathways for the delivery of plastics from land to the sea (Meijer et al., 2021). Recently, efforts have been made to use concepts from hydraulics, hydrology, fluvial geomorphology, sedimentology, and debris transport to resolve the open questions of river plastic transport (Liro et al., 2020; Valero et al., 2022; Waldschläger et al., 2022). In particular, river plastic transport processes have been increasingly investigated in recent years in relation to hydrology. Observational studies have demonstrated the strong response of plastic transport to high river discharge events (van Emmerik et al., 2022a, 2023). Extreme discharge events such as floods mobilize large quantities of plastic and can lead to increased plastic emissions into the ocean (Roebroek et al., 2021b; van Emmerik et al., 2023; Hurley et al., 2018). Under normal hydrological conditions, the relation between plastic transport and discharge varies between catchments and is non-trivial (Roebroek et al., 2022; van Emmerik et al., 2022a). Despite growing efforts to link plastic transport to hydrological processes, the transfer dynamics from rivers to sea remain poorly understood (van Emmerik et al., 2022b). Ultimately, the transfer processes in the lower reaches of rivers – in tidal rivers and estuaries – are the most crucial aspect for quantifying plastic emissions into the ocean. Yet, these plastic transfer processes at the river–ocean interface are arguably the most understudied aspect of riverine plastic transport.
Tidal rivers and estuaries are key components of river systems as they form the interface between rivers and coastal environments (Hoitink and Jay, 2016). In tidal rivers, flows are affected by the combination of freshwater discharge and coastal forcing processes, such as tides. The interactions between river discharge and tidal dynamics ultimately affect the water, sediment, and pollutant budgets (Healy et al., 2007; Tessler et al., 2018; Fernandes and Pillay, 2010). This can result in either net export towards the coastal water or net import landward, depending on the spatio-temporal scales considered. For example, characterizing net sediment transport requires quantifying the balance between landward supply and retention mechanisms within the estuarine zone. Various pollutants are similarly affected by bi-directional flows, with both net export and import being observed depending on the tidal dynamics (Fernandes and Pillay, 2010).
Several plastic research studies have aimed to quantify global riverine emissions of plastic into the sea (Jambeck et al., 2015; Lebreton et al., 2017; Schmidt et al., 2017; Meijer et al., 2021). River transport models typically include freshwater discharge as a determining variable for the total export into the sea but do not consider tidal effects on net water discharge (Lebreton et al., 2017; Schmidt et al., 2017; Meijer et al., 2021). To date, no plastic transport model accounts for the influence of tidal dynamics on plastic emissions into the sea. Meijer et al. (2021) postulated that the probability of riverine plastic reaching the oceans increases with proximity to the river mouth because larger cross-sectional areas in downstream reaches will reduce the likelihood of plastic trapping along riverbanks. We argue that, in tidal rivers and estuaries, bi-directional flows and other processes including turbulent mixing, entrapment in mudflats, and vegetation could generate the opposite effect. With increasing tidal influence towards the river mouth, higher retention times of plastic within the system can be expected. This can ultimately result in lower net plastic transport rates in the downstream reaches than in the upstream reaches of the river system. Most global models assume that river plastic emissions are equivalent to plastic transport estimated at the most downstream point of the river (Meijer et al., 2021). This neglects retention dynamics within tidal rivers and estuaries, as well as potential landward transport. Acha et al. (2003) found that salinity fronts in estuaries act as a physical barrier that accumulates plastic. More recent studies have also shown the limited nature of plastic export in estuaries (Fernandino et al., 2016; López et al., 2020; Tramoy et al., 2020a; van Emmerik et al., 2020). For instance, López et al. (2020) simulated plastic transport in the Chesapeake estuary (USA) and found that only 5 % of the annual microplastic transport was exported into coastal waters, whereas the overwhelming majority (94 %) beached on the estuarine shores.
Both Eulerian- and Lagrangian-based approaches have been used to study solute transfer dynamics from rivers to the ocean, notably in the field of sediment transport (Ballio et al., 2018). Lagrangian approaches follow the motion of particles, whereas Eulerian approaches describe the motion of particles over a spatially fixed volume. Most observation-based studies on plastic transport in tidal rivers and estuaries follow a Lagrangian approach in that they study the transport and accumulation dynamics of a finite number of items (Ledieu et al., 2022; Ryan and Perold, 2021; Sutton et al., 2016; Tramoy et al., 2020a, b). These studies all show that plastic trajectories are affected by both non-uniform advection (longitudinal) and diffusive (multi-directional) transfer processes. Mobile plastics travel limited distances, although a considerable share of plastics will deposit in various riverine compartments and be retained for years to decades at a time (Tramoy et al., 2020a, b). Such transfer dynamics are the result of both limited transport caused by bi-directional flows and (temporary) trapping in vegetation and along riverbanks. Despite the growing evidence that tidal and estuarine dynamics attenuate plastic emissions into the oceans, net plastic transport has never been measured during full tidal cycles. The difficulty in conducting measurements at night (due to the lack of daylight) and the resource-intensive nature of continuous measurements likely explain why such measurements have not been done thus far.
For this study, we developed a simple and easily transferable approach to quantify net plastic transport over tidal cycles at a river cross-section in relation to total plastic transport. By using a Eulerian approach, we considered a fixed spatial domain in which we estimated plastic transport. This approach entails measuring plastic transport and water flow dynamics (river discharge, flow velocity, and water depths) at a sub-hourly frequency. We applied this method to the Saigon River, Vietnam, in May 2022 and estimated net and total plastic transport over six full tidal cycles. For the first time, we were able to estimate net plastic transport in a tidal river based upon field observations and using an Eulerian approach. We collected data on floating plastic transport for various plastic types and measured river discharge at a sub-hourly frequency. We estimate net transport of plastic and how it varies by plastic type and by tidal cycle. We aim to highlight the crucial role of tidal rivers in the transport of riverine plastic into the ocean.
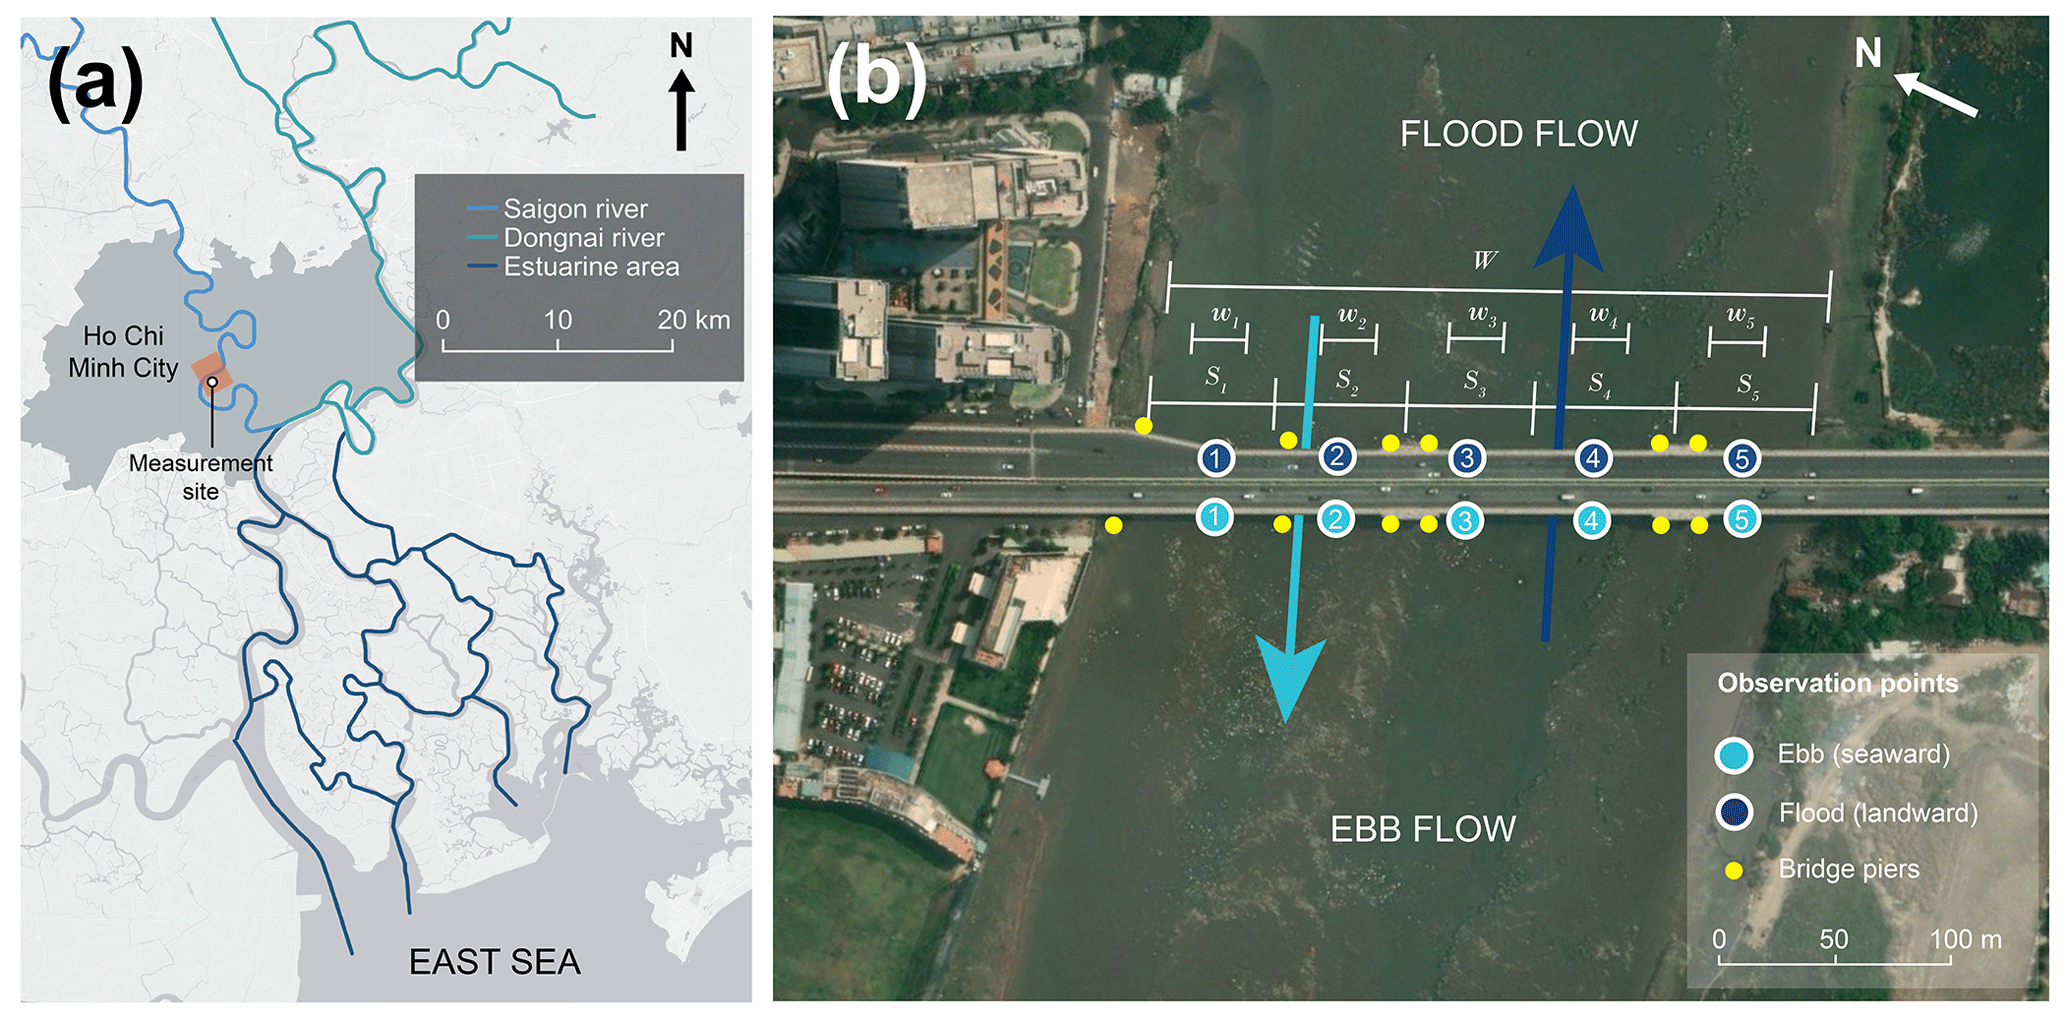
Figure 1(a) Measurement site within the Saigon–Dong Nai river system. (b) Measurement site (Thu Thiem bridge; 10.785984, 106.718332) and locations. The numbers 1, 2, 3, 4, and 5 mark the observation points distributed across the bridge, with variations in their location depending on the flow direction. For floating plastic, we considered observational track width wi (of 15 m). For discharge calculations, we considered widths represented as si at each observation point. © Microsoft. Note the different north orientation for the two panels.
2.1 Study site
The field measurements were conducted at one site on the Saigon River (Vietnam) in Ho Chi Minh City (HCMC) at 70 km from the river mouth (Fig. 1). The Saigon River originates in Cambodia, passes through the Dau Tieng reservoir, progresses through a diverse agricultural and industrial region, and then crosses HCMC, which has a population of 9 million people, making it Vietnam's largest city. Approximately 20 km south of HCMC, the Saigon River meets the Dong Nai River where it forms the Nha Be River. The latter passes through the Can Gio mangrove forest, where it branches into multiple channels and then debouches into the East Sea (Nguyen et al., 2020) (Fig. 1a). The Saigon River is affected by an asymmetric semi-diurnal tidal regime, usually resulting in a reversal of the flow direction twice a day. Tidal dynamics are registered up to the Dau Tieng reservoir, 140 km from the river mouth (Nguyen et al., 2021), and this regulates net discharge in the Saigon River (Camenen et al., 2021). In addition, river discharge in the Saigon River is affected by a strong seasonality between the wet and the dry seasons, with monthly mean net discharge varying between −80 and 320 m3 s−1 (Camenen et al., 2021).
2.2 Measurement setup
This study focuses on the transport of floating macroplastics larger than 0.5 cm, hereafter referred to as plastic. We measured plastic transport, water depth, and flow velocity at the Thu Thiem bridge (10.785984, 106.718332), located in the southern part of HCMC. The field measurements were conducted continuously over 74 h and 30 min, from 1 to 4 May 2022. Five observation points were monitored across the river width to account for the spatial variability at the river cross-section in plastic transport, water depth, and flow velocity (Fig. 1b). The observation points were chosen in order to maximize coverage of the entire river cross-section on the one hand and to minimize the influence of the bridge piers that support the road from which observations were made. Measurements were conducted on both sides of the bridge. During flood flow, the measurements took place on the northern side of the bridge, while the southern side was used during ebb flow. This allowed surveyors to face the flow direction during measurements and facilitated the handling of equipment in and out of the water. The bridge deck was approximately 14 m above the average water surface elevation during measurements.
At each measurement location, three instantaneous measurements were taken: floating plastic transport (Sect. 2.3), the water depth (Sect. 2.4), and the flow velocity (Sect. 2.5). A minimum of two surveyors were present to conduct the instantaneous measurements. This was necessary during peak plastic transport periods, when values of up to over 100 items perminute were registered. In such cases, one surveyor conducted the visual counting, while another noted down the values. Up to four surveyors could be present for instantaneous measurements, depending on availability. Each measurement round lasted, on average, 9 min. The measurement duration varied between 3 to 42 min, depending on the number of available surveyors, the presence of boat traffic which could further delay the measurement, and potential challenges with handling equipment. Measurements were conducted both during the day and at night. At night, a flashlight lamp (P18R Signature, Ledlenser, Germany, https://ledlenser.com/en/, last access: 2 December 2022) was used to illuminate the water surface, estimate plastic transport, and take equipment in and out of the water safely. The model used had a 4500 lumen luminous flux.
2.3 Plastic transport estimates
Plastic transport was estimated using the visual counting method developed by González-Fernández and Hanke (2017). All visible (> 0.5 cm) anthropogenic litter items floating at the water surface were counted and classified for a duration of 2 min by trained observers who stand on a bridge. The following eight categories were used for classifying visible anthropogenic litter items: EPS (expanded polystyrene), POhard (hard polyolefins), POsoft (soft polyolefins), PS (polystyrene), PET (polyethylene terephthalate), multilayer plastics, other plastic items, and other litter items (non-plastic). These plastic categories have been used in previous studies (van Emmerik et al., 2022a; Schreyers et al., 2021) and are considered to be suitable for a first-order identification of plastic types. In this study, we only consider plastic items and therefore do not report total litter transport estimates. Plastic transport P (items h−1) was calculated using the following equation: (van Emmerik et al., 2022a):
with mean plastic transport observation (items h−1) for observation point i at five observation points, observation track width wi (m), and total river width W (m). We considered an observation track width of 15 m and a total river width of 298 m.
Plastic transport is often expressed in terms of mass transport in current literature (Lebreton et al., 2017; Meijer et al., 2021; Schmidt et al., 2017; van Emmerik et al., 2022a). Therefore, we also expressed plastic transport M in terms of mass transport (kg d−1) using the following equation (Vriend et al., 2020):
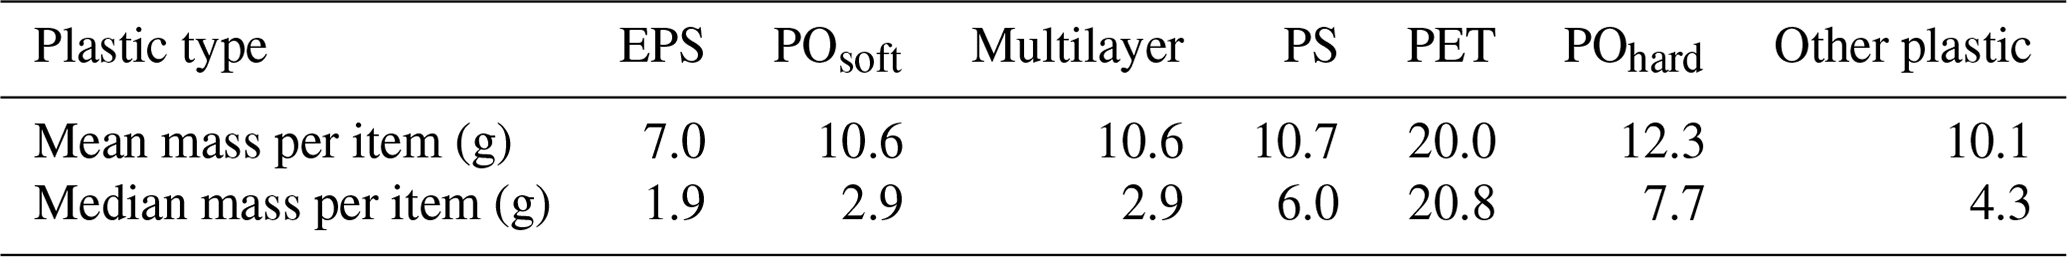
with expressing either the mean or median mass per plastic item (g) and c being the conversion factor (from g h−1 to kg d−1). To convert item transport to mass transport, we used the mass statistics from van Emmerik et al. (2019). In this study, 3022 items collected over 45 d were weighted and categorized into the following plastic type categories: EPS, PS, POhard, POsoft, and PET. The items were collected using a net at the same monitoring location as in our study. The weighting and counting of individual items reported in (van Emmerik et al., 2019) allowed us to derive mean and median masses per item category. For the categories of multilayer and other plastic from our observations, we used the mean and median mass found for POsoft items and all items, respectively. In van Emmerik et al. (2019), multilayer items were categorized as soft items (POsoft). Median and mean mass values per item category are reported in Table D3 in Appendix D.
2.4 Water depth, flow velocity measurements, and discharge estimates
Water depth was measured using a single-beam sonar with compressed high-intensity radiated pulse (CHIRP) (Deeper Smart Sonar Chirp 2, Lithuania, https://deepersonar.com/, last access: 10 November 2022). The sonar was lowered from the bridge into the water using a rope. Once the sonar reached the water surface, water depth values could be read on a previously paired mobile phone using the Deeper Smart Sonar mobile application. The sonar was lost on 4 May 2022 around 03:00 GMT + 7 due to collision with a container ship. As a result, water depths were not recorded for the last 13 h of measurements.
Near-surface flow velocities were measured using a propeller flow meter (Flowatch, JDC, Switzerland, https://www.jdc.ch/, last access: 10 November 2022). The flow meter was lowered from the bridge into the water to approximately 1 m of depth from the surface using a cable. The surface velocities were converted to depth-averaged velocity by multiplying the surface velocity by a coefficient of 0.85. This coefficient assumes a logarithmic vertical velocity distribution and a typical bed roughness and is generally accepted in the hydrological community (Muste et al., 2008; Hauet et al., 2018; Rantz, 1982; Boiten, 2003). Flow velocities for flood water flows were recorded as negative values and as positive values for ebb water flows.
The cross-sectional area was estimated for each observation point as follows:
with segment width si (m) and depth di (m) per observation point i. We established five segments, with an observation point in the middle. The water depth was measured at each observation point i and was considered to be the averaged depth per segment. We estimated water discharge (m3 s−1) at the river cross-section as follows:
with being the depth-averaged flow velocity (m s−1) at each measurement location i. Bathymetric data were not available, and our estimates of water depths could have overlooked local bed variations and scour holes. We measured water depths at five locations across the river width, taking into account contraction scour effects (Arneson, 2013). However, we did not directly measure water depths at the nose of the bridge piers, which could mean that we may have overlooked local scour holes. We estimated the maximum local scour hole depths based on Arneson (2013) (Chapter 7, specifically detailed in Eqs. 7.3 and 7.4). We found scour depths reaching maximum values between 3.6–2.7 m, depending on the bridge pier considered (Fig. 1b). We assumed the piers to be composed of a set of two columns on each side of the bridge. We found a maximum total scour area across the entire cross-section of approximately 90 m2. Such an increase in cross-sectional area would result in an increase in river discharge estimates of 2 %. Thus, we can reasonably assume that, in such a worst-case scenario, factors such as local scour holes have only a minimal impact on our discharge estimates.
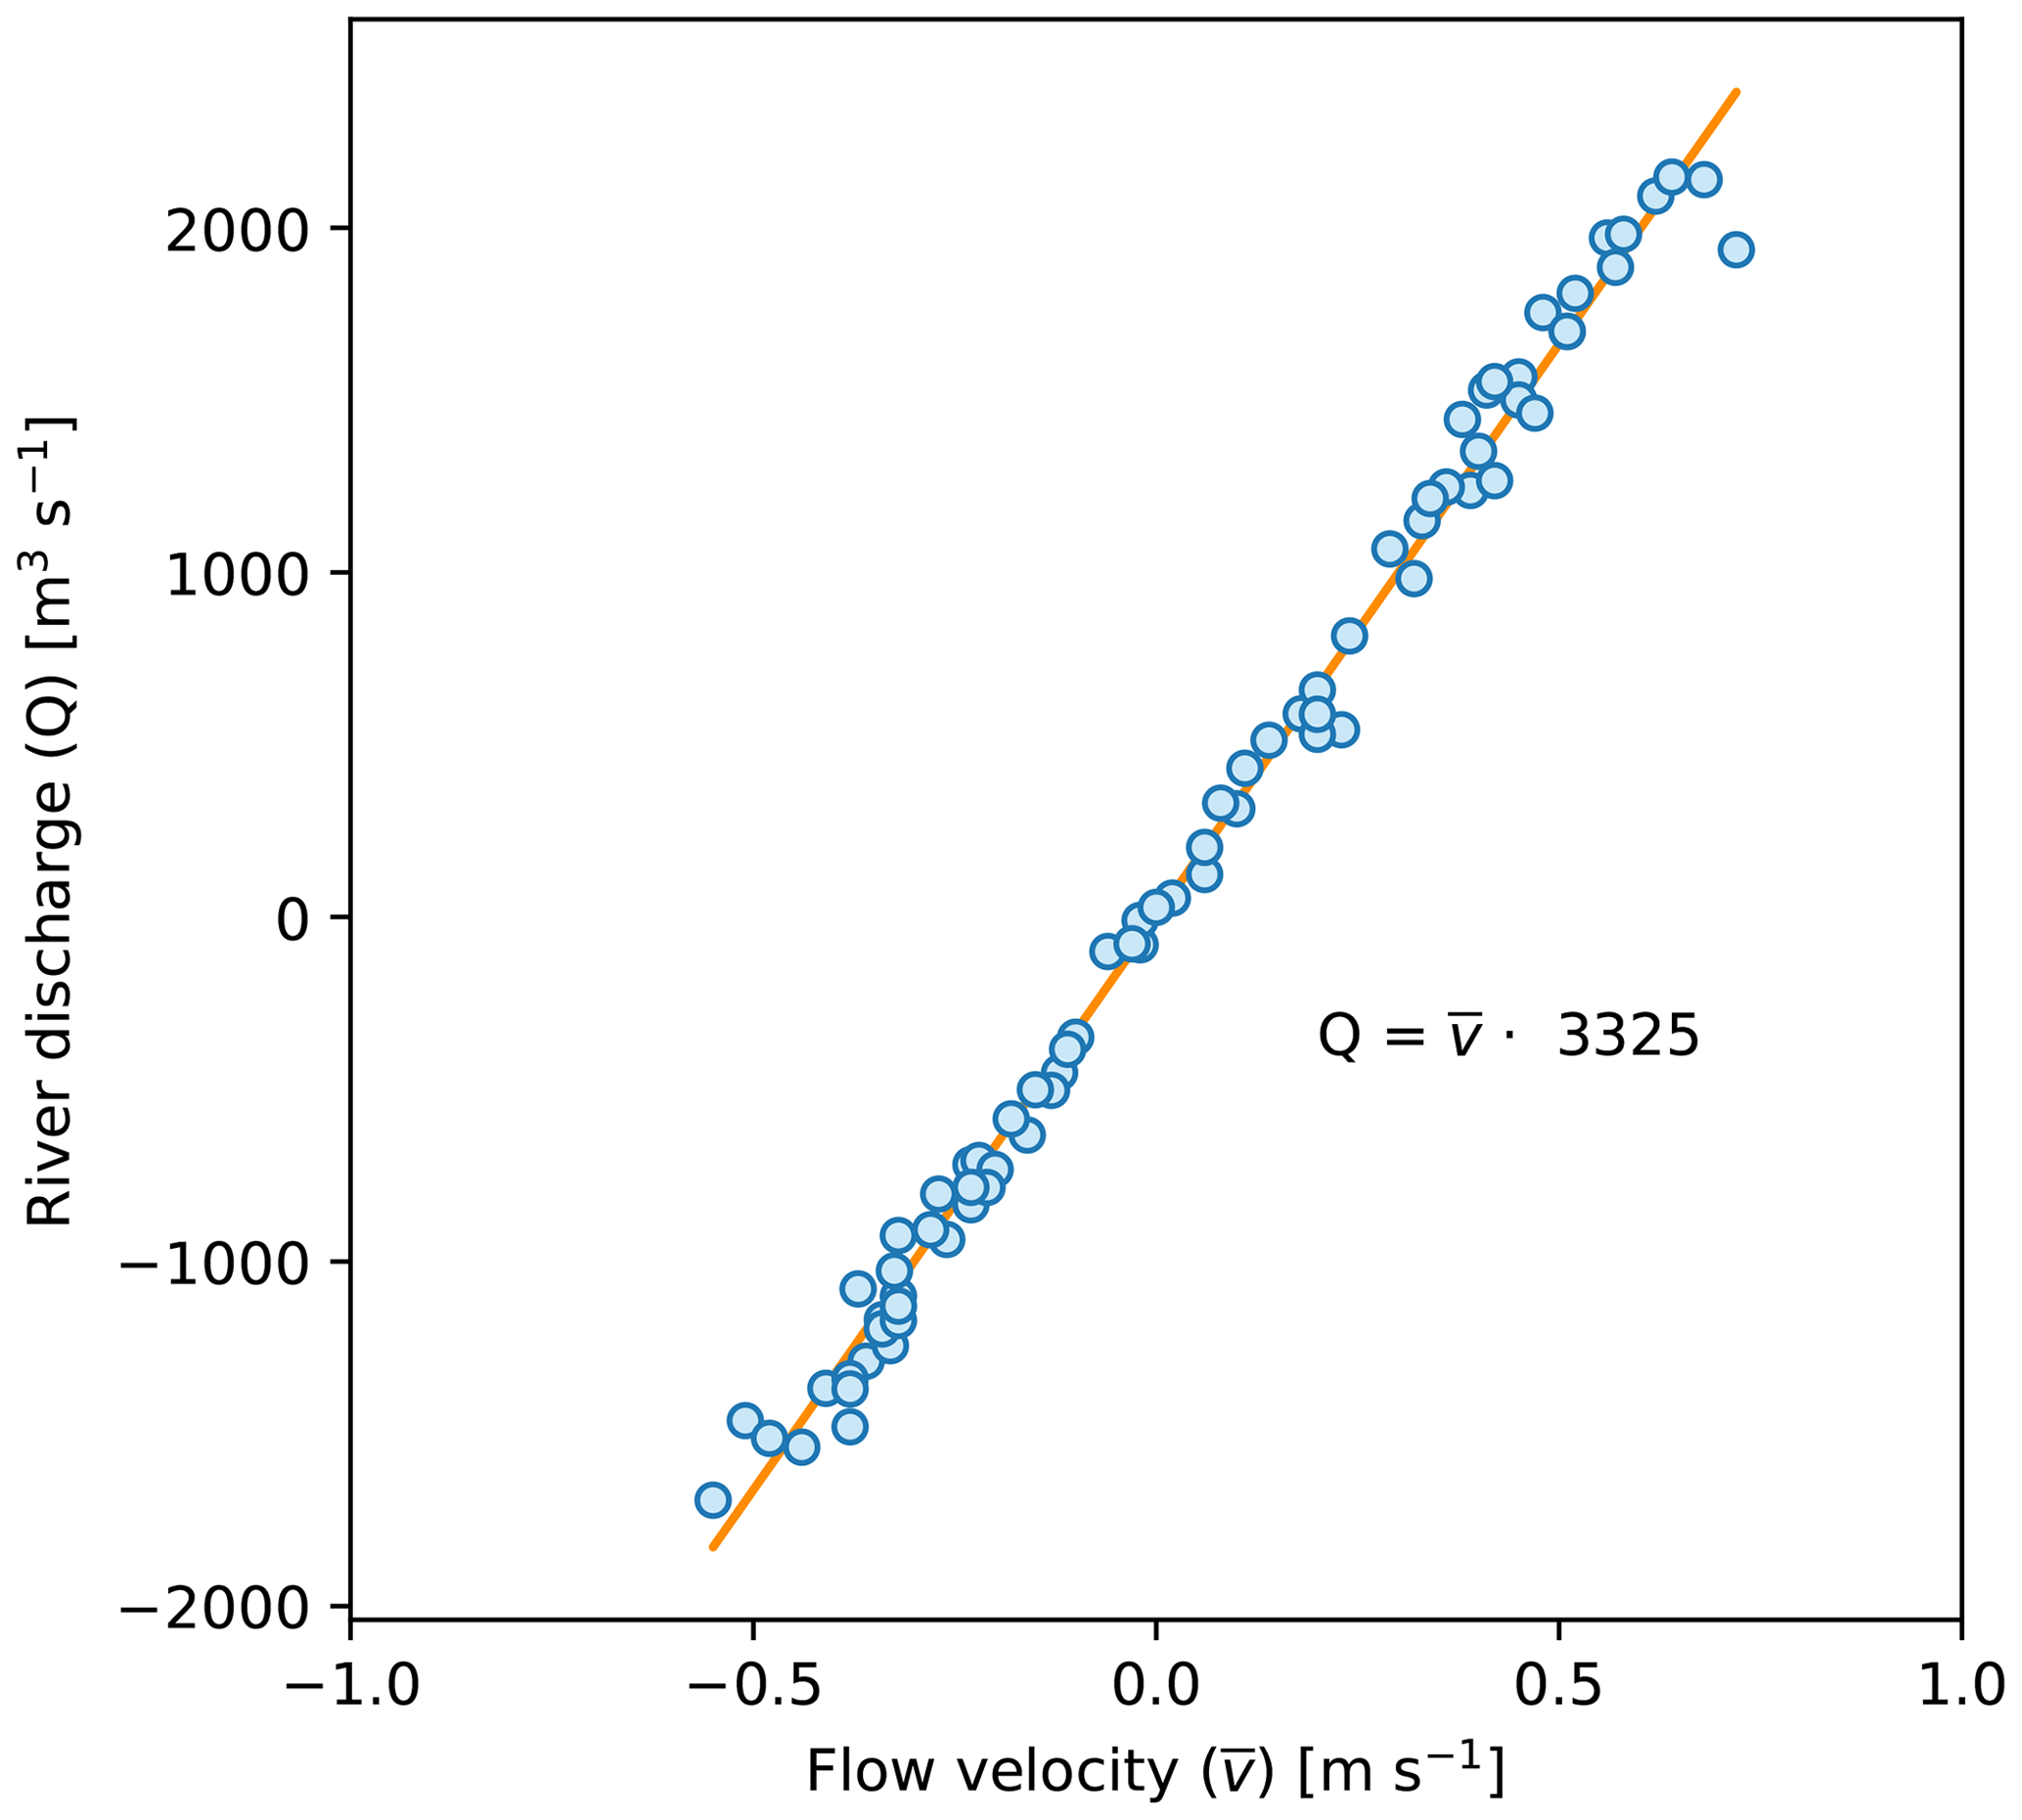
Because of the lack of water depth observations during the last 13 h of measurement, the resulting discharge estimates only covered five out of the six tidal cycles. This data gap was filled by estimating river discharge based on the significant and strong relation found with flow velocity for all observed values (Pearson's R2 = 0.99 and p value < 0.01) (Fig. A1 in Appendix A). The following equation was used to fill missing discharge estimates:
In addition, it should be noted that precise quantification of discharge was outside the scope of our study. Because of the uncertainties inherent to our discharge estimates, we prefer to report the relationship between plastic transport and water flow based on flow velocity estimates (for instance, for Figs. 3 and 4).
2.5 Temporal data harmonization
Plastic transport, water depths, and flow velocities could not be measured at precisely regular time intervals due to constraints in handling equipment, a varying number of available surveyors, and varying distances between measurement locations. For this reason, plastic transport, flow velocity, and discharge values were interpolated to a regular time interval using two different methods. Flow velocity and discharge values were interpolated using tidal characteristics. Tidal constituents were analyzed using the Unified Tidal Analysis and Prediction (UTide) package in Python 3.4 (Codiga, 2011). This enabled us to determine the coefficients (phase and amplitude) for each tidal constituent, which were in turn used to interpolate our time series. We present the results of the tidal constituent analysis in Appendix B as they are not considered to be novel findings but were nonetheless crucial for flow velocity and discharge interpolation. The temporal interpolation was done to a 5 min interval. Plastic transport was also interpolated to 5 min intervals using a linear interpolation.
2.6 Calculating net and total plastic transport and discharge
Here we define ebb and flood as the tidal phases in which the water current is flowing seaward and landward, respectively. While seaward plastic transport usually dominates during the ebb phase and landward plastic transport dominates during the flood phase, short lags in time (of about a few minutes) were noted during slack periods (Fig. 2). For instance, although the overall river cross-sections were dominated by one flow direction, reverse flow could still be (temporally) observed at one or a few measurement locations. If, at those measurement locations, plastic densities outweigh densities at the remaining measurement locations, a discrepancy can be noted at the cross-section between water flow and plastic transport directions.
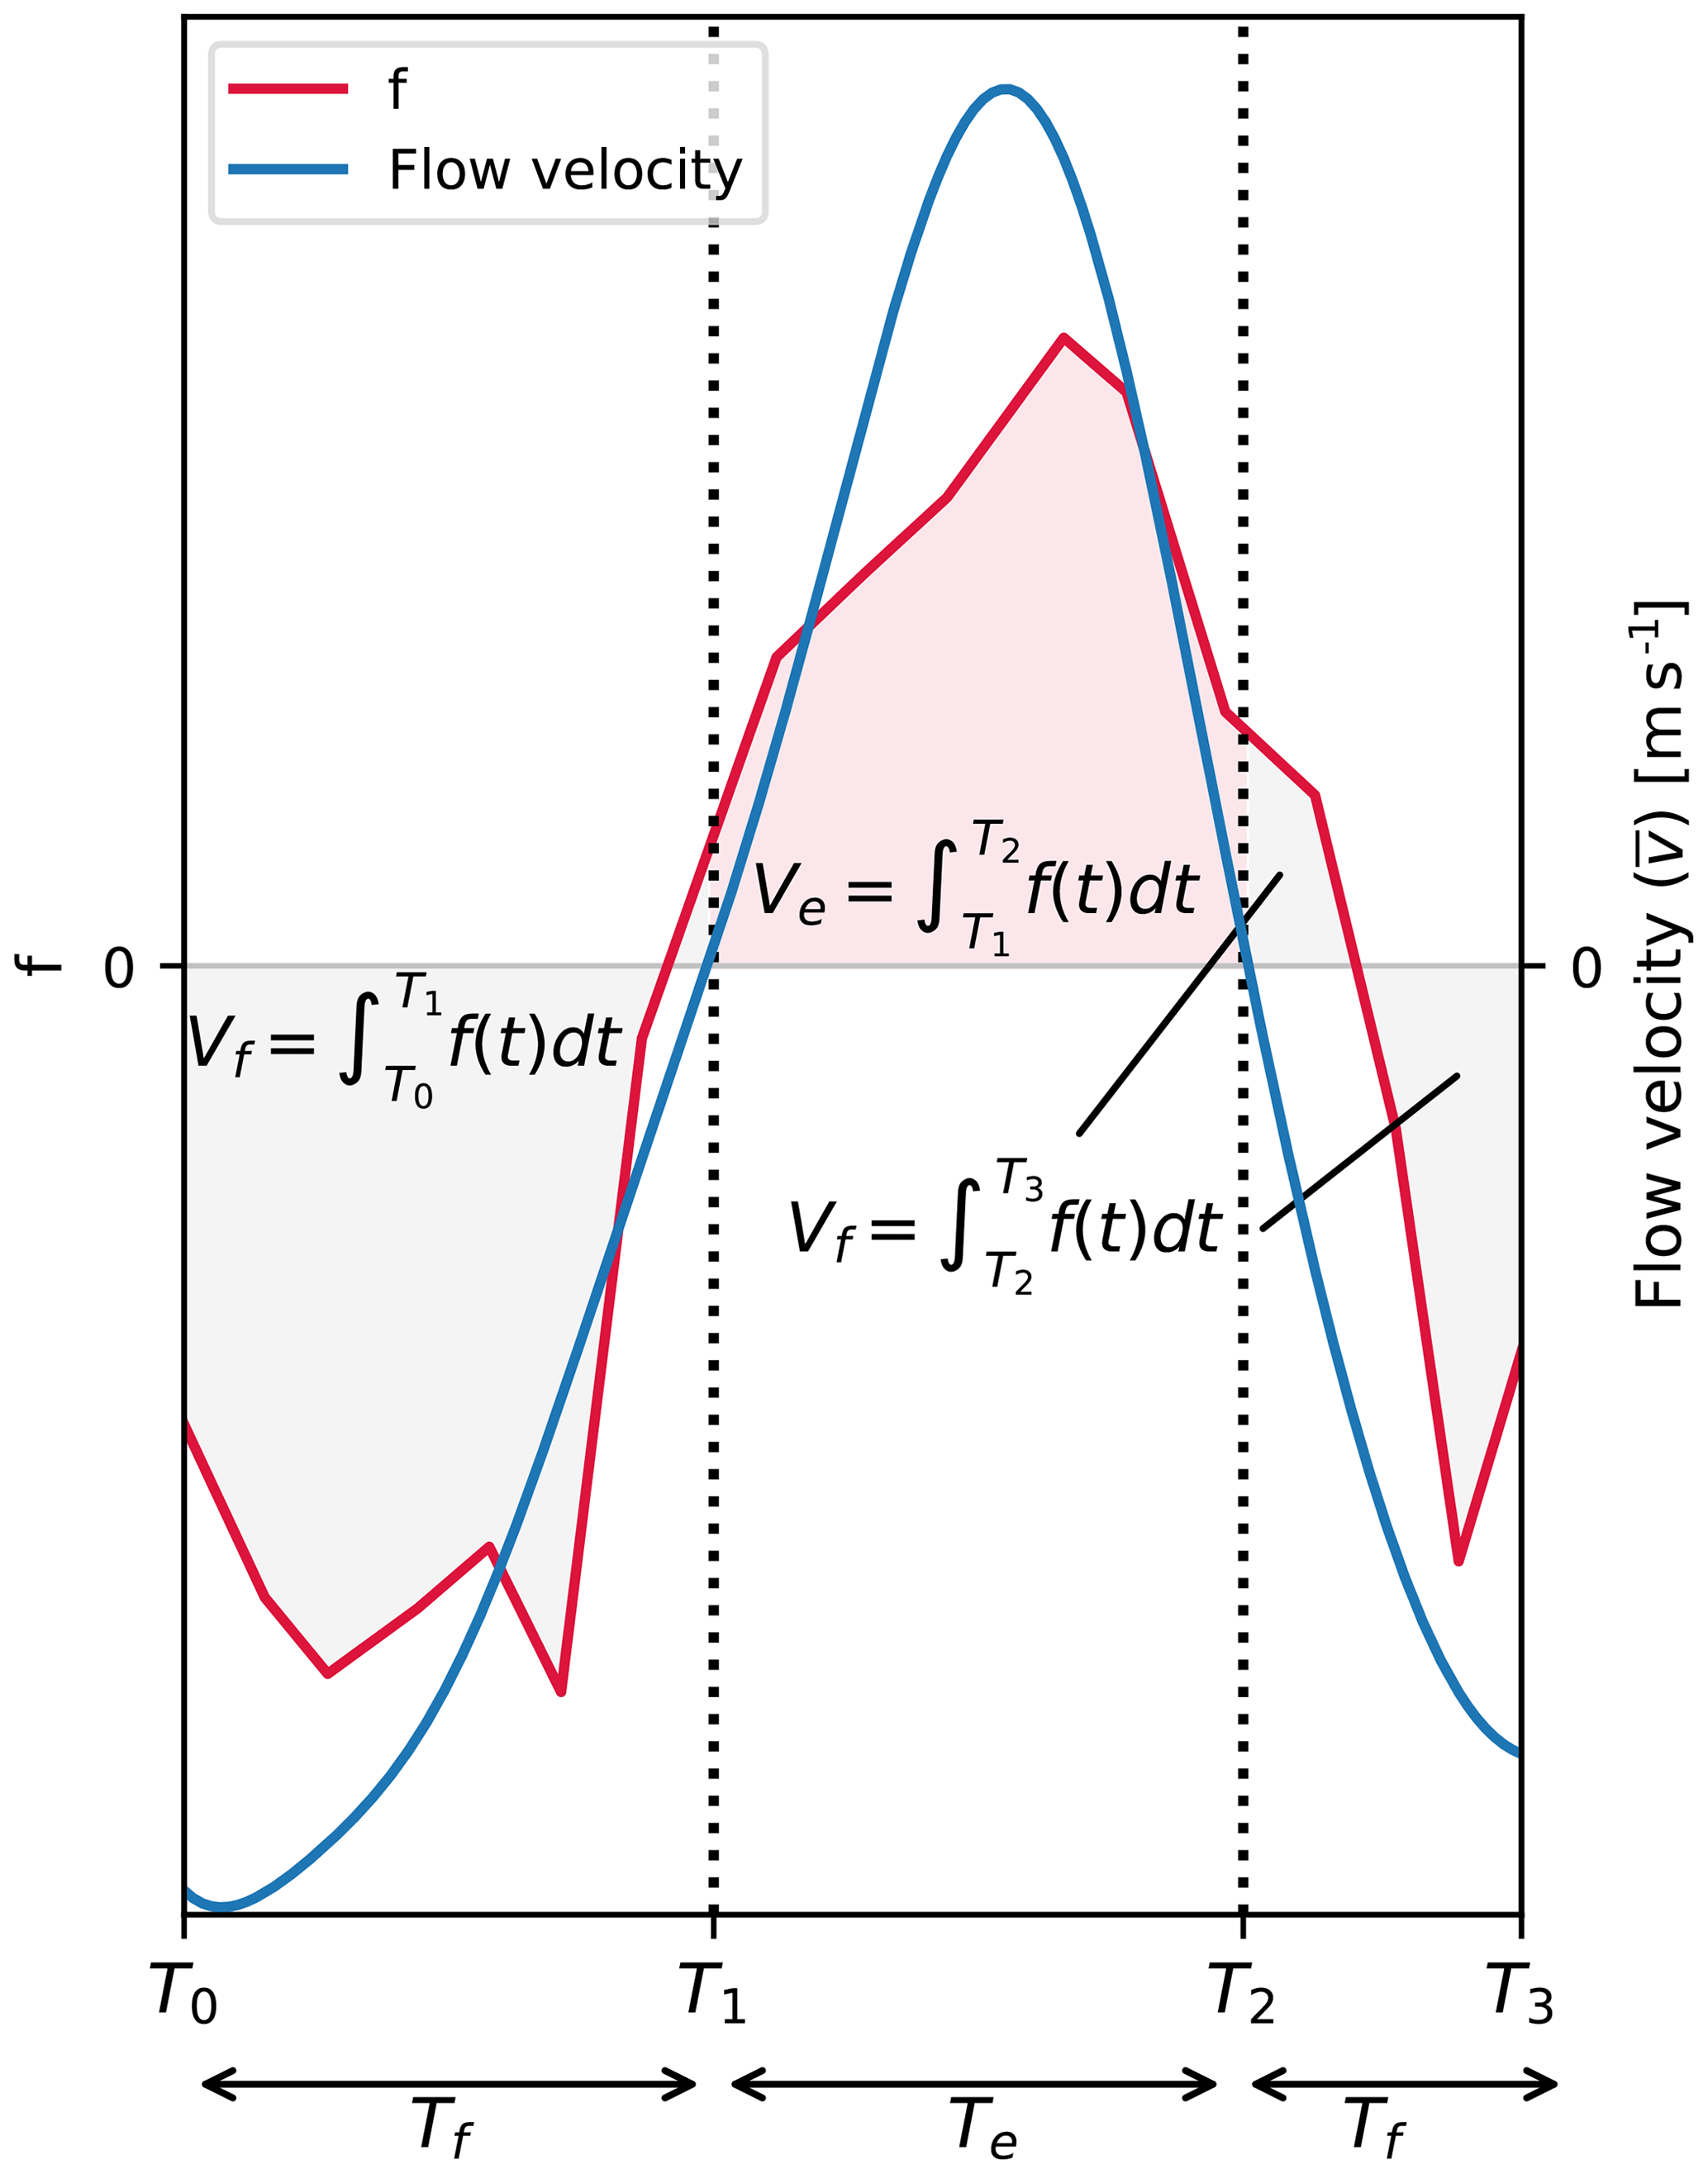
Figure 2Example of calculation of integral areas for the ebb and flood phases of the tidal cycle. The gray-shaded areas correspond to the integral during flood, and the red-shaded area corresponds to the integral during ebb; f represents the variable to be integrated, which could be plastic transport, river discharge, or flow velocity.
Based on the distinction between flood and ebb phases, we calculated the net plastic transport during ebb and flood, flow velocities, and river discharges. We introduce a relative measure of net transport, hereby called the delivery ratio (dr). Using a relative metric allows for easier comparison across various spatio-temporal scales and within systems with varying plastic pollution levels. The dr expresses the ratio (–) between net and total transported amounts, volumes, or distances as follows:
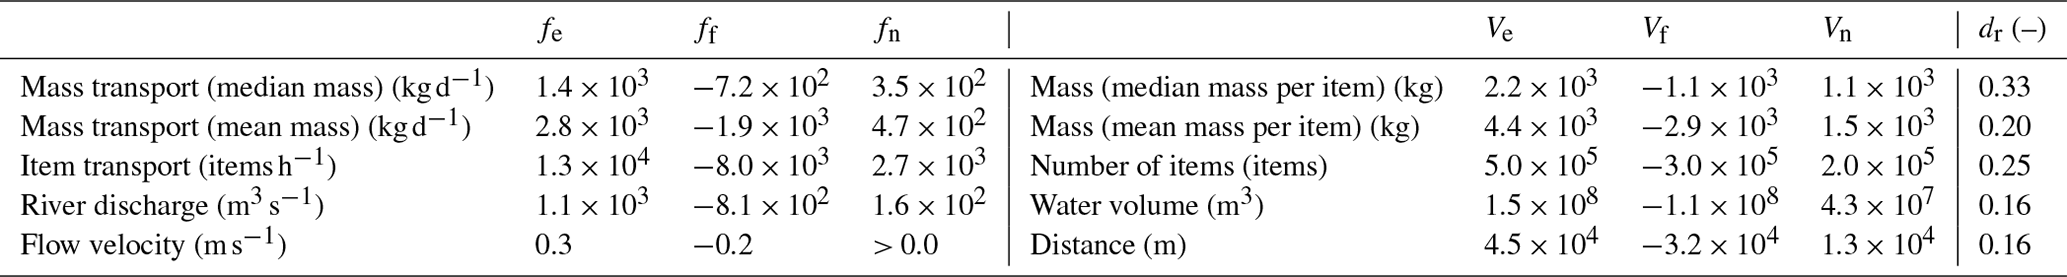
Table 1Summary of plastic transport, flow velocity, discharge, and associated metrics during ebb and flood phases.
We present two alternative ways of calculating the delivery ratio in Appendix D. The results based on the three ways of calculating dr are also reported in Appendix D (Tables D1 and D2). For brevity, we only report in the main text the delivery ratio values as presented above.
To estimate the delivery ratio (dr), we calculated the total transported amounts, volumes, and distances of plastic, discharge, and flow velocity during ebb and flood as follows:
Te and Tf indicate the ebb and flood tidal phase, respectively; f indicates the values integrated over time t (plastic transport, flow velocity, and discharge); and v indicates the flow velocity. The integral values for flow velocity and discharge correspond, respectively, to the total river distance (m) and water volume (m3) that passed by the measurement location per tidal phase. The integral values for plastic transport correspond to the total amount (number and mass) of plastic items passing by the measurement location. Figure 2 gives an example for the Ve and Vf calculation using the flow velocity as the variable of reference for distinguishing between flood and ebb.
We also determined the net plastic transport, flow velocity, and discharge (fn) in absolute values (respectively in items h−1, m s−1, and m3 s−1) as follows:
In addition, we calculated the mean plastic transport, flow velocity, and discharge for each ebb and flood cycle (fe and ff, respectively) as follows:
3.1 Net plastic transport less than one-third of total plastic transport
Over the six tidal cycles considered, we found a seaward mean net transport of approximately 2.7 × 10³ items h−1, corresponding to 350–470 kg d−1 (Table 1). This represents only about 20 %–33 % of total plastic transport. This ratio is lower for river discharge and flow velocity (16 %) (Table 1). In the Discussion section, we explored potential explanations for the observed disparities between water and plastic delivery ratios. Plastic net mass transport rates vary by 34 %, depending on whether the mean or median mass of items is considered (Table 1). Overall, the delivery ratio based on mean mass per item is lower (20 %) than that based on median mass per item (33 %). We consider the delivery ratio for item transport (25 %) to be the more robust one as it aligns more closely with our observational data (Sect. 2.3).
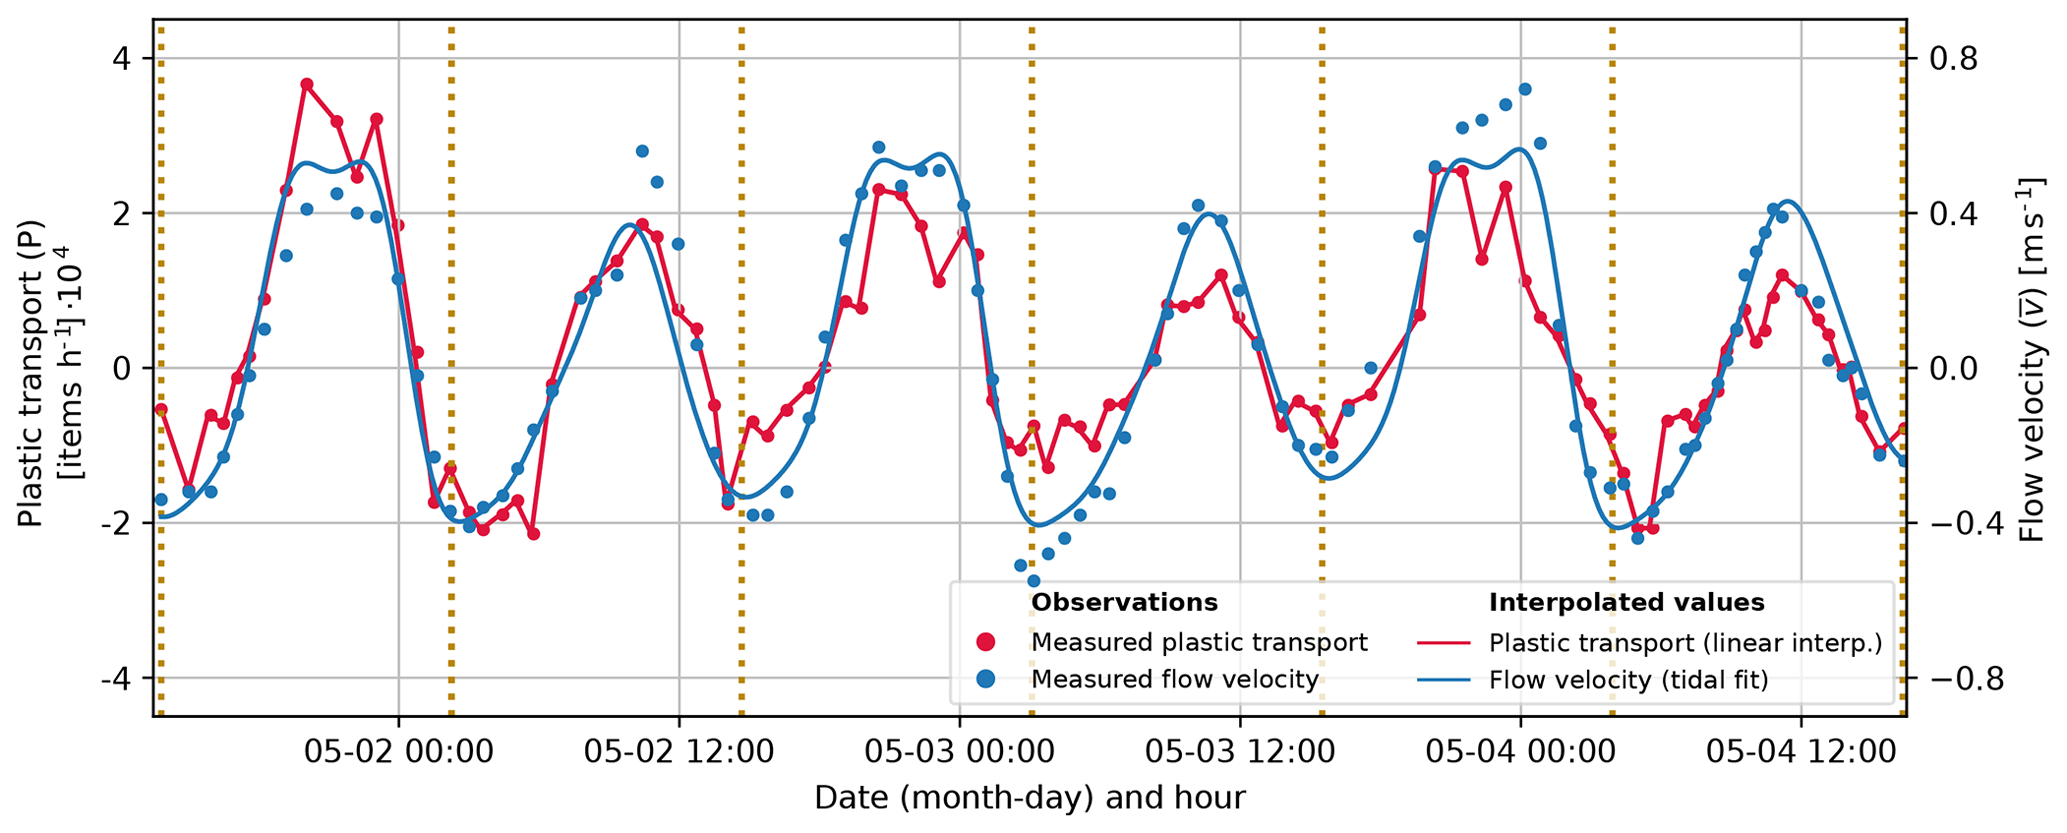
Figure 3Plastic transport and flow velocity over the entire measurement period. The dotted yellow lines separate each tidal cycle.
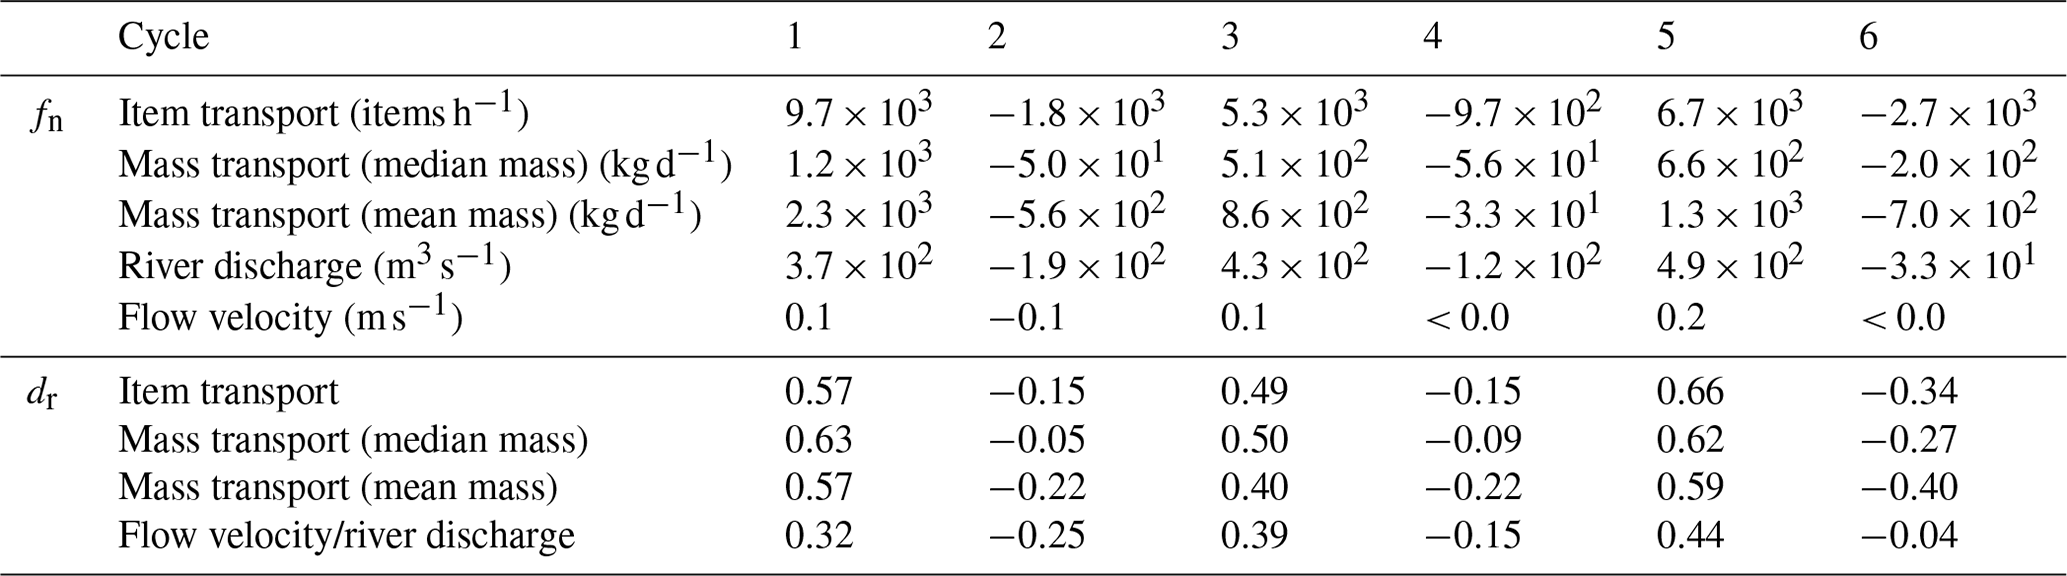
Table 2Plastic transport, flow velocity, discharge, and associated metrics during ebb and flood phases per tidal cycle.
Water flow in the Saigon River follows a sinusoidal pattern, with clear alternations between ebb and flood phases determined by the tidal cycle and its various phases in rising and falling limbs and slack-water periods (Fig. 3). The maximum flow velocity during the ebb phase exceeds that observed during the flood phase (0.6 and −0.4 m s−1, respectively). The flood phase is longer than the ebb phase (38 h 20 min and 36 h 10 min, respectively). We found a seaward net discharge of 160 m3 s−1 over the measurement period, corresponding to relative net water transport of approximately 16 % of total water flow (Table 1). Plastic transport follows a similar asymmetrical sinusoidal pattern to flow velocity (Fig. 3). Plastic transport was found to be highly positively correlated with river discharge and flow velocity (Pearson's R2 = 0.76 and p value < 0.01 for plastic transport in relation to both discharge and flow velocity). Plastic transport can be expressed as a linear function in relation to discharge for all items aggregated (Fig. C1), as well as by plastic types (Fig. C2). For the latter, the R2 values could indicate the degree to which river discharge influences the transport of these different plastic types. With this assumption, transports of PS and POsoft items are the most correlated river discharges (R2 of, respectively, 0.70 and 0.68).
Despite the strong and significant correlation found between river discharge and plastic transport, similar discharge values were observed for a wide range of plastic transports. For instance, for peak discharges of over 1800 m3 s−1, plastic transport varied by a factor of almost 4, between 0.7–2.6 × 10⁴ items h−1 (Fig. C1). We hypothesize that varying contributions of different plastic types to the overall plastic transport explain this discrepancy. In particular, a higher share of EPS and POsoft, two types of items for which the relation between transport and river discharge is characterized by a steeper slope (Fig. C2), might lead to higher transport during peak discharge periods. This hypothesis seems to be confirmed by our observations (Fig. C1), with EPS and POsoft items making up more than 80 % of the plastic composition during peak plastic transport, much higher than on average (56 %) (Fig. C1). In addition, a hysteresis pattern is noticeable between plastic transport and river discharges but was not found to be consistent between rising and falling limbs of the tidal cycle for both the entire time series and across the different tidal cycles observed (Figs. C1 and C3). Overall, estimating plastic transport based on a simple linear model from measured discharge would yield large uncertainties, especially for peak transport values. There is no clear explanation for the wide range of plastic transport values during peak discharge events. The observed hysteresis pattern could be related to the asymmetry in rising and falling limbs and/or from other sources of uncertainties, including varying concentrations of different plastic types.
3.2 Diurnal inequality results in alternating positive and negative delivery ratios
During the measurement period, water flow exhibited a mixed tidal cycle (i.e., two high and low tides each lunar day), resulting in diurnal inequality and an alternation between ebb- and flood-dominated tidal cycles. The first, third, and fifth tidal cycles were ebb dominated as the total volume of water was larger during the ebb phase of the cycle than during the flood phase (Ve > Vf). The second, fourth, and sixth tidal cycles exhibited, on the contrary, flood dominance (Vf > Ve) (Table D2).
Because of this diurnal alternation, we could therefore expect varying net discharge and plastic transport rates depending on whether the tidal cycle was ebb or flood dominated. We found positive net plastic transport, flow velocity, and discharge for ebb-dominated cycles (cycles 1, 3, and 5) for both mean values and delivery ratios (Table 2). Negative net plastic transport, flow velocity, and river discharge were measured for flood-dominated cycles (cycles 2, 4, and 6). This indicates that diurnal variations in tidal dynamics and freshwater discharge, resulting in asymmetry in peaks, are important components in explaining the variability in net flow and transport. In line with this, the tidal constituent analysis showed that the main daily tidal component (K1) is the second most important tidal component of our time series (Appendix B, “Tidal constituent analysis”). As a result of the alternation between ebb- and flood-dominated cycles, the cycle-averaged net transport rates varied by a factor of nearly 4 between cycles (9.7 × 10³ items h−1 for the first cycle and −2.7 × 10³ items h−1 for the sixth cycle).
We hypothesize that high plastic delivery ratios could be governed by either cycle-averaged high net river discharge, high plastic concentrations in the water, or a combination of both. For the first tidal cycle, the high plastic delivery ratio (57 %–63 %) seems to be mainly driven by high plastic concentrations as the flow velocity and river discharge delivery ratio were not particularly high (32 %). The highest mean plastic transport during the ebb phase was found for this cycle (2.4 × 10⁴ items h−1, almost twice more than for the entire measurement period) (Table D1). For the third tidal cycle, the plastic delivery ratio was closer to the flow velocity and river discharge delivery ratio (40 %–50 % and 39 %, respectively), and the net river discharge was found to be quite high (430 m3 s−1), more than 16 % higher, in fact, than in the first cycle (370 m3 s−1). This suggests that the high delivery ratio of plastic transport found for the third tidal cycle was mainly governed by high net discharge. The highest plastic delivery ratio was registered during the fifth tidal cycle (59 %–66 %). Net river discharge was also at its peak during this tidal cycle (490 m3 s−1), and net plastic transport was double the average (6.7 × 10³ items h−1 for the fifth tidal cycle and 2.7 × 10³ items h−1 on average for the entire measurement period, but it was lower than during the first tidal cycle (9.7 × 10³ items h−1). During the fifth tidal cycle, a combination of high net discharge and high plastic concentrations likely explains the high plastic delivery ratio found.
Plastic delivery ratios calculated based on item transport and mass transport show variable agreement. For ebb-dominated cycles, the spread in plastic delivery ratios was comprised between ± 1 % and ± 6 %, showing a relatively narrow spread between the calculated values (item transport, mass transport based on median, and mean mass per item). During flood-dominated cycles, the spread widens, ranging from ± 13 % to ± 17 % (Table 2). This disparity is primarily attributed to the lower delivery ratios observed during flood-dominated cycles when considering mass transport based on the median mass per item. The mean mass per item was very similar among items compared to the mean mass of all items: with the exception of PET (mean mass =20.0 g), all items have a mass between 7.0 and 12.3 g, with an overall average of 10.1 g per item. The median mass was more variable among items, ranging between 1.9 and 7.7 g (with the exception of PET, with median mass = 20.8 g) (Table D3). As a result, peaks in the transport of items heavier or lighter than others can alter the cycle-averaged net transport rates and delivery ratios. Anticipating Sect. 3.3, the peak in polystyrene items (PS) observed during the ebb phase of the tidal cycle can explain the lower delivery ratio registered for the median mass transport. Indeed, the median mass for PS items was higher than the averaged median mass for all items (6.0 vs. 4.3 g – 28 % difference), whereas this difference was less pronounced for the mean mass (10.7 vs. 10.1 g – difference of less than 6 %).
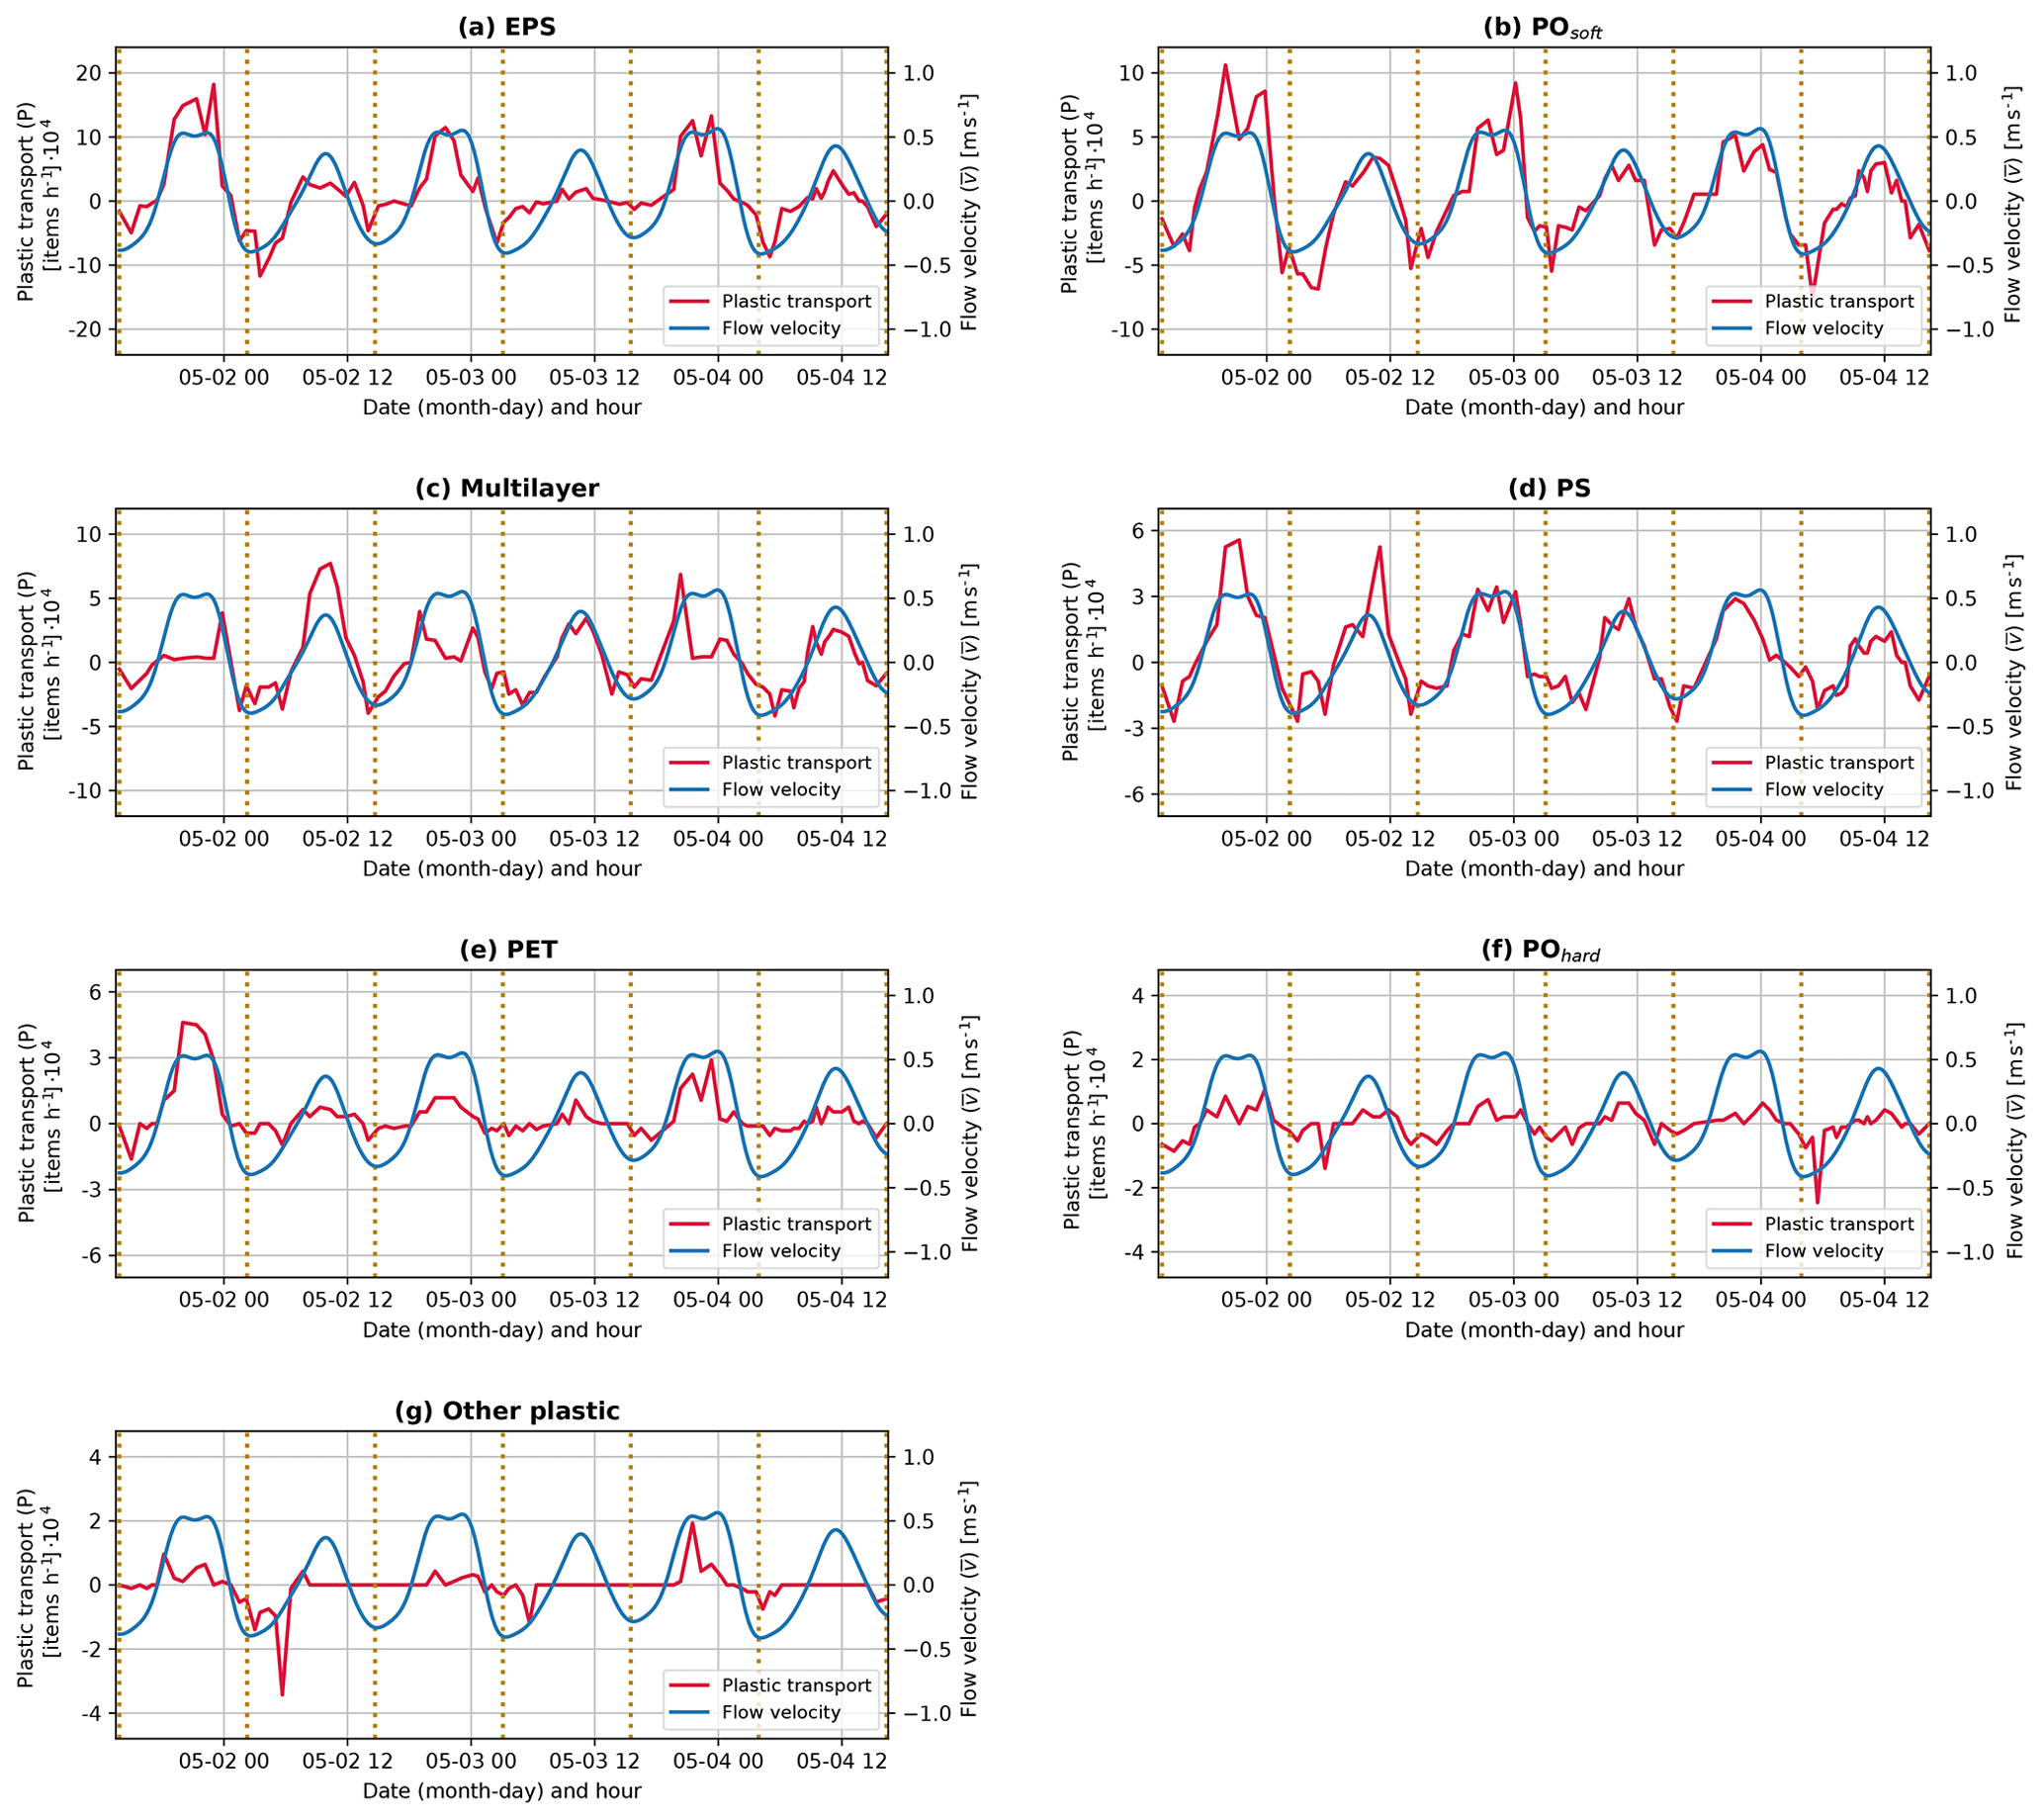
Figure 4Plastic transport by item category and flow velocity over the entire measurement period (a–g). The dotted yellow lines separate each tidal cycle. The y axes differ depending on the subplot for plastic transport to better visualize the value distributions. Items are ranked from the most frequently found on average (EPS) to the least frequently found on average (other plastic).
Table 3Net plastic transport and delivery ratios per item category. The discrepancy in sign for certain values between net transport and delivery ratios is due to the fact that the latter was calculated based on the integral values for ebb and flood phases, whereas net transport resulted from the difference between mean ebb and flood transport rates.
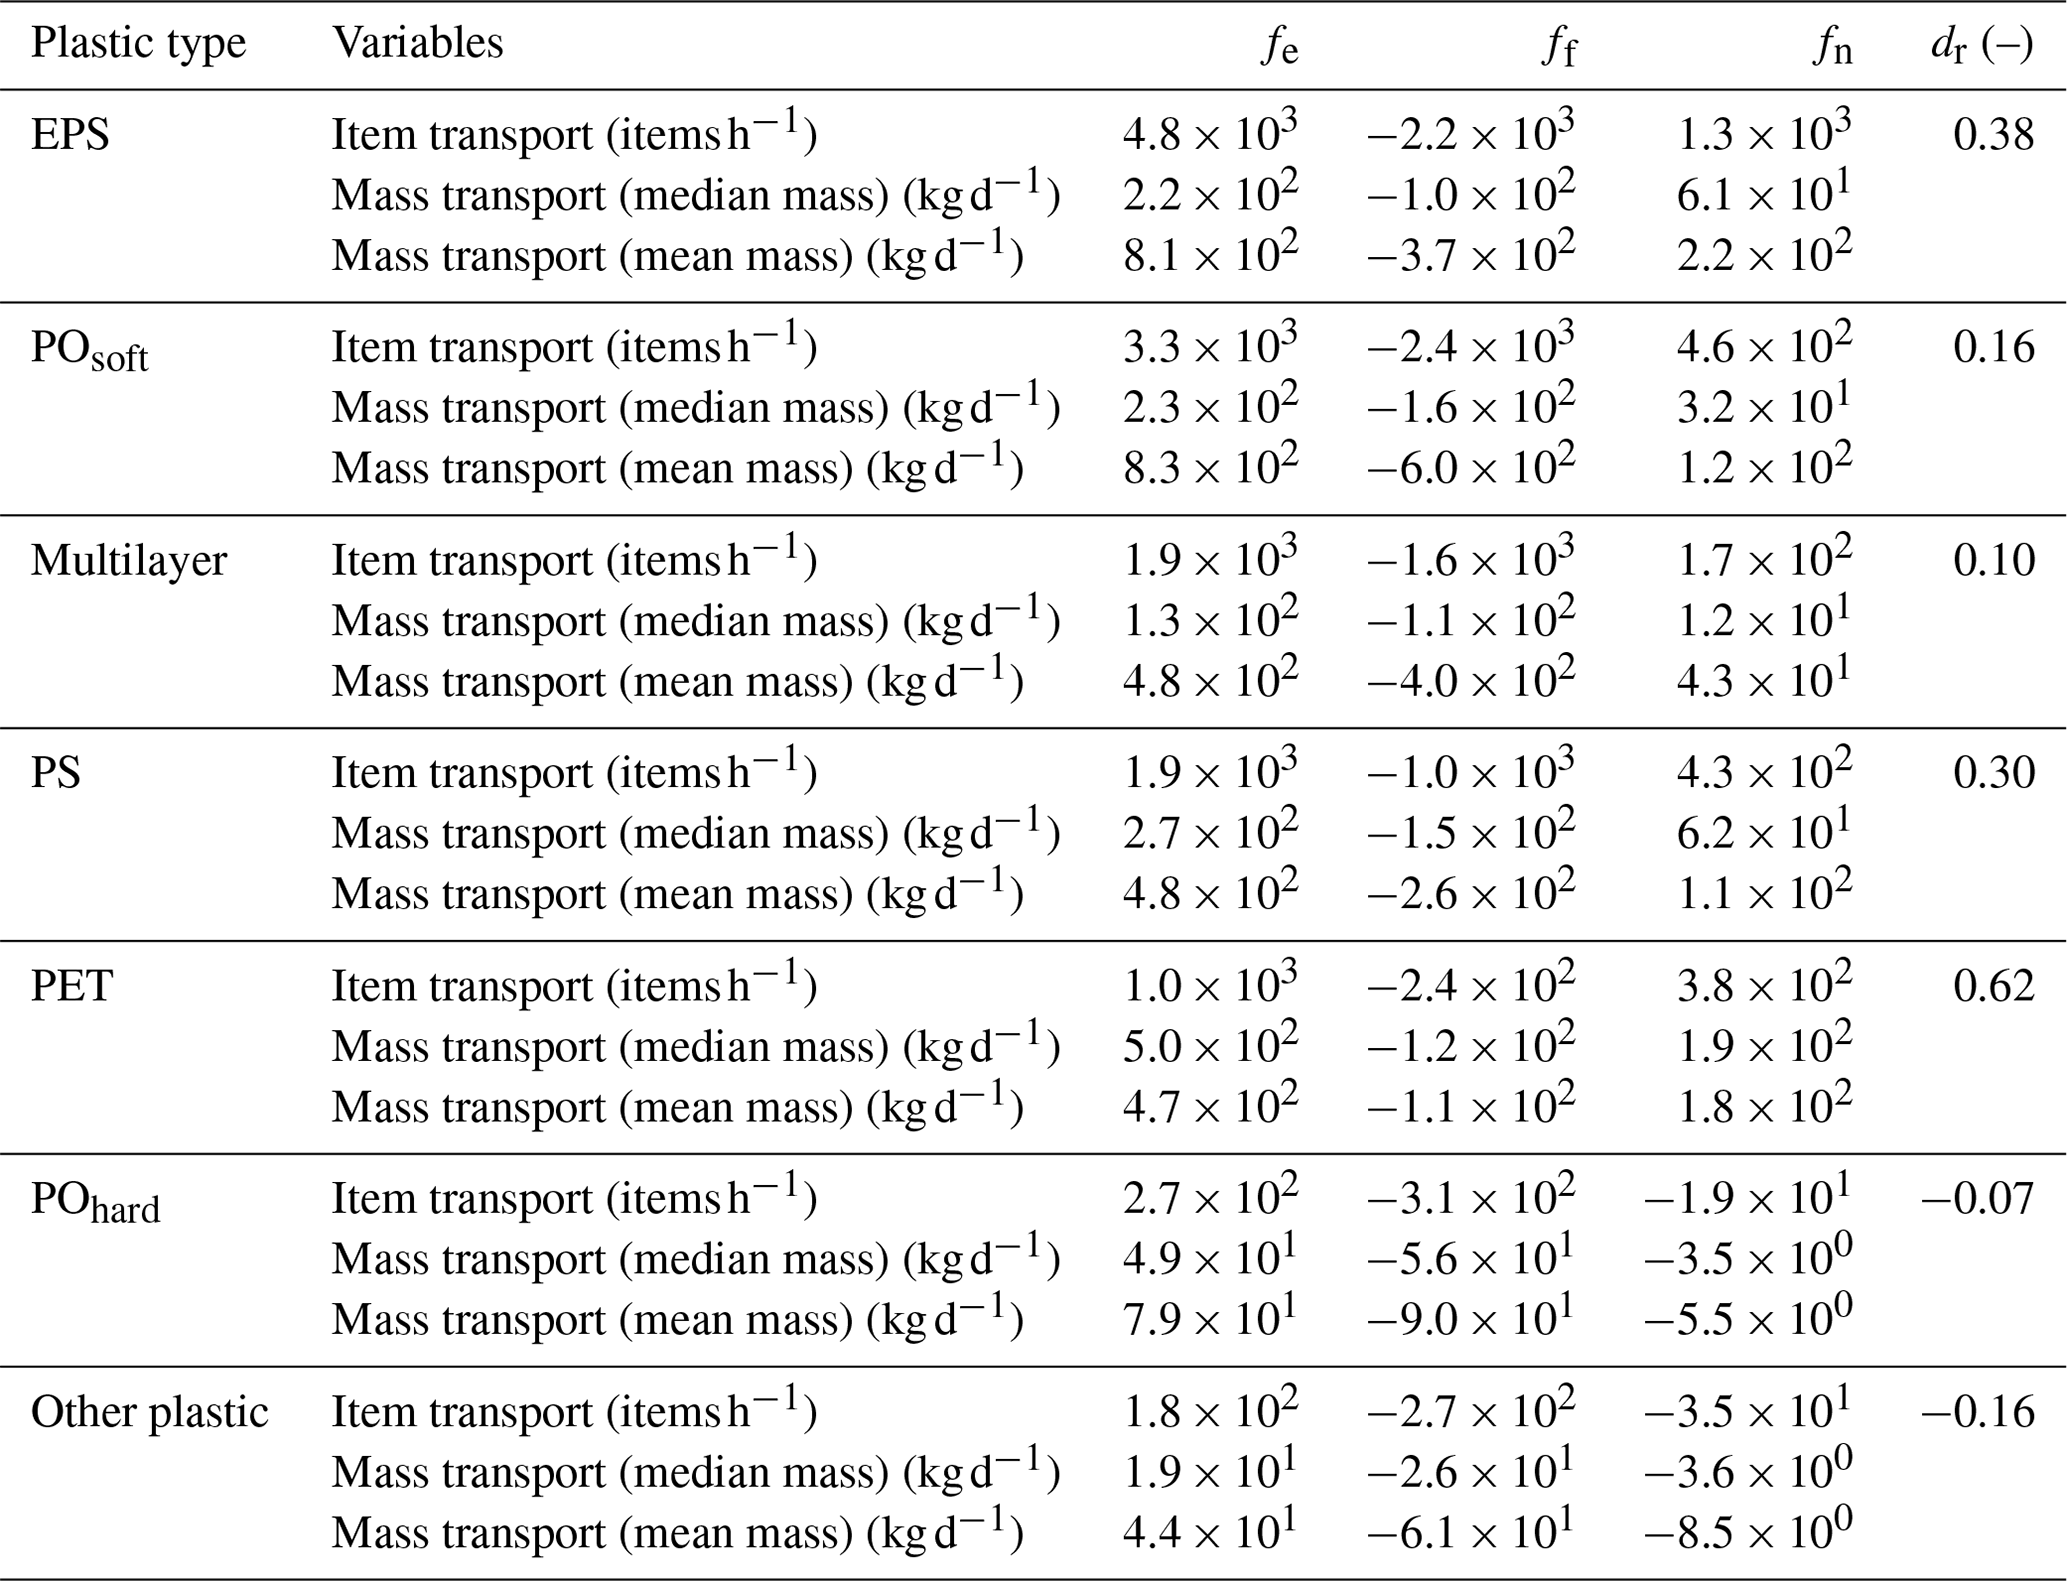
3.3 Net plastic transport varies with plastic type
We determined the transport and delivery ratio per plastic type (Fig. 4). Plastic items differ in their shape, size, buoyancy, and rigidity, characteristics that could influence their transport processes. We found that the amplitude in plastic transport varies significantly depending on both the tidal cycle and the type of items considered. Net transport vary by 2 orders of magnitude depending on the plastic type considered (from 1.3 × 10³ items h−1 for EPS items to −3.5 × 101 items h−1 for other plastic items) (Table 3). We calculated a positive net transport in relation to total transport (dr > 0) for all plastic types, with the exception of POhard and other plastic. These two categories correspond to the least commonly found items (respectively, 3 % and 2 % of the total plastic items). The delivery ratio varied between 62 % and −16 % depending on the plastic type. Large items such as PET (e.g., plastic bottles) and rigid and highly buoyant items such as EPS (e.g., expanded polystyrene such as foam) and PS (polystyrene, such as plates) registered the highest net export (62 %, 38 %, and 30 %, respectively). On the contrary, soft and neutrally buoyant items such as POsoft (e.g., bags and foils) and multilayer (food packaging) had lower delivery ratios (16 % and 10 %, respectively).
Moreover, large fluctuations in plastic transport were noted depending on the tidal cycle. For instance, transport in EPS, POsoft, and PS were particularly high during the first tidal cycle during its ebb phase. Transport of multilayer items was high during the second tidal cycle, similarly to transport of PS items, also during the ebb phase. Our results suggest that the relative contribution of item types is highly variable, with varying concentrations per plastic type at the water surface, probably resulting from varying inputs of plastics into the river.
4.1 Increased plastic travel distance and retention probability in tidal systems
The results of this study demonstrate that tidal dynamics strongly affect plastic transport dynamics. We found that net plastic transport corresponds to less than one-third of the total transport as a result of bi-directional flows and semi-diurnal and diurnal tidal dynamics. In contrast, in non-tidal systems, without bi-directional flows, the net distance traveled by water and floating plastic equals the total traveled distance. In tidal systems, however, the total distance can be much larger for the same net distance due to bi-directional flows. This is in line with previous studies that demonstrated that plastic is transported over longer total distances in estuaries compared to the freshwater reaches of rivers (Tramoy et al., 2020a).
The likelihood of plastic retention within rivers is a function of total travel distance. In tidal systems, the total travel distance per day is higher than that compared to non-tidal systems given the same net transport. Therefore, plastics have a larger probability of retention in tidal systems, for instance through deposition on riverbanks and retention at hydraulic infrastructures. Various observation-based studies have highlighted the high probability of plastic retention within tidal systems (Lotcheris et al., 2023; Ledieu et al., 2022; Tramoy et al., 2020a).
In tidal systems, plastics can be retained over long periods of time, in certain cases surpassing decades, as shown for the Seine River (France) (Tramoy et al., 2020b). Long retention times likely lead to high plastic concentrations if we consider the additional inputs of plastic in and around the river. In the Saigon River, a clear seasonality in net discharge is observed. Peak net discharges (typically exceeding 200 m3 s−1) only occur for a couple of months, usually between June and August (Camenen et al., 2021). Plastic concentrations likely only decrease significantly during these high-discharge periods due to an increase in net plastic transport and export. In this study, we only considered macroplastic (> 0.5 cm), but long macroplastic retention times would likely impact microplastic concentrations as well. Increased plastic breakdown and degradation due to a prolonged presence of macroplastics in the river system probably lead to increased microplastic concentrations as well (Delorme et al., 2010; Lahens et al., 2018).
4.2 Neglecting tidal dynamics leads to overestimating global river plastic emission into the sea
To date, global river plastic transport and emission models do not consider tidal influence, which likely results in an overestimation of global plastic emissions into the oceans. Models that use discharge as a predictor for riverine plastic transport should be considered as export models from the non-tidal part of the river to its tidal zone but not yet into the ocean. We found that plastic transport was strongly correlated to instantaneous discharge, which could then be used to estimate net discharge and net plastic transport. Thus, transport and emission in the tidal zone could be based on measured instantaneous discharge instead of only using freshwater discharge estimates. Using rainfall–runoff models to estimate freshwater discharge rates entirely neglects the tidal influence on net plastic transport and emissions into the ocean. However, such approaches have been used broadly to estimate global plastic emissions (Lebreton et al., 2017; Meijer et al., 2021). Measuring discharge in tidal systems, however, remains very challenging, and, as a result, most gauging stations are located upstream of the tidal region of rivers (Gisen and Savenije, 2015; Nguyen and Nguyen, 2018). Furthermore, considering measured discharge as a more reliable predictor of plastic transport in tidal rivers remains problematic. Establishing a fixed relation between river discharge (and other environmental drivers) and plastic transport is ultimately challenging because it cannot take into account temporal variations in plastic concentrations in the water due to human behaviors (littering and cleaning) (Roebroek et al., 2021a).
By drawing an analogy with sediment rating curves, we can hypothesize that the rating parameters indicating availability and concentrations of plastics probably change more rapidly compared to sediment supply. The timescales governing variability in plastic inputs into the water are likely to be shorter compared to those of sediment loads. In line with this hypothesis, Tasseron et al. (2023) observed large temporal (daily and monthly) fluctuations in plastic transport in urban waterways, a likely result of higher inputs of plastics during peak hours and seasons of outdoor human activity. The inherent difficulties in obtaining discharge estimates for tidal regions worldwide on the one hand and the limitations of using discharge as a reliable predictor of plastic transport on the other hand call for alternative approaches to estimating plastic emissions. Probabilistic methods that introduce a corrective factor for decreasing downstream plastic transport with decreasing distance to the river mouth could improve global transport estimates.
4.3 Short-term plastic transport variability driven by tidal dynamics
Our analysis has shown that plastic transport rates are highly variable over time. This temporal variability in plastic transport rates is two-fold: (i) between peak and semi-diurnal-averaged net transport rates and (ii) between the different semi-diurnal-averaged net transport rates. Peak transport values ranged from −2.1 × 10⁴ to 3.7 × 10⁴ items h−1 over the studied period. As a consequence, field measurements that would be undertaken at the peak of either the flood or ebb flow of the tide or during a slack water phase would likely result in an overestimation or underestimation of net plastic transport. For instance, the highest mean plastic transport found during the ebb and flood phases (2.4 × 10⁴ and −1.1 × 10⁴ items h−1, respectively) are approximately 1 order of magnitude higher than the mean net plastic transport (2.7 × 10³ items h−1) for the entire measurement period. Similarly, studies on sediment transport in tidal rivers found that instantaneous peak transport values are at least 1 order of magnitude higher than the net (residual) sediment transport (Gatto et al., 2017). The large discrepancy between instantaneous and net plastic transport highlights the need to estimate transport rates based on longer observation periods than usually done in riverine transport studies. For example, González-Fernández et al. (2021) quantified plastic transport over 42 rivers, including 5 influenced by tides. Similarly, van Emmerik et al. (2022a) estimated plastic transport in Dutch rivers, encompassing 26 locations, 7 of which were influenced by tides. In both studies, data collection was limited to the ebb phase, which may have led to potential overestimations of plastic transport. Furthermore, we have shown that net estimates of plastic transport vary greatly depending on whether measurements are conducted during ebb- or flood-dominated cycles, resulting in either positive (seaward) or negative (landward) net plastic transport, and values vary by a factor of nearly −4 between the highest and lowest net transport per cycle. Overall, the high variability between peak- and cycle-averaged net plastic transport, coupled with the variability within net plastic transport per tidal cycle, highlights both the uncertainty in quantifying net plastic transport and the dependency on the temporal scale considered.
This study was the first to quantify plastic transport during full tidal cycles using a Eulerian approach. We only considered short-term tidal dynamics, namely the alternation between flood and ebb tidal phases and the diurnal cycles. Longer-term patterns, such as the cycle in neap and spring tides, the seasonality in net discharge, or peaks in freshwater discharge could all influence flow dynamics and thus significantly alter plastic transport processes. Fernandino et al. (2016), for instance, observed higher floating-litter densities during the spring ebb tides. This suggests that co-occurrences in hydrological conditions are also of interest when trying to understand long-term plastic transport dynamics in tidal rivers. Additional measurements of plastic transport throughout full tidal cycles of varying tidal and hydrological conditions are therefore needed for this. We therefore suggest repeating similar observations during specific conditions, such as spring or neap and high discharge or storm surge conditions. Such measurements would enable researchers to widen the range of tidal and hydrological conditions investigated in relation to plastic transport.
4.4 Delivery ratio of plastic is higher than water
We found that, in relative terms, plastic net transport is higher when compared with net discharge rates (dr of 16 % for water flow and 20 %–33 % for all plastic items). Two main explanations can be hypothesized for this difference in delivery ratios. The first postulates that fundamental differences exist between plastic and water transport processes. Factors not directly accounted for in this study, such as wind and different flow mobilization thresholds, could impact differently water and plastics and ultimately result in significantly higher delivery ratios for plastic compared to water. The second hypothesis relates to the site-specific dynamics. High temporary entrapment rates of plastics downstream of the measurement site could lead to lower landward transport rates compared to water because a significant portion of items become temporarily stuck.
Hydraulic and mechanical factors, such as different motion thresholds, the influence of wind and lateral flows, and sinking or resuspension mechanisms along the water columns might explain the higher delivery ratios of plastic compared to water. Our analysis has shown that, during the flood phase of the tide, fewer plastic items were transported in the landward direction compared to water. This is somewhat surprising given that the flood phase of the tidal cycle generally corresponds to rising water levels, which could potentially mobilize items that were deposited during falling water levels (ebb phase). However, the lower flow velocities measured during the flood phase compared to the ebb phase of the tidal cycle (−0.2 vs. 0.3 m s−1) could explain why a lower share of plastic items reach their critical threshold of motion in contrast to water. This could be particularly relevant considering that, in most rivers, including the Saigon River, plastic items are often temporarily trapped in floating vegetation, on the banks, or within fluvial structures (Ledieu et al., 2022; Schreyers et al., 2021; van Emmerik et al., 2022b). Quantification of mobilization thresholds of plastics in various trapping conditions is required to further investigate this mechanism.
Besides flow velocity and discharge, other factors could influence the velocity of plastics, such as wind, waves, and lateral flows (Laxague et al., 2017; van der Mheen et al., 2020). These factors could generate accelerating or decelerating effects in the propagation of plastic in the river. In addition, our study only measured floating plastic transport, and, therefore, the influence of tidal dynamics on sub-surface plastic and the transfer of plastics between the surface and the deeper layers (sinking and re-suspension) were ignored. This is mainly due to the lack of measurement methods that are easy to deploy to quantify the distribution of plastic throughout the water column in rivers at a high temporal frequency. Tidal dynamics could also affect the vertical distribution of plastic items due to variations in water depths and vertical mixing of fresh and salt water (Vermeiren et al., 2016). Ultimately, sinking and re-suspension mechanisms could also contribute to the higher downstream transport rate found for plastic in comparison to water. Finally, changes in the lateral distribution of floating plastics between the ebb and flood phases could potentially lead to higher net transport rates of plastics downstream compared to water. Specifically, if plastics are hypothesized to be more concentrated mid-stream during the ebb phase and more widely dispersed over the river width during the flood phase, this could increase the likelihood of entrapment along the riverbanks during upstream transport. This could contribute to higher net plastic transport in the downstream direction. However, this specific scenario was not supported by our findings (Schreyers et al., 2023a).
Another hypothesis pertains to the local characteristics of our case study area. High rates of plastic entrapment or deposition downstream of the measurement site compared to upstream could explain the relative lower landward transport rates compared to water. High concentrations of items were often found downstream of the measurement site due to the presence of docks, piers, and jetties, which temporarily trap items (Lotcheris et al., 2023). Similar trapping elements were not found directly upstream of the measurement site. Other factors such as the vegetation, wood jams, and meandering might also influence plastic accumulation rates on riverbanks, as already evidenced by recent research (Ledieu et al., 2022; Liro et al., 2020). The two hypotheses presented for higher delivery ratios of plastics compared to water could be tested using Lagrangian approaches in combination with high-frequency hydrometeorological measurements throughout tidal cycles. Lagrangian studies on plastic transport could provide insights into the (re)mobilization and entrapment thresholds in relation to flow and other hydrometeorological factors such as wind. To the best of our knowledge, no Lagrangian-based approaches have so far quantified thresholds for the mobilization and stopping of mobile plastics. In addition, Lagrangian approaches are also useful in mapping entrapment and/or accumulation zones along a river course (Ledieu et al., 2022).
4.5 Plastic transport processes are affected by the geometry, size, and buoyancy of items
Our results show that different plastic categories have highly variable net transport rates, depending on item type characteristics such as size, rigidity, and buoyancy. Large and highly buoyant plastics were found to have higher downstream net transport rates than smaller and more neutrally buoyant items. PET items (mainly bottles) were the largest category of plastics by size (average size: 20 vs. 11 cm for all item categories) and had the highest delivery ratio found (62 %). Highly buoyant items such as EPS and PS items (food containers, isolation foam, cups, and plates), with densities between 0.016 and 0.640 g cm−3 for EPS and between 1.01 and 1.04 g cm−3 for PS (van Emmerik and Schwarz, 2020), were found to have high downstream net transport rates (38 % and 30 %, respectively). Such items are also more prone to wind influence (Jackson, 1998; Schwarz et al., 2019). This could cause both deposition effects on the sides of the river or on the riverbanks and longer travel distances over the same duration compared to other items, depending on the wind direction and magnitude. Ryan (2021); López et al. (2020) found that highly buoyant plastics travel longer distances between the coast and the marine environment. In addition, because of their high buoyancy, these items do not sink easily in the water column (Schwarz et al., 2019). All these factors could explain the higher net export ratios found for highly buoyant plastics. In comparison, more neutrally buoyant and soft items such as POsoft (bags and foils) and multilayer items (food wrapping) (van Emmerik et al., 2019) had lower net transport rates than average (between 10 % and 16 % vs. 25 % for all plastics). Because of their lower buoyancy, such items are more prone to vertical mixing and the influence of changes in turbulence and density fronts, such as salt concentrations (Acha et al., 2003; Ballent et al., 2012). This is particularly relevant for tidal rivers and estuaries due to changes in the relative balance between fresh and salt water and higher turbulence resulting from the changes in density distribution compared to the freshwater reaches of a river.
These findings confirm that, similarly to sediment, plastic transport processes should be studied in relation to item characteristics instead of considering plastics as a single uniform type of material (Kooi et al., 2018; Schwarz et al., 2019). The wide range of sizes, geometry, densities, buoyancies, and masses of plastic strongly impacts their transport dynamics (both vertically and horizontally), as already pointed out by several studies (Ryan, 2021; Waldschläger and Schüttrumpf, 2019; Kuizenga et al., 2021). Comparably, sediment grain size distribution and density strongly influence settling and advection velocities of particles in the water. Recent sediment transport models that incorporated a broader distribution range of grain sizes and densities led to improved estimates of suspended sediment loads compared to models which used more uniform distributions (Lepesqueur et al., 2019).
For the first time, we quantified net plastic transport over full tidal cycles in a tidal river using a Eulerian approach. Over this time period, we conducted sub-hourly measurements of flow velocity, water depth, and plastic transport. Time series of flow velocity and discharge estimates were extrapolated by fitting the tidal constituents of our observations, for which we found that the semi-diurnal and diurnal components were the most significant. We introduced a simple Eulerian approach, which expresses net transport by establishing a balance between the flood (landward) and ebb (seaward) water flows and plastic transport. This approach could easily be transferred to other river systems as it requires limited and affordable equipment.
Four main findings on plastic transport in tidal regions are highlighted from our study. First, net plastic transport is lower compared to total transport due to estuarine dynamics. In our case study, we found that net transport amounted to only 20 %–33 % of the total plastic transport. This likely leads to longer travel distances of plastics in tidal systems compared to non-tidal ones, facilitating plastic retention along the river course. Secondly, estimates of river plastic transport show high short-term variability due to tidal dynamics. Diurnal inequality in the tides causes an alternation between cycles with positive net transport (seaward plastic transport) and cycles with negative net transport (i.e., landward plastic transport). We also found that peak and semi-diurnal averaged net transport rates varied by as much as 1 order of magnitude. Thirdly, net plastic transport shows higher net downstream transport compared to water. We found that net water discharge amounted to 16 % of the total river discharge, whereas net plastic transport corresponds to 20 %–33 % of the total plastic transport. This suggests that either plastic travels longer distances than water, possibly due to the influence of other environmental drivers such as wind, or that plastics are often trapped downstream from the measurement site, limiting their transport upstream during the flood tidal phase. Lastly, plastics are not uniformly affected by tidal dynamics. Larger and highly buoyant items, such as plastic foams and polystyrene have larger net transport ratios compared to neutrally buoyant and more flexible items, such as bags, foils, and food packaging.
In this paper, we show that tidal dynamics play a crucial role in total and net plastic transport in tidal rivers. Bi-directional flows resulting from the semi-diurnal tidal component lead to a large discrepancy between net and total plastic transport rates. With each river that flows into the ocean being affected by tidal dynamics, such effects cannot be neglected anymore in studies that quantify (global) plastic emissions into the ocean. Efforts to both conceptualize and integrate tidal dynamics in river plastic transport and emissions models are therefore required.
We found M2 (principal lunar semi-diurnal) and K1 (lunar diurnal) to be the dominating tidal constituents over our flow velocity time series (Table B1). However, the distortions of the sinusoidal symmetry (Fig. 3) could be attributed to shallow-water override components (M4 and M6), which were also found to be significant, and/or the interactions between the M2 and K1 components (Hoitink et al., 2003; Gatto et al., 2017).
Table B1Tidal constituent coefficients (amplitude and frequency) and signal-to-noise ratio.
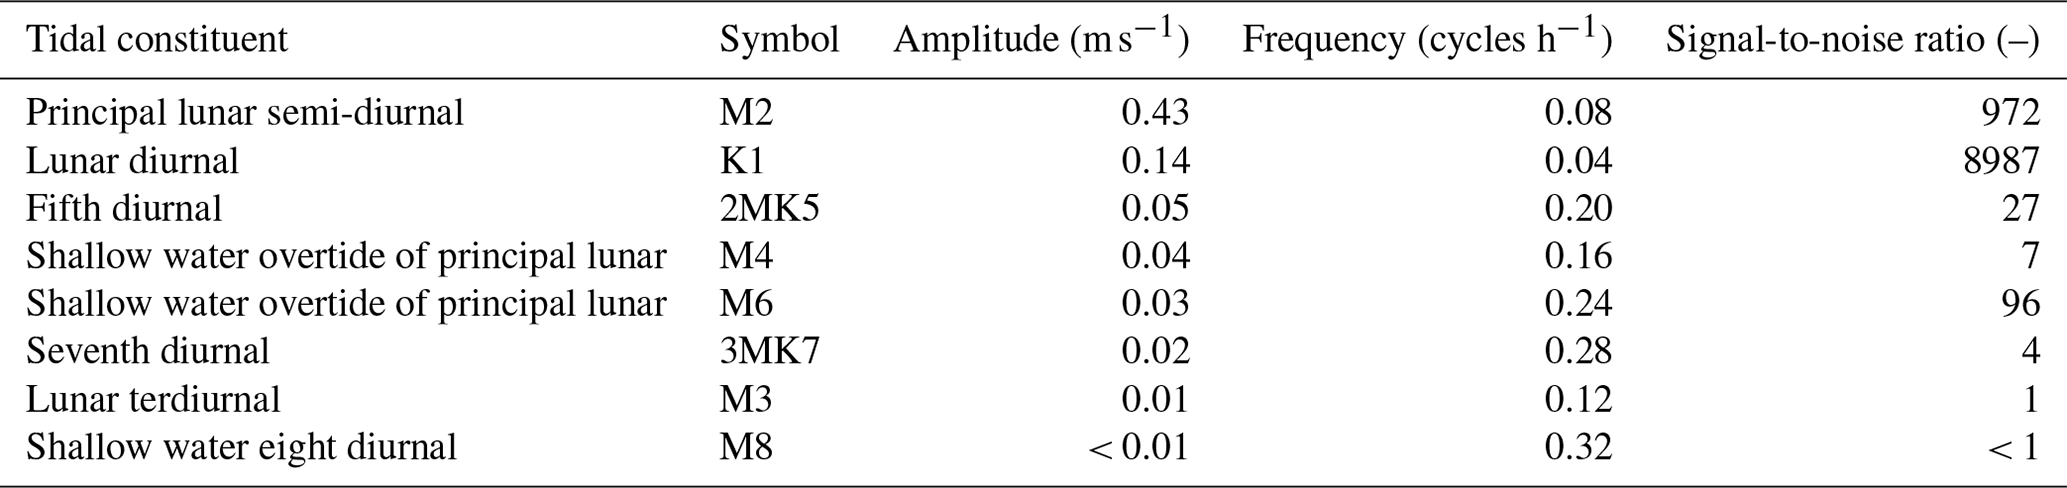
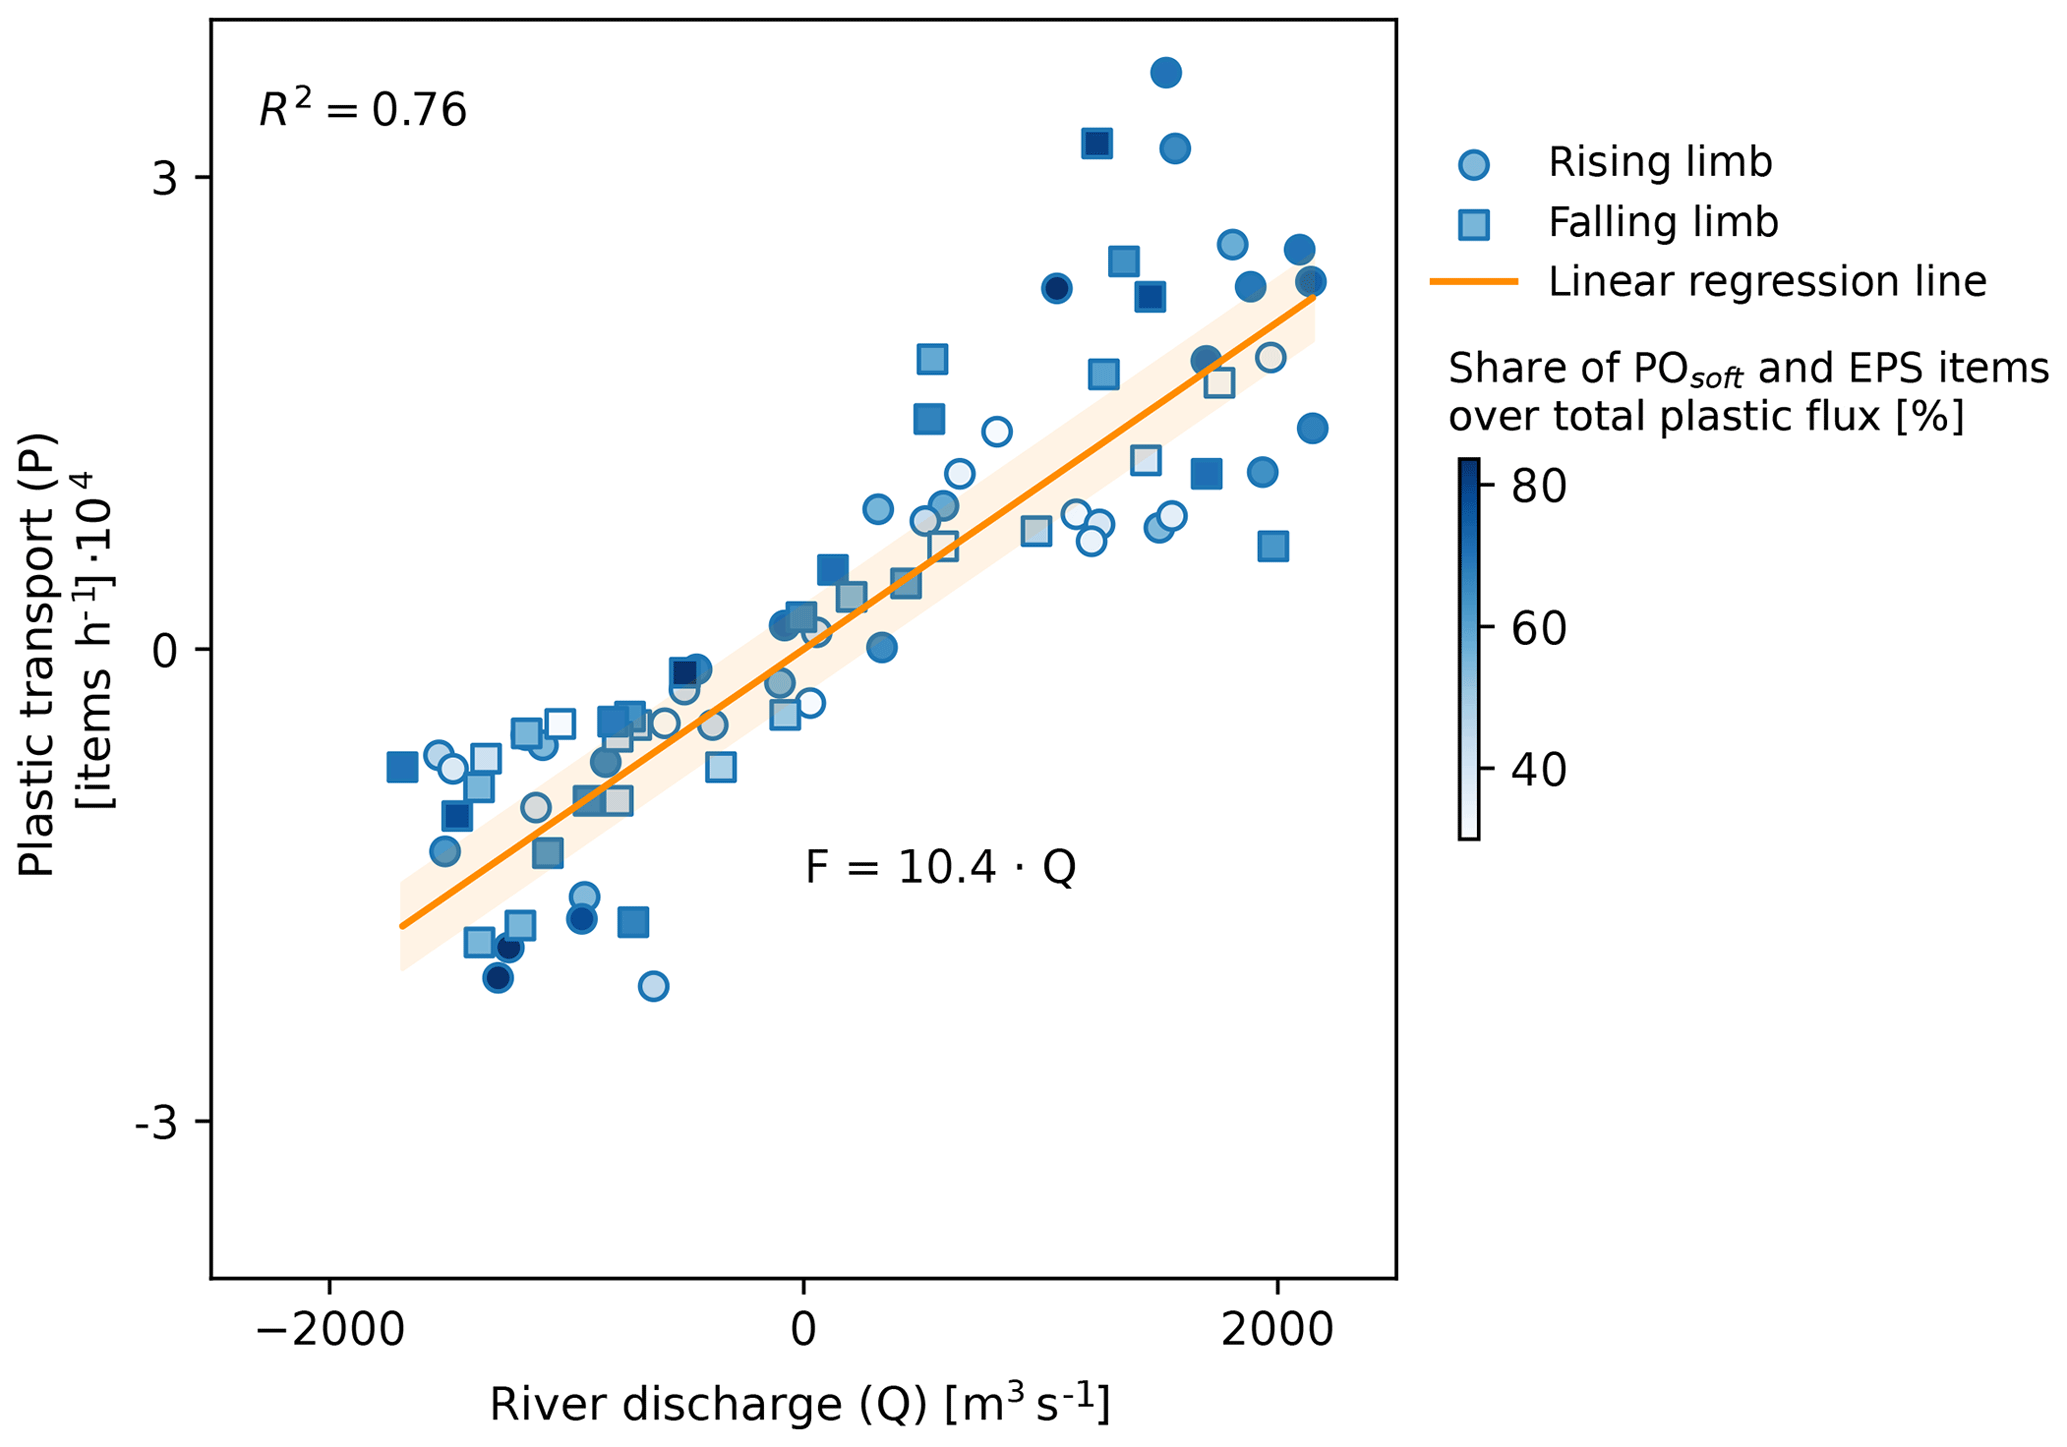
Figure C1Relationship between plastic transport and river discharge (p value < 0.01). The light orange area shows 95 % confidence interval.
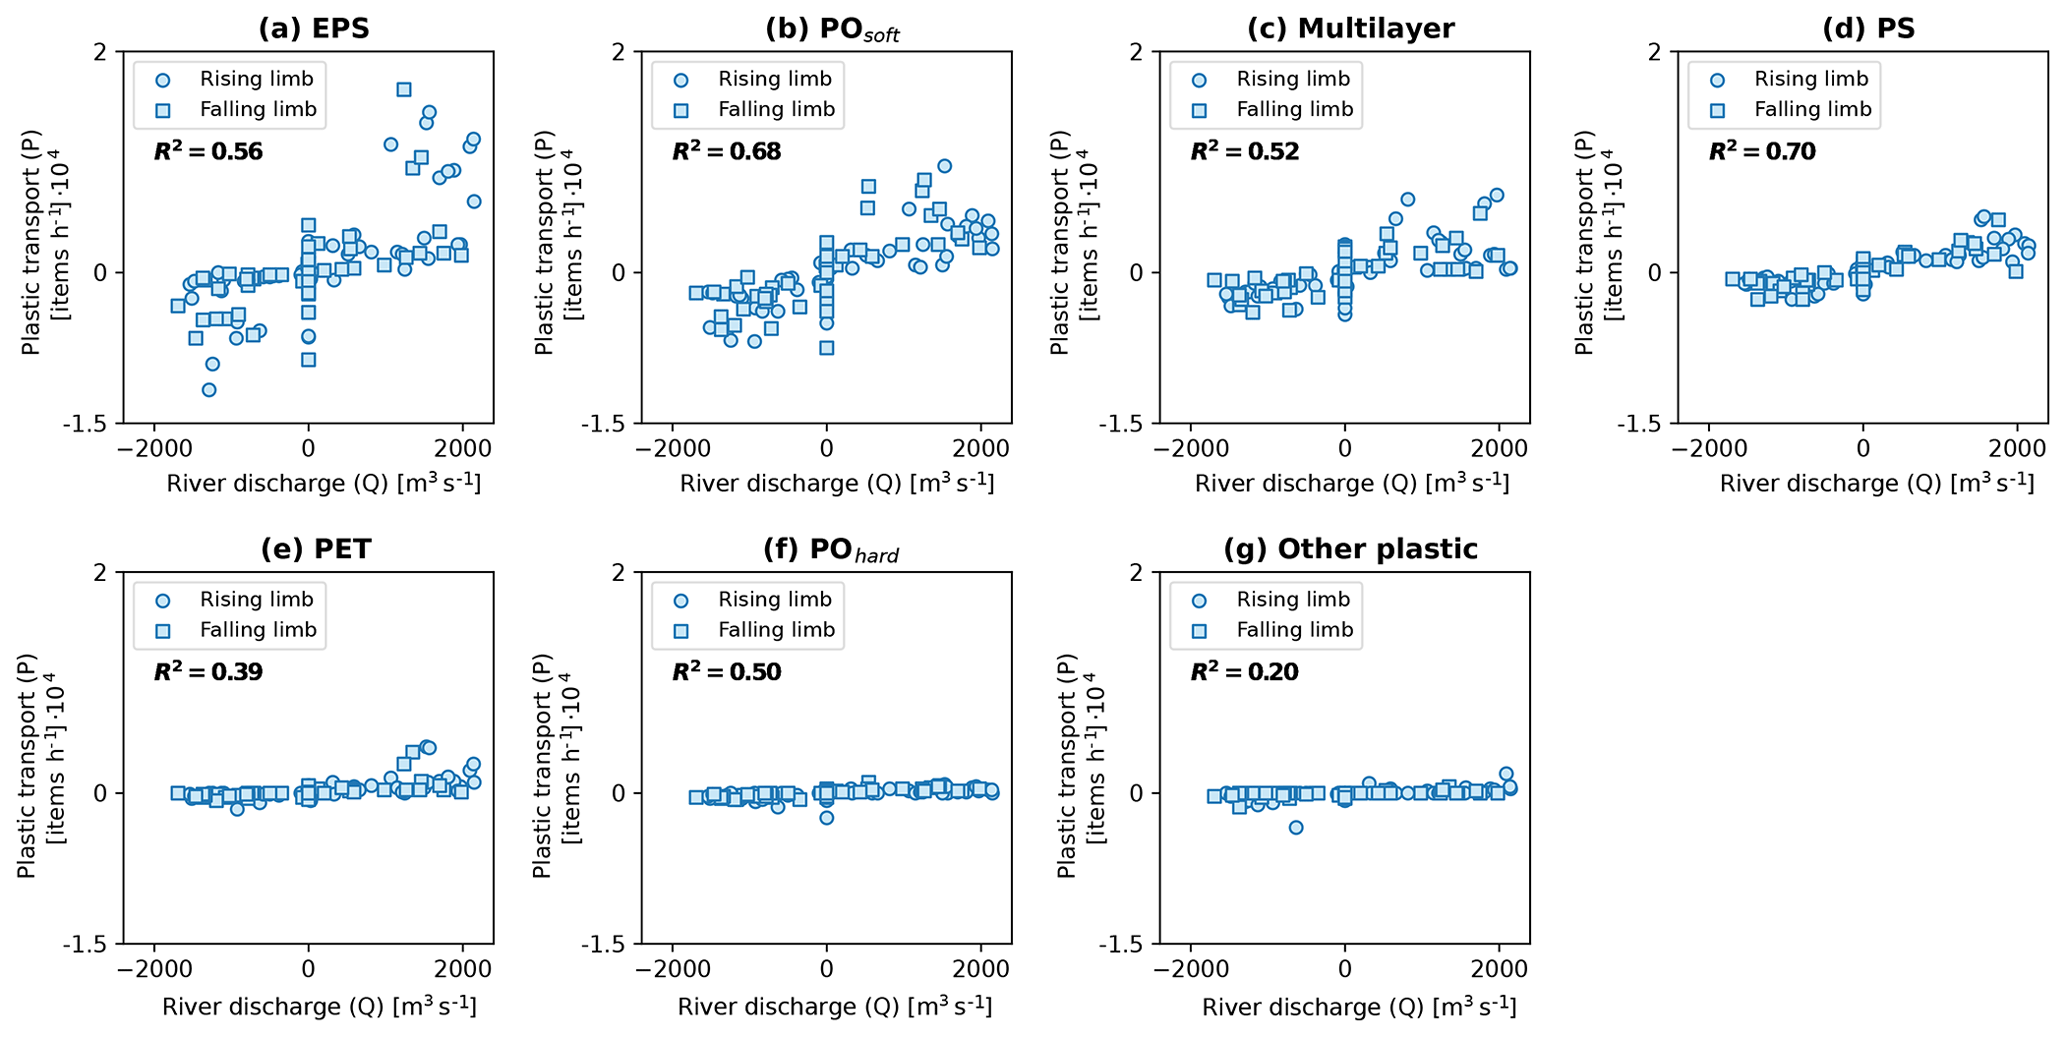
Figure C2Relationship between plastic transport and river discharge by plastic types (a–g). All p values were found to be below < 0.01.
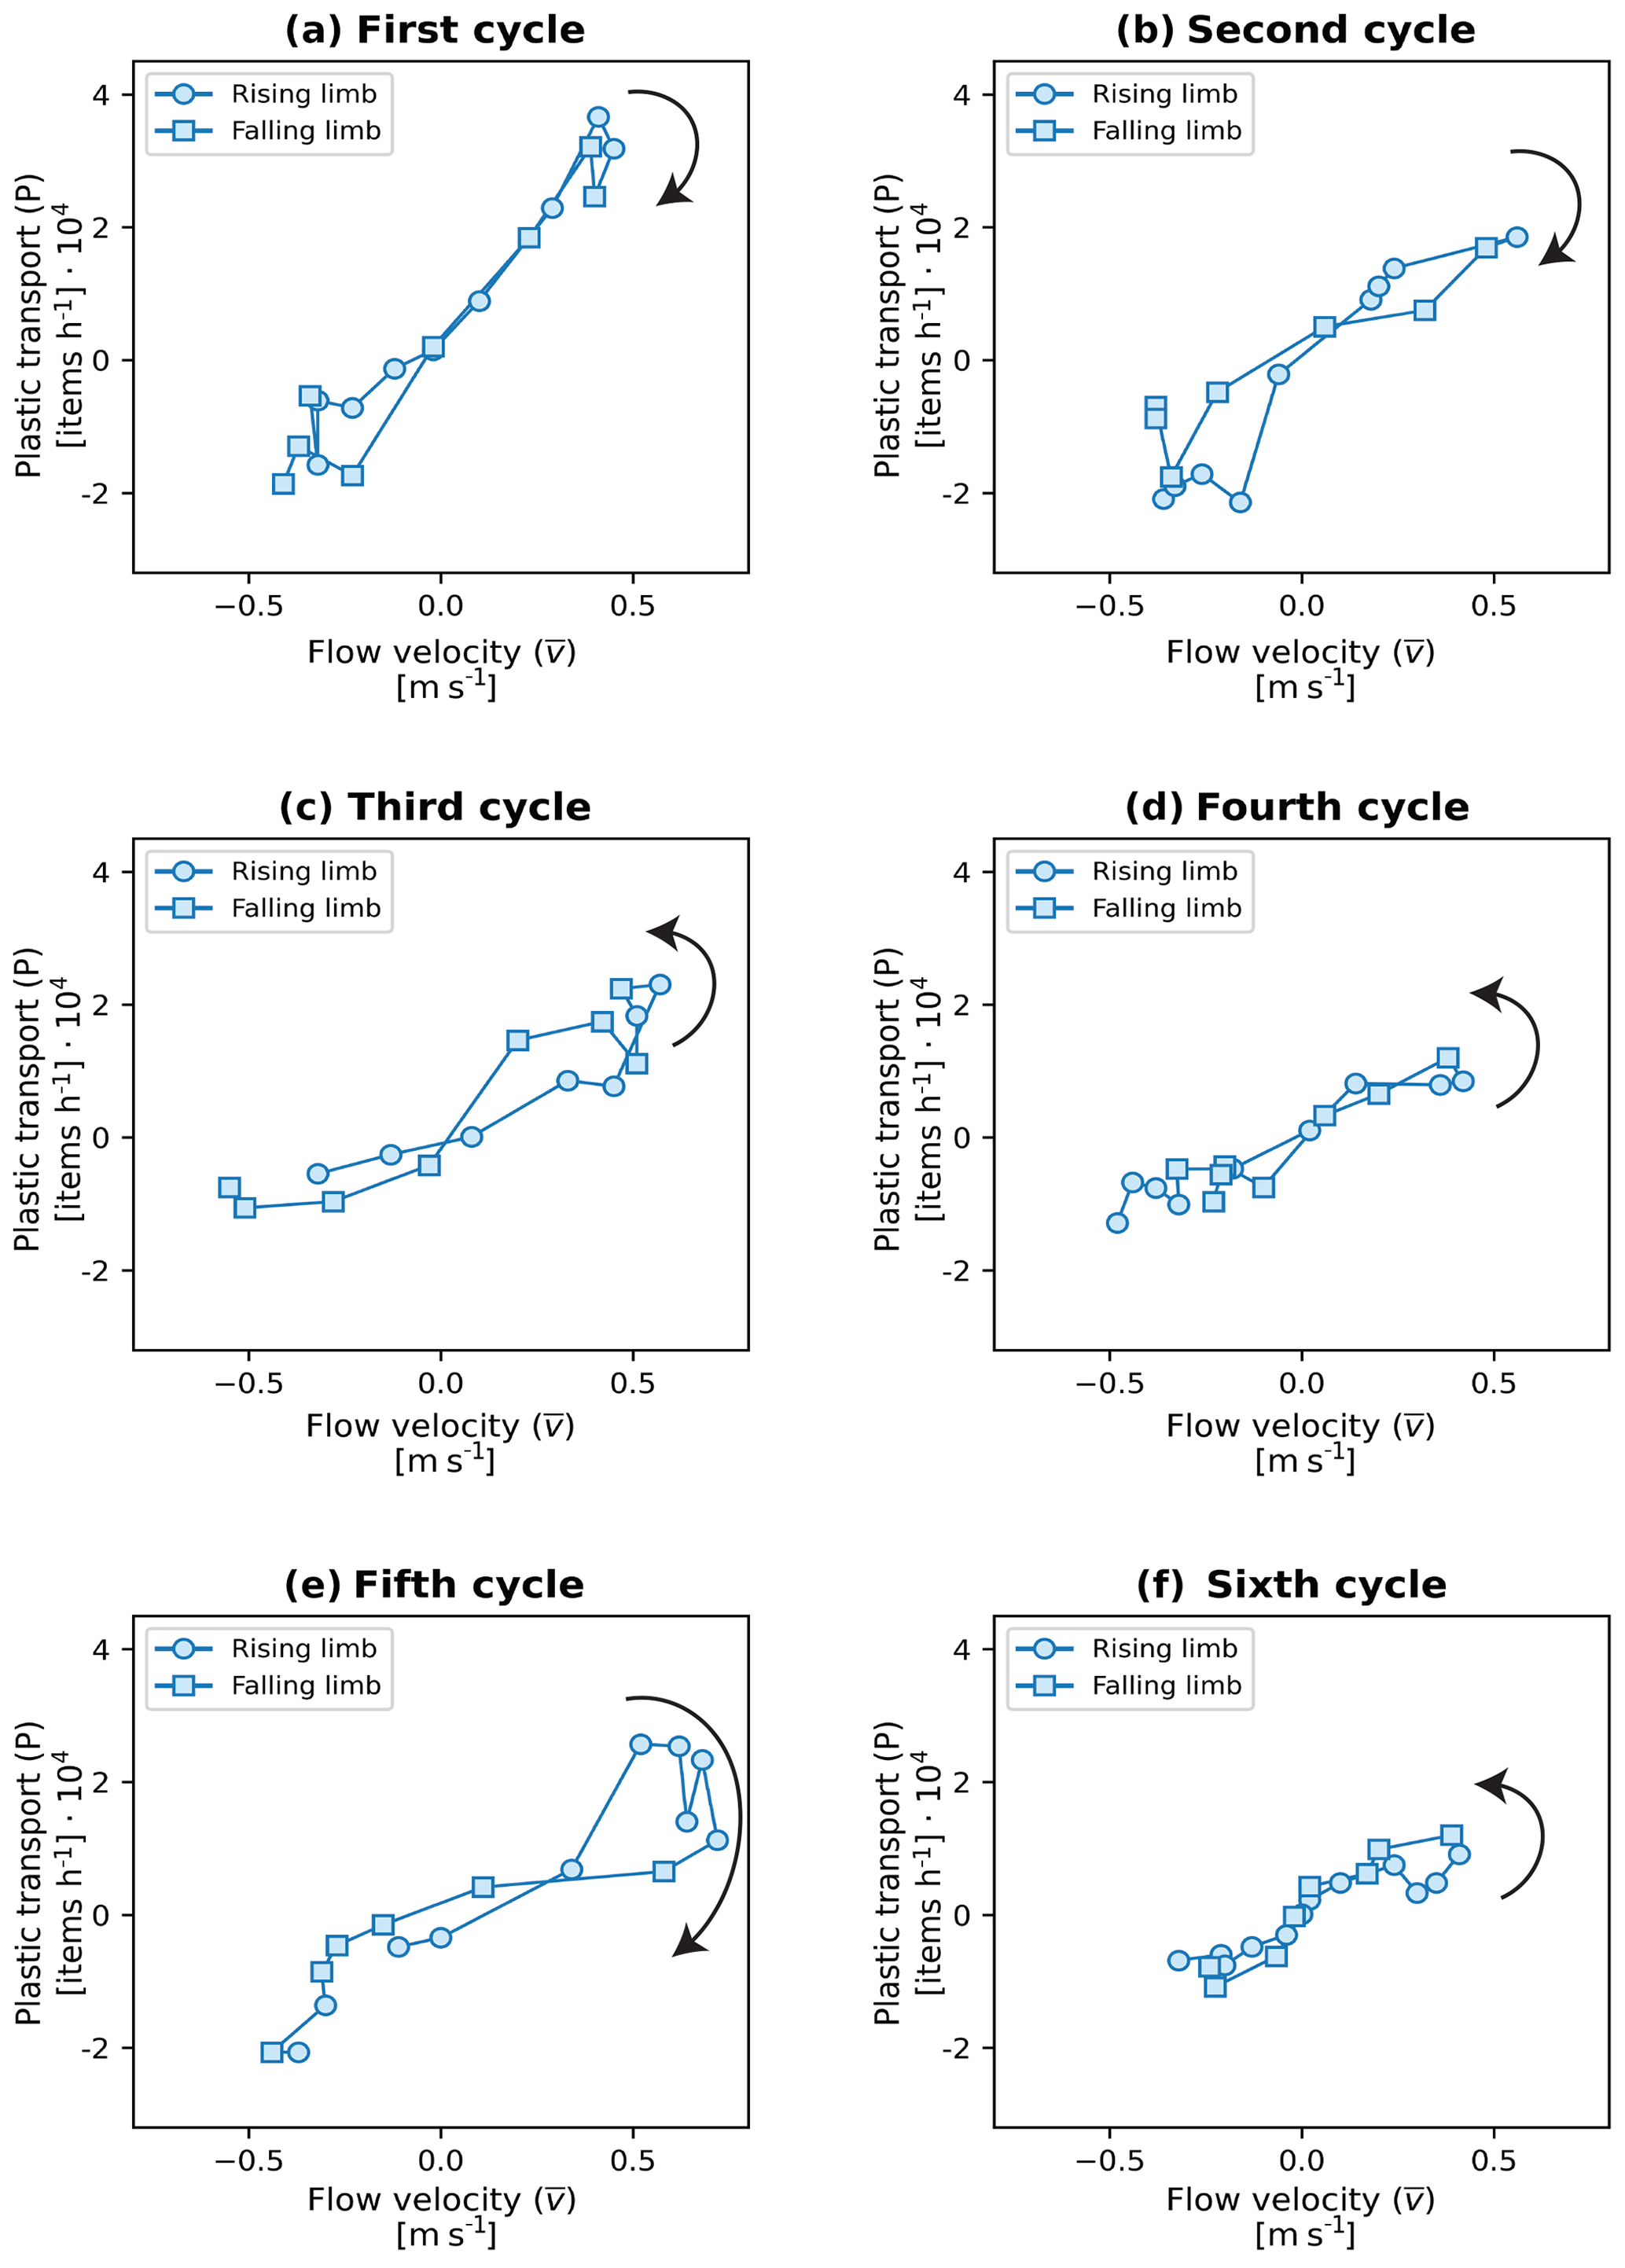
Figure C3Relationship between plastic transport and flow velocity per tidal cycle (a–f). The arrows indicate the direction of the hysteresis (clockwise or counterclockwise) between rising and falling limbs of the tidal cycle.
Alternative calculation methods to estimate delivery ratios
We propose two alternative methods for calculating delivery ratios (dr). In Eq. (6), the denominator corresponds to the total transported amounts, volumes, or distances (Vt) for the variable f considered. A potential issue with using Vt as our denominator in Eq. (6) could be that Ve and Vf can be seen as not being independent of each other because part of Ve is likely to be circulated in Vf and vice versa. To address this, we introduce an alternative delivery ratio, dr,2:
Here, we consider the mean transported amounts, volumes, or distances as the denominator. However, the delivery ratios can exceed unity for plastics (see Table D2). We aimed to constrain the delivery values between −1 and 1 to ease the interpretation, with a value of zero indicating no net transport over the tidal cycle and a value of 1 or −1 indicating that the total volume of plastic has been transported downstream or upstream, respectively. We therefore suggest the following equation as another alternative to calculate delivery ratio dr,3:
By taking the maximum value between the plastic volume during ebb and the absolute amounts, volumes, or distances during flood, we constrain our delivery values to be between −1 and 1 because the denominator cannot be smaller than the numerator in such a case.
We report results based on dr,1, dr,2, and dr,3 in Tables D1 and D2. Regardless of the selected delivery ratio calculation method, our main conclusions are supported. Plastic delivery is higher than that of water for all dr,1, dr,2, and dr,3 values (Tables D1 and D2). Ebb-dominated cycles have positive delivery values (net downstream transport), whereas flood-dominated cycles are characterized by negative delivery values (net upstream transport) (Table D2). Our finding that net plastic transport is limited by tidal dynamics remains correct as delivery values over the entire monitored period were all found to be below unity (Table D1). The extent of the reduction in transport is, however, variable depending on the calculation method chosen. As we want to constrain delivery values to be between +1/−1 and 0, we consider dr,2 not to be a suitable option. We reported dr,1 values in the main text.
Table D1Summary of plastic transport, flow velocity, discharge, and associated metrics during ebb and flood phases; dr,1, dr,2, and dr,3 correspond to the three calculation methods for the delivery ratio, as presented in Appendix D. In the main text, we only report dr,1 for brevity.
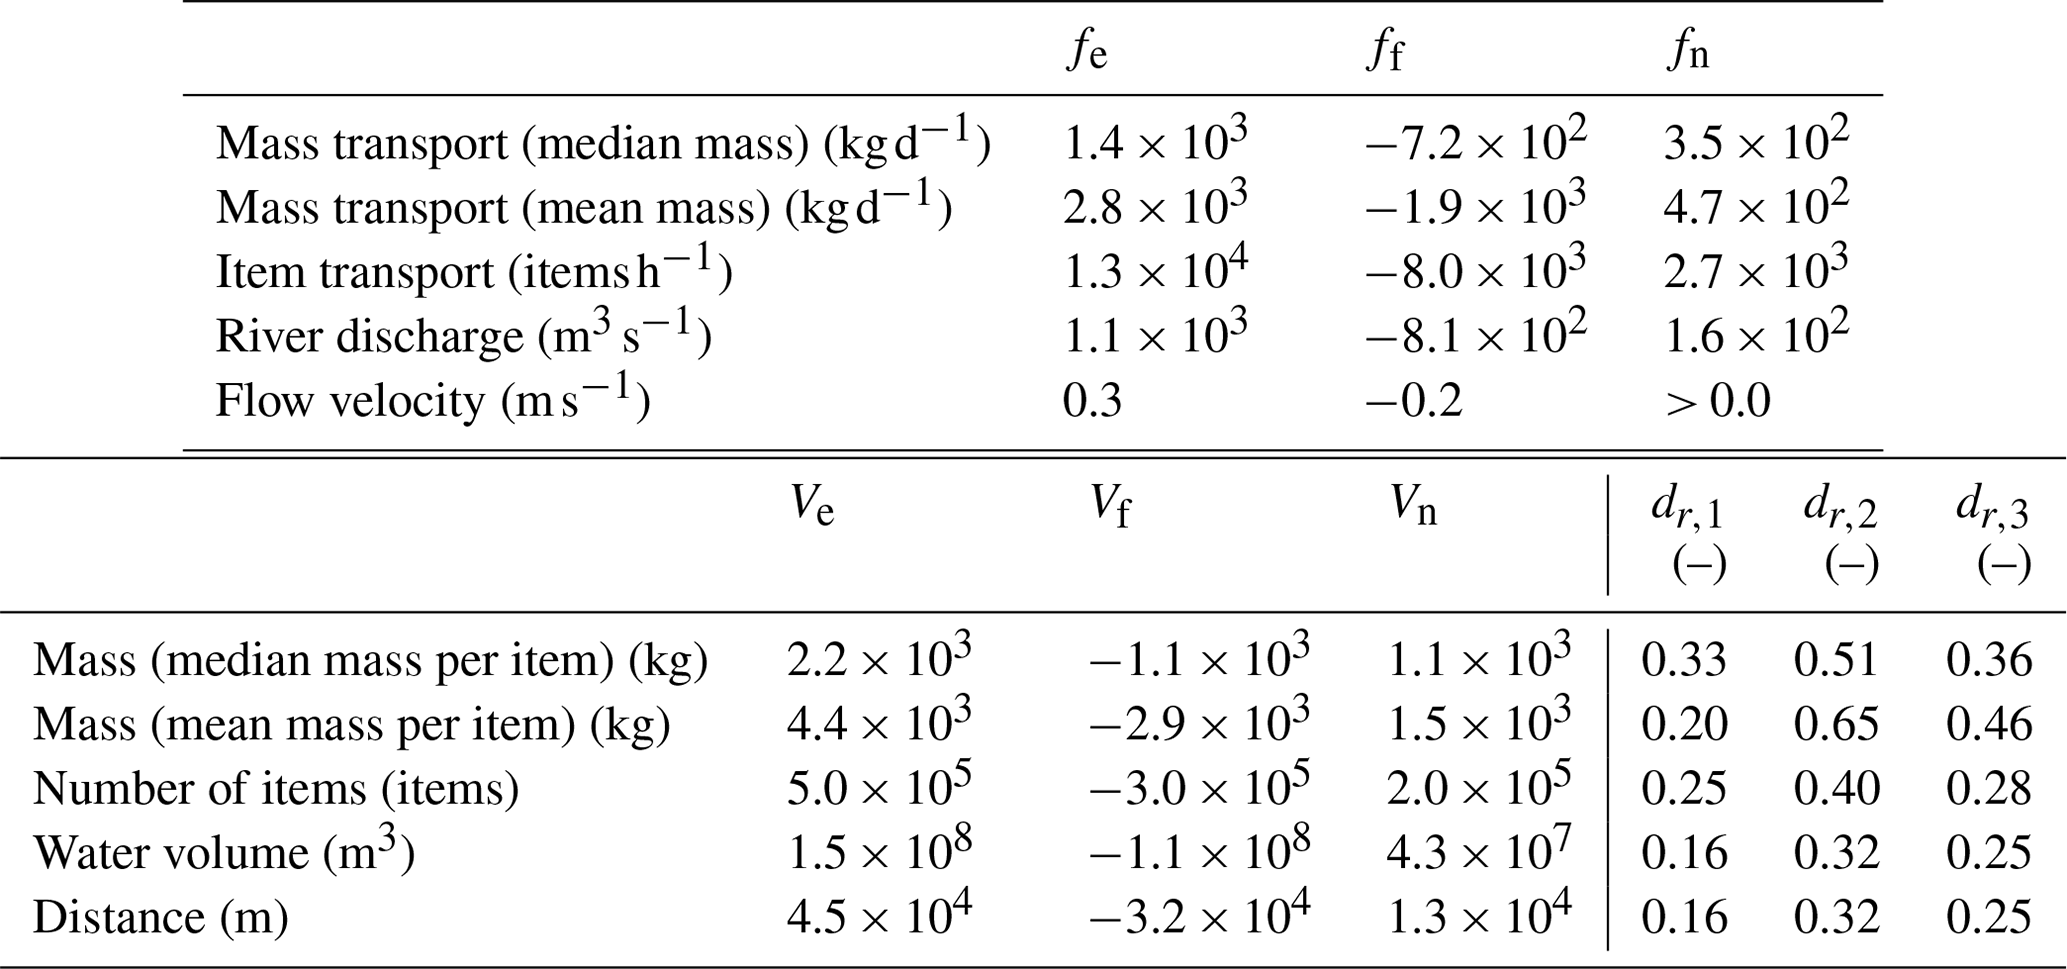
Table D2Plastic transport, flow velocity, discharge, and associated metrics during ebb and flood phases per tidal cycle; dr,1, dr,2, and dr,3 correspond to the three calculation methods for the delivery ratio, as presented in Appendix D. In the main text, we only report dr,1 for brevity.
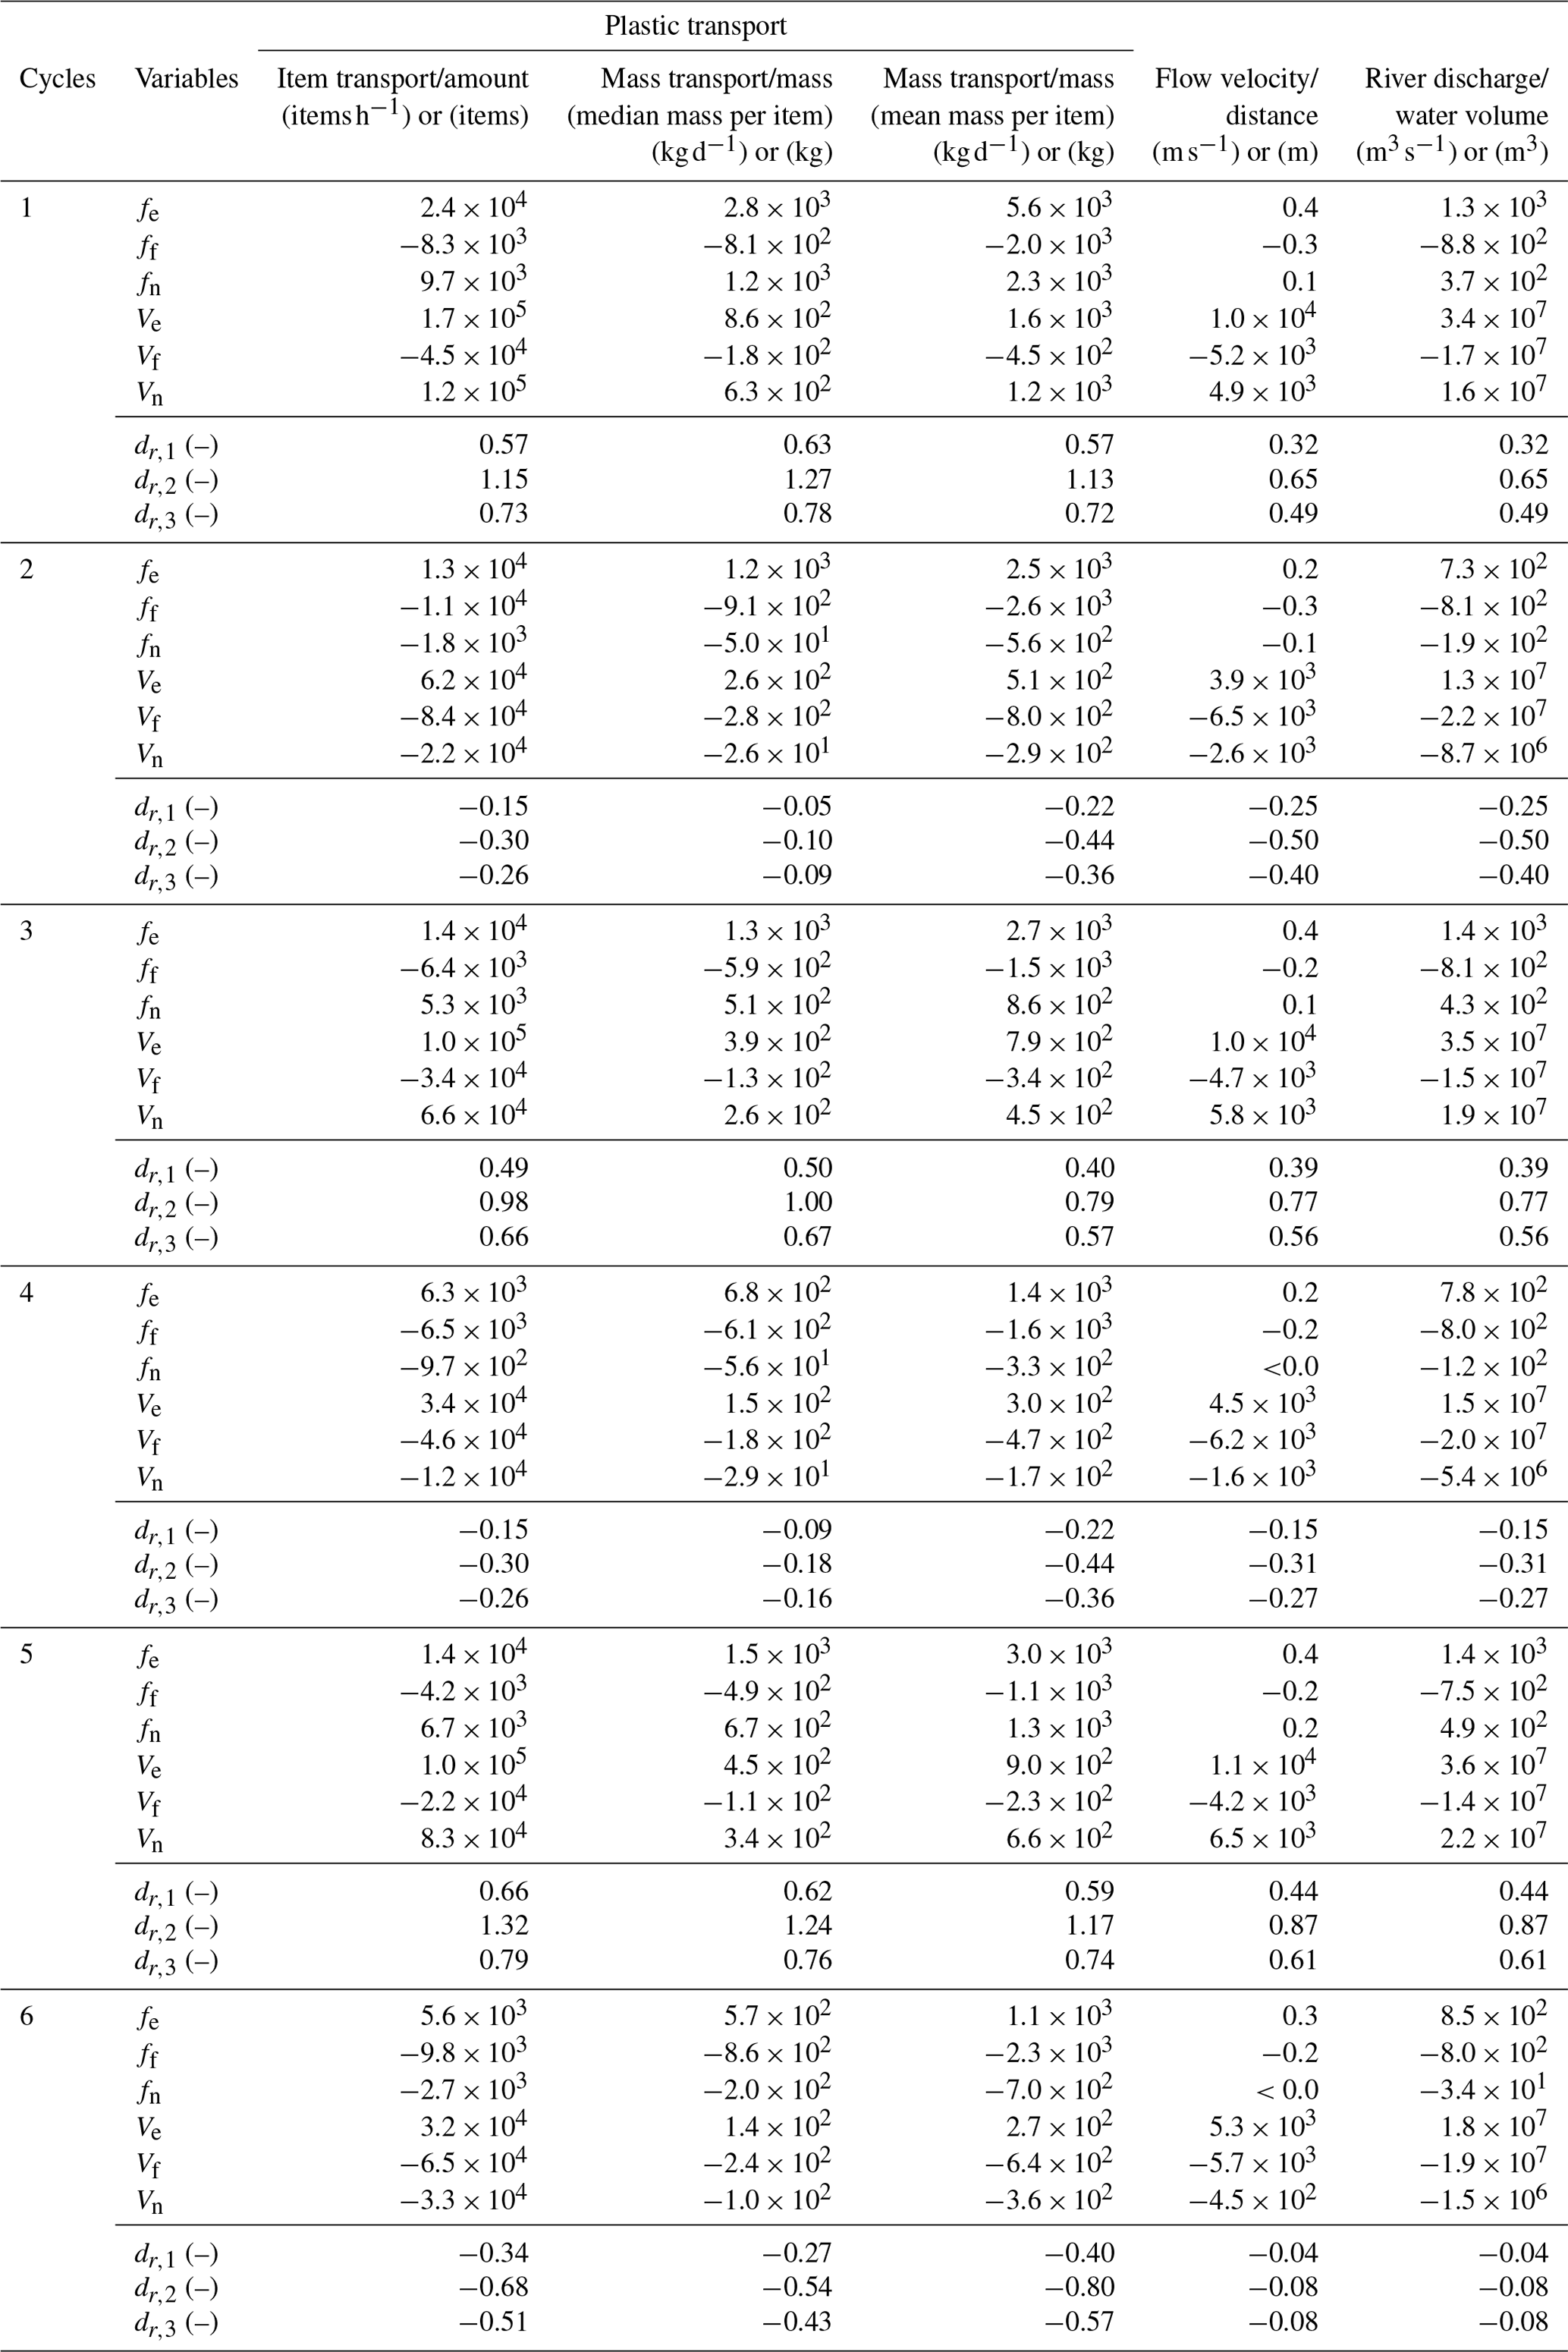
Table D3Mean and median mass per item. The mass statistics were taken from van Emmerik et al. (2019). The reported values for multilayer and other plastics correspond to the mean and median for all items since mass was not measured for a sufficient number of items for these two categories.
The data underlying this paper are available at https://doi.org/10.4121/21732818 (Schreyers et al., 2023b).
Conceptualization: LJS and THMvE. Investigation – data collection: LJS, THMvE, TKLB, and KVLT. Formal analysis: LJS. Visualization: LJS. Data curation: LJS. Writing – original draft: LJS. Writing – reviewing and editing: all authors. Supervision: MvdP, NW, and RU. Project administration: THMvE and LJS. Funding acquisition: THMvE and LJS.
The contact author has declared that none of the authors has any competing interests.
Publisher's note: Copernicus Publications remains neutral with regard to jurisdictional claims made in the text, published maps, institutional affiliations, or any other geographical representation in this paper. While Copernicus Publications makes every effort to include appropriate place names, the final responsibility lies with the authors.
Thanks to Quynh Nhu, Thanh Phuong, My Linh, Do Tien, Minh Son, Quoc Dung, Hoang Linh, Tran Danh, Diem Quynh, Anh Thu, Phuong Uyen, and Thu Trúc for their help in data collection. Thank you to Henk Jongbloed, Joris Beemster, Ton Hoitink, Isabel Jalón Rojas and the two referees for their meaningful inputs to the paper.
This research has been supported by the European Space Agency (grant no. 4000132682/20/NL/GLC) and the Aard- en Levenswetenschappen, Nederlandse Organisatie voor Wetenschappelijk Onderzoek (grant no. 18211).
This paper was edited by Giuliano Di Baldassarre and reviewed by Hubert H. G. Savenije and one anonymous referee.
Acha, E., Mianzan, H., Iribarne, O., Gagliardini, D., Lasta, C., and Daleo, P.: The role of the Rıo de la Plata bottom salinity front in accumulating debris, Mar. Pollut. Bull., 46, 197–202, 2003. a, b
Arneson, L.: Evaluating scour at bridges, Tech. rep., Federal Highway Administration, United States, 2013. a, b
Ballent, A., Pando, S., Purser, A., Juliano, M. F., and Thomsen, L.: Modelled transport of benthic marine microplastic pollution in the Nazaré Canyon, Biogeosciences, 10, 7957–7970, https://doi.org/10.5194/bg-10-7957-2013, 2013. a
Ballio, F., Pokrajac, D., Radice, A., and Sadabadi, S. H.: Lagrangian and Eulerian description of bed load transport, J. Geophys. Res.-Earth, 123, 384–408, 2018. a
Beaumont, N., Aanesen, M., Börger, M., Clark, J., Cole, M., Hooper, T., Lindeque, P., Pascoe, C., and Wyles, J.: Global ecological, social and economic impacts of marine plastic, Mar. Pollut. Bull., 142, 189–195, 2019. a
Boiten, W.: Hydrometry: IHE Delft lecture note series, CRC press, London, https://doi.org/10.1201/9780203971093, 2003. a
Borrelle, S., Rochman, C., Liboiron, M., Bond, A., Luscher, A., Bradshaw, H., and Provencher, J.: Why we need an international agreement on marine plastic pollution, P. Natl. Acad. Sci. USA, 114, 9994–9997, 2017. a
Camenen, B., Gratiot, N., J.-A., C., Tran, F., Nguyen, A.-T., Dramais, G., van Emmerik, T., and Némery, J.: Monitoring discharge in a tidal river using water level observations: Application to the Saigon River, Vietnam, Sci. Total Environ., 761, 143195, https://doi.org/10.1016/j.scitotenv.2020.143195, 2021. a, b, c
Codiga, D.: Unified Tidal Analysis and Prediction Using the UTide Matlab Functions, Technical Report 2011-01., Graduate School of Oceanography, University of Rhode Island, Narragansett, RI, 2011. a
Delorme, A. E., Koumba, G. B., Roussel, E., Delor-Jestin, F., Peiry, J. L., Voldoire, O., Garreau, A., Askanian, H., and Verney, V.: The life of a plastic butter tub in riverine environments, Environ. Pollut., 287, 117656, https://doi.org/10.1016/j.envpol.2021.117656, 2010. a
Fernandes, S. and Pillay, S.: A study of the net transport of nitrates from estuaries of the eThekwini Municipality of Durban, KwaZulu-Natal, South Africa, Environmental Earth Sciences, 67, 2193–2203, 2010. a, b
Fernandino, G., Elliff, C., Frutuoso, G., da Silva, E. N. M., Gama, G. S., de Oliveira Sousa, J., and Silva, I. R.: Considerations on the effects of tidal regimes in the movement of floating litter in an estuarine environment: Case study of the estuarine system of Santos-São Vicente, Brazil, Mar. Pollut. Bull., 110, https://doi.org/10.1007/s12665-012-1659-2, 2016. a, b
Gatto, V., van Prooijen, B., and Wang, Z.: Net sediment transport in tidal basins: quantifying the tidal barotropic mechanisms in a unified framework, Ocean Dynam., 67, 1385–1406, 2017. a, b
Gisen, J. and Savenije, H.: Estimating bankfull discharge and depth in ungauged estuaries, Water Resour. Res., 51, 2298–2316, https://doi.org/10.1002/2014WR016227, 2015. a
González-Fernández, D. and Hanke, G.: Toward a harmonized approach for monitoring of riverine floating macro litter inputs to the marine environment, Frontiers in Marine Science, 4, 86, https://doi.org/10.3389/fmars.2017.00086, 2017. a
González-Fernández, D., Cózar, A., Hanke, G., Viejo, J., Morales-Caselles, C., Bakiu, R., Barceló, D., Bessa, F., Bruge, A., Cabrera, M., Castro-Jiménez, J., Constant, M., Crosti, R., Galletti, Y., Kideys, A. E., Machitadze, N., de Brito, J. P., Pogojeva, M., Ratola, N., Rigueira, J., Rojo-Nieto, E., Savenko, O., Schöneich-Argent, R. I., Siedlewicz, G., Suaria, G., and Tourgeli, M.: Floating macrolitter leaked from Europe into the ocean, Nature Sustainability, 4, 474–483, 2021. a
Hauet, A., Morlot, T., and Daubagnan, L.: Velocity profile and depth-averaged to surface velocity in natural streams: A review over a large sample of rivers, in: E3s web of conferences, vol. 40, p. 06015, EDP Sciences, https://doi.org/10.1051/e3sconf/20184006015, 2018. a
Healy, R., Winter, T., LaBaugh, J., and Franke, O.: Water budgets: foundations for effective water-resources and environmental management, Tech. rep., U. S. Geological Survey, 2007. a
Hoitink, A. and Jay, D.: Tidal river dynamics: Implications for deltas, Rev. Geophys., 54, 240–272, 2016. a
Hoitink, A., Hoekstra, P., and van Maren, D.: Flow asymmetry associated with astronomical tides: Implications for the residual transport of sediment, J. Geophys. Res.-Oceans, 108, C10, https://doi.org/10.1029/2002JC001539, 2003. a
Hurley, R., Woodward, J., and Rothwell, J. J.: Microplastic contamination of river beds significantly reduced by catchment-wide flooding, Nat. Geosci., 11, 251–257, 2018. a
Jackson, L. T. N.: Spatial and temporal variations in debris accumulation and composition on an estuarine shoreline, Cliffwood Beach, New Jersey, USA, Mar. Pollut. Bull., 36, 705–711, 1998. a
Jambeck, J. R., Geyer, R., Wilcox, C., Siegler, T. R., Perryman, M., Andrady, A., Narayan, R., and Law, K. L.: Plastic waste inputs from land into the ocean, Science, 347, 768–771, https://doi.org/10.1126/science.1260352, 2015. a
Koelmans, A., Ellen, B., Foekema, E., Kooi, M., Mintenig, S., Ossendorp, B., Redondo-Hasselerharm, P., Verschoor, A., van Wezel, A., and Scheffer, M.: Risks of Plastic Debris: Unravelling Fact, Opinion, Perception, and Belief, Environ. Sci. Technol., 51, 11513–11519, 2021. a
Kooi, M., Besseling, E., Kroeze, C., van Wezel, A., and Koelmans, A.: Modeling the Fate and Transport of Plastic Debris in Freshwaters: Review and Guidance, in: Freshwater Microplastics. The Handbook of Environmental Chemistry, vol. 51, edited by: Wagner, M. and Lambert, S., Springer Nature, https://doi.org/10.1007/978-3-319-61615-5, 2018. a
Kuizenga, B., van Emmerik, T., Waldschläger, K., and Kooi, M.: Will it Float? Rising and Settling Velocities of Common Macroplastic Foils, Environmental Science & Technology Water, 2, 975–981, 2021. a
Lahens, L., Strady, E., Kieu-Le, T.-C., Dris, R., Boukerma, K., Rinnerte, E., Gasperi, J., and Tassin, B.: Macroplastic and microplastic contamination assessment of a tropical river (Saigon River, Vietnam) transversed by a developing megacity, Environ. Pollut., 235, 1–10, 2018. a
Laxague, N., Özgökmen, T. M., Brian, K., Novelli, G., Shcherbina, A., Sutherland, P., Guigand, C., Lund, B., Mehta, S., Alday, M., and Molemaker, J.: Observations of Near-Surface Current Shear Help Describe Oceanic Oil and Plastic Transport, Geophys. Res. Lett., 45, 245–249, 2017. a
Lebreton, L. C., Van Der Zwet, J., Damsteeg, J.-W., Slat, B., Andrady, A., and Reisser, J.: River plastic emissions to the world's oceans, Nat. Commun., 8, 1–10, 2017. a, b, c, d
Ledieu, L., Tramoy, R., Mabilais, D., Ricordel, S., Verdier, L., Tassin, B., and Gasperi, J.: Macroplastic transfer dynamics in the Loire estuary: Similarities and specificities with macrotidal estuaries, Mar. Pollut. Bull., 182, 114019, https://doi.org/10.1016/j.marpolbul.2022.114019, 2022. a, b, c, d, e
Lepesqueur, J., Hostache, R., Martínez-Carreras, N., Montargès-Pelletier, E., and Hissler, C.: Sediment transport modelling in riverine environments: on the importance of grain-size distribution, sediment density, and suspended sediment concentrations at the upstream boundary, Hydrol. Earth Syst. Sci., 23, 3901–3915, https://doi.org/10.5194/hess-23-3901-2019, 2019. a
Liro, M., van Emmerik, T., Wyżga, B., Liro, J., and Mikuś, P.: Macroplastic Storage and Remobilization in Rivers, Water, 12, 2055, https://doi.org/10.3390/w12072055, 2020. a, b
Lotcheris, R., Schreyers, L., Bui, T. K. L., Thi, K., Nguyen, H. Q., Vermeulen, B., and van Emmerik, T.: Plastic Does Not Simply Flow into the Sea: River Transport Dynamics Affected by Tides and Floating Plants, preprint available at SSRN 4449742, 2023. a, b
López, A., Najjar, R., Friedrichs, M., Hickner, M., and Wardrop, D.: Estuaries as Filters for Riverine Microplastics: Simulations in a Large, Coastal-Plain Estuary, Frontiers in Marine Science, 8, 2055, https://doi.org/10.3389/fmars.2021.715924, 2020. a, b, c
Meijer, L. J., van Emmerik, T., van der Ent, R., Schmidt, C., and Lebreton, L.: More than 1000 rivers account for 80% of global riverine plastic emissions into the ocean, Science Advances, 7, eaaz5803, https://doi.org/10.1126/sciadv.aaz5803, 2021. a, b, c, d, e, f, g
Muste, M., Fujita, I., and Hauet, A.: Large-scale particle image velocimetry for measurements in riverine environments, Water Resour. Res., 44, 4, https://doi.org/10.1029/2008WR006950, 2008. a
Nguyen, D. and Nguyen, D.: A simple approach to estimating freshwater discharge in branched estuarine systems, Hydrol. Process., 32, 2765–2778, https://doi.org/10.1002/hyp.13222, 2018. a
Nguyen, H., Nguyen, H., Quang, N., Hieu, N. D., and Thang, L.: Spatio-temporal pattern of water quality in the Saigon-Dong Nai river system due to waste water pollution sources, International Journal of River Basin Management, 19, 221–243, 2021. a
Nguyen, T., Némery, J., Gratiot, N., Garnier, J., Strady, E., Nguyen, P. D., Tran, V., Nguyen, A., S. Tung Cao, S., and Huynh, T.: Nutrient budgets in the Saigon–Dongnai River basin: Past to future inputs from the developing Ho Chi Minh megacity (Vietnam), River Res. Appl., 36, 974–990, https://doi.org/10.1002/rra.3552, 2020. a
Rantz, S.: Measurement and Computation of Streamflow: Volume 2. Computation of Discharge, Tech. rep., USGS Water Supply Paper 2175, US Geological Survey, 1982. a
Rochman, C., Cook, A.-M., and Koelmans, A.: Plastic debris and policy: Using current scientific understanding to invoke positive change, Environ. Toxicol. Chem., 35, 1617–1626, 2016. a
Roebroek, C. T. J., Hut, R., Vriend, P., Winter, W. d., Boonstra, M., and Emmerik, T. H. M. v.: Disentangling Variability in Riverbank Macrolitter Observations, Environ. Sci. Technol., 55, 4932–4942, https://doi.org/10.1021/acs.est.0c08094, 2021a. a
Roebroek, C. T. J., Harrigan, S., Van Emmerik, T. H., Baugh, C., Eilander, D., Prudhomme, C., and Pappenberger, F.: Plastic in global rivers: are floods making it worse?, Environ. Res. Lett., 16, 025003, https://doi.org/10.1088/1748-9326/abd5df, 2021b. a
Roebroek, C. T. J., Laufkötter, C., González-Fernández, D., and van Emmerik, T.: The quest for the missing plastics: Large uncertainties in river plastic export into the sea, Environ. Pollut., 312, 119948, https://doi.org/10.1016/j.envpol.2022.119948, 2022. a
Ryan, P.: Does size and buoyancy affect the long-distance transport of floating debris?, Environ. Res. Lett., 10, 084019, https://doi.org/10.1016/j.ecss.2021.107186, 2021. a, b
Ryan, P. G. and Perold, V.: Limited dispersal of riverine litter onto nearby beaches during rainfall events, Estuar. Coast. Shelf S., 251, 107186, https://doi.org/10.1016/j.ecss.2021.107186, 2021. a
Schmidt, C., Krauth, T., and Wagner, S.: Export of plastic debris by rivers into the sea, Environ. Sci. Technol., 51, 12246–12253, 2017. a, b, c
Schreyers, L., van Emmerik, T., Luan Nguyen, T., Castrop, E., Phung, N.-A., Kieu-Le, T.-C., Strady, E., Biermann, L., and van der Ploeg, M. J.: Plastic plants: The role of water hyacinths in plastic transport in tropical rivers, Front. Environ. Sci., 9, https://doi.org/10.3389/fenvs.2021.686334, 716516, 2021. a, b
Schreyers, L., van Emmerik, T. H., Bui, K., Van Le Thi, K., Vermeulen, B., Nguyen, H.-Q., and van der Ploeg, M.: Reply to Reviewer Comment 1 on “Tidal dynamics limit river plastic transport”, Preprint on Egusphere, https://doi.org/10.5194/egusphere-2022-1495-AC3, 2023a. a
Schreyers, L., van Emmerik, T., Thanh-Khiet L. Bui, van Le Thi, K., Vermeulen, B., Nguyen, H. Q., Wallerstein, N., Uijlenhoet, R., and van der Ploeg, M.: Dataset underlying the publication Tidal dynamics limit river plastic transport, Version 1, 4TU.ResearchData, [data set], https://doi.org/10.4121/21732818.v1, 2023b. a
Schwarz, A., Ligthart, T., Boukris, E., and van Harmelen, T.: Sources, transport, and accumulation of different types of plastic litter in aquatic environments: A review study, Mar. Pollut. Bull., 143, 92–100, https://doi.org/10.1016/j.marpolbul.2019.04.029, 2019. a, b, c
Sutton, R., Mason, S., Stanek, S., Willis-Norton, E., Wren, I., and Box, C.: Microplastic contamination in the San Francisco Bay, California, USA, Mar. Pollut. Bull., 109, 230–235, https://doi.org/10.1016/j.marpolbul.2016.05.077, 2016. a
Tasseron, P., Begemann, F., Joosse, N., van der Ploeg, M., van Driel, J., and van Emmerik, T.: Amsterdam urban water system as entry point of river plastic pollution, Environ. Sci. Pollut. R., 30, 1–10, https://doi.org//10.1007/s11356-023-26566-5, 2023. a
Tessler, Z., C. J.Vörösmarty, Overeem, I., and Syvitzki, J.: A model of water and sediment balance as determinants of relative sea level rise in contemporary and future deltas, Geomorphology, 305, 2019–220, 2018. a
Tramoy, R., Gasperi, J., Colasse, L., Silvestre, M., Dubois, P., Noûs, C., and Tassin, B.: Transfer dynamics of macroplastics in estuaries – New insights from the Seine estuary: Part 2. Short-term dynamics based on GPS-trackers, Mar. Pollut. Bull., 160, 111566, https://doi.org/10.1016/j.marpolbul.2020.111566, 2020a. a, b, c, d, e
Tramoy, R., Gasperi, J., Colasse, L., and Tassin, B.: Transfer dynamic of macroplastics in estuaries – New insights from the Seine estuary: Part 1. Long-term dynamic based on date-prints on stranded debris, Mar. Pollut. Bull., 152, 110894, https://doi.org/10.1016/j.marpolbul.2020.110894, 2020b. a, b, c
Valero, D., Belay, B. S., Moreno-Rodenas, A., Kramer, M., and Franca, M. J.: The key role of surface tension in the transport and quantification of plastic pollution in rivers, Water Res., 226, 119078, https://doi.org/10.1016/j.watres.2022.119078, 2022. a
van der Mheen, M., Pattiaratchi, C., Cosoli, S., and Wandres, M.: Depth-Dependent Correction for Wind-Driven Drift Current in Particle Tracking Applications, Frontiers in Marine Science, 7, 305, https://doi.org/10.3389/fmars.2020.00305, 2020. a
van Emmerik, T. and Schwarz, A.: Plastic debris in rivers, Water, 7, e1398, https://doi.org/10.1002/wat2.1398, 2020. a, b
van Emmerik, T., Strady, E., Kieu-Le, T.-C., Nguyen, L., and Gratiot, N.: Seasonality of riverine macroplastic transport, Sci. Rep.-UK, 9, 1–9, 2019. a, b, c, d, e
van Emmerik, T., van Klaveren, J., Meijer, L. J., Krooshof, J. W., Palmos, D. A. A., and Tanchuling, M. A.: Manila river mouths act as temporary sinks for macroplastic pollution, Frontiers in Marine Science, 7, 770https://doi.org/10.3389/fmars.2020.545812, 2020. a
van Emmerik, T., de Lange, S., Frings, R., Schreyers, L., Aalderink, H., Leusink, J., Begemann, F., Hamers, E., Hauk, R., Janssens, N., Jansson, P., Joosee, N., Kelder, D., van der Kuijl, T., Lotcheris, R., Löhr, A., Mellink, Y., Pinto, R., Tasseron, P., Vos, V., and Vriend, P.: Hydrology as a driver of floating river plastic transport, Earths Future, 10, e2022EF002811, https://doi.org/10.1029/2022EF002811, 2022a. a, b, c, d, e, f
van Emmerik, T., Mellink, Y., Hauk, R., Waldschläger, K., and Schreyers, L.: Rivers as plastic reservoirs, Frontiers in Water, 3, 212, https://doi.org/10.3389/frwa.2021.786936, 2022b. a, b
van Emmerik, T. H., Frings, R. M., Schreyers, L. J., Hauk, R., de Lange, S. I., and Mellink, Y. A.: River plastic transport and deposition amplified by extreme flood, Nature Water, 1–9, 2023. a, b
Vermeiren, P., Muñoz, C., and Kou, I.: Sources and sinks of plastic debris in estuaries: A conceptual model integrating biological, physical and chemical distribution mechanisms, Mar. Pollut. Bull., 113, 7–16, 2016. a
Vriend, P., Van Calcar, C., Kooi, M., Landman, H., Pikaar, R., and Van Emmerik, T.: Rapid assessment of floating macroplastic transport in the Rhine, Frontiers in Marine Science, 7, 10, https://doi.org/10.3389/fmars.2020.00010, 2020. a
Waldschläger, K. and Schüttrumpf, H.: Effects of Particle Properties on the Settling and Rise Velocities of Microplastics in Freshwater under Laboratory Conditions, Environ. Sci. Technol., 53, 1958–1966, 2019. a
Waldschläger, K., Brückner, M. Z., Carney Almroth, B., Hackney, C. R., Adyel, T. M., Alimi, O. S., Belontz, S. L., Cowger, W., Doyle, D., Gray, A., Kane, I., Kooi, M., Kramer, M., Lechthaler, S., Michie, L., Nordam, T., Pohl, F., Russell, C., Thit, A., Umar, W., Valero, D., Varrani, A., Warrier, A. K., Woodall, L. C., and Wu, N.: Learning from natural sediments to tackle microplastics challenges: A multidisciplinary perspective, Earth-Sci. Rev., 228, 104021, https://doi.org/10.1016/j.earscirev.2022.104021, 2022. a
- Abstract
- Introduction
- Methods
- Results
- Discussion
- Conclusions
- Appendix A: Relationship between river discharge and flow velocity
- Appendix B: Tidal constituent analysis
- Appendix C: Relationship between river discharge and plastic transport
- Appendix D: Plastic transport, flow velocity, discharge, and associated metrics: extended data
- Data availability
- Author contributions
- Competing interests
- Disclaimer
- Acknowledgements
- Financial support
- Review statement
- References