the Creative Commons Attribution 4.0 License.
the Creative Commons Attribution 4.0 License.
Determining the threshold of issuing flash flood warnings based on people's response process simulation
Ruikang Zhang
Dedi Liu
Lihua Xiong
Jie Chen
Hua Chen
Jiabo Yin
The effectiveness of flash flood warnings depends on people's response processes to the warnings. And false warnings and missed events cause people's negative responses. It is crucial to find a way to determine the threshold of issuing the warnings that reduces the false-warning ratio (FWR) and the missed-event ratio (MER), especially for uncertain flash flood forecasting. However, most studies determine the warning threshold based on the natural processes of flash floods rather than the social processes of warning responses. Therefore, an agent-based model (ABM) was proposed to simulate people's response processes to the warnings. And a simulation chain of rainstorm probability forecasting–decision on issuing warnings–warning response processes was conducted to determine the warning threshold based on the ABM. The town of Liulin in China was selected as a case study to demonstrate the proposed method. The results show that the optimal warning threshold decreases as forecasting accuracy increases. And as forecasting variance or the variance of the forecasting variance increases, the optimal warning threshold decreases (increases) for low (high) forecasting accuracy. Adjusting the warning threshold according to people's tolerance levels to the failed warnings can improve warning effectiveness, but the prerequisite is to increase forecasting accuracy and decrease forecasting variance. The proposed method provides valuable insights into the determination of the warning threshold for improving the effectiveness of flash flood warnings.
- Article
(3935 KB) - Full-text XML
- BibTeX
- EndNote
With the intensification of climate change and human activities (Slater et al., 2021), flash floods have become one of the most serious disasters, threatening economic and social security (Borga et al., 2019). Flash flood warnings have been taken as an effective and economical means of preventing flash flood disasters (Yin et al., 2023). By issuing warnings before the occurrence of flash floods, people are advised or ordered to evacuate to reduce casualties. However, people's responses to the warnings are complex processes, including receiving the warnings, understanding the warnings, trusting the warnings, and personalizing the flood risk (Mileti, 1995; Parker et al., 2009). And these complex processes might hinder the evacuation and undermine the effectiveness of the warnings (Cools et al., 2016). To improve the effectiveness of flash flood warnings, extensive studies have been done to pursue a higher accuracy and longer lead time of flash flood forecasting (Han and Coulibaly, 2017; Lei et al., 2018). Unfortunately, people's responses to the warnings have rarely been explored and have become a bottleneck in improving the effectiveness of the warnings and reducing casualties (Bodoque et al., 2019; Wang et al., 2022).
People's negative responses to the warnings have been mainly attributed to the uncertainties in flash flood forecasting and warnings. The uncertainties in flash flood forecasting come from the uncertainties in meteorological forecasting, observation data, initial conditions, hydrological and hydraulic model structure, model parameters, and so on (Boelee et al., 2019). To describe the uncertainties in flood forecasting, a probabilistic flood forecasting method was proposed and has been widely applied in issuing warnings by the disaster prevention administrators (Krzysztofowicz, 2001). If the probability of flash flood disasters from the probabilistic flood forecasting exceeds a preset threshold, the procedure of issuing a warning will be triggered (Coccia and Todini, 2011; Todini, 2017). If the threshold is set low, even a low forecasted probability of flash flood disasters can exceed the threshold, and a lot of warnings with only the low probability of flash flood disaster will be issued, resulting in an increase in the false-warning ratio. In contrast, if the threshold is set high, only the flash flood disasters with high forecasted probability can be warned about, and some flash flood disasters with a probability that is not low will be missed, leading to an increase in the missed-event ratio (Potter et al., 2021). These two increases from both the false-warning ratio and the missed-event ratio can decrease people's responses to the warnings and increase the casualties. Simmons and Sutter (2009) conducted a statistical analysis of tornado data from 1986 to 2004, and they found that tornadoes with a higher false-warning ratio killed and injured more people. LeClerc and Joslyn (2015) explored the cry wolf effect in weather-related decision-making through a controlled experimental approach. And their experiments revealed that the decreasing false-warning ratio could increase people's trust in the warnings when the trust level is in the medium range, while false-warning ratios that are both too high and too low led to inferior decision-making. Ripberger et al. (2015) found that the false-warning ratio and the missed-event ratio significantly reduced people's trust in the National Weather Service and suppressed their positive responses via a large regional survey. However, it is impossible to simultaneously reduce the false-warning ratio and the missed-event ratio at a certain level of forecasting as there is a trade-off between these two ratios as described above. Therefore, it is crucial to find a way to determine an appropriate threshold that balances the false-warning ratio and the missed-event ratio for improving the positive warning responses and reducing the disaster casualties.
Extensive methods have been proposed to determine the threshold of issuing flood warnings for balancing the false-warning ratio and the missed-event ratio (Duc Anh et al., 2020; Ke et al., 2020; Ramos Filho et al., 2021; Tekeli and Fouli, 2017; Young et al., 2021). The methods have gradually evolved from fixed-threshold determination methods to dynamic-threshold determination methods and from data-driven methods to simulation-based methods (Cheng, 2013). However, these methods only determined the threshold of issuing warnings based on the natural processes of flash floods, while ignoring the social processes of warning responses. The goal of flash flood warnings is to stimulate people's responses to the warnings to reduce casualties. Even a reliable warning cannot be effective without people's positive responses to it. To the best of our knowledge, there are very few methods to determine the threshold based on people's response process simulation. Roulston and Smith (2004) generalized the warning release into an improved classical binary cost–loss problem, where people's warning response level was expressed as a function of the false-warning ratio, and this warning response level variable was included in the cost–loss analysis. And the threshold of issuing warnings was derived with the goal of minimizing the cost loss ratio under different scenarios. Sawada et al. (2022) proposed a stylized model that coupled natural and social systems to determine the threshold of issuing warnings. In this stylized model, the warning response level was discovered to be influenced by both the success rate of the warning and the flood experience and then was mapped to flood losses through an empirical equation. However, these studies only described the warning response level through empirical equations or conceptual models instead of describing the warning response processes through process-based models. To reflect the characteristics of flash flood disaster prevention and the flash flood warning responses, it is necessary to simulate people's response processes of receiving warnings, making evacuation decisions, implementing evacuation, and being submerged by flash floods (or reaching shelters).
An agent-based model (ABM) is a modeling framework for complex systems that simulate the dynamic interactions between automatic decision-making agents and between these agents and the environment at a distributed micro level (Janssen and Ostrom, 2006). As the warning responses are related to a learning process and also to personal flood experience and risk perception, ABM is suitable for understanding the dynamic processes through simulating the individual decision-making (Anshuka et al., 2022). Additionally, ABM can describe the spatially explicit social–hydrological processes, such as the dissemination of warning information, the selection of evacuation routes, and the distribution of flash flood inundation (Sivapalan and Bloeschl, 2015). Thus, ABM is an effective tool for simulating people's response processes to flash flood warnings (Du et al., 2017, 2023; Yang et al., 2018; Zhuo and Han, 2020).
The objective of this study includes two parts. Firstly, to simulate people's response processes to flash flood warnings and reveal the impact of the warning information weight given by people on the effectiveness of warnings, this study aims to develop a process-based ABM that combines natural and social processes (Sect. 2.1). Secondly, to determine the threshold of issuing warnings (called the warning threshold hereafter) based on the social processes of warning responses, this study attempts to propose a simulation chain of rainstorm probability forecasting–decision on issuing warnings–warning response processes based on the ABM (Sect. 2.2). Through the proposed simulation framework for determining the warning threshold, we examine the uncertainties in flash flood forecasting that affect the determination of warning thresholds and the joint impact of forecasting skills and people's tolerance levels to failed warnings on the warning threshold determination. The town of Liulin in China is selected as a case study to demonstrate the proposed method and to provide valuable insights into the determination of warning threshold for improving the effectiveness of flash flood warnings.
A modeling framework is proposed to determine the warning threshold based on people's response processes. The modeling framework includes the development of an ABM and its surrogate model for simulating people's response processes to flash flood warnings and a chain simulation of forecasting–warning–response (see Fig. 1). First, rainstorm probability forecasting is performed according to actual rainfall, and then the warning administrators make decisions to issue warnings based on the rainstorm probability forecasting and warning thresholds. If it is decided to issue warnings, the warning information and the actual rainfall jointly drive the surrogate model of the ABM to simulate people's response processes. Finally, the casualty rate is estimated and the warning threshold that minimizes the casualty rate can be determined based on the proposed modeling framework.
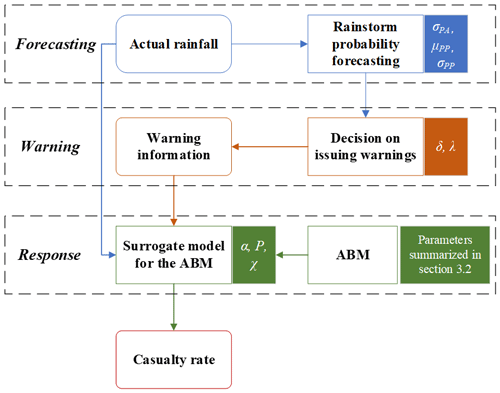
Figure 1The proposed modeling framework for determining the warning threshold based on people's response processes (the parameters in a simulation step are indicated by a rectangular box with a background in the corresponding color).
2.1 Development of an ABM for simulating people's response processes to flash flood warnings
To simulate people's response processes to flash flood warnings (i.e., including the receiving warnings, deciding to start evacuation, implementing evacuation, and being submerged by flash floods/reaching shelters), an ABM is developed by coupling social and natural sub-systems.
2.1.1 Agents and their environments in the ABM
There are two types of agents in the ABM: resident and authority. Resident agents refer to the people threatened by flash floods. After receiving flash flood warnings, the agents will decide whether and when to evacuate. If they decide to evacuate, they will move along the roads towards the shelters. After issuing the warnings, the flash flood will occur and might wash away the agents who have not successfully arrived at shelters. The probability of casualties can be estimated based on the velocity and the depth of the flash flood. Authority agents represent the local authorities that mandate to prevent the flash flood disasters.
The environment in the ABM are the residences, road networks, shelters, and floodwater. The residence agents are initially randomly distributed in the residences. The resident agents who have decided to evacuate will move along the road network instead of freely moving within the ABM area. Shelters are destinations for evacuation. The flash flood water not only affects the evacuation decisions and behaviors of the resident agents but also causes casualties to the resident agents.
2.1.2 Sub-modules of the ABM
Early warning sub-module. The early warning sub-module simulates the process of issuing warnings. Owing to the uncertainties in flash flood forecasting, there are multiple stages of warning in a warning system. Rainstorm red, ready-to-evacuate, and immediate-evacuation warnings are successively issued in the ABM. The times of issuing these three warnings are determined by three parameters: lead times of the rainstorm red warning (indicated as lead-time-w1), ready-to-evacuate warning (indicated as lead-time-w2), and immediate-evacuation warning (indicated as lead-time-w3).
Social sub-module. The social sub-module simulates people's psychological and behavioral response processes to the warnings. The jth agent1 will decide to evacuate when their overall evacuation intention (Sj, exceeds a threshold, τ, or the water depth near them exceeds an evacuation depth threshold, EDT. There are two components in Sj: evacuation intention arising from receiving warnings (, and evacuation intention arising from observing neighbors (, . The value of is related to the socio-demographic and socio-psychological attributes of the jth agent (SSCj) and the stages of the receiving warning from the early-warning sub-module (WT). The relationship can be described by a random forest algorithm. The value of equals to the proportion of the jth agent's neighbors who have decided to evacuate. The weights of the influence of and on the Sj are represented by parameters αj and βj, respectively, and . Finally, the overall evacuation intention of the jth agent at time t, Sj,t, is a linear combination of overall evacuation intention at time t−1 () and current information. The learning rate, θj, measures the weight given by the jth agent to the obtained information at the current time. If the jth agent has decided to evacuate, they will walk along the shortest road network to the shelters. Their walking speed is estimated by the spatial-grid evacuation model (SGEM) that has been developed by the City University of Hong Kong and Wuhan University (Lo et al., 2004).
Flood sub-module. As a flash flood can affect people's evacuation behaviors and cause casualties, the flash flood process is simulated in the flood sub-module. Hydrologic Engineering Center's River Analysis System (HEC-RAS) software is gaining popularity due to its capabilities to simulate unsteady flow efficiently and identify and visualize flood-prone areas (Hicks and Peacock, 2005; Maidment, 2017). The HEC-RAS model has been applied for flood forecasting and warning (Oleyiblo and Li, 2010), and it has been adopted in our flood sub-module. The river geometries such as centerlines, bank lines, and cross-sectional lines are the major parameters processed in the HEC-RAS model to generate flood-prone areas. The spatiotemporal changes in the depth and velocity of flash floods are simulated by the HEC-RAS model after the warnings.
2.1.3 Casualty rate estimation module
Current studies generally estimate flood casualties through two types of influencing factors: environmental factors and victim characteristics (Petrucci, 2022). The first type includes the hazard conditions (measured by flood depth and velocity) and the location and environments where the hazard occurs (e.g., urban/rural, indoor/outdoor, and distance from floods). Flood velocity and depth are influenced by underlying surface conditions, such as the topography of flood plains, watershed size, and land use (Creutin et al., 2009; Penning-Rowsell et al., 2005; Spitalar et al., 2014). Rural residents are more vulnerable to floods due to the lack of advanced emergency response systems and forecasting and warning capabilities. The concentration of the urban population and the increase in impermeable surfaces amplifies the flood risk (Brazdova and Riha, 2014; Terti et al., 2017). The second type includes the attributes of people (e.g., age, gender, weight, and height), the status of the residence, and whether the victim has taken adaptive or emergency measures (Papagiannaki et al., 2022; Petrucci et al., 2019; Petrucci, 2022; Salvati et al., 2018).
Takahashi et al. (1992) established a connection between the characterization of human stability (safe or fall) and flow features such as depth (h) and velocity (u) through a casualty experiment. If variable z is set to the linear addition of h and u (i.e., ), a logistic regression equation can be used to fit the relationship between the characterization of human stability (if the person falls, its value is 1, otherwise it is 0) and z. Based on experiment data, the parameters (β0, β1, and β2) can be estimated, and the logistic regression equation is used to predict the probability of casualty by depth and velocity. Based on the spatiotemporal distribution of people outputted from the social sub-module and the spatiotemporal distribution of floodwater outputted from the flood sub-module, the casualty probability of an agent can be estimated via the logistic regression equation as follows:
where , , β1=22.036, and β2=11.517. The flood water depth is represented by h ( m, and the flood water velocity is denoted by u ( m s−1). The jth agent is taken to be casualty if the h exceeds 0.85 m or u exceeds 2.00 m s−1 around them. The casualty rate is estimated as the proportion of the casualties. A detailed description of the ABM can be retrieved from Zhang et al. (2024).
2.1.4 Development of a surrogate model for the ABM
Due to the complexity of the ABM, running this model once requires a significant amount of time (Confalonieri et al., 2010). To simulate multiple flash flood events, it is necessary to improve the computational efficiency of the ABM. Thus, a Bayesian method developed by Oakley and O'Hagan (2004) is used to develop a Gaussian process (GP) emulation as a surrogate model of the ABM. The GP emulation can simulate warning response processes more efficiently than the original ABM (O'Hagan, 2006). In general, the GP emulation can be represented by the following equation: D=fGP(x), where D is the casualty rate at the end of the simulation and x is a set of parameters of the ABM.
A global sensitivity analysis of the ABM reveals that the weight of warning influence, α, is the most sensitive parameter for the casualty rate (Zhang et al., 2024). Furthermore, rainfall, P, is the driving factor causing flash floods. Therefore, if there is a flash flood disaster and its corresponding warnings are issued, the ABM can be simplified into a two-parameter surrogate model: . If there is a flash flood disaster and no warning is issued, the ABM can be simplified into a one-parameter surrogate model: .
2.2 Simulation chain of rainstorm probability forecasting–decision on issuing warnings–warning response processes
2.2.1 Simulation of rainstorm probability forecasting
Flash floods often occur if there are sufficient rainstorms in a small basin over a few hours (Collier, 2007; Younis et al., 2008). As the total flood generation and routing time is very short, flash flood warnings have to be dependent on the rainstorm forecasting for enough lead time (Zhai et al., 2018). Therefore, the rainstorm forecasting determines the flash flood warning decisions. The probabilistic forecasting is preferred over the deterministic one as it considers forecasting uncertainties and is beneficial for rational decisions (Krzysztofowicz, 2001). A random probabilistic forecasting generator based on Ambühl (2010) is employed to forecast the probability distribution of rainfall as follows:
where F is the forecasted rainfall, N(.) is the Gaussian distribution, P is the actual rainfall, reflects the forecasting accuracy, and reflects the forecasting precision.
Although Ambühl (2010) used gamma distribution to simulate the forecasting precision, the normal distribution can help improve the interpretability of the results. If the probability distribution of forecasted rainfall is assumed to be a normal distribution and μPA is assumed to be zero according to Sawada et al. (2022), the deviation between the median value of forecasted rainfall and actual rainfall (denoted by η) is determined by σPA. In other words, η follows a normal distribution, with a mean of 0 and a variance of . Therefore, there is a positive correlation between |η| and σPA. For example, assuming the actual rainfall is 0.5, if σPA=0.05, the median value of forecasted rainfall from each probability forecast is around 0.5. However, if σPA=0.15, the median value of forecasted rainfall is likely to deviate from 0.5 (see Fig. 2a). In fact, the probability of η in the interval (−3σPA, 3σPA) is 99.73 %.
Negative is truncated to to eliminate the negative values of variance. The variance of forecasted rainfall is determined by μPP. For example, the probability distribution of forecasted rainfall is relatively concentrated if μPP=0.1, while the probability distribution of forecasted rainfall is relatively deconcentrated if μPP=0.2 (see Fig. 2b). And the variance of the variance of forecasted rainfall is determined by σPP. As shown in Fig. 2c, by conducting three probability forecasts, there is a similar dispersion degree of probability distributions if σPP=0.01, while there is a distinguishing dispersion degree of probability distributions if σPP=0.1.
Briefly, if the mean of F (i.e., ) is taken to be the forecasting tendency value, the accuracy of the forecasting tendency value will be reflected by σPA. The variance of F (i.e., ) determines the band width of F. The larger the value of , the greater the band-width value of F. The variance of the forecasting values is determined by μPP, while the variance of the variance of the forecasting values is determined by σPP.
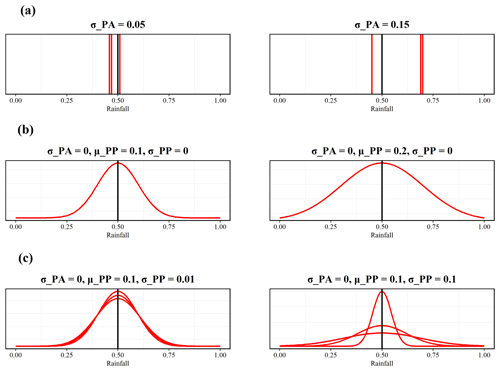
Figure 2The black line represents the actual rainfall. The value of forecasted rainfall is normalized to 0–1. (a) The median value of forecasted rainfall (represented by the red lines) by conducting three probability forecasts with different values of σPA. (b) The probability distribution of forecasted rainfall (represented by the red line) with different values of μPP. (c) The probability distributions of forecasted rainfall (represented by the red lines) by conducting three probability forecasts with different values of σPP.
2.2.2 Simulation of the decision on issuing warnings
There is a damage threshold, δ. If P exceeds this threshold, flash flood disasters will occur and cause damages. The probabilistic forecasting system can provide the probability that the forecasted rainfall exceeds δ (i.e., the probability of flash flood disasters, denoted by Prob). If Prob is larger than a preset threshold, λ, the warning administrators will issue the warnings. Thus, λ is the warning threshold. The warning outcomes are dependent on a contingency table (shown in Table 1). The outcomes are dependent on two conditions: first, whether Prob is above the λ or not (i.e., whether to issue warnings or not), and second, whether the P exceeds the δ or not (i.e., whether a flash flood disaster occurs or not). The interplay of the two conditions leads to four warning outcomes: true negative (no warning), false negative (missed event), false positive (false warning), and true positive (successful warning). The missed events and the false warnings are collectively taken as failed warnings here.
2.2.3 Simulation of warning response processes
According to the four warning outcomes in Table 1, warning response processes are simulated by the surrogate model of the ABM for estimating the casualty rate, D. If the warning outcome is true negative or false positive, the casualty rate is negligible as the actual rainfall, P, is smaller than the damage threshold, δ. It should be noted that a false positive can cause opportunity cost as there are behavior responses to the warnings (i.e., evacuation behaviors). As this study only focuses on the casualty rate, the opportunity cost has been ignored. If the warning outcome is a false negative, there is a flash flood disaster, but no warning is issued. In this case, the one-parameter surrogate model (i.e., ) is employed to simulate warning response processes for estimating the casualty rate. If the warning outcome is a true positive, there is a flash flood disaster, and its corresponding warnings are issued. The casualty rate is mitigated by evacuation. The two-parameter surrogate model (i.e., ) is used to simulate the warning response processes for estimating the casualty rate. In general, the casualty rate can be described by the following equation:
We assume that past warning outcomes affect people's trust levels in the warnings. Existing studies have found that the recent false-warning ratio undermines people's trust levels in the warnings and their preparedness actions (Jauernic and Van den Broeke, 2017; LeClerc and Joslyn, 2015; Lim et al., 2019; Ripberger et al., 2015). It is reasonable to assume that people's past experiences with successful (or failed) warnings increase (or decrease) their trust levels in the warnings. A person's trust level in the warnings can be described by the parameter α representing the weight assigned to the warning information. Therefore, α after experiencing a flash flood at time t+1 can be described by the following equation:
where χFN, χFP, and χTP are increments of α for a false negative, false positive, and true positive, respectively. If α is larger than 1, it is truncated to 1. If α is smaller than 0, it is truncated to 0. People's trust levels in the warnings were assumed to only be affected by past warning outcomes. There are other factors (e.g., social education and government authority) that can be incorporate into the estimation of people's trust levels in further research.
2.2.4 Performance metrics of the warning
Three metrics are used to evaluate the warning performance: the relative casualty rate (Dr), missed-event ratio (MER), and false-warning ratio (FWR). The Dr is defined as
where Dw is the average casualty rate of multiple flash floods if there is a flash flood warning. And the casualty rate of each flash flood can be estimated by Eq. (3). Dn is the average casualty rate of multiple flash floods if there is no flash flood warning in place (i.e., the casualty rate is dependent only on the natural variability). The casualty rate of each flash flood can be estimated by the following equation, Eq. (6).
The lower the value of Dr, the more effective the flash flood warning. If the objective of a flash flood warning is minimizing casualties, the optimal warning threshold is the threshold where the Dr is the lowest.
Besides Dr, MER and FWR are used to evaluate the performance of the flash flood warning. They are defined by Eqs. (7) and (8) as follows:
where OFN, OTP, and OFP are the total number of false negative, true positive, and false positive events, respectively.
3.1 Study area
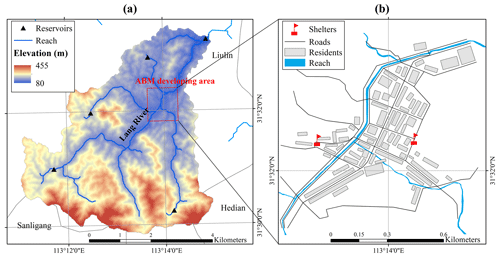
The town of Liulin located in Sui County, Hubei Province, China, was selected as our study area. The Lang River goes through Liulin as shown in Fig. 3a, and the red rectangle indicates the location of the town. The average annual rainfall is 1100 mm. Rainfall is unevenly distributed throughout the year and mainly concentrated from June to August. The upstream valley of Liulin is wider than that downstream. And this river geomorphology hinders flood discharge and easily causes a flash flood disaster when a rainfall occurs. Residences in the town are located on both sides of Lang River. In the prevention and control map of flash flood disasters in Sui County, two communities in Liulin are listed as high-risk and relatively high-risk areas. Extreme rainfall with a volume of 503 mm from 02:00 to 09:00 in UTC/GMT+8 on 12 August 2021 (hereafter called the 8.12 event) in particular caused a severe flash flood disaster in the town. Unfortunately, 21 people died, and four people are still missing after this disaster although flash flood warnings had been issued (Wei, 2021). Exploring ways to determine the threshold of issuing flash flood warnings in the town will provide valuable information on flash flood disaster prevention for reducing the casualties.
3.2 Setting of the ABM
To set up the environment of the ABM, the residences and road network (see Fig. 3) were imported into the model after processing a digital archive (i.e., World Imagery Wayback). To prevent evacuation across the river, two shelters were set up at high places on both sides of Lang River, and they should not be submerged by floods. The parameters of the ABM were set according to calibration, empirical data, and related literature (see Table 2). The lead times of the three stages of warning and evacuation depth threshold were parameterized from the 2-month surveying expertise and experience in the study area. The lead time of the rainstorm red warning is around 180 min in China, and here the lead time was set to 120 min as a conservative and unfavorable scenario. As people should immediately move to a shelter after receiving an immediate-evacuation warning, the lead time of the immediate-evacuation warning is related to the travel time of people to the shelter. The person farthest from the shelter needs about 25 min to travel to the shelter, so the lead time of the immediate-evacuation warning was set to 30 min. According to the lead times of the rainstorm red warning and immediate-evacuation warning, it was assumed that the lead time of the ready-to-evacuate warning was between the two, that is, 60 min. The three hyperparameters of the random forest model were calibrated by the empirical data from our survey. Sampling without replacement was conducted on the empirical data, and the sample was used to assign the initial SSC values of the agents. The random forest model calibration, the survey, and the method of assigning SSC values are detailed in Zhang et al. (2024). The values of θj and pj of the jth agent were sampled from the Gaussian distributions according to the exiting literature (Du et al., 2017). The setting of these two parameters aimed to reflect people's general behavior. βj=0.5 represents general and unbiased behavior that gives same weights to current flood information and past opinions on flood risk. And pj=0.1 means flood information being checked every 10 min. Sj=2 is set to indicate no decision-making on evacuation for the jth agent in the empirical data, while Sj>2 means the evacuation decision of the agent. Hence, the value of τ was set to 2. A global sensitivity analysis has been performed to explore the relative impacts of these parameters on the casualty rate and can be retrieved from Zhang et al. (2024).
Table 2Fixed ABM parameters.
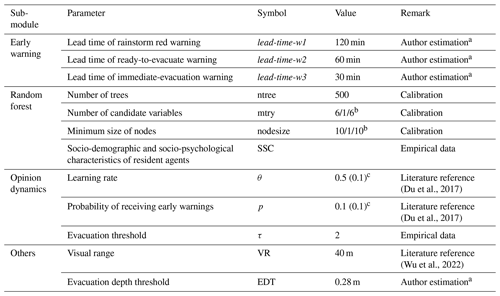
a These estimations are from the 2-month surveying expertise and experience of the authors in the study area. b indicates the values of the factors are x1, x2, and x3 for the rainstorm red, the ready-to-evacuate, and the immediate-evacuation warnings, respectively. c x1 (x2) indicates the values of the factors are sampled from a normal distribution with a mean value of x1 and variance of x2.
The flood module of the ABM was formed by a two-dimensional (2D) hydrodynamic model in the Lang River basin through HEC-RAS. Terrain information was obtained from the digital elevation model (DEM) at a spatial resolution of 12.5 m provided by the Advanced Land Observing Satellite (ALOS). Cells with a size of 30 m were generated within the 2D flow areas. Manning's coefficient was set to a unified comprehensive value of 0.045. The upstream boundary condition was set to be the rainfall process. The hyetograph was selected by the measured rainfall process of the 8.12 event. Specifically, the hourly rainfall was greater than 30.0 mm from 02:00 to 07:00 in UTC/GMT+8 on 11 August 2021 and the 6 h rainfall reached up to 462.6 mm (see Fig. 4). The 6 h rainfall process was input into HEC-RAS as the hyetograph. As the Baiguo River reservoir is in the outlet, the downstream boundary condition was set to the normal water level of the reservoir. The spatiotemporal changes in the depth and velocity of flash floods were exported after running the model at a temporal interval of 2 min and spatial resolution of 12.5 m. It should be noted that the hyetograph was selected as the measured rainfall process of the 8.12 event. More uneven hyetographs should be made in flash flood simulations, and the impact of a hyetograph on warning threshold determination can be explored in further research.
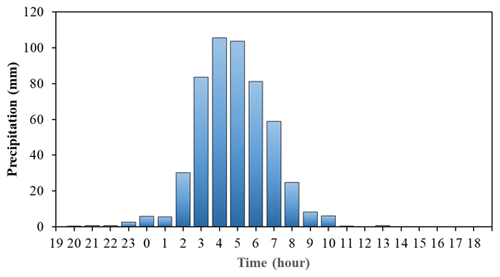
Figure 4The rainfall process from 19:00 on 11 August to 19:00 on 12 August 2021 of Liulin Meteorological Station in UTC/GMT+8.
The ABM was run by covering the processes from issuing warnings to the flash flood at a time step of 1 min and spatial resolution of 9.6 m, and 500 agents were assumed to be involved in the simulations. Due to the inherent randomness of the ABM, the averages of the outputs from 1000 runs of the ABM were obtained to ensure stable outputs.
3.3 Rainfall data
A series of rainfall data was imported into the ABM for simulating a series of possible flash flood disasters. First, synthetic rainfall series were generated to ensure a representative overview of these extreme events. The annual maximum 6 h rainfall, P, was assumed to follow the Pearson III distribution. Its mean and Cv values in the basin above Liulin were estimated to be 80 mm and 0.6, respectively, according to the Atlas of Statistical Parameters of rainfall in Hubei Province (2008). was taken to be 3.5 in Hubei Province. A total of 1000 synthetic rainfall events were randomly generated by the Pearson III distribution, and the result is shown in Fig. 5. Second, a rainfall event in the synthetic rainfall events was input into the flood module of ABM and then converted into a flash flood event. According to the flash flood event, the degree of the flash flood disaster was estimated, and people's attitudes towards the corresponding warning were recorded. People's attitudes can influence subsequent warning response processes. Then, the next rainfall event in the synthetic rainfall events was input into the ABM, and the above simulation process was repeated.
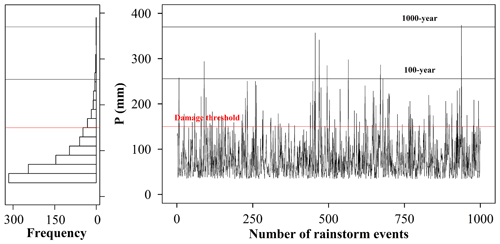
Figure 5An illustration of 1000 synthetic series of rainfall events (right). Histogram of the statistical results of the synthetic rainfall events. The three horizontal lines from top to bottom represent the rainfall for the 1000-year return period, 100-year return period, and triggering disasters, respectively.
3.4 Model test experiments
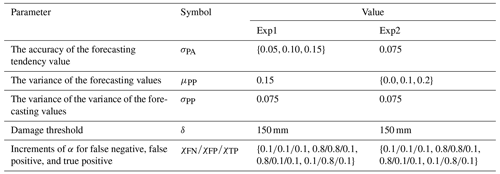
The impact of forecasting skills on warning threshold determination can be explored by setting different values of σPA, μPP, and σPP. In real-world flood warning scenarios, these three parameters can be estimated by statistical methods, such as the moment estimation method and maximum likelihood estimation method. Specifically, the actual rainfall and the corresponding probability forecasting results in history can be collected with a certain forecasting skill. Each rainstorm event is taken as a sample, and the observed rainfall, the median value of probability forecasted rainfall, and the variance of probability distribution for the rainstorm event are estimated. By collecting multiple rainstorm events, these three parameters can be estimated using statistical methods for a certain forecasting skill. As we aim to examine the uncertainties in flash flood forecasting that affect the determination of warning thresholds in this study, three possible values of each of the three parameters (i.e., σPA, μPP, and σPP) were prepared to reflect different forecasting skills (see Table 3), and their interactive effects on the determination of the warning threshold were tested.
The rainstorm red warning is the highest level of meteorological risk warning in mainland China. When the rainstorm red warning is issued, floods tend to cause damage, and the residents in flood risk area are advised to evacuate (Wang et al., 2020). If the 6 h rainfall reaches up to 150 mm, the rainstorm red warning is issued (Shanghai Meteorological Bureau, 2019). Thus, the value of δ was taken to be 150 mm in the case study.
Table 3Model test experiment for determining the warning threshold with different forecasting skills.

Besides the uncertainties in the forecasting, there are uncertainties in people's response processes to the uncertain forecasting. To determine the warning threshold with different forecasting skills and tolerance levels to the failed warnings, the warning threshold was determined with different σPA values and combinations of parameters related to the increments of α (i.e., χFN, χFP, and χTP) through Exp1 in Table 4 and with different values of μPP and combinations of parameters related to the increments of α through Exp2 in Table 4. The higher the χFN and χFP, the lower the tolerance levels of people to the missed event and the false warnings, respectively.
4.1 The casualty rate from people's response process simulation
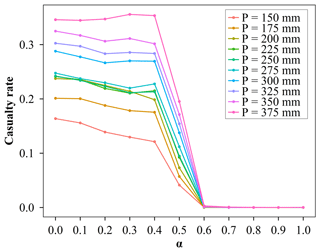
To determine the warning threshold based on people's response process simulation, the ABM with different values of P and α was run to generate corresponding casualty rates, and these simulations were taken as sample data to train the GP emulation as a surrogate model of the ABM as shown in Fig. 6. And it has shown the variation in the casualty rate with α with different values of P. There are three stages of change in the casualty rate as α increases regardless of P. When α increases from 0.0 to 0.4, the casualty rate slowly decreases, but as α continues to increase to 0.6, the rate of decline becomes faster. When α is greater than or equal to 0.6, everyone arrives at the shelters before the flash flood disaster arrives, and there are no casualties regardless of P. This result implies that it is very important and effective to enhance people's trust levels in the warnings when people have similar trust levels in warning information and their neighbors. When people's trust in warning information decreases, their evacuation decisions become more dependent on whether their neighbors are evacuating or not. In other words, the increase in the overall evacuation intention (S) of agents requires their neighbors to take evacuation actions. However, taking evacuation actions requires the increase in S in turn. Thus, waiting for others' evacuation ultimately leads to neither an increase in S nor the implementation of evacuation actions.
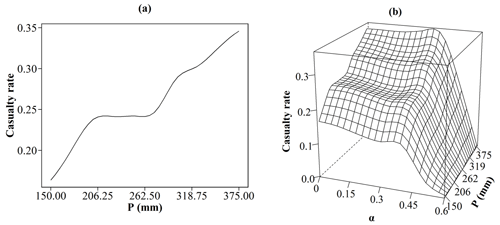
Because the casualty rate is zero when α is greater than or equal to 0.6 regardless of P, the one-parameter and two-parameter GP emulations were trained for α with a value of less than 0.6, and the results are shown in Fig. 7. The training result for one-parameter GP emulation shows that there are also three stages in the increase in the casualty rate as P increases. When P increases from 150 to 200 mm, the casualty rate increases, but if P increases from 200 to 260 mm, the casualty rate remains almost unchanged. When P exceeds 260 mm and continues to increase, the casualty rate starts to increase again. This result indicates that there is spatial heterogeneity of flood risk levels in the case study. It is necessary to classify flood risk zones and distinguish water level or rainfall thresholds for triggering evacuation according to different flood risk levels. The training result for two-parameter GP emulation shows the complex responses of the casualty rate to changes in α and P. When α is lower than 0.4, there are three stages of changes in the casualty rate as P increases. As α increases from 0.4 to 0.6, the relationship between P and the casualty rate tends to be linearly positive, and the difference in casualty rates with a different values of P gradually reduces. This result means that the trust level in the warnings becomes the dominant factor in determining the casualty rate when people's trust levels in the warnings and their neighbors are similar (i.e., when the value of α is the range of 0.4 to 0.6).
4.2 Determining the warning threshold with different forecasting skills for minimizing casualties
To determine the warning threshold with different forecasting skills for minimizing casualties, 250-member Monte Carlo simulations were performed on the simulation chain of rainstorm probability forecasting–decision on issuing warnings–warning response processes by randomly perturbing the warning threshold, λ, with different values of parameters controlling the forecasting skills (see Fig. 8). Different rows represent different values of μPP, and there is a larger forecasting variance in the sub-graph of the lower row. Similarly, there is a larger variance in forecasting variance in the sub-graph of the right column compared to the sub-graph of the left column. The highest forecasting accuracy is represented by the green curves followed by the yellow curves and finally the red curves. In all the sub-graphs, there is the highest relative casualty rate in the red curves followed by the yellow curves and finally the green curves. Therefore, the lower the forecasting accuracy, the higher the relative casualty rate. The optimal warning threshold can be taken to be the value of λ where the relative casualty rate, Dr, is the lowest. The optimal warning thresholds are the lowest in the green curves followed by the yellow curves and finally the red curves in all the sub-graphs. Thus, the lower the forecasting accuracy, the higher the optimal warning threshold. The reasons can be found in Fig. 9. As the warning threshold decreases, the number of false warnings and successful warnings increases, and more warnings are issued. However, if forecasting accuracy is low, the proportion of false warnings is higher than that of successful warnings among the additional warnings issued. For example, as the warning threshold decreases, the green curve for low forecasting accuracy rises faster than that for high forecasting accuracy. This means that if the forecasting accuracy is low, as the warning threshold decreases, the increase speed of false warnings is higher than that of successful warnings. In addition, when the warning threshold is lower than 0.7, the green curve begins to rise rapidly for σPA=0.15, while it does not start to rise rapidly until the warning threshold is lower than 0.5 for σPA=0.15. Therefore, when forecasting accuracy is low, a high warning threshold should be set. As forecasting accuracy increases, lowering the warning threshold can result in more successful warnings without significantly increasing false warnings, thereby improving the effectiveness of flash flood warnings.
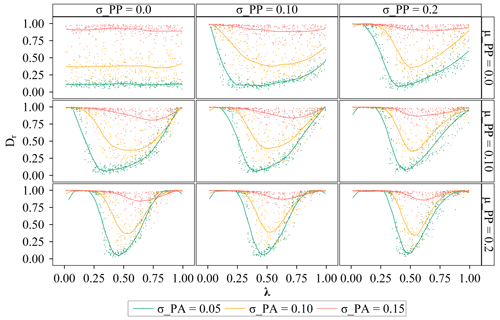
Figure 8The relationship between the relative casual rate, Dr, and the warning threshold, λ, with different values of σPA, μPP, and σPP. Different rows and columns represent different values of μPP and σPP, respectively. Different colors represent different values of σPA. Each dot shows the result of the individual Monte Carlo simulation.
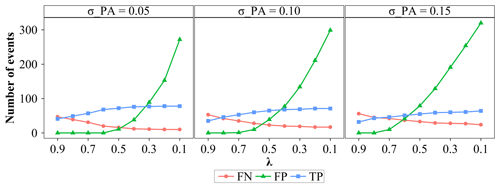
Figure 9The changes in the number of false negative, false positive, and true positive events as warning threshold, λ, decreases with different values of σPA. The range of λ is reversed from 0.9 to 0.1.
In terms of the impacts of forecasting variance (see Fig. 8), there is a larger forecasting variance and a higher relative casualty rate of three colored curves in the sub-graph of the lower row. Thus, the larger the forecasting variance, the higher the relative casualty rate. For the optimal warning threshold, the differences in the optimal warning thresholds of these three colored curves are smaller in the sub-graph of the lower row. For instance, as forecasting variance increases, the optimal warning thresholds for the red curves decrease, while the optimal warning thresholds for the green curves increase. This result means that the larger the forecasting variance, the lower the optimal warning threshold for low forecasting accuracy, while the larger the forecasting variance, the higher the optimal warning threshold for high forecasting accuracy. When forecasting accuracy is at a low level, a large forecasting variance is actually beneficial for improving the forecasting skills. High forecasting skill means that more successful warnings and fewer false warnings are issued after lowering the warning threshold. Therefore, if forecasting accuracy is at a low level, as forecasting variance increases, the warning threshold can be lowered. On the contrary, if forecasting accuracy is at a high level, as forecasting variance increases, increasing the warning threshold can significantly decrease the false warnings and improve the effectiveness of flash flood warnings. Finally, we focused on the impacts of the variance of the forecasting variance. Similarly to the impacts of forecasting variance, the larger the variance of the forecasting variance, the higher the relative casualty rate. As the variance of the forecasting variance increases, the optimal warning threshold tends to decrease for low forecasting accuracy or to increase for high forecasting accuracy.
The impacts of the three parameters (i.e., σPA, μPP, and σPP) on the shape of the relationship curve between Dr and λ can be analyzed as follows. As shown in Fig. 8, σPA determines the height of the curve, while μPP and σPP determine the width of the curve. Specifically, as forecasting accuracy increases, the stationary point of the curve moves down, and the curve becomes higher; as the forecasting variance or the variance of the forecasting variance increases, the curve becomes narrower. If forecasting accuracy is high and the forecasting variance and the variance of the forecasting variance are large, the curve will become high and narrow, such as the green curve for μPP=0.2 and σPP=0.2. And there is only a low relative casualty rate near the optimal warning threshold in this green curve. Thus, it is more important to determine the optimal warning threshold for minimizing casualties if forecasting accuracy is higher, and forecasting variance and the variance of the forecasting variance are larger.
4.3 Determining the warning threshold with different forecasting skills and tolerance levels to the failed warnings for minimizing casualties
To determine the warning threshold with different forecasting skills and tolerance levels to the failed warnings for minimizing casualties, the simulation chain of rainstorm probability forecasting–decision on issuing warnings–warning response processes was run with random values of λ with different values of σPA and combinations of parameters related to the increments of α (i.e., χFN, χFP, and χTP) (see Fig. 10), and different values of μPP and combinations of parameters related to the increments of α (i.e., χFN, χFP, and χTP) (see Fig. 11). Owing to the similar roles of μPP and σPP, the effects of σPP on the determination of warning threshold were not explored here. As shown in Fig. 10, the optimal warning thresholds for the yellow curves are the lowest. The yellow curves represent scenarios where people's trust in warnings is sensitive to false negative events and people have a low tolerance level to the missed events. To reduce the missed-event ratio, the warning threshold should be lowered (see Fig. 10g). Therefore, the warning threshold should be lowered for increasing people's trust levels in warnings and reducing casualties if people have a lower tolerance level to missed events. Similarly, the warning threshold should be increased if people's tolerance levels to the false warnings become lower (see the red curves). And if people's tolerance to both missed events and false warnings decreases to the same level, the optimal warning threshold remains almost unchanged, but the relative casualty rate increases overall (see the blue curves). As for the relative casualty rate, the relative casualty rates of the yellow curves are lower than those of the red curves. This result suggests that compared to the missed events, people's low tolerance levels to false warnings are less conducive to the effectiveness of flash flood warnings. As shown in Fig. 9, the number of false warnings is greater than the number of missed events in general. Therefore, if people's tolerance levels to the false warnings is low, their trust levels in warnings are more likely to decrease, leading to the cry wolf effect.
By comparing Fig. 10a and b, it is evident that the overall height of the curves decreases when forecasting accuracy decreases as discussed in the last paragraph of Sect. 4.2. However, compared to the green curve, the heights of other curves decrease more significantly. And the relative casualty rates are high at any warning threshold (i.e., Dr>0.75) except for the green curve when σPA increases from 0.05 to 0.1. It is more pronounced when σPA further increases to 0.15. Therefore, as forecasting accuracy decreases, the benefits gained by adjusting the warning threshold based on people's tolerance levels to failed warnings decreases. In other words, no matter how the warning threshold is adjusted, the relative casualty rate is high, and the effectiveness of the warning is at a low level.
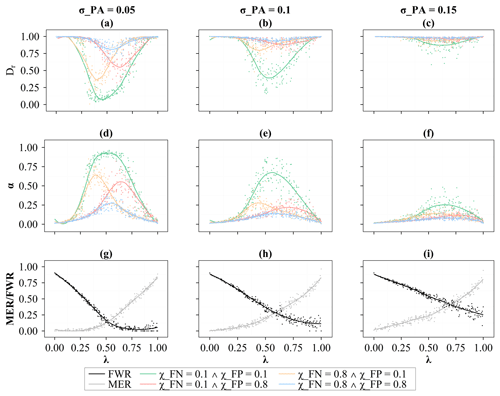
Figure 10(a–c) The relationship between the warning threshold, λ, and the relative casualty rate, Dr, with different values of σPA and combinations of parameters related to the increments of α (i.e., χFN, χFP, and χTP). (d–f) Same as (a)–(c) but for time-averaged α. (g–i) The relationship between the warning threshold, λ, and the false-warning ratio, FWR, and the missed-event ratio, MER, with different values of σPA. Each dot shows the result of the individual Monte Carlo simulation.
In terms of the effects of forecasting variance and tolerance levels to the failed warnings on the determination of the warning threshold as shown in Fig. 11, the warning threshold should be decreased if people have a lower tolerance level to the missed events and vice versa. And compared to the missed events, people's low tolerance levels to the false warnings are less conducive to the effectiveness of flash flood warnings. These findings are consistent with the results in Fig. 10. Furthermore, we find that the difference in the optimal warning thresholds of these colored curves decreases as the forecasting variance increases as shown in Fig. 11a–c. As discussed in the last paragraph of Sect. 4.2, the curve becomes narrower as the forecasting variance increases. If the width of the curves decreases, the difference between their optimal warning thresholds will also decrease. Therefore, as forecasting variance increases, the difference in the optimal warning thresholds of these curves will decrease, and the adjustment space for the warning threshold based on people's tolerance levels will also decrease.
If the green curve represents the result of the baseline scenario where both χFN and χFP equal 0.1, an increment of the values of χFN and χFP (i.e., lowering tolerance levels to the missed events and the false warnings) will result in a series of curves, and these curves will be enveloped by the green curve in Fig. 11. Therefore, only when the green curve is high enough can the relative casualty rate of this series of curves be low enough and the effectiveness of flash flood warnings be sufficiently improved. And only when the green curve is wide enough can the difference in the optimal warning threshold for this series of curves be large enough and there be enough room for the adjustment of the warning threshold. In summary, by increasing the height and width of the green curve, the room for adjustment for the warning threshold will be larger and the effectiveness of flash flood warnings improved. As forecasting accuracy increases, the green curve becomes higher. And as forecasting variance decreases, the green curve becomes wider. Therefore, with the premise of improving forecasting skills (i.e., increasing forecasting accuracy and decreasing forecasting variance), adjusting the warning threshold based on people's tolerance levels to the failed warnings is one of the ways to improve the effectiveness of flash flood warnings.
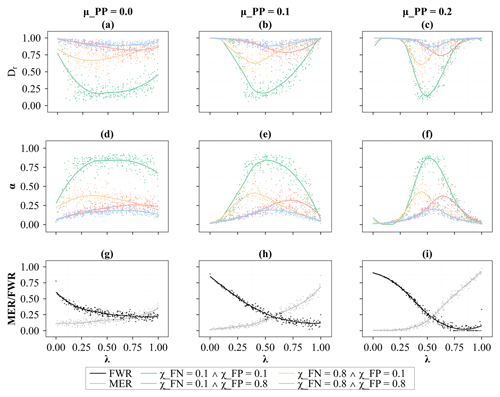
Figure 11(a–c) The relationship between the warning threshold, λ, and the relative casualty rate, Dr, with different μPP and combinations of parameters related to the increments of α (i.e., χFN, χFP, and χTP). (d–f) Same as (a)–(c) but for time-averaged α. (g–i) The relationship between the warning threshold, λ, and the false-warning ratio, FWR, and the missed-event ratio, MER, with different μPP. Each dot shows the result of the individual Monte Carlo simulation.
4.4 Implication and limitations
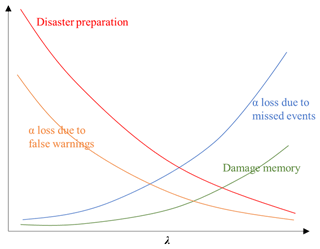
Although the simulation results have deepened our understanding of the warning threshold determination, especially of the impact of forecasting skills and people's tolerance levels to the failed warnings on the warning threshold determination, the simulation results should be carefully interpreted due to the assumptions underlying the simulation method. As highlighted in the simulation results, the warning threshold should be appropriately determined due to the trade-off between multiple factors affecting the warning threshold (see Fig. 12). Specifically, as the warning threshold increases, the number of missed events and the loss of α due to missed events will increase. And as the missed events increase, the level of disaster preparedness will decrease. The loss of α and the low level of disaster preparedness are not conducive to reducing disaster damage. However, as the warning threshold increases, the number of false warnings and the loss of α due to false warnings will decrease, which is conducive to reducing disaster damage. Therefore, there is a trade-off in the warning threshold determination. However, it has been assumed that the experience of warnings (i.e., the success or failure of past warnings) only affects people's trust levels in warnings (i.e., α). Actually, the experience of warnings can also affect people's attitudes and behavior towards flash floods. Specifically, the dangerous experiences on the property/life losses can form deep flash flood memories. Memories of damage make people more inclined to evacuate after receiving warnings (Cuite et al., 2017; Morss et al., 2018). The higher the warning threshold, the more missed events and dangerous experiences there will be, and people's damage memories will be more profound. The profound damage memories increase people's evacuation intention and reduce disaster damage. Therefore, if combined with the dynamism of human behavior, there can still be a trade-off of the warning threshold determination, but the optimal warning threshold will increase.
The development of the ABM is the core of the simulation flow. The simulation results based on the ABM show that there is a monotonic positive relationship between α and the casualty rate (see Fig. 7). The rationale behind the monotonic relationship is that the higher the value of α, the more likely a person is to evacuate after receiving a warning. If someone has evacuated, they will lead more people to evacuate because neighbor behavior is an important information source for a person to make evacuation decisions. The developed ABM generalizes these two information sources (i.e., warning information and neighbor behavior) to simulate the processes of people's evacuation decision-making. However, environmental cues (e.g., rainfall condition) are also a source of information (Lindell et al., 2019). The monotonic positive correlation relationship between α and the casualty rate may no longer hold true if the environmental cue is incorporated into the ABM. For example, if there is a flash flood disaster, but no warning is issued, our ABM assumes that no one will evacuate. In fact, if people observe rainfall that may lead to flash flood disasters, they will evacuate even if no warning is issued. The high trust levels in warnings (α) may have suppressed their evacuation intention, leading to a higher casualty rate instead. If the monotonic positive correlation relationship between α and the casualty rate no longer holds true, the curve shape in Fig. 8 will no longer be unimodal, and the determination of the optimal warning threshold will become more complex.
The ABM was applied to the town of Liulin, where residences are located along Lang River and listed as high-risk and relatively high-risk areas. If there is a flash flood disaster, the whole town along the river is likely to be submerged, and all people are required to evacuate. Therefore, the modeling region with an area of 0.28 km2 is set to receive forecasting and warnings as a whole. However, if the study region is large and terrain is complex, the study region needs to be divided into multiple sub-regions and then modeled by the ABM accordingly. For each sub-region, forecasting and warnings also need to be produced and issued separately. However, in the real world, there is usually a lack of clarity of the sub-region impact of some of the warnings owing to the limitation of forecasting skills. Forecasting and warning often only target a certain region and have difficulty distinguishing between the different degrees of impact within that region (Roberts et al., 2022). Given a unified forecast and warning for a region, the sub-region along a river or in high-risk areas is prone to missed events, while the sub-region located on higher ground is prone to false warnings. If it is difficult to improve forecasting skills, modifying people's tolerance levels to the failed warnings will become one of the ways to improve the effectiveness of warnings. For example, education or risk communication can be conducted to inform residents of the background and production process of warning information, allowing them to understand the reasons for false warnings and missed events as well as the obstacles to eliminate these issues. Implementing targeted education or risk communication based on geographical location to adjust people's tolerance to corresponding types of failed warnings can compensate for the lack of accuracy in forecasting and warning.
It is tough work to verify the hydrodynamic simulation and people's evacuation process simulation in small watersheds due to the difficulty of collecting data. A field flood survey was used to verify the water depth simulated by HEC-RAS. The flood survey showed that the flood depth of high-rise houses was 1.75 m, while that of houses with low terrain was 3.85 m in the 8.12 event (Shaojun et al., 2022). The survey results are roughly consistent with our simulation. In further studies, technologies such as uncrewed aerial vehicles and radars can be used to obtain high-precision inundation data, and the simulation results can be finely verified based on the inundation data. For the verification of the evacuation processes simulated by the social sub-module in the ABM, indirect verification was conducted by investigating and simulating people's evacuation intention. To directly verify the evacuation process simulation, milling time (the time taken to make a decision and prepare) can be surveyed and then converted into data on the evacuation processes in further studies. Based on the data, the parameters of the social sub-module in the ABM can be calibrated and verified.
A method has been proposed to determine the warning threshold for minimizing casualties based on people's response process simulation. A process-based ABM was developed to simulate people's response processes to flash flood warnings. A simulation chain of rainstorm probability forecasting–decision on issuing warnings–warning response processes was conducted to determine the warning threshold based on the ABM. The main conclusions are as follows.
The casualty rate is jointly controlled by the warning information source and precipitation. If people's trust levels in official warnings are below a certain threshold, precipitation is the dominant factor in controlling the casualty rate. If people have a similar level of trust to official warnings and neighbor behaviors, the credibility of the warning information source is the dominant factor in controlling the casualty rate.
The warning threshold has been determined with different forecasting skills for minimizing casualties. The lower the forecasting accuracy, the higher the optimal warning threshold, and the larger the forecasting variance or the variance of the forecasting variance, the higher (lower) the optimal warning threshold for high (low) forecasting accuracy. Furthermore, the impact pattern of forecasting skills on the shape of the relationship curve between the relative casualty rate and the warning threshold has been revealed: the curve becomes more pronounced as forecasting accuracy increases, and the curve becomes narrower as forecasting variance or the variance of the forecasting variance increases.
The warning threshold has been determined with different forecasting skills and tolerance levels to the failed warnings for minimizing casualties. The warning threshold should be decreased (increased) if people have a lower tolerance level to the missed events (the false warnings). However, if forecasting accuracy is low and forecasting variance is large, the space for adjusting the warning threshold is limited, and no matter how the warning threshold is adjusted, the casualty rate remains at a high level, and the effectiveness of flash flood warnings is limited. Therefore, under the premise of improving the forecasting skills, adjusting the warning threshold based on people's tolerance levels to the failed warnings is one of the ways to improve the effectiveness of flash flood warnings.
The code that supports the findings of this study is available from the corresponding author upon reasonable request.
Data will be made available on request.
RZ: conceptualization, formal analysis, methodology, writing (original draft), visualization, and funding acquisition. DL: conceptualization, data curation, formal analysis, funding acquisition, methodology, supervision, and writing (review and editing). LX: project administration and supervision. JC: data support, methodology, and writing (review and editing). HC: validation, writing (review and editing), and supervision. JY: validation and writing (review and editing). All authors contributed to the interpretation of the results and to the text.
The contact author has declared that none of the authors has any competing interests.
Publisher’s note: Copernicus Publications remains neutral with regard to jurisdictional claims made in the text, published maps, institutional affiliations, or any other geographical representation in this paper. While Copernicus Publications makes every effort to include appropriate place names, the final responsibility lies with the authors.
The authors gratefully acknowledge the financial support from National Key Research and Development Project of China (grant no. 2022YFC3202803); the National Natural Science Foundation of China (grant no. 52379022); and the Open Innovation Foundation funded by Changjiang Survey, Planning, Design and Research Co., Ltd (grant no. CX2021K04). The authors gratefully acknowledge the two anonymous reviewers for their valuable comments on improving the paper.
This research has been supported by the National Key Research and Development Project of China (grant no. 2022YFC3202803); the National Natural Science Foundation of China (grant no. 52379022); and the Open Innovation Foundation funded by Changjiang Survey, Planning, Design and Research Co., Ltd (grant no. CX2021K04).
This paper was edited by Yue-Ping Xu and reviewed by two anonymous referees.
Ambühl, J.: Customer oriented warning systems, Veröffentlichung Meteoschweiz Nr. 84, 1–86, https://www.meteosvizzera.admin.ch/dam/jcr:74b518b0-e768-4b06-b6bb-d8dd2286e066/veroeff84.pdf (last access: 3 December 2024), 2010.
Anshuka, A., van Ogtrop, F. F., Sanderson, D., and Leao, S. Z.: A systematic review of agent-based model for flood risk management and assessment using the ODD protocol, Nat. Hazards, 112, 2739–2771, 2022.
Bodoque, J. M., Diez-Herrero, A., Amerigo, M., Garcia, J. A., and Olcina, J.: Enhancing flash flood risk perception and awareness of mitigation actions through risk communication: A pre-post survey design, J. Hydrol., 568, 769–779, 2019.
Boelee, L., Lumbroso, D. M., Samuels, P. G., and Cloke, H. L.: Estimation of uncertainty in flood forecasts-A comparison of methods, J. Flood Risk Manag., 12, e12516, https://doi.org/10.1111/jfr3.12516, 2019.
Borga, M., Comiti, F., Ruin, I., and Marra, F.: Forensic analysis of flash flood response, WIREs Water, 6, e1338, https://doi.org/10.1002/wat2.1338, 2019.
Brazdova, M. and Riha, J.: A simple model for the estimation of the number of fatalities due to floods in central Europe, Nat. Hazards Earth Syst. Sci., 14, 1663–1676, https://doi.org/10.5194/nhess-14-1663-2014, 2014.
Cheng, W.: A review of rainfall thresholds for triggering flash floods, Adv. Water Sci., 24, 901–908, 2013.
Coccia, G. and Todini, E.: Recent developments in predictive uncertainty assessment based on the model conditional processor approach, Hydrol. Earth Syst. Sci., 15, 3253–3274, https://doi.org/10.5194/hess-15-3253-2011, 2011.
Collier, C. G.: Flash flood forecasting: What are the limits of predictability?, Q. J. Roy. Meteor. Soc., 133, 3–23, 2007.
Confalonieri, R., Bellocchi, G., Bregaglio, S., Donatelli, M., and Acutis, M.: Comparison of sensitivity analysis techniques: A case study with the rice model WARM, Ecol. Model., 221, 1897–1906, 2010.
Cools, J., Innocenti, D., and O'Brien, S.: Lessons from flood early warning systems, Environ. Sci. Policy, 58, 117–122, 2016.
Creutin, J. D., Borga, M., Lutoff, C., Scolobig, A., Ruin, I., and Créton-Cazanave, L.: Catchment dynamics and social response during flash floods: the potential of radar rainfall monitoring for warning procedures, Meteorol. Appl., 16, 115–125, 2009.
Cuite, C. L., Shwom, R. L., Hallman, W. K., Morss, R. E., and Demuth, J. L.: Improving coastal storm evacuation messages, Weather Clim. Soc., 9, 155–170, 2017.
Du, E., Cai, X., Sun, Z., and Minsker, B.: Exploring the role of social media and individual behaviors in flood evacuation processes: an agent-based modeling approach, Water Resour. Res., 53, 9164–9180, 2017.
Du, E., Wu, F., Jiang, H., Guo, N., Tian, Y., and Zheng, C.: Development of an integrated socio-hydrological modeling framework for assessing the impacts of shelter location arrangement and human behaviors on flood evacuation processes, Hydrol. Earth Syst. Sci., 27, 1607–1626, https://doi.org/10.5194/hess-27-1607-2023, 2023.
Duc Anh, D., Kim, D., Kim, S., and Park, J.: Determination of flood-inducing rainfall and runoff for highly urbanized area based on high-resolution radar-gauge composite rainfall data and flooded area GIS data, J. Hydrol., 584, 124704, 2020.
Han, S. S. and Coulibaly, P.: Bayesian flood forecasting methods: A review, J. Hydrol., 551, 340–351, 2017.
Hicks, F. E. and Peacock, T.: Suitability of HEC-RAS for flood forecasting, Can. Water Resour. J., 30, 159–174, 2005.
Janssen, M. A. and Ostrom, E.: Empirically based, agent-based models, Ecol. Soc., 11, 37, https://www.jstor.org/stable/26265994 (last access: 3 December 2024), 2006.
Jauernic, S. T. and Van den Broeke, M. S.: Tornado warning response and perceptions among undergraduates in Nebraska, Weather Clim. Soc., 9, 125–139, 2017.
Ke, Q., Tian, X., Bricker, J., Tian, Z., Guan, G., Cai, H., Huang, X., Yang, H., and Liu, J.: Urban pluvial flooding prediction by machine learning approaches-a case study of Shenzhen city, China, Adv. Water Resour., 145, 103719, https://doi.org/10.1016/j.advwatres.2020.103719, 2020.
Krzysztofowicz, R.: The case for probabilistic forecasting in hydrology, J. Hydrol., 249, 2–9, 2001.
LeClerc, J. and Joslyn, S.: The cry wolf effect and weather-related decision making, Risk Anal., 35, 385–395, 2015.
Lei, X., Wang, H., Liao, W., Yang, M., and Gui, Z.: Advances in hydro-meteorological forecast under changing environment, J. Hydraul. Eng., 49, 9–18, 2018.
Lim, J. R., Liu, B. F., and Egnoto, M.: Cry wolf effect? evaluating the impact of false alarms on public responses to tornado alerts in the southeastern United States, Weather Clim. Soc., 11, 549–563, 2019.
Lindell, M. K., Arlikatti, S., and Huang, S. K.: Immediate behavioral response to the June 17, 2013 flash floods in Uttarakhand, North India, Int. J. Disaster Risk Reduct., 34, 129–146, 2019.
Lo, S. M., Fang, Z., Lin, P., and Zhi, G. S.: An evacuation model: the SGEM package, Fire Saf. J., 39, 169–190, 2004.
Maidment, D. R.: Conceptual framework for the national flood interoperability experiment, J. Am. Water Resour. Assoc., 53, 245–257, 2017.
Mileti, D. S.: Factors related to flood warning response, U.S.-Italy Research Workshop on the Hydrometeorology, Impacts, and Management of Extreme Floods, November 1995, Perugia, Italy, 1–17, 1995.
Morss, R. E., Cuite, C. L., Demuth, J. L., Hallman, W. K., and Shwom, R. L.: Is storm surge scary? The influence of hazard, impact, and fear-based messages and individual differences on responses to hurricane risks in the USA, Int. J. Disaster Risk Reduct., 30, 44–58, 2018.
Oakley, J. E. and O'Hagan, A.: Probabilistic sensitivity analysis of complex models: a Bayesian approach, J. R. Stat. Soc. Ser. B-Stat. Methodol., 66, 751–769, 2004.
O'Hagan, A.: Bayesian analysis of computer code outputs: A tutorial, Reliab. Eng. Syst. Safe, 91, 1290–1300, 2006.
Oleyiblo, J. O. and Li, Z.: Application of HEC-HMS for flood forecasting in Misai and Wan'an catchments in China, Water Sci. Eng., 3, 14–22, 2010.
Papagiannaki, K., Petrucci, O., Diakakis, M., Kotroni, V., Aceto, L., Bianchi, C., Brázdil, R., Gelabert, M. G., Inbar, M., Kahraman, A., Kiliç, Ö., Krahn, A., Kreibich, H., Llasat, M. C., Llasat-Botija, M., Macdonald, N., de Brito, M. M., Mercuri, M., Pereira, S., Rehor, J., Geli, J. R., Salvati, P., Vinet, F., and Zêzere, J. L.: Developing a large-scale dataset of flood fatalities for territories in the Euro-Mediterranean region, FFEM-DB, Sci. Data, 9, 166, https://doi.org/10.1038/s41597-022-01273-x, 2022.
Parker, D. J., Priest, S. J., and Tapsell, S. M.: Understanding and enhancing the public's behavioural response to flood warning information, Meteorol. Appl., 16, 103–114, 2009.
Penning-Rowsell, E., Floyd, P., Ramsbottom, D., and Surendran, S.: Estimating injury and loss of life in floods: A deterministic framework, Nat. Hazards, 36, 43–64, 2005.
Petrucci, O.: Review article: Factors leading to the occurrence of flood fatalities: a systematic review of research papers published between 2010 and 2020, Nat. Hazards Earth Syst. Sci., 22, 71–83, https://doi.org/10.5194/nhess-22-71-2022, 2022.
Petrucci, O., Aceto, L., Bianchi, C., Bigot, V., Brázdil, R., Pereira, S., Kahraman, A., Kiliç, Ö., Kotroni, V., Llasat, M. C., Llasat-Botija, M., Papagiannaki, K., Pasqua, A. A., Rehor, J., Geli, J. R., Salvati, P., Vinet, F., and Zêzere, J. L.: Flood Fatalities in Europe, 1980–2018: Variability, Features, and Lessons to Learn, Water, 11, 1682, https://doi.org/10.3390/w11081682, 2019.
Potter, S., Harrison, S., and Kreft, P.: The benefits and challenges of implementing impact-based severe weather warning systems: perspectives of weather, flood, and emergency management personnel, Weather Clim. Soc., 13, 303–314, 2021.
Ramos Filho, G. M., Rabelo Coelho, V. H., Freitas, E. D. S., Xuan, Y., and Neves Almeida, C. S.: An improved rainfall-threshold approach for robust prediction and warning of flood and flash flood hazards, Nat. Hazards, 105, 2409–2429, 2021.
Ripberger, J. T., Silva, C. L., Jenkins-Smith, H. C., Carlson, D. E., James, M., and Herron, K. G.: False alarms and missed events: the impact and origins of perceived inaccuracy in tornado warning systems, Risk Anal., 35, 44–56, 2015.
Roberts, T., Seymour, V., Brooks, K., Thompson, R., Petrokofsky, C., O'Connell, E., and Landeg, O.: Stakeholder perspectives on extreme hot and cold weather alerts in England and the proposed move towards an impact-based approach, Environ. Sci. Policy, 136, 467–475, 2022.
Roulston, M. S. and Smith, L. A.: The Boy who Cried Wolf revisited: The impact of false alarm intolerance on cost-loss scenarios, Weather Forecast., 19, 391–397, 2004.
Salvati, P., Petrucci, O., Rossi, M., Bianchi, C., Pasqua, A. A., and Guzzetti, F.: Gender, age and circumstances analysis of flood and landslide fatalities in Italy, Sci. Total Environ., 610, 867–879, 2018.
Sawada, Y., Kanai, R., and Kotani, H.: Impact of cry wolf effects on social preparedness and the efficiency of flood early warning systems, Hydrol. Earth Syst. Sci., 26, 4265–4278, https://doi.org/10.5194/hess-26-4265-2022, 2022.
Shanghai Meteorological Bureau: Rainstorm warning signal, http://sh.cma.gov.cn/sh/news/yjjz/zhtqyj/201903/t20190329_243098.html (last access: 3 December 2024), 2019.
Shaojun, X., Yangsheng, J., Hao, J., Qiuju, L., Qi, X., Yi, L., Jun, Z., Feng, W., and Lingsheng, M.: Investigation and reflection on “2021.8.12” flood disaster in Liulin Town, Sui County, Hubei Province, China Flood & Drought Management, 32, 54–58, 2022.
Simmons, K. M. and Sutter, D.: False alarms, tornado warnings, and tornado casualties, Weather Clim. Soc., 1, 38–53, 2009.
Sivapalan, M. and Bloeschl, G.: Time scale interactions and the coevolution of humans and water, Water Resour. Res., 51, 6988–7022, 2015.
Slater, L., Villarini, G., Archfield, S., Faulkner, D., Lamb, R., Khouakhi, A., and Yin, J.: Global changes in 20-year, 50-year, and 100-year river floods, Geophys. Res. Lett., 48, e2020GL091824, https://doi.org/10.1029/2020GL091824, 2021.
Spitalar, M., Gourley, J. J., Lutoff, C., Kirstetter, P. E., Brilly, M., and Carr, N.: Analysis of flash flood parameters and human impacts in the US from 2006 to 2012, J. Hydrol., 519, 863–870, 2014.
Takahashi, S., Endoh, K., and Muro, Z. I.: Experimental study on people's safety against overtopping waves on breakwaters, Report on the Port and Harbour Institute, 34, 4–31, 1992.
Tekeli, A. E. and Fouli, H.: Reducing false flood warnings of trmm rain rates thresholds over Riyadh city, Saudi Arabia by utilizing AMSR-E soil moisture information, Water Resour. Manag., 31, 1243–1256, 2017.
Terti, G., Ruin, I., Anquetin, S., and Gourley, J. J.: A Situation-Based Analysis of Flash Flood Fatalities in the United States, B. Am. Meteorol. Soc., 98, 333–345, https://doi.org/10.1175/BAMS-D-15-00276.1, 2017.
Todini, E.: Flood Forecasting and Decision Making in the new Millennium. Where are We?, Water Resour. Manage., 31, 3111–3129, 2017.
Wang, L., Nie, R. H., Slater, L. J., Xu, Z. H., Guan, D. W., and Yang, Y. F.: Education can improve response to flash floods, Science, 377, 1391–1392, 2022.
Wang, Z. Q., Huang, J., Wang, H. M., Kang, J. L., and Cao, W. W.: Analysis of flood evacuation process in vulnerable community with mutual aid mechanism: an agent-based simulation framework, Int. J. Env. Res. Pub. He., 17, 560, https://doi.org/10.3390/ijerph17020560, 2020.
Wei, L.: Extreme heavy rainfall in Liulin Town, Suixian County, Hubei Province has resulted in 21 deaths and 4 missing persons, https://baijiahao.baidu.com/s?id=1707934363237110140&wfr=spider&for=pc (last access: 3 December 2024), 2021.
Wu, S., Lei, Y., Yang, S., Cui, P., and Jin, W.: An agent-based approach to integrate human dynamics into disaster risk management, Front. Earth Sci., 9, 818913, https://doi.org/10.3389/feart.2021.818913, 2022.
Yang, L. E., Scheffran, J., Suesser, D., Dawson, R., and Chen, Y. D.: Assessment of flood losses with household responses: agent-based simulation in an urban catchment area, Environ. Model. Assess., 23, 369–388, 2018.
Yin, J., Gao, Y., Chen, R., Yu, D., Wilby, R., Wright, N., Ge, Y., Bricker, J., Gong, H., and Guan, M.: Flash floods: why are more of them devastating the world's driest regions? Nature, 615, 212–215, 2023.
Young, A., Bhattacharya, B., and Zevenbergen, C.: A rainfall threshold-based approach to early warnings in urban data-scarce regions: A case study of pluvial flooding in Alexandria, Egypt, J. Flood Risk Manag., 14, e12702, https://doi.org/10.1111/jfr3.12702, 2021.
Younis, J., Anquetin, S., and Thielen, J.: The benefit of high-resolution operational weather forecasts for flash flood warning, Hydrol. Earth Syst. Sci., 12, 1039–1051, https://doi.org/10.5194/hess-12-1039-2008, 2008.
Zhai, X., Guo, L., Liu, R., and Zhang, Y.: Rainfall threshold determination for flash flood warning in mountainous catchments with consideration of antecedent soil moisture and rainfall pattern, Nat. Hazards, 94, 605–625, 2018.
Zhang, R., Liu, D., Du, E., Xiong, L., Chen, J., and Chen, H.: An agent-based model to simulate human responses to flash flood warnings for improving evacuation performance, J. Hydrol., 628, 130452, https://doi.org/10.1016/j.jhydrol.2023.130452, 2024.
Zhuo, L. and Han, D. W.: Agent-based modelling and flood risk management: A compendious literature review, J. Hydrol., 591, 125600, https://doi.org/10.1016/j.jhydrol.2020.125600, 2020.
The agent refers to the resident agent by default.


