the Creative Commons Attribution 4.0 License.
the Creative Commons Attribution 4.0 License.
Modeling water balance components of conifer species using the Noah-MP model in an eastern Mediterranean ecosystem
Mohsen Amini Fasakhodi
Hakan Djuma
Ioannis Sofokleous
Marinos Eliades
Adriana Bruggeman
Few studies have investigated the performance of land surface models for semiarid Mediterranean forests. This study aims to parameterize and test the performance of the Noah-MP land surface model for an eastern Mediterranean ecosystem. To this end, we calibrated the model for root zone soil moisture and transpiration of two conifer species, Pinus brutia, and Cupressus sempervirens, in a plantation forest on the Mediterranean island of Cyprus. The study area has a long-term average annual rainfall of 315 mm. Observations from 4 sap flow and 48 soil moisture sensors, for the period from December 2020 to June 2022, were used for model parameterization. A local sensitivity analysis found that the surface infiltration (REFKDT), hydraulic conductivity (SATDK), and stomatal resistance (RSMIN) parameters had the highest impacts on the water balance components (soil evaporation, tree transpiration, surface runoff, and drainage). The model performed better during the wetter 9-month validation period (379 mm rain) than during the drier 10-month calibration period (175 mm rain). Average soil moisture in the top 60 cm of the soil profile was reasonably well captured for both species (daily Nash–Sutcliffe efficiency > 0.80 for validation). Among the three soil layers, the second layer (20–40 cm) showed better simulation performance during both periods and for both species. The model exhibited limitations with respect to simulating transpiration, particularly during the drier calibration period. The inclusion of a root distribution function in the model, along with the monitoring of soil moisture below the 60 cm soil depth in the field, could improve the accuracy of model simulations in such water-limited ecosystems.
- Article
(7554 KB) - Full-text XML
- BibTeX
- EndNote
Evapotranspiration, which is a combination of evaporation from soil and vegetation and transpiration from vegetation, plays a crucial role in the terrestrial water cycle (Zhan et al., 2019) and is recognized as the most determinative component of the water balance in Mediterranean ecosystems (Corona and Montaldo, 2020). Evapotranspiration is controlled by atmospheric demand and water availability, which are, in turn, influenced by climate, vegetation, and soil conditions (Wang et al., 2015). Evapotranspiration is a key component of the hydrological cycle and the land surface energy balance and, globally, returns around 67 % of the precipitation to the atmosphere (Zhang et al., 2016). In Mediterranean pine forests, the fraction of precipitation that becomes evapotranspiration could amount to 90 % or even 100 % when trees extract water from deeper soil layers (Ungar et al., 2013). Hence, knowledge of forest water balances in semiarid regions and a better comprehension of its drivers are important for improving the performance of land surface models (Lu et al., 2022) and for developing sustainable land and water management policies in these regions (Vicente et al., 2018).
Pine forests form an important component of the Mediterranean landscape (Ganopoulos et al., 2013). Pinus brutia and Pinus halepensis forests cover more than 7×10⁶ ha around the Mediterranean Basin and perform important ecological and economic roles in low- to mid-elevation forests (Chambel et al., 2013). P. halepensis mainly occupies the most southern and western parts of the Mediterranean Basin, whereas P. brutia is confined to the eastern Mediterranean (Chambel et al., 2013). However, these two species are very similar and were historically considered to be two varieties of P. halepensis, although they were later recognized as distinct species based on morphological and biochemical differences (Boydak, 2004). In addition to the great ecological value of natural stands, these Mediterranean pines may provide a highly resilient forest cover under dry conditions for better rainfall infiltration, soil stabilization, and timber production (Chambel et al., 2013). Cupressus sempervirens (Mediterranean cypress) is another important native coniferous species in the eastern Mediterranean (Bagnoli et al., 2009). The species is widely distributed across the Mediterranean region and plays a significant role in the local ecosystem, economy, symbolism, and culture (Bagnoli et al., 2009). The beneficial ecosystem services provided by these species, such as mitigating the urban heat island effect, carbon sequestration, soil conservation, drought toleration, and habitat provision for wildlife, have been reported in many papers (e.g., Boydak, 2004; Kostopoulou et al., 2010; Helman et al., 2017a).
Although P. brutia and C. sempervirens have functional similarities in Mediterranean environments, their root systems differ significantly. Research by Rog et al. (2021) in a hot Mediterranean climate (510 mm annual rainfall) revealed that P. halepensis (similarities to P. brutia mentioned above) develops deep, extensive roots, accessing water from lower soil layers. In contrast, C. sempervirens has a shallower root system, potentially relying more on surface moisture. This study reported that P. halepensis roots were found throughout the shallow terra rossa soil (average depth 21 cm) and cracked limestone bedrock, while C. Sempervirens had fewer roots in bedrock. These findings about P. halepensis align with the P. brutia observations of Eliades et al. (2018). They studied a homogeneous P. brutia forest in Cyprus' Troodos Mountains, which are characterized by shallow soil, fractured bedrock, and a 425 mm average annual rainfall. They discovered that these trees' root systems extend horizontally up to 10 m and frequently grow within bedrock fractures. A study by Ares and Peinemann (1992) examined the fine-roots quantity and vertical distribution in 12 coniferous plots, including 4 stands of P. halepensis and 2 stands of C. sempervirens. The study area has a temperate climate and loess soil with a depth ranging from a few centimeters to 120 cm overlying a bedrock. Their findings showed that, in the upper 50 cm of the soil profile, C. sempervirens had a higher fine-root biomass than P. halepensis in similar forest-quality classes.
Despite numerous water-balance-related studies in Mediterranean forest areas (e.g., Molina and del Campo, 2012; Montaldo et al., 2021; Simpson et al., 2022), only a few studies have focused on quantifying water balance components of C. sempervirens, P. brutia, and P. halepensis species (e.g., Yaseef et al., 2010; Ungar et al., 2013; Klein et al., 2014; del Campo et al., 2014; Helman et al., 2017b; Eliades et al., 2018; Rohatyn et al., 2018). While some studies have combined observations with modeling techniques, none have specifically examined species-specific water balance components, considering the complexities of soil, vegetation, and atmospheric dynamics. For example, Klein et al. (2014) conducted a study in the 40-year-old Yatir P. halepensis forest in Israel, which has a mean annual rainfall of 285 mm and a light-brown Rendzina soil overlying a limestone bedrock. They estimated the transpirable soil water content using sap flow, water potential, and depth-dependent water retention curves. They also analyzed the impact of soil-layer-specific values of soil parameters on soil water dynamics with the ecosystem gas exchange model MuSICA. However, they did not calibrate aboveground species-specific vegetation parameters, instead relying on previous studies. In another study conducted in the same forest, Helman et al. (2017b) combined a remote-sensing-based model (RS-Met) with eddy-covariance observations to estimate the annual evapotranspiration of the planted pine forest. However, they only used a water deficit factor to adjust their model for natural water-limited ecosystems. Nonetheless, no research in the literature has combined field observations with land surface models (LSMs) to estimate water balance components in Mediterranean coniferous forests. Such studies can improve modeling applications in these environments, supporting foresters with information on the water use of different species under different climate conditions and thereby optimizing species selection and planting densities.
Land surface models have been extensively used to evaluate and predict water fluxes because of their mechanistic-based structure and application over various spatiotemporal scales (Chen et al., 2013). Through decades of development, LSMs have become more comprehensive, and the current, third-generation models represent increasing interactions and feedback between physical, biological, and chemical processes (Niu et al., 2011). Noah-MP is an augmented version of the Noah LSM (Ek et al., 2003). It belongs to a new generation of LSMs that utilize a multi-parameterization framework that allows different combinations of physical schemes for the different physical processes on the land surface (Chen et al., 2016). The Noah-MP model is the default land surface model within the widely used Weather Research and Forecasting (WRF; Skamarock et al., 2019) model, simulating all land–atmosphere interactions.
The Noah-MP model performance to estimate water balance components was assessed against several other LSMs with satisfactory results (e.g., Cai et al., 2014; Chen et al., 2014; Sun et al., 2021). Despite advances in LSMs, there are still uncertainties in the simulation and partitioning of evapotranspiration. This may be rooted in uncertainties in the atmospheric forcing and land surface property data sets, parameterizations of the physical and biogeochemical processes, and the spatiotemporal scales and resolutions of the simulations (Liu et al., 2015). To decrease the uncertainties in LSM applications, an informative initial step is to identify sensitive model parameters for specific model outputs and then to calibrate these parameters using local observations (Cuntz et al., 2015). Meir and Woodward (2010) also noted that results obtained from LSMs without evaluation with in situ measurements are questionable.
In general, there is a lack of information on the water balance components of coniferous species in Mediterranean ecosystems. The performance of Noah-MP, which can be used to model these water balance components, has never been specifically evaluated for a semiarid Mediterranean ecosystem. To this end, the overall goal of this study is to model the water balance components of two typical coniferous species, P. brutia and C. sempervirens, within an eastern Mediterranean ecosystem, using the Noah-MP land surface model. The study has three specific objectives: (1) to evaluate the impact of changes in model input parameters on tree water balance components (tree transpiration, soil evaporation, and total runoff); (2) to calibrate the most impactful parameters and evaluate the model's performance, using observed and modeled tree transpiration and soil moisture values; and (3) to assess differences in the water balance components simulated with the calibrated Noah-MP model and with the Noah-MP default settings of the WRF model. The study utilizes a one-dimensional, single-grid-cell version of the Noah-MP model, applied to the root zone area of a single tree.
2.1 Site description and measurements
Observations from a tree plantation in Athalassa National Forest Park on the southeastern edge of Nicosia in Cyprus (35.133° N, 33.400° E) were used for this study. The long-term (1980–2010) mean annual rainfall recorded at the nearby Athalassa meteorological station is 315 mm. The experimental site is on a sedimentary formation with a sandy loam soil texture. Percussion drilling, at three random locations, showed soil depths of approximately 1 m. The field is relatively flat (with a mean slope of 4 %) and is covered by a combination of seasonal vegetation and more than 2300 mixed indigenous trees and shrubs with a 5 to 6 m planting distance, covering a 7.5 ha area. The study site comprises 846 P. brutia and 216 C. sempervirens trees, allocated to the planting holes without any specific pattern. We will refer to these species as pine and cypress, respectively.
Sap flow was monitored on six pine and six cypress trees at the site. The mean and standard deviation of the stem diameter of the monitored trees were 9.2 ± 1.2 cm for pine and 10.3 ± 1.7 cm for cypress, which were close to the full-field averages of 10.3 ± 2.3 cm for pine and 9.9 ± 1.8 cm for cypress (Djuma et al., 2024). Soil moisture was monitored in the root zone of two pine trees and two cypress trees with sap flow sensors. These four trees are used for the current study. The mean stem diameter of the 4 studied trees (9.5 cm for pine and 9.3 cm for cypress) was similar to the 12-tree averages. The mean total sap flow of the 4 trees (296 mm for pine and 566 mm for cypress) during the December 2020 to June 2022 study period was also reasonably close to the 12-tree averages (314 mm for pine and 642 mm for cypress). The closer fit of the pine tree means was indicative of the lower sap flow variability in these trees (215–357 mm) compared with cypress (405–1061 mm) (Djuma et al., 2024). These numbers suggest that the four trees used in this modeling study were representative of the trees at the site.
Sap flow sensors (SFM1, ICT International, Armidale, Australia) were placed on the trees at a height of approximately 30 cm and used to measure the sap flow velocity at hourly intervals. The sensor observations were processed to calculate tree transpiration with the Sap Flow Tool software, following the methods of Burgess et al. (2001). Soil moisture (volumetric soil water content) and soil temperature were measured hourly with soil moisture sensors (SMT100, TRUEBNER, Neustadt, Germany). These sensors were installed at depths of 10, 30, and 50 cm and were placed around each tree in two opposite directions. In each direction, one set of sensors was installed under the tree canopy (approximately 0.7 m from the tree trunk), while the other set was installed at the edge of the canopy (approximately 1.8 m from the trunk). Thus, for each tree species, the average daily sap flow of the two trees and the average soil moisture from eight sensors at each depth were used for the model calibration and validation. Figure 1 presents the study area and the two studied species.
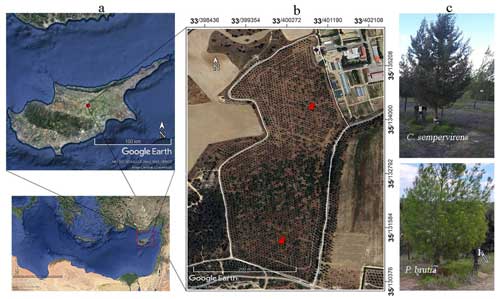
Figure 1Panel (a) shows the eastern Mediterranean with the island of Cyprus framed in red and the study area location identified with a red bullet. Panel (b) presents the study area in Athalassa National Forest Park, framed with a white polygon, and the two monitoring locations (each with a pine and cypress tree), identified with red pins. In panel (c), two of the monitored tree species with sap flow and soil moisture sensors are shown. Images in panels (a) and (b) are from Google Earth (© Google Earth).
Meteorological data were collected at the site in 5 min intervals with an all-in-one weather sensor (ATMOS 41, METER Group, Munich, Germany). To run the model during the calibration and validation periods, we used instantaneous meteorological forcing data at 30 min intervals, except for precipitation, which was summed up. These variables include air temperature (K), relative humidity (kg kg−1), downward solar radiation (W m−2), downward longwave radiation (W m−2), precipitation (kg m−2 s−1), wind speed (m s−1), and atmospheric pressure (hPa). We used data from two other meteorological stations to fill gaps in our ATMOS 41 data time series: (i) the Athalassa governmental meteorological station, located around 1 km from our experimental site, and (ii) the meteorological sensors of an eddy-covariance tower instrumented at a height of 2 m in a neighboring agricultural field. For the model sensitivity analysis, 30 min meteorological forcing data were extracted from optimized WRF simulations for the 1 km grid cell covering the site, from October 2016 to September 2019 (Sofokleous et al., 2021).
Average soil porosity at the site was 0.43 cm3 cm−3, calculated from bulk density samples collected from six locations and two depths (0–10 and 40–50 cm). Field capacity and wilting point were derived from the soil moisture observations. The field capacity (0.18 cm3 cm−3) was taken from a very wet period in early February 2022, after drainage had stopped, and the wilting point (0.06 cm3 cm−3) was the lowest observed soil moisture level during the summer months.
2.2 The Noah-MP land surface model
The Noah-MP model (Niu et al., 2011; Yang et al., 2011) has been developed via the integration of different physics modules from other land surface models (Kumar et al., 2017). Many options considered in the model represent interaction processes between the land surface and the atmosphere (Barlage et al., 2015). A variety of formulations are used in these options to calculate processes such as soil parameterization, runoff generation, stomatal conductance, and radiative transfer in the canopy (Cuntz et al., 2016).
2.2.1 Model description and setup
In the model version used in this study (version 1.1), there are 12 different physics schemes, each with different options that users can set based on their objectives and environmental conditions. We selected the same options as used by Sofokleous et al. (2023) in their WRF-Hydro (version 5.1) application for Cyprus (see Table A1). These authors selected the Jarvis option for the canopy stomatal resistance scheme because the alternative Ball–Berry option was found to underestimate transpiration. Options for other schemes were selected consistent with WRF-Hydro's recommended default options (Gochis et al., 2020). We entered a constant leaf area index (LAI) for each species for the monthly LAI values in the input tables, because LAI observations of the pine and cypress trees at the site showed little seasonal variation.
The default soil column in the Noah-MP model is a 2 m soil column, which is discretized into four layers (10, 30, 60, and 100 cm from the top to the bottom of the soil column). Based on field observations, we changed the soil depth to 1 m and set the thickness of the layers to 20, 20, 20, and 40 cm. We assumed that all four layers had tree roots.
The model was initialized using soil moisture and soil temperature recorded in the field. The initial conditions for the sensitivity analysis were taken from October 2020. The initial volumetric soil moisture (SMC) of the four soil layers was, from top to bottom, 0.06, 0.07, 0.07, and 0.07, and the soil temperature was 25.7, 25.9, 26.2, and 26.4 °C, respectively. The skin temperature was set as the average of the upper-layer soil temperature and the air temperature (21.4 °C).
2.2.2 Model conceptualization
We modeled a single tree with its root zone as a single grid cell. The grid cell represents the root zone area from which the tree extracts water. If all trees at the site are equal, the maximum root zone extent of a tree (grid cell area) would be equal to the planting area of the trees (30 m3). Considering the relatively small canopy areas of the trees (6.2–7.3 m2), it is likely that the roots are not extending into the full planting area. Because the actual root extension area is unknown, we tested different grid cell areas (see Sect. 2.2.3), using the following equations. The vegetation fraction of the grid cell (FVEG (−)) was determined as follows:
where CA is the observed canopy cover area (m2) and GA is the grid cell area (m2). The leaf area index (LAI (m2 m−2)) of the grid cell was determined as follows:
where LAICA is the LAI of the canopy area. The planting area was 30 m2 (5 m × 6 m). The average observed CA was 7.3 m2 for the two pine trees and 6.2 m2 for the two cypress trees. The observed LAICA was 4.4 for pine and 4.6 for cypress. Figure 2 presents a schematic of the modeled tree, root zone, and the water balance components.
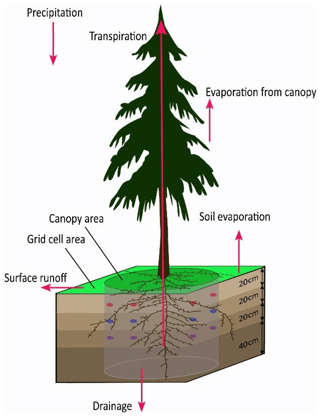
Figure 2Schematic of a modeled tree showing the canopy cover area, grid cell area, soil column with its discretized layers, and water balance components (red arrows); red, blue, and purple bullets in the tree root zone denote the locations of the soil moisture sensors at 10, 30, and 50 cm soil depth, respectively. The horizontal and vertical dimensions are not scaled.
2.2.3 Sensitivity analysis
Noah-MP calculates the different flux exchanges between the biosphere and the atmosphere for different plant functional types and different soil textures. There are 49 parameters for each plant functional type in the model and 10 for each soil texture. However, not all parameters are used by all physics schemes. For our selected options, there are 18 parameters involved in the modeling of one plant functional type with one soil texture (see Table 1). We analyzed the impact of the selected parameters on three output variables, namely tree transpiration, soil evaporation, and total runoff, using a local sensitivity analysis. In this method, each parameter is changed in turn, while keeping all other parameters constant at their baseline values.
Table 1The vegetation and soil input parameter ranges, as specified in the model input parameter files, and the baseline, minimum, and maximum values selected for the sensitivity analysis, for evergreen needleleaf forest, and soil textures ranging from sand to loam.
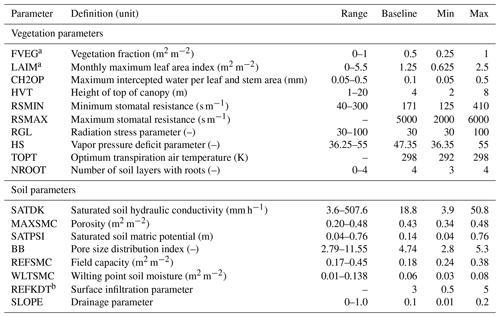
a FVEG and LAIM were set in relation to each other with Eqs. (1) and (2). b REFKDT is the reference soil conductivity scaling factor computed using the following equation: REFKDT = (KDT × REFDK)/SATDK, where KDT and REFDK are the scaled and reference values for SATDK, respectively.
We used a relative change (RC) equation to calculate the impact of the change in selected input parameter values on the output variables:
where RC is the relative change, and Ob and O denote the model output value at the baseline value of the input parameter and at a specific value of the input parameter, respectively. To rank each input parameter based on their impacts on the three outputs, we averaged their RCs for all outputs and all 3 years. However, we chose to focus on parameters that had an impact on at least one output or in at least 1 year, in order to ensure that our analysis was relevant and meaningful.
In Table 1, the range column shows the ranges of parameter values as specified for evergreen needleleaf forests and for sandy and loamy soil textures in the model input table files. For the sensitivity analysis, we use baseline, minimum, and maximum values, which represent the best estimates for our study area, based on field observations and data from the literature. To analyze the effect of the root extension area, we examined three different cases in which FVEG and LAI were defined using Eqs. (1) and (2), using the average canopy cover area (7.3 m2) and LAICA (4.4) of the pine trees. For the maximum run, we set FVEG equal to 1, which represents the case in which the grid cell area equals the canopy cover area (7.3 m2). For the minimum run, we set FVEG equal to 0.25, representing a grid cell area close to the planting area (29.2 m2). For the baseline run, FVEG was set equal to 0.5. We used the two-stream radiation option as our baseline setting and tested relative changes due to the use of the modified two-stream option of the radiation transfer scheme in one run. Finally, we examined the impact of the first soil layer thickness on the output variables by changing it around its baseline value of 20 cm (min = 10 cm and max = 30 cm).
The baseline and maximum values for minimum stomatal resistance (RSMIN) and minimum and maximum values for optimum transpiration air temperature (TOPT) were based on flux observations and model simulations of a P. pinea forest near Pisa in Italy (Hoshika et al., 2017). Minimum and maximum values for radiation stress (RGL) and vapor pressure deficit (HS) parameters were obtained from observations and Noah model simulations by Hogue et al. (2006) in Arizona. Maximum and minimum values for maximum intercepted water per leaf and stem area (CH2OP) and the surface infiltration factor (REFKDT) were based on Niu et al. (2011).
2.2.4 Parameter calibration and model validation
A stepwise trial-and-error method was applied to calibrate all parameters with an absolute RC of 0.05 (5 %) or higher for each of the three water balance outputs, occurring in any of the 3 years. Initially, we examined combinations of the minimum and maximum values of the selected parameters, as presented in Table 1. We then refined these values in the following steps. We tested the fit of modeled and observed daily total transpiration and instantaneous soil moisture of the top 60 cm soil at 00:00 h (average of three layers), using four evaluation criteria, namely, BIAS, mean absolute error (MAE), Nash–Sutcliffe efficiency (NSE), and Kling–Gupta efficiency (KGE). The BIAS for transpiration is computed as the sum of the daily errors. For soil moisture, considering that the daily values are not independent of each other, BIAS is calculated as the average daily error. The formulations for these criteria are as follows:
Here, n is the number of days; Xi and Yi denote observed and modeled values of the ith day, respectively; is the mean of observed values; r is the Pearson correlation coefficient between observed and simulated values; β is the ratio of the standard deviation of the simulated values to the standard deviation of the observed values; and γ is the ratio of the mean of the simulated values to the mean of the observed values. Given the last three components, linear correlation, temporal variability, and mean bias contribute to the KGE metric.
All four evaluation criteria for transpiration and soil moisture were first ranked (1 is best), and then the ranks were summed to select the optimum model parameterization, based on the smallest sum of the ranks. We first calibrated the model for pine and subsequently for cypress. Because of the homogeneous soil physical properties at the study site, we maintained the soil parameter values obtained for the pine tree calibration for the cypress calibration. We used data from December 2020 to August 2021 for calibration and from September 2021 to June 2022 for model validation. Furthermore, we also reversed the calibration and validation periods, using data from September 2021 to June 2022 for calibration and from December 2020 to August 2021 for model validation.
2.2.5 Comparison of calibrated Noah-MP with default Noah-MP used in WRF
We conducted a comparison between the water balance components simulated with the calibrated Noah-MP model and those simulated with Noah-MP used within the WRF model, utilizing its default global settings, for both the calibration and validation periods. The default global settings of Noah-MP in WRF for our research site encompass a 2 m soil column, a clay loam soil texture, an open-shrubland plant functional type, and specific physics schemes, as listed in Table A1. We refer to this model parameterization as the default Noah-MP. We utilized the initial conditions of pine for running the default parameterized WRF. Furthermore, the open shrublands in the default Noah-MP have a lower LAI and FVEG than our Noah-MP settings for evergreen needleleaf trees. The default Noah-MP uses monthly dynamics of LAI (ranging from 0.6 in July to 2.58 in January) and FVEG (0.17 in July, 0.54 in January), whereas we used constant values for LAI (4.0 for pine) and FVEG (0.9 for pine) at the research site.
3.1 Sensitivity analysis
The water balance components for the base scenario of the sensitivity analysis, as a fraction of the precipitation, are presented in Table 2. As can be seen in the table, the 3 hydrologic years represent very dry, dry, and very wet conditions, as the long-term average precipitation at the study site is around 315 mm. In all 3 years, transpiration was the largest water balance component.
Table 2Simulated annual water balance components for the base parameter values, as a fraction of the precipitation (P); Et is evaporation from the canopy, Eg is soil evaporation, T is tree transpiration, Rs is surface runoff, Rd is drainage, and ΔSM is soil moisture change.

The relative changes in the modeled soil evaporation, tree transpiration, and total runoff resulting from changing the input parameters from their base values to their minimum and maximum values are presented in a heat map in Fig. 3. The figure shows that the soil parameters had stronger impacts on the outputs than the vegetation parameters (right side of the heat map is more highlighted). Relative changes were higher for runoff than for the other two outputs, especially in the very wet year. RC values higher than 1 (100 %) were all related to runoff (shown in dark red in the map). We can also see that the 2 dry years behaved very similarly.
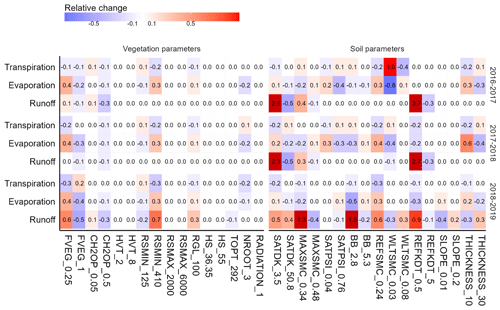
Figure 3Relative change (RC) in tree transpiration, soil evaporation, and total runoff (drainage plus surface runoff) resulting from changes in the vegetation and soil parameters for 3 hydrologic years (2016–2017 to 2018–2019). Absolute relative changes lower than 0.05 (|RC| < 0.05) are reported as 0.0. Relative changes above 1.0 are shown in dark red. RADIATION_1 is the modified two-stream option of the radiation transfer scheme; THICKNESS_10 and THICKNESS_30 runs use a first soil layer thickness of 10 and 30 cm (baseline = 20 cm), respectively. For an explanation of the other parameters, see Table 1.
Except for the drainage parameter (SLOPE), which had no impact on any of the three water balance components in the 2 dry years (|RC| < 0.05), all other soil parameters impacted outputs in all 3 years. SLOPE had no impact on transpiration and affected evaporation and runoff only in the very wet year. We found the highest impacts on runoff associated with the soil parameters SATDK, MAXSMC, BB (pore size distribution index), and REFKDT. A decrease in the top soil layer depth from 20 cm (base run) to 10 cm increased soil evaporation, on average, by 40 % over the 3 years, whereas an increase from 20 to 30 cm decreased evaporation by 30 %. This is most likely due to the higher soil water contents in a 10 cm layer than a 20 cm layer after small rainfall events, resulting in less resistance to evaporation and transpiration. The highest impacts of the vegetation parameters were related to the vegetation fraction (FVEG) and minimum stomatal resistance (RSMIN). Transpiration was generally less impacted than evaporation by both vegetation and soil parameters.
For the calibration, we selected all parameters that produced relative changes of −0.05 and lower or 0.05 and higher (round off to −0.1 and 0.1 in Fig. 3) on at least one of the output variables, in at least 1 of the hydrologic years. These were the following 11 parameters: REFKDT, SATDK, BB, RSMIN, FVEG, CH2OP, SATPSI, RGL, NROOT, TOPT, and SLOPE. The five most impactful parameters on transpiration, in descending order of impact (see Sect. 2.2.3), were RSMIN, FVEG, SATDK, RGL, and SATPSI. The five parameters with the highest impact on evaporation and runoff combined, also listed in descending order of impact, were REFKDT, SATDK, FVEG, BB, and RSMIN. Porosity (MAXSMC), field capacity (REFSMC), and wilting point (WLTSMC) were not selected for the calibration, because their values were derived from field observations. For soil thickness scenarios, the base scenario (first soil layer thickness of 20 cm) was selected for the calibration, because it had a zero-water-balance error and facilitated direct comparisons with the soil moisture observations, while small positive and negative errors were found in the two other options.
3.2 Parameter calibration and model validation
We tested more than 700 different combinations of parameter values and found that the model simulated soil moisture much better than transpiration. This was also the case for the validation period. Table 3 shows the calibrated parameter values for the highest-ranked parameterization for pine and cypress. The evaluation criteria for the calibration and validation periods are presented in Table 4.
Table 3Calibrated parameters values for the run with the highest-ranked evaluation criteria for soil moisture (SM) and tree transpiration (T) for pine and cypress.
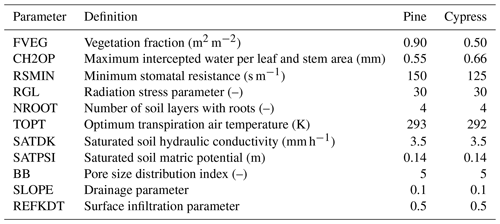
Table 4Evaluation criteria of the modeled transpiration; average soil moisture (SM) of the 60 cm root zone; and the soil moisture at 10, 30, and 50 cm depth for pine and cypress for the calibration and validation periods.
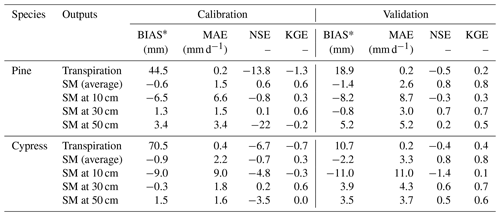
* Transpiration BIAS is the sum of daily errors (mm) and soil moisture BIAS is the average daily errors (mm d−1).
Total precipitation over the 9-month calibration period was 175 mm. For pine, observed transpiration over the 8.1 m2 grid cell area, as derived from the calibrated FVEG (0.9), was 62 % of the precipitation, which amounts to 109 mm. For cypress, the calibrated FVEG was 0.50, which corresponds to a 12.4 m2 grid cell area, and the observed transpiration accounted for approximately 78 % of the precipitation (equivalent to 136 mm) of the precipitation over the grid cell area. However, the fraction of precipitation over the grid cell area that goes to transpiration during the 10-month validation period, with 379 mm of precipitation, was almost the same for pine and cypress (38 % for pine and 36 % for cypress).
High values of SATDK and REFKDT result in low runoff and high infiltration and soil moisture, showing an overestimation of transpiration and soil moisture during the wet period. This contrasted with the observed transpiration, which showed a much more even distribution over the season. When both SATDK and REFKDT were tuned towards their lowest values to fit the observed soil moisture, transpiration was consistently underestimated. Therefore, to model the observed transpiration, we needed to set low RSMIN values to increase transpiration. Notably, REFKDT exhibited particular sensitivity when hydraulic conductivity was very low. Therefore, the best-ranked evaluation criteria for soil moisture and transpiration were achieved with low values for the hydraulic conductivity and infiltration parameter (SATDK = 3.9 mm h−1 and REFKDT = 0.5) and with RSMIN for pine set to 150. For cypress, we maintained the same soil parameters and NROOT values as used for pine. However, the calibrated RSMIN in cypress (125) was slightly lower than in pine due to the higher transpiration rates of cypress. Additionally, we increased interception (CH2OP) to better fit the observed soil moisture during the wet period.
The largest obstacle with respect to simulating transpiration during the calibration period occurred during the period without precipitation (summer time), when soil moisture approached its wilting point, leading to a near absence of modeled transpiration (Figs. 4 and 5). Despite both observed and modeled soil moisture reaching the wilting point by late April 2021, both species preserved their transpiration levels throughout the summer, with a slight increase in transpiration following the rainfall event in June. The discrepancy between observed and modeled transpiration in both species suggests that the trees extracted water from depths beyond the reach of the soil moisture sensors, possibly below 60 cm. Consequently, this resulted in a considerable positive transpiration bias (44.5 mm for pine and 70.5 mm for cypress) and consistently negative NSE and KGE values for transpiration (Table 4).
We attempted to enhance modeled transpiration during the dry period by adjusting the TOPT and RGL parameters of the Jarvis scheme. However, modifying TOPT had little impact on transpiration, except for a brief increase in the second half of April, which led to poor NSE and KGE values for transpiration. In contrast, increasing RGL from its base value not only resulted in a slight rise in transpiration from mid-April to mid-June but also caused a decrease in transpiration during December and January, ultimately leading to increased underestimation of transpiration and poorer evaluation criteria values for soil moisture. After experimenting with various values, we found that low values of TOPT and RGL for both species, as shown in Table 3, provided the best results.
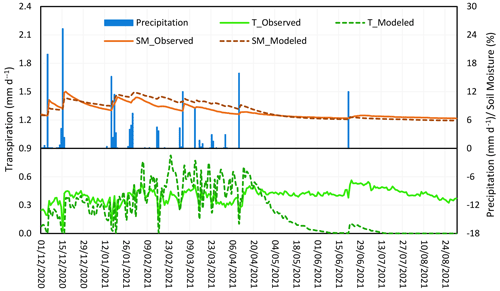
Figure 4Daily time series of precipitation and modeled and observed average soil moisture (SM) and tree transpiration (T) for pine for the calibration period.
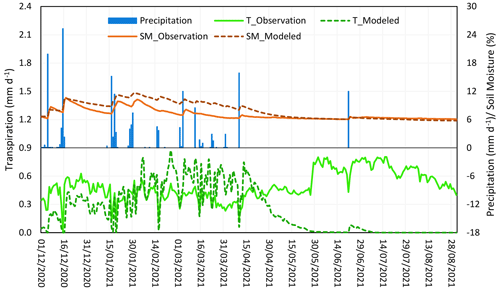
Figure 5Daily time series of precipitation and modeled and observed average soil moisture (SM) and tree transpiration (T) for cypress for the calibration period.
Figures 6 and 7 illustrate the validation results for pine and cypress. The model demonstrated improved simulation of soil moisture and transpiration during the validation period, primarily due to the presence of more evenly distributed precipitation compared with the calibration period. Considering that we calibrated the model for the average soil moisture of the three layers, this was, with one exception, always better modeled than the soil moisture in each separate layer, for both species over both periods (Table 4). Among the three layers, the best model performance was observed in the second layer (20–40 cm) for both pine and cypress during both the calibration and validation periods. This is because the model can only use a single set of soil physical properties for the soil column, and the daily values of soil moisture in the second layer, unlike the other two layers, are closely aligned with the average daily values of the soil moisture of the three layers. Whereas the model specifies the wilting point as the minimum soil moisture content, the soil moisture of the top layer falls below the wilting point due to evaporation. This results in a general overestimation of the soil moisture of the top layer, which is subsequently balanced by an underestimation of soil moisture of the third layer (Table 4). The soil moisture of the third layer was better modeled for cypress, specifically in the validation period (NSE = 0.5). Recorded soil moisture in the second and third layers was lower for cypress than for pine, indicating that cypress has better access to and consumes more water from these layers.
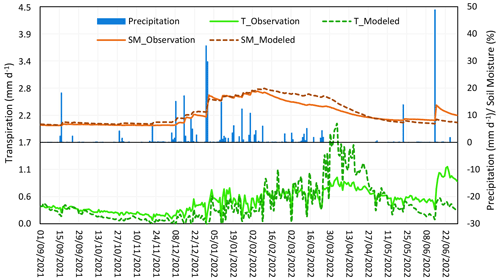
Figure 6Daily time series of precipitation and modeled and observed average soil moisture (SM) and tree transpiration (T) for pine for the validation period.
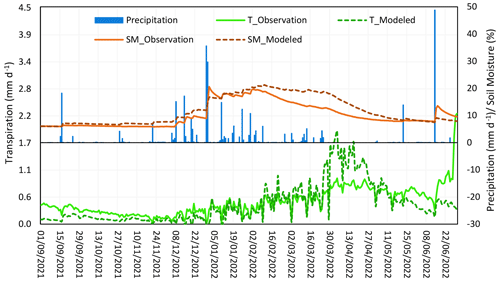
Figure 7Daily time series of precipitation and modeled and observed average soil moisture (SM) and tree transpiration (T) for cypress for the validation period.
Results for the reversed calibration–validation test showed small improvements for FVEG = 0.95 for pine, compared with the original calibrated value of 0.90, in five of the evaluation criteria: soil KGE, BIAS, and MAE improved to 0.9, −1.1, and 2.5 mm d−1, respectively, and transpiration NSE and KGE increased to −0.4 and 0.3, respectively. We also observed improvements for cypress, for FVEG = 0.65 instead of the original value of 0.50, in two evaluation criteria of transpiration NSE and KGE (0.5 and −0.1), while the soil evaluation criteria remained nearly equal. However, when we validated the model using the drier period from December 2020 to August 2021, six evaluation criteria decreased for pine and seven criteria decreased for cypress, relative to the original calibrations.
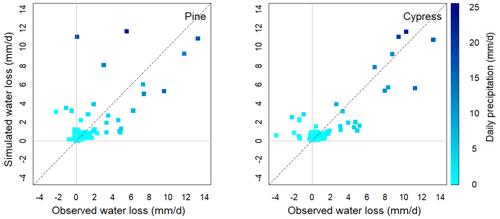
Figure 8 shows scatterplots of modeled daily water losses (the sum of modeled daily transpiration, interception, soil evaporation, and runoff) versus observed daily water losses (the observed precipitation minus the soil moisture changes over the day) to better explain the model performance in capturing daily water use in presence and absence of daily rainfall events. The figure shows relatively higher observed than modeled water losses during rainfall events. These losses from the observed water balance could be related to surface runoff or preferential flows. Because Noah-MP cannot simulate preferential flows, we modeled these losses as surface runoff. Observed negative water losses (water gains), which generally occurred on the day after rain, could also indicate the existence of preferential flows. These preferential flows may have created moist spots at deeper depths that sustained tree transpiration during the dry period. The sum of negative water losses in pine was 8 mm, whereas it was 17.2 mm in cypress, which can support the higher observed transpiration in cypress than in pine.
3.3 Comparison of calibrated Noah-MP with default Noah-MP used in WRF
Table 5 presents the water balance components simulated with the default Noah-MP, with the calibrated Noah-MP, and those recorded in the plot (observed). The default Noah-MP simulations had much lower transpiration, higher change in soil moisture storage and evaporation, lower interception, and lower runoff than the calibrated Noah-MP simulations. The calibrated Noah-MP captured observed soil moisture and transpiration better than the default version, with the latter consistently underestimating transpiration and overestimating soil moisture (Figs. A1 and A2). Some of these differences arise from the difference in soil texture, with clay loam of the default Noah-MP having a higher water-holding capacity than the sandy loam observed in the field, which consequently resulted in higher soil moisture and less runoff for the default Noah-MP, relative to the calibrated Noah-MP. The simulations show that the modeled soil moisture using the default Noah-MP settings never reached or even came close to the default wilting point of clay loam soil texture (10.3 %), even during periods with no precipitation. This is primarily attributed to the very low default LAI values of open shrublands during the summer months (LAI = 0.6 during June–August), which result in a lower rate of transpiration and hence a lower drying rate of the soil. The higher surface runoff simulated with the calibrated Noah-MP may have been trapped in micro-puddles and captured by preferential flows within the grid cell. Total evapotranspiration was higher in all modeling options in the calibration period (65 %–77 % of P) than in the validation period (53 %–58 % of P). The calibrated model for cypress had the lowest evapotranspiration due to its lower interception compared with pine and the default model had the highest values of 77 % in the calibration period (Table 5).
The sensitivity analysis of our research revealed that RSMIN, REFKDT, and SATDK had the highest impact on evapotranspiration and runoff, which is consistent with previous studies (e.g., Arsenault et al., 2018; Cuntz et al., 2016). However, we also found that the strong water limitation in our study area influences the sensitivities of parameters differently than in other regions. For instance, Arsenault et al. (2018) conducted a global-scale study to identify sensitive parameters in the Noah-MP model using a global sensitivity method and found the same soil parameters that we identified as having a high impact on evapotranspiration and runoff. They examined dynamic and prescribed leaf area index (LAI) vegetation options in their study and found RSMIN, RGL, and TOPT to be sensitive parameters. However, while they identified HS (vapor pressure deficit parameter) as a sensitive parameter, we did not find it significant in our study. This discrepancy is likely due to the unique hydroclimatic conditions of our study area, which is characterized by strong water limitation, and implies that trees may be more limited by soil water availability than by atmospheric conditions in such ecosystems.
In a study on the sensitivity of the Noah-MP parameters over 12 catchments in the US, Cuntz et al. (2016) found that surface runoff was very sensitive to REFKDT and SATDK. Similarly, we found high relative changes in runoff for these two parameters. Cuntz et al. (2016) also identified BB, MAXSMC, and REFSMC as sensitive model parameters for all outputs. However, in contrast to our findings, both Cuntz et al. (2016) and Arsenault et al. (2018) found CH2OP and SATPSI to be insensitive, although our relative changes for SATPSI exceeded 0.1 only in the 2 dry years. Sofokleous et al. (2023) also reported SATDK and MAXSMC as sensitive parameters for simulated runoff and evapotranspiration in 31 mountainous watersheds of Cyprus using Noah-MP. These authors also found SLOPE to affect these two variables, which was not seen here because SLOPE is related to the drainage at the bottom of the soil column, which is not often observed in the harsher semiarid conditions of the plains.
The findings of our study, in conjunction with those of other research conducted on a global or national scale, highlight the importance of certain model parameters, regardless of the hydroclimatic conditions. Specifically, the consistency in identifying REFKDT, SATDK, and MAXSMC as highly sensitive soil parameters across different studies underscores their crucial role in controlling water infiltration and consequently influencing soil water balance. Similarly, RSMIN, a vegetation parameter that regulates tree water consumption, was consistently identified as a sensitive parameter in our study and the studies mentioned above. However, our study also highlights the importance of ecosystem-specific conditions in determining the sensitivity of certain parameters, such as CH2OP, which was identified as sensitive in our study but not in others, The varying sensitive parameters identified in different studies suggest that the sensitivity of model parameters and the magnitude of their sensitivity can be highly dependent on the specific characteristics of the study area.
Ecosystem-specific conditions, such as soil and vegetation characteristics, imply the need for a unique calibration of identified sensitive parameters and model parameterization that accurately reflects the reality of the ecosystem. For instance, our calibration resulted in a CH2OP of 0.55 mm (per unit LAI) in pine, which gave an interception rate of 25 % and 21 % of the precipitation in the calibration and validation periods, respectively. These modeled interception rates for pine align with the observed and modeled interception rates reported by Eliades et al. (2022). The authors reported observed interception rates ranging from 13 % to 55 % of the precipitation over 12 years (2008–2019) for a stand in the foothills of Cyprus' Troodos Mountains, with an average rainfall of 429 mm. Higher interception was associated with drier years, with the highest interception (55 %) occurring in the driest year (186 mm) and the lowest interception (13 %) in a wet year (475 mm). Similarly, we found higher interception (25 %) during the drier calibration period and lower interception (21 %) during the wetter validation period. The agreement with the findings of Eliades et al. (2022), who conducted their study in a nearby P. brutia forest, suggests that the calibrated value of CH2OP in Noah-MP can be applied to similar conditions in future studies.
The model's overall better performance when calibrated on the dry year and validated on the wet year, instead of the other way around, suggests that the model captures the relationship between soil moisture and tree transpiration better during drier periods than during wetter periods. The better relationship between evapotranspiration and soil moisture in drier soils than in wetter soils in land surface models has also been mentioned in other studies. Larsen et al. (2016) calibrated the SWET land surface model using eddy-covariance fluxes and catchment runoff over three different surface types (forest, grass, and agriculture) in Denmark. They found a less distinct relationship between evapotranspiration and root zone soil moisture in grassland with higher soil moisture compared with the two other surfaces with lower soil moisture.
We found an underestimation of evapotranspiration in the model, which is also discussed in previous studies conducted in arid and semiarid regions. For example, Ma (2023) applied the Noah-MP model to estimate water and energy fluxes in two representative alpine meadow and steppe ecosystems on the Tibetan Plateau and found an underestimation of evapotranspiration for both ecosystems. The author incorporated a nonlinear (asymptotic) root distribution function in the model, which improved the evapotranspiration estimates and the partitioning between transpiration and soil evaporation in the alpine meadow, increasing the daily NSE for evapotranspiration from 0.84 to 0.90. However, the improvement in the alpine steppe was marginal (from −0.45 to −0.37). The author related the poor evapotranspiration simulations in the alpine steppe to a sparse vegetation cover.
Zheng et al. (2015) modeled soil moisture using Noah-MP at three different soil depths of 5, 25, and 70 cm in a Tibetan meadow ecosystem. In line with our findings (Table 4), they found a consistent overestimation of soil moisture in the top soil layer and an underestimation in the lowest layer. Similar to Ma (2023), Zheng et al. (2015) incorporated two nonlinear root distribution functions (exponential and asymptotic) in the model. Using either of the nonlinear equations, they were able to improve water uptake from different soil layers. Such functions could possibly also improve our simulations, considering that cypress relies heavily on lateral roots concentrated in the subsurface, as Rog et al. (2021) reported. These authors found that the root growth of C. sempervirens is mostly horizontal and that of P. halepensis is both horizontal and vertical, based on root sampling in top 20 cm of soil on limestone bedrock and allometric equations.
This study used the Noah-MP model to investigate the water balance components of two conifer species, Pinus brutia and Cupressus sempervirens, in an eastern Mediterranean ecosystem. The model's performance was also compared to those simulated with the default Noah-MP settings in the WRF model for the research site. Our findings highlight the importance of sensitive parameters in water balance simulations, with vegetation fraction (FVEG), minimum stomatal resistance (RSMIN), surface infiltration parameter (REFKDT), and saturated soil hydraulic conductivity (SATDK) having the most significant impacts on transpiration and soil water balance components. Our sensitivity analysis and subsequent calibration of these parameters demonstrate the potential to improve the accuracy of water balance predictions in similar ecosystems, ultimately contributing to a better understanding of the impact of sensitive parameters on water balance components and informing the development of forest management strategies.
Noah-MP showed improved performance during the wetter validation period (379 mm rain) compared with the drier calibration period (175 mm rain) for both species, effectively capturing the average soil moisture, as observed with 24 soil moisture sensors for each species. The middle soil layer exhibited better modeling performance compared with the other layers. Soil moisture in the first and third layers was over- and underestimated, respectively, which can be attributed to the model's use of a single set of soil physical properties for the soil column and a uniform root distribution for the root zone. The single set of soil properties also fixes the lowest soil moisture content at the wilting point, while, in reality, the top soil layer becomes almost air-dry. The model failed to capture the observed tree transpiration, although positive KGEs (0.2 for pine and 0.5 for cypress) were obtained during the validation period. This is most likely due to heterogeneous wetting and water uptake in the soil profile.
Comparison between the calibrated and the default Noah-MP models revealed that runoff in the calibrated model was significantly higher than in the default model, which can be attributed to the higher water-holding capacity of clay loam in the default Noah-MP, compared with that of the sandy loam soil of the research site, as used in the calibrated model. For both model parameterizations, the evapotranspiration, as a fraction of the precipitation, was higher during the calibration period than during the validation period, with the highest values associated with the default Noah-MP and the lowest values associated with the cypress in the calibrated model. Incorporating a nonlinear root distribution function could potentially improve model performance by providing a more accurate estimation of plant water use from different soil layers, resulting in better soil moisture estimation and improved estimation and partitioning of evapotranspiration. Additionally, installing soil moisture sensors below the 60 cm depth could help improve our understanding of vertical root extension and water extraction for transpiration.
Table A1Noah-MP multi-physics schemes with their possible options; the options used for the sensitivity analysis, calibration, and validation (selected); and the options of the default Noah-MP, as used in WRF.
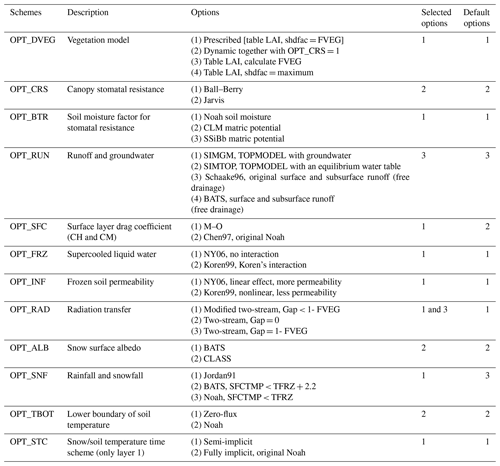
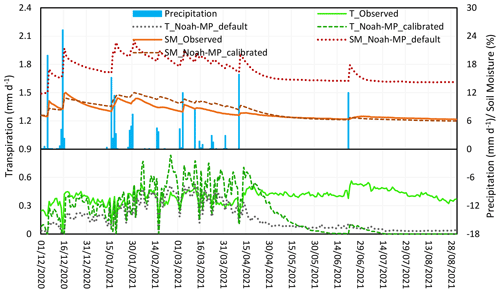
Figure A1Daily time series of observed precipitation, average soil moisture (SM) and tree transpiration (T), and the modeled SM and T for pine with the calibrated Noah-MP and for open shrubland with the Noah-MP default for the calibration period. The initial soil moisture content of the clay loam soil of the default Noah-MP was set equal to its wilting point (10.3 %) plus the initial moisture content of the sandy loam soil of the calibrated Noah-MP in the calibration period (7.2 %) minus its wilting point (6.0 %), resulting in an initial moisture content of (11.5 %).
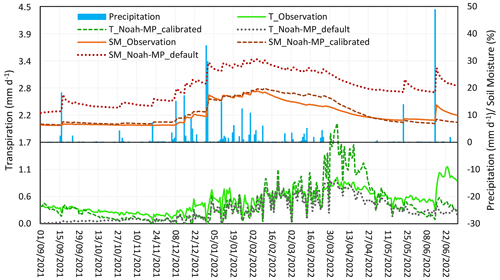
Figure A2Daily time series of observed precipitation, average soil moisture (SM) and tree transpiration (T), and the modeled SM and T for pine with the calibrated Noah-MP and for open shrubland with the Noah-MP default for the validation period. The initial soil moisture content of the sandy loam soil was 6.9 %, whereas that for the clay loam soil was set to 11.2 %, as described in Fig. A1.
The codes used in the development of all analyses can be made available from the authors upon request. The code used to run the Noah-MP land surface model can be found at https://doi.org/10.5281/zenodo.7901855 (He et al., 2023).
The model simulation data from this study are available from https://doi.org/10.5281/zenodo.10900317 (Amini Fasakhodi et al., 2024). Field data can be made available by the authors upon request.
MAF: conceptualization, data curation, formal analysis, investigation, methodology, software, validation, and writing – original draft; HD: data curation, formal analysis, investigation, methodology, and writing – review and editing; IS: data curation, formal analysis, investigation, software, and writing – review and editing; ME: investigation; AB: conceptualization, funding acquisition, methodology, supervision, and writing – review and editing.
The contact author has declared that none of the authors has any competing interests.
Publisher’s note: Copernicus Publications remains neutral with regard to jurisdictional claims made in the text, published maps, institutional affiliations, or any other geographical representation in this paper. While Copernicus Publications makes every effort to include appropriate place names, the final responsibility lies with the authors.
We would like to express our sincere thanks to the Cyprus Department of Forests and the Cyprus Department of Meteorology for their support of this research. This work has received financial support from the PRIMA (2018 call) SWATCH project and the Water JPI (joint call 2018) FLUXMED project. The PRIMA program is supported by Horizon 2020 within the European Union's Framework Programme for Research and Innovation.
This research has been supported by the Republic of Cyprus through the Research and Innovation Foundation (grant nos. P2P/PRIMA/0318/0022 and P2P/WATER/0218/0011).
This paper was edited by Elham R. Freund and reviewed by two anonymous referees.
Amini Fasakhodi, M., Djuma, H., Sofokleous, I., Eliades, M., and Bruggeman, A.: Modeling water balance components of conifer species using the Noah-MP model in an eastern Mediterranean ecosystem, Zenodo [data set], https://doi.org/10.5281/zenodo.10900317, 2024.
Ares, A. and Peinemann, N.: Fine-root distribution of coniferous plantations in relation to site in southern Buenos Aires, Argentina, Can. J. Forest Res., 22, 1575–1582, 1992.
Arsenault, K. R., Nearing, G. S., Wang, S., Yatheendradas, S., and Peters-Lidard, C. D.: Parameter sensitivity of the Noah-MP land surface model with dynamic vegetation, J. Hydrometeorol., 19, 815–830, https://doi.org/10.1175/JHM-D-17-0205.1, 2018.
Bagnoli, F., Vendramin, G. G., Buonamici, A., Doulis, A. G., González‐Martínez, S. C., La Porta, N., Magri, D., Raddi, P., Sebastiani, F. and Fineschi, S.: Is Cupressus sempervirens native in Italy? An answer from genetic and palaeobotanical data, Mol. Ecol., 18, 2276–2286, https://doi.org/10.1111/j.1365-294X.2009.04182.x, 2009.
Barlage, M., Tewari, M., Chen, F., Miguez-Macho, G., Yang, Z. L., and Niu, G. Y.: The effect of groundwater interaction in North American regional climate simulations with WRF/Noah-MP, Climatic Change, 129, 485–498, https://doi.org/10.1007/s10584-014-1308-8, 2015.
Boydak, M.: Silvicultural characteristics and natural regeneration of Pinus brutia Ten. – A review, Plant Ecol., 171, 153–163, https://doi.org/10.1023/B:VEGE.0000029373.54545.d2, 2004.
Burgess, S. S. O., Adams, M. A., Turner, N. C., Beverly, C. R., Ong, C. K., Khan, A. A. H., and Bleby, T. M.: An improved heat pulse method to measure low and reverse rates of sap flow in woody plants, Tree Physiol., 21, 589–598, https://doi.org/10.1093/treephys/21.9.589, 2001.
Cai, X., Yang, Z. L., Xia, Y., Huang, M., Wei, H., Leung, L. R., and Ek, M. B.: Assessment of simulated water balance from Noah, Noah-MP, CLM, and VIC over CONUS using the NLDAS testbed, J. Geophys. Res.-Atmos., 119, 13751–13770, https://doi.org/10.1002/2014JD022113, 2014.
Chambel, M. R., Climent, J., Pichot, C., and Ducci, F.: Mediterranean Pines (Pinus halepensis Mill. and brutia Ten.), in: Forest Tree Breeding in Europe: Current State-of-the-Art and Perspectives, edited by: Pâques, L. E., Springer Netherlands, Dordrecht, 229–265, https://doi.org/10.1007/978-94-007-6146-9_5, 2013.
Chen, F., Barlage, M., Tewari, M., Rasmussen, R., Jin, J., Lettenmaier, D., Livneh, B., Lin, C., Miguez‐Macho, G., Niu, G. Y., Wen, L., and Yang, Z. L.: Modeling seasonal snowpack evolution in the complex terrain and forested Colorado Headwaters region: A model intercomparison study, J. Geophys. Res.-Atmos., 119, 13–795, https://doi.org/10.1002/2014JD022167, 2014.
Chen, J., Chen, B., Black, T. A., Innes, J. L., Wang, G., Kiely, G., Hirano, T., and Wohlfahrt, G.: Comparison of terrestrial evapotranspiration estimates using the mass transfer and Penman-Monteith equations in land surface models, J. Geophys. Res.-Biogeo., 118, 1715–1731, https://doi.org/10.1002/2013JG002446, 2013.
Chen, L., Li, Y., Chen, F., Barr, A., Barlage, M., and Wan, B.: The incorporation of an organic soil layer in the Noah-MP land surface model and its evaluation over a boreal aspen forest, Atmos. Chem. Phys., 16, 8375–8387, https://doi.org/10.5194/acp-16-8375-2016, 2016.
Corona, R. and Montaldo, N.: On the transpiration of wild olives under water-limited conditions in a heterogeneous ecosystem with shallow soil over fractured rock, J. Hydrol. Hydromech., 68, 338–350, https://doi.org/10.2478/johh-2020-0022, 2020.
Cuntz, M., Mai, J., Zink, M., Thober, S., Kumar, R., Schäfer, D., Schrön, M., Craven, J., Rakovec, O., Spieler, D., and Prykhodko, V.: Computationally inexpensive identification of noninformative model parameters by sequential screening, Water Resour. Res., 51, 6417–6441, https://doi.org/10.1002/2015WR016907, 2015.
Cuntz, M., Mai, J., Samaniego, L., Clark, M., Wulfmeyer, V., Branch, O., Attinger, S. and Thober, S.: The impact of standard and hard-coded parameters on the hydrologic fluxes in the Noah-MP land surface model, J. Geophys. Res.-Atmos., 121, 10676–10700, https://doi.org/10.1002/2016JD025097, 2016.
Del Campo, A. D., Fernandes, T. J., and Molina, A. J.: Hydrology-oriented (adaptive) silviculture in a semiarid pine plantation: How much can be modified the water cycle through forest management?, Eur. J. Forest Res., 133, 879–894, https://doi.org/10.1007//s10342-014-0805-7, 2014.
Djuma, H., Bruggeman, A., Eliades, M., and Zoumides, C.: Water use of drought-tolerant coniferous trees (Pinus brutia and Cupressus sempervirens) in a semi-arid environment, Ecohydrology, accepted, 2024.
Eliades, M., Bruggeman, A., Lubczynski, M. W., Christou, A., Camera, C., and Djuma, H.: The water balance components of Mediterranean pine trees on a steep mountain slope during two hydrologically contrasting years, J. Hydrol., 562, 712–724, https://doi.org/10.1016/j.jhydrol.2018.05.048, 2018.
Eliades, M., Bruggeman, A., Djuma, H., Christou, A., Rovanias, K., and Lubczynski, M. W.: Testing three rainfall interception models and different parameterization methods with data from an open Mediterranean pine forest, Agr. Forest Meteorol., 313, 108755, https://doi.org/10.1016/j.agrformet.2021.108755, 2022.
Ek, M. B., Mitchell, K. E., Lin, Y., Rogers, E., Grunmann, P., Koren, V., Gayno, G., and Tarpley, J. D.: Implementation of Noah land surface model advances in the National Centers for Environmental Prediction operational mesoscale Eta model, J. Geophys. Res.-Atmos., 108, 8851, https://doi.org/10.1029/2002JD003296, 2003.
Ganopoulos, I., Aravanopoulos, F., Madesis, P., Pasentsis, K., Bosmali, I., Ouzounis, C., and Tsaftaris, A.: Taxonomic identification of Mediterranean pines and their hybrids based on the High-Resolution Melting (HRM) and trnL approaches: from cytoplasmic inheritance to timber tracing, PLoS One, 8, e60945, https://doi.org/10.1371/journal.pone.0060945, 2013.
Gochis, D. J., Barlage, M., Cabell, R., Casali, M., Dugger, A., FitzGerald, K., McAllister, M., McCreight, J., RafieeiNasab, A., Read, L., Sampson, K., Yates, D., and Zhang, Y.: The WRF-Hydro® modeling system technical description, (Version 5.1.1), NCAR Technical Note, 108 pp., https://ral.ucar.edu/projects/wrf_hydro/documentation/wrf-hydro-v511-documentation (last access: 19 November 2024), 2020.
He, C., Barlage, M., Valayamkunnath, P., Gill, D., Mocko, D., and Chen, F.: NCAR/noahmp: Release of v5.0.0, Zenodo [code], https://doi.org/10.5281/zenodo.7901855, 2023.
Helman, D., Lensky, I. M., Yakir, D., and Osem, Y.: Forests growing under dry conditions have higher hydrological resilience to drought than do more humid forests, Glob. Change Biol., 23, 2801–2817, https://doi.org/10.1111/gcb.13551, 2017a.
Helman, D., Lensky, I. M., Osem, Y., Rohatyn, S., Rotenberg, E., and Yakir, D.: A biophysical approach using water deficit factor for daily estimations of evapotranspiration and CO2 uptake in Mediterranean environments, Biogeosciences, 14, 3909–3926, https://doi.org/10.5194/bg-14-3909-2017, 2017b.
Hogue, T. S., Bastidas, L. A., Gupta, H. V., and Sorooshian, S.: Evaluating model performance and parameter behavior for varying levels of land surface model complexity, Water Resour. Res., 42, W08430, https://doi.org/10.1029/2005WR004440, 2006.
Hoshika, Y., Fares, S., Savi, F., Gruening, C., Goded, I., De Marco, A., Sicard, P., and Paoletti, E.: Stomatal conductance models for ozone risk assessment at canopy level in two Mediterranean evergreen forests, Agr. Forest Meteorol., 234, 212–221, https://doi.org/10.1016/j.agrformet.2017.01.005, 2017.
Klein, T., Rotenberg, E., Cohen‐Hilaleh, E., Raz‐Yaseef, N., Tatarinov, F., Preisler, Y., Ogée, J., Cohen, S., and Yakir, D.: Quantifying transpirable soil water and its relations to tree water use dynamics in a water-limited pine forest, Ecohydrology, 7, 409–419, https://doi.org/10.1002/eco.1360, 2014.
Kostopoulou, P., Radoglou, K., Dini-Papanastasi, O., and Spyroglou, G.: Enhancing planting stock quality of Italian cypress (Cupressus sempervirens L.) by pre-cultivation in mini-plugs, Ecol. Eng., 36, 912–919, https://doi.org/10.1016/j.ecoleng.2010.04.004, 2010.
Kumar, S. V., Wang, S., Mocko, D. M., Peters-Lidard, C. D., and Xia, Y.: Similarity assessment of land surface model outputs in the North American Land Data Assimilation System, Water Resour. Res., 53, 8941–8965, https://doi.org/10.1002/2017WR020635, 2017.
Larsen, M. A., Refsgaard, J. C., Jensen, K. H., Butts, M. B., Stisen, S., and Mollerup, M.: Calibration of a distributed hydrology and land surface model using energy flux measurements, Agr. Forest Meteorol., 217, 74–88, https://doi.org/10.1016/j.agrformet.2015.11.012, 2016.
Liu, Y., Zhuang, Q., Miralles, D., Pan, Z., Kicklighter, D., Zhu, Q., He, Y., Chen, J., Tchebakova, N., Sirin, A., Niyogi, D., Niyogi, D., and Melillo, J.: Evapotranspiration in Northern Eurasia: Impact of forcing uncertainties on terrestrial ecosystem model estimates, J. Geophys. Res.-Atmos., 120, 2647–2660, https://doi.org/10.1002/2014JD022531, 2015.
Lu, S., Guo, W., Ge, J., and Zhang, Y.: Impacts of land surface parameterizations on simulations over the arid and semiarid regions: the case of the loess plateau in China, J. Hydrometeorol., 23, 891–907, https://doi.org/10.1175/JHM-D-21-0143.1, 2022.
Ma, N.: Modeling land-atmosphere energy and water exchanges in the typical alpine grassland in Tibetan Plateau using Noah-MP, Journal of Hydrology Regional Studies, 50, 101596, https://doi.org/10.1016/j.ejrh.2023.101596, 2023.
Meir, P. and Woodward, F. I.: Amazonian rain forests and drought: response and vulnerability, New Phytol., 187, 553–557, 2010.
Molina, A. J. and del Campo, A. D.: The effects of experimental thinning on throughfall and stemflow: A contribution towards hydrology-oriented silviculture in Aleppo pine plantations, Ecol. Manage., 269, 206–213, https://doi.org/10.1016/j.foreco.2011.12.037, 2012.
Montaldo, N., Corona, R., Curreli, M., Sirigu, S., Piroddi, L., and Oren, R.: Rock water as a key resource for patchy ecosystems on shallow soils: Digging deep tree clumps subsidize surrounding surficial grass, Earth's Future, 9, e2020EF001870, https://doi.org/10.1029/2020EF001870, 2021.
Niu, G. Y., Yang, Z. L., Mitchell, K. E., Chen, F., Ek, M. B., Barlage, M., Longuevergne, L., Kumar, A., Manning, K., Niyogi, D., Rosero, E., Tewari, M., and Xia, Y.: The community Noah land surface model with multiparameterization options (Noah-MP): Model description and evaluation with local-scale measurements, J. Geophys. Res., 116, D12109, https://doi.org/10.1029/2010JD015139, 2011.
Rog, I., Tague, C., Jakoby, G., Megidish, S., Yaakobi, A., Wagner, Y., and Klein, T.: Interspecific soil water partitioning as a driver of increased productivity in a diverse mixed Mediterranean forest, J. Geophys. Res.-Biogeo., 126, e2021JG006382, https://doi.org/10.1029/2021JG006382, 2021.
Rohatyn, S., Rotenberg, E., Ramati, E., Tatarinov, F., Tas, E., and Yakir, D.: Differential impacts of land use and precipitation on “ecosystem water yield”, Water Resour. Res., 54, 5457–5470, https://doi.org/10.1029/2017WR022267, 2018.
Skamarock, W. C., Klemp, J. B., Dudhia, J., Gill, D. O., Liu, Z., Berner, J., Wang, W., Powers, J. G., Duda, M. G., Barker, D. M., and Huang, X. Y.: A description of the advanced research WRF version 4, NCAR tech. note ncar/tn-556+ str, 145 pp., https://doi.org/10.5065/1dfh-6p97, 2019.
Simpson, J. E., Holman, F. H., Nieto, H., El-Madany, T. S., Migliavacca, M., Martin, M. P., Burchard-Levine, V., Cararra, A., Blöcher, S., Fiener, P., and Kaplan, J. O.: UAS-based high resolution mapping of evapotranspiration in a Mediterranean tree-grass ecosystem, Agr. Forest Meteorol., 321, 108981, https://doi.org/10.1016/j.agrformet.2022.108981, 2022.
Sofokleous, I., Bruggeman, A., Michaelides, S., Hadjinicolaou, P., Zittis, G., and Camera, C.: Comprehensive Methodology for the Evaluation of High-Resolution WRF Multiphysics Precipitation Simulations for Small, Topographically Complex Domains, J. Hydrometeorol., 22, 1169–1186, https://doi.org/10.1175/JHM-D-20-0110.1, 2021.
Sofokleous, I., Bruggeman, A., Camera, C., and Eliades, M.: Grid-based calibration of the WRF-Hydro with Noah-MP model with improved groundwater and transpiration process equations, J. Hydrology, 617, 128991, https://doi.org/10.1016/j.jhydrol.2022.128991, 2023.
Sun, R., Duan, Q., and Wang, J.: Understanding the spatial patterns of evapotranspiration estimates from land surface models over China, J. Hydrol., 595, 126021, https://doi.org/10.1016/j.jhydrol.2021.126021, 2021.
Ungar, E. D., Rotenberg, E., Raz-Yaseef, N., Cohen, S., Yakir, D., and Schiller, G.: Transpiration and annual water balance of Aleppo pine in a semiarid region: Implications for forest management, Forest Ecol. Manag., 298, 39–51, https://doi.org/10.1016/j.foreco.2013.03.003, 2013.
Vicente E., Vilagrosa A., Ruiz-Yanetti S., Manrique-Alba À., González-Sanchís M., Moutahir H., Chirino E., Del Campo A., and Bellot J.: Water balance of Mediterranean Quercus ilex L. and Pinus halepensis Mill. forests in semiarid Climates: A review in a Climate change context, Forests, 9, 426, https://doi.org/10.3390/f9070426, 2018.
Wang, S., Pan, M., Mu, Q., Shi, X., Mao, J., Brummer, C., Jassal, R. S., Krishnan, P., Li, J., and Black, T. A.: Comparing evapotranspiration from eddy covariance measurements, water budgets, remote sensing, and land surface models over Canada, J. Hydrometeorol., 16, 1540–1560, https://doi.org/10.1175/JHM-D-14-0189.1, 2015.
Yang, Z. L., Cai, X., Zhang, G., Tavakoly, A. A., Jin, Q., Meyer, L. H., and Guan, X.: The community Noah land surface model with multi-parameterization options (Noah-MP), Technical Description, The University of Texas at Austin, Austin, TX, USA, https://doi.org/10.13140/RG.2.1.4925.5921, 2011.
Yaseef, N. R., Yakir, D., Rotenberg, E., Schiller, G., and Cohen, S.: Ecohydrology of a semi-arid forest: Partitioning among water balance components and its implications for predicted precipitation changes, Ecohydrology, 3, 143–154, https://doi.org/10.1002/eco.65, 2010.
Zhan, S., Song, C., Wang, J., Sheng, Y., and Quan, J.: A global assessment of terrestrial evapotranspiration increases due to surface water area change, Earths Future 7, 266–282, https://doi.org/10.1029/2018EF001066, 2019.
Zhang, Y., Peña-Arancibia, J. L., McVicar, T. R., Chiew, F. H., Vaze, J., Liu, C., Lu, X., Zheng, H., Wang, Y., Liu, Y. Y., Miralles, D. G., and Pang, M.: Multi-decadal trends in global terrestrial evapotranspiration and its components, Sci. Rep., 6, 19124, https://doi.org/10.1038/srep19124, 2016.
Zheng, D., Van der Velde, R., Su, Z., Wen, J., Booij, M. J., Hoekstra, A. Y., and Wang, X.: Under-canopy turbulence and root water uptake of a Tibetan meadow ecosystem modeled by Noah-MP, Water Resour. Res., 51, 5735–5755, https://doi.org/10.1002/2015WR017115, 2015.


