the Creative Commons Attribution 4.0 License.
the Creative Commons Attribution 4.0 License.
Estimating response times, flow velocities, and roughness coefficients of Canadian Prairie basins
Paul H. Whitfield
Christopher Spence
John W. Pomeroy
The hydrology and hydrography of the Canadian Prairies are complex and difficult to represent in hydrological models. Recent studies suggest that runoff velocities on the Canadian Prairies may be much smaller than generally assumed.
Times to peak, basin-scale flow velocities and roughnesses were derived from hourly streamflow hydrographs from 23 basins in the central Alberta Prairies. The estimated velocities were much smaller than would be estimated from most commonly used empirical equations, suggesting that many existing methods are not suitable for estimating times to peak or lag times in these basins. Basin area was found to be a poor predictor of basin-scale rainfall-runoff flow velocity. Estimated velocities generally increased with basin scale, indicating that slow basin responses at small scales could be related to the predominance of overland and/or shallow sub-surface flow over the very level topography.
Basin-scale values of Manning's roughness parameter were found to be orders of magnitude greater than values commonly used for streams in other parts of the world. The very large values of roughness call into question whether the Manning equation should be used to calculate runoff in the prairies. These results have important implications for calculating rainfall runoff in this region since using widely published values of roughness will result in poor model estimation of streamflow hydrographs. It is likely that the Darcy–Weisbach equation, which is applicable to all flow regimes, may perform better in high-resolution hydrological models of this region. Further modelling and field research will be required to determine the physical causes of these very small basin-scale velocities.
- Article
(4431 KB) - Full-text XML
- BibTeX
- EndNote
Hydrological modelling is notoriously difficult on the Canadian Prairies. The difficulty is due in part to the region's cold climate, the hydrological processes of which are rarely represented well, if at all, by hydrological models developed for more temperate regions. It is also due to the region's complex hydrography, which is dominated by the presence of millions of depressions which can intercept runoff. Only a few hydrological models can simulate the variable contributing areas of prairie basins which depend on the states of water storage in the depressions (Shook et al., 2013).
In addition to the difficulties presented by the region's hydrology and hydrography, recent research has estimated runoff velocities on the Canadian Prairies which appear to be much smaller than seen in other locations (Costa et al., 2020). If very small runoff velocities are a general feature of the Canadian Prairies, they will also make hydrological modelling difficult, particularly in determining the appropriate values of the roughness parameters for achieving the required velocities and therefore flow rates.
An example of a very slow prairie event is shown in Fig. 1, where a flood wave took about 39 h to travel approximately 1.8 km from the inlet to the outlet of a small (gross area ≈ 1.2 km2) hummocky sub-basin near St. Denis, Saskatchewan, Canada, within the St. Denis Research Basin (SDRB). SDRB is a small (22.1 km2), relatively hummocky and endorheic basin which has been studied for more than 50 years. The basin is described in detail in Brannen et al. (2015).
The travel time of the flood wave yields a celerity value of approximately 0.013 m s−1. If the flows are entirely overland and turbulent, then Eq. (7) (described below) would imply that the water velocity was less than 0.008 m s−1.
Costa et al. (2020) used a detailed 2D hydrodynamic model (FLUXOS-OVERFLOW) to model flows at Steppler Watershed, a small (∼2.1 km2) basin in southern Manitoba. The only empirical parameter in the model was the vegetation height at which a velocity of zero would occur, which was estimated from the work of Brannen (2015). The model produced overland flow velocities smaller than 0.05 m s−1.
Bjerklie (2007) listed bankfull stream velocities between 0.68 and 3.21 m s−1 for rivers in Alberta, some of which lie within the prairies. As the velocities estimated by Brannen et al. (2015) and Costa et al. (2020) are orders of magnitude smaller than the values of Bjerklie (2007), many questions are raised about (a) the causes of the small apparent velocities at St. Denis and Steppler Watershed, (b) the extent to which similar values are found in the prairies and (c) how small velocities can be represented in hydrological models by using appropriate values of roughness coefficients.
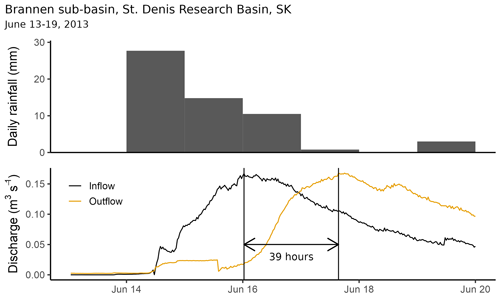
Figure 1Plots of daily rainfall and sub-hourly inflows and outflows for Brannen sub-basin, St. Denis Research Basin, SK, 13–19 June 2013.
Slow runoff flows on the prairies are believed to be influenced by the region's peculiar hydrology and hydrography. The climate of the prairie ecozone is generally semi-arid and experiences long, cold winters that freeze soils deeply (Willis et al., 1961; Sharratt et al., 1999). The hydrology of the prairie ecozone is dominated by cold-region processes, including the accumulation and redistribution of winter snowpacks (which are controlled by the erosion, transportation, deposition and sublimation of snow by wind), the spring melt of the snowpacks and the infiltration into frozen soils (Pomeroy et al., 1998). Because the soils are generally deep and the region is semi-arid, the soils are rarely saturated (Pennock et al., 2011). Runoff in the region predominantly occurs during the spring melt freshet over frozen soils; runoff due to rainfall events also occurs and may be increasing with changes in precipitation phase and duration caused by climate change (Shook and Pomeroy, 2012; Dumanski et al., 2015).
The hydrography of the Canadian Prairies is complex. The typical gentle slopes within the region are partly a product of the continental glaciers that covered the area until comparatively recently (∼10 000 years BP; Christiansen, 1979). As the climate is semi-arid, there has not been sufficient energy, time or overland flow to erode conventional drainage systems in much of the region. As shown by Bemrose et al. (2009), the mean annual depths of runoff in prairie basins are much smaller than in most of the rest of southern Canada. Much of the prairie precipitation and runoff is trapped in depressions, known locally as “sloughs” or “potholes”. When the depressions are filled, it is possible for flows to occur between them through a process analogous to “fill-and-spill” (Spence and Woo, 2003; Leibowitz and Vining, 2003; McDonnell et al., 2021). Thus, in these basins the areal fraction contributing flows to the outlet is dynamic, changing with the states of water storage in the depressions (Shaw et al., 2012; Stichling and Blackwell, 1957). In Canada, those areas that do not contribute flow to a stream or lake for return periods of 2 years or less because of downstream depression storage are designated “non-effective” (Godwin and Martin, 1975). The extent of the non-effective region within the study region is mapped in Fig. 2.
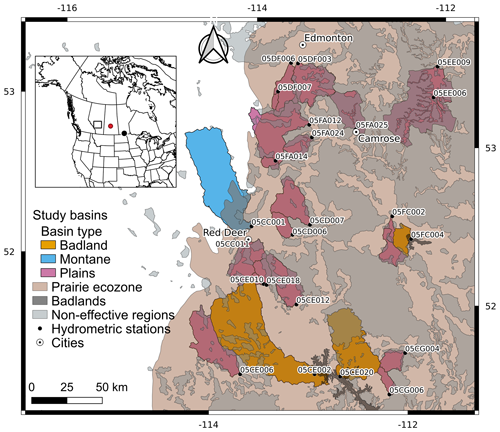
Figure 2Map of the study basins in central Alberta, shaded by basin type. The Canadian Prairie ecozone (tan shading), non-effective regions (light-grey shading) and badlands (dark-grey shading) are also plotted. The locations of the gauging stations of the Alberta study basins are plotted as black dots. The basins are shaded according to their topographic type. Cities within the region are plotted as small dots within circles. The inset map shows the location of the larger map within North America as a rectangle; the locations of SDRB and Steppler Watershed are plotted as red and black dots, respectively. The projection is UTM13.
Hydraulic modelling programmes have been widely used within the Canadian Prairies to model flows within river channels, but they have not been widely used to model overland flows. Costa et al. (2020) demonstrated the use of a hydraulic model to simulate overland flows within a very small (∼2.1 km2) basin. Because of the region's complex hydrology, hydraulic models with simplistic representations of cold-region hydrological processes (including snowfall sublimation, redistribution by the wind and infiltration to deeply frozen soils) invariably fail in this region. Costa et al. (2020) avoided this problem by forcing their hydraulic model with streamflow data.
Many of the basins on the Canadian Prairies are very large; the basins in this study are up to 1150 times as large as that those modelled by Costa et al. (2020). Hydraulic models have the disadvantage of being very computationally intensive as they need to simulate at very small space scales and timescales. Because of the region's complex hydrography, any hydraulic model will need to operate in at least 2 dimensions, further increasing its computational costs. High-resolution hydraulic models require high-resolution soil, vegetation and digital elevation model (DEM) data, which may not be available or may be expensive to obtain.
In contrast, hydrological modelling programmes such as the Cold Regions Hydrological Modelling platform (CRHM) (Pomeroy et al., 2022) and Modélisation Environmentale Communautaire–Surface and Hydrology (MESH) (Wheater et al., 2022) represent all the relevant cold-region processes. CRHM and MESH are semi-distributed models based on hydrological response units (HRUs) and grouped response units (GRUs), respectively. The programmes can also represent the varying contributing fractions of the prairie basins. Importantly, the data and computational requirements of models created using these programmes are relatively modest.
Given the challenges of using hydraulic models, it is likely that hydrological models will be important within the region for the foreseeable future. However, determining the surface roughnesses at HRU/GRU scales is not easy, particularly for those HRUs and GRUs which model overland flows rather than flows in channels. Successful parameterisation of hydrological models remains difficult without an understanding of the reason(s) for the apparent slow responses of the prairie streams. As an example, Annand (2022) described the tendency of a CRHM hydrological model of a prairie basin as too “flashy”, which required modification of the model structure.
The objectives of this research are to determine (a) whether small runoff flow velocities are a general feature of the study area and therefore of the Canadian Prairies, (b) whether the velocities can be related to any obvious basin-scale parameters and (c) what the effects of the flow velocities are on the basin-scale roughness parameters. The intent is not to determine basin-scale roughness parameters to be used by hydrological models, as these are distributed or semi-distributed and so invariably operate at much smaller (HRU, GRU or grid) scales. Rather, the intent is to aid in determining the cause(s) of the hypothesised slow responses of Canadian Prairie basins, which may help in estimating roughness parameters at smaller scales. This will also test the suitability of equations for modelling overland flows in the region.
This research is intended as a first step in identifying the scope of the phenomenon and will indicate the need for additional detailed field-based research. The results will inform hydrological modellers about the response times of streams in the region and the usefulness of published values of roughness parameters for streamflow modelling on the Canadian Prairies.
2.1 Study area
The studied region is in central Alberta, Canada, within which there were 23 hydrometric stations gauging unregulated streams during the selected period (2000–2019). This region is under dryland farming, i.e. without irrigation. The locations of the hydrometric stations are shown in Fig. 2. This portion of the Canadian Prairies was selected because it contains a relatively large number of hydrometric stations and a wide variety of topographies and other factors (stream lengths, surface geologies and depressional storages) believed to influence the basin responses and because it has a good network of precipitation gauges needed to identify high-flow events. Alberta's wetland regulations and policies require wetland drainage to be mitigated (Government of Alberta, 2015), and so it is believed that the study region has been less affected by drainage than have similar regions in Saskatchewan, Manitoba, North Dakota and Iowa. The centroid of the study region is distant from the previously mentioned SDRB (∼480 km) in Saskatchewan and Steppler Watershed (∼1090 km) in Manitoba, the locations of which are shown in the inset map in Fig. 2. If small velocities are documented in the study basins, then, in concert with the data for Steppler Watershed and St. Denis, it may be concluded that they are a feature of the Canadian Prairie landscape.
The basins are dominated by agriculture. According to data sourced from Agriculture and Agri-Food Canada (2009), the largest basin fraction classification is annual cropland (mean = 0.49, max = 0.8 and min = 0.21), followed by perennial crops and pasture (mean = 0.37, max = 0.65 and min = 0.12). The mean developed (i.e. built-up) fraction of the basins is 0.06.
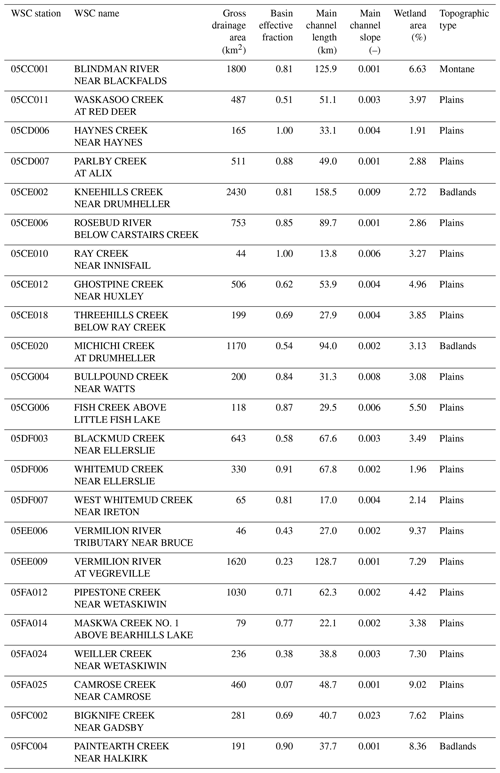
The physical attributes of the selected basins used in empirical equations for basin response times are listed in Table 1. The areas of the selected basins range from 44 to 2430 km2. As would be expected on the Canadian Prairies, the basins are relatively level, with the main channel slopes ranging from 0.0006 to 0.023 (mean = 0.004). The basin effective fractions (the areas producing runoff with a return period of 2 years divided by the gross basin areas) are between 0.07 (05FA025) and 1 (05CE010 and 05CD006), with a mean value of 0.69 as determined by the Prairie Farm Rehabilitation Administration (Godwin and Martin, 1975).
Although all of the hydrometric stations lie within the prairie ecozone, a small portion of basin 05FA012 lies outside it, as does most of basin 05CC001, which can be regarded as being largely a montane basin and which has the greatest basin fraction (0.14) occupied by deciduous trees. Several of the basins (05CE002, 05CE020 and 05FC004) contain badlands, which are deeply eroded river valleys with exposed clay soils. Basin 05CE020 had the greatest fraction (0.01) of exposed soils. These basins might be expected to respond differently from plains basins in the region, as runoff can be initiated from small rainfall events and the basins can have sub-surface pathways which are very different from other prairie basins (de Boer and Campbell, 1989). The selected Canadian Prairie basins are classified as “Plains”, “Badlands” or “Montane” in plots to determine whether there are differences in their responses.
2.2 Streamflow data
The Water Survey of Canada (WSC) publishes historical daily streamflows. To allow finer determination of basin responses, hourly streamflows for the selected stations were obtained directly from Water Survey of Canada officials. The hourly flows analysed were restricted to the period 24 May–1 September in each year to avoid snowmelt events. The hourly flows were acquired for the selected stations for the period 2000–2019. This period was selected because it spans both a historic drought period (1999–2005) and a recent wet period (2005–2015) experienced in western Canada. Previous research has indicated that the lengths and magnitudes of multi-day rain events have increased over time on the Canadian Prairies (Shook and Pomeroy, 2012; Dumanski et al., 2015; Szeto et al., 2015). Long-duration rainfall events are more likely than short-duration events to cause basin-wide runoff responses, so a recent period is more likely than an earlier period to contain many basin-scale runoff events. Many of the selected basins responded to large-scale rain events in the summer of 2011 (not shown here).
Manual gauging data (velocities and cross-sectional areas) were obtained directly from the Water Survey of Canada for the study stations for the period 2010–2015. As described below, the values were used to create open-water rating curves to estimate flow velocities from stage values.
2.3 Rainfall data
Daily rainfall values were downloaded from the Environment and Climate Change Canada website (https://climate.weather.gc.ca/, last access: 24 July 2022) using the R (R Core Team, 2013) package weathercan (LaZerte and Albers, 2018) for every available station within the study basins during the study period. Basin mean daily rainfalls were determined for each event analysed by gridding the station data using the R package gstat (Pebesma, 2004), using inverse-distance weighting, clipping the resulting grid to the basin boundaries using the R package raster (Hijmans, 2020) and calculating the mean of all grid cell values within the basin. The intent in determining the mean daily rainfall was only to confirm the existence of rainfall events which occurred before the streamflow peaks. Daily rainfall values were sufficient for this purpose.
2.4 Basin topographic data
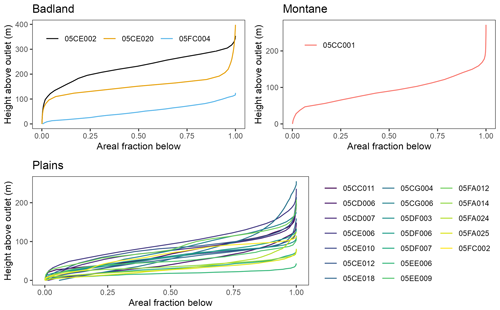
Shapefiles of the selected hydrological basins were obtained from Environment and Climate Change Canada. DEMs were obtained from the Shuttle Radar Topography Mission (SRTM) (Farr et al., 2007) version 3.0 (Siemonsma, 2015). The SRTM data have a vertical precision of 1 m and a horizontal resolution of 1 arcsec (approximately 30 m). The DEMs were used to delineate the basin channels and to estimate slopes for the study basins. All slopes presented herein are dimensionless (i.e. m m−1). Basin hypsometric curves (plotted in Fig. 3) demonstrate that two of the Badlands basins (05CE002 and 05CE020) and the Montane basin (05CC001) have more relief than any of the Plains basins.
As snowmelt runoff events dominate the hydrology of the Canadian Prairies, it might be assumed that snowmelt events would be the most useful for analysing the responses of prairie basins. Snowpacks are spatially extensive, thereby ensuring that most or all of a basin is responding to a given event. However, snowmelt-runoff events are much more complex than rainfall events. Within the Canadian Prairies, the ratios of instantaneous peak flows to daily peak flows have been shown to differ between rainfall and snowmelt events (Ellis and Gray, 1966). The spring melt of a prairie snowpack is a slow process, generally taking many days, and is controlled by the diurnal fluctuations of air temperature and, especially, incoming solar radiation (Pomeroy et al., 1998). As snow melts, the meltwater must travel through the snowpack via matrix flow and preferential paths (Leroux and Pomeroy, 2017), the lengths of which will change as the snowpack melts. Snow redistribution by wind causes highly variable snowpacks and extended snow cover depletion periods of partial snow cover and therefore partial contributing area for runoff (Shook and Gray, 1997). Runoff can be impeded by deep, cold snow drifts because of the transport of snow by wind (Pomeroy et al., 1993), further slowing the translation of runoff into streamflow (Woo and Sauriol, 1980).
Compared to those generated by snowmelt, rainfall-runoff events are simpler. Flow velocities estimated from rainfall events can provide base estimates of basin responses. As described in the next section, there are many existing empirical equations for basin response times. It is useful to compare the response times of prairie basins to these empirical relationships to determine whether prairie basins are slower to respond than would be expected from existing equations. All of the empirical equations are, however, based on rainfall events, meaning that only values derived from rainfall can be compared. For all these reasons, only rainfall-runoff events are evaluated here.
The research objectives were addressed by (a) estimating the observed response times of the 23 experimental basins to rainfall runoff, (b) determining the expected response times from existing empirical equations, (c) estimating the observed flood wave celerities and basin-scale velocities and (d) determining basin roughness factors.
The premise of this research is that the hydrological responses to rainfall and the underlying runoff velocities in prairie basins are much slower than in many other regions. To avoid false confirmation of the premise, all assumptions herein are made as conservative as possible, i.e. acting to maximise the estimated basin velocities.
3.1 Observed basin response times
To determine whether the experimental basins responded slowly to rainfall, it is necessary to determine (a) the response time for each basin and (b) the response times that would have been expected from existing empirical equations.
There are many ways of quantifying observed response times of basin streamflows to rainfall runoff, including the time of concentration (tc), the lag time (tl) and the time to peak (tp). These terms have been present in the hydrological literature for a long time, although the distinctions between them are rarely clear (Gericke and Smithers, 2014) and the terms may have multiple definitions (McCuen, 2009). Gericke and Smithers (2014) demonstrated four different definitions of tc, two of which have also been used to define tl. They also demonstrated conflicting definitions between tp and tl. The meanings of the time of concentration (tc), lag time (tl) and time to peak (tp) are defined here as follows:
-
Lag time (tl) is defined as the time between the centroid of effective rainfall, i.e. that exceeding a loss function and that of the peak discharge (Gericke and Smithers, 2014). Determination of tl requires modelling of rainfall losses.
-
Time of concentration (tc) as a concept dates from at least 1851 (Beven, 2020) and is considered to be the time required for water to travel from the most distant point in the basin to the outlet. There is no way to ascertain this value experimentally (Langridge et al., 2020).
-
Time to peak (tp) was defined by Gericke and Smithers (2014) as “the time from the start of effective rainfall to the peak discharge in a single-peaked hydrograph”, i.e. from the onset of runoff to the peak. However, the methodology applied here uses the more recent definition of Langridge et al. (2020), which is “the rise time of a storm hydrograph, encompassing the time from the first stream contributions from a precipitation event to the arrival of the peak flow”. Using this definition, it is relatively straightforward to determine the value of tp directly from event hydrographs.
There are likely to be differences in the values of the three response times (tp, tc and tl) due to their differing definitions. In particular, the times of the centroid of the effective precipitation and the onset of the rise of the hydrograph would be expected to differ. However, the extent of this difference is not known for the basins being investigated.
3.2 Observed times to peak
Times to peak were estimated for the selected basins from observed event hydrographs, similar to the procedures of Holtan and Overton (1963) for estimating basin response times. The procedure consisted of (a) identifying peak flows, (b) selecting events with simple peaks, (c) determining the time of the initial point of rise for each event and (d) subtracting the time of the initial rise from that of the peak flow. An example of a typical peak event, for basin 05CC001, is shown in Fig. 4.
Peaks were identified in the hourly WSC flows for summer (24 May–1 September) periods, using a variant of the function ch_get_peaks in the R package CSHShydRology (Anderson et al., 2019). The modification was necessary to adapt the function to work with hourly rather than daily flows. The function extracts peaks over a threshold: here, the 80th quantile was used. The function extracts sequences of points greater than the threshold and prepends and appends values for four additional time steps to ensure a time series of at least nine values where only a single hour exceeds the threshold. In total, 195 peaks were identified among the basins.
A subset of 101 simple events was extracted; these events had low flows before the event, several days of rainfall and an obvious single peak. The identification of simple peak events is potentially arbitrary but was conservative as the process could only reduce the maximum values of tp estimated for the basins. The initial point of rise for each event was defined as the time when the flows exceeded 1 % of the difference between the minimum flow and the peak flow. This threshold was used to avoid any effects of small variations in hourly streamflows.
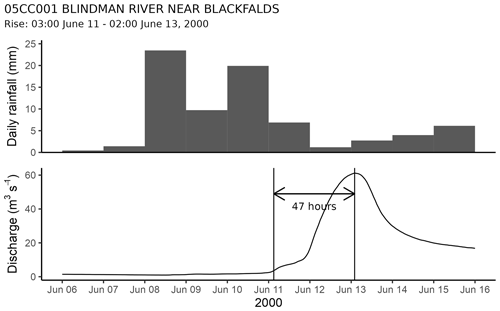
Figure 4Mean basin daily rainfall and hourly discharge hydrograph of station 05CC001, BLINDMAN RIVER NEAR BLACKFALDS. The peak occurs on 13 June at 02:00 Mountain Standard Time. The period of rise begins at 03:00 on 11 June, resulting in a time to peak of 47 h.
Many of the basins are large (maximum gross area = 2430 km2) and it is difficult for rainfall events, in particular intense convective storms, to cause basin-wide responses. The largest event time to peak for each basin was selected as the value of the basin tp, as it is assumed to best represent the response of the basin. It is possible that the actual tp of a basin may exceed that of the longest event in our time series. Precipitation events large enough to cause runoff over a whole basin may have runoff durations that are shorter than the time of concentration of the basin, causing the basin responses to be asynchronous and resulting in reduced peak times. Thus, the maximum observed peak time may underestimate the true response time of a basin. The assumption that the entire basin is contributing flow to the events is conservative.
3.3 Response times from existing empirical equations
Published empirical equations were used to estimate the values of tl, tp and tc for the study basins. As noted by Grimaldi et al. (2012), the values of tc (and therefore consequent estimations of flow velocities and roughness parameters) computed using empirical relationships can vary widely (by up to 500 % in their study) for a given basin. Therefore, several empirical equations were used to estimate the response times of the study basins.
Modelling based on these empirical relationships requires caution and understanding of the assumptions of any chosen for use. The empirical relationships are based on quite limited sets of observations, and extrapolation to different landscapes can be challenging. As will be seen, most available empirical equations fail on the landscapes in this study, so modelling based on those relationships is likely to be unsuccessful.
As discussed above, because tl begins at the centroid of effective rainfall rather than the point of rise of the stream, there would be an expected difference between its value and that of tp. However, in the example plotted in Fig. 4, it is evident that the centroid of the daily precipitation before the peak greatly preceded the initial rise of the hydrograph because of its very slow response. Accordingly, it is unlikely that the centroid of the effective precipitation would have occurred after the initial rise, meaning that using tp to test computed tc values will be conservative in that the value of tc for the stream would likely be slightly greater than tp. Therefore, the definitions of the empirical response times are deemed to be similar enough that they can be compared with the observed tp values, despite the differences in their definitions.
Note that the equations given below are as they are taken from the literature, so the symbols used and their units vary. The values of the basin parameters used by the empirical equations are given in Table 1. Each of the empirical response times is denoted by a letter designating the researcher whose equation is used. For example, tc as developed by Kirpich (1940) is designated as tcK. The designation is applied to the equation and to values calculated from the equation of each researcher.
Sheridan (1994) and Gericke and Smithers (2014) list many equations for estimating response times of rainfall-runoff hydrographs in flat regions. The equations used in this study to estimate basin response times were selected because they employ simple parameters based on basin dimensions (such as the area, length and slope of the main stream channel), without requiring regionally specific coefficients that may not be available for the Canadian Prairies. The equations were also selected to avoid parameters such as stream density, which are difficult to apply to intermittent streams such as those in prairie basins or would be unavailable.
The equation of Kirpich (1940) for tc was developed for very small (areas between 0.005 and 0.453 km2) and comparatively steep (slopes between 0.0399 and 0.0978) basins in Tennessee. Kirpich (1940) stated that the relationships used to derive the equation were valid “for the average small agricultural area ranging from 1 to 200 acres”, i.e. between 0.004 and 0.81 km2. Despite its unsuitability for prairie basins, the equation is included here because it familiar to many hydrologists. The equation (as cited by Gericke and Smithers, 2014) defines the time of concentration, tcK (h), based on the main channel length (Lc, km) and the main channel slope (Sc) as
Although stream channel delineations are available from Natural Resources Canada (2004), the stream channel vectors are discontinuous in many places, probably because of the effects of depressions. Therefore, the main channel length was calculated from the SRTM DEM of each basin, using the Free Open Source Software (FOSS) GIS Whitebox GAT (Lindsay, 2016). The value of Sc was calculated as the difference in elevation between the divide and the outlet (m), divided by Lc converted to metres.
Watt and Chow (1985) developed a relationship for tl (h) as
where Lc is in metres rather than kilometres.
The equation was developed for basins in the Midwestern United States and Quebec with areas between 0.005 and 5840 km2, channel slopes between 0.001 and 0.09 and main channel lengths between 100 m and 200 km (Watt and Chow, 1985), so it can be considered applicable to the study basins (see the basin parameters in Table 1).
James et al. (1987) developed tp equations from 48 basins with areas between 0.73 and 62.2 km2 in Arizona, Arkansas, Iowa, Louisiana, Mississippi, Nebraska, North Carolina, Ohio, Oklahoma, Tennessee, Texas, Virginia and Wisconsin. James et al. (1987) defined tp as “the time from the beginning of the rainfall excess to the peak discharge (hr)”, which is the same definition as that of Gericke and Smithers (2014).
The equation for the flattest basins (i.e. where slopes <5 %) is a function of A the basin area (km2), HT the maximum difference in elevation between the divide and the outlet (m) and L the distance to the divide (km):
The distance to the divide (L) is defined here as the Euclidean distance from the outlet to the farthest point on the basin divide. For the study basins, the location of the farthest point from the outlet was determined by clipping the SRTM DEM using the shapefile of the basin divide and finding the distance from each DEM cell on the raster divide to the outlet with an R script containing the packages raster (Hijmans, 2020) and sp (Pebesma and Bivand, 2005). The value of HT was estimated using the same script as the difference in elevation between the highest cell of the basin divide and that of the outlet.
Capece et al. (1988) related tl (h) to the drainage area (A, ha) and also included the percentage of wetlands (W) as
The Florida basins modelled in Capece et al. (1988) were very small (areas between 0.08 and 14.5 km2). The basin slopes ranged from 0.0008 to 0.0015. The “percentage of wetlands” varied between 0 and 23. However, the meaning of this term is uncertain. It is believed to refer to the percentage of wetland area within each basin.
W was calculated for each of the basins in this study by obtaining wetland percentages for homogeneous polygons from Alberta Agriculture and Forestry, Government of Alberta (2016). The polygons were weighted by their areas, clipped to the experimental basin boundaries and then aggregated by using the FOSS GIS program QGIS (QGIS Development Team, 2009). The values of W for the experimental basins ranged from 1.9 % to 9.4 %.
Sheridan (1994) compared several empirical equations, including those of Capece et al. (1988), James et al. (1987), Kirpich (1940) and Watt and Chow (1985), to experimental values for nine flat basins in the south-eastern United States, finding that all the empirical equations studied grossly underestimated the actual responses. In response, Sheridan (1994) developed a simple empirical equation for tc (h) based on the basin drainage area (DA, km2):
The basins used by Sheridan (1994) were small, with areas ranging from 2.62 to 334 km2. The channel slopes ranged from 0.001 to 0.0035.
Langridge et al. (2021) developed a modified version of the model first presented in Langridge et al. (2020). The revised model replaced coefficients defining the basin wetness, which required values rarely measured in North America, with coefficients whose values are more easily determined. The revised Eq. (6) for tp (h) is based on Qp the peak streamflow (m3 s−1) and L the longest drainage path (km):
The exact meaning of the definition of L is unclear, so it is assumed that the value of L is the same as that of Lc in Eq. (3). The values of C1 and C2 (dimensionless) are taken from nine classifications determined by the historical wetness of the basin and the season. The historical wetness of the basin is indexed by Rc, the ratio of mean annual discharge depth to mean annual precipitation. According to Langridge et al. (2021), “wet” basins have Rc values greater than or equal to 0.7; basins with Rc values less than 0.5 are classified as “dry”. Values of C1 and C2 are provided for wet, dry and average basins in seasons which are assumed to be “wet” (December through March), “dry” (June through September) and “average” (April, May, October and November). The modified model was tested for basins in the UK, Massachusetts and Ontario.
Values of Rc computed from historical precipitation and streamflows for the experimental basins were found to be between 0.019 and 0.068, the mean being 0.041. These are typical of values found in the western Canadian Prairies. The corresponding values of C1 and C2 for dry basins during the dry season, as determined from the plot in Langridge et al. (2021), were 0.0031 and 0.9593, respectively.
None of the empirical equations was developed from basins exactly like those in this study. The areas of the basins used to develop the equation of Watt and Chow (1985) overlap those of the selected central Alberta basins and the channel slopes are similar, but the equation “has not been tested and may not apply for … basins with large lake and swamp storage”. The large depressional storages of many of the experimental basins indicate that the equation may not apply to them.
The equation of James et al. (1987) was developed for fairly level basins, but their range of areas only overlaps the five smallest study basins presented here. The equation of Capece et al. (1988) was developed for very flat basins containing wetlands, but the basins used for developing the equation were smaller than any basin selected for this study. The areas of the basins used by Sheridan (1994) overlap those of the study basins, but the original basin areas in ponds and lakes ranged from 0.11 % to 2.34 % and are much smaller than in many prairie basins. The areas of the basins used by Langridge et al. (2021) are not known, but the climates of their basins are far wetter than the Canadian Prairies.
3.4 Wave celerities and water velocities
For each basin, the celerity of the flood wave (McDonnell and Beven, 2014) was calculated by dividing the observed value of Lc by tp. The actual distance that water flows in each event is unknown, particularly for those basins which have large non-effective fractions, where the area of the basin contributing flow is strongly influenced by the storage of water in depressions. However, the use of Lc derived from the gross drainage area is conservative, as it represents the maximum distance that water could travel in the main channel; dividing Lc by tp can only overestimate the celerity of an event.
The relationship between the celerity of a wave (c) and the water velocity (v) is often expressed as
where β is a constant.
Many theoretical relationships have been developed for β, depending on the channel properties (dimensions and roughness), but a value of is often used for wide channels with turbulent flows (Wong and Zhou, 2006). As velocities decrease, the value of β increases. When flows are fully laminar, β = 3 (Wong and Zhou, 2006). Therefore, when flows are turbulent, basin-scale water velocities can be estimated from flood wave celerities by solving Eq. (7) for v, assuming that β = . As discussed below, the regime(s) of the flows in this study are unknown and may lie in the laminar region in the transition from turbulent to laminar flow, or they may be fully turbulent as Reynolds numbers for shallow overland flow are not necessarily in the turbulent range (Schroers et al., 2022). Estimating the velocities from the celerities by assuming that β equals is conservative for this study in that it gives larger estimated velocity values.
Observed streamflow velocities provide useful comparisons with the empirically derived and computed basin-scale flood wave velocities. As velocity data are not generally available at the time of peak flows, stream velocities were estimated from manual depth–velocity streamflow measurements taken at the hydrometric stations. These values were supplied by Water Survey of Canada staff. The mean velocity of a stream is a power-law function of the hydraulic radius (Eq. 9), which is approximated by the flow depth in a wide natural channel. Rating curves relating the discharge of a stream to its stage are also typically power-law functions. Therefore, the relationship between the mean velocity and the discharge at a point is assumed to also be a simple power law. Curves of the mean stream velocity as a function of discharge were developed by fitting linear models of the log10 values of the observed mean velocities and the log10 values of the observed discharges. The velocity–discharge curve from each gauging site was used to estimate stream velocities from the peak flows corresponding to the tp values.
Manual gauging values obtained between 24 May and 1 September (which very conservatively approximate the frost-free period on the Canadian Prairies) were used to develop the rating curves to ensure that the values were not affected by ice. A threshold of at least five manual gauging values through the study period was selected as the minimum needed to derive a curve. Because the water depths and velocities were zero during many of the summer manual gaugings, curves could only be derived for 18 streams.
3.5 Basin roughness coefficients
Roughness coefficients were estimated from basin-scale flow velocities calculated from the observed tp values and the basin dimension parameters. The roughness coefficients can be compared to other study values to evaluate the suitability of commonly used equations for modelling streamflows in these basins.
3.5.1 Manning's n
The Manning open-channel flow equation is widely used in hydrology, although its usefulness has been questioned (Ferguson, 2010). The equation assumes turbulent flow. In Europe, Manning's equation is known as the Gauckler–Manning–Strickler or Gauckler–Manning formula. Manning's equation is expressed in SI units (Schneider and Arcement, 1989) as a function of v (stream velocity, m s−1), R (hydraulic radius, m), Se (slope of the energy grade line (dimensionless) which is approximated by the stream slope S) and n (roughness coefficient, m s):
To test the applicability of Manning's equation to the region of interest, Eq. (8) is solved for n using experimentally derived values for v, R and S. The values of n produced in this manner are basin-scale estimates and are not intended to be used for modelling or other calculations.
The hydraulic radius is defined as the quotient of a (cross-sectional area of flow, m2) and wp (wetted perimeter, m):
As Q=va, , where the value of Q is that of the peak discharge for each of the events.
Assuming rectangular cross sections of flow, the flow width (w) and depth (d) are related to a as
So, knowing a and assuming a value of the width : depth ratio, the depth can be estimated. Similarly, the wetted perimeter can be estimated as
For gently sloping rivers (i.e. with slopes less than 0.005) in Canada, the USA and New Zealand, width : depth ratios have been found to be as great as 40 (Rosgen, 1994). Bjerklie (2007) listed bankfull width : depth ratios for 19 Alberta rivers, with values ranging from 11.1 to 66 and a mean of 37.9. Using the manual gauging values, the mean depth can be estimated as the quotient of the cross-sectional area and the width of the flow. The maximum width : depth ratio was selected for each station to estimate Manning's n as it is the most conservative; small values of the width : depth ratio will result in large values of n. The maximum width : depth ratios were determined for all the gauging sites (min = 13.2, mean = 48.2 and max = 144), and values of n were estimated for all the basins.
3.5.2 Darcy–Weisbach f
The Darcy–Weisbach equation, although less widely used than Manning's, has the advantage of being applicable across all flow regimes, from laminar to fully turbulent.
Darcy–Weisbach roughness coefficient f values (dimensionless) were calculated from the study velocities. Comparing the study's f values to published empirical values derived from research plots allows determination of the ability of the Darcy–Weisbach equation to be used as a robust routing method in hydrological models in gently sloping agricultural basins. For open-channel flows, the equation for f can be written as follows (Gilley et al., 1992), where g is the acceleration of gravity (9.81 m s−2):
4.1 Observed times to peak
In total, 101 clear, simple rainfall-runoff events were found among the 23 basins. Hydrographs demonstrate that the observed times to peak varied widely amongst, and within, basins (Fig. 5). In the majority of the basins (05CC001, 05CD006, 05CD007, 05CE002, 05CE012, 05CE018, 05CE020, 05CG006, 05DF003, 05DF006, 05DF007, 05FA024 and 05FC002), the largest events in each basin have similar response times (Fig. 5). Several basins (05CC011, 05EE006 and 05FA024) display flashy event hydrographs showing sharp rising and falling limbs, with short times to peak. It is assumed that these events were caused by runoff events that did not cause much of the basin to respond. Although the hydrographs are coloured according to the basin topographic type, there do not seem to be substantial differences in the responses by basin type. Basin 05FA025 only had a single event, which featured a slow rise followed by a flat response and a delayed peak. The shape of the hydrograph was due to the basin's very slow responses to two precipitation events. To avoid overestimating the basin response time, the “shoulder” of the hydrograph, which was the response to the first event, was taken as the peak, resulting in a time to peak of 190 h.
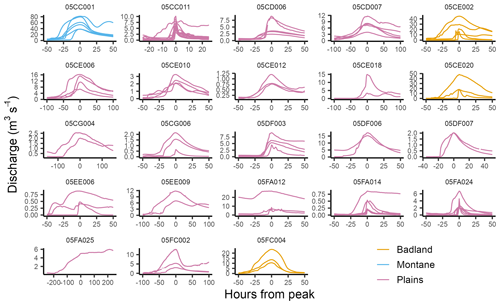
Figure 5Hydrographs of all events by basin, coloured according to basin topographic type. Note that the scales of the axes vary among the panels.
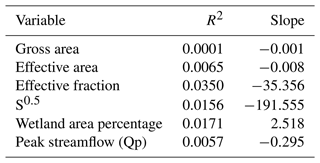
The observed event times to peak are provided in the published data set. Table 3 lists the observed tp value (i.e. the maximum event tp) for each basin. There appears to be little relationship between the observed tp and the basin parameters, as shown by the correlation coefficients of linear models in Table 2. The lack of any significant correlation with the gross basin area is particularly surprising, given that the empirical equations of James et al. (1987), Capece et al. (1988) and Sheridan (1994) are functions of the basin area and those of Kirpich (1940) and Watt and Chow (1985) are functions of Lc, which is a function of basin area (Gray, 1961).
4.2 Empirical equation response times
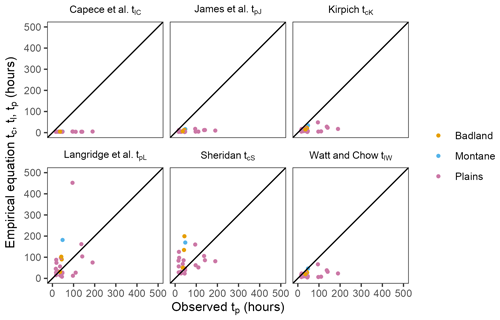
Figure 6 plots the empirical equation response times against the observed tp for each study basin. The empirical tl, tc and tp values computed from the Capece et al. (1988) (mean empirical : observed ratio = 0.125), James et al. (1987) (mean empirical : observed ratio = 0.219), Kirpich (1940) (mean empirical : observed ratio = 0.383) and Watt and Chow (1985) (mean empirical : observed ratio = 0.509) equations are much smaller than the corresponding observed tp for each basin. The basin topographic type did not influence the values of tlC, tpJ, tcK or tlW.
The values of tcS computed from the Sheridan (1994) equation (mean empirical : observed ratio = 2.144) and tpL computed from the Langridge et al. (2021) (mean empirical : observed ratio = 1.683) equation were more similar in magnitude to the observed tp than were the other empirical values. The good agreement between tcS and tp is not surprising, as the equation was specifically developed for slow-responding basins. The relatively good agreement between tpL and the observed tp values is interesting because many of the equation parameters (L, S and DA) are also used by the other empirical equations, which fared much worse. It is worth noting that, unlike the other equations, Langridge et al. (2021) include the effects of climate (through the constants C1 and C2) and the peak discharge.
4.3 Observed basin flood wave celerities and velocities
The observed celerities (Table 3) range from 0.07 to 1 m s−1. The calculated water velocities range from 0.04 to 0.6 m s−1 (mean = 0.24 m s−1). It is important to note that these values are basin-scale averages; they do not represent the velocity of flow at the outlet or at any other point.
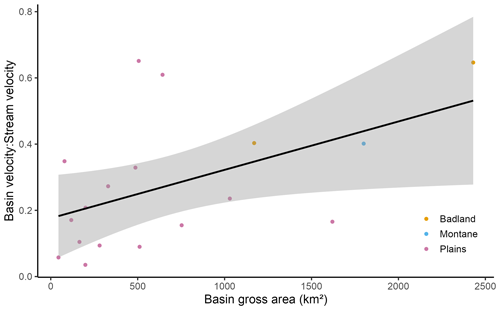
As discussed above, there was no significant relationship between observed tp and basin area. It is known that the magnitude of Lc generally increases as a power function of basin area (Gray, 1961). Therefore, the velocity would be expected to show a positive trend with basin area, as is shown in Fig. 7, but the relationship is weak (R2=0.37). The Badlands and Montane basins show very little deviation in their relationship between basin velocity and area; therefore, it is likely that their behaviour is primarily differentiated from the Plains basins by their relatively large basin areas.
Table 3Observed basin tp, calculated flood wave celerity, basin velocity, Manning n and Darcy–Weisbach roughness f for the study basins.
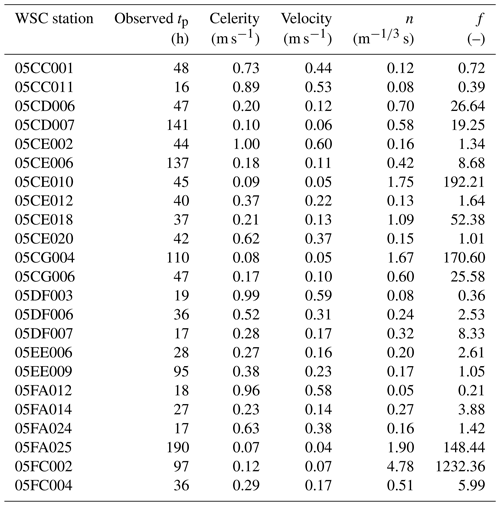
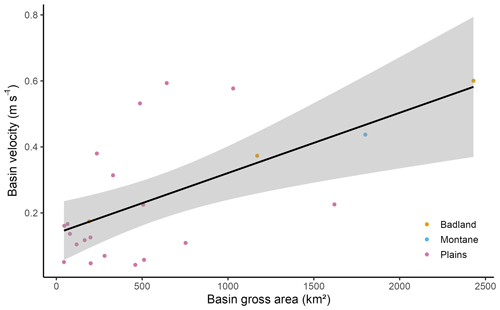
Figure 7Basin velocity and gross area of each basin. The line represents a least-squares linear model. The grey region is the 95 % confidence interval of the regression (R2=0.37).
The ratios of the basin velocities to the stream velocities show an increasing trend (R2=0.24) with basin area (Fig. 8). The basin velocities vary from 0.03 to 0.65 (mean = 0.3) of the estimated stream velocities. As with the plot of the basin velocities, the velocity ratios of the Badlands and Montane basins are like the values for Plains basins of similar areas. As all the velocity ratios are smaller than 1, it appears that the methodology for estimating the stream velocities is not grossly in error.
4.4 Observed basin roughness coefficients
4.4.1 Manning's n
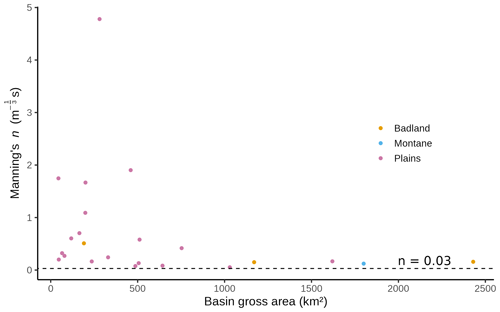
The magnitudes of n, as plotted in Fig. 9, varied widely (min = 0.05, mean = 0.7 and max = 4.8). The large values of n calculated here for small basins are far too large to be plausible for stream channels but are similar in magnitude to some values in the literature for overland flows. The maximum n value given by Schneider and Arcement (1989) is 0.3 for flows through a forested floodplain. Conversely, Weltz et al. (1992) found mean values of n as large as 0.56 for small (3.05 m × 10.7 m) plots on prairie grasslands in the USA and individual values of n as large as 1.00 for Salt Desert. Engman (1986) gives recommended n values as large as 0.40 for overland flow on cropland, which are also derived from small research plots (10–20 m × 1.7–4 m) and subjected to simulated rainfall with very high intensities (50–100 mm h−1).
The values of n for basins with gross areas larger than 1000 km2 are consistently relatively small, as shown by their proximity to the dashed line that represents the base n value for a straight stable channel, as suggested by Schneider and Arcement (1989). As with the plot of basin velocity (Fig. 7), the Badlands and Montane basins behave similarly to the Plains basins with similar areas.
4.4.2 Darcy–Weisbach roughness coefficient f
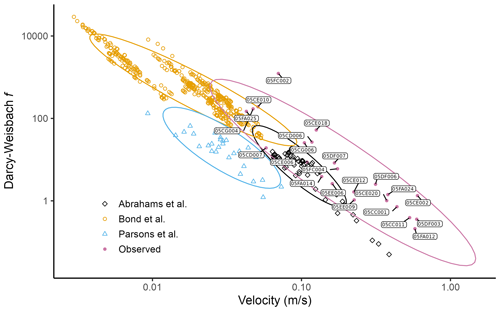
The calculated values of f, listed in Table 3, varied over more than 4 orders of magnitude (min = 0.21, mean = 83 and max = 1232). The values of f for basins 05FA025, 05CG004, 05CE010, 05CD007, 05CE006, 05FA014 and 05EE006 plot within, or adjacent to, the values of Bond et al. (2020b) (as listed in Bond et al., 2020a) and Abrahams et al. (1994) in Fig. 10. The agreement between the observed points and the published values is remarkable considering (a) the published values all derived from very small experimental plots rather than from basin-scale observations and (b) the many assumptions which went into the derivation of the observed values.
As listed in Table 3, Manning's n values computed for these basins were 1.90, 1.67, 1.75, 0.58, 0.42, 0.27 and 0.20, respectively, which are too large to be plausible for stream channels.
Many of the observed prairie basin flood wave celerities and velocities are very small. It is apparent that the smallest values of the study celerities and the ratios of basin velocities to stream velocities, together with the largest estimated values for Manning's n and the Darcy–Weisbach f, were obtained from the smallest basins. This indicates that the causes of the exceptionally small basin velocities are related to the presence of overland and/or shallow sub-surface flows, as channel flows will dominate at large scales. This finding also agrees with the work of Brannen et al. (2015) and Costa et al. (2020), which were carried out on very small basins. The effects of scale appear to hold true even in the Badlands-containing basins (05CE002, 05CE020 and 05FC004) and the Montane basin (05CC001), despite the possibility of predominant flow pathways in these basins that would be different from those in plains.
The channel slopes of the central Alberta basins (Table 1) are gentle and undoubtedly influence basin-scale flow velocities. The equations of Kirpich (1940), Watt and Chow (1985) and Langridge et al. (2020) explicitly include the channel slope. The slopes of the basins studied here are much shallower than those used by Kirpich (1940) and lie within the range of those used by Watt and Chow (1985) to derive their relationship, and at least three of the Alberta basins lie within the range of the areas of the basins that they used. However, the values of tcK and tlW were much smaller than the observed tp values. The values of the slopes used by Langridge et al. (2020) are unknown, but the tpL values are quite similar to the observed tp values.
Although the equations of Capece et al. (1988) and Sheridan (1994) do not include the channel slope, the basin slopes used for their derivations are similar to the values of the study basins. As described above, the tlC values were smaller than the observed tp values, while the tcS values were quite similar to the observed tp values.
Therefore, the gentle slopes may not be sufficient on their own to explain the behaviours of the experimental basins. It is believed that there are at least five additional potential causes of the slow responses of the prairie basins: (1) flow pathways, (2) climate, (3) depressional storage, (4) roads and culverts and (5) vegetation. It is quite possible that more than one cause is responsible for the slow responses.
Brannen et al. (2015) found evidence of shallow groundwater flows in the hummocky ∼1.2 km2 Brannen sub-basin at SDRB. Using tracers, Ross et al. (2017) found evidence of old water that could rapidly contribute to streamflows in hillslope plots in southern Manitoba. It is unclear whether these results can be extrapolated to the much larger scales of the study basins and to the drier conditions with more frequently unsaturated soils at depth that predominate in western Alberta. Furthermore, the very slow velocities simulated by Costa et al. (2020) did not include sub-surface flows.
The effects of low runoff rates in reducing flow velocities were demonstrated by Costa et al. (2020) in simulations of snowmelt runoff events. The small annual basin yields in the prairies described by Bemrose et al. (2009) imply that rainfall events do not often produce high runoff rates, as most of the runoff in the region is due to snowmelt. This is particularly likely to be true of the events considered here, which will tend to have low intensities and long durations. Low runoff rates associated with gentle rainfall will translate into small streamflows. As indicated by Eqs. (8) and (12), the flow velocity increases with the hydraulic radius, which is a function of the flow depth. Thus, shallow flows resulting from relatively small runoff events will be slow. This may be why the equation of Langridge et al. (2021), which includes representations of the climate and peak discharge, performed relatively well in this study. Cen et al. (2022) found that unit discharge was the most important factor in determining the transition from laminar to transitional flows in flume experiments using synthetic vegetation. Woolhiser et al. (1970) found laminar flow on rangeland plots (0.81 ha) in western South Dakota for overland flows with lengths of up to 170 m when the runoff rate was 6.35 mm h−1. Note that the highest precipitation rate in the events studied here was about 60 mm d−1.
The flow depths of sites 8 and 13 (shortgrass prairie and mixed-grass prairie, respectively) of Weltz et al. (1992), which resulted in the largest mean values for Manning's n (0.56 for both), were very shallow at 5.9 and 5.6 mm, respectively. It is also notable that both sites were quite steep compared to the research basins, with slopes of 6.6 % and 9.9 %, respectively.
The ubiquitous depressions within the prairie basins may reduce flow velocities through at least two mechanisms. The first is by reducing flow rates as runoff water fills the depressions. The small yields of many of the prairie basins are caused in part by the reduction in their contributing fractions through the abstraction of runoff by depressions. The reduction in flow rates will contribute to the reduction in runoff velocities. The second mechanism is the reduction in outflow velocities from depressions by widening flow channels. As the land surface slopes upward gradually in all directions, as shown by the scaling equations of Hayashi and van der Kamp (2000), the addition of water to a depression causes a relatively small increase in stage compared to a channel. Thus, the topography of the depression reduces the head available to drive flows over the outlet sill of the depression.
Koskiaho (2003) found outflow velocities of approximately 0.02 m s−1 when simulating flows within constructed wetlands in Finland. Kadlec (1990) found that surface velocities varied widely at a single wetland site, their histogram varying between 5 and 125 m h−1 (0.0014 and 0.035 m s−1).
Depressional storage is unlikely to be the sole cause of the observed long tp values and the consequent very small magnitudes of the flood wave celerities and velocities. As demonstrated in Table 2, there was no significant correlation between the effective area fractions of the Alberta basins, their wetland areal percentages and their observed tp. The results of Costa et al. (2020), cited in the Introduction, were obtained in a basin with relatively little depressional storage. Basin 05CE010 had a very slow celerity and velocity (Fig. 7) and a very large value of n (Fig. 9) for its area, despite having an effective area fraction of 1 as shown in Table 1, suggesting minimal depressional storage.
The Canadian Prairies are divided by a network of roads spaced at intervals of 1.6 or 3.2 km (i.e. 1 or 2 miles). The roads have deep and broad ditches on either side and are usually provided with culverts to allow water to pass through, but the siting, sizes and conditions of the culverts are rarely optimal. The roadbed network is therefore effectively a grid of dams, as has been documented in the USA (Wang et al., 2011) and in Alberta (Duke et al., 2003). Annand (2022) modelled the effects of a large culvert slowing high flows at the outlet of a basin in eastern Saskatchewan within the pothole region. It is likely that roads and culverts also contribute to slowing summer runoff in the Alberta study basins in a manner similar to natural depressions.
Kadlec (1990) stated that, for wetlands, “Open-channel equations, such as Manning's, should not be used because they apply to situations where bottom drag is controlling. In vegetated wetlands, vegetation drag controls”. Vegetation sub-divides flow, exerting a shear stress over the submerged depth of stalks. Although the summer rainfall events occur during the growing season, the entire depth of flow is likely to lie within the crop heights, because the flows are shallow, even early in the growing season when the crops (which are primarily annuals) are short.
Horton (1939) described flow velocities in the transition zone between laminar and turbulent flows. For open channels, laminar flows are assumed to occur for Reynolds numbers smaller than 500 (Yen, 2002). Abrahams et al. (1994) found flow velocities between 0.065 and 0.387 m s−1 at research plots on semi-arid grassland and shrubland hillslopes in Arizona, with Reynolds numbers between 86.5 and 450.2. The smaller velocities on these plots are greater than some of the estimated velocities for the study basins. Bond et al. (2020b) also found many flow measurements lying within the laminar regime on research plots in northern England. Interestingly, Gilley and Kottwitz (1994) found that wheat stalks had the highest roughness coefficients of any crop tested (including corn, cotton, sorghum, soybeans and sunflowers) in rectangular flumes and found Reynolds numbers as small as 500. As wheat is a dominant crop in much of the Canadian Prairies, its role in slowing overland flows is expected to be important.
Channels constructed for artificial drainage will behave very differently from the natural swales which exist between depressions. Artificial drainage channels are much narrower for a given depth and are also straighter and shorter than natural channels, which will result in deeper and faster flows than in natural channels. Therefore, prairie basins subject to extensive agricultural drainage will, all other factors being equal, experience changes in their response times, introducing yet another degree of non-stationarity which must be modelled. White et al. (2003) found that channel drainage of basins in Illinois decreased their times to peak. Artificial drainage may also increase water velocities by increasing flow rates through the elimination of depressional storage. Thus, models calibrated against historical streamflows will be very vulnerable to errors when simulating the effects of drainage in prairie basins.
The observed tp values estimated from the streamflow hydrometric records were generally much greater than those estimated by four of the six available empirical equations. Therefore, the answer to the first research objective is that, in combination with the observed slow responses at St. Denis Research Basin and the modelled slow velocities at Steppler Watershed, slow stream responses are a general feature of the Canadian Prairies.
As an answer to the second objective, there were no apparent relationships between the study's tp values and any of the basins' characteristics. The only relationship that possibly described the runoff velocities was a weak power-law fit with the gross basin areas.
The slow observed responses and estimated flow velocities of the basins have important implications for Canadian Prairie hydrology, particularly for modelling streamflow responses to rainfall using hydrological routing. Many engineering design calculations, such as the rational method, and dimensionless hydrographs, such as the SCS Unit Hydrograph, are based on empirical response times such as tc and tp. As four of the six empirical equations grossly underestimate the hydrological response times of the study basins, these methods are likely to cause large errors in design flows. The equations of Sheridan (1994) and Langridge et al. (2021) provide better estimates of the basin response times, although they show considerable scatter.
Development of hydrological routing methods suitable for prairie basins will require understanding of flow velocities at many scales within basins. Distributed hydrological models are being used on the Canadian Prairies, with grid scales varying from 125 km2 (Hossain, 2017) to as small as 1 km2 (Mengistu and Spence, 2016), and they presume turbulent flow in their hydrological routing methods. As noted in the Introduction, existing models of prairie basins are semi-distributed using HRUs and GRUs to represent sub-basin variability. Hydraulic models are currently used at small scales within the Canadian Prairies, and their use is likely to increase in the future, particularly when forced with outputs from hydrological models.
As an answer to the third objective, the demonstrated relationships between the basin velocity and area indicate that the size of the region being modelled must be considered when developing routing methods for such models. Calibrated roughness parameters cannot be separated from their scales, and the assumption of turbulence is highly uncertain. As many modellers restrict calibrated values to the range of published values, the use of Manning's equation, which may require unusually large values of n to work, will induce errors in other calibrated parameters of a model. Values of n for overland flow, such as those of Weltz et al. (2000) and Engman (1986), are closer to those of the study basins but are smaller than the largest values presented here. As described, the experimental n values presented here are basin-scale values. Therefore, it is quite possible that n values at the HRU and GRU scales may be much greater. The Darcy–Weisbach equation, which can simulate all flow regimes, may be better suited to modelling Canadian Prairie basins at small scales.
This study is a first step on the path toward understanding and modelling flow velocities on the Canadian Prairies. Further research will be required to determine the small-scale velocities of flows and to find ways of incorporating their spatial and temporal variabilities into basin-scale hydrological models of this region. Further modelling and fieldwork studies, perhaps involving the use of tracers, are needed to gain a better understanding of why basin-scale responses and velocities in the region are as slow as found here.
All data, R code and calculation results used in this research are published online at https://zenodo.org/record/7915938 (Shook et al., 2023).
KRS and PHW conceived the study and led the analyses. CS supplied the experimental data. All the authors contributed to the writing.
The contact author has declared that none of the authors has any competing interests.
Publisher’s note: Copernicus Publications remains neutral with regard to jurisdictional claims made in the text, published maps, institutional affiliations, or any other geographical representation in this paper. While Copernicus Publications makes every effort to include appropriate place names, the final responsibility lies with the authors.
The authors acknowledge funding support from the Global Water Futures programme of the Canada First Research Excellence Fund, the Canada Research Chairs programme and Environment and Climate Change Canada. We also wish to acknowledge the assistance of officials from the Water Survey of Canada of Environment and Climate Change Canada in providing us with access to hydrometric basin shape files, hourly streamflows and manual gauging data. This research could not have been undertaken without their support.
This paper was edited by Erwin Zehe and reviewed by Tim Jakobs and two anonymous referees.
Abrahams, A. D., Parsons, A. J., and Wainwright, J.: Resistance to overland flow on semiarid grassland and shrubland hillslopes, Walnut Gulch, southern Arizona, J. Hydrol., 156, 431–446, https://doi.org/10.1016/0022-1694(94)90088-4, 1994.
Agriculture and Agri-food Canada: Land Cover for Agricultural Regions of Canada, circa 2000 – Open Government Portal, https://open.canada.ca/data/en/dataset/16d2f828-96bb-468d-9b7d-1307c81e17b8 (last access: 1 April 2022), 2009.
Alberta Agriculture and Forestry, Government of Alberta: Areal Extent of Wetlands, Areal Extent of Wetlands, https://open.alberta.ca/opendata/gda-57f606f5-4b81-446e-aaf6-f5b93c092a96 (last access: 14 June 2020), 2016.
Anderson, E., Chlumsky, R., McCaffrey, D., Trubilowicz, J., Shook, K. R., and Whitfield, P. H.: R-functions for Canadian hydrologists: A Canada-wide collaboration, Can. Water Resour. J./Revue canadienne des ressources hydriques, 44, 108–112, https://doi.org/10.1080/07011784.2018.1492884, 2019.
Annand, H.: The influence of climate change and wetland managment on prairie hydrology – insights from Smith Creek, Saskatchewan, PhD thesis, University of Saskatchewan, https://harvest.usask.ca/server/api/core/bitstreams/faad51d2-d55a-4099-bad4-5ced54bdffb5/content (last access: 29 June 2022), 2022.
Bemrose, R., Kemp, L., Henry, and Soulard, F.: Water Yield for Canada as a Thirty-year Average (1971 to 2000): Concepts, Methodology and Initial Results, Statistics Canada Research and development section, Ottawa, Ontario, Canada, https://www150.statcan.gc.ca/n1/en/catalogue/16-001-M2009007 (last access: 15 June 2020), 2009.
Beven, K. J.: A history of the concept of time of concentration, Hydrol. Earth Syst. Sci., 24, 2655–2670, https://doi.org/10.5194/hess-24-2655-2020, 2020.
Bjerklie, D. M.: Estimating the bankfull velocity and discharge for rivers using remotely sensed river morphology information, J. Hydrol., 341, 144–155, https://doi.org/10.1016/j.jhydrol.2007.04.011, 2007.
Bond, S., Kirkby, M. J., Johnston, J., Crowle, A., and Holden, J.: Seasonal vegetation and management influence overland flow velocity and roughness in upland grasslands, Hydrol. Process., 34, 3777–3791, https://doi.org/10.1002/hyp.13842, 2020a.
Bond, S., Kirkby, M. J., Johnston, J., Crowle, A., and Holden, J.: Seasonal vegetation and management influence overland flow velocity in upland grasslands – dataset, https://doi.org/10.5518/794, 2020b.
Brannen, R.: Controls on connectivity and streamflow generation in a Canadian Prairie landscape, Master's thesis, University of Saskatchewan, Saskatoon, Saskatchewan, Canada, https://core.ac.uk/download/pdf/226142583.pdf (last access: 28 July 2018), 2015.
Brannen, R., Spence, C., and Ireson, A.: Influence of shallow groundwater-surface water interactions on the hydrological connectivity and water budget of a wetland complex, Hydrol. Process., 29, 3862–3877, https://doi.org/10.1002/hyp.10563, 2015.
Capece, J. C., Campbell, K. L., and Baldwin, L. B.: Estimating Runoff Peak Rates from Flat, High-Water-Table Watersheds, T. ASAE, 31, 74–81, https://doi.org/10.13031/2013.30668, 1988.
Cen, Y., Zhang, K., Peng, Y., Rubinato, M., Liu, J., and Ling, P.: Experimental study on the effect of simulated grass and stem coverage on resistance coefficient of overland flow, Hydrol. Process., 36, e14705, https://doi.org/10.1002/hyp.14705, 2022.
Christiansen, E. A.: The Wisconsinan deglaciation of southern Saskatchewan and adjacent areas, Can. J. Earth Sci., 16, 913–938, 1979.
Costa, D., Shook, K., Spence, C., Elliott, J., Baulch, H., Wilson, H., and Pomeroy, J. W.: Predicting Variable Contributing Areas, Hydrological Connectivity, and Solute Transport Pathways for a Canadian Prairie Basin, Water Resour. Res., 56, e2020WR027984, https://doi.org/10.1029/2020WR027984, 2020.
de Boer, D. H. and Campbell, I. A.: Spatial scale dependence of sediment dynamics in a semi-arid badland drainage basin, CATENA, 16, 277–290, https://doi.org/10.1016/0341-8162(89)90014-3, 1989.
Duke, G. D., Kienzle, S. W., Johnson, D. L., and Byrne, J. M.: Improving overland flow routing by incorporating ancillary road data into digital elevation models, Journal of Spatial Hydrology, 3, 2–27, 2003.
Dumanski, S., Pomeroy, J. W., and Westbrook, C. J.: Hydrological regime changes in a Canadian Prairie basin, Hydrol. Process., 29, 3893–3904, https://doi.org/10.1002/hyp.10567, 2015.
Ellis, W. H. and Gray, D. M.: Interrelationships Between the Peak Instantaneous and Average Daily Discharges of Small Prairie Streams, Can. Agr. Eng., 8, 2–5, 1966.
Engman, E. T.: Roughness Coefficients for Routing Surface Runoff, J. Irrig. Drain. E., 112, 39–53, https://doi.org/10.1061/(ASCE)0733-9437(1986)112:1(39), 1986.
Farr, T. G., Rosen, P. A., Caro, E., Crippen, R., Duren, R., Hensley, S., Kobrick, M., Paller, M., Rodriguez, E., Roth, L., Seal, D., Shaffer, S., Shimada, J., Umland, J., Werner, M., Oskin, M., Burbank, D., and Alsdorf, D.: The Shuttle Radar Topography Mission, Rev. Geophys., 45, 1–22, https://doi.org/10.1029/2005RG000183, 2007.
Ferguson, R.: Time to abandon the Manning equation?, Earth Surf. Proc. Land., 35, 1873–1876, https://doi.org/10.1002/esp.2091, 2010.
Gericke, O. J. and Smithers, J. C.: Review of methods used to estimate catchment response time for the purpose of peak discharge estimation, Hydrolog. Sci. J., 59, 1935–1971, https://doi.org/10.1080/02626667.2013.866712, 2014.
Gilley, J. E. and Kottwitz, E. R.: Darcy-Weisbach Roughness Coefficients for Selected Crops, T. ASAE, 37, 467–471, https://doi.org/10.13031/2013.28098, 1994.
Gilley, J. E., Flanagan, D. C., Kottwitz, E. R., and Weltz, M. A.: Darcy-Weisbach roughness coefficients for overland flow, in: Overland flow, edited by: Parsons, A. and Abrahams, A., 24–47, CRC press, ISBN 978-1-85728-006-7, 1992.
Godwin, R. B. and Martin, F. R. J.: Calculation of gross and effective drainage areas for the Prairie Provinces, in: Proceedings of Canadian Hydrology Symposium, 219–223, 1975.
Government of Alberta: Wetland Regulatory Requirements Guide, Water Policy Branch, ISBN 978-1-4601-2358-4, 2015.
Gray, D. M.: Interrelationships of Watershed Characteristics, J. Geophys. Res., 66, 1215–1223, https://doi.org/10.1029/JZ066i004p01215, 1961.
Grimaldi, S., Petroselli, A., Tauro, F., and Porfiri, M.: Time of concentration: A paradox in modern hydrology, Hydrolog. Sci. J., 57, 217–228, https://doi.org/10.1080/02626667.2011.644244, 2012.
Hayashi, M. and van der Kamp, G.: Simple equations to represent the volume-area-depth relations of shallow wetlands in small topographic depressions, J. Hydrol., 237, 74–85, https://doi.org/10.1016/S0022-1694(00)00300-0, 2000.
Hijmans, R. J.: Raster: Geographic data analysis and modeling, R package version 3.6-30, https://CRAN.R-project.org/package=raster (last access: 22 May 2020), 2020.
Holtan, H. N. and Overton, D. E.: Analyses and application of simple hydrographs, J. Hydrol., 1, 250–264, https://doi.org/10.1016/0022-1694(63)90005-2, 1963.
Horton, R. E.: The Interpretation and Application of Runoff Plat Experiments with Reference to Soil Erosion Problems, Soil Sci. Soc. Am. J., 3, 340, https://doi.org/10.2136/sssaj1939.036159950003000C0066x, 1939.
Hossain, K.: Towards a Systems Modelling Approach for a Large-Scale Canadian Prairie Watershed, Master's thesis, University of Saskatchewan, Saskatoon, Saskatchewan, Canada, https://harvest.usask.ca/items/6bcfdfae-3e83-4e2b-a2a2-f93c96965546 (last access: 30 July 2020), 2017.
James, W. P., Winsor, P. W., and Williams, J. R.: Synthetic Unit Hydrograph, J. Water Res. Pl., 113, 70–81, 1987.
Kadlec, R. H.: Overland Flow in Wetlands: Vegetation Resistance, J. Hydraul. Eng., 116, 691–706, https://doi.org/10.1061/(ASCE)0733-9429(1990)116:5(691), 1990.
Kirpich, Z. P.: Time of concentration of small agricultural watersheds, Civil Eng., 10, 362, 1940.
Koskiaho, J.: Flow velocity retardation and sediment retention in two constructed wetland-ponds, Ecol. Eng., 19, 325–337, https://doi.org/10.1016/S0925-8574(02)00119-2, 2003.
Langridge, M., Gharabaghi, B., McBean, E., Bonakdari, H., and Walton, R.: Understanding the dynamic nature of Time-to-Peak in UK streams, J. Hydrol., 583, 124630, https://doi.org/10.1016/j.jhydrol.2020.124630, 2020.
Langridge, M., McBean, E., Bonakdari, H., and Gharabaghi, B.: A dynamic prediction model for time-to-peak, Hydrol. Process., 35, e14032, https://doi.org/10.1002/hyp.14032, 2021.
LaZerte, S. and Albers, S.: Weathercan: Download and format weather data from Environment and Climate Change Canada, Journal of Open Source Software, 3, 571, https://doi.org/10.21105/joss.00571, 2018.
Leibowitz, S. G. and Vining, K. C.: Temporal connectivity in a prairie pothole complex, Wetlands, 23, 13–25, https://doi.org/10.1672/0277-5212(2003)023[0013:TCIAPP]2.0.CO;2, 2003.
Leroux, N. R. and Pomeroy, J. W.: Modelling capillary hysteresis effects on preferential flow through melting and cold layered snowpacks, Adv. Water Resour., 107, 250–264, https://doi.org/10.1016/j.advwatres.2017.06.024, 2017.
Lindsay, J. B.: Whitebox GAT: A case study in geomorphometric analysis, Comput. Geosci., 95, 75–84, https://doi.org/10.1016/j.cageo.2016.07.003, 2016.
McCuen, R. H.: Uncertainty Analyses of Watershed Time Parameters, J. Hydrol. Eng., 14, 490–498, https://doi.org/10.1061/(ASCE)HE.1943-5584.0000011, 2009.
McDonnell, J. J. and Beven, K.: Debates – The future of hydrological sciences: A (common) path forward? A call to action aimed at understanding velocities, celerities and residence time distributions of the headwater hydrograph, Water Resour. Res., 50, 5342–5350, https://doi.org/10.1002/2013WR015141, 2014.
McDonnell, J. J., Spence, C., Karran, D. J., Van Meerveld, H. J., and Harman, C. J.: Fill-and-spill: A process description of runoff generation at the scale of the beholder, Water Resour. Res., 57, e2020WR027514, 2021.
Mengistu, S. G. and Spence, C.: Testing the ability of a semidistributed hydrological model to simulate contributing area, Water Resour. Res., 52, 4399–4415, https://doi.org/10.1002/2016WR018760, 2016.
Natural Resources Canada: National Hydro Network, Canada, Level 1 Linear Referencing System (LRS) Data Catalogue Edition 1.0, Natural Resources Canada Geomatics Canada Centre for Topographic Information, https://open.canada.ca/data/en/dataset/a4b190fe-e090-4e6d-881e-b87956c07977/resource/f6ca81dd-a1ee-4002-ac94-bfaa1118e8ea (last access: 9 June 2020), 2004.
Pebesma, E. and Bivand, R. S.: S classes and methods for spatial data: The sp package, R news, 5, 9–13, 2005.
Pebesma, E. J.: Multivariable geostatistics in S: The gstat package, Comput. Geosci., 30, 683–691, https://doi.org/10.1016/j.cageo.2004.03.012, 2004.
Pennock, D., Bedard-Haughn, A., and Viaud, V.: Chernozemic soils of Canada: Genesis, distribution, and classification, Can. J. Soil. Sci., 91, 719–747, https://doi.org/10.4141/cjss10022, 2011.
Pomeroy, J. W., Gray, D. M., and Landine, P. G.: The Prairie Blowing Snow Model: Characteristics, validation, operation, J. Hydrol., 144, 165–192, https://doi.org/10.1016/0022-1694(93)90171-5, 1993.
Pomeroy, J. W., Gray, D. M., Shook, K. R., Toth, B., Essery, R. L. H., Pietroniro, A., and Hedstrom, N.: An evaluation of snow accumulation and ablation processes for land surface modelling, Hydrol. Process., 12, 2339–2367, https://doi.org/10.1002/(SICI)1099-1085(199812)12:15<2339::AID-HYP800>3.0.CO;2-L, 1998.
Pomeroy, J. W., Brown, T., Fang, X., Shook, K. R., Pradhananga, D., Armstrong, R., Harder, P., Marsh, C., Costa, D., Krogh, S. A., Aubry-Wake, C., Annand, H., Lawford, P., He, Z., Kompanizare, M., and Lopez Moreno, J. I.: The cold regions hydrological modelling platform for hydrological diagnosis and prediction based on process understanding, J. Hydrol., 615, 128711, https://doi.org/10.1016/j.jhydrol.2022.128711, 2022.
QGIS Development Team: QGIS Geographic Information System, Open Source Geospatial Foundation, https://www.qgis.org (last access: 28 July 2018), 2009.
R Core Team: R: A language and environment for statistical computing, R Foundation for Statistical Computing, Vienna, Austria, ISBN 3-900051-07-0, 2013.
Rosgen, D. L.: A classification of natural rivers, CATENA, 22, 169–199, https://doi.org/10.1016/0341-8162(94)90001-9, 1994.
Ross, C. A., Ali, G., Bansah, S., and Laing, J. R.: Evaluating the Relative Importance of Shallow Subsurface Flow in a Prairie Landscape, Vadose Zone J., 16, 1–20, https://doi.org/10.2136/vzj2016.10.0096, 2017.
Schneider, V. and Arcement, G.: Guide for selecting manning's roughness coefficients for natural channels and flood plains, Available from the US Geological Survey, Books and Open-File Reports Section, Box 25425, Federal Center, Denver, CO 80225-0425, Water-Supply Paper 2339, 38 pp., 1989.
Schroers, S., Eiff, O., Kleidon, A., Scherer, U., Wienhöfer, J., and Zehe, E.: Morphological controls on surface runoff: an interpretation of steady-state energy patterns, maximum power states and dissipation regimes within a thermodynamic framework, Hydrol. Earth Syst. Sci., 26, 3125–3150, https://doi.org/10.5194/hess-26-3125-2022, 2022.
Sharratt, B., Benoit, G., Daniel, J., and Staricka, J.: Snow cover, frost depth, and soil water across a prairie pothole landscape, Soil Sci., 164, 483–492, 1999.
Shaw, D. A., van der Kamp, G., Conly, F. M., Pietroniro, A., and Martz, L.: The Fill-Spill Hydrology of Prairie Wetland Complexes during Drought and Deluge, Hydrol. Process., 26, 3147–3156, https://doi.org/10.1002/hyp.8390, 2012.
Sheridan, J. M.: Hydrograph Time Parameters for Flatland Watersheds, T. ASAE, 37, 103–113, https://doi.org/10.13031/2013.28059, 1994.
Shook, K. and Gray, D. M.: Synthesizing shallow seasonal snow covers, Water Resour. Res., 33, 419, https://doi.org/10.1029/96WR03532, 1997.
Shook, K. and Pomeroy, J.: Changes in the hydrological character of rainfall on the Canadian prairies, Hydrol. Process., 26, 1752–1766, https://doi.org/10.1002/hyp.9383, 2012.
Shook, K., Pomeroy, J. W., Spence, C., and Boychuk, L.: Storage dynamics simulations in prairie wetland hydrology models: Evaluation and parameterization, Hydrol. Process., 27, 1875–1889, https://doi.org/10.1002/hyp.9867, 2013.
Shook, K. R., Whitfield, P. H., Spence, C., and Pomeroy, J. W.: Estimating response times, flow velocities and roughness coefficients of Canadian Prairie basins, https://zenodo.org/records/7915938 (last access: 9 May 2023), Zenodo [code, data set], 2023.
Siemonsma, D.: The Shuttle Radar Topography Mission (SRTM) Collection User Guide, 17, 2015.
Spence, C. and Woo, M. K.: Hydrology of subarctic Canadian shield: Soil-filled valleys, J. Hydrol., 279, 151–166, https://doi.org/10.1016/S0022-1694(03)00175-6, 2003.
Stichling, W. and Blackwell, S. R.: Drainage Area as a Hydrologic Factor on the Glaciated Canadian Prairies, in: IUGG Proceedings, 111, 365–376, 1957.
Szeto, K., Gysbers, P., Brimelow, J., and Stewart, R.: The 2014 extreme flood on the southeastern Canadian prairies, B. Am. Meteorol. Soc., 96, S20–S24, 2015.
Wang, X., Liu, T., Yang, D., Qu, Z., Clary, C. R., and Wunneburger, C.: Simulating Hydrologic Effects of Raised Roads within a Low-Relief Watershed, J. Hydrol. Eng., 16, 585–597, https://doi.org/10.1061/(ASCE)HE.1943-5584.0000351, 2011.
Watt, W. E. and Chow, K. C. A.: A general expression for basin lag time, Can. J. Civ. Eng., 12, 294–300, https://doi.org/10.1139/l85-031, 1985.
Weltz, L., Frasier, G., and Weltz, M.: Hydrologic responses of shortgrass prairie ecosystems, Rangeland Ecol. Manag./Journal of Range Management Archives, 53, 403–409, 2000.
Weltz, M. A., Arslan, A. B., and Lane, L. J.: Hydraulic Roughness Coefficients for Native Rangelands, J. Irrig. Drain. E., 118, 776–790, https://doi.org/10.1061/(ASCE)0733-9437(1992)118:5(776), 1992.
Wheater, H. S., Pomeroy, J. W., Pietroniro, A., Davison, B., Elshamy, M., Yassin, F., Rokaya, P., Fayad, A., Tesemma, Z., Princz, D., Loukili, Y., DeBeer, C. M., Ireson, A. M., Razavi, S., Lindenschmidt, K.-E., Elshorbagy, A., MacDonald, M., Abdelhamed, M., Haghnegahdar, A., and Bahrami, A.: Advances in modelling large river basins in cold regions with Modélisation Environmentale Communautaire–Surface and Hydrology (MESH), the Canadian hydrological land surface scheme, Hydrol. Process., 36, e14557, https://doi.org/10.1002/hyp.14557, 2022.
White, A. B., Kumar, P., Saco, P. M., Rhoads, B. L., and Yen, B. C.: Changes in Hydrologic Response Due to Stream Network Extension Via Land Drainage Activities, J. Am. Water Resour. Res., 39, 1547–1560, https://doi.org/10.1111/j.1752-1688.2003.tb04438.x, 2003.
Willis, W. O., Carlson, C. W., Alessi, J., and Haas, H. J.: Depth of Freezing and Spring Run-Off as Related to Fall Soil-Moisture Level, Can. J. Soil. Sci., 41, 115–123, https://doi.org/10.4141/cjss61-014, 1961.
Wong, T. S. and Zhou, M. C.: Kinematic Wave Parameters for Trapezoidal and Rectangular Channels, J. Hydrol. Eng., 11, 173–183, https://doi.org/10.1061/(ASCE)1084-0699(2006)11:2(173), 2006.
Woo, M.-K. and Sauriol, J.: Channel Development in Snow-Filled Valleys, Resolute, N. W. T., Canada, Geogr. Ann. A, 62, 37–56, https://doi.org/10.2307/520451, 1980.
Woolhiser, D. A., Hanson, C. L., and Kuhlman, A. R.: Overland flow on rangeland watersheds, J. Hydrol. (New Zealand), 9, 336–356, 1970.
Yen, B. C.: Open Channel Flow Resistance, J. Hydraul. Eng., 128, 20–39, https://doi.org/10.1061/(ASCE)0733-9429(2002)128:1(20), 2002.


