the Creative Commons Attribution 4.0 License.
the Creative Commons Attribution 4.0 License.
On the cause of large daily river flow fluctuations in the Mekong River
Khosro Morovati
Keer Zhang
Lidi Shi
Yadu Pokhrel
Maozhou Wu
Paradis Someth
Sarann Ly
Natural fluctuations in river flow are central to the ecosystem productivity of basins, yet significant alterations in daily flows pose threats to the integrity of the hydrological, ecological, and agricultural systems. In the dammed Lancang–Mekong River (hereafter LMR), the attribution of these large daily flow changes to upstream regions remains mechanistically unexamined, a factor blamed on challenges in estimating the time required for large daily shifts in upstream river flow to impact the downstream stations. Here, we address this with a newly developed subbasin modeling framework that integrates 3D hydrodynamic and response time models, together with a hydrological model with an embedded reservoir module. This integration allows us to estimate the time required between two hydrological stations and to distinguish between the contributions of subbasins and upstream regions to large daily river flow alterations. The findings revealed a power correlation between upstream river discharge and the time required to reach downstream stations. Significant fluctuations (greater than 1 m) in the river's daily flow were evident before the advent of the era of human activities, i.e., before 1992, with around 92 % of these fluctuations occurring during the wet season, particularly in June, July, and August. This pattern persisted throughout subsequent periods, including the growth period (1992–2009) and the mega-dam period (2010 to 2020), with minimal variation in the frequency of events. The Lancang basin contributed approximately 33 %–42 % of these large river fluctuations at the Chiang Saen station. We found that daily-scale water level and runoff might not fully capture dynamic river flow changes, as significant differences were observed between daily and subdaily river flow profiles. Subbasins significantly contributed to mainstream discharge, leading to substantial shifts in mainstream daily river flows. The outcomes and model derived from the subbasin approach have significant potential for managing river fluctuations and broader applicability beyond the specific basin studied.
- Article
(7613 KB) - Full-text XML
-
Supplement
(2512 KB) - BibTeX
- EndNote
Natural flow regimes provide temporal and spatial fluctuations in river water level and flow, which are central to supporting productive environmental and ecological systems (Van Binh et al., 2020). However, large changes in river flow – mainly due to human intervention and climate change – pose a threat to ecosystem productivity and sustainable development, disrupting the integrity of rivers, causing bank erosion (Darby et al., 2013), leading to successive saturation and draining, and altering natural hydrological rhythms (Yoshida et al., 2020; Soukhaphon et al., 2021).
Two primary drivers of these hydrological alterations in the Lancang–Mekong River (LMR) basin are human activities (e.g., uncoordinated dam operations) and significant spatiotemporal variability in precipitation (Zhang et al., 2023; Yun et al., 2020; J. Wang et al., 2021). Dam water storage and operations can alter peak flows, increase base flows, and modify the frequency and variability range of discharge (Hecht et al., 2019). For instance, since 2010, the Chiang Saen station in Thailand, near the border with China, has recorded a 98 % increase in monthly discharge during the dry season, while the wet season water level has dropped by 1.55 m (Lu and Chua, 2021). Intense downpours lasting several hours or days further exacerbate downstream flow alterations (Wang et al., 2017a). Undammed regions can deliver large discharges into the downstream areas, compounding the impact of these stressors and causing daily water level fluctuations of 1–4 m (MRC, 2011). These fluctuations can influence critical phenomena like the flood pulse, which drives productivity in downstream regions such as the Tonlé Sap lake (Morovati et al., 2021a; Morovati et al., 2023), affecting agriculture and fishery (Sabo et al., 2017; Chen et al., 2021; J. Wang et al., 2021). Additionally, these changes trigger fish mortality by confining fish to small water bodies, altering spawning patterns and fish migration, and affecting agricultural and livestock production (Burbano et al., 2020; Li et al., 2022; Morovati et al., 2024) – a concern recently raised by local communities. Despite the importance of these issues, research on assessing such large daily river flow fluctuations (1–4 m) remains limited.
Flow regime analysis has driven extensive research in recent years. Han et al. (2019) used the CREST-snow hydrological model with remote sensing data and found a 6 % change in mean annual streamflow at the Lancang River from 2008 to 2014. S. Wang et al. (2021) applied the SWAT hydrological model to project daily runoff until 2050, revealing increased flood risks in the lower Mekong River. Shin et al. (2020) utilized the CaMa-Flood hydrodynamic model, accounting for 86 dams, and found that surface water storage was mainly governed by climate variation before 2010. Galelli et al. (2022) employed the VIC and VIC-Res models to simulate dam re-operations, demonstrating a 39 % increase in the median daily flow in January and a 10 % decrease in August in the lower Mekong River. Yun et al. (2020), using the VIC-Res model, reported a 5 % reduction in annual streamflow at Chiang Saen due to the Lancang cascade dams from 2008 to 2016. J. Wang et al. (2021) employed the VIC and CaMa-Flood models to analyze daily floods in the LMR basin from 1976 to 2015. Most recently, Yun et al. (2024) used this model to investigate reservoir impacts on natural runoff, finding that, by 2023, reservoirs could store up to 62 % of the annual runoff under extreme conditions.
There are many other studies resulting in successful analyses of flow regime changes in the LMR basin, including historical assessment using indicators of hydrologic alteration (Cochrane et al., 2014; Lu et al., 2014; Li et al., 2017; Lu and Chua, 2021) and monthly assessments of Chinese dams' impacts on the downstream flow regime using VMod, a distributed hydrological model (Räsänen et al., 2017). Additionally, studies have examined the impacts of constructed tributary dams on the lower Mekong River (Piman et al., 2016) using the SWAT and HEC-ResSim models. Furthermore, the rainfall-runoff-inundation (RRI) model has been applied to address climate change and reservoir operation impacts on inundation patterns based on daily and monthly simulations of river runoff across the lower Mekong River (Try et al., 2018, 2020, 2022; Ly et al., 2023).
However, none of these models or the other tools developed to assess hydrodynamics, hydrology, and sediment dynamics in the LMR basin discussed in the review by Johnston and Kummu (2012) provide an assessment of the degree to which the downstream large daily water level and flow changes are attributed to upstream subbasins and the time required for shifts in upstream river flow to impact downstream stations.
Here, we first identify the large daily river flow changes by analyzing observed historical data over the last 4 decades. We then address the gaps mentioned above by developing an integrated modeling framework consisting of a highly accurate 3D hydrodynamic model (Delft3D-Flow) to simulate the daily water level, flow, and velocity; a response time model to explicitly attribute the daily river flow changes at the mainstream stations to their respective subbasin and upstream station(s); and a hydrological model to provide daily discharge for tributaries lacking measured data. Our analysis based on the developed models expands on previous research in at least three aspects: (i) our approach allows us to quantitatively assess the regional contribution to downstream abnormal water level and flow shifts. Indeed, this analysis shifts the current conversations from how much water level or flow has historically altered – including small river flow changes existing even in undammed river basins – to how much upstream subbasins have contributed to large daily water level or flow changes, which is significant for regional and transboundary development; (ii) the results offer essential insights into the time required for upstream river flow changes to propagate to the downstream station. This facilitates improved management strategies for subbasins, which is crucial for mitigating abnormal flow regime changes that pose threats to communities residing near the mainstream; and (iii) these models and analyses provide insights into the concerns raised by locals regarding the roles of climate change and human activities in the large daily river flow fluctuations in the LMR. Furthermore, the findings and the developed model can serve as a reference for understanding similar issues in other basins.
2.1 Study area
With a length of ∼4800 km, the pan-shaped LMR constitutes the second most diverse aquatic ecosystem globally (MRC, 2011; Intralawan et al., 2019) and ranks as the eighth largest in terms of annual runoff (Sabo et al., 2017). Its extensive length encompasses diverse geographical regions, including deep valleys and lowland areas, which has facilitated both dam construction and agricultural development (Yoshida et al., 2020; Tian et al., 2023). The LMR is divided into two reaches: the upper course is known as the Lancang River within China, where it originates from the Tibetan Plateau and is home to 11 large mainstream hydropower dams and many tributary dams (Fig. 1), and the lower reach is known as the lower Mekong River, where its surrounding subbasins have been heavily impacted by agricultural activities and tributary dams (Zhang et al., 2023). Until the end of 2020, two mainstream hydropower dams operated in the lower Mekong River (i.e., Don Sahong and Xayaburi); however, their total storage capacity was much smaller than that of some tributary dams, including Nam Ngum (4700 MCM) and Xe Kaman (4800 MCM) (Fig. 1). Although each tributary reservoir typically has a small storage capacity (e.g., < 5 km3; Fig. S1 in the Supplement), the reservoirs' cumulative storage and independent operation, due to varying priorities among riparian countries, could intensify hydrological changes (Zhang et al., 2023): 10 % of the total hydropower potential across the LMR basin is attributed to these mainstream hydropower reservoirs (MRC, 2019; Morovati et al., 2023).
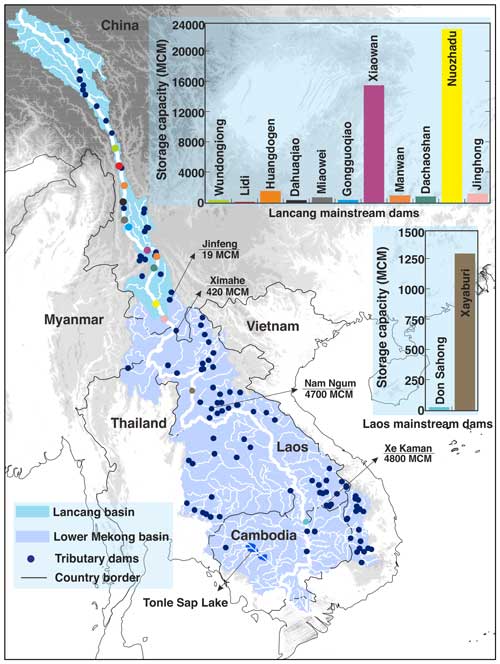
Figure 1Map of the Lancang and lower Mekong basins, highlighting the extensive river network that dominates the region along with the locations of tributary and mainstream dams. The bar chart shows the total storage capacity of mainstream dams constructed within the Lancang River and lower Mekong River.
The hydrology of the basin is mainly influenced by an uneven distribution of precipitation, both spatially and temporally (Pokhrel et al., 2018). The wet season, occurring from June to November (LMC and MRC, 2023), sees substantial precipitation, resulting in approximately 345 km3 of runoff. In contrast, the dry season, spanning from December to May, witnesses a significant decrease in basin-wide precipitation, leading to a notable drop, approximately 67 %, in runoff delivered to the delta region compared to the wet season. The mainstream runoff primarily stems from recharge by upstream subbasins, tributaries, and precipitation.
2.2 Methodology and data collection
The daily fluctuations in river flow are analyzed at seven mainstream gauging stations, a process pivotal in the formulation of our subbasin modeling framework. Each subbasin's delineated area precisely reflects the geographical extent influencing its respective downstream station. Our developed hydrological model, as detailed in Sects. 2.2.2 and 3.1.1, demonstrates the capability to generate time series discharge data for both mainstream stations and tributaries. These datasets serve as crucial input discharge data for defining the inlet boundary, complemented by outlet boundary specifications derived from water level data sourced from the Mekong River Commission (MRC). This facilitates the integration of our hydrodynamic and response time models, as depicted in Fig. 2.
2.2.1 Data
For eight gauging stations extending from the Chiang Saen (CS) to Kratie (KR) stations, continuous daily water level and discharge data were obtained from the MRC website for the period 1980 to 2020. For tributaries, low-resolution discharge data were accessible for six stations: Chantangoy, Siempang, Pak Mun, Phonesy, Tha Ngon, and Ban Pak Kanhoung. The locations of these stations are indicated in Fig. 2. Additionally, low-temporal-resolution velocity data were measured at the Stung Treng (ST) station; however, velocity data were not available for stations located upstream of Stung Treng.
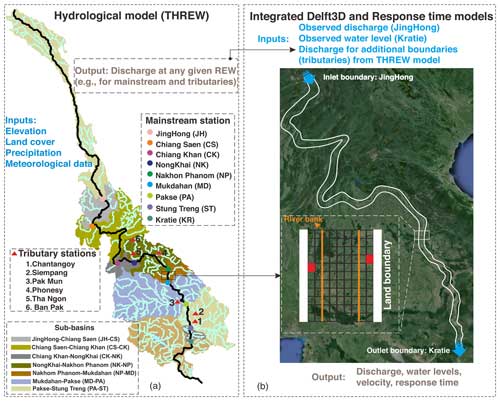
Figure 2Illustration of the developed integrated modeling framework: (a) the THREW model applied to the LMR basin and (b) the defined computational domain (white splines, i.e., land boundary) in the developed hydrodynamic model for analyzing daily river flow fluctuations. Each tributary is represented by a single cell located between the land boundary and the riverbank (red cells in panel (b)). Note: the cells in panel (b) do not represent the actual number of cells used in the simulations (see Sect. S4 in the Supplement for more details). The name of each defined subbasin in this study is based on its upstream and downstream stations (panel (a)). The background map in Fig. 2b is adapted from Google Earth Maps (e.g., © Google Maps).
Meteorological data sourced from the MRC and CMA, i.e., the China Meteorological Administration, served as primary inputs for the THREW (Tsinghua Hydrological model based on the Representative Elemental Watershed – REW) hydrological model. Daily precipitation records were gathered from 89 meteorological stations for the lower Mekong River subregion and 11 stations for the Lancang River subregion (Fig. S6). Additionally, other meteorological data, including near-surface air pressure, air temperature, specific humidity, wind speed and direction, sunshine duration, and solar radiation, were collected from 44 stations in both subregions. These datasets were utilized to calculate potential evapotranspiration using the Penman–Monteith equation, which is a crucial parameter for the THREW model.
Soil data were obtained using the global soil database provided by the Food and Agriculture Organization of the United Nations (FAO), with a spatial resolution of 10×10 km. DEM data used for the THREW model were obtained from the SRTM (Shuttle Radar Topography Mission), with a spatial resolution of 250 m. Data for the normalized difference vegetation index (NDVI), leaf area index (LAI), and snow cover were sourced from MODIS, featuring a spatial resolution of 500×500 m and a temporal resolution of 16 d (Zhang et al., 2023).
For the developed hydrodynamic model, SRTM data with an original resolution of 90 m were utilized for areas outside the mainstream of the LMR (https://srtm.csi.cgiar.org/srtmdata/, last access: 12 January 2024). For the mainstream of the LMR, measured cross-sectional shapes were available at various stations from the MRC website. An anisotropy approach was adopted during depth interpolation due to its superior performance in a flow-oriented coordinate system (see Merwade et al., 2006). The bathymetry data were then interpolated using the triangular technique embedded in the Delft3D model. Additionally, the internal diffusion method was applied to non-interpolated parts to assign depths to these areas (see Deltares, 2014, for detailed information). More details can be found in Sect. S3.
2.2.2 Hydrological model
The THREW model serves as a physically and spatially distributed model that utilizes the REW method. This approach's spatial feature allows each REW to be divided into various hydrological zones, capturing the basin's heterogeneous nature. The model incorporates various hydrological processes, such as glacier and permafrost dynamics, snowmelt, and precipitation, making it applicable to various regions within the LMR basin. It demonstrates high performance in producing tributary flows in each REW (Cui et al., 2023). Based on the REW method, we divided the LMR basin into subbasins based on selected hydrological stations for this study (Fig. 2).
The LMR basin is covered by 651 REWs (Fig. S7). For site-based data, the Thiessen polygon method was employed to calculate the inputs for each REW. For raster data, such as the LAI and NDVI, we conducted spatial intersection analysis to determine the raster cells within each REW and their respective weights. These weighted values were then averaged to obtain the inputs for the respective REW. Calibration of the model was achieved using an automatic parallel computation program to adjust the hydrological parameters (Nan et al., 2021). The THREW model was successfully applied to large river basins such as the LMR basin (Tian et al., 2020; Morovati et al., 2023), the Urumqi River basin (Mou et al., 2009), the Han River basin (Sun et al., 2014), and the Yarlung Tsangpo–Brahmaputra River basin (Xu et al., 2019; Nan et al., 2021; Cui et al., 2023). Additionally, inundation is calculated using a hydrodynamic model, with the THREW model providing tributary streamflow as an input rather than simply spreading the runoff across the basin.
Reservoir module
The THREW model schedules reservoirs according to the REW format. Due to the unavailability of detailed dam attributes, the model considers 85 dams within the basin, a number similar to that reported by Shin et al. (2020) and Dang et al. (2022). The basin contains 651 REWs (Fig. S7), and each dam is assigned to its corresponding REW based on location information. For each REW, the annual cumulative reservoir storage is calculated and input as a parameter into the THREW model. The reservoir module consists of two parts: (1) the initial storage phase and (2) the normal operation phase. In phase 1, each REW experiences a change in cumulative storage annually, signifying the operation of new reservoirs within that REW during that year. The rules governing the initial storage phase are detailed in Eqs. (1) to (6). During this phase, if the inlet flow is below the minimum reservoir discharge constraint, the outlet flow equals the inlet flow. Conversely, when the incoming flow meets or exceeds the minimum reservoir discharge constraint, the outlet flow is set to this minimum value. Additionally, once the reservoir storage surpasses the minimum reservoir storage constraint, the initial storage phase concludes, changing the reservoir scheduling into the normal operation phase.
Qout represents the outlet flow, Qin denotes the inlet flow, Qmin is the minimum reservoir discharge constraint, St stands for the reservoir storage at time t, Smin is the minimum reservoir storage constraint, Stotal denotes the total reservoir storage, and Qave denotes the average multiyear runoff for each REW during the calibration period (i.e., 2000–2009).
The scheduling rule for the normal operation phase of the reservoir follows the improved standard operating policy hedging model (SOP rule) (Morris and Fan, 1998; Wang et al., 2017b). During this phase, the reservoir operates according to the following rules, prioritized in decreasing order from (a) to (e):
- a.
The water balance is .
- b.
The reservoir storage constraint is .
- c.
The reservoir discharge constraint is .
- d.
The reservoir storage is maintained at Sc in the wet season.
- e.
The reservoir storage is maintained at Sn in the dry season.
Sc represents the reservoir storage corresponding to the flood control level, and Sn denotes the reservoir storage corresponding to the normal storage level.
During the normal phase, the reservoir scheduling rules account for two scenarios: the general case and the emergency case, each with distinct constraints. If, after scheduling based on the general case constraints, the outlet flow fails to meet the maximum or minimum reservoir flow constraints, the situation is deemed a contingency case. In such instances, the reservoir is re-scheduled according to the emergency case constraints, which involve appropriately relaxing the constraints on maximum reservoir storage and minimum reservoir flow. This adjustment aims to mitigate excessively high or low outlet flows, thereby reducing flow variability. While ensuring that reservoir storage remains safe, the emergency case maximizes the reservoir's regulation capabilities to promote more favorable downstream ecological conditions and support downstream production and livelihoods. The reservoir scheduling rules for the emergency case are denoted by rules (f) and (g):
- f.
After scheduling, verify whether the outlet flow is maintained between Qmin and Qmax: .
- g.
If condition (f) is false, repeat steps (a) to (e).
According to Tennant (1976), 30 % of the average multiyear flow sustains good survival conditions for most aquatic life forms and basic recreation, 10 % supports the short-term survival of aquatic life forms, and 60 % provides an excellent habitat during their primary growth period and for recreational uses. The maximum flow released from the dam should not exceed twice the average flow (Tennant, 1976). Therefore, in the general case, and . In the emergency case, .
Referring to Yun et al. (2020) for Sc and Sn, we set and . Here, Stotal. In the general case, Smax varies seasonally as follows:
In the emergency case, .
2.2.3 Hydrodynamic model
Water level or flow modeling requires a hydrodynamic model to accurately capture the daily fluctuations in river flow. Flow velocity is equally essential in this study, as any daily change in upstream flow necessitates time for its downstream impact to manifest. The Delft3D model was selected to implement 3D simulations of the basin (Deltares, 2014). The simulation domain encompasses the river reach between the JingHong and Kratie stations (∼2200 km) (Fig. 2).
In the study area, the horizontal scale of the river significantly exceeds its depth, validating the shallow water assumption. The Navier–Stokes equations are solved for the river's incompressible flow. Given the curved computational boundaries typical of rivers like the LMR, a spherical coordinate was utilized to prevent discretization errors resulting from undefined rectangular cells. The cyclic method was chosen for advection, and the k−ε turbulence model, known for its superior performance, was implemented for simulations (Shi et al., 2022; Morovati et al., 2021b; Wu et al., 2024). Both models have been validated to produce more accurate results than their counterparts for the LMR (Morovati et al., 2023).
Land boundaries were defined as wider than the river's main channel to accurately model large increases in discharge without being impacted by land boundaries. The JingHong (JH) and KR stations were designated the inlet and outlet boundaries, respectively, with the measured daily discharge and water level defined at these points. All the tributaries were also designated additional inlet boundaries, with their daily discharge simulated by the THREW model. A vertical uniform profile was applied for the defined inlet discharge. Further details on the model settings, computational meshing domain, and mesh sensitivity analysis can be found in Sects. S1 and S4.
2.2.4 Response time model
This model is developed to determine the time required for upstream daily river flow to impact the downstream section, thereby allowing us to identify which upstream daily river flow shifts correspond to specific downstream daily fluctuations. The concept of a response time reflects the degree of water exchange by depicting the residence times of water bodies while taking into account spatial heterogeneity. Therefore, to determine the response times of water and temporal dynamics within river systems, a sophisticated 3D response time (age) is developed, leveraging the hydrodynamic model within an Eulerian framework (Shi et al., 2023; Wu et al., 2024). Within this model, the trajectory of water entering the river is meticulously traced through the utilization of a virtual passive substance commonly referred to as a tracer. Note that the defined tracer does not change the water density. The response time is how long it has been since the tracer left a specific place like the inlet boundary. We start counting the response time from zero when the water first leaves the inlet boundary. In this context, the term “age” signifies the average time of the tracer. This means that the response time is calculated by considering the ages of all individual tracers and weighting them based on their mass. To simplify this, the introduction of the water age concentration helps with averaging by combining the average response times of water tracers with their concentrations. This creates a single variable that represents both the response time and the abundance of the tracers. Both tracer concentration and age concentration follow advection–diffusion equations, which are based on the principle of mass conservation. This means that they account for the movement and spread of tracers in the system while ensuring that mass is conserved throughout the process. The evolution of the response time is governed by a set of equations (Eqs. 7–9), where a represents the response time, C is the tracer concentration, and α denotes the age concentration.
In these equations, the components of horizontal and vertical velocity (diffusivity) are represented by u=(uv) (Dh) and w (Dv), respectively. ∇ is the Hamiltonian operator .
At the upstream and downstream boundaries of the LMR, designated JH and KR, the boundary conditions for the tracer and age concentrations are defined as 1 and 0 (0 and 0), respectively. These defined boundary conditions facilitate the accurate simulation of the response time along the primary flow path within the LMR. Furthermore, a cold start is implemented, initializing the entire domain with zero values for both the tracer and age concentrations.
2.3 Scenario setting
Our regional assessment of the basin is based on observed and simulated data spanning 4 decades from 1980 to 2020. We divided this period into three distinct phases. The first phase, from 1980 to 1991, is designated the pre-dam period due to the absence of large tributary and mainstream dams as well as limited land cover changes aimed at improving farming practices (Chua et al., 2022; Zhang et al., 2023). The second phase, from 1992 to 2009, is categorized as the growth period, marked by the commencement of dam construction, including projects like the Manwan and JingHong dams, alongside observable changes in land cover (Morovati et al., 2024). The third phase, from 2010 onwards, is termed the mega-dam period, characterized by the construction of mainstream dams with a total capacity of 45 km3 and many irrigation projects (Morovati et al., 2024). Additionally, a resurgence in tributary dam construction was observed in downstream subbasins of the Lancang River, contributing a total capacity of around 30 km3.
In line with recommendations from the MRC regarding allowable hourly water level changes downstream of cascade dams (5 cm h−1 or 1.2 m d−1) (MRC, 2020), our study focuses on water level changes exceeding 1 m, referred to as “events”. The aim is to quantitatively assess the regional impacts contributing to these events.
3.1 Model validation
3.1.1 THREW
The model calibration utilized data spanning from 2000 to 2009 across all the selected stations, ensuring its accuracy and reliability. The model validation was conducted for the pre-dam period (Fig. S8) and the mega-dam period (Fig. 3) to further assess its performance. The model exhibited good performance across all the stations, consistently achieving average Nash–Sutcliffe efficiency (NSE) values of greater than 0.92 for the pre-dam period and 0.78 for the mega-dam period.
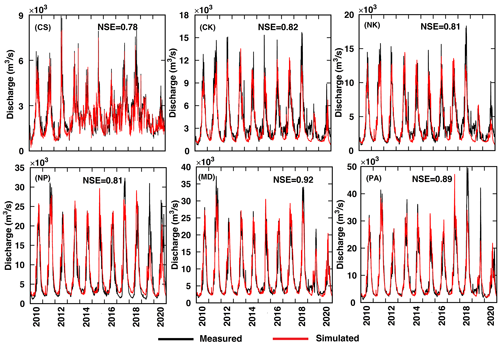
Figure 3Comparison using the THREW model of the simulated time series discharge and the measured data over the mega-dam period (2010–2020).
Comparable performance was attained for available tributary discharges during the pre-dam, growth, and mega-dam periods, with the NSE values exceeding 0.88 and indicating high accuracy. Additional details can be found in Fig. S9.
3.1.2 Hydrodynamic model
Accurately capturing the daily large fluctuations is a primary objective of this study, given its significant impact on regional contribution analysis. While a comprehensive comparison of the time series discharge and water level data yielded by the hydrodynamic model is conducted for all the stations throughout the study period (Fig. S5), Fig. 4a and b illustrate water level and discharge profiles for a single month, showcasing notable river flow shifts at the Chiang Khan (CK) and Pakse (PA) stations, respectively.

Figure 4Comparison of water level and discharge profiles at two stations: (a) Chiang Khan station and (b) Pakse station. Panel (c) depicts a point-by-point comparison of measured velocity with the hydrodynamic model for the year 2020 at the Stung Treng (ST) station.
In Fig. 4a, observations over the span of a month reveal two substantial daily water level increases (1.5 and 2.18 m) and a 1 m decrease in the water level. Meanwhile, Fig. 4b depicts the PA station as experiencing three consecutive large daily water level or flow increases. Notably, the developed model adeptly captures the river flow profiles at both stations, with a mean relative error (MRE) of less than 5 % underscoring its accuracy in modeling daily water level or flow shifts in the LMR.
Regarding flow velocity, data are solely available for the ST station at low temporal resolution. The daily flow velocity is compared with the model-derived velocity for the year 2020. A detailed point-by-point comparison indicates the model's relatively accurate simulation of flow velocity at this station, with an MRE of less than 6.2 %. Comparable levels of accuracy are achieved for the years 2018 and 2019 (Fig. S4).
3.2 Large daily water level or flow changes
Figure 5 illustrates significant fluctuations in water levels and discharges over a 24 h cycle (daily) across all the main hydrological stations during the pre-dam period (1980–1991). For comprehensive data covering the growth and mega-dam periods, please refer to Fig. S10. Such large river flow fluctuations occurred in the basin even before the construction of any dams. During this period, a total of 143 events were recorded at these stations, with a notable concentration within the initial 3 months of the wet season spanning from June to August. The number of daily fluctuations varies among the stations along the LMR. For instance, while the PA station encountered 28 events, the downstream ST station experienced only 7 events. This discrepancy underscores the significant influence of regional contributions on exacerbating or mitigating downstream discharge and subsequent water level changes (Fig. 7). Furthermore, the majority of these events were characterized by substantial increases in water level or discharge, aligning with observations typically associated with the wet season spanning from June to November.
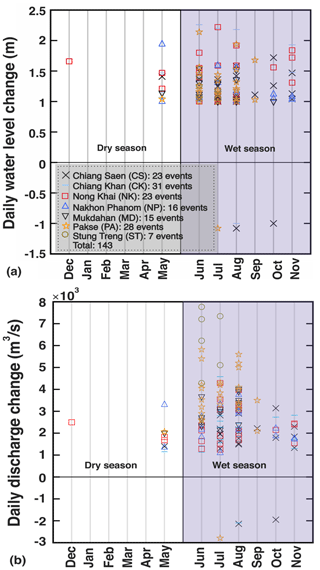
Figure 5The daily river flow alterations greater than 1 m for the mainstream stations (pre-dam period). Negative and positive values denote decreases and increases in water levels (a) and discharges (b), respectively. Note: in this study, the wet season starts on 1 June and ends on 30 November (LMC and MRC, 2023).
3.3 Response time
Response time denotes the duration required for a daily flow change upstream to propagate and be recorded at a downstream gauging station. This allows us to determine the effects of upstream daily river flow changes on downstream shifts. Figure 6 illustrates the resultant graphs and their corresponding equations for each mainstream station, enabling the calculation of response times for daily river flow changes to their respective downstream stations. Generally, a higher discharge at a given station corresponds to a shorter response time of its downstream station. This graph facilitates the determination of the minimum and maximum response time ranges for each daily river flow to reach its downstream station. For instance, at the PA station situated approximately 200 km upstream from the ST station, the response times range from 1 to 10 d, depending on the discharge at the Pakse station.
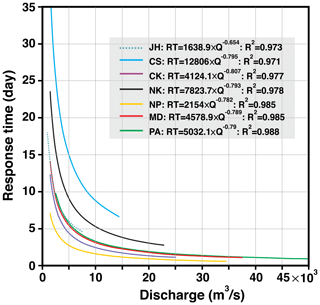
Figure 6Response time equations and their corresponding graphs for all the mainstream stations. Please note that the results presented in this figure are derived from the developed hydrodynamic model. These equations only calculate the response times based on the upstream station and do not consider the tributaries flowing into the mainstream.
3.4 Contributions of subbasins to mainstream flow
Figure 7 provides data on the cumulative average discharge at each hydrological station along the mainstream, reflecting contributions from both the respective subbasin and its upstream station. Upon analysis, it becomes evident that most subbasins in the LMR contribute significantly to the total downstream runoff, with the exception of the Nakhon Phanom–Mukdahan and Chiang Khan–Nong Khai subbasins. In these cases, the contribution from each subbasin to its downstream station is less than 5 % of the total discharge passing through each station. On average, around 35 %, 46 %, and 45 % of the total discharges during the wet season passing through the CS, CK, and Nakhon Phanom (NP) stations originate from their respective subbasins (Fig. 7), indicating the significant role of these subbasins in the daily river flow changes at their downstream stations.
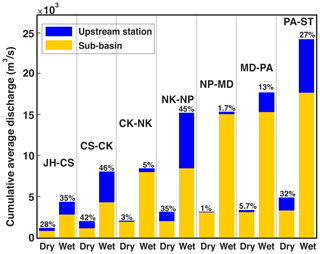
Figure 7The cumulative average discharge data at each hydrological station along the river's mainstream during the wet and dry seasons of the pre-dam period, incorporating contributions from both the corresponding subbasin and its upstream station. Note: for example, in this figure, “JH–CS” refers to the area or subbasin influencing the discharge at the Chiang Saen station from the JingHong station (JH).
Throughout the examined periods, there is no notable variance in the contributions of subbasins and upstream stations to the downstream stations, except for the NP station. At NP, a discernible increase of 10 % in the total runoff is observed in the last decade compared to the pre-dam period (Fig. S10, amounting to ∼2500 m3 s−1).
3.5 Contribution of upstream subbasins to large daily water level or flow increases
Figure 8 illustrates cumulative average daily discharge increases corresponding to the daily water level shifts exceeding 1 m at each station along the LMR's mainstream, considering contributions from both the subbasin and its upstream station(s). The CS station is closest to the Lancang River's course, where Chinese mega-dams were constructed recently (2010–2020). Results reveal that, during the pre-dam period, 67 % of the Chiang Saen discharge that resulted in water level shifts exceeding 1 m can be attributed to its subbasin. However, this contribution decreased to 62 % during the growth period and further to 58 % during to mega-dam period, indicating an impact that surpasses human activities in the Lancang basin.
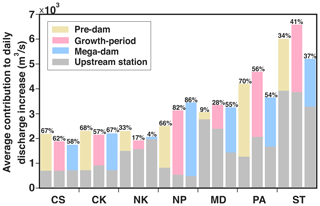
Figure 8Average daily discharge increases corresponding to the daily water level shifts exceeding 1 m at each station, considering contributions from both the respective subbasin (colored parts) and its upstream station(s) (grey parts) for the three defined periods. The percentage (%) shows the average contribution of each subbasin in the three examined periods.
This trend persists across other stations, such as CK, NP, and PA, where their respective subbasins' contributions remained above 54 % of daily discharge increases, resulting in water level shifts exceeding 1 m. The Mukdahan (MD) subbasin exhibited the lowest contribution during the pre-dam period, at 9 %. However, during the growth and mega-dam periods, the average contributions to daily discharge increases surged by 28 % and 55 %, respectively. Conversely, at the Nong Khai (NK) station, the contribution of its subbasin to discharge increases saw notable declines, from 33 % in the pre-dam period to 17 % and 4 % during the growth and mega-dam periods, respectively. Notably, the NP subbasin stands out for its substantial contribution, producing 66 % (pre-dam), 82 % (growth period), and 86 % (mega-dam) of its downstream station's large daily discharge increases.
While minor alterations in the flow patterns of large rivers are expected, particularly in regions characterized by dominant tropical monsoonal climates and a high number of dam constructions, substantial shifts in river flow and water levels resulting from heavy downpours and human activities can pose significant threats to the overall integrity of river networks and subsequent aquatic productivity. This study investigated the significant changes in river flow within the recently dammed LMR basin. The analysis revealed that, under the naturally wet conditions of the tropical lower Mekong River basin, the basin experienced noteworthy large daily river flow and water level fluctuations (> 1 m) even before the proliferation of anthropogenic activities such as large mainstream dams, tributary dams, and agricultural projects.
The basin's significant river flow changes stemmed primarily from increases rather than reductions in river flow, with the majority of these events occurring during the wet season over the past 4 decades. An approximate estimation of the precipitation received during the respective travel periods for each event reveals a consistency between the received precipitation and the contribution of the subbasin to its downstream station during the pre-dam period, as illustrated in Fig. 9. Conversely, the cumulative precipitation observed during the growth and mega-dam periods highlights a discrepancy when comparing some events: despite the larger precipitation received by the subbasin during certain event response times, its contribution to downstream river flow changes was less than that of events with lower precipitation (events marked by green arrows). This phenomenon could be attributed to factors such as human activities and precipitation, as indicated by the marked events in Fig. 9.
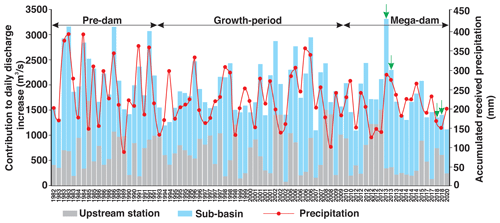
Figure 9Daily large river flow discharge changes at the CS station for the three defined periods. The right y axis shows the accumulated received precipitation in the JH–CS subbasin. Note: the total precipitation received does not correlate precisely with the discharge corresponding to the subbasin contribution.
Upon daily analysis of the large river flow changes along the LMR, this study finds that regional assessment in a large-scale modeling framework can be observed as an effective approach rather than solely focusing on subbasin study, as the impacts of upstream subbasins are experienced by downstream subbasin(s). This would also provide the possibility of exacerbating the impacts from upstream regions through coordinated management.
The basin experiences a notably heightened frequency of events, resulting in a 1 m increase in the water level compared to reduction events, as illustrated by Figs. 9 and 10. For example, at the CS station, there are 79 increased events, with only 18 reduction events in the last 4 decades for all the mainstream stations. This trend could possibly be due to a prevailing pattern of increased precipitation over multiple successive days, a phenomenon recurrent during the wet season (Fig. S13) and previously under the wet conditions of the region. Particularly noteworthy is the Lancang River's significant influence on daily discharge reduction at the CS station, accounting for eight events. This influence is especially pronounced during the growth and mega-dam periods, with more than 66 % of the CS station's large river flow change attributed to the Lancang region. This trend may be attributed to the compounded effects of heavy precipitation and human activities, such as the construction of large dams and agricultural projects after 1991.
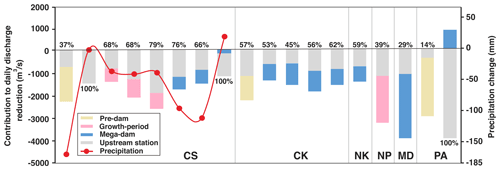
Figure 10The daily discharge reduction at each mainstream station, leading to water level decreases exceeding 1 m, is shown based on upstream station(s) and their corresponding subbasin(s). Each bar represents one event. Percentages indicate the contribution of the upstream station to the downstream hydrological station's large daily discharge change. The right y axis indicates the rough estimation of precipitation reduction before and after the response time of each event.
An approximate estimation of precipitation drop – one of the indicators of climate change – before and after the response time of the JH–CS subbasin indicates that, the greater the reduction in precipitation, the higher the contribution of the subbasin to the downstream river flow decrease.
For stations like NP, where significant tributaries converge with the mainstream in their subbasins, the contribution of the subbasins to the large discharge reduction outweighs that of the upstream station (59 %). This can primarily be attributed to the presence of numerous tributary dams, agricultural activities (Zhang et al., 2023), and the effects of climate change. These findings underscore the pivotal role of subbasins in influencing downstream discharge and subsequent water level variations.
Any changes in the upstream regions require time to be experienced by downstream areas, as river flow characteristics, including water level, discharge, and velocity, are influenced. Based on the highly accurately developed hydrodynamic model, this study provided equations based on the discharge and velocity for the mainstream hydrological station (Fig. 11). This basin lacks these data, which has important implications for future studies in terms of developing alarm systems for better management of the basin in case of significant upstream changes in river flow, as any upstream changes would impact the flow velocity and thus the response times of the impacts. These findings also bring new insights into fishery studies based on the integrated modeling frameworks and, based on our research direction, further studies will be conducted in the near future.
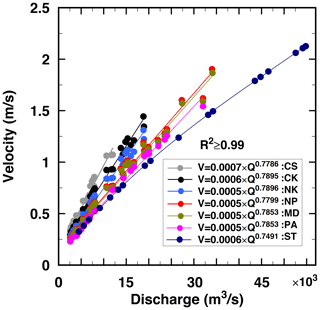
Figure 11Velocity equations for all the mainstream stations based on the data yielded by the developed hydrodynamic model. Note: the R2 for all the equations is > 0.99. Please refer to Sect. S10 for more details.
4.1 Limitations and ways forward
- i.
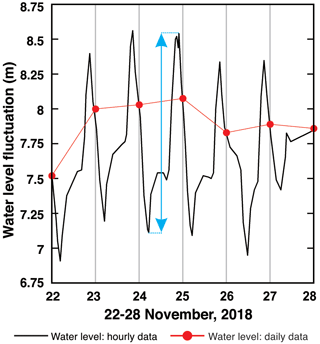
This study was conducted based on the daily data as the basin lacks subdaily data for the discharge and water level. While this study provided new additional insights into the regional assessment of precipitation and human activities in a large-scale basin study, subdaily river flow data may be central to accurately capturing the river flow regimes of the dammed LMR. For example, at the Ban Pakhoung (BP) station situated between the CS and CK stations (Fig. 2), the reported hourly water level data reveal that fluctuations exceeding 1 m are experienced by the mainstream even within a few hours. A relatively similar pattern is observed for a few days (Fig. 12). This pattern can trigger fish mortality by confining fish to small water bodies and thereby reducing the biomass (Li et al., 2022). This might be a result of the hourly operations of tributary dams and the precipitation received by the subbasin, as any change in its upstream station, i.e., CS, requires more than a few days to be experienced by this station (Fig. 6).
In contrast, the water level profile does not experience fluctuations larger than 1 m when using daily data for the same period. Therefore, for the dammed basins, higher-resolution temporal data are recommended (Morovati et al., 2024), as this may help to capture sudden water release by dams. Downscaling of the data (e.g., water level and discharge) in the LMR basin may also bring new insights into how river flow changed on an hourly scale during the pre-dam period.
- ii.
This study was unable to explicitly address the drivers behind large flow fluctuations, a factor attributed to the lack of detailed information on the dams within the basin, including their operation rules, commissioning dates, and water abstraction for agricultural purposes. Sufficient data on dam operations would enable the development of integrated hydrological, hydrodynamic, and response time models to better isolate the effects and gain a deeper understanding of the underlying mechanisms affecting water level patterns, as presented in Fig. 12. The uncertainties in the data and assumptions used in the dam module may contribute to the relatively lower accuracy of the THREW model during the mega-dam period compared to the pre-dam and growth periods. Therefore, obtaining more data in these areas could potentially improve the results presented in this work.
- iii.
The groundwater infiltration process was not incorporated into the developed hydrodynamic model. Although its impacts seem insignificant compared to the large discharge passing through the mainstream (Morovati et al., 2023), conducting groundwater measurements for each subbasin can further improve the accuracy of the model and thus reduce its uncertainty in attributing the upstream impact on the downstream subbasins.
- iv.
Although a large amount of sediment is transported from upstream reaches to downstream reaches (160 Mt yr−1) (Tian et al., 2023; Morovati et al., 2024), the basin lacks reliable sediment data to be incorporated into the model. These data are central to updating the river bed configuration while the river is simulated by the model, which can negatively influence the results.
- v.
Low-temporal-resolution velocity data were only available for the ST station within the modeled area. The developed model accurately simulates flow velocity, water level, and discharge at this station, with the same accuracy in the modeling water level and discharge for the upstream mainstream station. Based on this, this study developed equations based on the river discharge and flow velocity for all the mainstream stations to produce a continuous time series of velocity data. Although the accuracy of the modeling flow characteristics was relatively high at the mainstream stations, the accuracy of the model in reaches between two consecutive stations remains unknown, as (1) the distance between two consecutive stations is large (e.g., around 700 km from CS to CK) and (2) a more turbulent flow dominates the upstream reach of the LMR compared to its downstream reach. Providing more velocity data, even with low temporal resolution, would be important in producing detailed river flow regimes for the LMR.
This study provided an analysis of large river flow changes across the LMR over the past 4 decades. These were divided into three periods, i.e., pre-dam (1980–1991), growth (1992–2009), and mega-dam (2010–2020). In doing so, a subbasin approach was developed by incorporating physically based hydrological, reservoir module, 3D hydrodynamic, and response time models. This approach enabled us to address the contribution of subbasins to daily significant river flow changes. The results of the response times revealed a power correlation between the upstream daily river flow changes and the time required to reach the downstream station. Daily large river flow shifts exceeding 1 m were observed at various mainstream stations even before the construction of large hydropower dams in the basin, albeit differing in the number of events, emphasizing the natural variability of the river system. Approximately 92 % of these significant daily water level changes occurred during the wet season, particularly in June, July, and August. These large daily river flow changes were also observed after human modifications in the basin; however, the frequency of such events did not change significantly. This study revealed that water level profiles derived from daily data (1 value per day) can differ significantly from those based on hourly data (e.g., 24 values per day), potentially failing to fully capture the dynamic flow regime of the mainstream influenced by heavy downpours and the operation of numerous dams in both tributaries and the mainstream.
Moreover, we have demonstrated the substantial contribution of LMR subbasins to mainstream discharge, with certain subbasins contributing up to 46 % to downstream mainstream stations. The JingHong–Chiang Saen subbasin, for instance, contributed an average of 57 % to significant river flow changes at the Chiang Saen station during the mega-dam period, surpassing that of the Lancang basin. This highlights the need for their consideration of basin-scale management strategies using a basin-wide approach.
Water level, discharge, and velocity data are accessible at https://portal.mrcmekong.org/home (last access: 7 February 2024). The model code can be obtained upon reasonable request from the primary author of the paper. Data on dams can be found in the CGIAR Research Program on Water, Land, and Ecosystems (https://archive.iwmi.org/wle/thrive/2018/02/13/dams-data-and-decisions/index.html, last access: 10 November 2023). The SRTM data used for the hydrodynamic model can be found at https://srtm.csi.cgiar.org/srtmdata/ (CGIAR CSI, 2024). Due to policy restrictions, data from the JH station cannot be shared.
The supplement related to this article is available online at: https://doi.org/10.5194/hess-28-5133-2024-supplement.
KM designed the study. KM, FT, KZ, LS, and MW developed the models, with KM and KZ implementing them. KM drafted the manuscript in close collaboration with FT and YP. PS and LS contributed to the data curation. Throughout the study period, all the authors engaged in discussions regarding the results, provided critical feedback, and approved the final version of the paper.
At least one of the (co-)authors is a member of the editorial board of Hydrology and Earth System Sciences. The peer-review process was guided by an independent editor, and the authors also have no other competing interests to declare.
Publisher’s note: Copernicus Publications remains neutral with regard to jurisdictional claims made in the text, published maps, institutional affiliations, or any other geographical representation in this paper. While Copernicus Publications makes every effort to include appropriate place names, the final responsibility lies with the authors.
This research was supported by the National Natural Science Foundation of China (grant nos. 51825902 and 51961125204) and the Shuimu Tsinghua Scholar Program.
This paper was edited by Markus Hrachowitz and reviewed by Xiaobo Yun and one anonymous referee.
Burbano, M., Shin, S., Nguyen, K., and Pokhrel, Y.: Hydrologic changes, dam construction, and the shift in dietary protein in the Lower Mekong River Basin, J. Hydrol., 581, 124454, https://doi.org/10.1016/j.jhydrol.2019.124454, 2020.
CGIAR CSI: SRTM Data, CGIAR CSI [data set], https://srtm.csi.cgiar.org/srtmdata/, last access: 26 November 2024.
Chen, A., Liu, J., Kummu, M., Varis, O., Tang, Q., Mao, G., and Chen, D.: Multidecadal variability of the Tonle Sap Lake flood pulse regime, Hydrol. Process., 35, e14327, https://doi.org/10.1002/hyp.14327, 2021.
Chua, S. D. X., Lu, X. X., Oeurng, C., Sok, T., and Grundy-Warr, C.: Drastic decline of flood pulse in the Cambodian floodplains (Mekong River and Tonle Sap system), Hydrol. Earth Syst. Sci., 26, 609–625, https://doi.org/10.5194/hess-26-609-2022, 2022.
Cochrane, T. A., Arias, M. E., and Piman, T.: Historical impact of water infrastructure on water levels of the Mekong River and the Tonle Sap system, Hydrol. Earth Syst. Sci., 18, 4529–4541, https://doi.org/10.5194/hess-18-4529-2014, 2014.
Cui, T., Li, Y., Yang, L., Nan, Y., Li, K., Tudaji, M., and Tian, F.: Non-monotonic changes in Asian Water Towers' streamflow at increasing warming levels, Nat. Commun., 14, 1176, https://doi.org/10.1038/s41467-023-36804-6, 2023.
Dang, H., Pokhrel, Y., Shin, S., Stelly, J., Ahlquist, D., and Du Bui, D.: Hydrologic balance and inundation dynamics of Southeast Asia's largest inland lake altered by hydropower dams in the Mekong River basin, Sci. Total Environ., 831, 154833, https://doi.org/10.1016/j.scitotenv.2022.154833, 2022.
Darby, S. E., Leyland, J., Kummu, M., Räsänen, T. A., and Lauri, H.: Decoding the drivers of bank erosion on the Mekong River: The roles of the Asian monsoon, tropical storms, and snowmelt, Water Resour. Res., 49, 2146–2163, 2013.
Deltares: Delft3D-Flow user manual, https://content.oss.deltares.nl/delft3d4/Delft3D-FLOW_User_Manual.pdf (last access: 8 March 2024), 2024.
Galelli, S., Dang, T. D., Ng, J. Y., Chowdhury, A. K., and Arias, M. E.: Opportunities to curb hydrological alterations via dam re-operation in the Mekong, Nature Sustainability, 5, 1058–1069, 2022.
Han, Z., Long, D., Fang, Y., Hou, A., and Hong, Y.: Impacts of climate change and human activities on the flow regime of the dammed Lancang River in Southwest China, J. Hydrol., 570, 96–105, 2019.
Hecht, J. S., Lacombe, G., Arias, M. E., Dang, T. D., and Piman, T.: Hydropower dams of the Mekong River basin: A review of their hydrological impacts, J. Hydrol., 568, 285–300, 2019.
Intralawan, A., Smajgl, A., McConnell, W., Ahlquist, D. B., Ward, J., and Kramer, D.: Reviewing benefits and costs of hydropower development evidence from the Lower Mekong River Basin, Wiley Interdisciplinary Reviews: Water, 6, e1347, https://doi.org/10.1002/wat2.1347, 2019.
Johnston, R. and Kummu, M.: Water resource models in the Mekong Basin: a review, Water Resour. Manage., 26, 429–455, 2012.
Li, D., Long, D., Zhao, J., Lu, H., and Hong, Y.: Observed changes in flow regimes in the Mekong River basin, J. Hydrol., 551, 217–232, 2017.
Li, M., Liu, C., Liu, F., Wang, J., and Liu, H.: Decrease in Fishery Yields in Response to Hydrological Alterations in the Largest Floodplain Lake (Poyang Lake) in China, Front. Earth Sci., 10, 878439, https://doi.org/10.3389/feart.2022.878439, 2022.
LMC (Lancang-Mekong Center) and MRC: Technical Report – Phase 1 of the Joint Study on the Changing Patterns of Hydrological Conditions of the Lancang-Mekong River Basin and Adaptation Strategies. Beijing: LMC Water Center or Vientiane: MRC Secretariat, https://www.mrcmekong.org/publications/technical-report-phase-1-of-the-joint-study-on-the-changing-patterns-of-hydrological-conditions-of-the-lancang-mekong-river-basin-and-adaptation-strategies/ (last access: 26 November 2024), 2023.
Lu, X. X. and Chua, S. D. X.: River discharge and water level changes in the Mekong River: Droughts in an era of mega-dams, Hydrol. Process., 35, e14265, https://doi.org/10.1002/hyp.14265, 2021.
Lu, X. X., Li, S., Kummu, M., Padawangi, R., and Wang, J. J.: Observed changes in the water flow at Chiang Saen in the lower Mekong: Impacts of Chinese dams?, Quaternary Int., 336, 145–157, 2014.
Ly, S., Sayama, T., and Try, S.: Integrated impact assessment of climate change and hydropower operation on streamflow and inundation in the lower Mekong Basin, Progress in Earth and Planetary Science, 10, 55, https://doi.org/10.1186/s40645-023-00586-8, 2023.
Merwade, V. M., Maidment, D. R., and Goff, J. A.: Anisotropic considerations while interpolating river channel bathymetry, J. Hydrol., 331, 731–741, 2006.
Morris, G. L. and Fan, J.: Reservoir sedimentation handbook: design and management of dams, reservoirs, and watersheds for sustainable use, ISBN 007043302X, 9780070433021, 1998.
Morovati, K., Nakhaei, P., Tian, F., Tudaji, M., and Hou, S.: A Machine learning framework to predict reverse flow and water level: A case study of Tonle Sap Lake, J. Hydrol., 603, 127168, https://doi.org/10.1016/j.jhydrol.2021.127168, 2021a.
Morovati, K., Homer, C., Tian, F., and Hu, H.: Opening configuration design effects on pooled stepped chutes, J. Hydraul. Eng., 147, 06021011, https://doi.org/10.1061/(ASCE)HY.1943-7900.0001897, 2021b.
Morovati, K., Tian, F., Kummu, M., Shi, L., Tudaji, M., Nakhaei, P., and Olivares, M. A.: Contributions from climate variation and human activities to flow regime change of Tonle Sap Lake from 2001 to 2020, J. Hydrol., 616, 128800, https://doi.org/10.1016/j.jhydrol.2022.128800, 2023.
Morovati, K., Tian, F., Pokhrel, Y., Someth, P., Shi, L., Zhang, K., and Ly, S.: Fishery and agriculture amidst human activities and climate change in the Mekong River: A review of gaps in data and effective approaches towards sustainable development, J. Hydrol., 132043, https://doi.org/10.1016/j.jhydrol.2024.132043, 2024.
Mou, L., Tian, F., and Hu, H.: Artificial neural network model of runoff prediction in high and cold mountainous regions: A case study in the source drainage area of Urumqi River, Journal of Hydroelectric Engineering, 64–69, https://caod.oriprobe.com/articles/15688549/Artificial_neural_network_model_of_runoff_prediction_in_high_and_cold_.htm (last access: March 2024), 2009.
MRC: Assessment of Basin-Wide Development Scenarios (Main Report), Vientiane: MRC Secretariat, https://tile.loc.gov/storage-services/service/gdc/gdcovop/2013341124/2013341124.pdf (last access: 26 November 2024), 2011.
MRC: State of the Basin Report 2018/The Mekong River Commission/Vientiane/Lao PDR, https://www.mrcmekong.org/publications/state-of-the-basin-report-2018-2/ (last access: 26 November 2024), 2019.
MRC: Hydropower Mitigation Guidelines (Volume 3), Vientiane: MRC Secretariat, https://www.mrcmekong.org/wp-content/uploads/2024/08/Ish0306-vol3-1.pdf (last access: 26 November 2024), 2020.
Nan, Y., Tian, L., He, Z., Tian, F., and Shao, L.: The value of water isotope data on improving process understanding in a glacierized catchment on the Tibetan Plateau, Hydrol. Earth Syst. Sci., 25, 3653–3673, https://doi.org/10.5194/hess-25-3653-2021, 2021.
Piman, T., Cochrane, T. A., and Arias, M. E.: Effect of Proposed Large Dams on Water Flows and Hydropower Production in the Sekong, Sesan and Srepok Rivers of the Mekong Basin, River Res. Appl., 32, 2095–2108, https://doi.org/10.1002/rra.3045, 2016.
Pokhrel, Y., Burbano, M., Roush, J., Kang, H., Sridhar, V., and Hyndman, D. W.: A review of the integrated effects of changing climate, land use, and dams on Mekong River hydrology, Water, 10, 266, https://doi.org/10.3390/w10030266, 2018.
Räsänen, T. A., Someth, P., Lauri, H., Koponen, J., Sarkkula, J., and Kummu, M.: Observed River discharge changes due to hydropower operations in the Upper Mekong Basin, J. Hydrol., 545, 28–41, 2017.
Sabo, J. L., Ruhi, A., Holtgrieve, G. W., Elliott, V., Arias, M. E., Ngor, P. B., and Nam, S.: Designing River flows to improve food security futures in the Lower Mekong Basin, Science, 358, eaao1053, https://doi.org/10.1126/science.aao1053, 2017.
Shi, L., Sun, J., Lin, B., Liu, Z., and Zuo, X.: Hydro-thermodynamic processes at a large confluence under reservoir regulation, Water Resour. Res., 58, e2022WR033315, https://doi.org/10.1029/2022WR033315, 2022.
Shi, L., Sun, J., Lin, B., Morovati, K., Liu, Z., and Zuo, X.: Macroscopic hydro-thermal processes in a large channel-type reservoir, J. Hydrol. Regional Studies, 47, 101367, https://doi.org/10.1016/j.ejrh.2023.101367, 2023.
Shin, S., Pokhrel, Y., Yamazaki, D., Huang, X., Torbick, N., Qi, J., and Nguyen, T. D.: High-resolution modeling of river-floodplain-reservoir inundation dynamics in the Mekong River Basin, Water Resour. Res., 56, e2019WR026449, https://doi.org/10.1029/2019WR026449, 2020.
Soukhaphon, A., Baird, I. G., and Hogan, Z. S.: The impacts of hydropower dams in the Mekong River Basin: A review, Water, 13, 265, https://doi.org/10.3390/w13030265, 2021.
Sun, Y., Tian, F., Yang, L., and Hu, H.: Exploring the spatial variability of contributions from climate variation and change in catchment properties to streamflow decrease in a mesoscale basin by three different methods, J. Hydrol., 508, 170–180, 2014.
Tennant, D. L.: Instream flow regimens for fish, wildlife, recreation and related environmental resources, Fisheries, 1, 6–10, 1976.
Tian, F., Liu, H., and Hou, S.: Drought characteristics of the Lancang-Mekong basin and the role of reservoir regulation on streamflow, Int. J. Hydropower, 5, 81–89, 2020.
Tian, F., Hou, S., Morovati, K., Zhang, K., Nan, Y., Lu, X. X., and Ni, G.: Exploring spatio temporal patterns of sediment load and driving factors in Lancang-Mekong River basin before operation of mega-dams (1968–2002), J. Hydrol., 617, 128922, https://doi.org/10.1016/j.jhydrol.2022.128922, 2023.
Try, S., Lee, G., Yu, W., Oeurng, C., and Jang, C.: Large-scale flood-inundation modeling in the Mekong River Basin, J. Hydrol. Eng., 23, 05018011, https://doi.org/10.1061/(ASCE)HE.1943-5584.0001664, 2018.
Try, S., Tanaka, S., Tanaka, K., Sayama, T., Lee, G., and Oeurng, C.: Assessing the effects of climate change on flood inundation in the lower Mekong Basin using high-resolution AGCM outputs, Progress in Earth and Planetary Science, 7, 1–16, 2020.
Try, S., Sayama, T., Oeurng, C., Sok, T., Ly, S., and Uk, S.: Identification of the spatio-temporal and fluvial-pluvial sources of flood inundation in the Lower Mekong Basin, Geosci. Lett., 9, 5, https://doi.org/10.1186/s40562-022-00215-0, 2022.
Van Binh, D., Kantoush, S. A., Saber, M., Mai, N. P., Maskey, S., Phong, D. T., and Sumi, T.: Long-term alterations of flow regimes of the Mekong River and adaptation strategies for the Vietnamese Mekong Delta, J. Hydrol.: Regional Studies, 32, 100742, https://doi.org/10.1016/j.ejrh.2020.100742, 2020.
Wang, J., Yun, X., Pokhrel, Y., Yamazaki, D., Zhao, Q., Chen, A., and Tang, Q.: Modeling daily floods in the Lancang-Mekong River basin using an improved hydrological-hydrodynamic model, Water Resour. Res., 57, e2021WR029734, https://doi.org/10.1029/2021WR029734, 2021.
Wang, S., Zhang, L., She, D., Wang, G., and Zhang, Q.: Future projections of flooding characteristics in the Lancang-Mekong River Basin under climate change, J. Hydrol., 602, 126778, https://doi.org/10.1016/j.jhydrol.2021.126778, 2021.
Wang, W., Lu, H., Ruby Leung, L., Li, H. Y., Zhao, J., Tian, F., and Sothea, K.: Dam construction in the Lancang-Mekong River Basin could mitigate future flood risk from warming-induced intensified rainfall, Geophys. Res. Lett., 44, 10–378, 2017a.
Wang, W., Li, H. Y., Leung, L. R., Yigzaw, W., Zhao, J., Lu, H., Deng, Z., Demisie, Y., and Blöschl, G.: Nonlinear filtering effects of reservoirs on flood frequency curves at the regional scale, Water Resour. Res., 53, 8277–8292, https://doi.org/10.1002/2017WR020871, 2017b.
Wu, M., Sun, J., Shi, L., Guo, J., Morovati, K., Lin, B., and Li, Y.: Vertical water renewal and dissolved oxygen depletion in a semi-enclosed Sea, J. Hydrol., 637, 131369, https://doi.org/10.1016/j.jhydrol.2024.131369, 2024.
Xu, R., Hu, H., Tian, F., Li, C., and Khan, M. Y. A.: Projected climate change impacts on future streamflow of the Yarlung Tsangpo-Brahmaputra River, Global Planet. Change, 175, 144–159, 2019.
Yoshida, Y., Lee, H. S., Trung, B. H., Tran, H. D., Lall, M. K., Kakar, K., and Xuan, T. D.: Impacts of mainstream hydropower dams on fisheries and agriculture in lower Mekong Basin, Sustainability, 12, 2408, https://doi.org/10.3390/su12062408, 2020.
Yun, X., Tang, Q., Wang, J., Liu, X., Zhang, Y., Lu, H., and Chen, D.: Impacts of climate change and reservoir operation on streamflow and flood characteristics in the Lancang-Mekong River Basin, J. Hydrol., 590, 125472, https://doi.org/10.1016/j.jhydrol.2020.125472, 2020.
Yun, X., Song, J., Wang, J., and Bao, H.: Modelling to assess the suitability of hydrological-hydrodynamic model under the hydropower development impact in the Lancang-Mekong River basin, J. Hydrol., 637, 131393, https://doi.org/10.1016/j.jhydrol.2024.131393, 2024.
Zhang, K., Morovati, K., Tian, F., Yu, L., Liu, B., and Olivares, M. A.: Regional contributions of climate change and human activities to the altered flow of the Lancang-Mekong River, J. Hydrol. Regional Studies, 50, 101535, https://doi.org/10.1016/j.ejrh.2023.101535, 2023.
This study examines large daily river flow fluctuations in the dammed Mekong River, developing integrated 3D hydrodynamic and response time models alongside a hydrological model with an embedded reservoir module. This approach allows estimation of travel times between hydrological stations and contributions of subbasins and upstream regions. Findings show a power correlation between upstream discharge and travel time, and significant fluctuations occurred even before dam construction.
This study examines large daily river flow fluctuations in the dammed Mekong River,...


