the Creative Commons Attribution 4.0 License.
the Creative Commons Attribution 4.0 License.
Simulation of spatially distributed sources, transport, and transformation of nitrogen from fertilization and septic systems in a suburban watershed
Lawrence E. Band
Peter M. Groffman
Laurence Lin
Amanda K. Suchy
Jonathan M. Duncan
Arthur J. Gold
Excess export of reactive nitrogen in the form of nitrate (NO) from suburban watersheds is a major source of water quality degradation and threatens the health of downstream and coastal waterbodies. Ecosystem restoration and best management practices (BMPs) can be introduced to reduce in-stream NO loads by promoting vegetation uptake and denitrification in the upland and riparian areas. However, accurately evaluating the effectiveness of these practices and setting regulations for nitrogen inputs requires an understanding of how human sources of nitrogen interact with ecohydrological systems. We evaluated how the spatial and temporal distribution of nitrogen sources interacts with ecohydrological transport and transformation processes along surface and subsurface flow paths with respect to nitrogen cycling and export. Embedding distributed household sources of nitrogen and water within hillslope hydrologic systems influences the development of both planned and unplanned “hot spots” of nitrogen flux and retention in suburban ecosystems. We chose a well-monitored low-density suburban watershed, Baisman Run, in Baltimore County, Maryland, USA, to evaluate patterns of in-stream NO concentrations and terrestrial nitrogen cycling processes in response to three common activities: irrigation, fertilization, and on-site sanitary wastewater disposal (septic systems). We augmented a distributed ecohydrological model, RHESSys (Regional Hydro-Ecological Simulator System), with estimates of the spatial distribution of these loads at household parcel level to develop a predictive understanding of the factors generating upland and riparian nitrogen cycling, transport, and stream NO concentrations. We calibrate subsurface hydraulic parameters only without calibrating ecosystem and biogeochemical processes. The calibrated model predicted mean NO concentrations of 1.43 mg NO-N L−1 compared to the observed 1.6 mg NO-N L−1 from water year 2013 to 2017. With spatially explicit irrigation, fertilizer, and septic effluent inputs, estimated denitrification rates in grass lawns, a dominant land cover in suburban landscapes, were also in the range of previously measured values. The highest predicted denitrification rates (N retention hot spots) were downslope of lawn and septic locations in a constructed wetland and at a riparian sediment accumulation zone at the base of a gully receiving street drainage. These locations illustrate the development of hot spots for nitrogen cycling and export in both planned and “accidental” retention features. Appropriate siting of suburban nutrient management and BMPs should assess and incorporate spontaneously developed nutrient hot spots to design improved landscape ecosystem N retention and water quality.
- Article
(8577 KB) - Full-text XML
- BibTeX
- EndNote
Nitrogen (N) and carbon (C) are fundamental elements for ecosystem functions and are influenced by multiple factors including climate (Campo and Merino, 2016; Crowther et al., 2016), moisture and other soil properties (Pastor and Post, 1986; Wang et al., 2020), plant and microbial community composition (Chen et al., 2003), and human activities (Galloway et al., 2008). They are also influenced by the state and pattern of drainage flow paths as different forms of C and N are mixed and transported to distinct edaphic conditions, potentially forming “hot spots” (McClain et al., 2003) that have a disproportionate influence on landscape and watershed-scale biogeochemical cycling functions. Understanding mechanisms of N and C cycling and interactions with hydrologic processes is necessary to design and implement efficient ecosystem service and restoration strategies. In urban, suburban, and exurban ecosystems, human disturbance to biogeochemical cycling has led to air and water quality degradation. Best management practices (BMPs) are popularly deployed to reverse the degradation and improve local and downstream water quality, increase C and N retention, and promote ecosystem resilience to prepare for extreme weather events with changing climate. BMPs can be both structural (e.g., constructed wetlands) and non-structural (e.g., changing fertilization and irrigation regimes). In addition to planned BMPs, spontaneously developed “hot spots” (Palta et al., 2017) may be responsible for a large share of nutrient retention and should therefore be identified and protected. Both planned and unplanned retention features exist at very localized, sub-hillslope scales. Therefore, gaining a comprehensive understanding of hillslope-level ecohydrological behavior and interactions between (i) ecosystems and human-derived nitrogen sources, as well as (ii) flow-path modification, can lay the foundation for effectively mitigating these environmental issues through spatially well-conceived and sustainable management practices.
In urban ecosystems, human activities introduce additional inputs of water (e.g., lawn irrigation and septic effluent), carbon (e.g., mulch, lawn amendments), and nitrogen (e.g., septic systems, lawn and garden fertilization, sanitary sewer leakage), occurring on discrete land segments and altering watershed mass budgets of water and nutrients. Lawn fertilization can contribute more than half of the total N input in urban watersheds, even if it is only applied to 20 %–30 % of the landscape (Band et al., 2005; Groffman et al., 2004; Hobbie et al., 2017). In the United States, about 20 % of households (26.1 million) were reported to be served by septic systems in 2007 (US EPA, 2008). Through our work in the Baltimore Ecosystem Study, low-density suburban areas have been shown to produce the highest NO load per unit developed land among different land uses, degrading local and downstream water quality (Groffman et al., 2004; Zhang et al., 2022). Atmospheric deposition and septic system wastewater N can comprise similar input amounts at the watershed scale, but septic input is concentrated over only 1 %–2 % of the landscape, with a large, localized volume of wastewater sufficient to result in groundwater mounding and effluent plumes extending towards local streams (Cui et al., 2016). The concentrated inputs over limited areas by septic inputs and lawn fertilization with or without irrigation create delivery or retention patterns of N hot spots that provide opportunities for targeting N mitigation strategies (Groffman et al., 2023).
With rapid suburban and exurban sprawl, decision makers are facing environmental challenges which require detailed planning for siting BMPs effectively in watersheds to promote N retention, reduce N export in streams, and protect water quality. These include both constructed and “inadvertent” biogeochemical hot spots of N retention at specific hillslope locations (e.g., swales, wetlands, riparian areas) at resolutions required for landscape design. However, commonly used modeling frameworks often do not couple distributions and interactions of hillslope ecohydrological processes in transporting and transforming natural and human-induced N sources to understand or predict local-scale (neighborhood or hillslope) transport and retention. Semi-distributed hydrologic models, such as the Storm Water Management Model (SWMM; Rossman, 2010) and the Soil Water Assessment Tool (SWAT; Arnold et al., 1998), are widely used to simulate nutrient loads at subwatershed-level outlets. They simulate water and nutrient balance based on hydrologic response units (HRUs) with similar land cover and soil, where nutrients are independently processed by BMPs and added to streamflow at the subcatchment outlet. However, these models lack hillslope water and nutrient mixing along interacting surface–subsurface hydrologic flow paths. These interactions are important to simulate the formation of biogeochemical hot spots where potential uptake and retention of nutrients are high. The lack of sub-hillslope flow-path processes may generate significant bias in estimating key hydrologic and biogeochemical processes (Band et al., 1993; Fan et al., 2019). Data-driven approaches, such as SPARROW (Ator and Garcia, 2016; Smith et al., 1997), are also developed to assess large-scale water quality in streams by nonlinear regression from gauged discharge and solute concentrations. However, these models also do not investigate hillslope-scale transport and transformation processes. In addition, data do not exist at hillslope scales to develop sufficient data-based approaches to understand and predict retention processes (e.g., denitrification, uptake, immobilization).
Fully distributed hydrology models, such as MIKE-SHE (Abbott et al., 1986a, b), RTM-PiHM (Bao et al., 2017; Zhi et al., 2022), ParFlow (Maxwell, 2013), and RHESSys (Regional Hydro-Ecological Simulator System; Tague and Band, 2004), could explicitly couple hillslope hydrologic and biogeochemical processes that are required to understand the transport and transformation of these human-induced N loads along hydrologic flow paths from upland to stream. They simulate surface and subsurface hillslope processes with detailed topographic and soil information to generate distributed surface runoff, recharge, soil moisture, evapotranspiration (ET), and other ecohydrological variables. Lateral surface and subsurface drainages redistribute precipitation, resulting in gradients of water availability within a watershed from ridge to riparian areas. These models include modules for biogeochemical reaction and transport processes, which can interact with the transport and storage patterns of soil water and provide high-resolution output for each location within a watershed.
Therefore, a spatially explicit and process-based framework that simulates hillslope hydrology and interactions between C, N, vegetation, water, and household-level human activities through flow paths has important advantages to understand and manage non-point-source pollutants and hot spots in urban watersheds (Bernhardt et al., 2017; Groffman et al., 2009). The ability to represent processes at the scale of human perception can also provide information useful for decision-making as well as community and stakeholder involvement. High-resolution simulations and visualization of spatially explicit water, N cycling, and transport can facilitate understanding and communication of how human activities can alter terrestrial and aquatic ecosystem functions in urban ecosystems and contribute to participatory planning. The framework should be capable of extension to watersheds without water chemistry data, which are less available than discharge records worldwide. It would be a valuable feature of the framework to estimate nutrient dynamics reasonably, while restricting calibration to hydrologic parameters. Calibrating nutrient dynamics may not allow generalization to watersheds without chemistry records or extrapolation to conditions in which water quality BMPs are implemented.
RHESSys is an ecohydrological model that simulates mass balances of water, C, and N of a watershed including hydrologic and biogeochemical stores and cycling. The hydrologic component in RHESSys routes water and solutes based explicitly on topographic and infrastructure surface water flow paths, as well as two-dimensional subsurface flow based on dynamic groundwater table gradients. Biogeochemical process rates are then estimated with modules modified from Biome-BGC (Running and Hunt, 1993), CENTURYNGAS (Parton et al., 1996), and subsequent models. In this study, we augmented RHESSys to include household-level transfer of groundwater for lawn irrigation and domestic water use, with domestic water use routed to septic spreading fields. By coupling hillslope hydrology and biogeochemistry at spatially connected patches, RHESSys estimates spatiotemporal patterns of soil moisture, lateral flow distribution, evapotranspiration, groundwater level, and N transportation, transformation, uptake, and immobilization. In summary, by adding modules of household-level lawn irrigation, fertilization, and septic releases (see Sect. 2.3), as commonly sourced from groundwater in low-density suburban and rural areas, RHESSys is designed with the capacity to simulate the comprehensive ecosystem dynamics and feedbacks of introduced spatially explicit lawn irrigation, fertilization, and septic releases at resolutions commensurate with human management of the landscape. This facilitates the scientific assessment of small-scale human activity and modification to land cover and infrastructure in expanding suburban and exurban areas.
We developed and used the augmented version of RHESSys to investigate the spatial and temporal distribution of hydrologic and biogeochemical N cycling and export in a low-density suburban watershed, Baisman Run (BARN, see Sect. 2.1). BARN is in a suburban area of Baltimore County, with all households using septic systems and well water. We developed numerical experiments with and without human additions of water and N and compared model results to field observations for streamflow, water chemistry, and soil N cycling processes to answer the following research questions:
-
What are the individual and interacting contributions of different watershed N sources to stream water N export?
-
How do the spatially nested patterns of water and N inputs from human activities alter spatial patterns of key ecohydrological processes including N retention, evapotranspiration, groundwater levels, and flows?
-
What are the patterns of hot spots for N retention and associated implications for the design of BMPs to promote N retention within suburban watersheds?
2.1 Study area
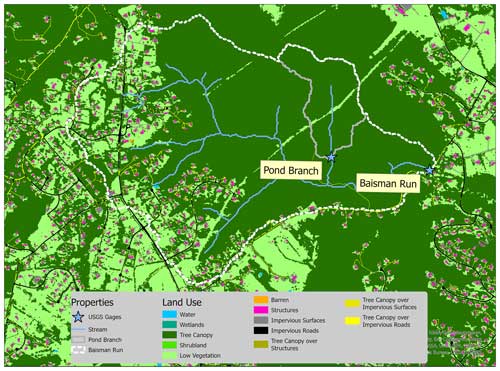
Our study watershed (Fig. 1), BARN, is in Baltimore County, MD, outside of the urban sanitary sewer service boundary. The 3.8 km2 watershed is in the Piedmont physiographic province with a rolling, locally steep landscape. Mean elevation is 170.5 m, with average slope 7.8°. Meteorological records from 1980 to 2018 were integrated from the Baltimore–Washington International Airport (BWI) weather station and a local rain gauge adjacent to BARN at the Oregon Park operated by the Baltimore Ecosystem Study (BES), available after 2013 (Welty and Lagrosa, 2020). Mean annual maximum and minimum temperatures are 18.9 and 7.9 °C, respectively, and mean annual precipitation is 1024 mm. The discharge and gauge height records of BARN have been monitored by the USGS (gauge ID: 01583580) since 1999.
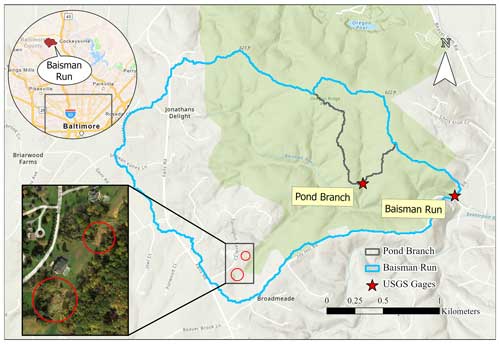
Figure 1Study watershed Baisman Run (BARN) in suburban Baltimore County, Maryland (from ESRI). The inset (from ESRI World Imagery) highlights two N retention “hot spots”: a sediment accumulation zone (upper circle) receiving drainage from roads and a constructed wetland (lower circle). Pond Branch (POBR), a fully forested subcatchment, is outlined in gray.
Soils in BARN range from silt clay loam to silt loam in the riparian areas to sandy loam on steeper slopes. Forested areas are dominated by approximately 100-year-old Quercus spp. (oaks) and Carya spp. (hickory). The entire watershed is underlain by the medium- to coarse-grained micaceous schist of the Loch Raven Formation, overlain by a weathered saprolite. The saprolite thickness is highest on ridges (up to 20 m), thins (<1 m) with some bedrock outcrops at steep midslope positions, and is 1–2 m in bottom-land locations (Cleaves et al., 1970; St Clair et al., 2015). Hydraulic conductivities of soils generally decrease with depth but may locally increase into the saprolite. The saprolite may store substantial amounts of moisture and is drained through underlying bedrock fractures through a set of emergent springs on the valley sidewall–riparian area transition, providing a fairly steady baseflow (Putnam, 2018). Dominant land cover includes forest and lawns, covering 81.5 % and 14.5 % of the watershed, respectively. Impervious areas cover 4.0 % of the watershed, including roofs of single-family houses, driveways, and roads. Lawns are located in front and backyards of households in headwater areas of BARN. Two natural-gas supply lines cut through the watershed, creating two strips of herbaceous land.
BARN is a useful watershed for examining the interactions between human activities and watershed ecohydrological response, as the sources and disposal of domestic water are on-site without external piped inputs and outputs. In this suburban watershed all households use groundwater wells for water supply and on-site septic systems to process wastewater. Lawn and garden fertilization is another major source of N input in BARN (Law et al., 2004). Septic and fertilization N and water additions are localized on lawns and septic drain fields near houses in the BARN headwaters.
The availability of several previously collected datasets allowed us to compare simulation results to field observations. Rich ecohydrological observations and lawn management surveys (Fraser et al., 2013; Law et al., 2004) from the BES are available as are weekly water chemistry concentration data at the BARN USGS gauge since 1998 (Groffman et al., 2020; Castiblanco et al., 2023). In addition, a fully forested subcatchment of BARN, Pond Branch (POBR, Fig. 1), is also monitored weekly by the BES and USGS (Gauge ID: 01583570). POBR serves as a forest control site without human water and nutrient additions. Finally, we have previously estimated N stores and cycling rates, including lawn soil NO content and denitrification rates in BARN (Suchy et al., 2023), sites on the campus of the University of Maryland Baltimore County (Raciti et al., 2011), and other sites in the region (Groffman et al., 2009). Annual atmospheric N deposition was estimated as 11 kg N ha−1 from site MD99 of the National Trends Network from National Atmospheric Deposition Program (NADP, 2022).
2.2 RHESSys setup and calibration
2.2.1 Model inputs and settings
Our study period makes use of observed and simulated watershed processes from water year 2013 to 017 (i.e., 1 October 2012 to 30 September 2017). BARN had gradual suburban development in the headwater which was converted from agricultural land over a few decades. New development was largely completed in the 1990s, with one last field developed in 2007–2009. Our study period could reduce the uncertainty of N inputs due to land cover change during urban development and allow for analysis of N dynamics in a stationary condition. We set a 30-year simulation spin-up period to stabilize groundwater levels and C and N pools. Inspection of the spin-up storage of soil C and N showed they were asymptotic with stable C:N ratios, with a mean of 8.5 in the entire watershed. The watershed is delineated using 1 m digital elevation data (Baltimore County GIS, 2017) using r.watershed (Ehlschleager et al., 2008) from GRASS GIS. Streams are identified when accumulated drainage areas are above 10 ha (Fig. 1), which approximates the extension of Baltimore County's dataset of hydrology lines (Baltimore County GIS, 2016). Detailed land use information (LULC) data are from the Chesapeake Conservancy (Chesapeake Bay Program, 2023). The dataset contains “roof” as a LULC class, from which we identified 249 spatially isolated clusters of roofs within BARN. Comparison with the Baltimore County parcel dataset (Baltimore County GIS, 2019) and the latest Google Earth satellite data allows us to filter out detached garages and sheds and to identify the main building in each parcel. We identified 181 households, although 13 homes are located on the watershed divide, providing some uncertainty in the effective number of septic systems.
We set up RHESSys in BARN at 10 m resolution. Patches in centroids of the 181 main buildings were identified as “drain-in” patches, receiving on-site water supply from a hillslope-scale groundwater store. We simulated groundwater well supplies from deep groundwater stores to household use as either domestic water use routed to septic spreading fields or to lawns for irrigation. Drain-in patches (homes) were paired with “drain-to” patches (septic spreading fields and lawns) to receive domestic water release, which are discussed in detail in Sect. 2.3. The methods can also draw water from ponds, but there is only one pond in the watershed that has occasionally been used for irrigation, and our simulations relied fully on groundwater wells. The riparian areas in RHESSys were defined as areas with height above nearest drainage (HAND) below 1.5 m (Nobre et al., 2011). This is an approximation of riparian extent based on local inspection and can be improved with more detailed riparian delineation. These areas were set to receive additional drainage from the deep groundwater system, which can set a feedback between greater household groundwater use and lower groundwater inputs to riparian areas. The start and end dates of the growing season in RHESSys are based on local observations and vary for lawn and forest: deciduous trees grow from 5 May to 22 October and grass is set as perennial, identical to parameters in previous RHESSys studies (Lin et al., 2015, 2019). There is limited conifer cover in BARN and some mountain laurel (Kalmia sp.) understory on hillslopes.
2.2.2 Parameter calibration
We calibrate several subsurface hydraulic parameters to simulate lateral and vertical water flows and route subsurface lateral flow following the procedure detailed in Smith et al. (2022). In this study, we calibrated eight parameters (Table 1) for subsurface properties (i.e., lateral and vertical saturated hydraulic conductivities and their decay rates, pore size index, and air entry pressure) with initial estimates (Fig. A2) from the Soil Survey Geographic Database (SSURGO; USDA, 2019) and deeper groundwater processes (i.e., bypass seepage from surface and shallow saturated soil, as well as drainage rate to stream). We set the calibration period from water year 2013 to 015 and validation period from water year 2016 to 2017. The original parameter values derived from SSURGO were further calibrated by multipliers to vary their magnitudes but preserve the spatial patterns of soil hydraulic properties (Fig. A2).
Table 1RHESSys parameters being calibrated and their physical representations (Tague and Band, 2004). Calibrated results are shown as ranges of multipliers to original soil properties (Figs. A2 and A3) and groundwater component generating behavioral simulations with NSE greater than 0.5 for streamflow.
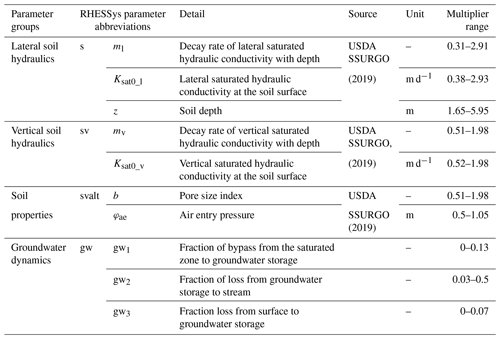
Specifically, the simulated streamflow was used to calibrate against the daily USGS discharge records (gauge ID: 01583580). From 4000 parameter set realizations randomly chosen within specified limits described in Smith et al. (2022), behavioral sets are chosen as yielding Nash–Sutcliffe efficiency (NSE; Nash and Sutcliffe, 1970) greater than 0.5 and fraction of groundwater loss to stream (i.e., gw2 in Table 1) less than 0.5 to estimate the ensemble means and uncertainties of model simulations. The latter condition was enforced to regulate the flashiness of groundwater dynamics, as BARN is found to have large saprolite storage to provide steady baseflow (Putnam, 2018). To assess uncertainty, we report the 95 % uncertainty boundaries for simulated streamflow and NO concentration and load. Lastly, we emphasize that no calibration was performed for N inputs (e.g., fertilization rate and septic load) or N cycling and transport processes in the model, as an important aim of our methods is to evaluate the capacity of our model to regionalize to watersheds where no water chemistry but only streamflow observations are available.
2.3 Household additions of water and N
We included estimates of fertilization, on-site wastewater disposal from septic systems, and irrigation as input to RHESSys to incorporate water and N management decisions and capture how such activities affect water and N cycling and export within the study watershed.
2.3.1 Fertilization
The lawn fertilization module in RHESSys specifies the amount, location, and timing of fertilization rates applied to lawns. Law et al. (2004) and Fraser et al. (2013) conducted in-person household surveys in a set of neighborhoods in the Baltimore area, including BARN, and found that approximately 50 % of homeowners apply fertilizer to their lawns, with a mean annual total fertilization rate ranging from 3.7 to 13.6 g N m−2. Both surveys were conducted during significant drought conditions (2002 and 2008) when lawn care was reduced due to groundwater supply concerns. Hence, we consider the survey results to be on the lower end of actual rates. In this study, we used the intermediate lawn fertilization rates consistent with estimates of Law et al. (2004) surveyed in 2002, 8.4 g N m−2 (12.4 kg N ha−1 yr−1 at watershed scale, accounting for lawns that are not fertilized), for a denser suburban site. We assumed all lawns in BARN were fertilized three times with a 60 d interval between applications beginning 1 April. This fertilization frequency is consistent with our prior household surveys and similar to results of surveys conducted in other suburban communities (Carrico et al., 2013; Martini et al., 2015). The model distributed the estimated total fertilization amount uniformly to all lawns in the watershed at rates modulated by the proportion of lawns fertilized estimated by Law et al. (2004) and Fraser et al. (2013).
In the model, applied fertilizer is stored in an independent pool of each lawn patch, and each day we assumed a fixed fraction of available nutrients in the fertilizer pool leached to other pools, of which 80 % is dissolved to detention storage and 20 % to soil. Assuming all lawn fertilization is done with the slow-release fertilizer designed to remain 10 % after one fertilization interval, the daily release fraction (RF) is determined by the fertilization interval (FI), following Eq. (1):
In our case study, our 60 d fertilization interval results in 3.8 % of nutrients in the fertilization pool declining exponentially and being transported to other pools per day and then stored, consumed by vegetation, immobilized, denitrified, or further transported to groundwater and downslope. User-defined fertilization time series could overwrite this setting of lawn fertilization if observations are available. In this study, we considered fertilizer input to only contain NO, following sensitivity analysis that found that varying NO and NH proportions in fertilizer had negligible impacts on model outputs. Once NO is released to soil, N cycling is simulated following the procedure detailed in Lin et al. (2015). Phosphorous fertilizer, which is banned in Maryland lawn fertilizer formulations as protection for the Chesapeake Bay, is not considered.
2.3.2 Septic systems
All households within BARN use septic systems to dispose of domestic wastewater. Wastewater from a house is released first to septic tanks for settling, then to drain fields which are typically placed downslope of the house. Therefore, soils in specified downslope areas receive additional water and N input from septic effluents and may become N input hot spots in the watershed. We estimated the N load from septic systems as 7.7 kg N per capita per year and water input as 110.5 m3 per capita per year (∼80 gal−1 per capita per day), resulting in a NO concentration of 70 mg N L−1 estimated from results of Gold et al. (1990), Lowe et al. (2009), and other sources for per-capita water use and septic nitrogen concentrations. We set the average number of people per household as 3.3 for these single-family houses based on survey results from Law et al. (2004) and census information. Applying these water and NO loads for 181 houses in BARN results in 4599 kg N yr−1 (12.0 kg N ha−1 yr−1) of NO input to the watershed. The demand for septic source water (SSWdemand) is 66 001 m3 yr−1 (17 mm yr−1 at the full watershed scale or 3647 mm yr−1 normalized to the estimated total areas of septic fields) of water extracted from deep groundwater. Septic water and N loads are currently set to be evenly distributed through the year.
Septic source water is drawn from drain-in patches (i.e., centroid patches of main buildings) and transported to storage in septic drain-to patches (Fig. 2) which are the locations of drain fields of septic systems and defined as the closest downslope lawn patches to drain-in patches. We regulated actual withdrawal of septic source water (SSWactual) to not exceed the available water in groundwater storage, as in Eq. (2):
where GWstorage is available water in surface detention and deep groundwater storage of the hillslope at drain-in patches (Fig. 2). This is a simplification which may miss more gradual household reduction of water use during droughts. The extracted source water is added to septic drain-to patches (orange arrow in Fig. 2), where it is subject to hydrological and biogeochemical processes. Nutrients are also added to the drain-to patches' storage, depending on the concentrations and quantity of source water from the groundwater of drain-in patches. Once NO is added to surface detention storage, N cycling is simulated following the procedure detailed in Lin et al. (2015).
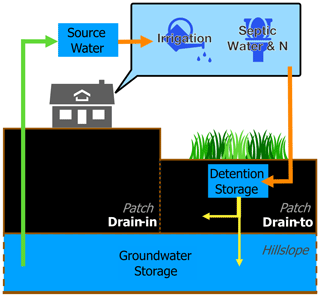
Figure 2Groundwater extraction for irrigation and septic systems in the RHESSys model. The source water (green arrow) is extracted from groundwater storage of drain-in patches (i.e., house centroids) and redistributed (orange arrow) to surface detention in downstream lawn patches for septic effluents and irrigated lawn patches of a household. After redistribution of source water, infiltration to soil and percolation to hillslope groundwater (yellow arrows) would follow the original processing of RHESSys.
2.3.3 Irrigation
Although irrigation practices and quantities vary significantly among households, irrigation is commonly applied during the growing season, especially during dry and hot conditions. Therefore, we designed a mechanism to determine the total irrigation amount based on water stress of grass. Specifically, the amount of irrigation applied on lawns is determined by a water stress factor (WSF) in Eq. (3):
where PET and ET represent patch-level potential and actual ET, which are estimated daily in RHESSys based on the Penman–Monteith equation (Monteith, 1965) and procedures in Sect. 5.6 in Tague and Band (2004). During continuously hot and dry days, WSF increases due to lower soil water content (lower ET) and high atmospheric demand for water (higher PET). Our model then activates the irrigation function and calculates the demand of irrigation for patches modulated by water shortage. This function effectively modulates soil water conditions through the addition of groundwater sourced irrigation.
Unlike the septic source water (SSWdemand), which is fixed each day, the daily demand for irrigation source water (ISWdemand) in Eq. (4) for a lawn patch is further controlled by the water stress factor as
where IRmax is the user-defined maximum daily irrigation rate, WSF is the water stress factor in Eq. (3), and lawn % is the fraction of grass in an irrigated patch. In the current model, we defined the maximum irrigation rate (IRmax) in BARN as 4 mm d−1, which was converted based on the EPA's recommendation (US EPA, 2024) of 25.4 mm per week for lawns. This rate can be modified based on the local practices or for sensitivity analysis. Like septic source water, withdrawal of irrigation source water cannot exceed available water in groundwater storage. The actual irrigation source water is calculated following the same rule in Eq. (1). The irrigation amount is pumped from deep groundwater storage to drain-in patches (i.e., centroids of houses, Fig. 2) to water lawns around houses. Irrigated lawns are limited to 50 m from houses, covering 33.7 ha (60.6 %) out of 55.7 ha of lawns in BARN. We note that many households in this area are on programmed sprinkler systems, and our “smart” irrigation estimates may underestimate actual water use in non-drought conditions but overestimate irrigation during droughts when homeowners reduce water use, contributing to input uncertainty. Dynamic water use is the subject of ongoing research in this watershed.
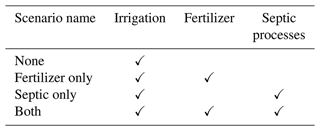
2.4 Scenarios and N hot spots
We focus on evaluating changes in NO dynamics in riparian and upland areas when additional NO is added from fertilization and/or septic systems, which resulted in four scenarios (Table 2) – none (no fertilization or septic inputs), fertilizer only, septic only, and both (fertilization and septic inputs) – for our study watershed. Irrigation is activated in all scenarios, including our reference control scenario none to emphasize NO dynamics without residential N inputs. Scenario both receives a total of 35 kg N ha−1 yr−1 of N input, with 11 (31.4 %), 12 (34.3 %), and 12 (34.3 %) kg N ha−1 yr−1 from atmospheric deposition, fertilization, and septic effluents, respectively, expressed at the watershed level. To better compare our NO concentration results with the sampled weekly water chemistry from BES for BARN, we resampled the daily simulated concentration from RHESSys to weekly averages, expressed in units of mg NO-N L−1. The weekly NO load was then estimated by the product of weekly mean NO concentration and streamflow, expressed in unit of kg N ha−1 yr−1. Note that this approach may introduce bias for load as the once-a-week samples, typically not during major storms, and the observed daily mean discharges may not reflect the average load of the whole week.
We further evaluated changes in ecohydrological processes at potential on-site input hot spots (e.g., residential lawns and septic drainage fields) receiving direct household water and N inputs as well as off-site potential hot spots located in downslope areas that receive water and N inputs added upslope (e.g., riparian areas, wetlands, septic fields). Specifically, lawns are identified as patches with more than 50 % grass, and downstream forests are patches with more than 50 % forest downslope of residential areas of BARN. One off-site location is a constructed wetland (lower red circle in Fig. 1), while the other is a spontaneously developed “accidental wetland” (Palta et al., 2017) in an area receiving road drainage and gully sedimentation, and it is referred to as a “sedimentation accumulation zone” (lower red circle in Fig. 1).
In the Results section, we present model calibration results in Sect. 3.1, in-stream NO dynamics of scenarios in Sect. 3.2, and ecohydrological changes and N retention hot spots in Sect. 3.3. Since no calibration was performed for N dynamics, NO concentration and N retention processes are reported for the entire study period (i.e., water year 2013 to 2017).
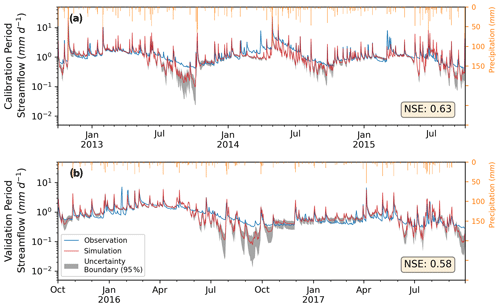
Figure 3The ensemble mean of daily streamflow from simulations (red), USGS observations (blue), and the daily 95 % uncertainty range (gray) from 50 simulations with NSE greater than 0.5. The period of (a) calibration was from October 2012 to September 2015, and (b) validation was from October 2015 to September 2017. All simulations include irrigation, lawn fertilization, and septic processes.
3.1 Model calibration and validation on streamflow
After performing calibration on soil hydraulic and groundwater parameters, we found 50 behavioral parameter sets that provided simulations meeting the requirement in Sect. 2.2.2. The range of calibrated multipliers is listed in Table 1, and the distributions are shown in Fig. A3. In the calibration period (i.e., water year 2013 to 2015, Fig. 3a), the ensemble of simulated mean (standard deviation) daily streamflow was 1.24 (±0.03) mm d−1, with NSE of 0.63 (between 0.5 and 0.69) compared to the USGS-observed 1.38 mm d−1. In the validation period (Fig. 3b), the simulated ensemble mean (standard deviation) streamflow was 0.91 (±0.03) mm d−1, with NSE of 0.58 (between 0.44 to 0.64) compared to the USGS's 0.86 mm d−1. A negligible difference was detected after activating lawn fertilization or septic processes in the watershed. The small drop in NSE in the validation period compared to the calibration period indicated that our calibrated parameters reasonably captured the hydrologic behavior of BARN. The 95 % uncertainty boundary encompassed the majority of observed moderate flows. Our model was able to simulate the seasonality of streamflow and water balance well compared to the observation records but tended to underestimate the lowest flows in the growing season (from May to September) when streamflow is lowest and dominated by baseflow. During the entire study period, the mean simulated growing season streamflow was 0.95 mm d−1, which is 0.13 mm d−1 (−12 %) lower than the 1.08 mm d−1 in the USGS records.
3.2 Improved prediction of NO export
Turning fertilization and septic processes on and off in the model produced variation in in-stream NO concentration and load simulations. We calculated weekly means of NO load and concentration of behavioral simulations. In our 5-year study period, the ensemble mean NO concentrations (Fig. 4a) for scenarios none, septic only, fertilizer only, and both were 0.34, 0.77, 0.87, and 1.43 mg NO-N L−1, respectively (Table 4). The mean long-term observed concentration at the BARN USGS gauge was 1.6 mg NO-N L−1. Thus, the simulated bias of mean NO concentration considering both fertilization and septic loads decreased significantly from −1.26 mg NO-N L−1 in the scenario none to 0.17 mg NO-N L−1 in the scenario both. The 95 % uncertainty boundary of weekly NO concentration in scenario both captured 67 % of the weekly sampled observations. The seasonality of NO concentration is also well captured, except for the growing season (e.g., July to October in 2013 and 2016) when the model underestimated low flows (Sect. 3.1). At seasonal scales (Table 3), the weekly mean NO concentrations of scenario both from spring to winter were underestimated compared to the BES observations by small amounts (0.1 (−7 %), 0.34 (−21 %), 0.16 (−7 %), and 0.12 (−10 %) mg NO-N L−1). The highest underestimation of NO concentration in summer was aligned with the period that our model underestimated the lowest flows in the growing season (Sect. 3.1).
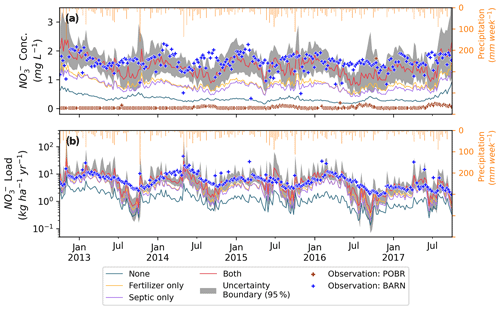
Figure 4Ensemble weekly mean of (a) NO concentration and (b) load at the outlet of Baisman Run over the entire study period (water year 2013 to 2017). The 95 % uncertainty boundary for scenario both is shown in gray.
Table 3Mean weekly NO concentration (mg N L−1) and load (kg N ha−1 yr−1) from calibrated simulations for BES weekly observations (BARN and POBR) and RHESSys simulation scenarios in each season and the entire study period from water year 2013 to 2017. Standard deviations from behavioral simulations for all scenarios are included below the mean values.
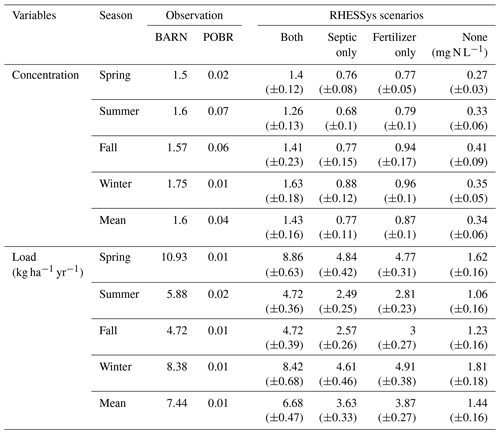
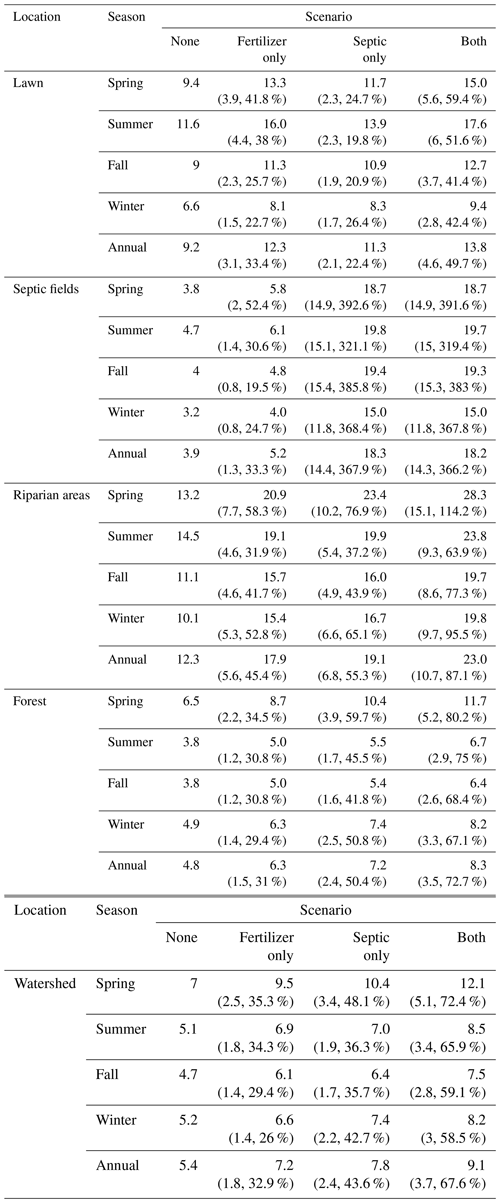
Table 4Ensemble mean denitrification rates (kg N ha−1 yr−1) in different locations under four scenarios and all seasons. Absolute and relative changes between scenario none and other scenarios are included below denitrification rates. Rates for forest exclude Pond Branch patches where no fertilizer or septic inputs are added.
The in-stream NO load (Fig. 4b) followed a similar trend as concentration, and the bias was reduced substantially from scenario none to both when fertilizer and septic loads were included. Scenario none underestimated NO load by 6 (−81 %) kg NO-N ha−1 yr−1, and the scenario both decreased the bias substantially to −0.77 (−10 %) kg NO-N ha−1 yr−1. The seasonality was also well simulated by our model. The ensemble mean loads (Table 3) in fall and winter were accurately captured with close-to-zero bias compared to the observations, and the bias in spring and summer was slightly higher. The differences were due to lower simulated than observed discharges (Fig. 3) during the growing season. Lastly, the NO retention rate (i.e., percent of N input not exported in streamflow) varied across different scenarios, ranging from a high of 87 % in scenario none (atmospheric deposition only) to a low of 81 % in scenario both. In scenarios septic only and fertilizer only, retention rates were 84 % and 83 %, respectively.
3.3 Ecohydrological and biogeochemical responses of hot spots
In our simulations, fertilizer is slowly released to soil and surface detention and transported downslope. This transport is augmented by irrigation and septic inputs. As a result, water and NO are redistributed through other patches along subsurface hydrological flow paths, providing “off-site” ecohydrological and biogeochemical responses downslope and across the whole watershed.
3.3.1 Soil moisture and ET
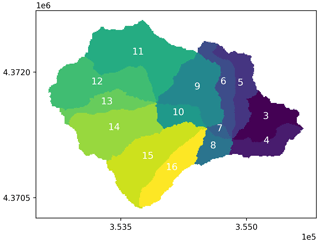
The ensemble catchment mean of water table depth (Fig. A4) from all behavioral simulations under scenario none was 4.52 m during the study period. Fertilization had overall negligible effects on watershed mean soil moisture or water table depth compared to the base (none) scenario (Fig. 5a–c), but a minor increase in water table depth was detected in the residential areas, likely due to higher ET in lawns after fertilization. Septic processes decreased mean catchment water table depth to 4.47 m by groundwater mounding, which increases shallow groundwater flow to surrounding patches along connected flow paths. Specifically in septic drainage field patches, the mean water table depth decreased to 3.69 m (−0.66 m, −15 %) in scenarios both and 3.72 m (−0.63 m, −14 %) in septic only compared to the mean depth of 4.35 m in scenarios none and fertilizer only. With hillslope groundwater as the only source for septic process, we found that groundwater withdrawal resulted in slightly drier conditions (i.e., increase in water table depth) in riparian areas of these residential hillslopes (Fig. A7, hillslopes 11 to 16), where the mean water table depth increased by 5 mm (2 %) and 8 mm (3.4 %) in scenarios septic only and both compared to 219 mm depth in scenarios none and fertilizer only. Though the standard deviation of each scenario from the 50 behavioral simulations was 1.1 m, the spatial distribution of soil moisture is consistent among all behavioral simulations.
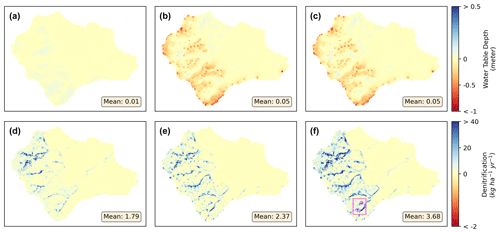
Figure 5Ensemble mean differences of water table depth (a–c) and denitrification (d–f) between scenario none and scenarios fertilizer only (a, d), septic only (b, e), and both (c, f). The inset highlights two hot spots of denitrification (i.e., wetlands in Fig. 1) circled in (f).
The watershed-scale mean ET was 43.9 mm per month in scenario none and 44.0 mm per month in scenario fertilizer only. The standard deviation from 50 behavioral parameter sets was 0.8 mm per month for each scenario. As a result of higher soil moisture levels after activating septic processes in scenario both, ET in lawn patches and septic drainage fields increased to (by) 42.3 (+0.4 mm per month, 1.0 %) and 40.8 (+6.5 mm per month, 18.9 %) mm per month compared to the levels in scenarios none, respectively. With septic processes activated, mean ET increased to 44.1 and 44.2 mm per month in scenarios septic only and both in the residential hillslopes, which could be contributed by the additional water extracted from groundwater to surface soil at the upland areas (in Fig. 5). When fertilization is activated in scenario fertilizer only, ET in riparian areas of residential hillslopes decreased to (by) 54.7 (−0.1 mm per month, −0.3 %) mm per month compared to scenario none, while the upland of these hillslopes increased by 0.1 mm per month. This shows that fertilization in the upland residential lawns could support a higher growth rate of vegetation but reduced water from draining towards downstream areas of a hillslope (in Fig. 5).
3.3.2 Denitrification
Our model suggested significant changes in denitrification after including additional NO inputs from fertilization and septic processes. Compared to scenario none (Fig. A5), the ensemble mean annual rates of denitrification at the watershed scale were 7.2, 7.8, and 9.1 kg N ha−1 yr−1 in scenarios fertilizer only, septic only, and both, respectively, increasing by 33 %, 44 %, and 68 % (Fig. 5d–f and Table 4). The standard deviation from the 50 behavioral simulations was 1.5 kg N a−1 yr−1 for scenario none and fertilizer only and 1.6 kg N ha−1 yr−1 for scenario septic only and both. When fertilization and septic processes were activated, the denitrification rates increased at the residential hillslopes and their riparian areas. The only exception was found in scenario septic only, where seven patches experiencing minor reduced denitrification (−1.4 % in average). All these patches were found in riparian areas of residential hillslopes where the water table drops by 9 mm on average after the septic processes extracting groundwater in the upstream.
Compared to scenario none, denitrification rates increased significantly in hot spots – lawn, septic drainage field, and riparian areas (Table 4) – in response to NO inputs from fertilization and septic processes. Scenario fertilizer had higher denitrification rates than scenario septic only in lawns. Denitrification rates in septic drainage patches increased by 368 % in scenarios septic only compared to the reference scenario none where these patches do not receive additional water and N inputs. Fertilization and septic processes added more than 20 kg N ha−1 yr−1 at the watershed level concentrated in upland residential areas. These additions increased mean denitrification rates in forest patches in and below residential areas (i.e., excluding patches in Pond Branch) by 72.7 % (Table 4). The annual denitrification rates in the sediment accumulation zone (upper red circle in Fig. 5) showed a significant increase after activating fertilization and septic processes, from 76.9 kg N ha−1 yr−1 before to 95.6 (+18.7, 24.3 %) kg N ha−1 yr−1 after activation. Similarly, denitrification rates in the constructed wetland (lower red circle in Fig. 1) increased from 81.5 kg N ha−1 yr−1 before to 102.7 (+21.2, 26 %) kg N ha−1 yr−1 after activation.
Changes in denitrification varied among seasons (Table 4). At the watershed scale and in all hot spots, the highest rates were generally found in spring and summer, followed by fall, and were lowest in winter. The greatest increases (%) in denitrification at all locations were in spring when fertilizer is applied to lawns and soil moisture is generally higher. Riparian areas had significant increases in denitrification in winter when the watershed receives sustained NO input from septic effluents.
Our modeled denitrification rates are consistent with measurements from field studies in Baltimore. Assuming 210 d (∼7 months) on which denitrification would occur, Raciti et al. (2011) reported a denitrification rate of 204 kg N ha−1 yr−1 at 20° for saturated soil samples from fertilized lawns at the University of Maryland, Baltimore County. At the same temperature, Suchy et al. (2023) reported a higher rate, 744 kg N ha−1 yr−1, when lawn soil samples collected from BARN lawns were saturated. We interpolated the two rates based on the method from Raciti et al. (2011), assuming 5 % storm (i.e., saturated soil) and 95 % dry (i.e., low-soil-moisture) days (with a denitrification rate of 2.95 kg N ha−1 yr−1) in a year. The projected climate-adjusted mean denitrification rates were 13 and 40 kg N ha−1 yr−1 from Raciti et al. (2011) and Suchy et al. (2023), which are very similar to estimates of annual denitrification from our simulated scenarios (Table 4). The mean 25th and 85th percentiles of annual denitrification rate for lawns from all simulations in scenario both were 2.8 to 30.8 kg N ha−1 yr−1, respectively, which are comparable with the range of empirical measurements from low to high soil moisture conditions and various fertilization rates.
4.1 Hydrologic processes
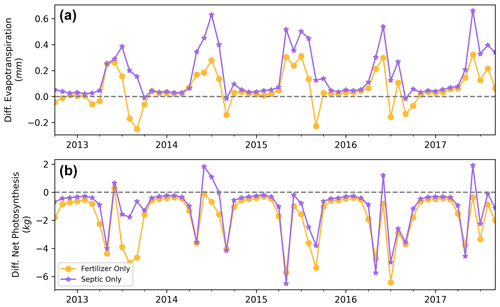
In BARN, household water use from wells transports roughly 0.05 mm d−1 of water from groundwater to septic systems at the watershed level (10 mm d−1 on septic fields). However, the conversion of groundwater to septic usage produced only negligible changes in streamflow while locally changing soil moisture and groundwater levels. Specifically, simulated streamflow was slightly decreased compared to the condition without septic water input. Inspecting growing season phenology, we found that both ET and net photosynthesis were elevated with septic input (Fig. A8). This may be due to local increases in septic water and nutrients increasing ET during the growing season, reducing groundwater recharge, in addition to reducing groundwater storage, and contributing to watershed baseflow. We also noted that our model tended to underestimate the lowest streamflows during the growing season, which was also found in another suburban watershed, Dead Run, in Baltimore by Miles (2014). Several potential factors could cause this discrepancy: (1) higher transpiration estimates caused by uncertainties in vegetation ecophysiological parameters in RHESSys controlling vegetation water use or phenology, (2) underestimation of groundwater recharge and release to streams during the growing season, and (3) a lack of household modulation of groundwater use during dry periods. During our prior surveys (Law et al., 2004; Fraser et al., 2013) residents stated they had reduced their water use during droughts. While the model underestimation was small (up to ∼0.5 mm d−1), additional empirical data about water flux, groundwater processes, and household water management would enhance model prediction accuracy of hydrological processes, especially during the growing season.
4.2 N dynamics and uncertainties
4.2.1 Nitrogen concentrations and loads
Not surprisingly, adding fertilization and septic modules in RHESSys improved the simulations of in-stream NO concentration and load dynamics. Compared to the weekly BES observations, our model underestimated mean in-stream NO concentration by less than 0.2 mg NO-N L−1 (−10 %) and with similar seasonality (Fig. 5). Considering that no N-related parameters were calibrated, the reasonable NO simulations suggest the model can provide sufficient assessment of the effects of household water and nutrient management on N transport, transformation, and export in suburban watersheds when only discharge but no NO observations are available. The highest bias of NO concentration was found in summer during our study period, when our model might retain excessive N in the upland through denitrification and uptake and leave little transported to streams. In addition, we assumed identical N inputs for all households in BARN, but the actual fertilization and septic effluents may have considerable spatial and temporal variations which could impact the N cycling and transport significantly. Specifically, we used the annual fertilization rate on lawns as 84 kg N ha−1 from Law et al. (2004) in which the reported range of annual fertilization was from 10.5 to 369.7 kg N ha−1. It is also important to note that BARN had extensive agricultural activities for up to 2 centuries, which may have resulted in accumulation of legacy N in the groundwater.
Compared to other RHESSys studies (e.g., Lin et al., 2015; Son et al., 2019; Tague et al., 2013), spinning up the model for 30 years may be insufficient to account for the export of this N from groundwater, which possibly caused the lower simulated mean NO concentration compared to BES measurements. A longer spin-up period (i.e., 500 years) was used in Lin et al. (2015) for a fully forested watershed. In our suburban watershed with larger inputs and shorter residence time of N, the spin-up period could be shorter than a fully forested watershed, as evidenced by asymptotic C:N ratio after 30 years. Furthermore, we found that the model yielded a stronger seasonality of N export, with simulated concentrations with fertilization and septic processes lower during the growing season but spiking right at the end of growing season. Uncertainty in RHESSys phenology may contribute to these differences, where errors in the prescribed end of the growing season caused quick mobilization of NO into streams. The lower estimation of streamflow during the growing season could also increase residence time and retention and reduce N export from uplands and groundwater to streams, causing the underestimation of NO concentration and load in these periods. Lastly, we noted that the observations of weekly NO from BES tended to avoid the highest flow conditions, but our model simulated NO under all weather conditions. Bias between our model simulation and the observations is unavoidably expected.
Another interesting finding is that the simulated mean NO concentration from scenario none was significantly greater than the observed concentrations at POBR (Table 3), which is a reference of forest, and pre-urbanization conditions of watersheds in the region. The higher estimated NO concentrations in BARN could be explained by the land use difference between the two watersheds. Specifically, there are more impervious areas and lawns in the upland of BARN than in POBR, which is dominated by strongly N-retentive oak–hickory forests (with the exception of a regional natural-gas line cut with herbaceous vegetation), resulting in lower N uptake and higher N concentration (Table 3, scenario none vs. POBR). This result implies that, even in the absence of additional NO input from human activities, the water quality in urban watersheds is unlikely to fully recover to pre-urbanization levels due to altered hydrology and differences in vegetation and land covers.
4.2.2 Denitrification and N retention hot spots
In addition to improving predictions of in-stream NO concentration, the simulated denitrification rates (Sect. 3.3.2 and Table 4) in lawns fell in the range of empirically estimated rates at BARN (Suchy et al., 2023) and other areas in Baltimore (Raciti et al., 2011). Among all N retention hot spots, the constructed wetland and sediment accumulation zone at the base of the gully exhibited the highest denitrification rates within the entire watershed, both before and after considering fertilization and septic processes (Fig. A5). These rates were comparable to other wetland denitrification measurements: Groffman and Hanson (1997) estimated denitrification rates from 1 to >130 kg N ha−1 yr−1 at several wetlands in Rhode Island, Poe et al. (2003) reported rates ranging between 19 and 191 kg N ha−1 yr−1 at a constructed wetland receiving agricultural runoff, and Harrison et al. (2011) found rates of 89 and 158 kg N ha−1 yr−1 at two wetlands adjacent to Minebank Run in Baltimore. In BARN, these wetlands were located in low-slope downstream areas and advertently or inadvertently treat runoff originating from roads and upstream households. Unlike lawns which may not maintain high soil moisture levels, these areas remain consistently wet throughout most of the year. These features create ideal conditions for promoting denitrification and effectively retaining N loads that would otherwise be transported to streams. Specifically, these two wetlands covering only 0.09 % of the watershed contributed 0.39 % of the total denitrification during the study period. This highlights the significance of strategically selecting locations for water quality improvement projects in future watershed restoration efforts and assessing the ecosystem services of spontaneously generated features.
4.3 Future model improvements
The analyses here highlight several challenges in modeling the ecohydrology of mixed-land-use watersheds such as BARN. Our current setup assumed a uniform daily NO input and wastewater volume of septic effluents for all households and fixed fertilization amounts for lawns adjusted by application interval (Eq. 1). These parameters could be further adjusted when more observations are available. For fertilization, our model distributed the estimated total fertilization amount uniformly to all lawns in the watershed at rates modulated by the proportion of lawns fertilized estimated by Law et al. (2004) and Fraser et al. (2013). In reality, fertilization rate and frequency vary significantly in different lawns. Variable space and time patterns of fertilization rates could result in N input hot spots that exceed retention capacity relative to variable transport rates. For irrigation, our model applies irrigation close to its maximum (4 mm d−1) when water stress is high, but residents may not irrigate their lawns at these rates during drought to conserve groundwater and may continue to irrigate lawns during wet periods with automated sprinkler systems. Survey and high-resolution satellite observations could help to improve our irrigation module and accurately estimate the timing and quantity of irrigation practices in suburban watersheds. Current settings of our model could introduce excessive depletion of groundwater during droughts and lead to underestimation of baseflow and in-stream NO concentrations or increased recharge during wet growing seasons. More detailed information about water use habits and observations of relationships between meteorological factors and groundwater storage are needed to improve the simulation of the dynamics of water withdrawal in RHESSys.
4.4 Synthesis of results
Lastly, our study addressed three overarching questions:
-
What are the individual and interacting contributions of different watershed N sources to stream water N export?
Calibrating hydrologic parameters only, our augmented RHESSys model reduced the bias of NO load (Table 3) significantly after including N loads of fertilization and septic effluents in BARN. Specifically, mean NO load increased from 1.44 kg NO-N ha−1 yr−1 in scenario none to 6.68 kg NO-N ha−1 year−1 compared to the 7.4 kg NO-N ha−1 yr−1 observed export (Table 3). The reduced bias after adding human inputs showed that our model could reasonably estimate the N export once the quantity and spatial patterns of N inputs are known. For BARN, the drop in retention rate in scenario both compared to scenario fertilizer only or septic only suggested that the watershed is saturated in its retention capacity, and there is a potential to promote N retention through new BMPs such as detention ponds and wetlands to reduce N export to streams through on- and off-site effects of hillslope hydrology and biogeochemistry.
-
How do the spatially nested patterns of water and N inputs from human activities alter spatial patterns of a set of key ecohydrological processes including N retention, evapotranspiration, soil and groundwater levels, and flows?
Simulation results indicate that septic systems using deep groundwater as the water source transport that water to shallow soils, resulting in systematic shallow water table increases within upland residential areas and small drops in water table levels in riparian areas of residential subcatchments. Results show how on-site extraction of water could alter the hydrological conditions of both “on-site” locations where septic effluent is directly disposed and “off-site” locations. These results occur because while the septic effluent is depleted by evapotranspiration, the deeper groundwater that emerges in riparian areas is also affected at hillslopes with residential development. Thus, extraction of water for domestic use lowers riparian water tables even when this water is ultimately discharged back into the environment via a septic system. Likewise, the spatial pattern of denitrification showed increases not only at sites receiving N inputs directly (i.e., lawns and septic drainage fields) but also at off-site downstream areas (i.e., wetlands and riparian areas) receiving transported NO from upland zones.
-
What are the patterns of hot spots for N retention and associated implications for the design of BMPs to promote N retention within suburban watersheds?
In the residential subcatchments of the watershed, riparian zones and constructed and accidental wetlands were found to be hot spots of denitrification (Zhang et al., 2023). These areas have the combination of subsidized supplies of water and NO, providing mixing zones with conditions promoting denitrification that are more consistent than fertilized lawn areas with variable soil moisture. Temporal patterns of denitrification were generally climate-driven, with the highest rates occurring in spring and summer in both hot spots and other areas in the watershed. Our results showed the spatial pattern of N retention and identified spontaneously existing (accidental) retention zones that accumulate both water and N loads from upstream. By effective siting of BMPs based on our results for developed watersheds, both naturally occurring and built features could become N retention hot spots and provide ecosystem services to improve water quality in the future.
Our analysis provides important insights into how different sources of N input interact with ecohydrological processes to control N export in suburban and exurban watersheds relying on local groundwater for domestic use and septic systems for wastewater release. With single-family houses dominant in these watersheds, the input of lawn fertilization and irrigation water as well as septic effluent volume and N load are concentrated in limited areas at much higher per-unit-area rates. These differences cascade through the watershed, producing hot spots of N export and retention. Calibrating hydrologic parameters against streamflow observations only, our model yielded satisfactory simulations of in-stream NO concentration and upland N retention processes. Specifically, our model estimated the mean NO concentration as 1.43 mg L−1, which is only less than 0.2 mg L−1 lower than the weekly observations from the Baltimore Ecosystem Study for our study period. The simulated denitrification rates for fertilized lawns are also comparable to measurements in the study area and nearby watersheds in Baltimore, and rates at wetlands and riparian areas are similar to reported measurements in other studies.
Our results strongly support the basis for small-watershed-scale analysis and planning to address watershed N exports and are particularly relevant in areas such as the Chesapeake Bay that are highly sensitive to N-induced eutrophication. Small-watershed improvement plans (e.g., Kamenetz, 2011) only have generic recommendations – more trees on lawns and reducing fertilizer inputs, without considering the spatial component of BMPs. The spatially explicit, high-resolution simulations from our model could help local decision makers identify existing and potential new hot spots of N retention processes (e.g., denitrification) to further advance these plans. Specifically, we found that locations accumulating both high N loads and water from upstream are ideal locations for siting future BMPs (e.g., detention ponds, constructed wetlands) to promote N retention and improve water quality for local and downstream waterbodies. In summary, the improved RHESSys simulations with augmentations for more complete, spatially nested inputs of water and N and subsequent feedbacks between transport and retention highlight the importance of the structured spatial heterogeneity of human impacts to fully understand ecohydrological processes at hillslope level in developed watersheds. Existing models often miss the patterns and feedbacks of water and N inputs at household levels and within hillslope hydrologic flow paths. The spatially distributed inputs and our augmented RHESSys model structure may provide a reliable framework to comprehensively evaluate current coupled water and C and N cycles, as well as to understand and predict the effectiveness of ecosystem restorations to improve water quality and ecosystem health in developed watersheds.
Table A1List of data sources used to set up, calibrate, and evaluate the RHESSys model for Baisman Run.

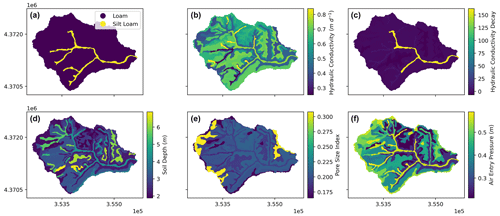
Figure A2SSURGO-derived (USDA, 2019) (a) soil texture, (b) lateral and vertical saturated hydraulic conductivities at the surface (m d−1), (c) lateral and vertical decay rates for lateral and vertical hydraulic conductivities, (d) soil depth (m), (e) pore size index, and (f) air entry pressure (m) for Baisman Run.
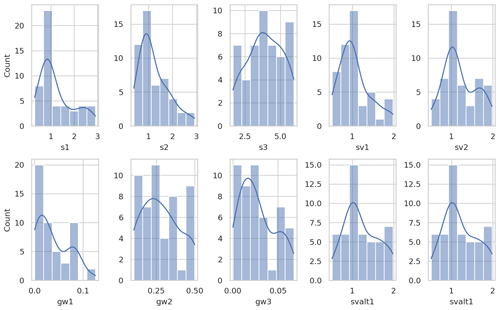
Figure A3Distributions of multipliers to RHESSys parameters (Table 1) based on 50 calibrated behavioral parameter sets.
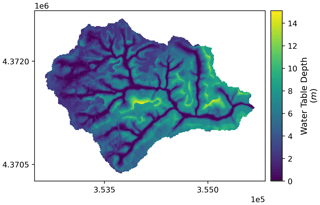
Figure A4Spatial pattern of ensemble mean water table depth (m) of Baisman Run during the entire study period (water year 2013 to 2017) from the 50 behavioral simulations under scenario none. Map in projection NAD83 UTM 18N (EPSG: 26 918).
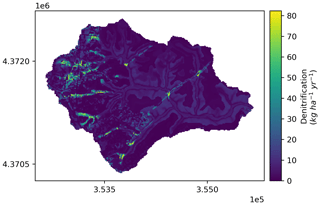
Figure A5Spatial pattern of ensemble mean denitrification (kg N ha−1 yr−1) of Baisman Run during the entire study period (water year 2013 to 2017) from the 50 behavioral simulations under scenario none. Map in projection NAD83 UTM 18N (EPSG: 26 918).
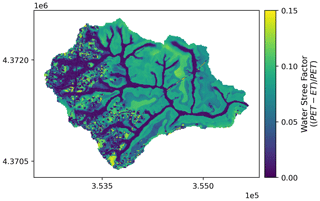
Figure A6Spatial pattern of ensemble mean water stress factor (; Eq. 3) of Baisman Run during the entire study period (water year 2013 to 2017) from the 50 behavioral simulations under scenario none. Map in projection NAD83 UTM 18N (EPSG: 26 918).
The RHESSys program used for this study is available at https://doi.org/10.5281/zenodo.13958613 (Zhang, 2024). The model definition files, outputs, and Python code used to simulate, analyze, and visualize the outputs (Jupyter Notebook) are posted to a public Zenodo repository at https://doi.org/10.5281/zenodo.10034198 (Zhang, 2023). Other files related to the paper can be requested directly from the corresponding author (Ruoyu Zhang).
Conceptualization and main investigation, writing of the first draft, and visualization of this study were conducted by RZ under the supervision of LEB and PMG. LL provided technical assistance on developing and calibrating the RHESSys model, and PMG, AKS, JMD, and AJG provided water chemistry and biogeochemical data. All authors reviewed and edited the paper.
The contact author has declared that none of the authors has any competing interests.
Publisher's note: Copernicus Publications remains neutral with regard to jurisdictional claims made in the text, published maps, institutional affiliations, or any other geographical representation in this paper. While Copernicus Publications makes every effort to include appropriate place names, the final responsibility lies with the authors.
This work was supported by the National Science Foundation Coastal Science, Engineering, and Education for Sustainability Program under grant no. 1426819, the National Science Foundation Long-Term Ecological Research (LTER) Program under grant no. 1027188 for the Baltimore Ecosystem Study, and the Department of Energy Integrated Field Laboratory under grant no. 004278 for the Baltimore Social-Environment Collaborative.
This paper was edited by Yongping Wei and reviewed by Hyunglok Kim and three anonymous referees.
Abbott, M. B., Bathurst, J. C., Cunge, J. A., Oconnell, P. E., and Rasmussen, J.: An Introduction to the European Hydrological System – Systeme Hydrologique Europeen, She, 1. History and Philosophy of a Physically-Based, Distributed Modeling System, J. Hydrol., 87, 45–59, https://doi.org/10.1016/0022-1694(86)90114-9, 1986a.
Abbott, M. B., Bathurst, J. C., Cunge, J. A., Oconnell, P. E., and Rasmussen, J.: An Introduction to the European Hydrological System – Systeme Hydrologique Europeen, She, 2. Structure of a Physically-Based, Distributed Modeling System, J. Hydrol., 87, 61–77, https://doi.org/10.1016/0022-1694(86)90115-0, 1986b.
Arnold, J. G., Srinivasan, R., Muttiah, R. S., and Williams, J. R.: Large area hydrologic modeling and assessment – Part 1: Model development, J. Am. Water Resour. Assoc., 34, 73-89, https://doi.org/10.1111/j.1752-1688.1998.tb05961.x, 1998.
Ator, S. W. and Garcia, A. M.: Application of Sparrow Modeling to Understanding Contaminant Fate and Transport from Uplands to Streams, J. Am. Water Resour. Assoc., 52, 685–704, https://doi.org/10.1111/1752-1688.12419, 2016.
Baltimore County GIS: Hydrology Lines, Baltimore County GIS [data set], https://opendata.baltimorecountymd.gov/datasets/hydrology-lines (last access: 18 October 2023), 2016.
Baltimore County GIS: Bare Earth DEM 2014, Baltimore County GIS [data set], https://opendata.baltimorecountymd.gov/datasets/6515c7e1ffc345ac9205e764dd5d292e (last access: 18 October 2023), 2017.
Baltimore County GIS: Parcels, Baltimore County GIS [data set], https://opendata.baltimorecountymd.gov/datasets/parcels (last access: 18 October 2023), 2019.
Band, L. E., Patterson, P., Nemani, R., and Running, S. W.: Forest Ecosystem Processes at the Watershed Scale – Incorporating Hillslope Hydrology, Agr. Forest Meteorol., 63, 93–126, https://doi.org/10.1016/0168-1923(93)90024-C, 1993.
Band, L. E., Cadenasso, M. L., Grimmond, C. S., Grove, J. M., and Pickett, S. T.: Heterogeneity in urban ecosystems: patterns and process, in: Ecosystem Function in Heterogenous Landscapes, Springer, New York, NY, 257–278, https://doi.org/10.1007/0-387-24091-8_13, 2005.
Bao, C., Li, L., Shi, Y. N., and Duffy, C.: Understanding watershed hydrogeochemistry: 1. Development of RT-Flux-PIHM, Water Resour. Res., 53, 2328–2345, https://doi.org/10.1002/2016wr018934, 2017.
Bernhardt, E. S., Blaszczak, J. R., Ficken, C. D., Fork, M. L., Kaiser, K. E., and Seybold, E. C.: Control Points in Ecosystems: Moving Beyond the Hot Spot Hot Moment Concept, Ecosystems, 20, 665–682, https://doi.org/10.1007/s10021-016-0103-y, 2017.
Campo, J. and Merino, A.: Variations in soil carbon sequestration and their determinants along a precipitation gradient in seasonally dry tropical forest ecosystems, Global Change Biol., 22, 1942–1956, https://doi.org/10.1111/gcb.13244, 2016.
Carrico, A. R., Fraser, J., and Bazuin, J. T.: Green With Envy: Psychological and Social Predictors of Lawn Fertilizer Application, Environ. Behav., 45, 427–454, https://doi.org/10.1177/0013916511434637, 2013.
Castiblanco, E. S., Groffman, P. M., Duncan, J., Band, L. E., Doheny, E., Fisher, G. T., Rosi, E., and Suchy, A. K.: Long-term trends in nitrate and chloride in streams in an exurban watershed, Urban Ecosyst., 26, 831–844, https://doi.org/10.1007/s11252-023-01340-0, 2023.
Chen, G., Zhu, H. L., and Zhang, Y.: Soil microbial activities and carbon and nitrogen fixation, Res. Microbiol., 154, 393–398, https://doi.org/10.1016/S0923-2508(03)00082-2, 2003.
Chesapeake Bay Program: Chesapeake Bay Land Use and Land Cover (LULC) Database 2022 Edition, US Geological Survey [data set], https://doi.org/10.5066/P981GV1L, 2023.
Cleaves, E. T., Godfrey, A. E., and Bricker, O. P.: Geochemical Balance of a Small Watershed and Its Geomorphic Implications, Geol. Soc. Am. Bull., 81, 3015–3032, https://doi.org/10.1130/0016-7606(1970)81[3015:Gboasw]2.0.Co;2, 1970.
Crowther, T. W., Todd-Brown, K. E. O., Rowe, C. W., Wieder, W. R., Carey, J. C., Machmuller, M. B., Snoek, B. L., Fang, S., Zhou, G., Allison, S. D., Blair, J. M., Bridgham, S. D., Burton, A. J., Carrillo, Y., Reich, P. B., Clark, J. S., Classen, A. T., Dijkstra, F. A., Elberling, B., Emmett, B. A., Estiarte, M., Frey, S. D., Guo, J., Harte, J., Jiang, L., Johnson, B. R., Kröel-Dulay, G., Larsen, K. S., Laudon, H., Lavallee, J. M., Luo, Y., Lupascu, M., Ma, L. N., Marhan, S., Michelsen, A., Mohan, J., Niu, S., Pendall, E., Peñuelas, J., Pfeifer-Meister, L., Poll, C., Reinsch, S., Reynolds, L. L., Schmidt, I. K., Sistla, S., Sokol, N. W., Templer, P. H., Treseder, K. K., Welker, J. M., and Bradford, M. A.: Quantifying global soil carbon losses in response to warming, Nature, 540, 104–108, https://doi.org/10.1038/nature20150, 2016.
Cui, J. T., Shao, G. C., Yu, S. E., and Cheng, X.: Influence of Controlled Drainage on the Groundwater Nitrogen and Phosphorus Concentration at Jointing-Booting Stage of Wheat, J. Chem.-Ny., 2016, 5280194, https://doi.org/10.1155/2016/5280194, 2016.
Ehlschleager, C., Metz, M., and Gericke A.: r.watershed, GRASS GIS, [code], https://grass.osgeo.org/grass83/manuals/r.watershed.html (last access: 2 September 2023), 2008.
Fan, Y., Clark, M., Lawrence, D. M., Swenson, S., Band, L. E., Brantley, S. L., Brooks, P. D., Dietrich, W. E., Flores, A., Grant, G., Kirchner, J. W., Mackay, D. S., McDonnell, J. J., Milly, P. C. D., Sullivan, P. L., Tague, C., Ajami, H., Chaney, N., Hartmann, A., Hazenberg, P., McNamara, J., Pelletier, J., Perket, J., Rouholahnejad-Freund, E., Wagener, T., Zeng, X., Beighley, E., Buzan, J., Huang, M., Livneh, B., Mohanty, B. P., Nijssen, B., Safeeq, M., Shen, C., van Verseveld, W., Volk, J., and Yamazaki, D.: Hillslope Hydrology in Global Change Research and Earth System Modeling, Water Resour. Res., 55, 1737–1772, https://doi.org/10.1029/2018wr023903, 2019.
Fraser, J. C., Bazuin, J. T., Band, L. E., and Grove, J. M.: Covenants, cohesion, and community: The effects of neighborhood governance on lawn fertilization, Landsc. Urban Plan., 115, 30–38, https://doi.org/10.1016/j.landurbplan.2013.02.013, 2013.
Galloway, J. N., Townsend, A. R., Erisman, J. W., Bekunda, M., Cai, Z. C., Freney, J. R., Martinelli, L. A., Seitzinger, S. P., and Sutton, M. A.: Transformation of the nitrogen cycle: Recent trends, questions, and potential solutions, Science, 320, 889–892, https://doi.org/10.1126/science.1136674, 2008.
Gold, A. J., Deragon, W. R., Sullivan, W. M., and Lemunyon, J. L.: Nitrate-Nitrogen Losses to Groundwater from Rural and Suburban Land Uses, J. Soil Water Conserv., 45, 305–310, 1990.
Groffman, P. M. and Hanson, G. C.: Wetland denitrification: Influence of site quality and relationships with wetland delineation protocols, Soil Sci. Soc. Am. J., 61, 323–329, https://doi.org/10.2136/sssaj1997.03615995006100010047x, 1997.
Groffman, P. M., Law, N. L., Belt, K. T., Band, L. E., and Fisher, G. T.: Nitrogen fluxes and retention in urban watershed ecosystems, Ecosystems, 7, 393–403, https://doi.org/10.1007/s10021-003-0039-x, 2004.
Groffman, P. M., Butterbach-Bahl, K., Fulweiler, R. W., Gold, A. J., Morse, J. L., Stander, E. K., Tague, C., Tonitto, C., and Vidon, P.: Challenges to incorporating spatially and temporally explicit phenomena (hotspots and hot moments) in denitrification models, Biogeochemistry, 93, 49–77, https://doi.org/10.1007/s10533-008-9277-5, 2009.
Groffman, P. M., Rosi, E. J., and Martel, L. D.: Baltimore Ecosystem Study: Stream chemistry for Gwynns Falls Upper Tributaries ver 440, EDI Data Portal [data set], https://doi.org/10.6073/pasta/5f15b7aa8d3f57d9e05a0392c6f57749, 2020.
Groffman, P. M., Matsler, A. M., and Grabowski, Z. J.: How reliable – and (net) beneficial – is the green in green infrastructure, Agric. Resour. Econ. Rev., 52, 189–200, https://doi.org/10.1017/age.2023.6, 2023.
Harrison, M. D., Groffman, P. M., Mayer, P. M., Kaushal, S. S., and Newcomer, T. A.: Denitrification in Alluvial Wetlands in an Urban Landscape, J. Environ. Qual., 40, 634–646, https://doi.org/10.2134/jeq2010.0335, 2011.
Hobbie, S. E., Finlay, J. C., Janke, B. D., Nidzgorski, D. A., Millet, D. B., and Baker, L. A.: Contrasting nitrogen and phosphorus budgets in urban watersheds and implications for managing urban water pollution, P. Natl. Acad. Sci. USA, 114, 4177–4182, https://doi.org/10.1073/pnas.1618536114, 2017.
Kamenetz, K.: Beaverdam Run, Baisman Run, and Oregon Branch Small watershed Action Plan, Department of Environmental Protection and Sustainability, Baltimore County, MD, 111 pp., https://www.baltimorecountymd.gov/files/Documents/Environment/Watersheds/swapareaivolume1.pdf (last access: 29 August 2024), 2011.
Law, N., Band, L., and Grove, M.: Nitrogen input from residential lawn care practices in suburban watersheds in Baltimore County, MD, J. Environ. Plan. Manage., 47, 737–755, https://doi.org/10.1080/0964056042000274452, 2004.
Lin, L., Webster, J. R., Hwang, T., and Band, L. E.: Effects of lateral nitrate flux and instream processes on dissolved inorganic nitrogen export in a forested catchment: A model sensitivity analysis, Water Resour. Res., 51, 2680–2695, https://doi.org/10.1002/2014wr015962, 2015.
Lin, L., Band, L. E., Vose, J. M., Hwang, T., Miniat, C. F., and Bolstad, P. V.: Ecosystem processes at the watershed scale: Influence of flowpath patterns of canopy ecophysiology on emergent catchment water and carbon cycling, Ecohydrology, 12, 5, https://doi.org/10.1002/eco.2093, 2019.
Lowe, K. S., Tucholke, M. B., Tomaras, J. M., Conn, K., Hoppe, C., Drewes, J. E., McCray, J. E., and Munakata-Marr, J.: Influent constituent characteristics of the modern waste stream from single sources, Water Environment Research Foundation Alexandria, VA, IWA Publishing, London, UK, https://doi.org/10.2166/9781780403519, 2009.
Martini, N. F., Nelson, K. C., Hobbie, S. E., and Baker, L. A.: Why “Feed the Lawn”? Exploring the Influences on Residential Turf Grass Fertilization in the Minneapolis-Saint Paul Metropolitan Area, Environ. Behav., 47, 158–183, https://doi.org/10.1177/0013916513492418, 2015.
Maxwell, R. M.: A terrain-following grid transform and preconditioner for parallel, large-scale, integrated hydrologic modeling, Adv. Water Resour., 53, 109–117, https://doi.org/10.1016/j.advwatres.2012.10.001, 2013.
McClain, M. E., Boyer, E. W., Dent, C. L., Gergel, S. E., Grimm, N. B., Groffman, P. M., Hart, S. C., Harvey, J. W., Johnston, C. A., Mayorga, E., McDowell, W. H., and Pinay, G.: Biogeochemical hot spots and hot moments at the interface of terrestrial and aquatic ecosystems, Ecosystems, 6, 301–312, https://doi.org/10.1007/s10021-003-0161-9, 2003.
Miles, B. C.: Small-scale residential stormwater management in urbanized watersheds: A geoinformatics-driven ecohydrology modeling approach, PhD dissertation, The University of North Carolina at Chapel Hill, USA, https://doi.org/10.17615/1m6y-vs10, 2014.
Monteith, J. L.: Evaporation and environment, Symp. Soc. Exp. Biol., 19, 205–234, 1965.
NADP – National Atmospheric Deposition Program: National Trend Network, National Atmospheric Deposition Program [data set], https://nadp.slh.wisc.edu/networks/national-trends-network (last access: 2 June 2023), 2022.
Nash, J. E. and Sutcliffe, J. V.: River flow forecasting through conceptual models part I – A discussion of principles, J. Hydrol., 10, 282–290, https://doi.org/10.1016/0022-1694(70)90255-6, 1970.
Nobre, A. D., Cuartas, L. A., Hodnett, M., Rennó, C. D., Rodrigues, G., Silveira, A., Waterloo, M., and Saleska, S.: Height Above the Nearest Drainage – a hydrologically relevant new terrain model, J. Hydrol., 404, 13–29, https://doi.org/10.1016/j.jhydrol.2011.03.051, 2011.
Palta, M. M., Grimm, N. B., and Groffman, P. M.: “Accidental” urban wetlands: ecosystem functions in unexpected places, Front. Ecol. Environ., 15, 248–256, https://doi.org/10.1002/fee.1494, 2017.
Parton, W. J., Mosier, A. R., Ojima, D. S., Valentine, D. W., Schimel, D. S., Weier, K., and Kulmala, A. E.: Generalized model for N2 and N2O production from nitrification and denitrification, Global Biogeochem. Cy., 10, 401–412, https://doi.org/10.1029/96gb01455, 1996.
Pastor, J. and Post, W. M.: Influence of Climate, Soil-Moisture, and Succession on Forest Carbon and Nitrogen Cycles, Biogeochemistry, 2, 3–27, https://doi.org/10.1007/Bf02186962, 1986.
Poe, A. C., Piehler, M. F., Thompson, S. P., and Paerl, H. W.: Denitrification in a constructed wetland receiving agricultural runoff, Wetlands, 23, 817–826, https://doi.org/10.1672/0277-5212(2003)023[0817:Diacwr]2.0.Co;2, 2003.
Putnam, S. M.: The influence of landscape structure on storage and streamflow generation in a piedmont catchment, PhD dissertation, Johns Hopkins University, USA, http://jhir.library.jhu.edu/handle/1774.2/60111 (last access: 21 October 2024), 2018.
Raciti, S. M., Burgin, A. J., Groffman, P. M., Lewis, D. N., and Fahey, T. J.: Denitrification in Suburban Lawn Soils, J. Environ. Qual., 40, 1932–1940, https://doi.org/10.2134/jeq2011.0107, 2011.
Rossman, L. A.: Storm Water Management Model User's Manual, Version 5.0, US Environmental Protection Agency, https://nepis.epa.gov/Exe/ZyPURL.cgi?Dockey=P100ERK4.TXT (last access: 5 June 2023), 2010.
Running, S. W. and Hunt, E. R.: Generalization of a Forest Ecosystem Process Model for Other Biomes, BIOME-BGC, and an Application for Global-Scale Models, in: Scaling Physiological Processes, edited by: Ehleringer, J. R. and Field, C. B., Academic Press, San Diego, 141–158, https://doi.org/10.1016/B978-0-12-233440-5.50014-2, 1993.
Smith, J. D., Lin, L., Quinn, J. D., and Band, L. E.: Guidance on evaluating parametric model uncertainty at decision-relevant scales, Hydrol. Earth Syst. Sci., 26, 2519–2539, https://doi.org/10.5194/hess-26-2519-2022, 2022.
Smith, R. A., Schwarz, G. E., and Alexander, R. B.: Regional interpretation of water-quality monitoring data, Water Resour. Res., 33, 2781–2798, https://doi.org/10.1029/97wr02171, 1997.
Son, K., Lin, L., Band, L., and Owens, E. M.: Modelling the interaction of climate, forest ecosystem, and hydrology to estimate catchment dissolved organic carbon export, Hydrol. Process., 33, 1448–1464, https://doi.org/10.1002/hyp.13412, 2019.
St Clair, J., Moon, S., Holbrook, W. S., Perron, J. T., Riebe, C. S., Martel, S. J., Carr, B., Harman, C., Singha, K., and Richter, D. D.: Geophysical imaging reveals topographic stress control of bedrock weathering, Science, 350, 534–538, https://doi.org/10.1126/science.aab2210, 2015.
Suchy, A. K., Groffman, P. M., Band, L. E., Duncan, J. M., Gold, A. J., Grove, J. M., Locke, D. H., Templeton, L., and Zhang, R. Y.: Spatial and Temporal Patterns of Nitrogen Mobilization in Residential Lawns, Ecosystems, 26, 1524–1542, https://doi.org/10.1007/s10021-023-00848-y, 2023.
Tague, C. L. and Band, L. E.: RHESSys: Regional Hydro-Ecologic Simulation System – An Object-Oriented Approach to Spatially Distributed Modeling of Carbon, Water, and Nutrient Cycling, Earth Interact., 8, 1–29, https://doi.org/10.1175/1087-3562(2004)8<1:RRHSSO>2.0.CO;2, 2004.
Tague, C. L., Choate, J. S., and Grant, G.: Parameterizing sub-surface drainage with geology to improve modeling streamflow responses to climate in data limited environments, Hydrol. Earth Syst. Sci., 17, 341–354, https://doi.org/10.5194/hess-17-341-2013, 2013.
USDA – United States Department of Agriculture: Web Soil Survey, USDA [data set], https://websoilsurvey.nrcs.usda.gov/app (last access: 4 June 2023), 2019.
US EPA – United States Environmental Protection Agency, Septic systems fact sheet, https://nepis.epa.gov/Exe/ZyPURL.cgi?Dockey=P1004624.TXT (last access: 1 March 2024), 2008.
US EPA – United States Environmental Protection Agency: Watering tips, https://www.epa.gov/watersense/watering-tips (last access: 21 August 2024), 2024.
Wang, G. S., Huang, W. J., Zhou, G. Y., Mayes, M. A., and Zhou, J. Z.: Modeling the processes of soil moisture in regulating microbial and carbon-nitrogen cycling, J. Hydrol., 585, 124777, https://doi.org/10.1016/j.jhydrol.2020.124777, 2020.
Welty, C. and Lagrosa, J.: Baltimore Ecosystem Study: Precipitation measurements at eight stations ver 220, Environmental Data Initiative [data set], https://doi.org/10.6073/pasta/d641020eacb963f4e9a3db40c0de4ec0, 2020.
Zhang, R.: RHESSys model and outputs for Baisman Run [Data set], Zenodo [data set], https://doi.org/10.5281/zenodo.10034198, 2023.
Zhang, R.: RHESSysEastCoast, Zenodo [code], https://doi.org/10.5281/zenodo.13958613, 2024.
Zhang, R., Newburn, D., Rosenberg, A., Lin, L., Groffman, P., Duncan, J., and Band, L.: Spatial asynchrony in environmental and economic benefits of stream restoration, Environ. Res. Lett., 17, 054004, https://doi.org/10.1088/1748-9326/ac61c6, 2022.
Zhang, R., Band, L. E., and Groffman, P. M.: Balancing upland green infrastructure and stream restoration to recover urban stormwater and nitrate load retention, J. Hydrol., 626, 130364, https://doi.org/10.1016/j.jhydrol.2023.130364, 2023.
Zhi, W., Shi, Y. N., Wen, H., Saberi, L., Ng, G. H. C., Sadayappan, K., Kerins, D., Stewart, B., and Li, L.: BioRT-Flux-PIHM v1.0: a biogeochemical reactive transport model at the watershed scale, Geosci. Model Dev., 15, 315–333, https://doi.org/10.5194/gmd-15-315-2022, 2022.


