the Creative Commons Attribution 4.0 License.
the Creative Commons Attribution 4.0 License.
 | 27 Aug 2024
Combining statistical and hydrodynamic models to assess compound flood hazards from rainfall and storm surge: a case study of Shanghai
Hanqing Xu
Sebastiaan N. Jonkman
Jun Wang
Jeremy D. Bricker
Zhan Tian
Laixiang Sun
Coastal regions have experienced significant environmental changes and increased vulnerability to floods caused by the combined effect of multiple flood drivers such as storm surge, heavy rainfall and river discharge, i.e., compound floods. Hence, for a sustainable development of coastal cities, it is necessary to understand the spatiotemporal dynamics and future trends of compound flood hazard. While the statistical dependence between flood drivers, i.e., rainfall and storm surges, has been extensively studied, the sensitivity of the inundated areas to the relative timing of a driver's individual peaks is less understood and location dependent. To fill this gap, here we propose a framework combining a statistical dependence model for compound event definition and a hydrodynamic model to assess inundation maps of compound flooding from storm surge and rainfall during typhoon season in Shanghai. First, we determine the severity of the joint design event, i.e., peak surge and precipitation, based on the copula model. Second, we use the same frequency amplification (SFA) method to transform the design event values in hourly time series so that they represent boundary conditions to force hydrodynamic models. Third, we assess the sensitivity of inundation maps to the time lag between storm surge peak and rainfall. Finally, we define flood zones based on the primary flood driver, and we delineate flood zones under the worst compound flood scenario. The study highlights that the temporal delay between storm surge and rainfall plays a pivotal role in shaping the dynamics of flooding events. More specifically, that the peak rainfall occurs 2 h before the peak storm surge would cause the deepest average cumulative inundation depth. At the same time, the results show that in Shanghai surge is the primary flood driver. High storm surge at the eastern part of the city (Wusongkou tidal gauge) propagates upstream in the Huangpu River, resulting in fluvial flooding in Shanghai city center and several surrounding districts. This calls for a better fluvial flooding control system hinging on the backwater effect during high surge in the upper and middle Huangpu River and in the newly added urbanized areas to ensure flood resilience. The proposed framework is useful to evaluate and predict flood hazard in coastal cities, and the results can provide guidance for urban disaster prevention and mitigation.
- Article
(5617 KB) - Full-text XML
- BibTeX
- EndNote


Despite significant advancements in flood management systems (e.g., forecasting and early warning systems), recent compound flood events, such as Hurricane Harvey (2017) and Super Typhoon Lekima (2019), have demonstrated the vulnerability of coastal cities (Zscheischler et al., 2018; Hendry et al., 2019; Valle-Levinson et al., 2020). Compound flood events are defined as events generated by the combined effect of multiple physical drivers, e.g., heavy rainfall and storm surge. Due to the interaction between flood drivers, the magnitude of compound events can be greater than the magnitude of events generated by a single driver, e.g., either heavy rainfall or storm surge. Hence, it is important to understand how such interaction is realized in coastal areas prone to compound floods (Fig. 1).
According to the Intergovernmental Panel on Climate Change (IPCC), adapting coastal cities to the adverse impacts of climate change is crucial for their long-term resilience and sustainability (Adler et al., 2022). Consequently, a comprehensive assessment of the processes leading to compound floods is crucial to develop targeted and innovative adaptation strategies.
Chinese southeastern coastal cities are highly susceptible to flood hazards caused by typhoons due to their unique geographical location and complex ecological environment (Xu et al., 2023). During the occurrence of a typhoon, the simultaneous presence of heavy rainfall and strong storm surge can result in severe and destructive flood events (Wahl et al., 2015; Santiago-Collazo et al., 2019; Ridder et al., 2020). In this context, the effective management of flood risk relies on the integration of statistical and hydrodynamic modeling to assess the extent and potential impact of a flooding event.
In recent years, a growing body of research has focused on the probabilistic characterization of compound flooding (Moftakhari et al., 2019; Gori et al., 2020; Xu et al., 2023). Bevacqua et al. (2019) assessed the potential probability of compound flood hazards triggered by heavy precipitation coinciding with high tidal levels across Europe. Gori et al. (2020) simulated a large number of realistic tropical cyclone (TC) events to examine flooding driven by rainfall and storm surge.
At the same time, hydrodynamic models have been widely used to simulate flood extent due to single or multiple flood drivers (Yin et al., 2016; Wang et al., 2018; Shi et al., 2020). Hydrodynamic models are effective in simulating the consequences of rainfall–runoff and storm surge during typhoon events (Kumbier et al., 2018; Bevacqua et al., 2019; Zellou and Rahali, 2019) and can improve our understanding of region-specific hydrodynamics and the genesis mechanisms of compound flooding scenarios (Xu et al., 2022). Such numerical models necessitate boundary conditions, which include hourly time series of seawater level and rainfall data, to ensure precise and effective simulations of inundation extent and depth. Paprotny et al. (2017) combine a Bayesian-network-based model and a 1D steady-state hydraulic model in place of conventional rainfall–runoff models to carry out flood mapping for Europe. Moftakhari et al. (2019) proposed a method linking bivariate statistical models and hydrodynamic models to estimate compound floods resulting from upstream discharge and downstream water levels in tidal estuaries. Gori and Lin (2022) conducted an investigation into compound flood hazards under climate change by combining physical models and joint probability analysis, highlighting its effectiveness in reducing computational expenses.
Generally, copula models can provide information on the joint severity of multiple flood drivers, like rainfall, river discharge and storm surge, which need to be further processed to become hydraulic boundary conditions (Hao and Singh, 2016; Jalili Pirani and Najafi, 2022). However, in the case of multiple flood drivers (e.g., surge and rainfall), it is essential to consider not only the statistical dependence of the drivers, but also the physical interactions between them in terms of flooding processes. This comprehensive approach is crucial for a more accurate assessment of compound floods and the development of effective flood management strategies. For example, when high sea levels from storm surge coincide with increased river water flow due to heavy rainfall, it would lead to backwater effects for drainage and result in localized flooding (Feng et al., 2022). This implies the need to investigate methods to move from the definition of the severity of the event to the physical interaction of the flood drivers at a sub-daily timescale.
Moreover, when sub-daily observations are available to force a hydrodynamic model, to obtain a better understanding of the generation process of compound floods, it is necessary to investigate the sensitivity of the flood extent to the relative timing between the drivers, i.e., between storm surge peak and rainfall. This enables a clear identification of inundation zones and their respective drivers, which is key information especially in urban planning to improve the resilience of the system. Currently, there is limited research on how to clearly define flood zones in coastal cities based on their main flood sources (Jane et al., 2020; Muñoz et al., 2021) since a systematic numerical analysis is required to delineate flood zones, which are very sensitive to the relative occurrence of the tidal fluctuation and the rainfall event.
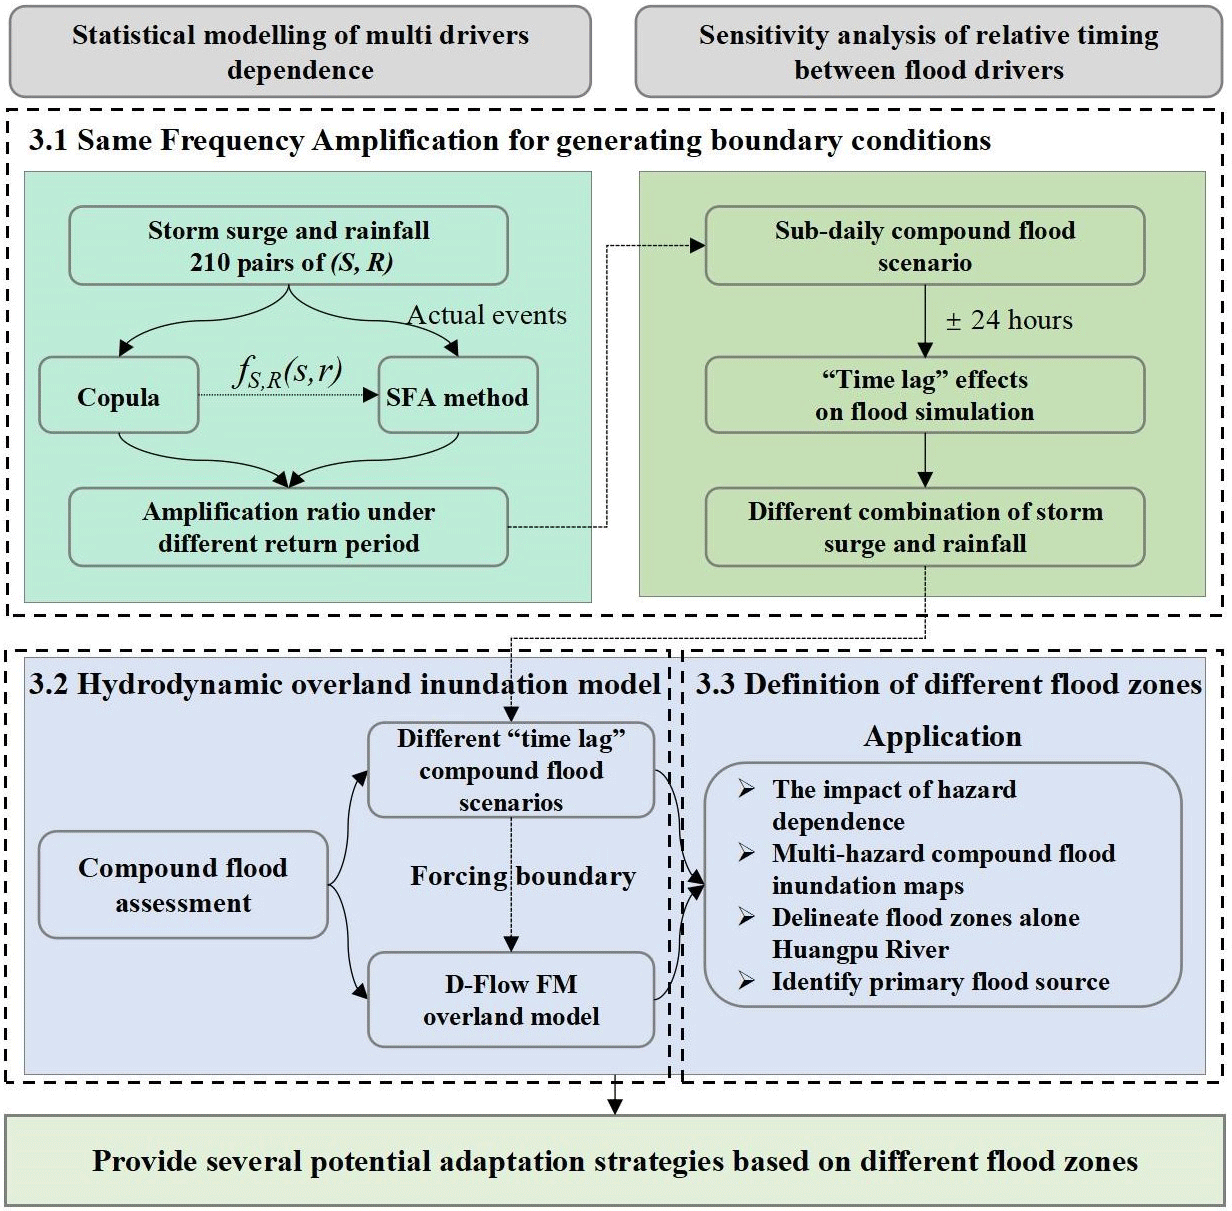
The objective of this paper is to combine dependence models for the probabilistic characterization of compound events with hydrodynamic models to improve the identification of flood zones prone to compound floods (Fig. 1). To assess flood hazards and the associated main physical drivers we propose the following framework: (1) determine events of surge and rainfall from their the joint probability of occurrence, (2) select historical events to derive sub-daily signals of surge and rainfall, (3) merge (1) and (2) via the same frequency amplification (SFA) method to generate boundary conditions, and (4) simulate flood zones for various time lags between peak surge and rainfall to enable adaptation strategies specific to the type of flood driver(s). A comprehensive urban hydrodynamic inundation model is used to assess the sensitivity of the inundation maps to the relative timing between peak surge and rainfall. This quantitative assessment methodology of compound flooding can assist engineers and urban planners in designing resilient structures in flood-prone areas.
2.1 Study area
Shanghai, a coastal megacity located in the Yangtze River Delta, spans a total area of 6340.5 km2 and had a population of 24.87 million in 2020 (Fig. 2). The city experiences an annual rainfall of approximately 1200 mm, with the rainy months falling between June and September. During this period, Shanghai is prone to frequent typhoons and rainstorms, which often result in storm flooding leading to severe damage. Despite the presence of Shanghai's extensive flood mitigation measures (e.g., 523 km seawall, comprehensive drainage systems and advanced water level monitoring systems), the city experienced significant impacts during Typhoon Winnie in 1997, which caused economic damage exceeding USD 100 million. These instances highlight Shanghai's persistent vulnerability to extreme weather events.
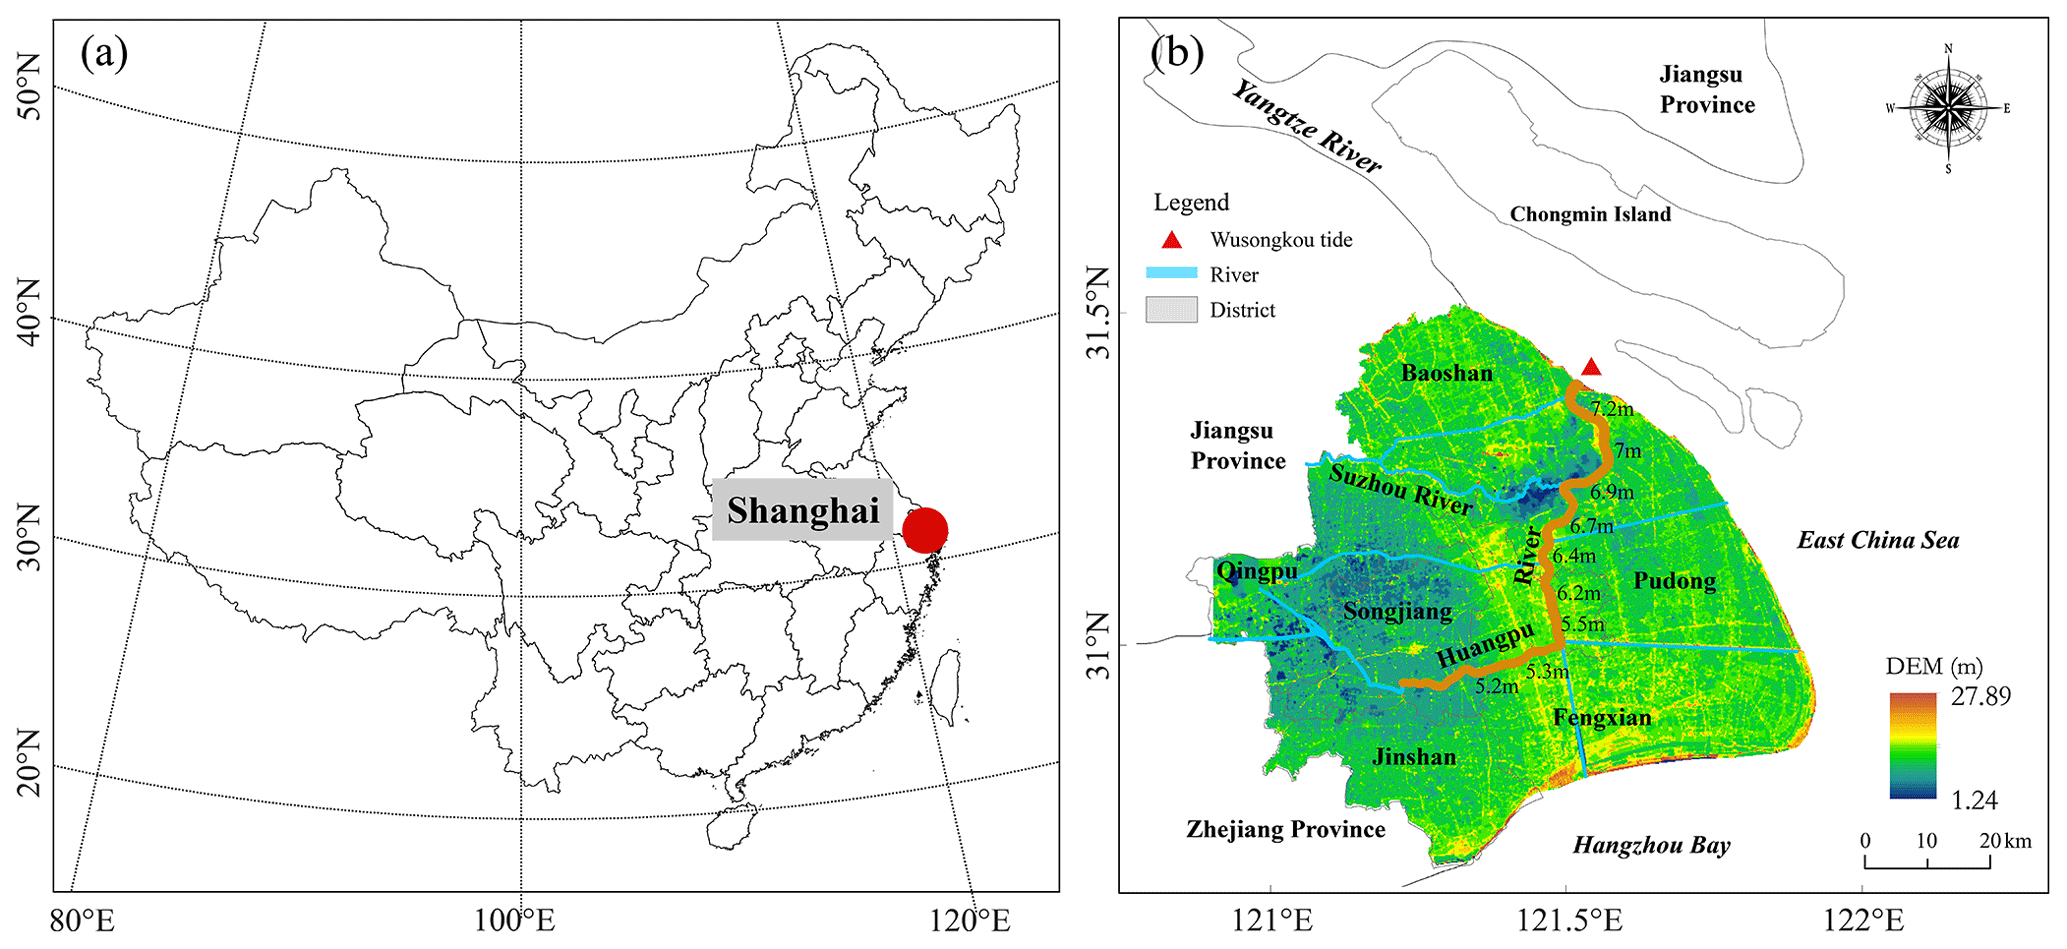
Figure 2Location map of Shanghai. The red triangle shows the Wusongkou tide gauge. The orange line along the Huangpu River represents the flood walls, and associated labels indicate their heights. The DEM data use the Wusong Datum.
2.2 Dataset
Two flood drivers are considered in this study: storm surge peaks and associated daily rainfall. Daily rainfall is collected from the China Meteorological Administration (CMA; http://data.cma.cn/, last access: 25 July 2023) Meteorological Data Center, covering the period from 1961 to 2018. More specifically, the reanalysis dataset of storm surge peaks from 1961 to 2018 located at the mouth of the Huangpu River (Fig. 2) and associated rainfall used here is the same as the one described and used in Xu et al. (2022), and the reader is referred to that paper for further details on data processing. To obtain hourly boundary conditions, a representative hourly storm surge pattern and hourly rainfall hyetograph are selected from the Shanghai Municipal Water Authority and CMA.
In addition to flood drivers, we use land use data to analyze the potential impact of compound floods. Our approach involves directly coupling the inundation maps with land use data in order to identify the potential impacts without employing a separate damage function. In this study impacts are thus quantified in terms of the affected area for different land use types in different flood zones. The land-use-type data of Shanghai in 2010 come from the Shanghai Institute of Surveying and Mapping. This represents the most detailed data available for Shanghai; however, it is important to recognize that land use patterns and urban development may have evolved since then. The land use types are further divided into four categories, which are residential land (including urban residential land and rural homestead), transportation and public service land (including commercial service land; public management land; and railway, highway, port and other transportation facilities), industrial land, and green and agricultural land (including farmland, garden land, woodland and park green space).
3.1 Same frequency amplification for generating boundary conditions
The same frequency amplification (SFA) method enables the consistent amplification of input variables across different frequency bands, ensuring that the derived signals maintain their original characteristics while enhancing their magnitudes for more accurate modeling and analysis. Drawing on the concept of an amplifier, we implement the SFA method to establish boundary conditions for hydrodynamic modeling (Xiao et al., 2009). The SFA method amplifies observed events (v0(t)) to meet the design criteria (vi(t)) via a constant amplification factor (A): then . In this specific case study, the hourly storm surge and hourly hyetograph over a window of 24 h are amplified based on predetermined design events expressed in terms of storm surge peaks and total daily rainfall. A represents a constant amplification factor that interacts with v0(t) in a linear manner. It is the ratio between the potential designed value calculated by the copula model and the observed values from the 9711 compound flooding events (Fig. 3).
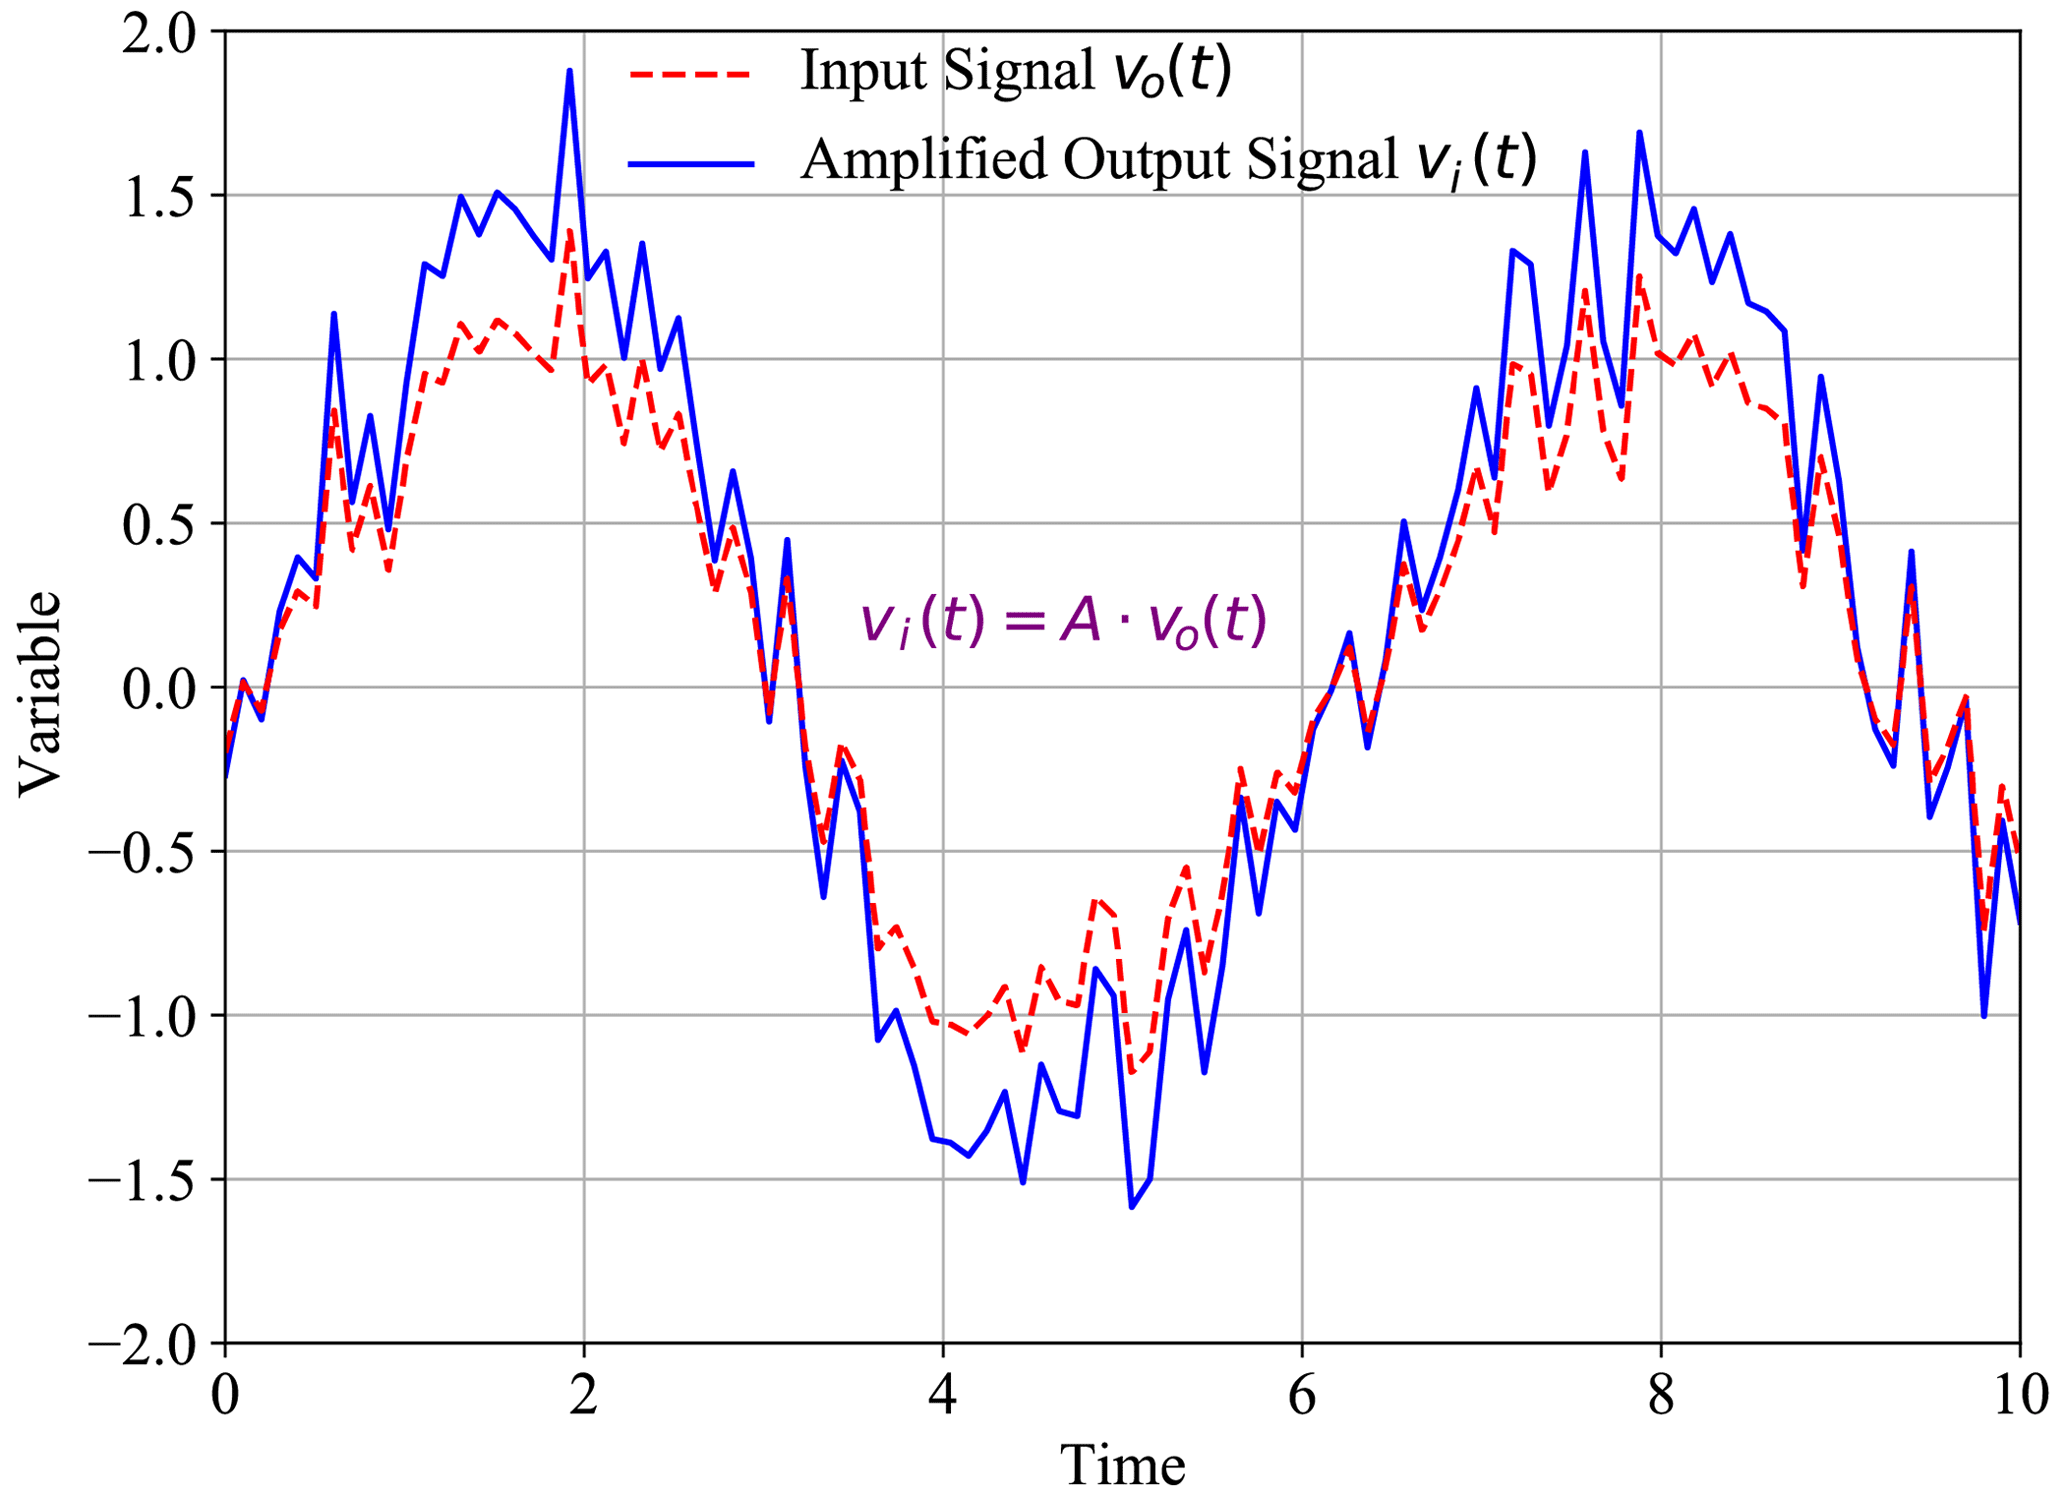
Figure 3Principal of the same frequency amplification (SFA) based on the principal of signal amplification.
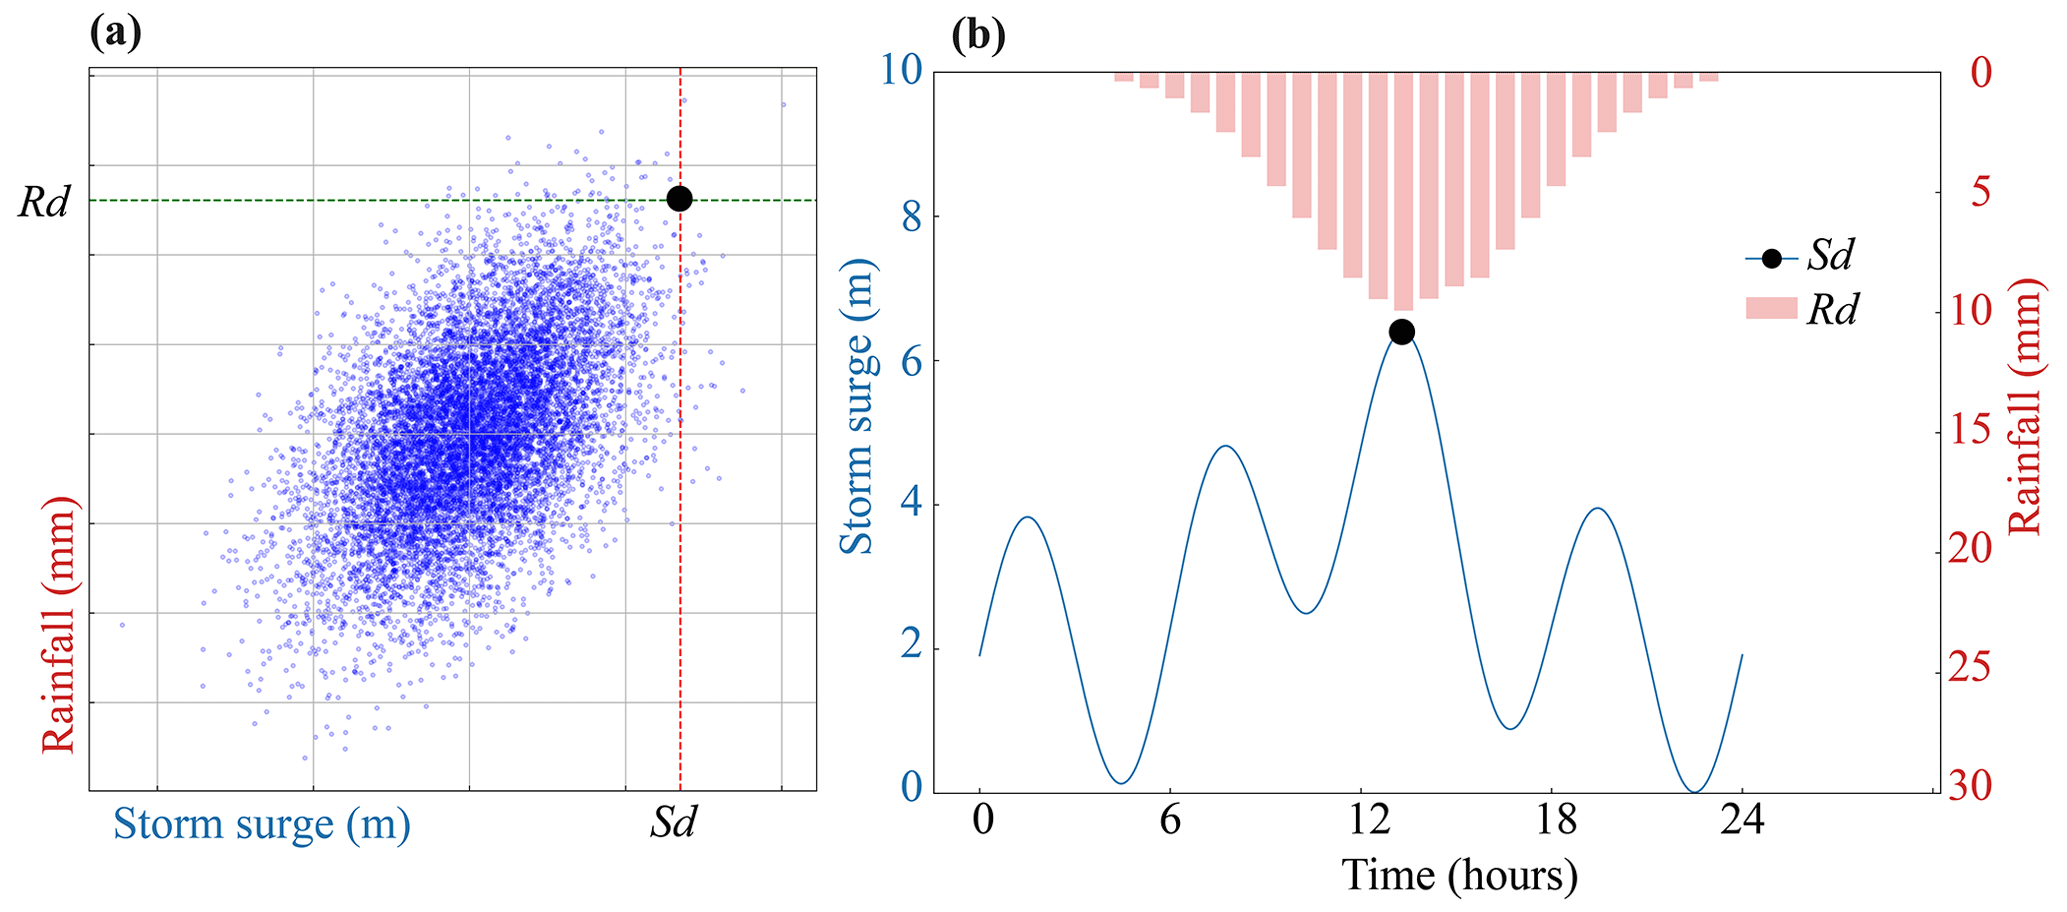
Figure 4Sketch graph to illustrate the combination of the copula and SFA methods. Panel (a) represents the dependence model of surge peaks and accumulated rainfall to derive their respective design values Sd and Rd. Panel (b) illustrates the amplified signals where the highest peak corresponds to the design value Sd and the volume of rainfall corresponds to the design value Rd.
We employed the Gaussian copula, which is well-suited (maximum likelihood estimation) for capturing the dependency via 210 compound flooding events caused by storm surge and rainfall in the Shanghai area. These design values are derived from the probabilistic dependence model presented in Xu et al. (2022). Readers are referred to Xu et al. (2022) for details on the selection of the severity and magnitude of the event of interest.
Since design values are single values, to obtain hourly storm surge and rainfall time series, the following steps are considered. First, a local typical storm surge pattern and rainfall hyetograph over a window of 24 h are selected from historical observations in the Shanghai region. This pattern is characterized based on past storm events, notably during the “9711” typhoon event in August 1997. During this event, the sea level rose significantly, causing high tide levels in the Huangpu River to break historical records. At the Mishidu and Damaogang stations, both located upriver from Shanghai, water levels were 24 and 26 cm higher than their previous historical records, respectively. The peak tide occurred just after the heaviest rainfall. According to the peak surge and cumulative rainfall volume obtained from the joint probability model, we then calculate the amplification ratio by dividing the peak of the typical surge pattern and cumulative value of rainfall by the corresponding design event (Fig. 4). The amplification factor is estimated by dividing the design value of the peak surge or cumulative rainfall signal by the typical storm event. By applying this amplification factor, we ensure the amplification ratio essentially adjusts the typical storm event to match the desired design criteria based on the design value from the copula function.
3.2 Hydrodynamic overland inundation model
D-Flow FM, developed by Deltares in the Netherlands, has been widely applied for water flow simulations, including storm surge and overland inundation, because of its capability of simulating 2D and 3D shallow water flow. It integrates structured and unstructured grids, which is convenient for partial grid refinement and predicting the behavior of water flow for flood modeling in coastal regions (Ke et al., 2021). Ke et al. (2021) developed a 2D urban model for Shanghai with D-Flow FM capable of reproducing coastal, fluvial, pluvial and interacting flood dynamics. Hence, we use the D-Flow FM hydrodynamic model, equipped with flexible meshing, efficient numerical schemes and comprehensive physical equations, to simulate overland flood inundation maps. The model used in this study incorporates rainfall and storm surge boundary conditions and takes into accounts flood walls along the Huangpu River in Shanghai, as developed and validated by Ke et al. (2021). We use the digital elevation model data acquired from the Institute of Geographic Sciences and Natural Resources Research, Chinese Academy of Sciences, as well as river, flood wall and discharge data obtained from the Shanghai Municipal Water Authority, to develop the urban inundation model. The overland flooding model combines regular rectangular and irregular triangular meshes. This model is a surface runoff numerical model, and the mesh grid resolution is set at 150 m. The storm surge at Wusongkou gauge is used as the downstream boundary condition for the overland inundation model. The hourly rainfall hyetograph data from the CMA are used as input for the overland inundation model to determine the spatial and temporal distribution of rainfall across Shanghai.
3.3 Definition of different flood zones
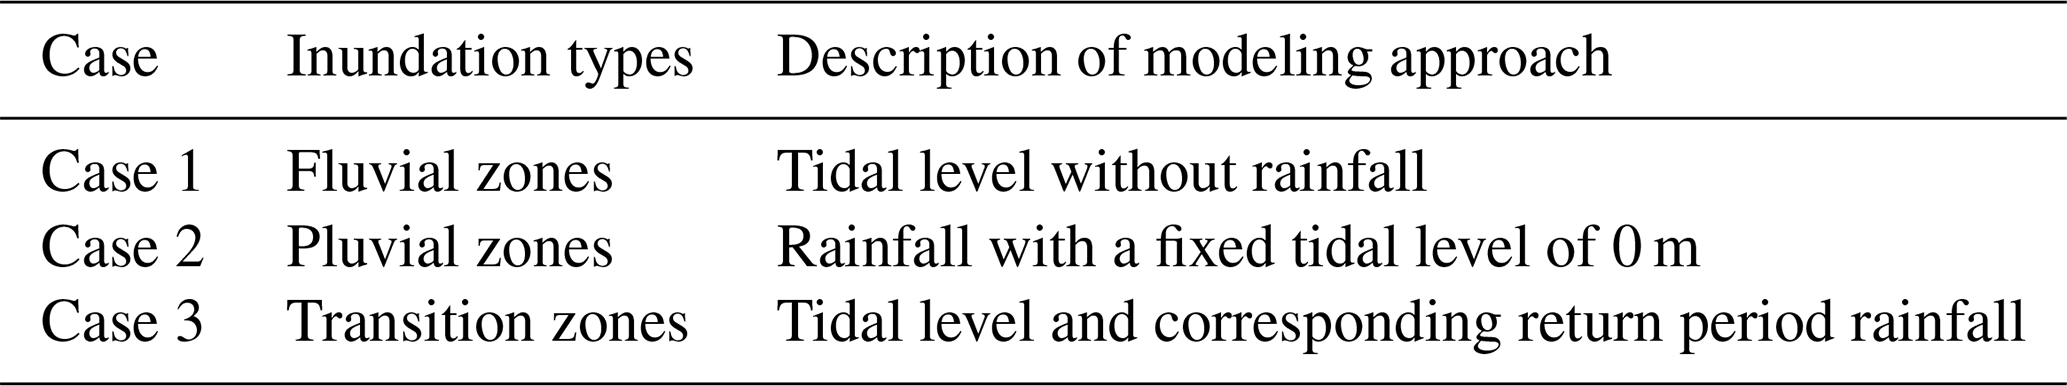
To discern the principal flood contributor, namely storm surge and/or precipitation, for a particular region, Bilskie and Hagen (2018) propose a floodplain division into three zones based on the dominant contributor: fluvial (surge), transition (surge and precipitation) and pluvial (precipitation) zones. Here, we are interested in defining such zones in the city of Shanghai since they represent key information to develop targeted adaptation strategies. Hence, we run the hydrodynamic model for three different cases (Table 1). In Case 1, only the tidal level time series is taken as input, with no rainfall, to identify fluvial zones. In Case 2, rainfall and a fixed tidal level of 0 m are taken as the boundary conditions to identify pluvial zones. In Case 3, both storm surge and rainfall runoff processes are considered to identify transition zones. We expect that areas along the river flood plain are more prone to flooding due to high surge and backwater effect. On the other hand, we expect that inland areas are prone to pluvial flooding since rainfall becomes the predominant contributor to flooding.
4.1 Hourly boundary conditions merging copulas and SFA
In this study, we use the hourly storm surge curve at the Wusongkou tidal gauge and the rainfall hyetograph in Shanghai recorded during Typhoon Winnie (9711) between 18 and 19 August as the basic curves to construct boundary conditions. This specific event stands out as it represents a noteworthy combination of extreme storm surge and heavy rainfall. Typhoon Winnie brought historical records of a storm tide of 5.99 m at Wusongkou tide gauge and 134.3 mm rainfall in a period of 24 h. Since this event is representative of a combination of extreme storm surge and heavy rainfall, it is suitable for studying the impacts of compound floods.
The amplification factor for storm surge and rainfall is estimated so that the amplified storm and rainfall match the design values derived from the probabilistic dependence model presented in Xu et al. (2022) and shown in Fig. 5. Since Shanghai is generally more vulnerable to fluvial flooding, we select the joint design values such that the surge design value corresponds to the event with a return period of 1000 years (the design standard of the flood wall along the middle and lower reaches of Huangpu River) when yearly maximum water levels from 1912 to 2013 are analyzed independently (Ke et al., 2018). The associated rainfall design value is obtained from the dependence model (Fig. 5a). By fixing the design value of the surge peak, the pair of surge and rainfall with the highest density corresponds to a joint event with a return period of 200 years considering the “AND” scenario; i.e., the probability that both surge and rainfall are higher than their respective thresholds is 0.005 (Fig. 5a). The SFA is then applied to the surge and rainfall during Typhoon Winnie and amplified based on the designed value identified (Fig. 5b).
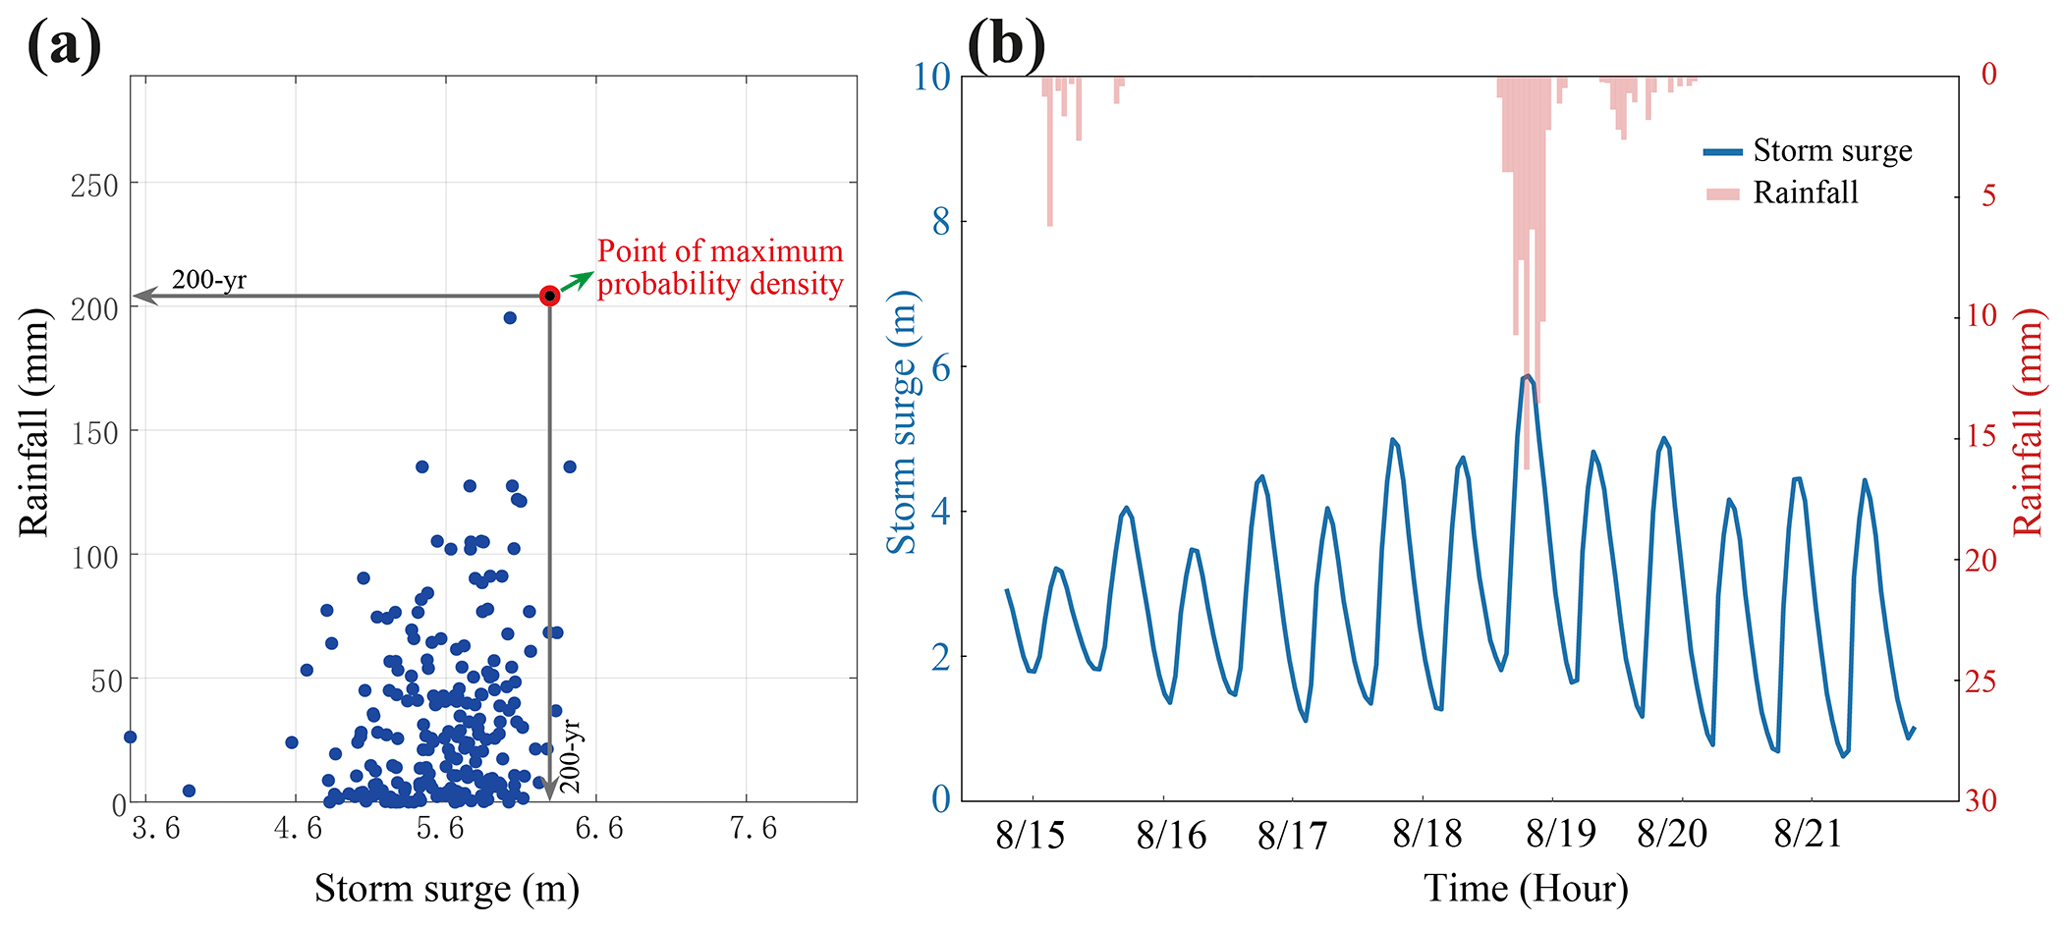
Figure 5(a) Bivariate statistical analysis of joint distribution with “AND” scenario between peak storm surge and corresponding cumulative rainfall by the Multivariate Copula Analysis Toolbox (MvCAT); (b) the boundary conditions for the hydrodynamic model based on a scenario of no time lag between the peak storm tide and the corresponding cumulative rainfall observed during Typhoon Winnie.
4.2 Sensitivity of inundation maps to time lag between hourly peak storm surge and rainfall
To understand the combined effect of storm surge and rainfall, it is important to investigate the relative timing between the peaks of these two drivers. Hence, we investigate how the relative timing of the peak surge and rainfall affects flood inundation depth by running the D-Flow FM hydrodynamic model multiple times, each time with a pre-defined distance between the peaks spanning a temporal window of ±24 h. For each run, the averaged inundation depth over all flooded locations (here labeled as the cumulative inundation depth) is recorded.
We observe that maximum cumulative inundation depth occurs when the rainfall event occurs 2 h prior to the surge peak. In this scenario, floods mainly occur in the upper Huangpu River, and the maximum cumulative inundation depth exceeds 1.0 m in the southwestern Qingpu district and the southern Songjiang district, while some areas in the downtown area are covered by flood water with depths over 2 m (Fig. 6a and b). The water level in rivers is high, potentially exceeding the capacity of drainage systems and pumping infrastructure to mitigate the inundation. This results in more extensive flooding in low-lying areas. In contrast, when rainfall takes place after the surge peak (e.g., +12 h later), the water levels in the river have time to recede. This allows for improved drainage and pumping capacity in the city, reducing the cumulative inundation depth to 0.21 m (Fig. 6c and d).
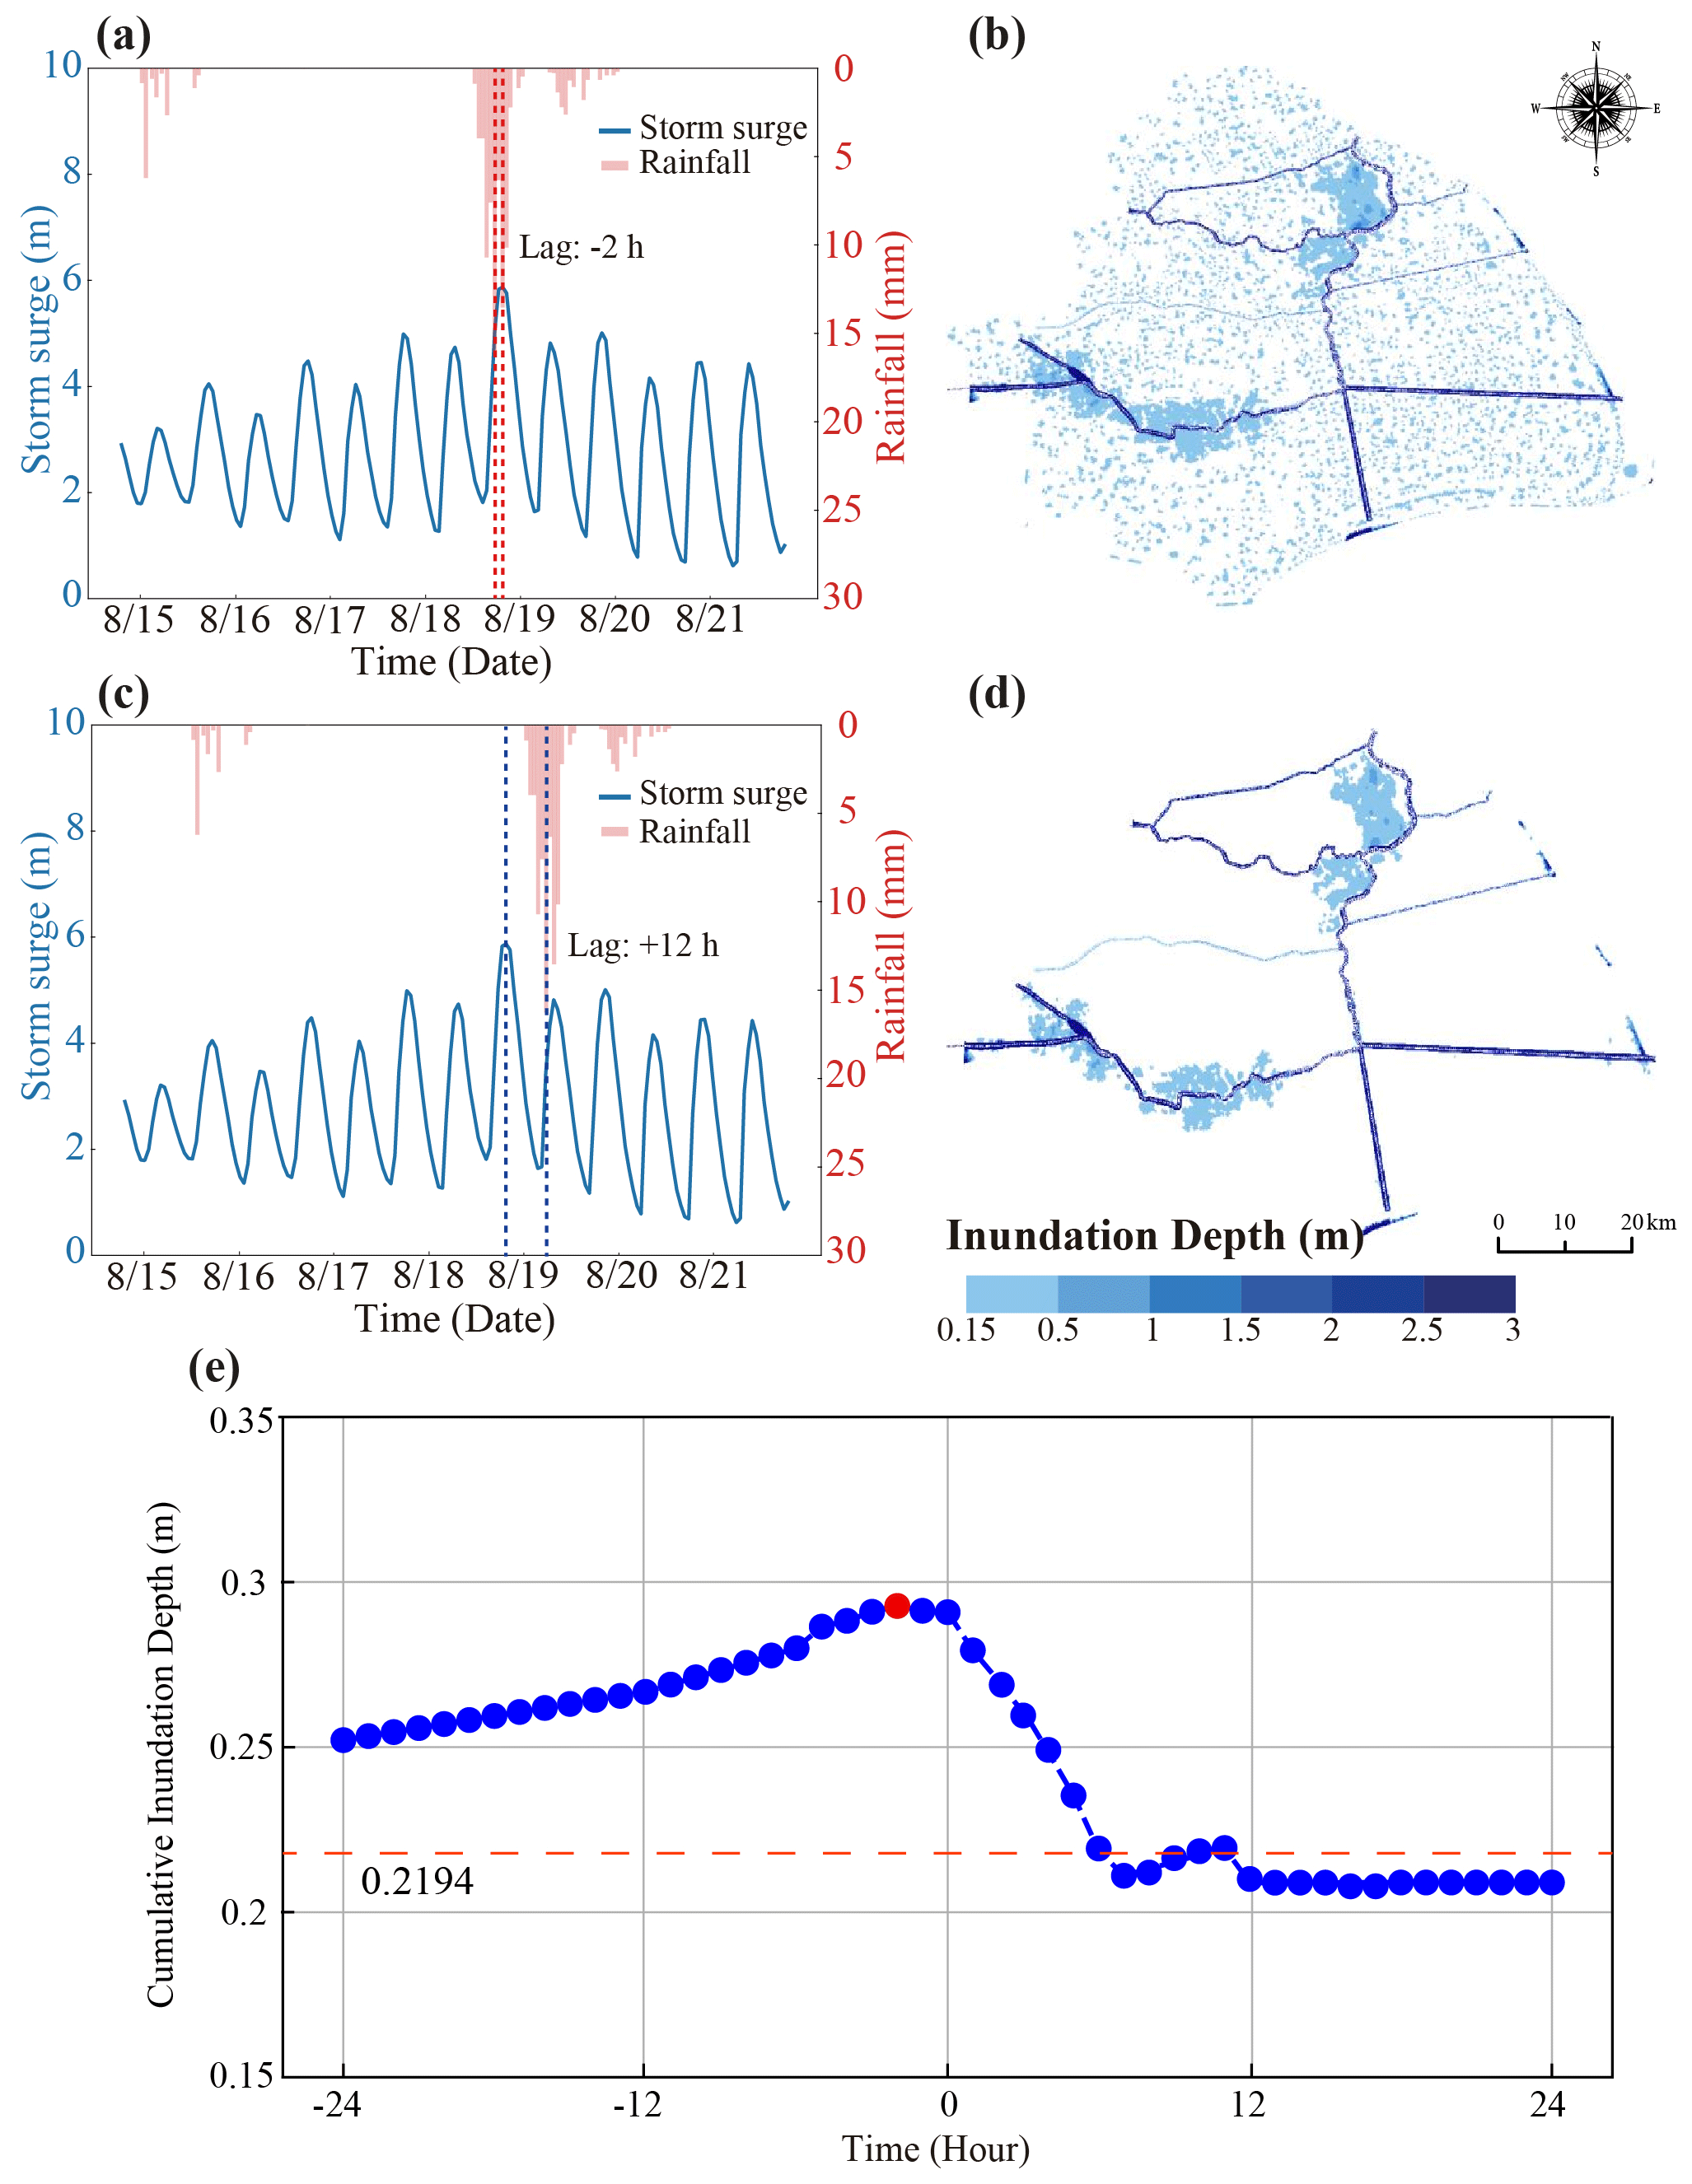
Figure 6Cumulative inundation depth under combined impact of storm surge and rainfall with −2 and +12 h lags. (a) The boundary conditions of −2 h time lag between the peak storm surge and the corresponding cumulative rainfall; (b) flooding inundation under the −2 h time lag scenario. (c) The boundary conditions of the scenario with +12 h time lag between the peak storm surge and the corresponding cumulative rainfall; (d) flooding inundation under the +12 h time lag scenario. (e) Cumulative inundation depth with different time lags. (The horizontal dashed line is the maximum cumulative inundation depth for uniform rainfall. The red dot means the maximum cumulative inundation depth by a −2 h lag of the compound event.)
Generally, we observed a cumulative inundation depth greater than 0.25 m when the rainfall event precedes the peak of the surge, i.e., between −24 to 0 h. Rainfall events occurring after the storm surge peak (>0 h) do not increase the cumulative inundation depth (Fig. 6e). The cumulative inundation depth stabilizes at around 0.21 m when rainfall peaks about 12 h after the surge peak. Therefore, the observed difference in flooding between these scenarios can be attributed to the combination of high water level in rivers following the surge peak and the capacity of the drainage and pumping systems. This highlights the critical importance of considering the relative timing of events when determining the flood extent and severity in fluvial urban region.
4.3 Flood zones
The distribution of flood zones would vary significantly given different storm events due to the different timing between rainfall and storm surge; here, we investigate the average response of the basin for the worst cumulative inundation depth event (rainfall peaks 2 h prior to the surge peak). Flood zones are delineated in the entire study area based on the criteria established (Table 1).
In general, storm surges are the primary cause of inundation along and within the Huangpu River, as indicated by the areas marked in red in Fig. 7. The inland areas situated far from the river experience inundation primarily due to rainfall, shown in blue. Distinct transitional zones, marked in yellow in Fig. 7, can be seen surrounding the Huangpu River. We observe three main critical areas (Region A, B and C) due to the obvious cumulative inundation depth. Region A (inundated by 39.68 km2), with its immediate fluvial adjacency, is dominated by fluvial flooding. Similarly, Region C (inundated by 23.88 km2) is also dominated by fluvial flooding even though it is located about 100 km from the coast. This could be due to the river configuration and the backwater effect that prevents the normal discharge of the river into the sea when high surge occurs. In contrast, Region B (inundated by 34.27 km2) is the most prone to the combined effect of rainfall and storm surge with the largest transition zone recorded, 2.3 times greater than the transition zone in Region A and 4.4 times greater than the transition zone in Region C. The combination of low elevation and low flood wall makes the Region B susceptible to fluvial flooding, which can result in overtopping and further exacerbate flooding.
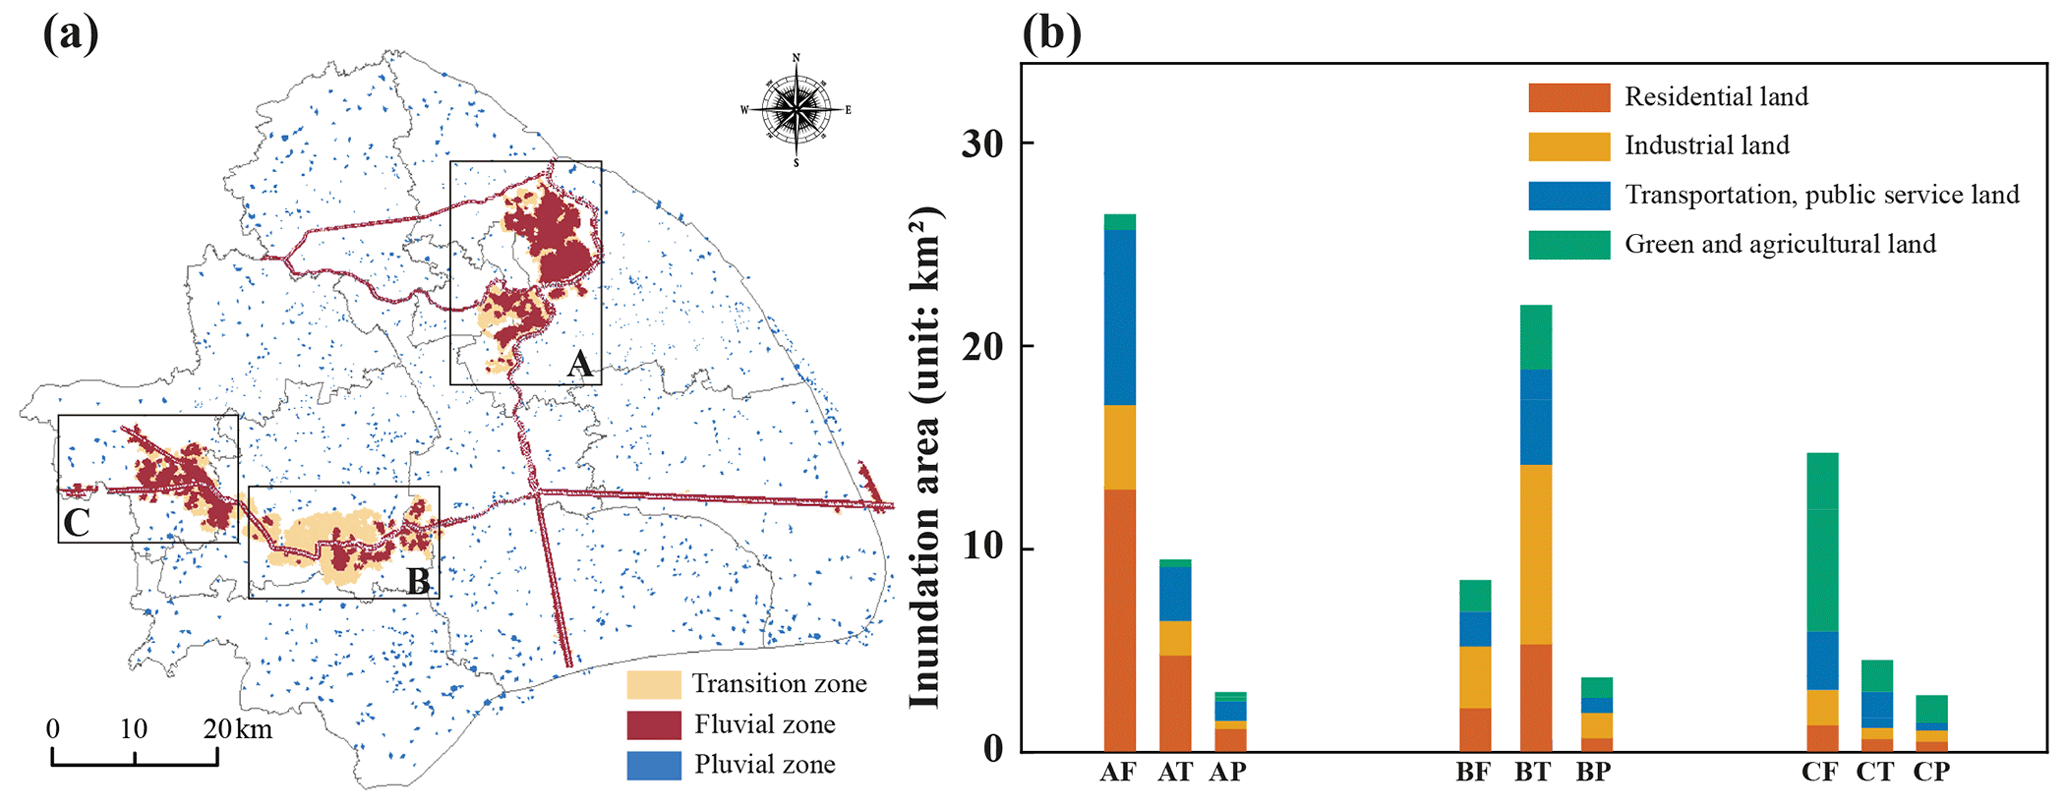
Figure 7(a) Flood zones under 200-year return period flooding events; (b) the inundation area of different land use combinations under 200-year return period flooding events (F: fluvial zone; T: transition zone; P: pluvial zone). The letters in front of the zones (A–C) refer to the region investigated.
To gain additional insight into the population exposed in the regions identified as the most affected by a flood event, we investigate urban land use maps. Figure 7b clearly shows that Region A is mostly residential land, Region B is mostly industrial land, and Region C is mostly green and agricultural land. This implies that a different approach is needed when developing strategies for flood control, especially in Region B where the industrial sector is prone to compound flooding (a larger transition zone). These results give insights into how to effectively realize the developmental goals for the year 2035 in Shanghai's new city expansion endeavors. These results suggest that the focal point should be on reducing the risk in the system for fluvial flooding. This would also protect the upper and middle reaches of the Huangpu River, as well as the newly established urbanized region, with particular attention to low-lying areas in the upper reach of the Huangpu River.
The primary objective of this study was to develop a methodology to quantify flood inundation depth accounting for the relative timing of storm surge and rainfall and their respective magnitudes when the dependence between the two events cannot be neglected, such as during typhoon season. In our simulations, the time lag between rainfall and storm surge peak equals −2 h; i.e., the peak rainfall occurring 2 h before the surge peak causes the largest total inundation depth. However, this result depends on our initial choice of the hourly storm surge elevation and rainfall hyetograph amplified based on design requirements. The availability of higher-quality data at finer temporal resolution could provide a different and more accurate insight into the sensitivity of the area to the combined effect between rainfall and storm surge. At the same time, we showed that this framework is a valuable option to generate boundary conditions when there is a lack of observation data.
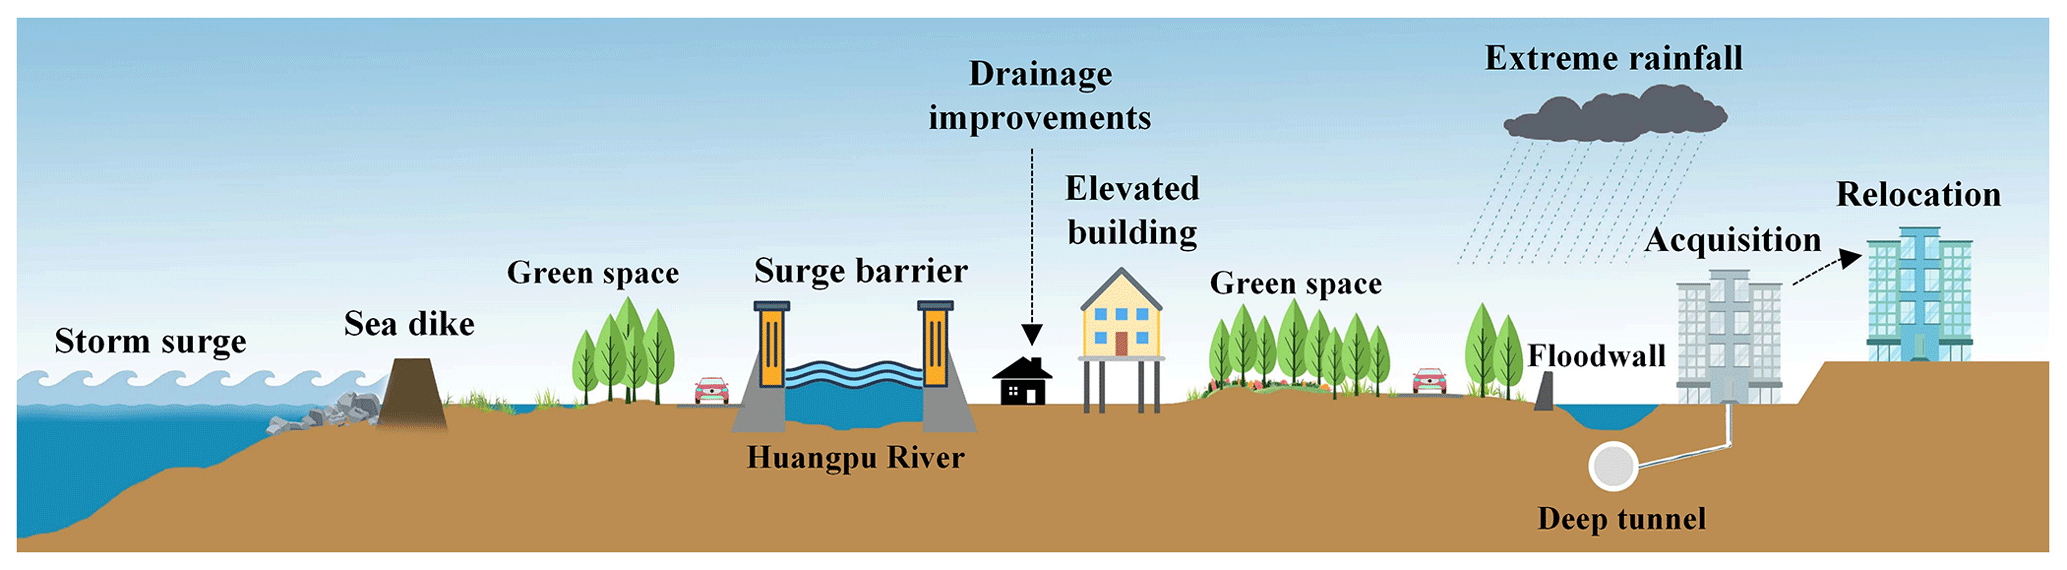
From a design perspective, this study emphasizes the need for a comprehensive and case-specific understanding of the interaction between storm surge and rainfall and their relative timing to identify the most suitable adaptation strategy. For example, our results showed that storm surge protection systems can prevent flooding in upstream reaches of the Huangpu River. Indeed, the river's susceptibility to backwater effects can result in river flooding even during moderate rainfall events (Tian et al., 2023). Alternatively, flood protection measures along riverbanks and within the city can also be considered, but they should be developed considering storm surge and backwater effects as major drivers for high water in the river (Ke et al., 2018). Along with interventions to reduce the inundation due to storm surges, implementing rainwater storage and hydrograph peak reduction facilities, such as detention basins, can enhance the capabilities of the urban flood protection system and improve the city's safety, particularly in cases when high rainfall precedes high surge (Fig. 8).
However, it is crucial not to overlook hydrological factors, including topography, land use, soil type and vegetation cover, as neglecting these elements would lead to an inaccurate representation of flooding hazards. For example, comprehensive land use maps offer an effective tool for delineating flood prevention and mitigation strategies because they rule out solutions not suitable for a specific category. In this study, we combined the land use types with inundation maps, thereby establishing a more holistic understanding of the areas within flooding hazards. Within the context of this investigation, we put forth a range of prospective adaptation strategies that can be employed by various vulnerable areas to reduce the impact of compound flooding. We underscore the paramount importance of adopting a comprehensive flood risk management approach that encompasses the entire system while also emphasizing the necessity for integrated and coordinated measures to effectively tackle the intricate and dynamic nature of compound flooding events (Sun et al., 2021). Among these strategies is the proposal for constructing floodgates at the mouth of the Huangpu River, a measure designed to substantially diminish the impact of storm floods on the inner river basin and to prevent or reduce the necessity to raise flood walls. Insights from the completed and ongoing designs for international storm surge barriers could serve as valuable references for this investigation (Mooyaart and Jonkman, 2017).
Concurrently, it is imperative to reinforce the vulnerable sections of the flood wall on the upstream reach of the Huangpu River and the newly urbanized regions to ensure the preservation of their designated flood control capacity until the floodgates at the river mouth are completed (Tian et al., 2023). Additionally, in accordance with the latest analysis of Huangpu River tide levels, it is advisable to augment flood walls to maintain their intended flood control capacity (Ke et al., 2018). By prioritizing these targeted efforts, Shanghai can make significant strides towards achieving its developmental aspirations while effectively managing the risk from compound flooding events.
In this study, we highlight the importance of understanding how the interactions between multiple flood mechanisms change compound flooding hazard maps in contrast to current Chinese flood policy which focuses on floods due to only a single driver. Although this study is specific to the city of Shanghai, the methodology of quantitatively assessing compound flood hazard via a coupled statistical–hydrodynamic model framework is available for other coastal cities.
-
The study allowed us to analyze the dynamics of storm surge and rainfall interactions and their effect on the inundation area under various return periods.
-
The investigation into the impact of temporal windows spanning ±24 h revealed that the maximum cumulative inundation depth occurs at a temporal lag of −2 h, highlighting the importance of assessing compound flood hazard “time lag” between different flood driving factors.
-
Storm surge is the primary driver of fluvial flood inundation in Shanghai, with inundated regions primarily situated on both sides of the Huangpu River and concentrated in the city center and other specific districts.
-
Based on the worst-case inundation map caused by storm surge and rainfall, the flood zones are delineated into fluvial, pluvial and transition zones, enabling us to propose different potential adaptation strategies to cope with inundation in Shanghai.
-
This knowledge can assist engineers and urban planners in planning and designing structural and non-structural measures in flood-prone areas to withstand potential combinations of hazards.
The data used in this study such as the daily rainfall records are collected from the China Meteorological Administration (http://data.cma.cn/, CMA, 2023). The model used in this study is provided on 4TU (https://doi.org/10.4121/4ff14dc0-a290-4ffd-985f-3d68b9c25644.v1, Xu, 2024).
HQ, ER, ZT and JW conceived the study. HQ, ER and LS drafted the manuscript. HQ and ER contributed to the copula method and boundary conditions. JB and ZT were responsible for hydrodynamic modeling. HQ and ER contributed to the sensitivity analysis of inundation. All authors commented on the manuscript.
The contact author has declared that none of the authors has any competing interests.
Publisher's note: Copernicus Publications remains neutral with regard to jurisdictional claims made in the text, published maps, institutional affiliations, or any other geographical representation in this paper. While Copernicus Publications makes every effort to include appropriate place names, the final responsibility lies with the authors.
This article is part of the special issue “Attributing and quantifying the risk of hydrometeorological extreme events in urban environments”. It is not associated with a conference.
Hanqing Xu is thankful for financial support from the China Scholarships Council program (grant no. 202006140040).
This research has been supported by the China National Key R&D Program (grant no. 2019YFEQ124800), the National Natural Science Foundation in China (grant nos. 42371088 and 42401087), the China Postdoctoral Science Foundation (grant no. 2023M731091), the Postdoctoral Fellowship Program of CPSF (grant no. GZB20230217), the Shanghai Key Lab for Urban Ecological Processes and Eco-Restoration (grant no. SHUES2023B02), and Guangdong Provincial Key Laboratory of Soil and Groundwater Pollution Control (grant no. 2023B1212060002).
This paper was edited by Nadav Peleg and reviewed by two anonymous referees.
Adler, C., Wester, P., Bhatt, I., Huggel, C., Insarov, G. E., Morecroft, M. D., Muccione, V., and Prakash, A.: Cross-Chapter Paper 5: Mountains, in: Climate Change 2022: Impacts, Adaptation and Vulnerability, Contribution of Working Group II to the Sixth Assessment Report of the Intergovernmental Panel on Climate Changem, edited by: Pörtner, H. O., Roberts, D. C., Tignor, M., Poloczanska, E. S., Mintenbeck, K., Alegría, A., Craig, M., Langsdorf, S., Löschke, S., Möller, V., Okem, A., and Rama, B., Cambridge University Press, 2273–2318, https://doi.org/10.1017/9781009325844.022, 2022.
Bevacqua, E., Maraun, D., Vousdoukas, M. I., Voukouvalas, E., Vrac, M., Mentaschi, L., and Widmann, M.: Higher probability of compound flooding from precipitation and storm surge in Europe under anthropogenic climate change, Sci. Adv., 5, eaaw5531, https://doi.org/10.1126/sciadv.aaw5531, 2019.
Bilskie, M. V. and Hagen, S. C.: Defining flood zone transitions in lowgradient coastal regions, Geophys. Res. Lett., 45, 2761–2770, https://doi.org/10.1002/2018GL077524, 2018.
CMA: Surface precipitation amount, http://data.cma.cn/ last access: 25 July 2023.
Feng, D., Tan, Z., Engwirda, D., Liao, C., Xu, D., Bisht, G., Zhou, T., Li, H.-Y., and Leung, L. R.: Investigating coastal backwater effects and flooding in the coastal zone using a global river transport model on an unstructured mesh, Hydrol. Earth Syst. Sci., 26, 5473–5491, https://doi.org/10.5194/hess-26-5473-2022, 2022.
Gori, A. and Lin, N., Projectingcompound flood hazard under climatechange with physical models and jointprobability methods, Earth's Future, 10, e2022EF003097, https://doi.org/10.1029/2022EF003097, 2022.
Gori, A., Lin, N., and Xi, D.: Tropical Cyclone Compound Flood Hazard Assessment: From Investigating Drivers to Quantifying Extreme Water Levels, Earth's Future, 8, e2020EF001660, https://doi.org/10.1029/2020ef001660, 2020.
Hao, Z. and, Singh, V. P.: Review of dependence modeling in hydrology and water resources, Prog. Phys. Geog., 40, 549–578, https://doi.org/10.1177/0309133316632460, 2016.
Hendry, A., Haigh, I. D., Nicholls, R. J., Winter, H., Neal, R., Wahl, T., Joly-Laugel, A., and Darby, S. E. Assessing the characteristics and drivers of compound flooding events around the UK coast, Hydrol. Earth Syst. Sci., 23, 3117–3139, https://doi.org/10.5194/hess-23-3117-2019, 2019.
Jalili Pirani, F. and Najafi, M. R.: Multivariate analysis of compound flood hazard across Canada's Atlantic, Pacific and Great Lakes coastal areas, Earth's Future, 10, e2022EF002655, https://doi.org/10.1029/2022EF002655, 2022.
Jane, R., Cadavid, L., Obeysekera, J., and Wahl, T.: Multivariate statistical modelling of the drivers of compound flood events in south Florida, Nat. Hazards Earth Syst. Sci., 20, 2681–2699, https://doi.org/10.5194/nhess-20-2681-2020, 2020.
Ke, Q., Jonkman, S., van Gelder, P., and Bricker, J.: Frequency Analysis of Storm-Surge-Induced Flooding for the Huangpu River in Shanghai, China, J. Mar. Sci. Eng., 6, 70, https://doi.org/10.3390/jmse6020070, 2018.
Ke, Q., Yin, J., Bricker, J., Savage, N., Buonomo, E., Ye, Q., Visser, P., Dong, G., Wang, S., Tian, Z. and Sun, L.: An integrated framework of coastal flood modelling under the failures of sea dikes: a case study in Shanghai, Nat. Hazards, 109, 671–703, https://doi.org/10.1007/s11069-021-04853-z, 2021.
Kumbier, K., Carvalho, R. C., Vafeidis, A. T., and Woodroffe, C. D.: Investigating compound flooding in an estuary using hydrodynamic modelling: a case study from the Shoalhaven River, Australia, Nat. Hazards Earth Syst. Sci., 18, 463–477, https://doi.org/10.5194/nhess-18-463-2018, 2018.
Moftakhari, H., Schubert, J. E., AghaKouchak, A., Matthew, R. A., and Sanders, B. F.: Linking statistical and hydrodynamic modeling for compound flood hazard assessment in tidal channels and estuaries, Adv. Water Resour., 128, 28–38, https://doi.org/10.1016/j.advwatres.2019.04.009, 2019.
Mooyaart, L. F. and Jonkman, S. N.: Overview and design considerations of storm surge barriers, J. Waterw. Port Coast. Ocean Eng., 143, 06017001, https://doi.org/10.1061/(ASCE)WW.1943-5460.0000383, 2017.
Muñoz, D. F., Muñoz, P., Moftakhari, H., and Moradkhani, H.: From local to regional compound flood mapping with deep learning and data fusion techniques, Sci. Total Environ., 782, 146927, https://doi.org/10.1016/j.scitotenv.2021.146927, 2021.
Paprotny, D., Morales-Nápoles, O., and Jonkman, S. N.: Efficient pan-European river flood hazard modelling through a combination of statistical and physical models, Nat. Hazards Earth Syst. Sci., 17, 1267–1283, https://doi.org/10.5194/nhess-17-1267-2017, 2017.
Ridder, N. N., Pitman, A. J., Westra, S., Ukkola, A., Do, H. X., Bador, M., Hirsch, A. L., Evans, J. P., Di Luca, A., and Zscheischler, J.: Global hotspots for the occurrence of compound events, Nat. Commun., 11, 5956, https://doi.org/10.1038/s41467-020-19639-3, 2020.
Santiago-Collazo, F. L., Bilskie, M. V., and Hagen, S. C.: A comprehensive review of compound inundation models in low-gradient coastal watersheds, Environ. Model. Softw., 119, 166–181, https://doi.org/10.1016/j.envsoft.2019.06.002, 2019.
Shi, X., Yu, P., Guo, Z., Sun, Z., Chen, F., Wu, X., Cheng, W., and Zeng, J.: Simulation of storm surge inundation under different typhoon intensity scenarios: case study of Pingyang County, China, Nat. Hazards Earth Syst. Sci., 20, 2777–2790, https://doi.org/10.5194/nhess-20-2777-2020, 2020.
Sun, X., Li, R., Shan, X., Xu, H., and Wang, J.: Assessment of climate change impacts and urban flood management schemes in central Shanghai, Int. J. Disast. Risk Reduct., 65, 102563, https://doi.org/10.1016/j.ijdrr.2021.102563, 2021.
Tian, Z., Ramsbottom, D., Sun, L., Huang, Y., Zou, H., and Liu, J.: Dynamic adaptive engineering pathways for mitigating flood risks in Shanghai with regret theory, Nat. Water, 1, 198–208, https://doi.org/10.1038/s44221-022-00017-w, 2023.
Valle-Levinson, A., Olabarrieta, M., and Heilman, L.: Compound flooding in Houston-Galveston Bay during Hurricane Harvey, Sci. Total Environ., 747, 141272, https://doi.org/10.1016/j.scitotenv.2020.141272, 2020.
Wahl, T., Jain, S., Bender, J., Meyers, S. D., and Luther, M. E.: Increasing risk of compound flooding from storm surge and rainfall for major US cities, Nat. Clim. Change, 5, 1093–1097, https://doi.org/10.1038/nclimate2736, 2015.
Wang, J., Yi, S., Li, M., Wang, L., and Song, C.: Effects of sea level rise, land subsidence, bathymetric change and typhoon tracks on storm flooding in the coastal areas of Shanghai, Sci. Total Environ., 621, 228–234, https://doi.org/10.1016/j.scitotenv.2017.11.224, 2018.
Xiao, Y., Guo, S., Liu, P., Yan, B., and Chen, L.: Design flood hydrograph based on multicharacteristic synthesis index method, J. Hydrol. Eng., 14, 1359–1364, https://doi.org/10.1061/(ASCE)1084-0699(2009)14:12(1359), 2009.
Xu, H.: Model and data underlying the research of combining statistical and hydrodynamic models to assess compound flood hazards from rainfall and storm surge, 4TU.ResearchData [data set], https://doi.org/10.4121/4ff14dc0-a290-4ffd-985f-3d68b9c25644.v1, 2024.
Xu, H., Tian, Z., Sun, L., Ye, Q., Ragno, E., Bricker, J., Mao, G., Tan, J., Wang, J., and Ke, Q.: Compound flood impact of water level and rainfall during tropical cyclone periods in a coastal city: the case of Shanghai, Nat. Hazards Earth Syst. Sci., 22, 2347–2358, https://doi.org/10.5194/nhess-22-2347-2022, 2022.
Xu, H., Ragno, E., Tan, J., Antonini, A., Bricker, J. D., Jonkman, S. N., Liu, Q., and Wang, J.: Perspectives on Compound Flooding in Chinese Estuary Regions, Int. J. Disast. Risk Sci., 14, 269–279, https://doi.org/10.1007/s13753-023-00482-1, 2023.
Yin, J., Yu, D., Yin, Z., Liu, M., and He, Q.: Evaluating the impact and risk of pluvial flash flood on intra-urban road network: A case study in the city center of Shanghai, China, J. Hydrol., 537, 138–145, https://doi.org/10.1016/j.jhydrol.2016.03.037, 2016.
Zellou, B. and Rahali, H.: Assessment of the joint impact of extreme rainfall and storm surge on the risk of flooding in a coastal area, J. Hydrol., 569, 647–665, https://doi.org/10.1016/j.jhydrol.2018.12.028, 2019.
Zscheischler, J., Westra, S., van den Hurk, B. J. J. M., Seneviratne, S. I., Ward, P. J., Pitman, A., AghaKouchak, A., Bresch, D. N., Leonard, M., Wahl, T., and Zhang, X.: Future climate risk from compound events, Nat. Clim. Change, 8, 469–477, https://doi.org/10.1038/s41558-018-0156-3, 2018.