the Creative Commons Attribution 4.0 License.
the Creative Commons Attribution 4.0 License.
 | 09 Aug 2024
Bimodal hydrographs in a semi-humid forested watershed: characteristics and occurrence conditions
Zhen Cui
Zilong Zhao
Zitong Xu
Yongjie Duan
Jie Wen
Mohd Yawar Ali Khan
Bimodal runoff behavior, characterized by two distinct peaks in flow response, often leads to significant stormflow and associated flooding. Understanding and characterizing this phenomenon is crucial for effective flood forecasting. However, this runoff behavior has been understudied and poorly understood in semi-humid regions. In this study, we investigated the response characteristics and occurrence conditions of a bimodal hydrograph based on the hydrometric and isotope data spanning 10 years in a semi-humid forested watershed in north China. The main findings include that (1) the onset of the bimodal hydrograph exhibits a threshold behavior, with delayed streamflow peaks occurring when the sum of event rainfall (P) and antecedent soil moisture index (ASI) prior to the rainfall exceeds 200 mm; (2) isotopic hydrograph separation reveals that the delayed stormflow process is primarily driven by pre-event water, with increasing contributions of pre-event water during catchment wetting up; and (3) the dynamic variation in groundwater level precedes that of streamflow, establishing a hysteretic relationship wherein the groundwater level peaks before streamflow during delayed stormflow. These findings, supported by on-site observations, emphasize the dominance of shallow groundwater flow in the generation of delayed stormflow.
- Article
(5497 KB) - Full-text XML
- BibTeX
- EndNote


Runoff generation is one of the most complex hydrological processes due to their complexity and non-linearity (McDonnell et al., 2007; McGuire and McDonnell, 2010; Phillips, 2003). At different times of the year, the activation of different runoff-generating mechanisms and contrasting compartments and flow routes form different hydrograph shapes, which are generally classified as unimodal and bimodal response types (Jenkins et al., 1994; Gu, 1996; Kosugi et al., 2011). A unimodal response is characterized by a needle-shaped peak which responds immediately to the rainfall impulse. In contrast, the bimodal response contains a delayed damped arch-shaped peak that respond to the same rainfall impulse in addition to the direct peak (Martínez-Carreras et al., 2016). Generally, the delayed peak in a bimodal event contributes substantially more runoff than the first peak (Zillgens et al., 2007). For instance, the study by Onda et al. (2001) showed that the delayed peak discharge is 5 to 10 times greater than the first peak. When the bimodal runoff event occurs, the streamflow increases markedly and lasts for several days. Therefore, characterizing the bimodal response is of great significance to understanding the runoff generation process and essential to achieving improved forecasting of extreme floods.
Since the bimodal hydrograph was accidently observed in Côte d'Ivoire in 1960 during flood frequency analysis and surface runoff generation study (Dubreuil, 1960, 1985), bimodal response has piqued the interest of many hydrologists worldwide and been recorded in watersheds in varied geological and climate conditions. For example, Onda et al. (2001) observed bimodal hydrographs in a steep mountainous watershed underlain by shale and serpentinite in Japan (annual precipitation of 1800 mm). Also in Japan, Padilla et al. (2014, 2015) found delayed peaks after the rainfall in a steep headwater catchment underlain by fractured bedrock (annual precipitation of 2669 mm). Zillgens et al. (2007) recorded a delayed peak after the direct peak in the Saalach Basin in the Austrian Alps (annual precipitation of 1400 mm). Masiyandima et al. (2003) found bimodal responses in an inland valley watershed with wet lowlands in central Côte d'Ivoire (annual rainfall of 1045 mm). Anderson and Burt (1977, 1978) observed a delayed peak after the storm at Bicknoller Combe in Somerset, which is composed of impermeable Old Red Sandstone. The characteristics and conditions of the occurrence of a bimodal hydrograph can provide an effective method for simplifying the description of complex hydrological systems and comparing stormflow generation mechanism in different watersheds (Tromp-van Meerveld and McDonnell, 2006). However, most of these studies mentioned above were done in humid regions with rainfall of more than 1000 mm. To the best of the authors' knowledge, very few studies, if not none, have been conducted in a semi-humid environment with rainfall less than 800 mm.
Meanwhile, recognizing the pivotal role of a bimodal response in runoff generation, researchers have made concerted efforts over the past several decades to quantify its characteristics and establish statistical metrics for identifying the occurrence of bimodal events. Findings suggest that indicators of a bimodal response encompass factors such as rainfall amount (Haga et al., 2005), pre-event streamflow (Graeff et al., 2009), soil moisture (Anderson and Burt, 1978; Weyman, 1970), groundwater level (Padilla et al., 2015), and storage (Martínez-Carreras et al., 2016). Taking the work of Martínez-Carreras et al. (2016) as an illustrative example, it revealed that the delayed peak manifested only when the watershed storage reached a critical threshold of 113 mm. It is noteworthy that predictors vary significantly among watersheds, with only a limited number of studies presenting quantitative results akin to those reported by Martínez-Carreras et al. (2016). Moreover, response timing metrics, such as response lag to peak, providing insights into different aspects of water travel time during an event, have received comparatively less attention in the evaluation of threshold effects (Dingman, 2015; Ross et al., 2021).
Many studies have delved into the compartments and flow pathways responsible for generating distinct runoff response patterns. The first runoff peaks are attributed to factors such as rainwater directly falling onto the stream channel, rapid flow through preferential paths (Becker and McDonnell, 1998; Martínez-Carreras et al., 2015; Wrede et al., 2015), or saturation excess overland flow in the riparian zone (Anderson and Burt, 1978; Westhoff et al., 2011). While delayed runoff peaks in bimodal events are primarily linked to subsurface flow processes (Weyman, 1970; Onda et al., 2006; Zillgens et al., 2007; Graeff et al., 2009; Padilla et al., 2015). However, a notable gap exists in the literature as many studies have focused solely on water flow processes within the soil profile without thoroughly investigating whether subsurface stormflow originates from the soil layer, bedrock layer, or a combination of the two.
Bimodal responses, representing the non-linear interplay between runoff and rainfall, inherently showcase the stormflow process in terms of both response timing and magnitude. This intuitive manifestation holds significant implications for advancing runoff modeling (Graeff et al., 2009; McDonnell et al., 2007) and enhancing the precision of flashflood forecasting (Zhang et al., 2021; Zillgens et al., 2007). In our present study, spanning the years 2014 to 2023, we collected data on rainfall, groundwater levels, soil water content, and streamflow within a semi-humid forest experimental watershed in north China. Our investigation involves characterizing the response magnitude and timing of stormflow to rainfall through hydrograph analysis while also scrutinizing the composition of the water sources contributing to stormflow. Specifically, we hypothesize that (1) the occurrence of bimodal streamflow responses exhibits a threshold behavior with rainfall and watershed wetness and (2) the primary source of water for the delayed stormflow is subsurface flow.
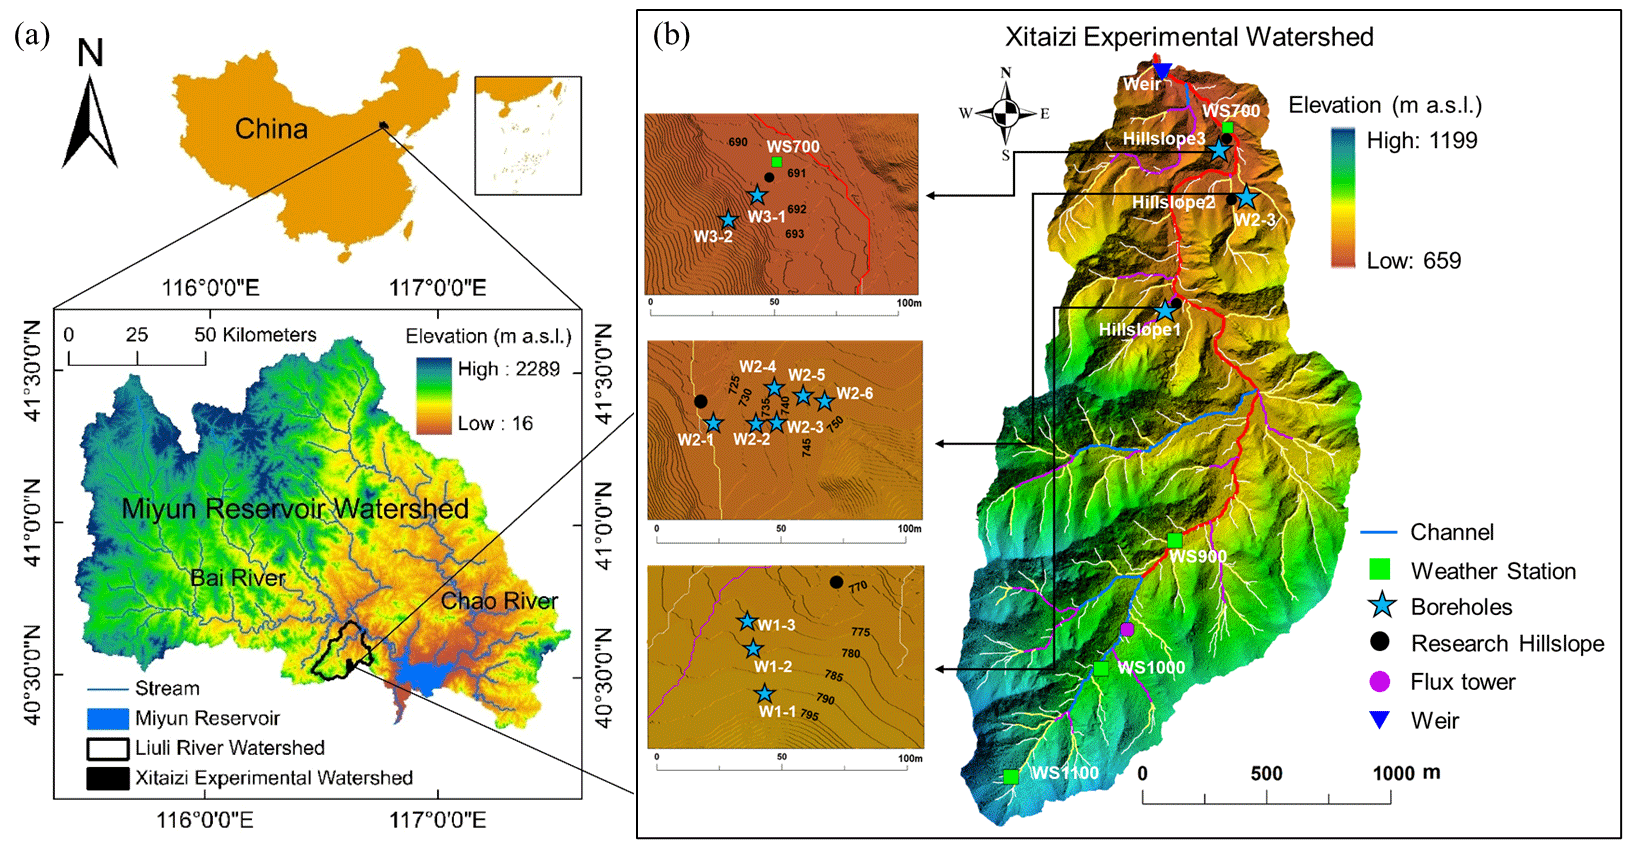
Figure 1Location of the Xitaizi experimental watershed (XEW) in north China (a) and the detailed distributed monitoring stations and instruments (b), including 4 automatic weather stations (WS700-1100), 1 weir, and 11 groundwater boreholes (the blue star corresponds to well numbers and locations). Four rain gauges are located near the weather stations, and one is located adjacent to the weir.
2.1 Study area
The studied headwater catchment, the Xitaizi experimental watershed (XEW), is situated at coordinates 40°32′ N, 116°37′ E, as depicted in Fig. 1. Spanning an area of 4.22 km2, XEW exhibits elevations ranging from 676 to 1201 m above sea level. Approximately 54 % of the area features a slope between 20 % and 40 %. The region experiences a monsoon-influenced semi-humid climate characterized by an average annual rainfall of 625 mm. The majority of this precipitation, around 80 %, occurs between June and September. The annual mean temperature in the area is 11.5 °C and is accompanied by a relative humidity of 59.1 %. Experimental and observational activities were conducted over the period from 2014 to 2023.
XEW represents a typical location in north China's earth-rocky mountainous region, where approximately 80 % of the catchment area is underlain by firmly compacted, deeply weathered granite. Soil mapping and field investigations reveal the prevalent soil types to be brown earth and cinnamon soil (according to Chinese soil taxonomy), with a depth extending to 1.5 m. The saturated hydraulic conductivity of the soil ranges from 19.5 to 175.3 mm h−1, with an average value of 45 mm h−1. The bedrock in the area is primarily composed of granite, constituting approximately 88 % of the total bedrock composition, while gneiss and dolomite are sporadically distributed. Some sections of the granite exhibit a fracture, and a layer of regolith is sandwiched between the soil layer and the bedrock layer. In terms of land cover, the catchment is predominantly covered by forest (98 %), with 54.2 % being broad-leaved, 2.3 % coniferous, and 10.5 % a mix of coniferous and broad-leaved. The remaining 33 % consists of shrubs (Tie et al., 2017).
2.2 Meteorology and runoff measurements
Meteorological variables and runoff have been systematically monitored since 2013. Meteorological conditions were consistently measured using four GRWS100 automatic weather stations. These weather stations were strategically distributed quasi-uniformly along the elevation gradient as depicted in Fig. 1. The comprehensive data collection from these stations contributes to a thorough understanding of the meteorological dynamics in the study area over the specified time frame.
For the measurement of air temperature (Ta) and relative humidity at each automatic weather station, an HC2S3-L temperature and relative humidity probe was utilized. These probes were equipped with a radiation shield to enhance accuracy. Simultaneously, a LI-190R quantum sensor was employed to measure photosynthetically active radiation (PAR). Rainfall data were collected at 10 min intervals using six tipping-bucket rain gauges. These gauges were positioned in an open space near the automatic weather stations, and average values were adopted for analysis in this study.
Furthermore, the antecedent precipitation index (API), generally used to represent the residual effect of previous precipitation (Mosley, 1979; Iwagami et al., 2010), was calculated for all the events over 3, 6, and 12 d. The API during the antecedent t days is described as follows:
where i is the day count and Pi is the daily precipitation on the ith day.
Table 1Rainfall–runoff event classification and counts by year. This table provides a breakdown of the number of rainfall–runoff events categorized as unimodal, bimodal, and hybrid bimodal for each year along with the corresponding time periods. The total counts are summarized at the bottom.
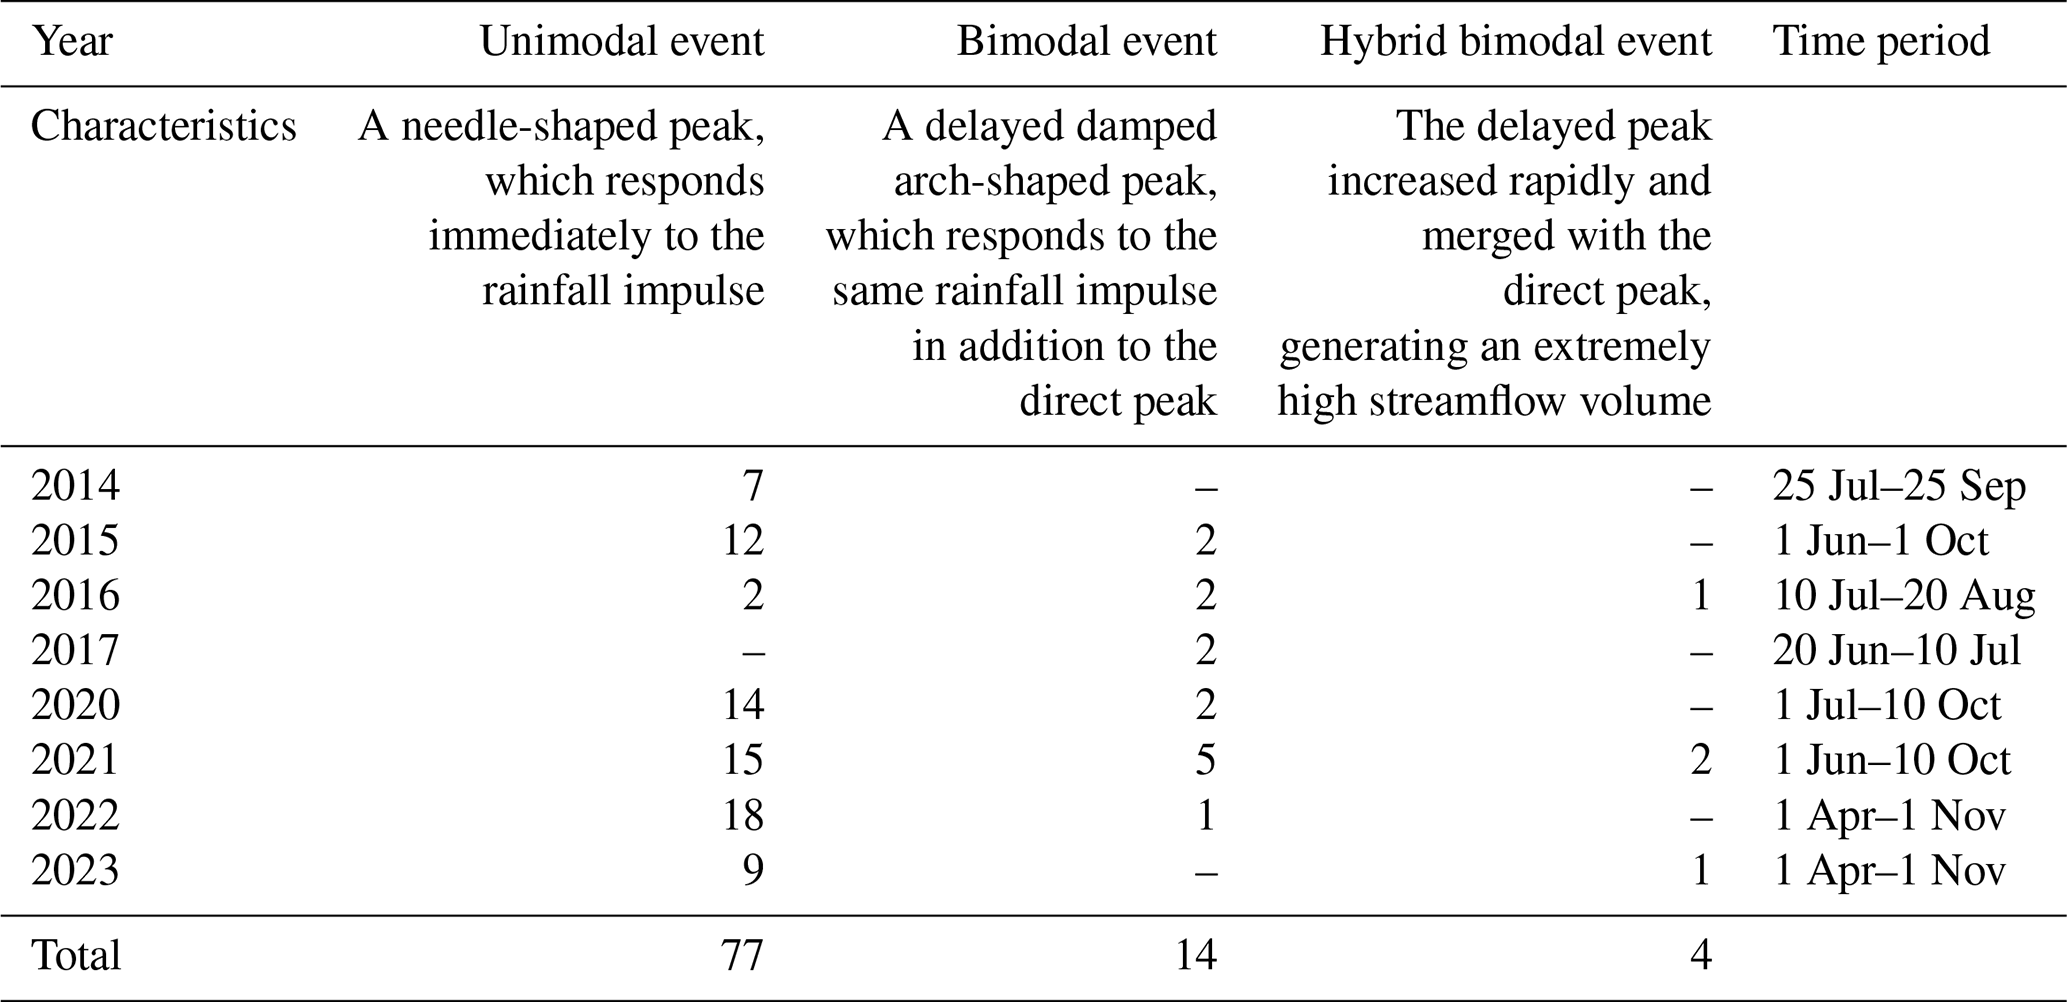
Table 2Depths and groundwater levels of boreholes. This table summarizes the depths of the bottom and the boundary between unscreened and screened portions along with the shallowest and deepest groundwater levels of boreholes in the study area.
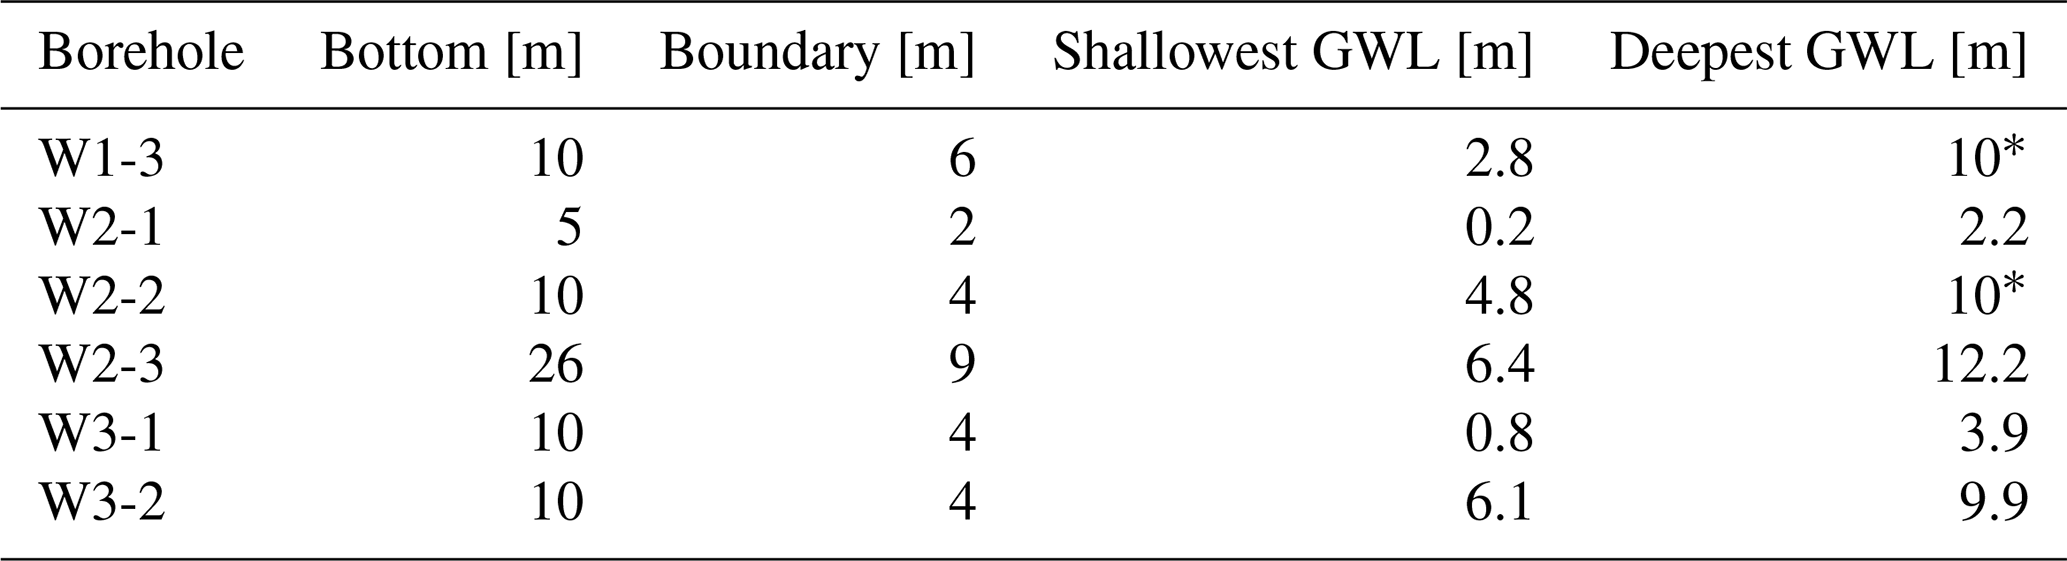
Note that all values indicate depths (in meters) from the ground surface. GWL represents groundwater level. The asterisk (∗) indicates that the groundwater level dropped below the bottom of the borehole.
A Parshall flume was installed at the catchment outlet to measure streamflow (Fig. 1). The water level in the flume was measured every 5 min with a HOBO capacitance water level logger from 2014. Streamflow was calculated using the standard Parshall flume-rating curve, and both the rainfall and streamflow measurements were averaged to hourly time steps, and in this study, the analysis is conducted at hourly time steps. Unfortunately, the observation equipment is susceptible to failures due to the complex environmental conditions and disturbances caused by wild animals and plants. Compounded by the remote location of XEW, accessing the site promptly to address malfunctions is challenging, leading to the loss of some observation data. Notably, stormflow data from 19 July to 16 August 2016 had to be excluded because the road collapsed during a heavy storm, preventing a significant amount of runoff from passing through the Parshall flume. Furthermore, streamflow data from 2018 to 2019 are unavailable, and the two bimodal events in 2016 were omitted from the hysteresis analysis due to substantial errors in streamflow observations resulting from damage to the diversion channel. The specific observation periods are detailed in Table 1. These limitations underscore the challenges associated with conducting observations in remote and environmentally intricate locations.
2.3 Soil water content observation
Volumetric soil water content (SWC) was measured at eight observation sites using CS616 time-domain reflectometry (TDR) probes at 10 min intervals. On Hillslope 1, five soil moisture sensors were deployed, with an additional three located adjacent to WS900. These sensors were strategically placed in the soil profiles at 80 cm depth intervals, each at a depth of 10 cm. For analysis in this study, the 10 min interval measurements were aggregated to hourly time steps, and the arithmetic mean of the total SWC across the four profiles was employed. Moreover, SWC data immediately preceding a rainfall event were integrated over the 80 cm depth to calculate an antecedent soil moisture index (ASI), as proposed by Haga et al. (2005). This index, commonly utilized in analyzing the impact of antecedent shallow soil water storage on catchment runoff response (Fu et al., 2013; Penna et al., 2011), provides valuable insights into the soil moisture conditions preceding rainfall events.
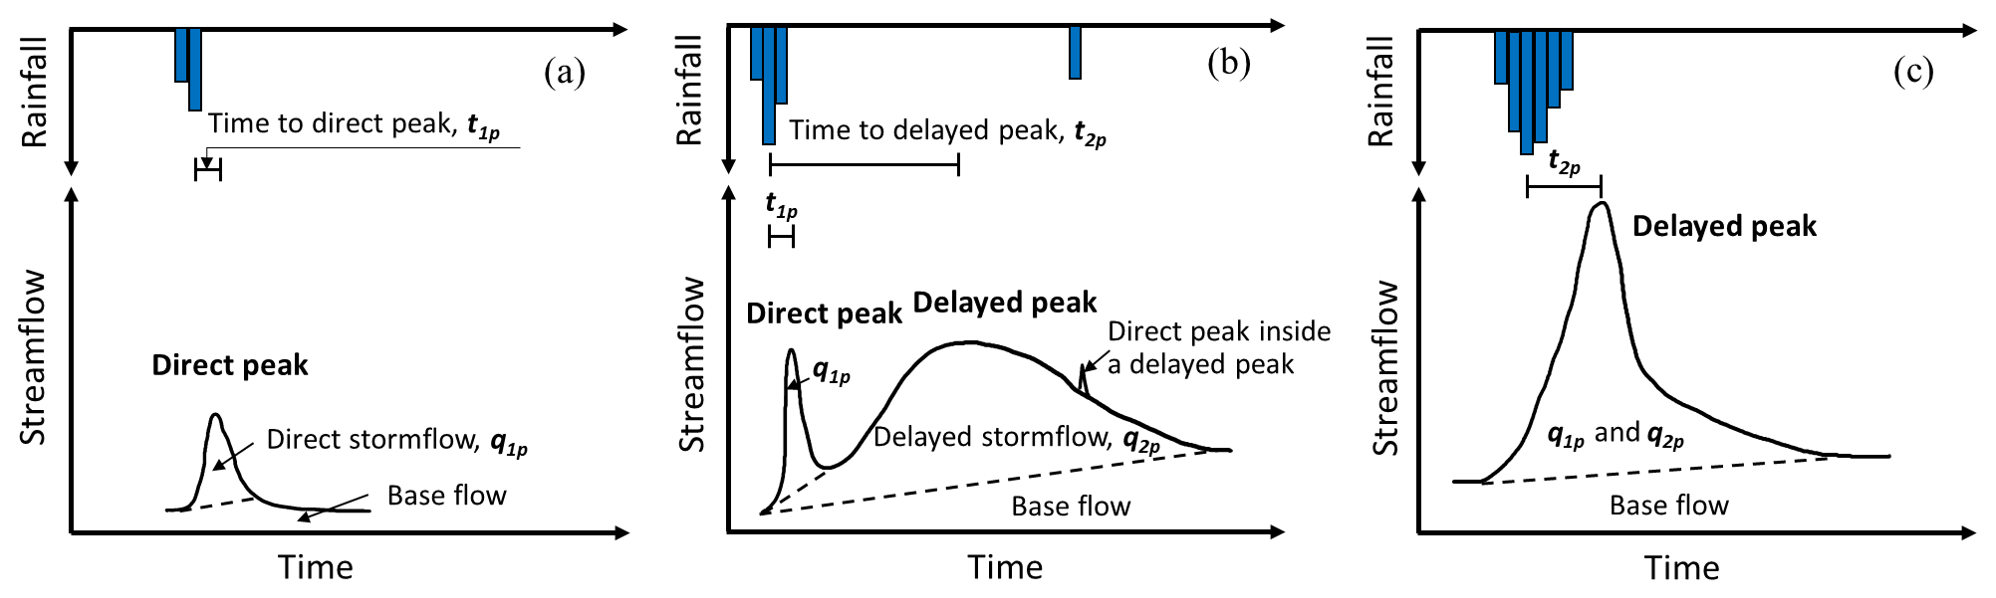
Figure 2Schematic diagrams of the hydrographs of a (a) unimodal event, (b) typical bimodal event, and (c) hybrid bimodal event.
2.4 Groundwater level observation
Fluctuations in groundwater level (below the ground surface, hereinafter referred to as bgs) were systematically recorded in eleven 80 mm diameter boreholes situated on three hillslopes within the catchment (refer to Fig. 1). The boreholes were drilled to depths of 5–26 m in granite (weathered and fractured to varying extents) mantled by thin soils. Unscreened portions of the boreholes accounted for approximately one-third to three-fifths of the total depth (refer to Table 2). To capture the groundwater level dynamics, HOBO capacitance water level loggers (Onset, USA) were deployed to record water levels in the boreholes at hourly intervals. It is noteworthy that water levels were rarely observed in boreholes W1-1, W1-2, W2-4, W2-5, and W2-6. This observation could be attributed to the boreholes potentially not being drilled deep enough to reach the groundwater, possibly due to challenges encountered during field drilling. Slug tests conducted following installation suggested that the saturated conductivity in the weathered and fractured granite was relatively high, ranging from 5.2 × 10⁻³ m d−1 to as high as 1.16 m d−1.
An index for groundwater level (IG) was computed by normalizing the groundwater levels in each borehole according to their recorded range throughout the research years, following the approach outlined by Detty and McGuire (2010). Subsequently, the arithmetic mean of values of IG across all boreholes was calculated, serving as a representative proxy for the groundwater level across the entire catchment. This approach provides a standardized measure that allows for the comparison of groundwater level variations across different boreholes within the study area.
2.5 Separation of rainfall–runoff events
An intensity-based automatic algorithm, as outlined by Tian et al. (2012) and Powell et al. (2007), was employed to delineate and segregate rainfall events from hourly rainfall time series data. In this algorithm, a threshold rainfall intensity of > 0.1 mm h−1 was utilized to determine the commencement and conclusion of each event, with individual storms being separated by a minimum of 6 h. Events characterized by an accumulated rainfall that exceeded 5 mm were selected for further analysis. A total of 95 distinct rainfall events, each with a cumulative rainfall of at least 5 mm, were identified and isolated from the rainfall data series spanning the years 2014 to 2023 by employing the intensity-based automatic method (refer to Table 1).
Storm runoff events are identified when streamflow experiences a rapid increase and attains a peak in response to a rain impulse. Throughout the analyses presented, streamflow refers to the total discharge measured at the weir. The computer program HYSEP (Sloto and Crouse, 1996) was employed to automatically partition a streamflow hydrograph into baseflow and stormflow components. Subsequently, the automated separation outcomes underwent manual verification and adjustment, aligning with observed data and widely accepted straight-line separation principles. In the context of each event, q0 is defined as the streamflow before the onset of rainfall. This parameter characterizes the baseflow conditions preceding the hydrograph's response to a rain impulse (Zillgens et al., 2007). The separation of stormflow from baseflow allows for a more detailed examination of the runoff dynamics during distinct rainfall events.
2.6 Hydrograph and event types
The hydrograph served as a valuable tool for characterizing the timing, magnitude, and duration of runoff responses to rainfall. Three primary response types were identified based on the number and shape of streamflow peaks: unimodal, bimodal, and hybrid bimodal events. Schematic diagrams illustrating these three types of events are presented in Fig. 2.
A unimodal event has a single peak that generates during or shortly after the cessation of rain impulse (refer to Fig. 2a), while a bimodal event features two peaks as a response to the same rain impulse, of which the direct peak (also called the first peak) corresponds to a fast catchment response to rainfall and occurs synchronously with the rainfall or shortly after its onset. Additionally, we observed that the hydrographs of these events resembled those of unimodal events but exhibited significantly greater water yields and longer peak delay times. We termed these events “hybrid bimodal events”. Hybrid bimodal events can be distinguished from unimodal events by their extremely high streamflow volume, longer duration, and delayed response time (Fig. 2c). For the hydrographs of bimodal and hybrid bimodal events, refer to Fig. 12.
It is worth noting that a rainfall event may consist of multiple impulses, and in such cases, the hydrograph responds with multiple direct peaks (see Fig. 2b). The stormflows from the first peak (q1p) and delayed peak (q2p), along with the total event stormflow (qs = q1p+q2p), were calculated by summing hourly values over the identified event period. The runoff ratio (Rr), commonly used to estimate the effective contributing area during a runoff event (Buttle et al., 2004; Detty and McGuire, 2010), is calculated as the ratio of qs to gross rainfall.
2.7 Definition of lag time
The lag time, defined as the duration between peak rainfall and peak streamflow (Mosley, 1979), is a critical parameter for modeling the temporal variability in streamflow. Lag time varies significantly among different water sources (Becker, 2005; Haga et al., 2005) and has been introduced to comprehend sub-components of runoff in different response processes. In this study, two specific lag times are considered: t1p, the time lag between peak rainfall intensity and the first streamflow peak, and t2p, the time lag between peak rainfall intensity and the delayed streamflow peak, as illustrated in Fig. 2.
2.8 Water sampling and isotope analysis
Water samples for isotope analysis (δ18O and δD) were collected from 1 July to 1 September 2021. Rainwater was automatically sampled every 2 hours using an ISCO6712 automatic water sampler (Teledyne ISCO Inc., Lincoln, Nebraska, USA) positioned near the weir. Manual bulk samples of rainfall were also collected at the same location after each event using a rainwater sampler with a 9.5 cm diameter funnel attached to a 500 mL plastic water bottle insulated with bubble foil to protect against direct sunlight and a table tennis ball placed in the funnel's mouth to minimize evaporation.
Stream water was collected every 2 hours upstream of the Parshall flume location using an automatic water sampler (Fig. 1). Spring, seepage water, and groundwater were manually collected daily from boreholes using a bailer. All collected samples underwent isotopic composition analysis (δ18O and δD) using a Picarro L2140-i isotopic liquid water and water vapor analyzer (wavelength-scanned cavity ring-down spectroscopy, WS-CRDS) with a declared precision of δ18O ± 0.1 ‰ and δD ± 1 ‰.
2.9 Isotopic hydrograph separation
To trace the source of the streamflow during storm events, a simple mass balance approach was employed to segregate the streamflow into two components: event water and pre-event water. These components are represented by rainfall and baseflow, respectively, based on the oxygen isotopic concentration (δ18O) of each component. The δ18O of baseflow and weighted rainwater samples served as end members, defining the ultimate isotopic composition of the stream, in accordance with the approach outlined by Padilla et al. (2014), as follows:
where Cs, Ce, and Cp refer to δ18O concentrations of stream, event, and pre-event water components, respectively. Ce is the weighted value calculated using the incremental weighted mean method (McDonnell et al., 1990) for each event. Cp is determined from the stream δ18O concentration measured immediately preceding the rainfall. Finally, x is the percentage of event water in the stream.
3.1 Characteristics of different runoff response types
During the period from 2014 to 2023, a total of 95 distinct rainfall events, each with a cumulative rainfall of at least 5 mm, were identified from the rainfall data series. Among these events, 14 exhibited a bimodal response and an additional 4 displayed a hybrid bimodal process (refer to Table 1).
The stormflow volume and lag times of streamflow peaks for both unimodal and bimodal events were determined and characterized. As depicted in Fig. 3, unimodal events generated relatively minimal runoff, with a maximum q1p of 0.25 mm. In contrast, the q1p and q2p of bimodal events exhibited a wider range, spanning from 0.03 to 0.38 mm and from 0.82 to 31.63 mm, respectively (Fig. 3b). The stormflow volume of bimodal events proved to be 3 to 114 times larger than that of unimodal events, primarily due to the presence of delayed peaks (Fig. 3a). Correspondingly, bimodal events displayed higher Rr values, ranging from 0.91 % to 31.81 %, whereas the Rr of unimodal events remained below 0.8 % (Fig. 3b). This discrepancy suggests an expanded effective contributing area during bimodal and hybrid bimodal events, as highlighted in previous studies (Zhang et al., 2021).
In both unimodal and bimodal events, all direct peaks were observed within a 1 h time frame. However, the delayed peak, a distinctive feature of bimodal events, manifested itself between 5 h and 9.9 d after the occurrence of the direct peak. Notably, hybrid bimodal events exhibited shorter lag times and significantly higher stormflow yield, underscoring the need for heightened attention in flood forecasting. The substantial difference in lag time strongly implies that these peaks are contributed by distinct water sources, aligning with findings from previous studies (Haga et al., 2005).
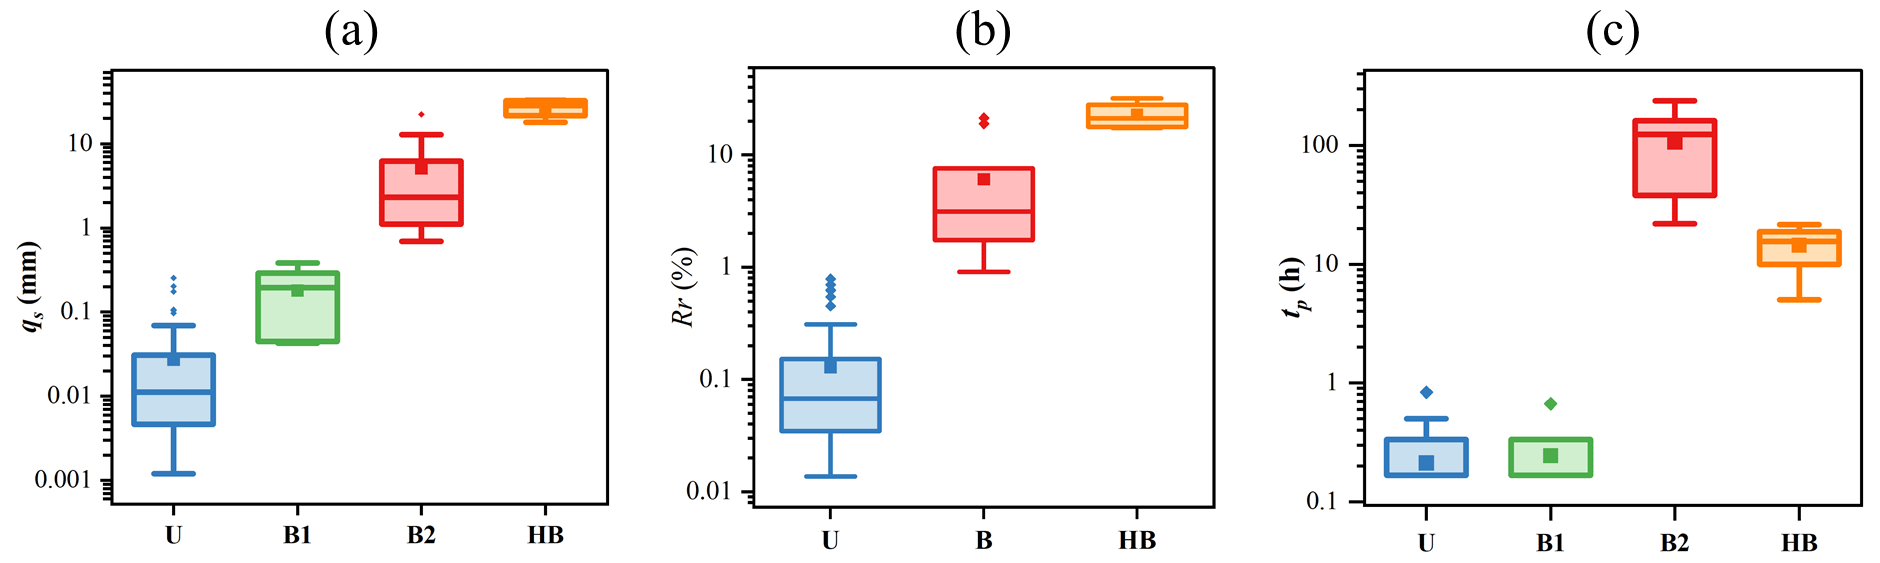
Figure 3Comparison of (a) stormflow (qs), (b) runoff ratio (Rr), and (c) lag time (tp) from the peak rainfall to peak streamflow of different event types. U indicates a unimodal event, B (including the first peak, B1, and the delayed peak, B2) a bimodal event, and HB a hybrid bimodal event. In each box plot, the lower and upper limits represent the lower and upper quartiles, while the whiskers extend to the minimum and maximum values in each dataset. The horizontal line within the box signifies the median. Individual asterisks denote points more than 1.5 times away from the median. It is noteworthy that a semi-logarithmic coordinate was utilized for enhanced interpretability due to the extensive range.
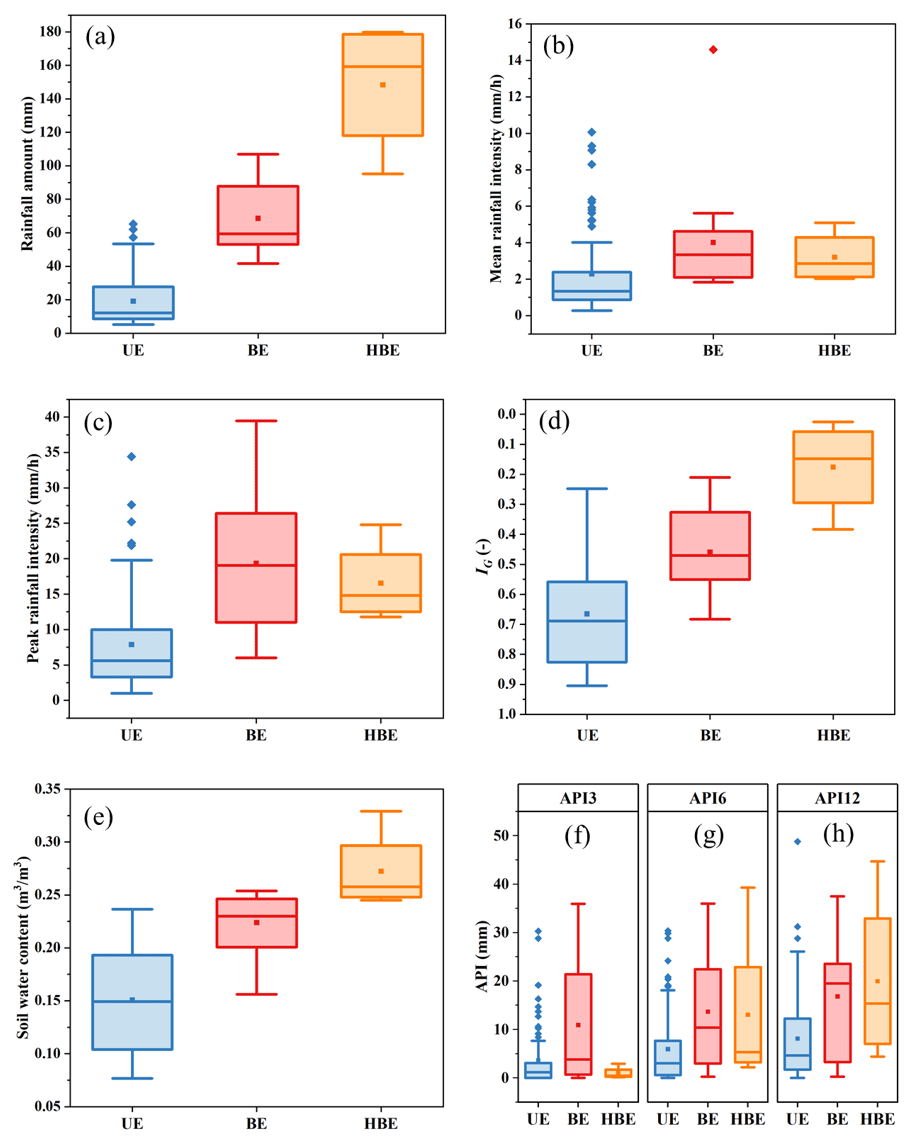
Figure 4Box plots of the hydrological characteristic parameters for unimodal and bimodal events. (a) Rainfall amount; (b) mean rainfall intensity; (c) peak rainfall intensity; (d) IG, the groundwater level index; (e) soil water content; and (f–h) API3, API6, and API12, i.e., antecedent precipitation index over 3, 6, and 12 d. UE, BE, and HBE stand for, respectively, unimodal, bimodal, and hybrid bimodal events. Note that each element of the box carries the same interpretation, as described in Fig. 3.
3.2 Determinants of delayed streamflow peaks
The relationships between different event types, rainfall characteristic parameters, and watershed wetness indicators were further depicted in Fig. 4. It is noteworthy that the soil water content (SWC) and groundwater level index (IG) presented in Fig. 4 represent data recorded at the end of rainfall events, considering that delayed streamflow peaks typically manifest subsequent to the cessation of rainfall events. Rainfall amount, IG, and SWC were statistically significantly different for both groups, as proven by the t test of the equality of medians at a significance level of α = 0.01. The transition from unimodal to bimodal events reveals a consistent increase in rainfall amount, IG, and SWC. Nearly all bimodal events exhibited rainfall amounts that exceed 50 mm, whereas the range for unimodal events varied from 5.2 to 66.6 mm (Fig. 4a). This suggests that the initiation of delayed streamflow peaks may be associated with substantial rainfall.
The IG and SWC of bimodal events, and especially hybrid bimodal events, were significantly higher (p < 0.01) than those of unimodal events. Despite partial overlap in the ranges of IG and SWC for these groups (Fig. 4d and e), the mean IG and SWC values for bimodal events (0.46 and 0.67) were notably greater than those for unimodal events (0.22 and 0.13), underscoring the distinctiveness of these parameters between event types. Contrastingly, peak rainfall intensity, mean rainfall intensity, and antecedent precipitation index (API) metrics (API3, API6, and API12) exhibited a widespread overlap in their variation (p > 0.05; Fig. 4b, c, and f–h). Consequently, while bimodal events were characterized by higher rainfall and antecedent wetness, IG and SWC emerged as more effective indicators for estimating the occurrence of bimodal events, while peak rainfall intensity, mean rainfall intensity, and API were found to be insufficient for distinguishing between bimodal and unimodal events.
Considering the interdependence of groundwater level, streamflow, and SWC on rainfall, a detailed examination of the relationship between rainfall amount and bimodal events was conducted. The analysis revealed that the occurrence of delayed peaks is contingent on both event rainfall and antecedent wetness, displaying a distinct threshold behavior (Fig. 5b). The combined sum of event rainfall amount (P) and antecedent soil moisture index prior to the rainfall (ASI0) serves as a reliable indicator for predicting the occurrence of delayed peaks. Figure 5 illustrates that bimodal events tend to manifest when P + ASI0 exceeds 200 mm (with only two bimodal events misplaced). An intriguing observation is that these misplaced bimodal events produced a very low value of qs and that these unimodal events near the threshold occurred just before the year's first bimodal response when the watershed was sufficiently humid, signaling a predisposition for bimodal events. However, once the rainfall surpassed the threshold, all bimodal episodes were randomly distributed, and no discernible relationship was observed between their stormflow volume (qs) and rainfall amount. Based on these findings, we posit that the stormflow generation process may be dominated by groundwater or SWC.
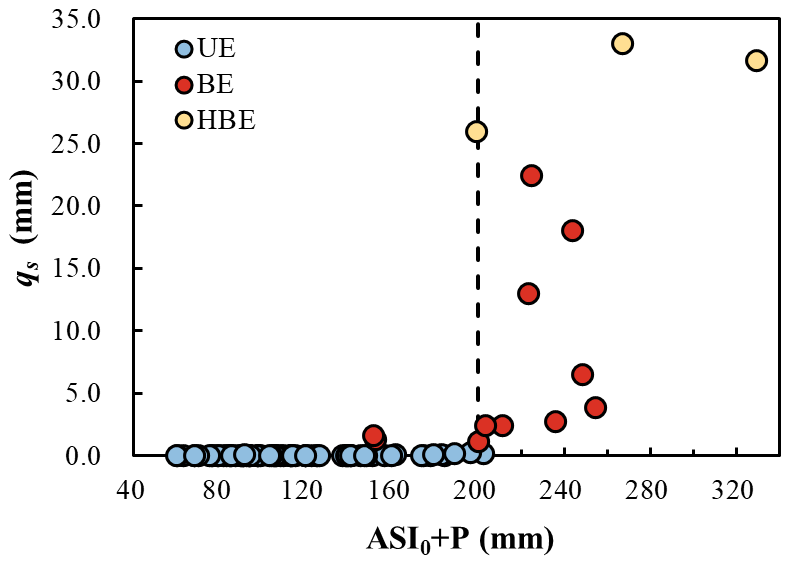
Figure 5Relationship between the ASI0 + P and stormflow volumes (qs) of different event types. UE stands for a unimodal event, HBE a hybrid bimodal event, P the rainfall amount, and ASI0 the antecedent soil moisture index before the rainfall.
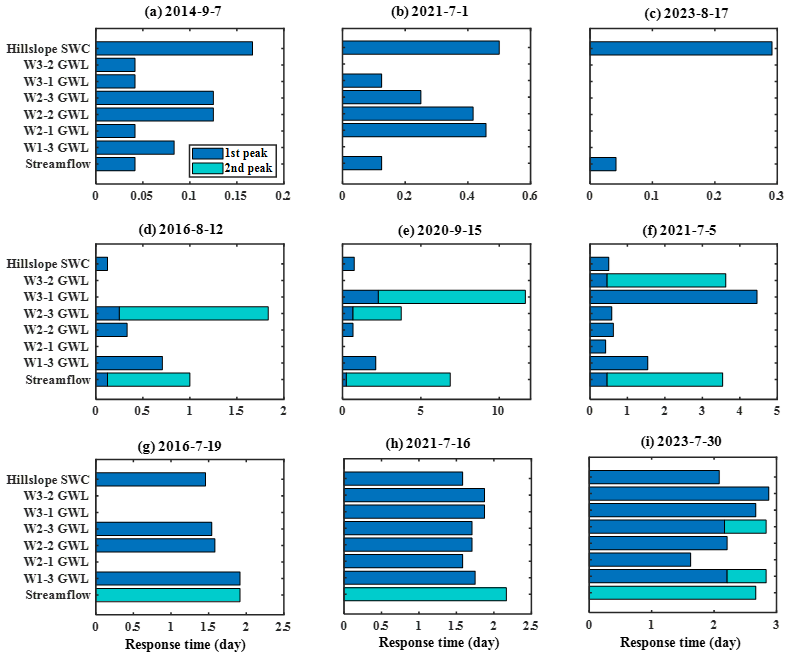
Figure 6Response time of streamflow, groundwater level, and soil water content in nine events. The horizontal axis illustrates the lag time from the onset of rainfall. The bar lengths depict the time it takes for volumetric water content and groundwater level to reach their respective maximums from the onset of rainfall. GWL is groundwater level and SWC is soil water content. Each row and column chart share identical vertical and horizontal axis titles.
3.3 Timing of groundwater, soil water, and streamflow response
The preceding analysis indicates a correlation between different event types and groundwater levels along with SWC. Moreover, the inconsistent response time among different event types may signify distinct contributing sources to the stream channel, providing insights into the primary mechanisms behind runoff generation. Earlier or identical response timing of groundwater compared with streamflow suggested that streamflow response was driven by hillslope groundwater (Haught and Meerveld, 2011; Rinderer et al., 2016). To explore this further, six bimodal events with minimal or sporadic rainfall during the delayed peak period along with three unimodal events were selected. The response timing of groundwater, SWC, and streamflow is illustrated in Fig. 6. Each horizontal bar represents the onset of rain on the left end and the lag time of the peak value on the right end of the corresponding variable. It is worth noting that some groundwater levels in Fig. 6d, e, and g lack horizontal bars due to missing groundwater level data, while the groundwater levels in Fig. 6c lack horizontal bars due to no response from groundwater.
SWC reached their maximum after direct streamflow peaks but before delayed peaks. In typical bimodal events in particular, SWCs peaked much earlier than delayed streamflow peaks, suggesting that in these events, soil water did not contribute to direct peak but may have to delayed streamflow peaks. Regarding groundwater levels, some locations showed two peaks, and not all responded to the same rainfall event. Among different locations, groundwater levels peaked before or after the delayed streamflow peaks. However, for the hybrid bimodal events, the response time of groundwater levels at various locations and even the SWC tended to coincide with the delayed streamflow peak. Identical response timing or groundwater rising and peaking just before the stream suggest that the whole catchment or critical zone contributed to delayed stormflow.
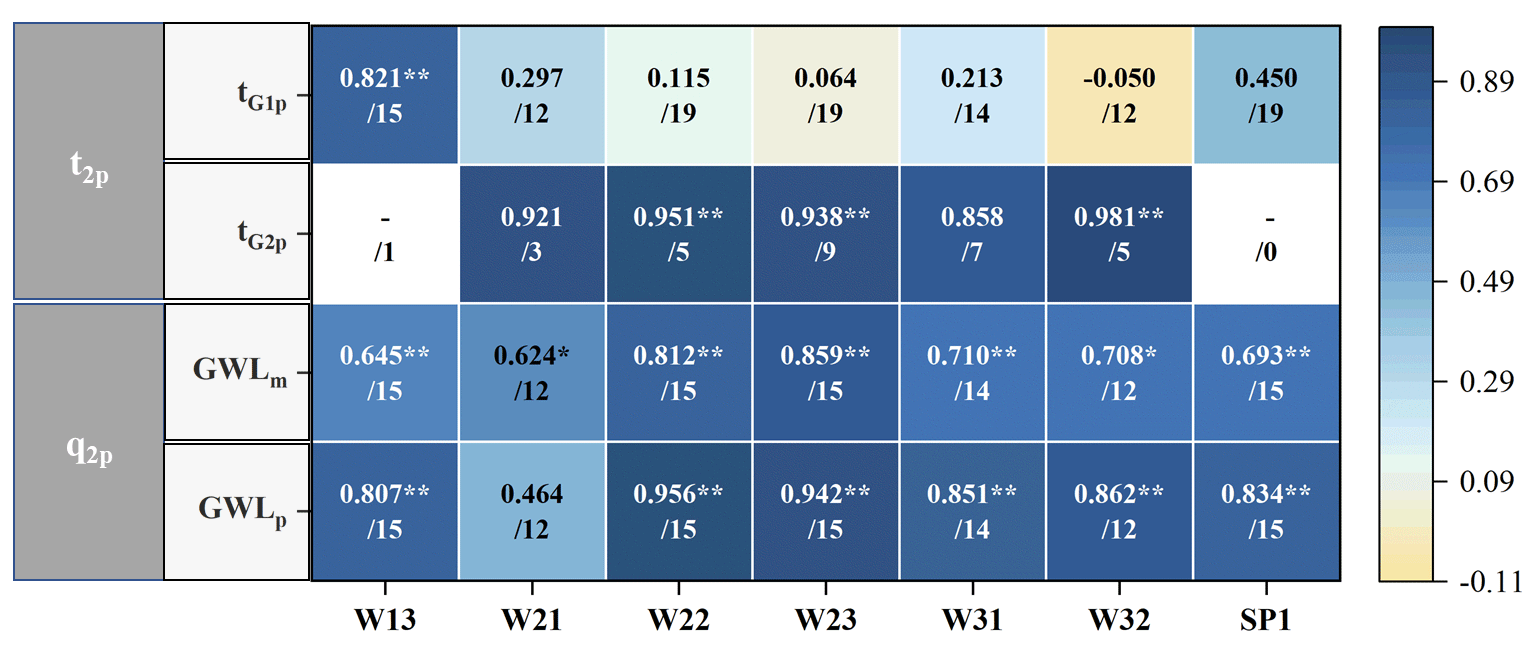
Figure 7Pearson correlation coefficients between the peak streamflow and peak groundwater levels. The number after the slash specifies how many pairs of the variables there are. IG is the groundwater water level index. Double asterisks () denote that correlation is significant at the 0.01 level (two-tailed).
Values of the Pearson correlation coefficient (rp) between peak groundwater levels, peak SWC, and delayed streamflow were calculated for 19 bimodal events. As showed in Fig. 7, the first two lines show the correlation coefficients between t2p and the lag time of the peak groundwater levels, and SWC, tG1p, and tG2p represent the response times of the first and second peaks of groundwater level or SWC, respectively. The last two lines show the correlation coefficients between q2p and the average and peak values of groundwater levels and SWC. The number after the slash specifies how many pairs of the variables.
Groundwater levels exhibited two peaks in some events, with the exception of W13. Correspondingly, among these events, the response time of the second peak of groundwater level has a strong correlation with t2p, with rp > 0.858. Even though W13's groundwater level only has one peak, this peak's response time was highly correlated with t2p at the 0.01 significance level (rp = 0.821). In contrast, SWC displayed one peak in all events, and its response time exhibited a weak correlation with t2p (rp = 0.450). Both groundwater levels and SWC, and particularly their peak values, demonstrated a high correlation with the delayed stormflow volume (qs). Above all, groundwater is deemed to be the primary controlling factor in delayed stormflow.
The robust correlation observed between groundwater levels at different locations and stormflow suggests that groundwater observations at a specific location can serve as a representative proxy for the overall groundwater level across the watershed. Given the relatively complete and dynamic water level observation data for W23, this borehole was selected for further analysis.
3.4 Stormflow timing and magnitude characteristics
Considering the high correlation between streamflow and groundwater level as indicated in the previous analysis, we hypothesized a connection between groundwater and delayed stormflow. To elucidate this correlation between groundwater and streamflow, we fitted the relationship between the groundwater level at location W23 and the magnitude and timing of the delayed stormflow for bimodal events. The time lag of delayed peak (t2p) shows a negative exponential correlation with peak groundwater level (ln (t2p) = 1.03 × PGL − 7.43; R2 = 0.84; p < 0.01, Fig. 8), suggesting that a higher groundwater level corresponds to a faster response of the delayed runoff peak to rainfall. A comparable linear correlation was also fitted between t2p and groundwater level, albeit with a slightly lower R2 (R2 = 0.76).
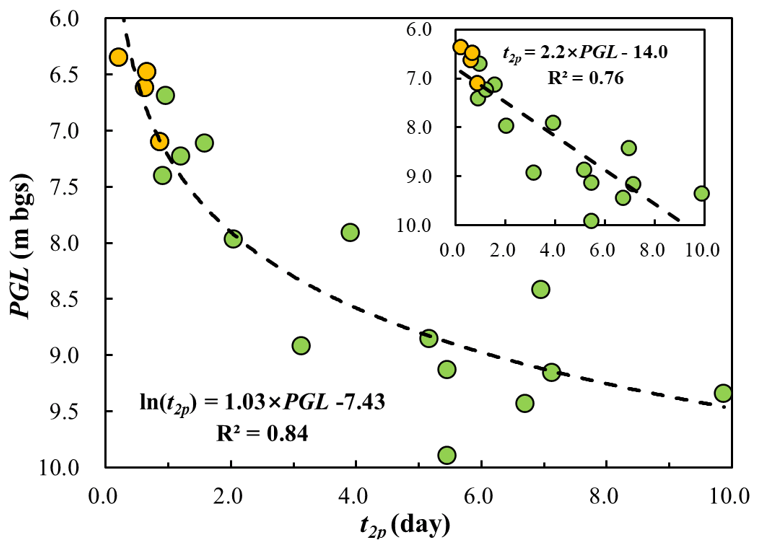
Figure 8Correlation between the peak groundwater level (PGL) and lag time of the delayed streamflow peak (t2p). The insert shows the same plot with linear fitting. Solid orange circles represent hybrid bimodal events.
Moreover, as shown in Fig. 9, qs also has a strong linear relationship with groundwater level (qs = −10 × PGL + 94.8; R2 = 0.91; p < 0.01). These results highlight the significant influence of groundwater on flood generation in the studied watershed, suggesting that incorporating groundwater level variations into flood forecasting models could enhance their accuracy.
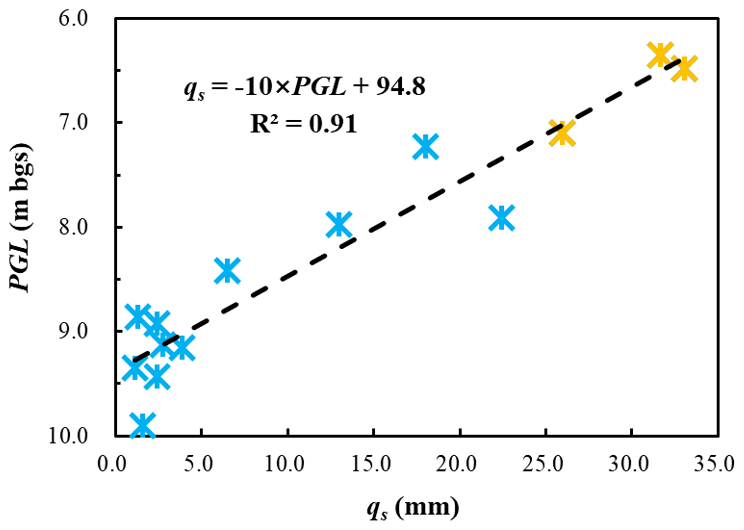
Figure 9Correlation between the peak groundwater (PGL) level and stormflow amount (qs) for bimodal events. Orange stars represent hybrid bimodal events.
For both fitted lines, the closely matching fitting lines for hybrid bimodal events support the hypothesis that these high, delayed streamflow responses, which may appear to be unimodal, are, in fact, bimodal. During hybrid bimodal events, the delayed peak increased rapidly and reached its peak within 1 d, practically merging with the direct peak. This led to a potentially misleading result that only one peak was generated. This occurrence was likely due to the groundwater level rising rapidly to a critical level with substantially higher hydraulic conductivity, allowing a larger portion of the hillslope to become hydraulically connected to the stream during these events within a very short time. Consequently, a substantial amount of groundwater was quickly discharged into the channel.
3.5 Isotope composition of groundwater and stream water
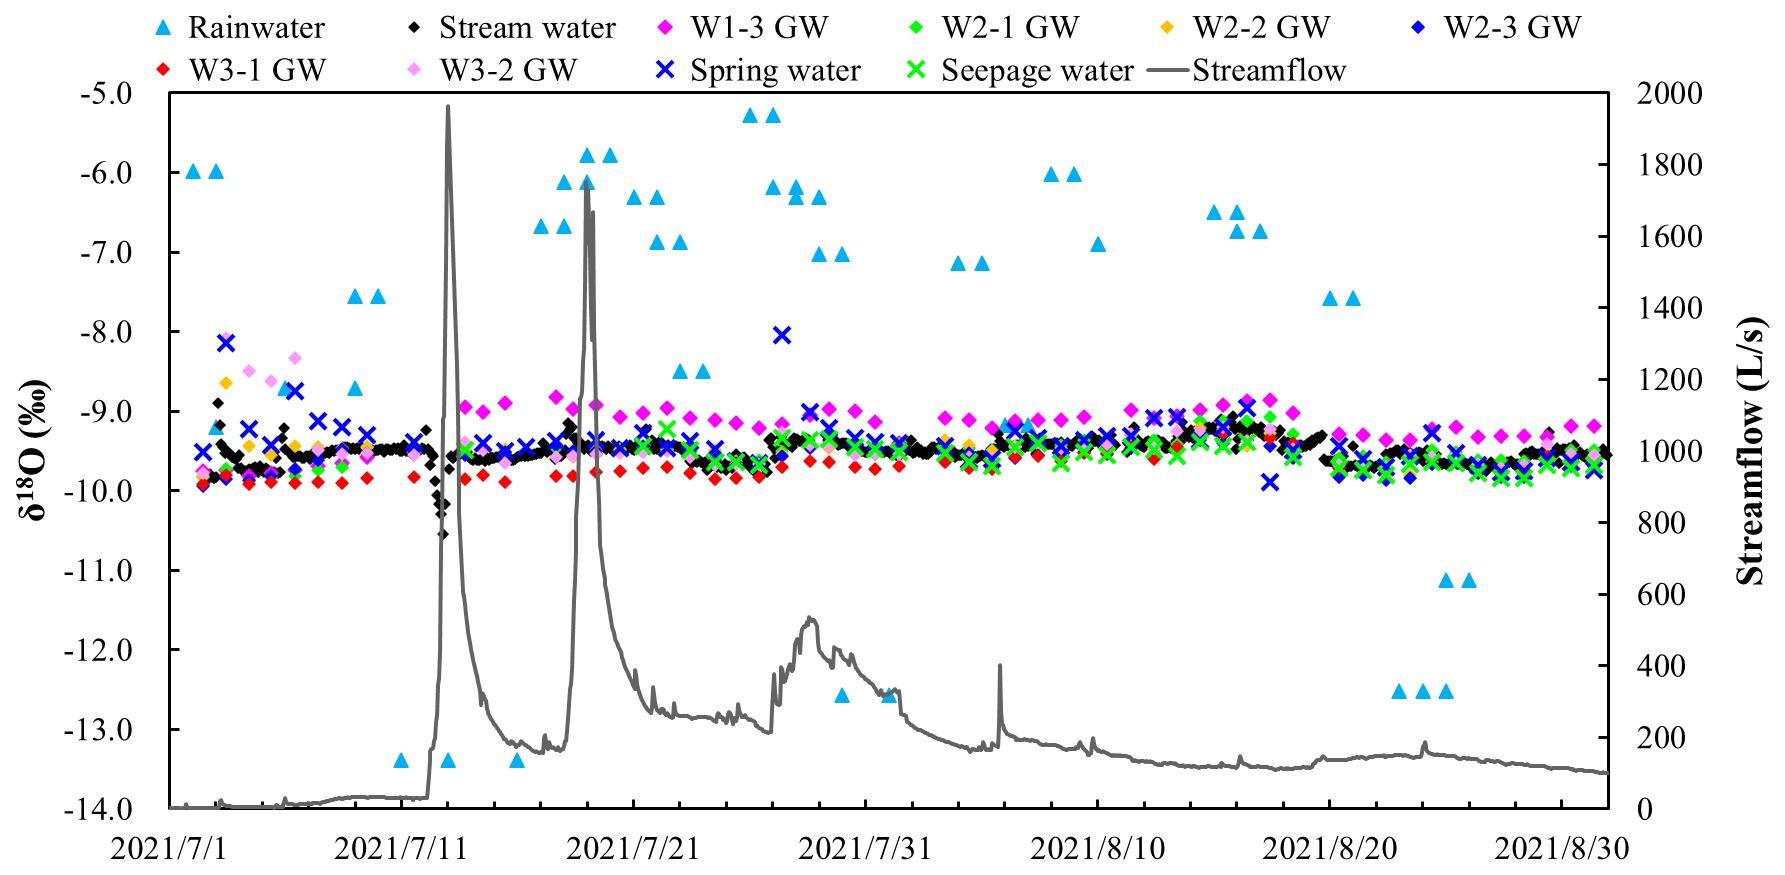
To gain additional insight into the control of groundwater level on delayed stormflow, the isotope compositions of different waterbodies were analyzed. Figure 10 summarizes the δ18O of stream, spring, and seepage water and the groundwater δ18O from all boreholes between 1 July and 1 September 2021. Rainwater exhibited a high variation in δ18O composition (ranging from −14.42 to −5.28 ‰), with a rainfall-weighted mean δ18O value of −9.197‰. In contrast, groundwater δ18O composition appeared more stable throughout the sampling period, showing little variation across various boreholes, with the mean δ18O value ranging from −9.76 ± 0.10 to −9.08 ± 0.86 ‰. This stability indicates minimal event-based mixing with rainwater. The δ18O values of spring and seepage water followed a pattern similar to that of groundwater. The average δ18O value of the stream (−9.51 ‰) closely resembled that of groundwater (−9.49 ‰). Although the stream's δ18O composition briefly deviated toward that of rainfall during a storm, it quickly reverted to its previous value, resembling groundwater. Large isotopic variation in rainfall was dampened in the stream, indicating that both baseflow and some stormflow originated from groundwater storage with a consistent isotopic ratio, which is a result of dispersion and mixing processes.
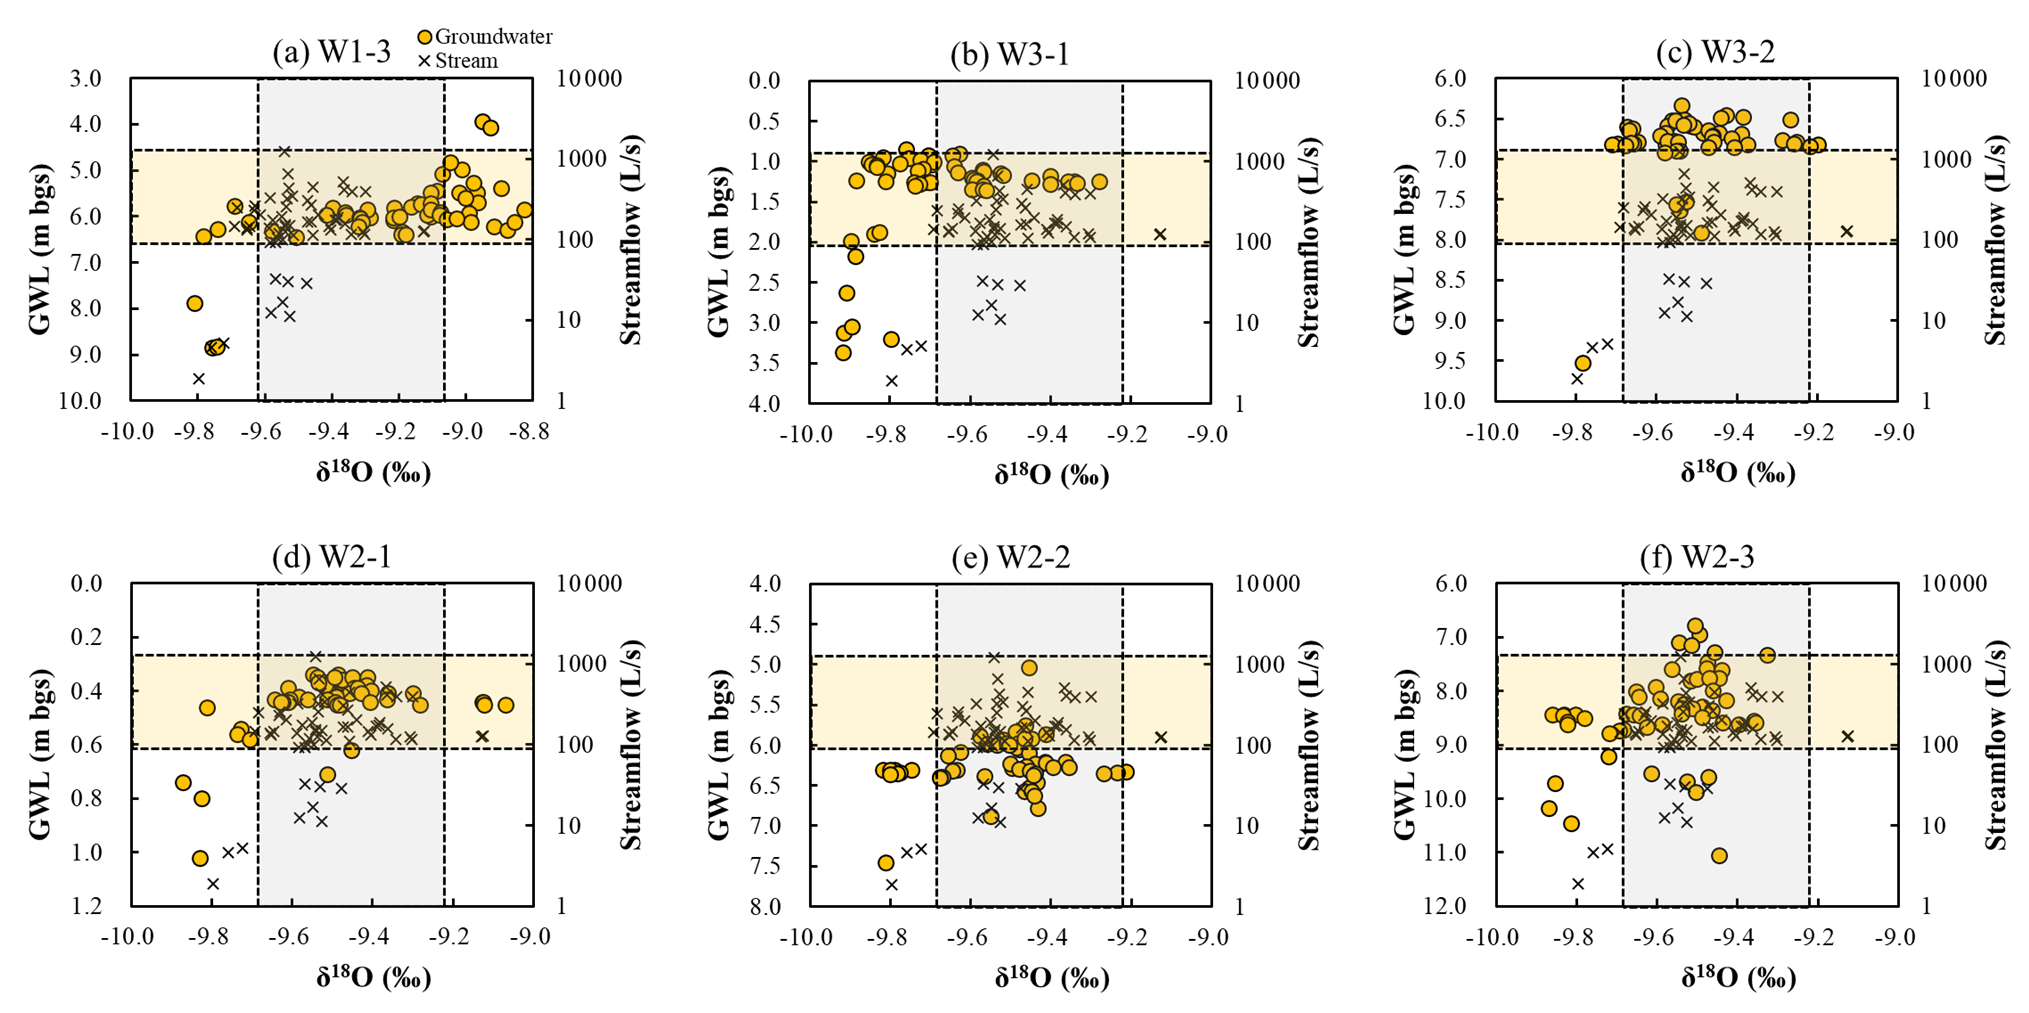
Figure 11δ18O measurements in groundwater and stream water from 1 July to 1 September 2021. Circles and crosses represent the δ18O of groundwater and stream water, respectively.
In Fig. 11, groundwater δ18O values were plotted against groundwater levels for each borehole and stream water δ18O values were plotted against streamflow. The variability in groundwater δ18O increased with rising groundwater levels, suggesting a stronger influence of rainwater on groundwater. Stream water's δ18O remained independent of streamflow volume and exhibited a range of variation similar to that of groundwater. Notably, the overlapping isotopic compositions, including those during stormflow, were predominantly found in regions with higher groundwater levels. This observation underscores that even during stormflow events, groundwater remains the primary source of streamflow.
4.1 Lag time of delayed streamflow peaks
The lag time of delayed peaks varies across different water sources, providing valuable insights into estimating stormflow water resources. Haga et al. (2005) conducted relevant studies in a forested unchanneled catchment, noting that events with shorter lag times (< 2 h) predominantly exhibited runoff that was composed of saturation excess overland flow near the spring area. In contrast, events with longer lag times (> 24 h) were characterized by river runoff mainly composed of saturated subsurface flow above the soil–bedrock interface. Becker (2005) synthesized lag times from various studies in different basins, observing a trend where lag times for the three main flow components differed by at least 1 order of magnitude following the pattern of overland flow < subsurface flow < baseflow. This substantial difference in lag times is likely attributed to the stochastic triggering of different flow paths by rainfall forcing in distinct events.
Lag times for the direct streamflow peaks, observed in both unimodal and bimodal events in this study, were generally within 30 min. These lag times exhibited no significant correlation with rainfall amount, rainfall intensity, or pre-event streamflow (correlation coefficients of 0.005, 0.017, and 0.012, respectively). This lack of correlation suggests that the direct streamflow peaks were nearly concurrent with rainfall. Therefore, we infer that these direct peaks were generated through either bypass flow mechanisms, such as macropores, fractures, or soil–bedrock interfaces, as interpreted in Buttle and Turcotte (1999), Onda et al. (2001), Uchida et al. (2005), and Xu et al. (2016). Alternatively, they could have been directly contributed to the channel by rainfall. This interpretation aligns with the consideration that the routing time of the river network in XEW is approximately 1 h (Zhao et al., 2019).
Table 3Lag time between the peak rainfall intensity and the delayed streamflow peak in this study and in previous studies.
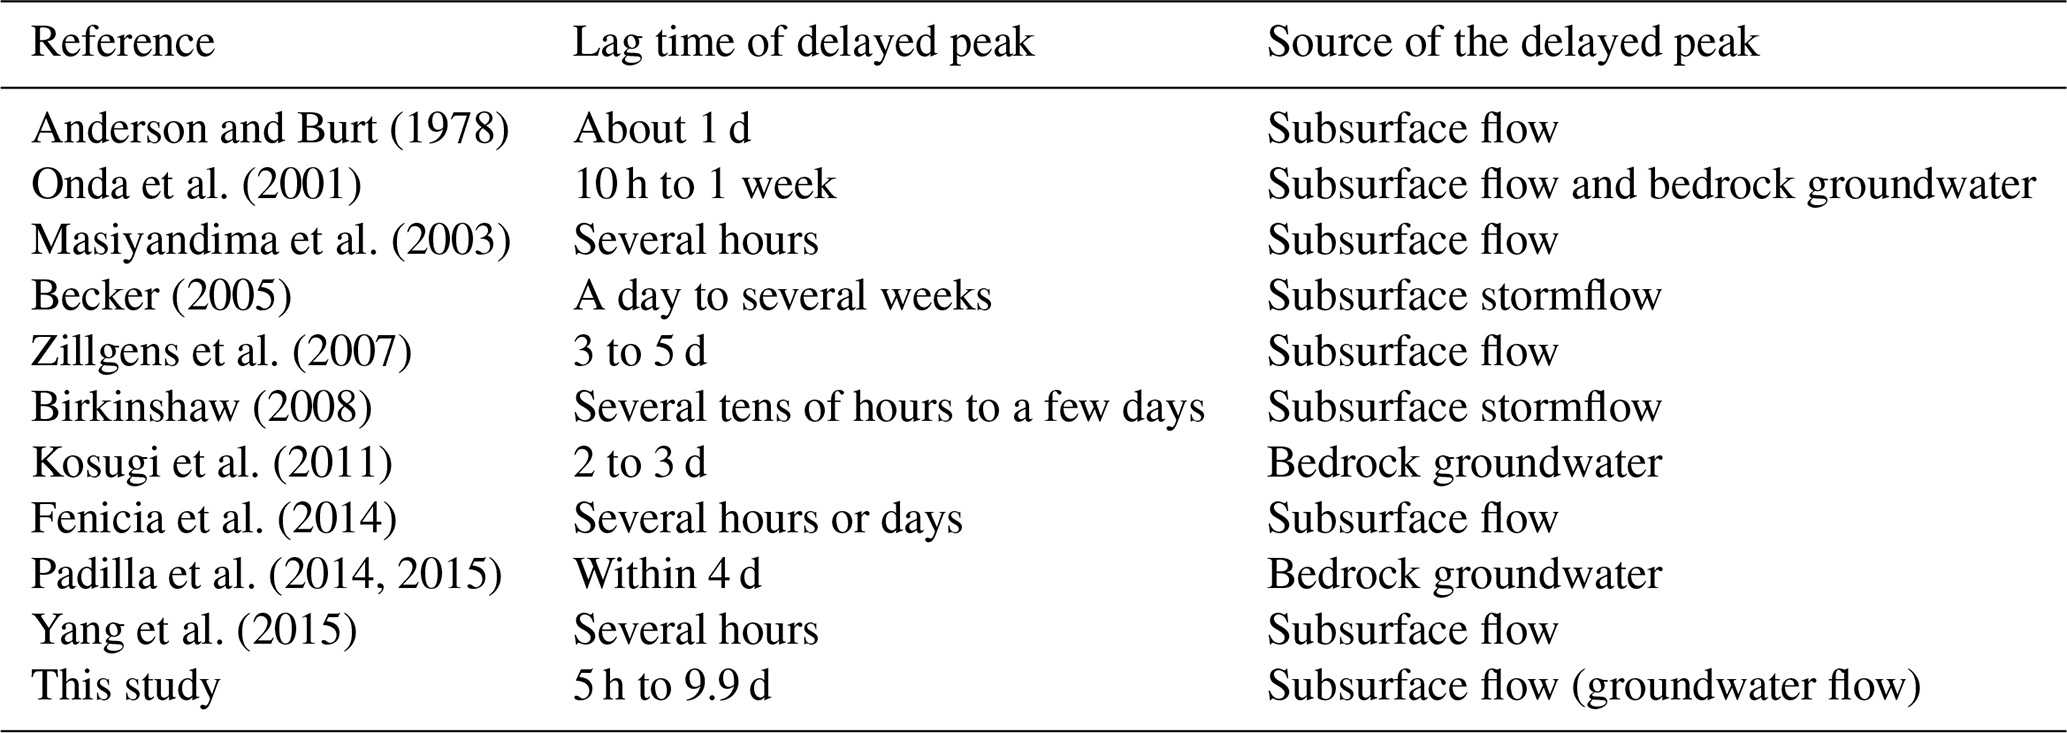
In contrast to the direct peaks, the time lags from the peak rainfalls to the delayed peaks were considerably longer, ranging from 5 h to 9.9 d (Fig. 3). This lag time in our study aligns with findings from other studies where similar parameters were calculated (refer to Table 3). The results imply that the delayed peaks observed in XEW were likely generated by subsurface flow processes, as indicated in the work of Lischeid et al. (2002).
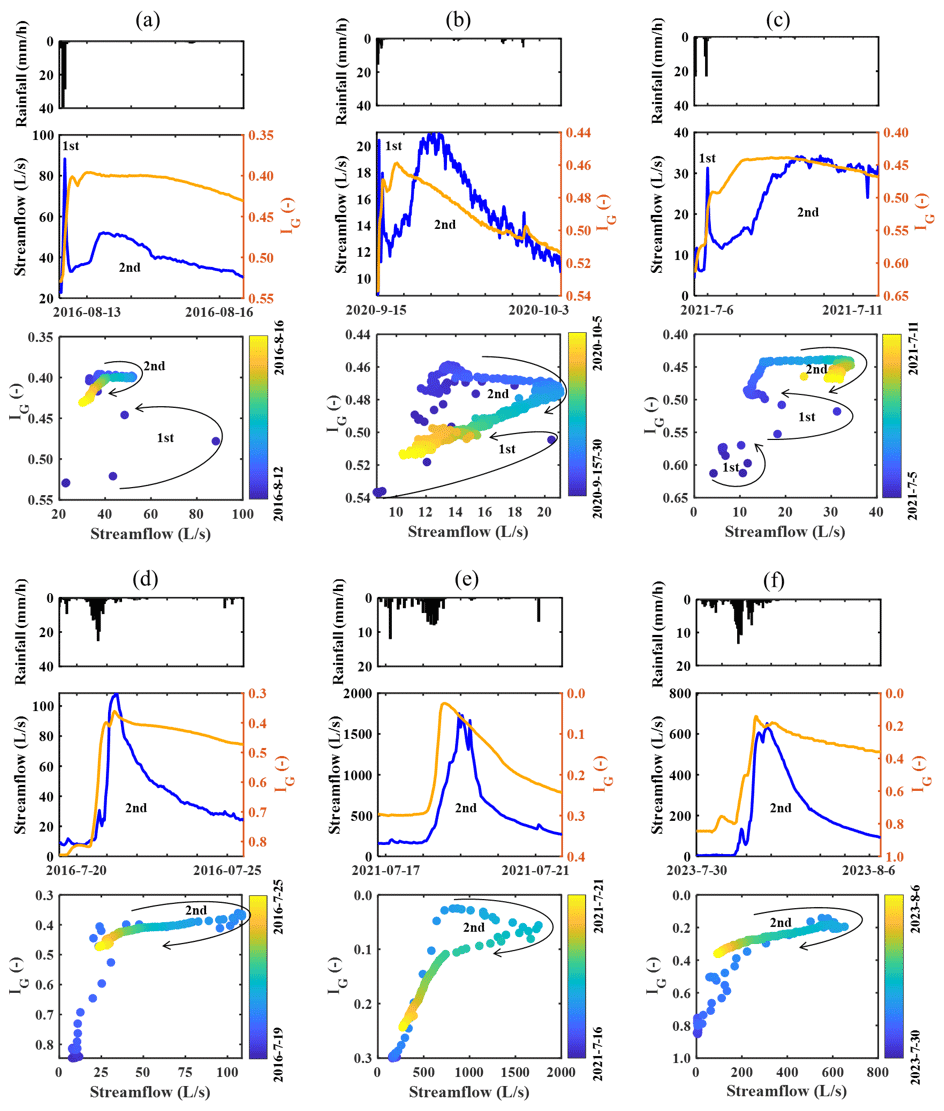
Figure 12Streamflow and IG with corresponding scatterplots between both variables for three typical bimodal and three hybrid bimodal events. Note that the axis scales vary between events. Arrows indicate progression of time. Direct peaks in bimodal hydrographs are indicated by 1st and delayed peaks by 2nd.
4.2 Hysteresis between groundwater level and streamflow
For bimodal events in XEW, the non-linear relationship between groundwater level and streamflow results in hysteretic relationships between the two variables. Figure 12 shows time series for streamflow and IG as well as scatterplots comparing the two variables for the six events used in Sect. 3.3. As noted by Dunne (1978), when two runoff peaks appear in an event, there must be at least two zones in the catchment that respond to the storm and contribute to runoff. The hysteretic nature highlights the possibility of multiple hydrological compartments being active, and these compartments are not necessarily contributing significant flows simultaneously but rather sequentially during the runoff generation period (Fovet et al., 2015; Martínez-Carreras et al., 2016).
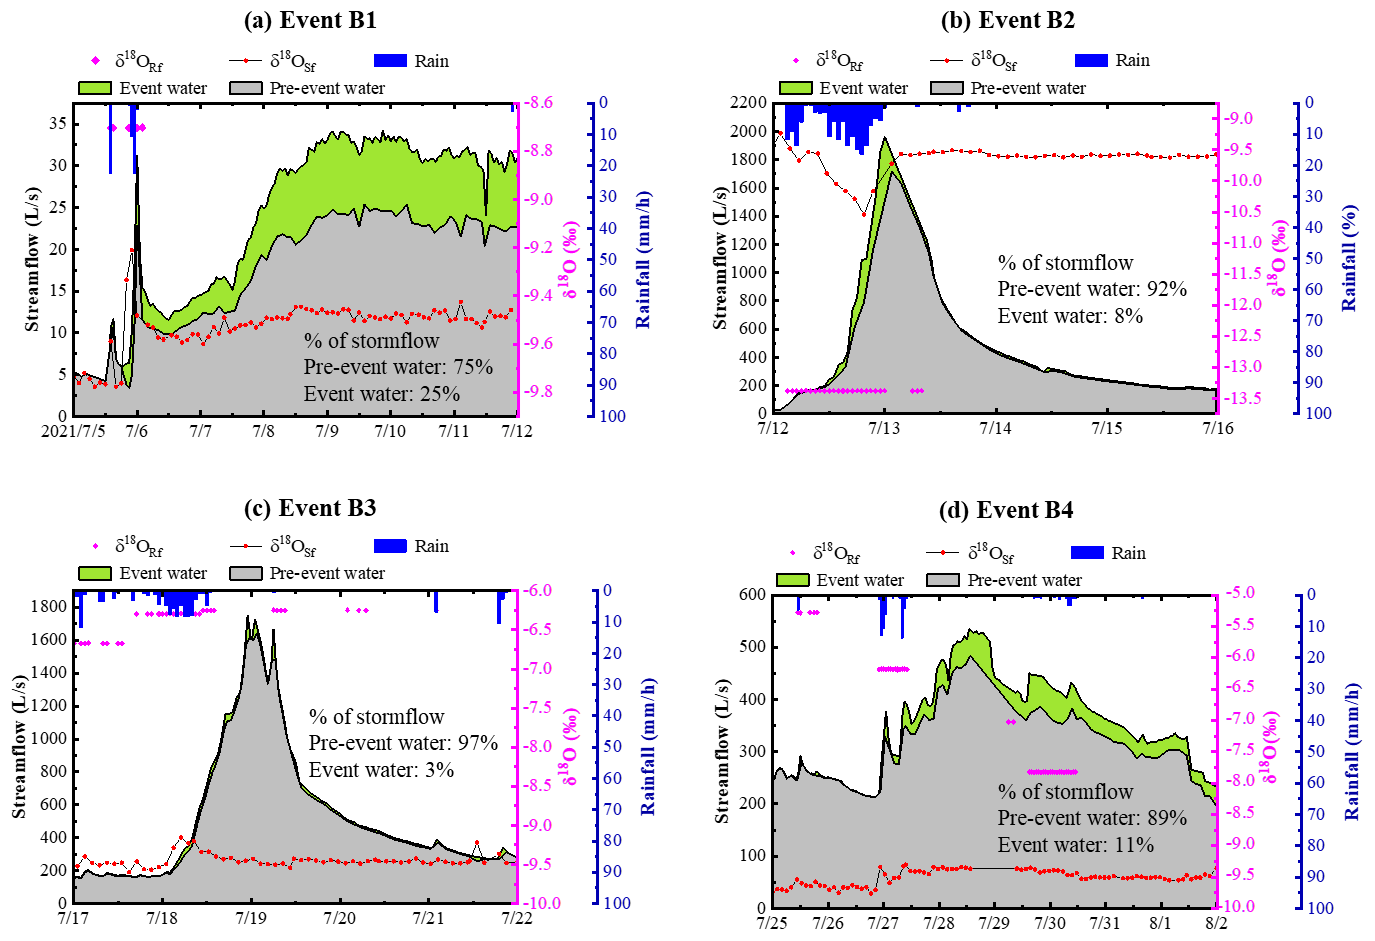
Figure 13The partitioning of stormflow into its pre-event and event water sources using one-tracer two-component hydrograph separation analysis with δ18O as the tracer for the four storm events. δ18ORf and δ18OSf are the δ18O, respectively, for rain- and stream water.
Streamflow increased quickly and peaked before groundwater level during direct peaks, resulting in an counterclockwise hysteretic loop. It can be explained that direct peaks were formed by rainfall directly falling onto the channel or a saturation zone near the channel and/or by the flow that contributed to the channel through rapid routes, as observed in other watersheds by Jackisch et al. (2016). In contrast, groundwater level peaked first during delayed peaks, indicating that the groundwater level in the watershed peaked first and subsequently released water, creating the delayed runoff peak. This behavior may be attributed to the groundwater level surpassing a threshold for generating bimodal hydrographs, leading to enhanced hydraulic connectivity between hillslopes and the channel. This, in turn, resulted in the swift release of a substantial amount of groundwater or subsurface flow (Burt and Butcher, 1985; Detty and McGuire, 2010; McGlynn and McDonnell, 2003; McGuire and McDonnell, 2010; Scaife and Band, 2017). Consequently, the groundwater level is not merely a passive feature in this watershed, where shallow groundwater may constitute the primary runoff component, but it actively controls the stormflow.
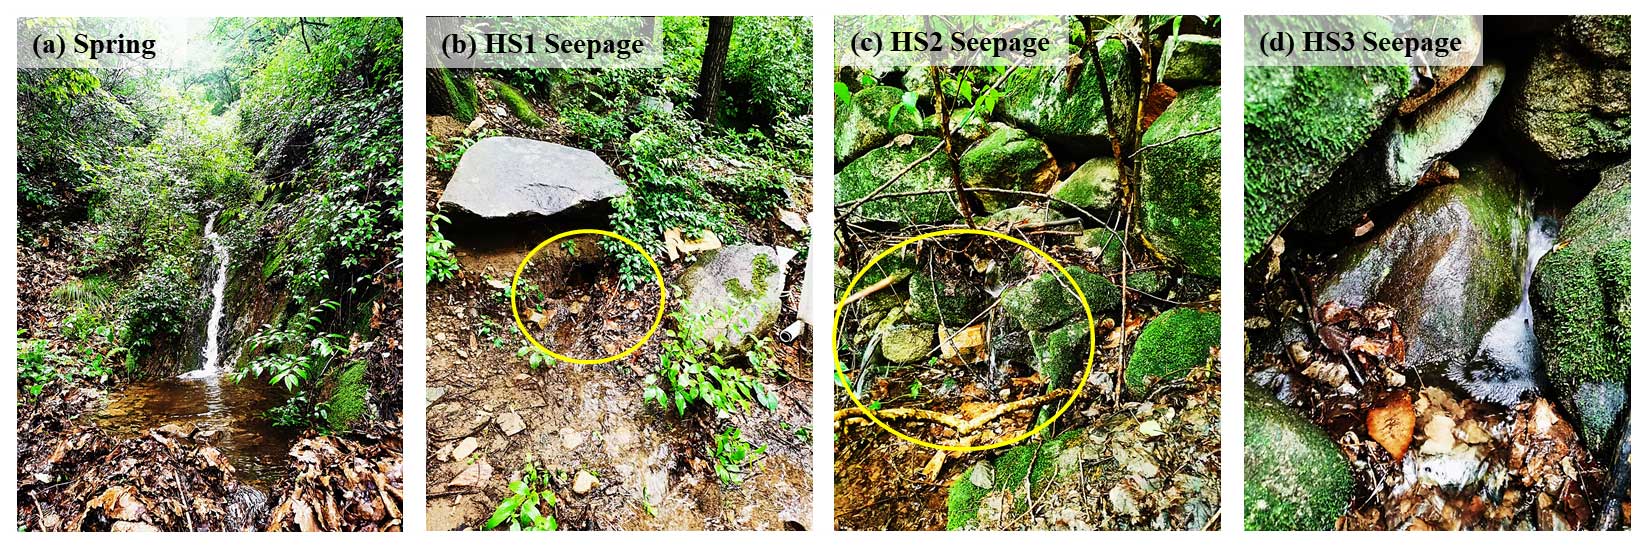
Figure 14Field observations of the spring and the seepage flows. HS1, HS2, and HS3 are Hillslope 1, Hillslope 2, and Hillslope 3, respectively.
4.3 Two-component hydrograph separation
The two-component hydrograph separation was performed for four bimodal storm events using the δ18O of the bulk rainfall, a pre-event water signature (represented by the stream δ18O before the rainfall) and the monitored stream water signature during the events. These four events were chosen because of their relatively complete isotope data. It should be noted that in all four rainfall events, δ18O values in rain and stream water were notably different, which is a requirement for end-member hydrograph separation analysis. The hydrograph separation results as well as the δ18O series of rainwater and stream water are shown in Fig. 13.
Regarding the water source separation result, these four events can be divided into two groups, the first being Event B1 and B4, where the major stormflow process were lagging behind and considerably damp and event water contributions were higher compared to the other two events. The fraction of event water comprising the hydrograph was 25 % in Event B1, and the contribution ratio of event water in Event 4 was 11 %. Considering that the rain had already stopped, the event water component of the delayed peak should be the rainwater temporarily stored in the watershed during the rainfall process. Event B2 and especially Event B3, however, were almost entirely pre-event-water-dominated (the contributions of pre-event water were 92 % for Event 2 and 97 % for Event B3); although it was evident that some event water contributed to the stormflow during the rising and peak period of streamflow, this water may have originated from the direct rainfall or rainwater taking a rapid route to the stream channel.
The hydrograph separation results indicated that the streamflow contribution of pre-event water changed virtually in sync with streamflow following the onset of rain, almost entirely dominating the hydrograph, while event water dominated the sharp streamflow peak that responds to high-intensity storm. Early in the rainy event, the pre-event component of the hydrograph exceeded 50 %, indicating a sufficiently swift groundwater response such that considerable amounts of groundwater were released soon after the start of rain.
In addition, there was a noticeable, gradual rise in the pre-event water contribution to total stormflow as the catchment was wetting up (Fig. 13). Event B1 had a rather dry antecedent condition and showed a relatively lower pre-event water percentage (about 75 %). Event 3 in the temporal sequence had an extremely high pre-event water proportion (of approximately 97 %) and occurred under highly wet antecedent conditions. In Event B4, due to a slightly reduced wetness condition compared to Event B3 preceding it, the percentage of pre-event water somewhat decreased to approximately 89 %. This pattern may be attributed to increased water flux during the wetting-up process, when the water table rose into near-surface soil layers with highly saturated hydraulic conductivity. The rate of groundwater increase slowed as a result of the higher transmissivity, and more pre-event water was mobilized and traveled rapidly to the stream via shallow flow pathways (Lundin, 1982).
4.4 Filed observation
Our field observations on site indicate that direct exfiltration of groundwater into the runoff is predominant, with few signs of hillslope overland flow. For example, during a heavy storm on 5 July 2021 characterized by short duration (7 h) and very high intensity (27.6 mm h−1), with a total rainfall of 65.2 mm, minimal overland flow was observed at the study site. However, after the storm on 5 July, the spring water flow from Hillslope 2 substantially increased. Moreover, at various points in the watershed, seepage flow was observed to be gushing from fractures in the stone and holes in the earth. These field observations strongly suggest the direct exfiltration of groundwater into the runoff, providing further support to the notion that groundwater significantly contributes to stormflow in the watershed.
Based on observations from 2013 to 2023, the study carried out an event-scale analysis of streamflow hydrographs in a semi-humid forested watershed of north China. Three stormflow patterns with a distinctly shaped hydrograph, i.e. unimodal, bimodal, and hybrid bimodal were identified. Particularly, their rainfall–runoff response characteristics as well the stormflow composition were analyzed, and the following conclusions were derived:
-
Direct peaks for both unimodal and bimodal events occurred within 1 h following the peak rainfall, while the lag time of delayed peaks ranged between 5 h and 9.9 d. The stormflow amount generated by bimodal events, due to the delayed peak, was several to hundreds of times higher than that of the unimodal events, often resulting in flooding.
-
Delayed stormflow appeared when the sum of the event rainfall amount (P) and antecedent soil moisture index (ASI) exceeded 200 mm. Stormflow yield is positively proportional to event peak groundwater level, while the lag time of delayed peak showed an inverse correlation with peak groundwater level.
-
The isotopic analysis and two-component hydrograph separation unveiled that pre-event water predominantly contributed to the delayed stormflow, with event water dominating the sharp streamflow peak in response to high-intensity storms.
-
Streamflow peaked before groundwater level during direct peaks, suggesting that direct streamflow peaks are a consequence of direct rainfall onto the channel or rapid flow through macropores and bedrock fractures. Discharge peaked before catchment storage during single peak, but groundwater levels peaked first during delayed streamflow, suggesting that the delayed stormflow is primarily made up of shallow groundwater, and this is further supported by field observation.
This study clarified the prerequisites for bimodal stormflow, and the provided information on the response characteristics and water resources of stormflow is not common knowledge for many regions. We believe these findings can enrich runoff generation theory and contribute new insights into stormflow modeling in other similar regions.
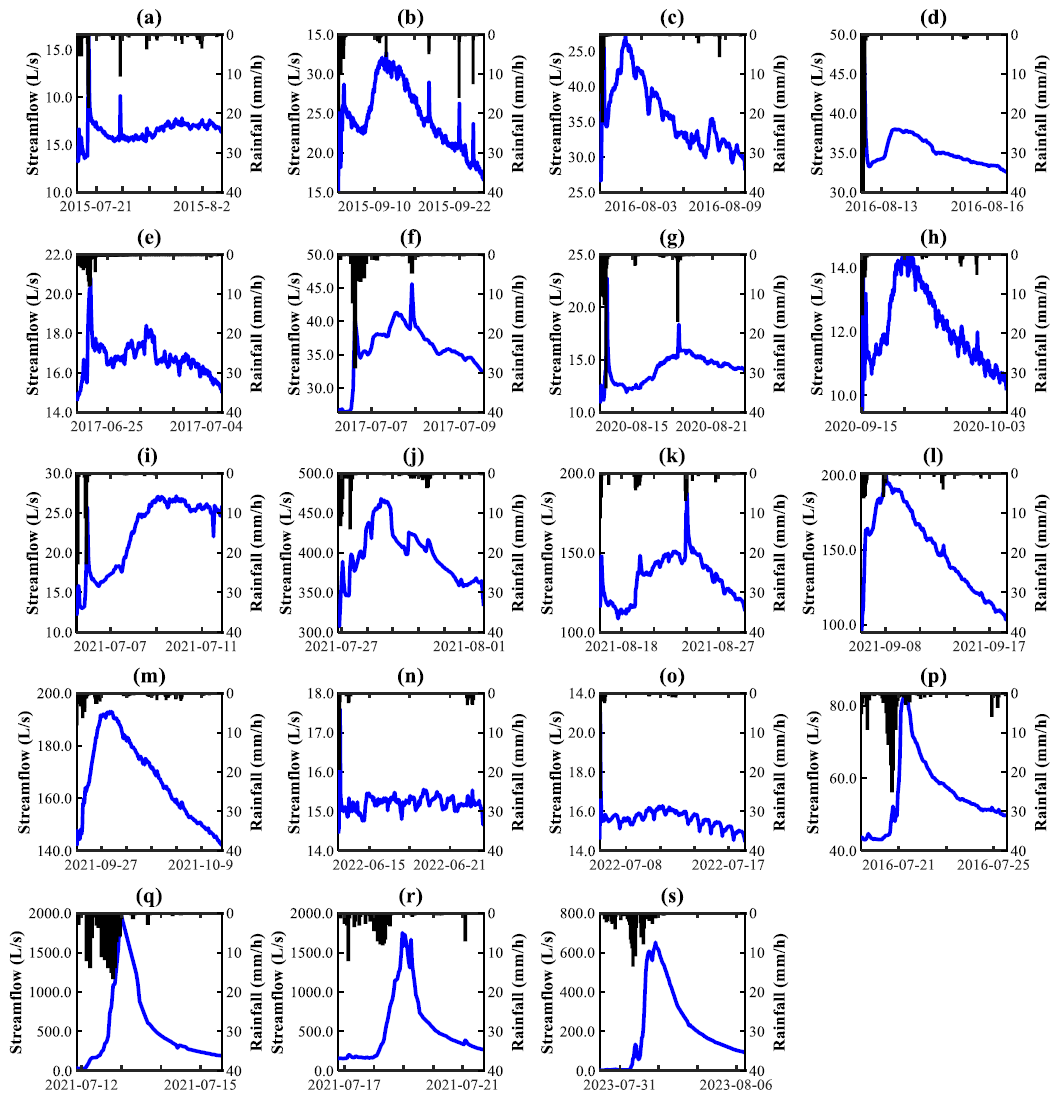
Figure A1Rainfall and streamflow hydrograph for (a–o) 15 bimodal and (p–s) 4 hybrid bimodal events.
The data supporting this study are available on Zenodo at https://doi.org/10.5281/zenodo.12581739 (Cui, 2024).
ZC contributed to the conceptualization, formal analysis, investigation, and writing. FT contributed to the conceptualization, formal analysis, and revision. ZZ, ZX, YD, and JW contributed to the investigation. MYAK contributed to the writing.
At least one of the (co-)authors is a member of the editorial board of Hydrology and Earth System Sciences. The peer-review process was guided by an independent editor, and the authors also have no other competing interests to declare.
Publisher's note: Copernicus Publications remains neutral with regard to jurisdictional claims made in the text, published maps, institutional affiliations, or any other geographical representation in this paper. While Copernicus Publications makes every effort to include appropriate place names, the final responsibility lies with the authors.
We would like to thank Jeffrey McDonnell for his constructive advice on this study. Additionally, we are grateful to the two anonymous reviewers for their valuable feedback during the revision process.
This research has been supported by the National Natural Science Foundation of China (grant no. 51825902) and the National Key Research and Development Program of China (grant no. 2022YFC3002902).
This paper was edited by Lixin Wang and reviewed by two anonymous referees.
Anderson, M. G. and Burt, T. P.: Automatic monitoring of soil moisture conditions in a hillslope spur and hollow, J. Hydrol., 33, 0–36, https://doi.org/10.1016/0022-1694(77)90096-8, 1977.
Anderson, M. G. and Burt, T. R.: The role of topography in controlling throughflow generation, Earth Surf. Processes, 3, 331–334, https://doi.org/10.1002/esp.3290030402, 1978.
Becker, A.: Runoff Processes in Mountain Headwater Catchments: Recent Understanding and Research Challenges, Global Change and Mountain Regions, 283–295, https://doi.org/10.1007/1-4020-3508-x_29, 2005.
Becker, A. and McDonnell, J. J.: Topographical and ecological controls of runoff generation and lateral flows in mountain catchments, IAHS Publ., 248, 199–206, 1998.
Birkinshaw, S. J.: Physically-based modelling of double-peak discharge responses at Slapton Wood catchment, Hydrol. Process., 22, 1419–1430, https://doi.org/10.1002/hyp.6694, 2008.
Burt, T. P. and Butcher, D. P.: Topographic controls of soil moisture distributions, J. Soil Sci., 36, 469–486, https://doi.org/10.1111/j.1365-2389.1985.tb00351.x, 1985.
Buttle, J. M. and Turcotte, D. S.: Runoff processes on a forested slope on the Canadian Shield, Hydrol. Res., 30, 1–20, https://doi.org/10.1016/S0304-2995(99)80027-8, 1999.
Buttle, J. M., Dillon, P. J., and Eerkes, G. R.: Hydrologic coupling of slopes, riparian zones and streams: An example from the Canadian Shield, J. Hydrol., 287, 161–177, https://doi.org/10.1016/j.jhydrol.2003.09.022, 2004.
Cui, Z.: Xitaizi Experimental Watershed dataset, Beijing, China, Zenodo [data set], https://doi.org/10.5281/zenodo.12581739, 2024.
Detty, J. M. and Mcguire, R. J.: Threshold changes in storm runoff generation at a till-mantled headwater catchment, Water Resour. Res., 46, 759–768, https://doi.org/10.1029/2009wr008102, 2010.
Dingman, S. L.: Physical hydrology, Waveland Press, Long Grove, IL, ISBN 978-1478628070, 2015.
Dubreuil, P. L.: Etude hydrologique de petits bassins en Cote d'Ivoire, Rapport general, ORSTOM Service Hydrologique, Paris, France, 1960.
Dubreuil, P. L.: Review of field observations of runoff generation in the tropics, J. Hydrol., 80, 237–264, https://doi.org/10.1016/0022-1694(85)90119-2, 1985.
Dunne, T.: Field studies of hillslope flow processes, in: Hillslope Hydrology, edited by: Kirkby, M. J., Wiley, London, ISBN 978-0470211371, 227–293, 1978.
Fenicia, F., Kavetski, D., Savenije, H. H., Clark, M. P., Schoups, G., Pfister, L., and Freer, J.: Catchment properties, function, and conceptual model representation: is there a correspondence?, Hydrol. Process., 28, 2451–2467, https://doi.org/10.1002/hyp.9726, 2014.
Fovet, O., Ruiz, L., Hrachowitz, M., Faucheux, M., and Gascuel-Odoux, C.: Hydrological hysteresis and its value for assessing process consistency in catchment conceptual models, Hydrol. Earth Syst. Sci., 19, 105–123, https://doi.org/10.5194/hess-19-105-2015, 2015.
Fu, C., Chen, J., Jiang, H., and Dong, L.: Threshold behavior in a fissured granitic catchment in southern China: 1. Analysis of field monitoring results, Water Resour. Res., 49, 2519–2535, https://doi.org/10.1002/wrcr.20191, 2013.
Graeff, T., Zehe, E., Reusser, D., Lück, E., Schröder, B., Wenk, G., John, H., and Bronstert, A.: Process identification through rejection of model structures in a mid-mountainous rural catchment: observations of rainfall–runoff response, geophysical conditions and model inter-comparison, Hydrol. Process., 23, 702–718, https://doi.org/10.1002/hyp.7171, 2009.
Gu, W.: On the hydrograph separation traced by environmental isotopes, Adv. Water Sci., 7, 105–111, 1996.
Haga, H., Matsumoto, Y., Matsutani, J., Fujita, M., Nishida, K., and Sakamoto, Y.: Flow paths, rainfall properties, and antecedent soil moisture controlling lags to peak discharge in a granitic unchanneled catchment, Water Resour. Res., 41, 2179–2187, https://doi.org/10.1029/2005wr004236, 2005.
Haught, D. R. W. and Van Meerveld, H. J.: Spatial variation in transient water table responses: differences between an upper and lower hillslope zone, Hydrol. Process., 25, 3866–3877, https://doi.org/10.1002/hyp.8354, 2011.
Iwagami, S., Tsujimura, M., Onda, Y., Shimada, J., and Tanaka, T.: Role of bedrock groundwater in the rainfall–runoff process in a small headwater catchment underlain by volcanic rock, Hydrol. Process., 24, 2771–2783, https://doi.org/10.1002/hyp.7690, 2010.
Jackisch, C., Angermann, L., Allroggen, N., Sprenger, M., Blume, T., Tronicke, J., and Zehe, E.: Form and function in hillslope hydrology: in situ imaging and characterization of flow-relevant structures, Hydrol. Earth Syst. Sci., 21, 3749–3775, https://doi.org/10.5194/hess-21-3749-2017, 2017.
Jenkins, A., Ferrier, R. C., Harriman, R., and Ogunkoya, Y. O.: A case study in catchment hydrochemistry: Conflicting interpretations from hydrological and chemical observations, Hydrol. Process., 8, 335–349, https://doi.org/10.1002/hyp.3360080406, 1994.
Kosugi, K., Fujimoto, M., Katsura, S., Kato, H., Sando, Y., and Mizuyama, T.: Localized bedrock aquifer distribution explains discharge from a headwater catchment, Water Resour. Res., 47, W07530, https://doi.org/10.1029/2010WR009884, 2011.
Lischeid, G., Kolb, A., and Alewell, C.: Apparent translatory flow in groundwater recharge and runoff generation, J. Hydrol., 265, 195–211, https://doi.org/10.1016/s0022-1694(02)00108-7, 2002.
Lundin, L.: Soil moisture and ground water in till soil and the significance of soil type for runoff, PhD thesis, Uppsala University, UNGI Report, 56, 216, 1982.
Martínez-Carreras, N., Wetzel, C. E., Frentress, J., Ector, L., McDonnell, J. J., Hoffmann, L., and Pfister, L.: Hydrological connectivity inferred from diatom transport through the riparian-stream system, Hydrol. Earth Syst. Sci., 19, 3133–3151, https://doi.org/10.5194/hess-19-3133-2015, 2015.
Martínez-Carreras, N., Hissler, C., Gourdol, L., Klaus, J., Juilleret, J., Iffly, J. F., and Pfister, L.: Storage controls on the generation of double peak hydrographs in a forested headwater catchment, J. Hydrol., 543, 255–269, https://doi.org/10.1016/j.jhydrol.2016.10.004, 2016.
Masiyandima, M. C., van de Giesen, N., Diatta, S., Windmeijer, P. N., and Steenhuis, T. S.: The hydrology of inland valleys in the sub-humid zone of West Africa: rainfall–runoff processes in the M'be experimental watershed, Hydrol. Process., 17, 1213–1225, https://doi.org/10.1002/hyp.1191, 2003.
McDonnell, J. J., Bonell, M., Stewart, M. K., and Pearce, A. J.: Deuterium variations in storm rainfall: Implications for stream hydrograph separation, Water Resour. Res., 26, 455–458, https://doi.org/10.1029/WR026i003p00455, 1990.
McDonnell, J. J., Sivapalan, M., Vaché, K., Dunn, S., Grant, G., Haggerty, R., Hinz, C., Hooper, R., Kirchner, J., Roderick, M. L., Selker, J., and Weiler, M.: Moving beyond heterogeneity and process complexity: A new vision for watershed hydrology, Water Resour. Res., 43, W07301, https://doi.org/10.1029/2006WR005467, 2007.
McGlynn, B. L. and McDonnell, J. J.: Quantifying the relative contributions of riparian and hillslope zones to catchment runoff, Water Resour. Res., 39, 1310, https://doi.org/10.1029/2003wr002091, 2003.
McGuire, K. J. and McDonnell, J. J.: Hydrological connectivity of hillslopes and streams: Characteristic time scales and nonlinearities, Water Resour. Res., 46, W10543, https://doi.org/10.1029/2010WR009341, 2010.
Mosley, M. P.: Streamflow generation in a forested watershed, New Zealand, Water Resour. Res., 15, 795–806, https://doi.org/10.1029/wr015i004p00795, 1979.
Onda, Y., Komatsu, Y., Tsujimura, M., and Fujihara, J.: The role of subsurface runoff through bedrock on storm flow generation, Hydrol. Process., 15, 1693–1706, https://doi.org/10.1002/hyp.234, 2001.
Onda, Y., Tsujimura, M., Fujihara, J. I., and Ito, J.: Runoff generation mechanisms in high-relief mountainous watersheds with different underlying geology, Hydrol. Process., 331, 659–673, https://doi.org/10.1016/j.jhydrol.2006.06.009, 2006.
Padilla, C., Onda, Y., Iida, T., Takahashi, S., and Uchida, T.: Characterization of the groundwater response to rainfall on a hillslope with fractured bedrock by creep deformation and its implication for the generation of deep-seated landslides on Mt. Wanitsuka, Kyushu Island, Geomorphology, 204, 444–458, https://doi.org/10.1016/j.geomorph.2013.08.024, 2014.
Padilla, C., Onda, Y., and Iida, T.: Interaction between runoff-bedrock groundwater in a steep headwater catchment underlain by sedimentary bedrock fractured by gravitational deformation, Hydrol. Process., 29, 4398–4412, https://doi.org/10.1002/hyp.10498, 2015.
Penna, D., Tromp-van Meerveld, H. J., Gobbi, A., Borga, M., and Dalla Fontana, G.: The influence of soil moisture on threshold runoff generation processes in an alpine headwater catchment, Hydrol. Earth Syst. Sci., 15, 689–702, https://doi.org/10.5194/hess-15-689-2011, 2011.
Phillips, J. D.: Sources of nonlinearity and complexity in geomorphic systems, Prog. Phys. Geog., 27, 1–23, https://doi.org/10.1191/0309133303pp340ra, 2003.
Powell, D. N., Khan, A. A., Aziz, N. M., and Raiford, J. P.: Dimensionless rainfall patterns for South Carolina, J. Hydrol. Eng., 12, 130–133, https://doi.org/10.1061/(asce)1084-0699(2007)12:1(130), 2007.
Rinderer, M., van Meerveld, I., Stähli, M., and Seibert, J.: Is groundwater response timing in a pre‐alpine catchment controlled more by topography or by rainfall?, Hydrol. Process., 30, 1036–1051, https://doi.org/10.1002/hyp.10634, 2016.
Ross, C. A., Ali, G. A., Spence, C., and Courchesne, F.: Evaluating the Ubiquity of Thresholds in Rainfall-Runoff Response Across Contrasting Environments, Water Resour. Res., 57, e2020WR027498, https://doi.org/10.1029/2020wr027498, 2021.
Scaife, C. I. and Band, L. E.: Nonstationarity in threshold response of stormflow in southern Appalachian headwater catchments, Water Resour. Res., 53, 6579–6596, https://doi.org/10.1002/2017WR020376, 2017.
Sloto, R. A. and Crouse, M. Y.: HYSEP: A computer program for streamflow hydrograph separation and analysis, US Geol. Surv., https://doi.org/10.3133/wri964040, 1996.
Tian, F., Li, H., and Sivapalan, M.: Model diagnostic analysis of seasonal switching of runoff generation mechanisms in the blue river basin, Oklahoma, J. Hydrol., 418–419, 136–149, https://doi.org/10.1016/j.jhydrol.2010.03.011, 2012.
Tie, Q., Hu, H., Tian, F., Guan, H., and Lin, H.: Environmental and physiological controls on sap flow in a subhumid mountainous catchment in north China, Agr. Forest Meteorol., 240–241, 46–57, https://doi.org/10.1016/j.agrformet.2017.03.018, 2017.
Tromp-van Meerveld, H. J. and McDonnell, J. J.: Threshold relations in subsurface stormflow: 1. A 147-storm analysis of the Panola hillslope, Water Resour. Res., 42, W02410, https://doi.org/10.1029/2004WR003778, 2006..
Uchida, T., Tromp-van Meerveld, I., and McDonnell, J. J.: The role of lateral pipe flow in hillslope runoff response: An intercomparison of non-linear hillslope response, J. Hydrol., 311, 117–133, https://doi.org/10.1016/j.jhydrol.2005.01.012, 2005.
Westhoff, M. C., Bogaard, T. A., and Savenije, H. H. G.: Quantifying spatial and temporal discharge dynamics of an event in a first order stream, using distributed temperature sensing, Hydrol. Earth Syst. Sci., 15, 1945–1957, https://doi.org/10.5194/hess-15-1945-2011, 2011.
Weyman, D. R.: Throughflow on hillslopes and its relation to the stream hydrograph, Int. Assoc. Sci. Hydrol. Bull., 15, 25–33, https://doi.org/10.1080/02626667009493969, 1970.
Wrede, S., Fenicia, F., Martínez-Carreras, N., Juilleret, J., Hissler, C., Krein, A., Savenije, H. H. G., Uhlenbrook, S., Kavetski, D., and Pfister, L.: Towards more systematic perceptual model development: a case study using 3 Luxembourgish catchments, Hydrol. Process., 29, 2731–2750, https://doi.org/10.1002/hyp.10393, 2015.
Xu, Q., Liu, H., Ran, J., Li, W., and Sun, X.: Field monitoring of groundwater responses to heavy rainfalls and the early warning of the Kualiangzi landslide in Sichuan Basin, southwestern China, Landslides, 13, 1555–1570, https://doi.org/10.1007/s10346-016-0717-3, 2016.
Yang, Y., Endreny, T. A., and Nowak, D. J.: Simulating double-peak hydrographs from single storms over mixed-use watersheds, J. Hydrol. Eng., 20, 06015003, https://doi.org/10.1061/(ASCE)HE.1943-5584.0001225, 2015.
Zhang, G., Cui, P., Gualtieri, C., Zhang, J., Ahmed Bazai, N., Zhang, Z., Wang, J., Tang, J., Chen, R., and Lei, M.: Stormflow generation in a humid forest watershed controlled by antecedent wetness and rainfall amounts, J. Hydrol., 603, 127107, https://doi.org/10.1016/j.jhydrol.2021.127107, 2021.
Zhao, S., Hu, H., Harman, C. J., Tian, F., Tie, Q., Liu, Y., and Peng, Z.: Understanding of storm runoff generation in a weathered, fractured Granitoid headwater catchment in northern China, Water, 11, 123, https://doi.org/10.3390/w11010123, 2019.
Zillgens, B., Merz, B., Kirnbauer, R., and Tilch, N.: Analysis of the runoff response of an alpine catchment at different scales, Hydrol. Earth Syst. Sci., 11, 1441–1454, https://doi.org/10.5194/hess-11-1441-2007, 2007.