the Creative Commons Attribution 4.0 License.
the Creative Commons Attribution 4.0 License.
 | 26 Jan 2024
Phosphorus supply and floodplain design govern phosphorus reduction capacity in remediated agricultural streams
Faruk Djodjic
Magdalena Bieroza
Agricultural headwater streams are important pathways for diffuse sediment and nutrient losses, requiring mitigation strategies beyond in-field measures to intercept the transport of pollutants to downstream freshwater resources. As such, floodplains can be constructed along existing agricultural streams and ditches to improve fluvial stability and promote deposition of sediments and particulate phosphorus. In this study, we evaluated 10 remediated agricultural streams in Sweden for their capacity to reduce sediment and particulate phosphorus export and investigated the interplay between fluvial processes and phosphorus dynamics. Remediated streams with different floodplain designs (either on one side or both sides of the channel, with different width and elevation) were paired with upstream trapezoidal channels as controls. We used sedimentation plates to determine seasonal patterns in sediment deposition on channel beds and floodplains and monthly water quality monitoring. This was combined with continuous flow discharge measurements to examine suspended sediment and particulate phosphorus dynamics and reduction along reaches. Remediated streams with floodplains on both sides of the channel reduced particulate phosphorus concentrations and loads (−54 µg L−1, −0.21 kg ha−1 yr−1) along reaches, whereas increases occurred along streams with one-sided floodplains (27 µg L−1, 0.09 kg ha−1 yr−1) and control streams (46.6 µg L−1). Sediment deposition in remediated streams was five times higher on channel beds than on floodplains and there was no evident lateral distribution of sediments from channel to floodplains. There was no effect from sediment deposition on particulate phosphorus reduction, suggesting that bank stabilization was the key determinant for phosphorus mitigation in remediated streams, which can be realized with two-sided but not one-sided floodplains. Further, the overall narrow floodplain widths likely restricted reach-scale sediment deposition and its impact on P reductions. To fully understand remediated streams' potential for reductions in both nitrogen and different phosphorus species and to avoid pollution swapping effects, there is a need to further investigate how floodplain design can be optimized to achieve a holistic solution towards improved stream water quality.
- Article
(3151 KB) - Full-text XML
-
Supplement
(12050 KB) - BibTeX
- EndNote


Past and present inputs of bioavailable nutrients for agricultural production continue to negatively impact stream water quality and ecology across aquatic ecosystems globally (Sharpley et al., 2013; Smith, 2003). In particular, phosphorus (P) losses to surface waters play a key role in eutrophication as it is often the limiting element for algal and cyanobacterial growth in freshwater recipients (Correll, 1998). The transport of P from land to rivers and lakes is disproportionately influenced by headwater streams, representing entry points for sediments and nutrients to stream networks. Therefore, the capacity of headwater streams for the processing and removal of pollutants is critical for regulating downstream export (Wollheim et al., 2018). Headwaters in flat agricultural landscapes (< 2 % slopes) commonly comprise artificially straightened and deepened trapezoidal channels (Fig. 1b) that effectively drain excess water from fields and enable crop growth. However, their short water residence time and geomorphic instability also enhance downstream export of suspended sediments (SS) and associated P. Therefore, an improved understanding of the capacity for sediment and nutrient reductions within agricultural stream networks is critical, and increasingly so with a changing climate that accelerates pollution to freshwaters (Ho et al., 2019; Ockenden et al., 2017).
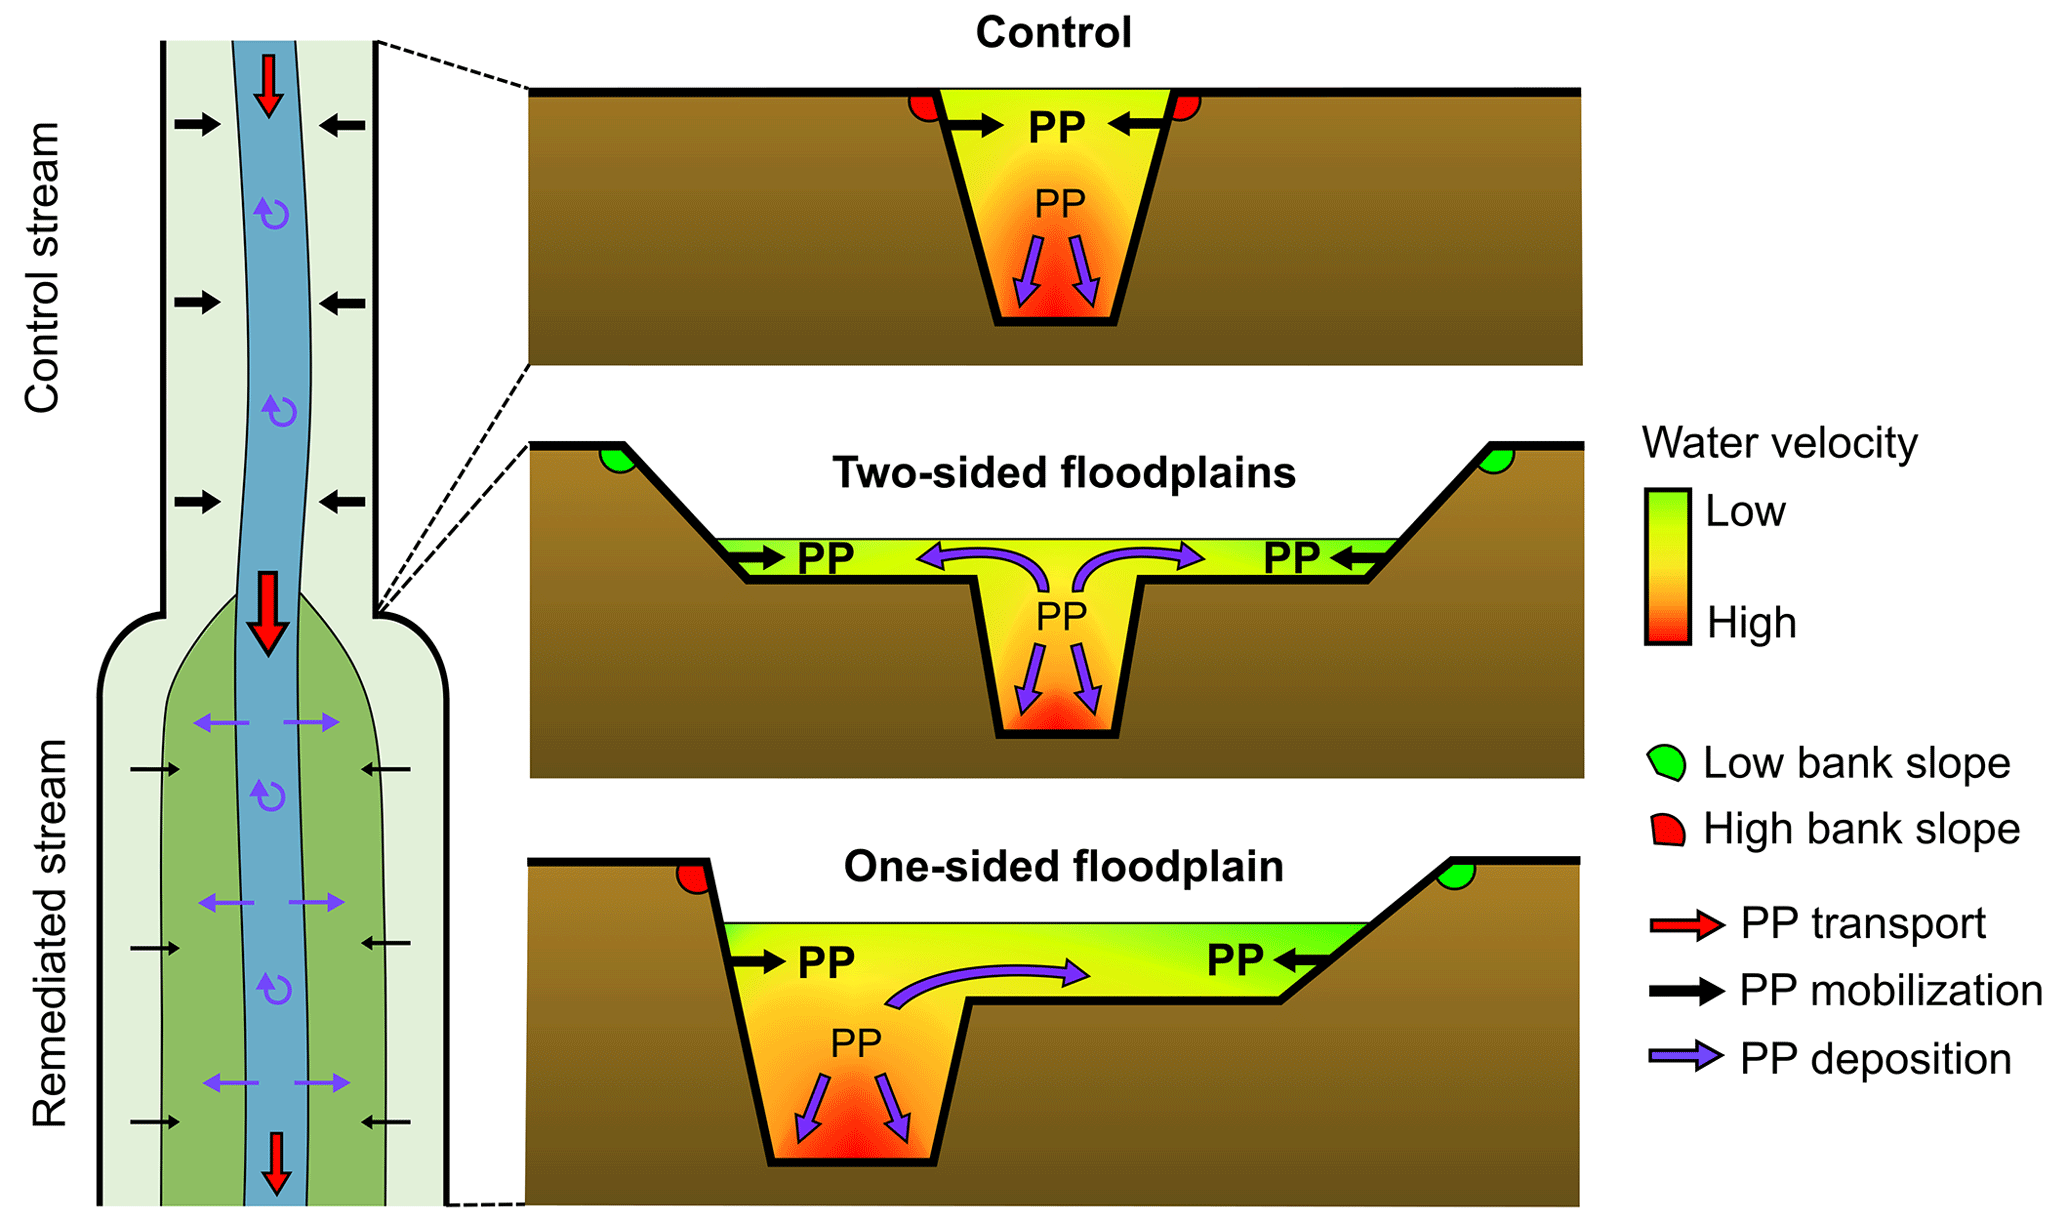
Figure 1Conceptual model of fluvial processes that determine particulate phosphorus (PP) export in remediated vs. control streams. Deposition of PP occurs on channel beds predominantly during lower flows when transport capacity is lower than sediment delivery. During inundation, PP deposition dominates on floodplains, owing to lower water velocities. In two-sided floodplains, streambanks are stabilized during higher flows owing to their lower slopes and lower shear stress from water forces than the inset channel. In one-sided designs, one streambank is steeper and exposed to higher water velocities in the channel, resulting in higher mobilization and transport of PP.
High export of sediments and P from trapezoidal channels, either historically converted from natural streams or artificially introduced, results from altered transport capacity and an imbalance between the catchment's supply and the stream's transporting power (Magner et al., 2012; Simon and Rinaldi, 2006). Internal erosion from trapezoidal channels can therefore contribute with higher sediment and P loads compared with distal sediment sources in catchments (Simon and Rinaldi, 2006). Closely interlinked with sediment conveyance in channels is the instream transport and storage of P, governed by fluvial processes (deposition/resuspension of sediment-bound P; Ballantine et al., 2009; Noe et al., 2019), redox processes (adsorption/desorption of soluble reactive P [SRP] to SS; Sandström et al., 2021) and geomorphic stability (streambank erosion; Fox et al., 2016). Channel bed sediments can store high amounts of P (Ballantine et al., 2009) and although deposition has been found to dominate in headwater reaches owing to stream power limitation (Worrall et al., 2020), sediment-bound P becomes susceptible to remobilization during high flow events (Bowes et al., 2003). Streambank erosion due to bank failures in agricultural streams can also be a significant source of P export, particularly in P-rich bank soils (Fox et al., 2016; Kronvang et al., 2013; Landemaine et al., 2015), but the efficacy of management strategies to counter this remains underexplored.
To reduce erosion and nutrient losses while maintaining drainage capacity, two-stage ditches with lateral floodplains excavated along existing channels have been tested as a stream remediation measure (Powell et al., 2007), with either two narrower or one single wider floodplain (Fig. 1). Here, floodplains refer to 2 to 6 m wide benches that are inundated upon higher flows (D'Ambrosio et al., 2015; Mahl et al., 2015; Powell et al., 2007). The purpose of two-stage designs is to establish a fluvial equilibrium by mimicking natural floodplain formation. Their design can support stable floodplains and banks, aid flood management, and reduce the need for routine dredging and bank restoration (D'Ambrosio et al., 2015; Krider et al., 2017). During higher flows, stream power dissipates as water inundates vegetated floodplains, allowing for reductions in SS and P concentrations by sedimentation (Davis et al., 2015; Mahl et al., 2015), sediment adsorption of SRP (Trentman et al., 2020), and nitrate removal through denitrification (Hallberg et al., 2022; Mahl et al., 2015; Speir et al., 2020). Reductions in SS and P concentrations and loads along remediated streams with a two-stage design are argued to be driven by lateral distribution of sediments from the inset channel onto floodplains during higher flows (Fig. 1), based on monitoring studies (D'Ambrosio et al., 2015; Krider et al., 2017; Mahl et al., 2015) and flume experiments (Bai and Zeng, 2019). To date, studies on sediment delivery in remediated streams have solely relied on either geometric survey data or grab water sampling, with emphasis on investigating its potential for improving geomorphic stability. Therefore, there is a need to explicitly link net P deposition rates and fluvial dynamics in field conditions with observed water quality impacts.
We measured net sedimentation rates and concentrations of P fractions in channel bed and floodplains of ten remediated streams (Fig. 2a) with two-stage design (Fig. 1) with the aim of investigating the spatial and temporal distribution of sediments and the effect on P export and long-term storage. Changes in stream water P concentrations along remediated streams and upstream trapezoidal control streams were compared to determine their reduction efficacy (Fig. 2b). Our objectives were to determine (1) if remediated streams with two-stage design can reduce SS and P export, (2) how floodplain designs (elevation and one- vs. two-sided floodplains) affect reduction capacity, and (3) what factors of transport, erosion and deposition control SS and P reductions. Two types of floodplain designs were compared: one-sided and two-sided floodplains along with a gradient in floodplain elevations and thus inundation frequencies.
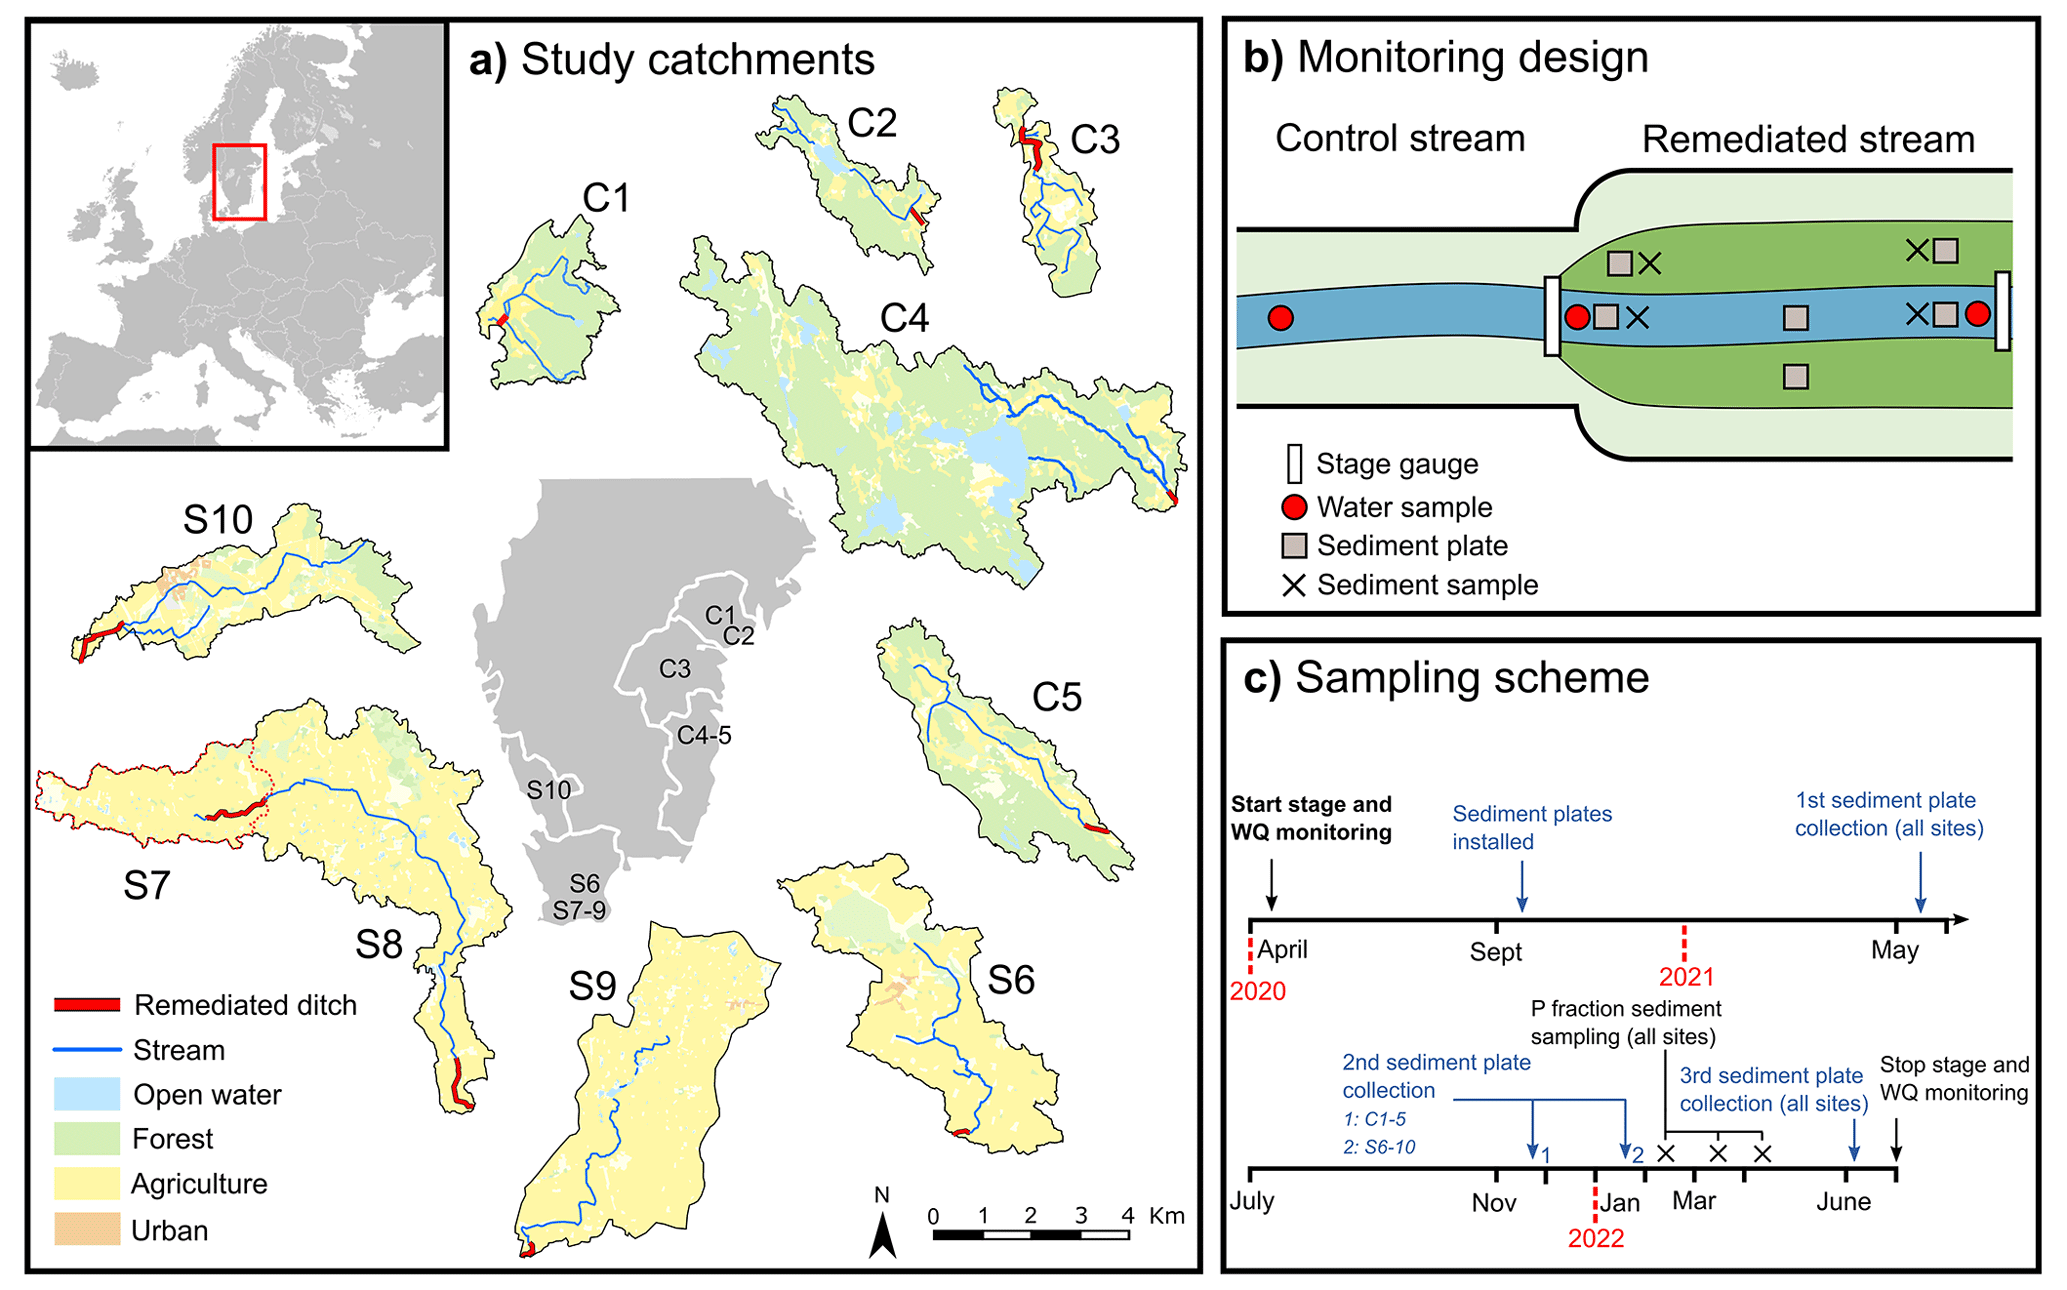
Figure 2(a) Location of the ten catchments with remediated streams in Central East (C1–C5) and South Sweden (S6–S10). (b) Control-impact monitoring design. Sediment samples and water grab samples were collected at the start, middle, and end of remediated reaches and water grab samples were also collected at the start of control reaches. Water stage sensors were placed at the start and end of remediated reaches. (c) Sampling scheme over time of sediments deposited on plates and composite sediments for sequential P fractionation. Land use maps: © Lantmäteriet.
2.1 Site description
Ten study sites were selected with established two-stage ditches (referred to as remediated streams) in Central East (C1–5) and South Sweden (S6–S10; Fig. 2a). The study sites are located in low slope gradient and tile drained agricultural catchments, dominated by winter and spring sown cereal crops and ley grass. A control-impact design was used to compare remediated reaches (0.3 to 1.7 km reach lengths) with upstream, mostly trapezoidal reaches, hereafter referred to as control streams (see Figs. S6–S9 for comparison of profiles). An exception is site C4 where the erosion of stream bank has created a natural floodplain (Fig. S7). Control stream reaches were selected with equivalent lengths (where this was possible) and similar channel slopes and agricultural land use % in sub-catchments (Table S1). For detailed monitoring design see Figs. S1–S5. Site S7 was not paired with a control reach as the remediated stream originates from a wetland. Additionally, sites S7 and S8 are nested in the same stream network (Fig. 2a), with approximately 10 km stream length in between. Site C1 has two tributaries draining into the remediated stream reach.
In remediated streams, floodplains have been constructed either symmetrically on two sides (C1–3 and S8) or on one side (C4, S6–7 and S9–10) of the inset channel, site C5 being the exception with both designs along the reach. One-sided floodplains with double widths were constructed in streams where riparian obstructions (e.g., trees, boulders, and high field elevation) restricted two-sided floodplain excavation. Floodplain elevations range between 0.25 and 0.96 m in relation to the lowest point of the inset channel and the ratio of total flooded widths to channel top widths ranges between 1.3 and 2.9. Remediated streams were constructed between 2013 and 2019, with the purpose of preventing flooding of adjacent fields and improving fluvial stability and downstream water quality (Brink et al., 2012; Wiström and Lindberg, 2016; Hedin and Kivivuori, 2015).
The sites are variable in their catchment characteristics and hydrology (Table 1). Central East catchments (C1–5) are generally characterized by lower agricultural land use density and higher clay content in soils than in South catchments (S6–10). Overall, the remediated streams are dominated by base flows, with median discharge ranging between 0.01 and 0.32 m3 s−1.
Table 1Characteristics of catchment, hydrology, and ditch geometry of remediated streams. Sites are ordered from North to South. Flow discharge and floodplain inundation were recorded between April 2020 and June 2022. Discharge in site C3 was recorded between 2018 and 2022, interrupted between December and March each year. Ditch and floodplain geometry were measured in March and April 2021 with a GPS leveling device (E600 GNSS Receiver, E-survey, China).
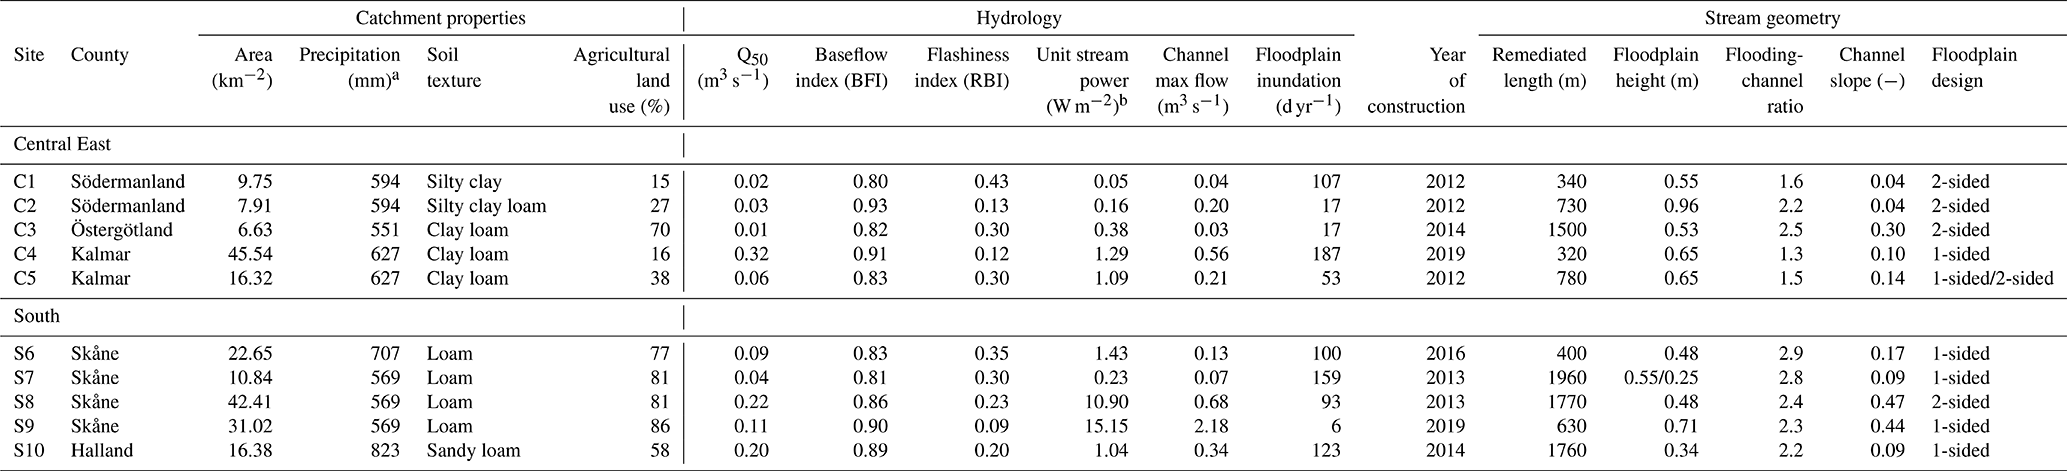
a Mean annual rainfall 2016–2021 (https://www.smhi.se/data/meteorologi/nederbord, last access: 20 March 2023), b Unit stream power at the point of inset channel overflow.
2.2 Sediment deposition rates: field sampling and analysis
To collect net sediment deposition rates, 0.16 m2 square wooden fiber plates were installed in September 2020 and anchored with a 1 m metal rod through the center (Fig. S10). Plates with a smooth surface coating were chosen to allow for resuspension of settled sediments but also to enable rapid in situ sediment collection. Sedimentation plates were installed on channel beds and on floodplains along each remediated ditch at the three locations upstream (US), midstream (MS) and downstream (DS; Fig. 2b), except at sites S6 and S8–9, where no plates could be placed in channels owing to impenetrable gravel and pebble bed substrates. Over the course of 21 months, deposited sediments were collected from the plates three times, approximately biannually (Fig. 2c) and with a total sample count of 41 (channel) and 73 (floodplains). To collect intact sediment samples from submerged plates in channels, a cylindrical frame was fitted onto plates before retrieval to prevent losses of sediments to the water column (Fig. S10). Before sampling, plates were lifted up from the channel beds to dewater sediments and the sediments were then measured for depth to estimate the total volume. Sediments were only collected from the inner 0.04 m2 square of the plates to avoid edge effects, and were subsequently stored in airtight plastic bags. Sediment plates with high volumes (n= 32) were subsampled from the 0.04 m2 square, with approximately 1 kg of fresh weight sediments collected after homogenization in the field. The fresh weight per 0.04 m2 of subsampled sediments was then estimated from the product of the sediment volume on the plate and the bulk density of fresh sediments, measured per 100 mL. In the case of missing sediment depth values in samples (n= 13), the depth was estimated based on a linear relationship between sediment fresh weight (kg m−2) and sediment depth (mm) of known samples (n= 90; r= 0.99, p< 0.01). All samples were oven dried at 105 ∘C to determine dry matter and then analyzed for TP with ICP-OES (Avio 200, PerkinElmer, USA). The TP content in sediments was normalized to deposition rates per area over six months as well as one year.
2.3 Composite sediment sampling and sequential P fractionation in sediments
In addition to newly deposited sediments on plates, composite sediments that represent the integration of both short- and long-term sediment deposition were sampled with a trowel in spring 2022 to determine P fractions. Sediments in channel bed and floodplains were sampled at US and DS for sequential P fractionation analysis (Fig. 2b, c). Sediments were sampled down to a depth of 5 cm with a trowel as 5 cm3 cubes. At each channel location, five pseudo-replicates were sampled at a distance of 10 m along reaches and pooled into one sample. On floodplains, ten pseudo-replicates were sampled at a distance of 5 m. Sediments were placed in airtight plastic bags and stored in coolers during field transportation and at 4 ∘C back at the laboratory before dry matter was determined by oven drying at 105 ∘C.
To determine the forms of P present in composite sediment samples, a sequential P fractionation method was used, developed from Psenner and Puckso (1988) and Hupfer et al. (1995, 2009). The analyzed P species (as operationally defined) were water-soluble P (H2O–P), redox-sensitive P adsorbed to iron and manganese (Fe–P), OH− exchangeable P adsorbed mainly to aluminum (Al–P), P bound in organic compounds (Org–P), and calcium-bound P (Ca–P). Here, H2O–P and Fe–P are also referred to as labile P and Al–P, Org–P, and Ca–P as recalcitrant P. The residual nonreactive P after the aforementioned fractionation (refractory P) was not determined; cumulative concentrations of analyzed P fractions are referred to here as TP. Fresh sediment samples were sequentially extracted with Milli-Q water (H2O–P), buffered dithionate solution (Fe–P), NaOH (Al–P), NaOH after 30 min persulfate digestion at 120 ∘C, and subtracted with NaOH (Org–P) and HCl (Ca–P). All extractions were analyzed for unfiltered SRP using the molybdenum blue method (Murphy and Riley, 1962). Concentrations of P fractions in sediments were calculated as g P kg−1 DM for comparison with TP concentrations in newly deposited sediments.
2.4 Hydrological monitoring and stream power calculation
Discharge was estimated by establishing stage-discharge rating curves from discharge measured manually on four to eight occasions and continuous water stage data from pressure sensors, as described in Hallberg et al. (2022). To minimize overestimation of high flows outside the range of flow measurements, out-of-range flows were estimated for all sites except for C2 and C4, using the product of (1) polynomial regressions of stage-cross-section area and (2) logarithmic regressions of stage-mean velocity (Herschy, 2014). To determine the effect of floodplain inundation on sediment deposition, geometrical cross-section surveys were conducted and floodplain inundation events were subsequently estimated using stage data (Hallberg et al., 2022).
The power generated by a stream is a function of the amount of water that flows down a slope in a confined channel. To compare the stream power and its influence on bed sediments between streams of different sizes (Bagnold, 1973; Reinfelds et al., 2004), the total stream power can be normalized by channel width to unit stream power (ω) at a given cross-section using:
where ρ is the density of the water (kg m−3), g is the acceleration due to gravity (m2 s−1), Q is the flow discharge (m3 s−1), S is the dimensionless channel bed slope and w is the channel width (m), here measured as the top width of the inset channel. With unit stream power, the force exerted per surface area and thus potential sediment transport can be derived, irrespective of system size. Unit stream power was calculated at the point of floodplain overflow, using derived flow discharge and channel widths from geometrical surveys, representing the maximum force of water when restricted to the inset channel.
2.5 Water quality sampling and vegetation survey
Water grab samples were collected monthly between April 2020 and July 2022 to determine water chemistry at the four locations upstream control (TD), US, MS, and DS (Fig. 2b). At site S9, sampling after June 2021 was excluded from analysis as the control stream was then converted into a remediated stream. Water samples were analyzed for TP (SS-EN ISO 6878:2005), with and without 0.45 µm filtration, and suspended solids (SS; SS-EN 872:2005). Particulate P was calculated as the difference between unfiltered and filtered TP. Existing TP, PP, and SS water chemistry from a location 1 km downstream of site C3 (Kyllmar et al., 2014) were used for subsequent validation of the flow-weighted mean concentration (FW) load estimation method. Two types of data were used: (1) Annual loads estimated from fortnightly flow-proportional composite sampling and (2) fortnightly discrete concentration samples. In addition, vegetation cover was visually estimated on floodplains using three 1 m2 (1 × 1 m) plots at each of the three locations US, MS, and DS. Average percentage vegetation cover was calculated from two surveys in May and June 2021.
2.6 Statistical data analysis
All statistical analyses were performed in R version 4.2.1 (RStudio Team, 2022). The packages' hydrostats (Bond, 2022) and ContDataQC (Leppo, 2023) was used to analyze the hydrological regimes. Base flow index (Gustard et al., 1992) were calculated using baseflows and flashiness index (Baker et al., 2004) using RBIcalc. Two outliers in TP and PP concentrations and one outlier in SS concentrations were removed from further analysis; these data points had exceptionally high concentrations (studentized residuals > 10, i.e., regression model residual divided by its adjusted standard error) and were measured in stagnant water during summer months, with minimal influence on total loads.
Annual loads of TP, PP, and SS per ha were calculated at US and DS locations using the FW method (Elwan et al., 2018). The accuracy of annual load estimation was tested downstream of site C3. Here, loads calculated from existing fortnightly flow-proportional composite sampling represent “accurate” loads (Dialameh and Ghane, 2022). At the same location, FW loads were calculated for the study period using water samples from two to three different days within each month to compare with true loads (Fig. S11). At this location, annual FW loads were underestimated across all parameters (TP: −28 %, PP: −29 %, and SS: −52 %). Daily loads of TP based on monthly water chemistry were also calculated by multiplying with daily flow. Changes in TP, PP, and SS concentrations were calculated as the difference between US and TD (control streams) and the difference between DS and US (remediated streams), hence negative values represent reductions in concentrations along reaches. In the case of non-normal sample distributions of changes in TP, PP, and SS concentrations (i.e., slightly right-skewed and with tails of outliers to both left and right), we used the approach of nonparametric permutation of t-tests (R= 10 000), using MKinfer package (Kohl, 2022). Permutation tests do not assume an underlying distribution and solely rely on the assumption of exchangeability, such as the absence of temporal autocorrelation (Good, 2000). To test for autocorrelation, concentration data were regressed against date and, if significant (p< 0.05), it was excluded from subsequent permuted t-tests. Differences in changes in TP, PP, and SS concentrations between remediated and control streams as well as differences in P deposition rates across inundation classes and floodplain sides were tested with permuted unpaired two-tailed t-tests (perm.t.test). When testing differences in concentration changes for each individual site, paired two-tailed t-tests (t.test, stats package; “base” R) were used for normally distributed data and permuted paired two-tailed t-tests (perm.t.test) were used for non-normal data. Seasonal differences in P deposition rates were tested with one-way ANOVA (anova, stats).
The effects of P deposition and stream water P on labile P in composite sediments were quantified with Pearson correlation coefficients, using cor.test in the stats package. No permutation of Pearson correlations was necessary owing to met assumptions of homoscedasticity and normal distribution of residuals. To visualize the controls for P sedimentation, sample distribution of predictor variables (catchment and reach properties) was analyzed using scaled principal component analysis (PCA; rda) on two separate matrices for channels and floodplains, using the Vegan package (Oksanen et al., 2022). Vectors of P deposition rates were fitted to the PCAs using envfit with 10 000 permutations.
3.1 Suspended sediment and P reduction in stream water
Absolute concentrations of TP and PP in stream water were highly variable across both seasons and sites, peaking in summer months during low flows and ranging from below the detection limit to 3940 µg TP L−1 and 3557 µg PP L−1. Overall, the proportion of PP out of TP ranged from 28 % to 86 % but PP was the dominant form across seven sites (Table S2). Concentrations of SS ranged between < 1 to 1200 mg SS L−1 and correlated with PP concentrations at each site (Table S3), but to a lesser degree in site C1 and S9 at high concentrations. Changes in TP concentrations along upstream control reaches correlated weakly with base flow index (r= 0.27, p < 0.01) and flashiness index (r= −0.25, p< 0.01), but there was no general correlation along remediated reaches and thus little influence of different hydrological regimes on P concentration dynamics.
When grouping remediated streams by floodplain design, two-sided floodplains showed higher reductions in absolute TP and PP concentrations along reaches compared with control streams (Fig. 3). Concentration changes along remediated streams with one-sided floodplains were not different than control streams. Correspondingly, there was a similar pattern to changes in TP and PP loads along remediated streams: two-sided floodplains retained on average 0.17 ± 0.26 kg TP ha−1 yr−1 and 0.21 ± 0.21 kg PP ha−1 yr−1 whereas one-sided floodplains lost 0.07 ± 0.10 kg TP ha−1 yr−1 and 0.09 ± 0.10 kg PP ha−1 yr−1. Concentration reductions in TP and PP among sites with two-sided floodplains were mostly explained by site C2 but also S8 (Fig. 3). Changes in SS concentrations were not reduced along two-sided floodplains and site C3 significantly increased SS concentrations along remediated reach.
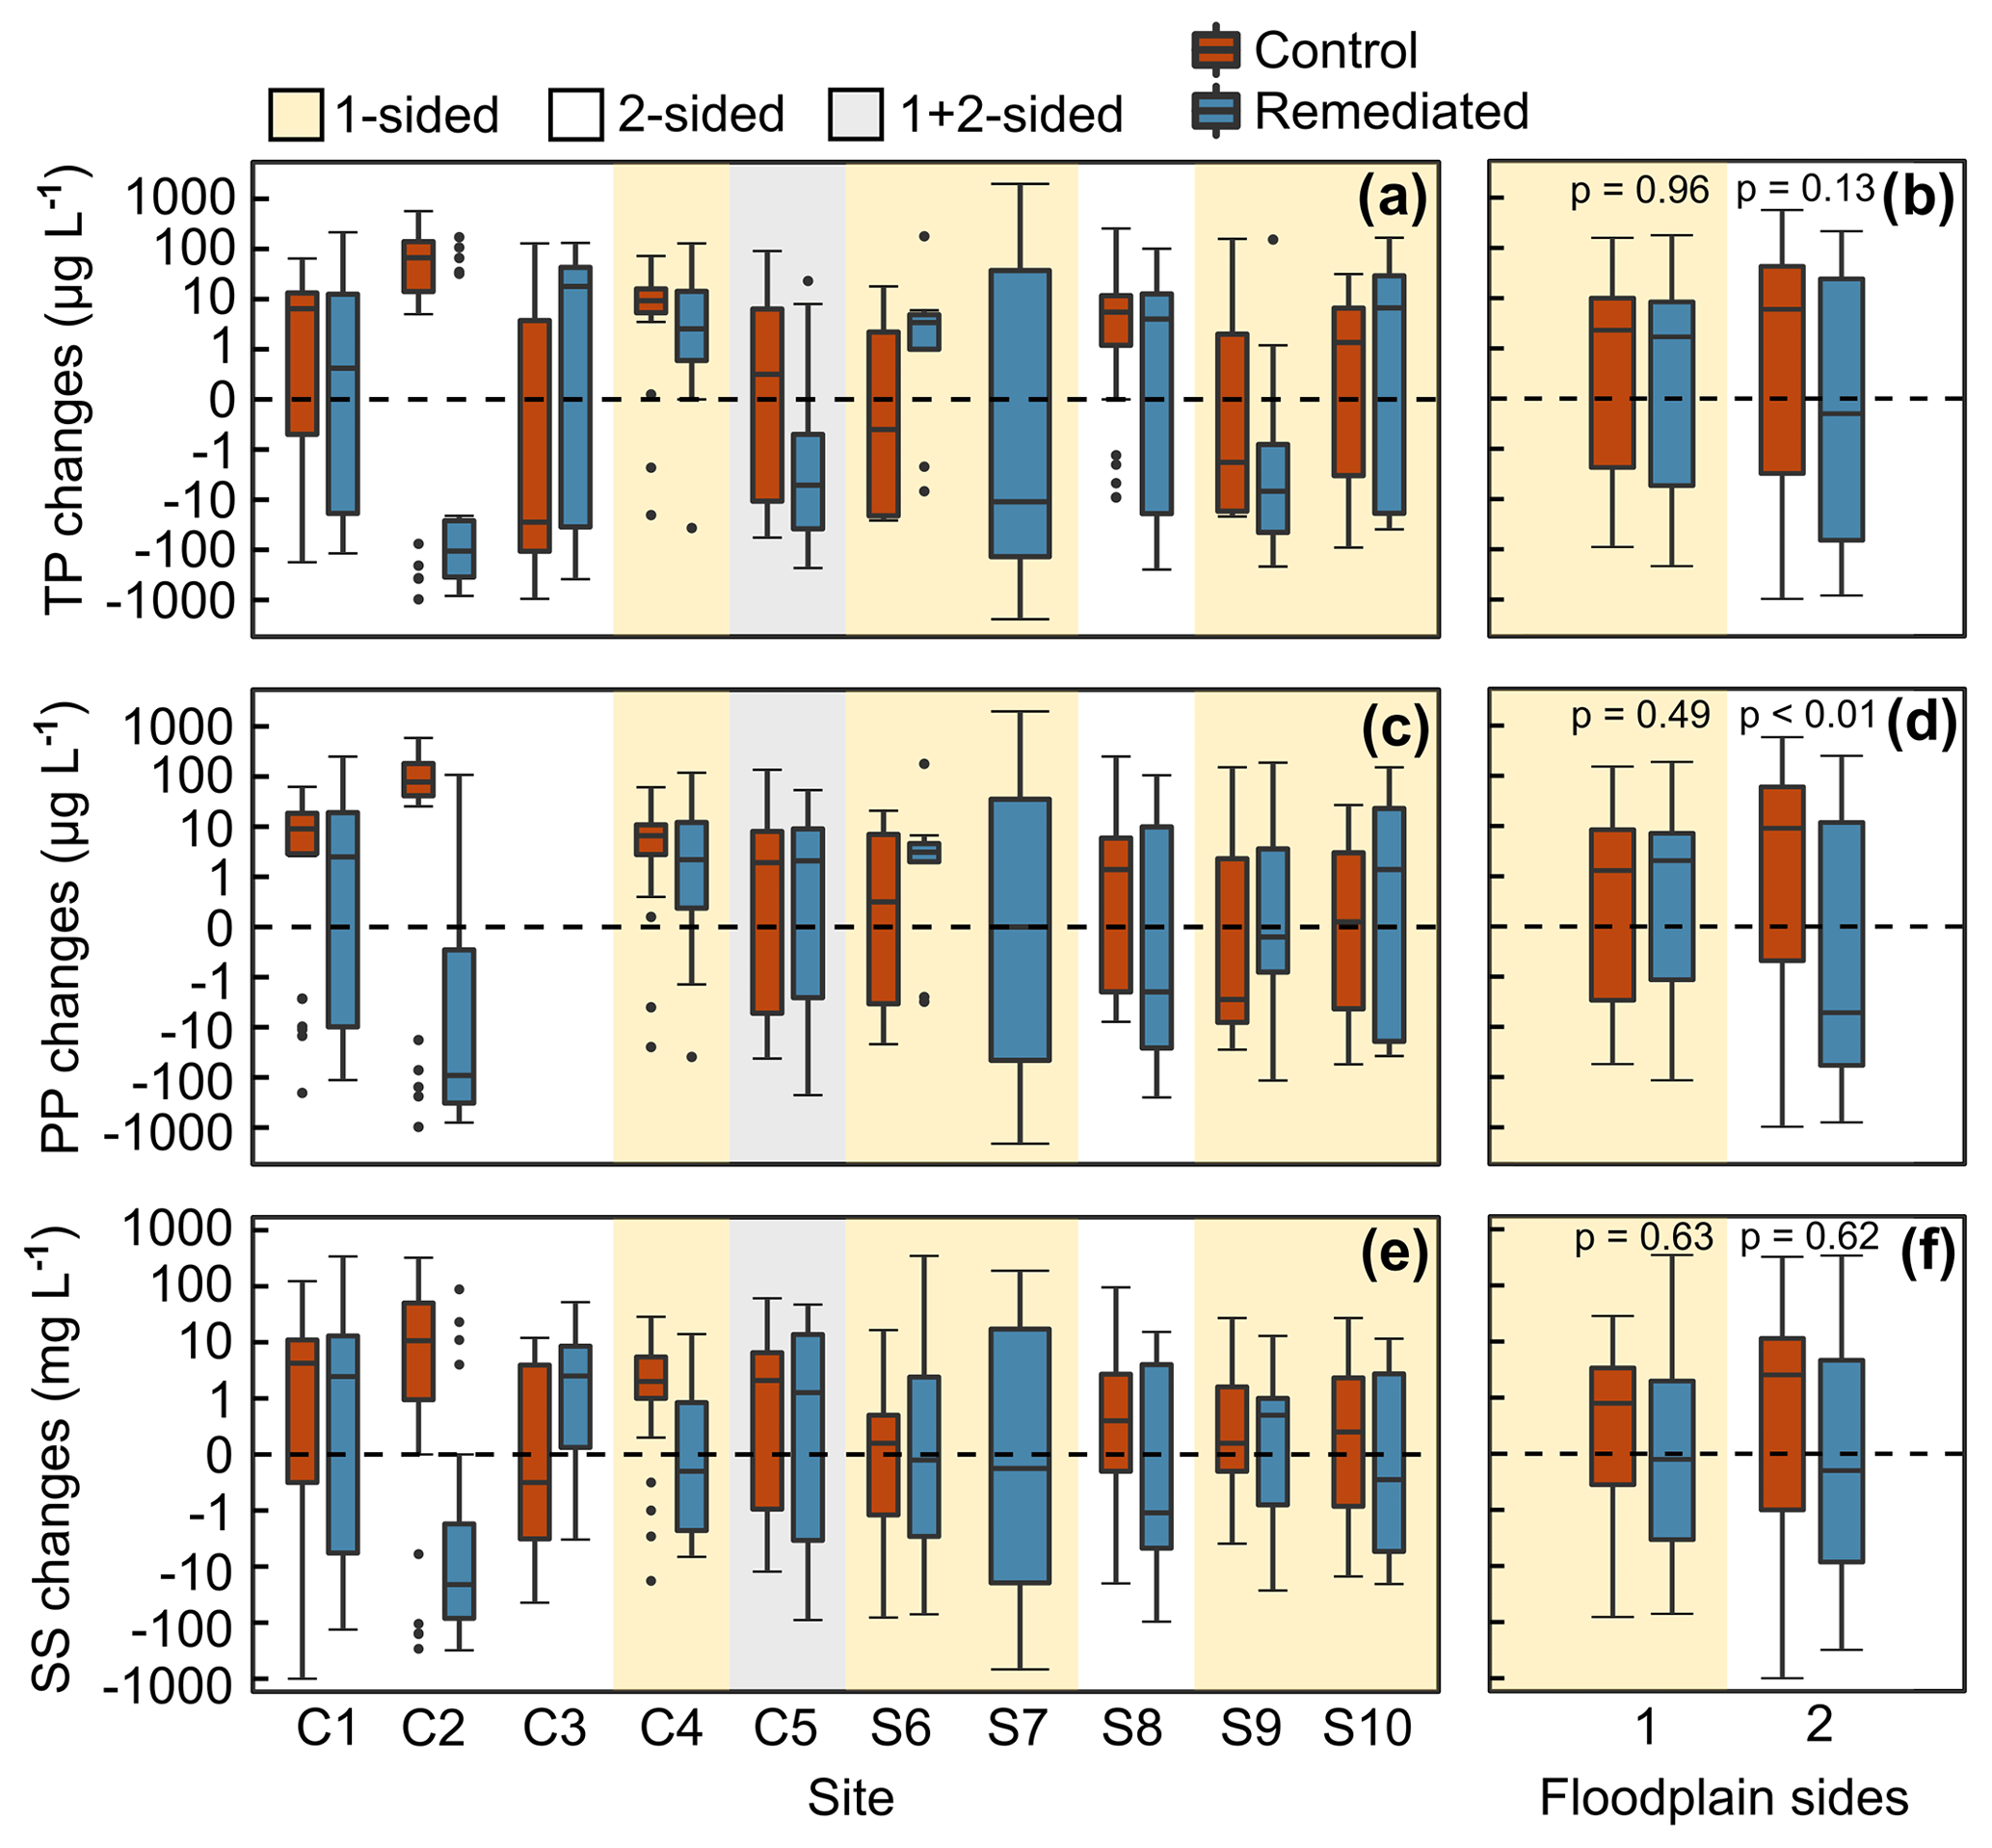
Figure 3Changes in TP, PP, and SS concentrations (note log10 y axis) between the start and end of control streams (red boxes) and the start and end of remediated streams (blue boxes) from April 2020 to June 2022. Changes in concentrations are shown in a, c, e by each site (C1–5 and S6–10) and b, d, f sites grouped by number of floodplain sides along the inset channel. When comparing floodplain sides, two sites were excluded owing to a lack of control stream (S7) and a combination of one- and two-sided floodplains along the reach (C5). P values of permuted unpaired t-tests are shown within the panels. P values of parametric and, when necessary, permuted paired t-tests are shown within the panels. P values = NA refers to non-normal and autocorrelated data that prevent reliable computation of t-tests. Bold font denotes significant difference (p< 0.05) between locations.
Based on monthly water chemistry data, TP loads (g d−1 ha−1) were reduced during inundation events in site S8, compared with base flows (permuted t-test, p= 0.02). This effect was not observed at any other site. Higher incoming loads in two-sided floodplains led to greater load reduction, whereas higher loads in one-sided floodplains led to greater load increases along the remediated reaches (Fig. 4).
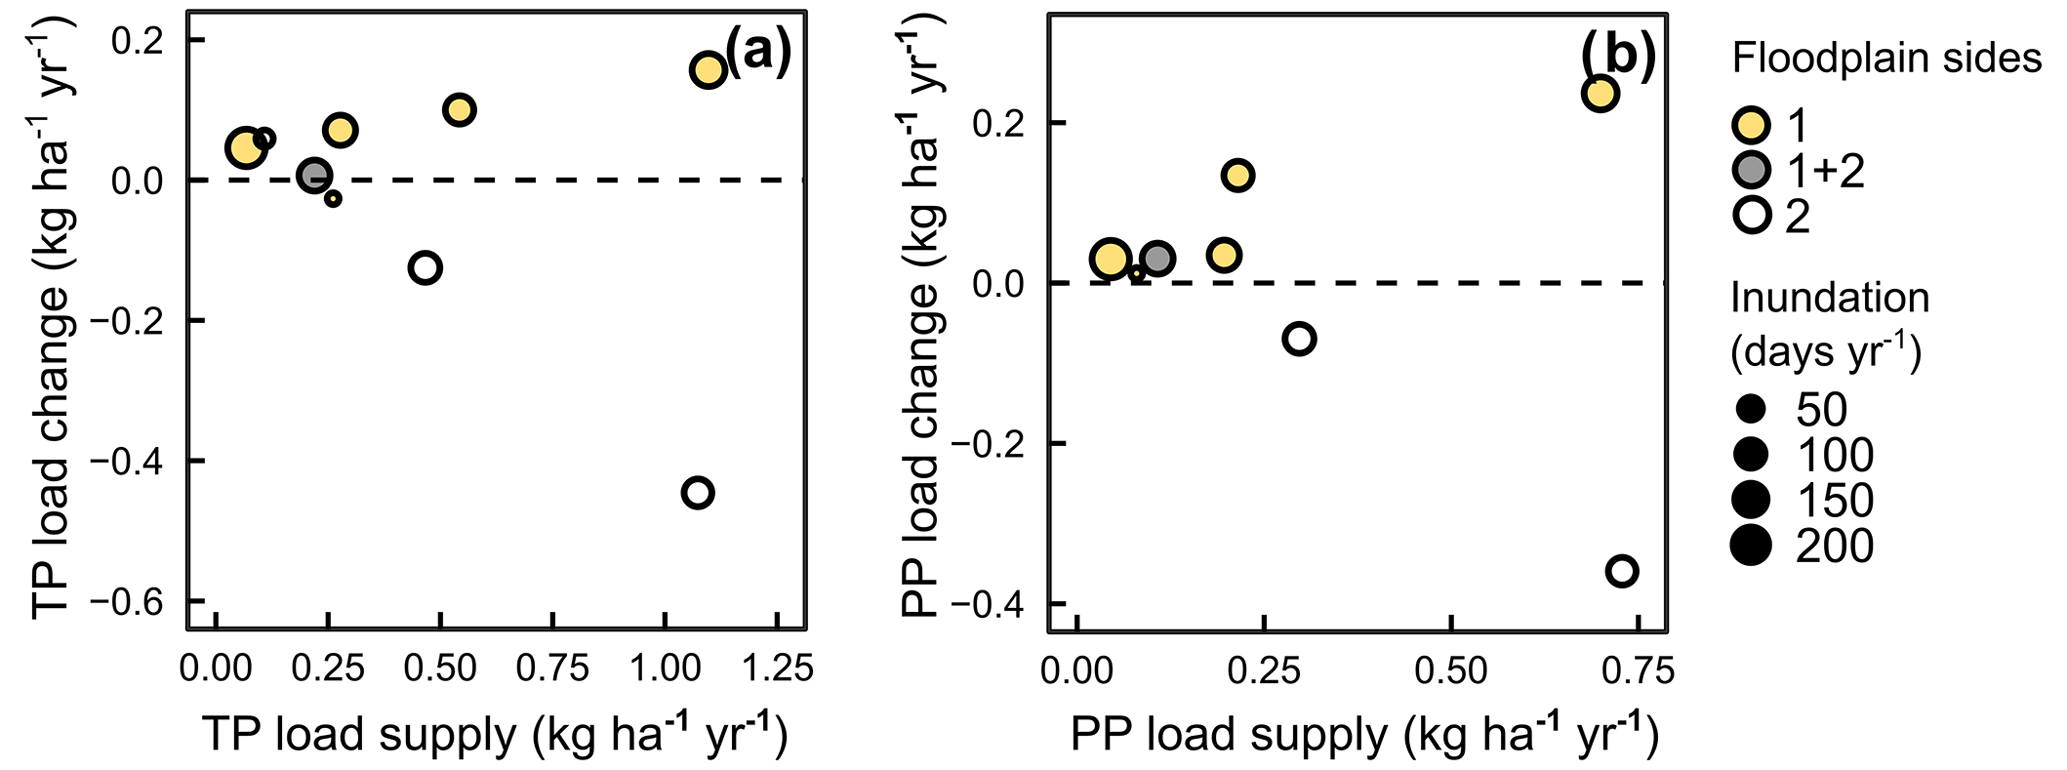
Figure 4Changes in (a) TP and (b) PP loads along remediated streams compared with P supply loads at the start of remediated streams. Remediated streams grouped as one-sided (yellow circles), one- and two-sided (gray circles), and two-sided floodplains (white circles). Size of circles denote average floodplain inundation d yr−1. TP and PP loads of site C2 were excluded owing to a lack of flow data at downstream location, and PP loads in site C3 was excluded as this was not measured.
3.2 Deposition of sediments and P in channels and on floodplains
Sediment deposition was five times deeper on channel beds (86 ± 72 mm yr−1) than floodplains (16 ± 23 mm yr−1) at sites C1–5, S7, and S10 (Fig. 5a), showing that sedimentation on floodplains, despite inundation frequencies up to 200 d yr−1, contributed little to the reaches' total sediment budgets. Deposition rates of P correlated with sediment depth (r= 0.96, p< 0.01) and averaged 29.9 ± 29.3 g TP m−2 yr−1 on channel beds and 7.0 ± 10.4 g TP m−2 yr−1 on floodplains. Combined channel bed and floodplain deposition rates did not correlate with stream water P concentration changes, neither between remediated and control streams and irrespective of the number of floodplain sides (Fig. S12). Ratios of deposited P:sedimentmass did not differ between channel and floodplains (unpaired t-test, p= 0.83). There was a seasonal pattern of higher P deposition rates on channel beds during the more hydrologically active winter and spring seasons than during summer and fall (ANOVA, 2.86, p= 0.07).
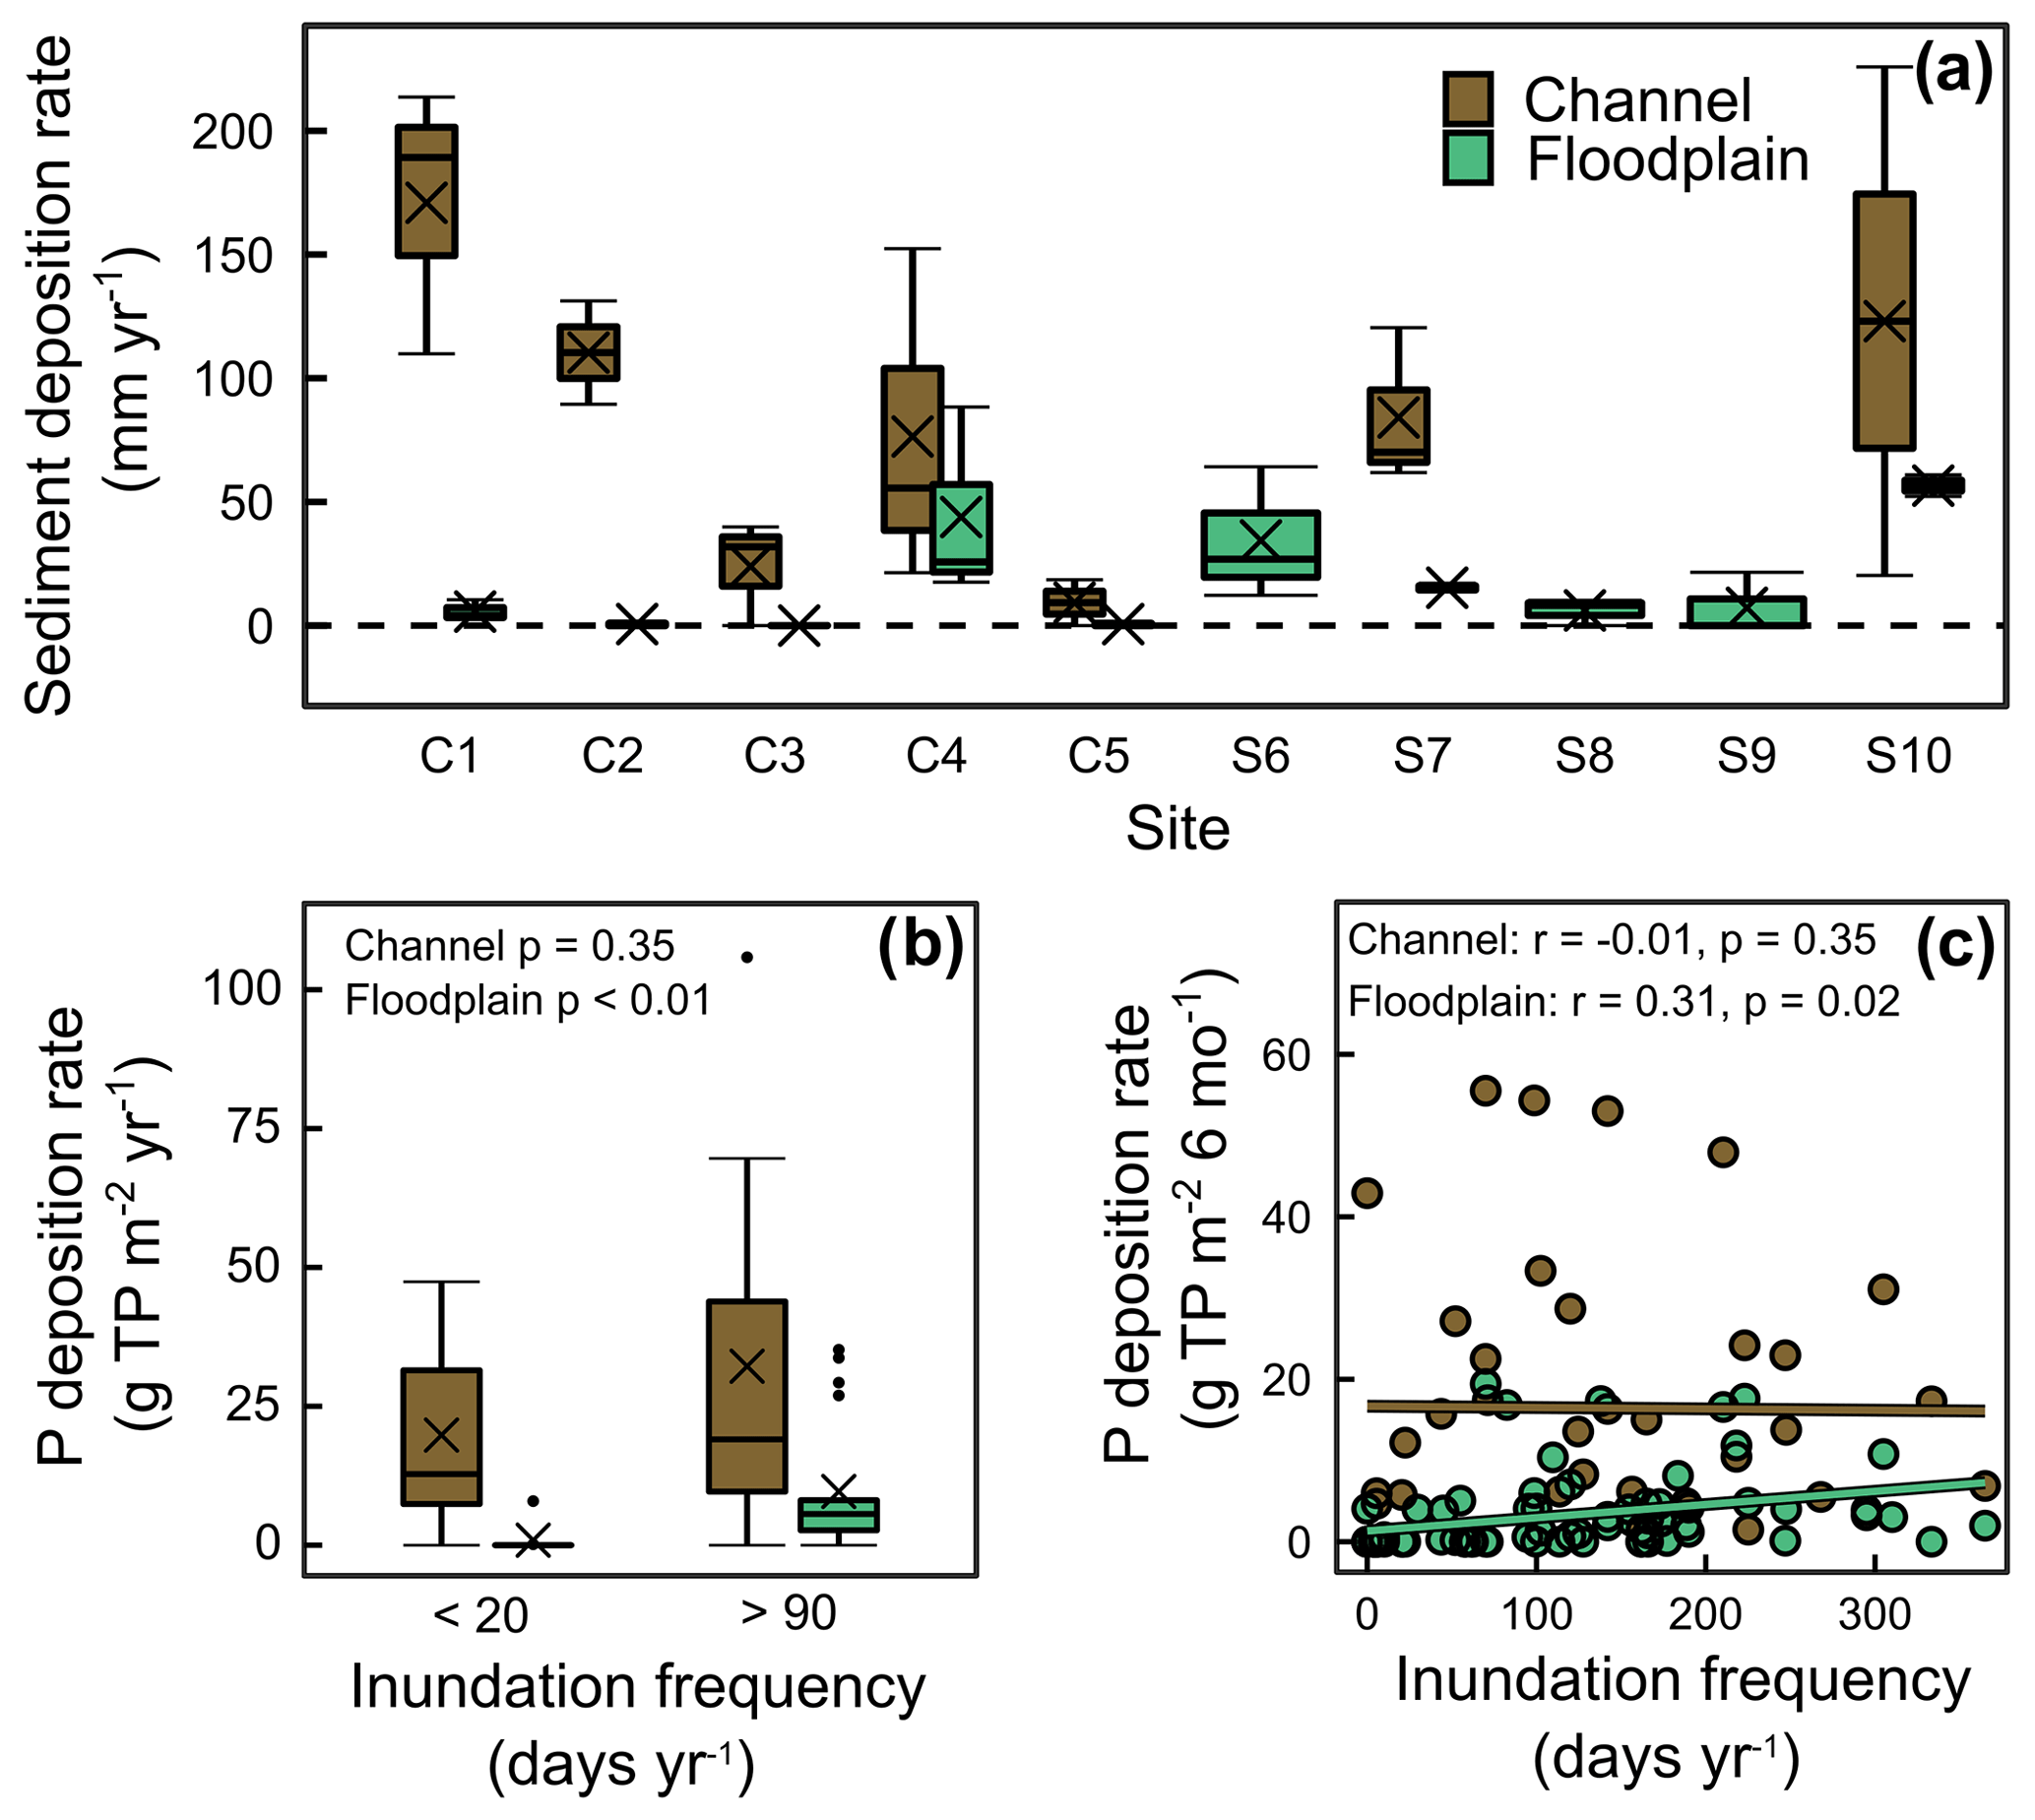
Figure 5(a) Sediment deposition rate in depth on channel beds and floodplains across sites (C1–5 and S6–10) from sediment plates deployed between September 2021 and May 2022. (b) Annual P deposition rate grouped by floodplain inundation frequency classes and (c) biannual P deposition rate regressed against inundation frequency during each 6 month sampling occasion. P values of permuted unpaired t-tests and permuted Pearson correlations are shown within panels.
On channel beds, P deposition rates increased with lower unit stream power (r= −0.43, p= 0.03; Fig. S13), representing the maximum stream power per m−2 bed surface area when flow was confined to the inset channel. Deposited P correlate with neither the average of stream water TP loads for each 6 month sampling period (r= −0.16, p= 0.42; Fig. S13) nor with the ratio of unit stream power:TP loads (r= 0.28, p= 0.32), indicating that unit stream power alone during lower flows was the primary driver for P sedimentation on channel beds.
On floodplains, P deposition rates fitted to a PCA of environmental predictors were primarily controlled by inundation frequency (Fig. S13b), in accordance with linear regression (Fig. 5c). Vegetation cover was also dependent on inundation frequency, but when excluding data points < 70 inundation d yr−1, there was an effect of higher P deposition rates with vegetation cover, independent of inundation (adj. R2= 0.05, Vegetation p= 0.05, Inundation p= 0.87). In contrast to channel beds, unit stream power did not influence P deposition rates on floodplains. Grouping of sites by mean inundation frequency revealed that P deposition rates on floodplains were 10.7 times higher during > 90 inundation d yr−1 compared with < 20 inundation d yr−1 (Fig. 5b). However, the process of lateral distribution from channel to floodplains could not be confirmed as P deposition rates on channel beds were not influenced by inundation.
3.3 Influence of sediment deposition on P stocks
There was an increase in TP content of composite sediments with construction age of remediated streams, both in channel beds (r= 0.48, p= 0.04) and floodplains (r= 0.54, p= 0.02), which was best explained by increases in Al–P fraction. Labile P fractions (H2O–P and Fe–P) accounted for on average 19 % of TP; hence, the recalcitrant P fractions (Al–P, Org–P, and Ca–P) were the dominant forms of P in sediments (Fig. S14). There was a trend in higher labile P content (paired t-test, p= 0.06) in channel sediments compared with floodplain sediments but no differences for TP or recalcitrant P content (paired t-test, TP: p= 0.12, Recalcitrant P: p= 0.23).
Total P in newly deposited sediments on plates was 1.6 times higher than in composite sediments, i.e., sediments down to a depth of 5 cm outside of the plates. Newly deposited P further correlated with higher labile P content in composite sediments of channels but not floodplains (Fig. 6a). However, deposited P had no effect on recalcitrant P content, meaning that deposited P mainly contributed to the bioavailable P pool in channel sediments (Fig. 6b). Stream water concentrations of TP and PP predicted higher labile P content in channel and floodplain sediments equally well (Fig. 6c, d), indicating that P in the water column supplies bioavailable P on floodplains rather than sediment deposition.
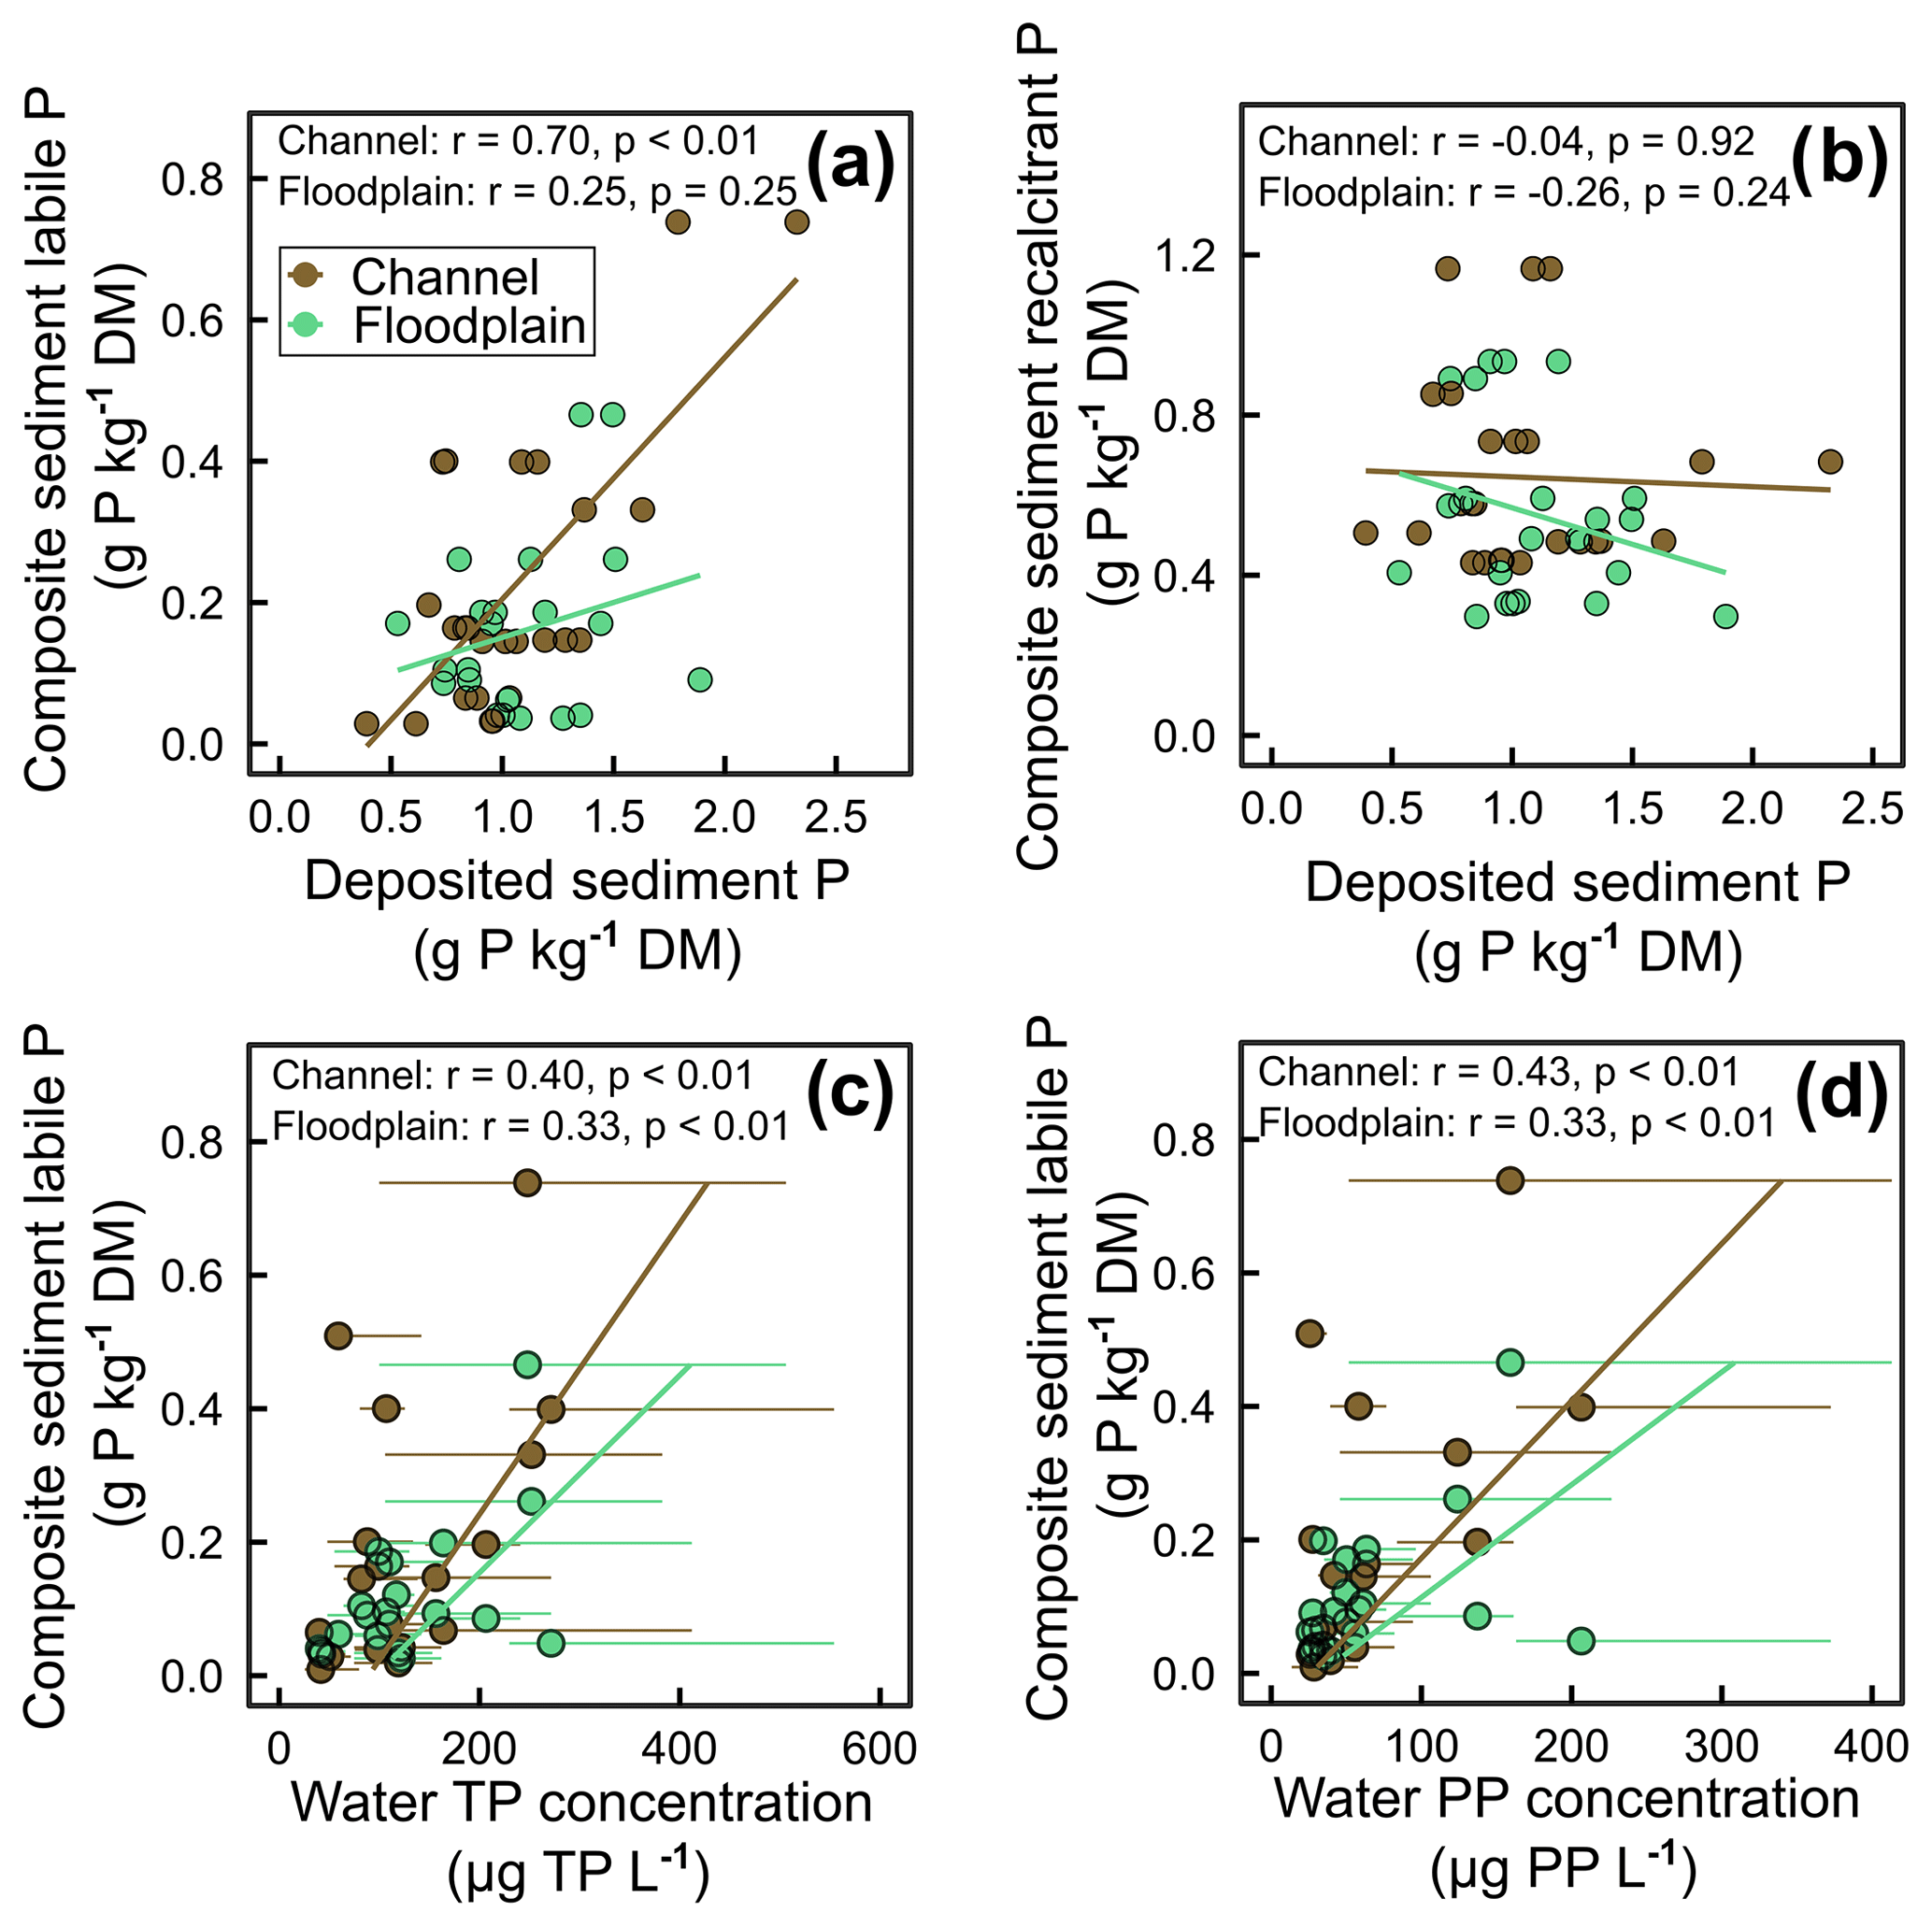
Figure 6Linear regressions between deposited sediment TP and composite sediment (a) labile P and (b) recalcitrant P in channel sediments (blue circles) and floodplain sediments (red circles). Linear regressions of composite sediment labile P by (c) stream water TP concentrations and (d) stream water PP concentrations. Deposited sediments were collected between September 2021 and May 2022, composite sediments sampled in spring 2022 and monthly water grab samples between April 2020 and July 2022. Zero values from plates without deposited sediments were removed from analysis. Labile P represent P fractions H2O–P and Fe–P. Pearson r and p values are shown within each panel and error bars show standard deviations of stream water P.
4.1 Influence of floodplain designs on P reductions in streams
The observed reductions in TP and PP concentrations and loads along remediated streams show that this measure has the potential to improve downstream water quality compared with control streams. The effect was exclusive to two-sided floodplain designs; one-sided floodplains did not differ from control streams, which implies that a floodplain on only one side might be less suitable for P mitigation. However, the effect of two-sided designs was highly influenced by site C2, wherein a perched culvert at the outlet could have contributed to additional P removal. The combination of stagnant water conditions at the lower end of the reach and stream bank stabilization resulted in highly favorable conditions for P trapping, without the risk of bank overflow. After removing site C2 from the analysis, the effect of the two-side floodplain was visible, although not statistically significant. Differences in P loads between the two floodplain designs were even more pronounced in sites with higher catchment P supply, as two-sided floodplains responded as active P sinks, whereas one-sided floodplains behaved as passive conduits. However, TP load data were only available at three sites (C1, C3, and S8) with two-sided floodplains, which limits the certainty of this floodplain design being the main control responsible for P load reductions, warranting further study of floodplain designs. Further, flow-weighted average concentration load estimation from monthly water samples is generally conservative (Elwan et al., 2018), which was also the case in the proximity of site C3, where loads based on monthly samples were 30 % lower than loads from biweekly flow-proportional sampling. Remediated streams with lower catchment P loads, due to less agricultural land use, did not reduce P loads irrespective of floodplain design. Thus, to realize their P reduction potential, the results indicate that remediated streams should be targeted in areas with P loading exceeding 0.25 kg P ha−1 yr−1.
Reduction in PP loads is particularly important in clay-dominated catchments, associated with high PP delivery from soil erosion to streams (Sandström et al., 2020), as in site C2. The highest reductions in both TP (30 %) and PP (34 %) concentrations occurred along the remediated stream in site C2, characterized by silty clay loam soil texture. Although the majority of the studied catchments were dominated by PP, site S8, which (in contrast to PP-dominated C2) was characterized by equal proportions of PP and SRP and loam soil texture, also showed a tendency toward reductions in TP, PP, and SS concentrations. This implies that remediated streams can be effective across diverse catchments with contrasting soil textures and P forms, if the criteria of high P loading is met. In addition, site S8 showed that remediated streams with frequent inundation and without additional ponding, as in C2, can improve downstream water quality. Site S8 has also been subject to re-meandering, which could account for increased water residence times and settling of particulates, in addition to its floodplains. However, among two-sided floodplain sites, C1 and C3 did not reduce P and SS concentrations, implying that solely implementing two-sided floodplains is insufficient and that further requirements such as frequent inundation, floodplain stability, and reach lengths must be met by proper design of two-sided sites. For instance, site C1 is characterized by a short and straight reach with a low flooding-to-channel ratio and unstable floodplains that prevent P and SS reduction.
We assumed that lateral inputs (tile drains and groundwater inflow) along both remediated and control reaches were comparable and thus not influencing the comparison between the two reaches. All paired reaches received tile drain inputs from adjacent fields with identical crop cultivation and flat topography with predominant subsurface flow pathways. There were no large deviations in loads between up- and downstream and we do not therefore have any reasons for suspecting significant lateral hotspots.
Although reductions in P loads were predicted during inundation events (Bai and Zeng, 2019; D'Ambrosio et al., 2015; Krider et al., 2017) this was only observed in site S8. However, the lower number of water samples collected during these events limited the comparison between base flow and inundation conditions, highlighting the need for high-resolution monitoring to resolve P responses to storm events. The lack of P reductions along streams with one-sided floodplains was likely connected to higher erosion from banks next to inset channels. These banks had higher slopes and resembled trapezoidal banks, compared with banks adjacent to floodplains (data not shown; Fig. 1). Higher bank slopes in loam and clay soils are known to reduce the cohesive strength and increase the vulnerability toward erosion of bank material to the water column (Thorne and Tovey, 1981). In one-sided designs, banks next to inset channels were also exposed to higher stream velocities; the greater water depth in channels than in floodplains led to higher water velocities that exerted greater shear stress on banks adjacent to the channel. Accordingly, we suggest that these processes that drive bank erosion together can explain the lack of P reductions with one-sided floodplains, consistent with previous observations of increased scour and deposition with this floodplain design (D'Ambrosio et al., 2015).
4.2 Influence of sediment deposition on P dynamics and channel morphology
Contrary to our initial assumption, higher P deposition rates on floodplains did not reduce P concentrations in stream water and could therefore not be confirmed as the sole process responsible for SS and P reduction in remediated streams. Instead, there was an average increase in TP concentrations of 1.6 µg TP L−1 per deposited g TP m−2 yr−1, suggesting that floodplain deposition co-occurred with other processes contributing to P losses, e.g., resuspension. Deposition rates of sediments and P on floodplains were controlled by inundation frequency and were substantially higher in this study than reported rates from five US sites (0.5–13 mm sediment yr−1; D'Ambrosio et al., 2015) and three Swedish sites (0.04–1.2 g TP m−2 yr−1; Lacoursière and Vought, 2020).
The relative importance of vegetation cover for trapping sediment-bound P on floodplains could only be assessed in locations with > 70 d of inundation yr−1, without collinearity between the two variables. Provision of water and nutrients from inundation events increases biomass growth on floodplains. It can therefore be assumed that sediment deposition is promoted directly by inundation, which provides sediments to be settled, and indirectly by its effect on vegetation, which also traps sediments. However, the smooth surfaces of sediment plates that were used to measure deposition likely underestimated sediment trapping on densely vegetated floodplains.
Despite the relatively high sediment yields on floodplains, particularly at sites C4, S6, and S10, its lack of effect on P concentrations observed in our study contradicts previous findings, reporting floodplains as consistent P traps (D'Ambrosio et al., 2015; Davis et al., 2015; Mahl et al., 2015). An explanation for this could be that in our study sites, flooding to channel width ratios were significantly smaller than the recommended ratio of 3 to 5 (Powell et al., 2007) and therefore not contributing to sufficient reach-scale P deposition needed to impact P in the water column. The unexpected increase in P concentrations with floodplain deposition could be due to coinciding activation of erosion processes in channels, banks, or floodplains that override reductions from sedimentation. Total P losses during increasing floodplain deposition were primarily explained by mobilization or increased transport of PP, accounting for 87 % of TP losses, and not SRP. Overall, surface erosion in catchment soils did not drive stream sediment losses. Modeled maximum erosion rates of SS from surface runoff (Djodjic and Markensten, 2019) were generally low for all sites (10–50 kg ha−1 yr−1), except for site S7 (100–250 kg ha−1 yr−1), which likely contributed to SS and PP loading in that particular site. It is further possible that rapid resuspension of newly deposited sediments during higher flows leads to net losses of stream water P. As monitoring with sediment plates only accounted for net deposition, we could not quantify losses of sediments co-occurring with deposition.
Based on sediment deposition rates on plates, there was no indication of lateral sediment distribution from channel beds to floodplains in the seven sites (C1–5, S7, S10) where both channel beds and floodplains were evaluated. Instead, channel beds represented the dominant pool of sediment storage in remediated streams, independent of floodplain deposition rates. The ongoing aggradation on the channel beds indicates that these systems are still in fluvial disequilibrium, which is likely an indirect effect of floodplain inundation that also lowers water velocities in channels. However, we could not show if this also occurred in control streams as no channel beds were monitored in these reaches. The lack of correlation between channel deposition and reductions in P concentrations in stream water could be explained by the bi-annual sediment sampling interval, being too coarse to capture periodic P reduction from sedimentation, which has been reported to occur during lower flow conditions (Bowes et al., 2003). In sites S6 and S8–9, where channel slopes ranged between 0.2 % and 0.6 %, channel bed material was dominated by gravel and pebble substrates. Their impenetrable channel beds prevented plate installation and measurement of sedimentation rates but based on visual observations, no substantial deposition of fine sediments occurred over the study period. Hence, these channels appeared to have sufficient stream power in relation to SS loads to transport SS, driven by their higher longitudinal channel slopes.
4.3 Variability in sediment P stock
The dominance of P deposition on channel beds compared with floodplains was also reflected in the higher labile P fractions (H2O–P and Fe–P) in composite channel bed sediments, which increased with P deposition rates. Although labile P fractions only accounted for 20 % of TP in composite sediments, Fe–P (the largest fraction of labile P) is sensitive to reducing conditions and subsequent re-release as SRP into the water column (Jarvie et al., 2005). The contribution of labile P from sediment deposition can therefore have negative implications for P export, supplying the system with easily available P rather than providing a persistent P trap. Labile P in composite sediments also correlated with stream water P concentrations, but here the causation was less clear owing to the reciprocity between sediment-bound P and stream water P; higher P concentrations in stream water can increase sediment P (deposition and sorption) whereas high sediment P can also lead to higher stream water P (resuspension and desorption).
The range of TP content in channel bed sediments was consistent with other agricultural streams in Sweden (0.07–1.57 g P kg−1, Lannergård et al., 2020; 0.35–1.85 g P kg−1, Sandström et al., 2021), indicating that remediated streams do not promote P enrichment in channel beds compared with streams without floodplains. However, the proportions of labile P fractions were overall lower in our study, either explained by less deposition of these fractions or a more rapid turnover of labile P. In a comparable system, sediments were also dominated by recalcitrant fractions that were shown to be stable over seasons (Kindervater and Steinman, 2019). The increase in Al–P with construction age was partly explained by higher clay content in catchment soils, which often are rich in Al silicates and hydroxides that increase the sorption of P to these surfaces (Gérard, 2016). However, the effect on TP with construction age was independent from clay content, suggesting a true accumulation of P in sediments over time in both channel and floodplain sediments. This post-construction maturation process indicates a system reset to low P content in sediments following construction, as previously shown for denitrification and microbial respiration rates in floodplain sediments (Speir et al., 2020).
The higher vegetation coverage on floodplains than on channel beds was not reflected in higher organic P fraction in sediments. Although soil organic carbon has been found to accumulate more over time in floodplain sediments than in channel sediments (Hallberg et al., 2022; Speir et al., 2020), the lack of increase in organic P in floodplain sediments with construction age suggests that the build-up of organic P forms, despite the presence of vegetation, is slow and requires more than 10 years to occur. In this study, P in vegetation biomass was not considered and although it could contribute as a seasonally active P sink, Kindervater and Steinman (2019) reported that channel and floodplain sediments on average held 18 times more P mass than biomass on a reach-scale.
4.4 Floodplain management toward P reduction and fluvial equilibrium
Currently in Sweden, the recommended dimensions of remediated streams with two-stage design (1 km length, 3–5 flooding to channel width ratio) are solely based on hydrology and do not take into account impact on sediment or nutrient reduction (Lindmark et al., 2013; Powell et al., 2007). Moreover, subsidies from Swedish authorities compensate for the stream length when constructing remediated streams and there is no mechanism for incentivizing the implementation of wider floodplains, resulting in narrower than recommended widths in remediated streams. We suggest that wider floodplains and shorter lengths can have larger effects on P reductions by sedimentation, improving cost-efficiency while maintaining the same total area. It is, therefore, also necessary to evaluate this within a modeling framework that can isolate a range of dimensions from other confounding, site-specific factors.
A one-sided floodplain design is sometimes preferred among landowners when constructing floodplains owing to the lower cost, easier implementation, and future maintenance accessibility, especially in locations where riparian obstructions (e.g., trees, boulders, and high bank elevation) inhibit the two-sided design. However, our results show clearly that this design is insufficient to reduce P concentrations and loads compared with control streams and therefore should be avoided. Instead, priority should be given to establishing two-sided floodplains in critical source areas with high P loading, where riparian conditions as well as channel slope allow this.
As higher inundation frequency (provided by lower floodplain elevations) increased P deposition, it is possible that lower and wider floodplains can increase reach-scale P trapping and thereby reduce P exports. However, lower floodplains can be exposed to higher shear stress and the risk of toe erosion of floodplains that can explain the lack of observed P reductions with deposition. When choosing the optimal floodplain elevation, multiple pollutants (e.g., nitrogen; Hallberg et al., 2022) should be considered to avoid potential pollution swapping (Bieroza et al., 2019).
Combining floodplains with partial damming, as in site C2, can lead to higher reductions in SS and P concentrations. Littlejohn et al. (2014) reported 45 % TP load reductions with two low-grade weirs in streams with constructed floodplains, comparable with that of site C2. Thus, raising culverts or installing low-grade weirs can complement remediated streams. The increased bankfull volume with constructed floodplains reduces the risk of flooding when restricting outflows; however, hydraulic calculations should be made to ensure that large flood volumes are confined within the bankfull volume when installing impoundments. Although the combination of re-meandering and floodplains resulted in lower SS and P export in site S8, stable meanders can be difficult to establish without additional protective measures to avoid erosion and migration (Wohl et al., 2015). Results on P mitigation with re-meandered channels are scarce but it has been shown to improve stream habitat quality (Lorenz et al., 2009). However, meanders rely on a certain freedom of channel migration that can infringe on productive agricultural land, lead to higher sediment (and thus P) exports, and are therefore less suitable in narrow riparian buffers with limited room for channel evolution. Sediment accumulation on channel beds is widely perceived as negative by landowners, requiring routine channel dredging to avoid drainage impairment and to reduce the risk of flooding. However, in the absence of maintenance activities, the natural formation of floodplains in agricultural streams has been observed to develop from sediment deposition in channels, facilitated by over-widened channels that limit stream power and bed load transport (Jayakaran and Ward, 2007; Landwehr and Rhoads, 2003). As such, the predominant accumulation of channel bed sediments in our studied sites could indicate that there is an ongoing adjustment toward floodplain formation, in addition to existing floodplains. The space to allow channel sedimentation before it puts conveyance capacity at risk is also greater in remediated streams and could motivate abstention from dredging to allow stabilization of fluvial equilibrium and adjustments of floodplains to the streams' fluvial conditions. Enhancing this potential by providing more space and designing wider floodplains is therefore important to effectively reduce P exports, rather than resorting to frequent channel dredging that systematically resets the fluvial imbalance. As future climate will bring higher frequencies of hydrological extremes and consequently higher P exports (Mehdi et al., 2015; Ockenden et al., 2017), remediation of agricultural streams can offer improved flood control, together with enhanced water purification.
Human pressures on freshwater resources, exacerbated by climate change, require urgent adjustment in agricultural streams to improve their capacity to transport and process large water and pollution fluxes. To date, nutrient mitigation strategies focus largely on in-field and point measures (e.g., soil management and wetlands), ignoring the enormous potential of headwater agricultural streams and their corridors as interfaces for reducing multiple pollutants (SS, N, and P) while also providing flood control. Evaluating the capacity for stream remediation in agricultural landscapes to reduce SS and P export, as carried out in this study, is therefore a critical step in improving our understanding of how agricultural streams can be modified to reduce downstream water quality impacts.
In this study, we demonstrated that reductions in stream water P concentrations and loads along remediated streams can be achieved with floodplains constructed laterally on both sides of the channel, compared with one-sided floodplains and control streams (trapezoidal channels). Higher catchment supply of P, driven by agricultural land use, also increased P reduction capacity in two-sided remediated streams. By linking fluvial dynamics with P storage and water quality impacts, our results showed that with narrow floodplains, PP reductions were controlled by protection against erosion rather than by the promotion of deposition. In this sense, remediated streams operate according to a different principle than flow-through wetlands, with the focus on reducing erosion and near-stream P inputs rather than actively trapping upstream-derived sediments. However, by extending the width of floodplains, the importance of P deposition for PP reductions is expected to increase. The fact that heavily impacted catchments in this study delivered high loads of N and P, as is typical in agricultural streams, underscores the need to adopt management strategies that can maximize reductions of multiple pollutants and minimize the risk for pollution swapping. Although the optimal design for PP reduction also has the potential to promote N removal, there is a further need to understand the effect on SRP dynamics when promoting high inundation frequencies and deposition of sediments with labile P.
The water and sediment chemistry and hydrology measurements from the studied sites are provided as a Supplement.
The supplement related to this article is available online at: https://doi.org/10.5194/hess-28-341-2024-supplement.
LH: conceptualization, methodology, data curation, formal analysis, visualization, writing – original draft, writing – review and editing. FD: methodology, formal analysis, writing – review and editing. MB: conceptualization, methodology, formal analysis, writing – review and editing, funding acquisition.
The contact author has declared that none of the authors has any competing interests.
Publisher's note: Copernicus Publications remains neutral with regard to jurisdictional claims made in the text, published maps, institutional affiliations, or any other geographical representation in this paper. While Copernicus Publications makes every effort to include appropriate place names, the final responsibility lies with the authors.
The authors would like to thank private landowners and stakeholders in the study catchments for their help with collecting water and sediment samples and for providing access to field sites, especially Christoffer Bonthron from Tullstorpsåprojektet, Anuschka Heeb from Lovang AB and Dennis Wiström from Västerviks kommun. We would also like to thank Sheryl Illao Åström for conducting the geometrical surveys and compiling GPS data, and Emma Ryding for collecting sediments and performing sequential P fractionation.
This research has been supported by Svenska Forskningsrådet Formas (grant no. 2018-00890) Havs- och Vattenmyndigheten (grant no. 3280-2019), and Stiftelsen Oscar och Lili Lamms Minne (grant no. DO2019-0021).
This paper was edited by Jim Freer and reviewed by two anonymous referees.
Bagnold, R. A.: The nature of saltation and of “bed-load” transport in water, P. Roy. Soc. Lond. A Mat., 332, 473–504, https://doi.org/10.1098/rspa.1973.0038, 1973.
Bai, Y. and Zeng, Y.: Lateral distribution of sediment and phosphorus in a two-stage ditch with partial emergent vegetation on the floodplain, Environ. Sci. Pollut. R., 26, 29351–29365, https://doi.org/10.1007/s11356-019-06118-6, 2019.
Baker, D. B., Richards, R. P., Loftus, T. T., and Kramer, J. W.: A New Flashiness Index: Characteristics and Applications to Midwestern Rivers and Streams, J. Am. Water Resour. As., 40, 503–522, https://doi.org/10.1111/j.1752-1688.2004.tb01046.x, 2004.
Ballantine, D. J., Walling, D. E., Collins, A. L., and Leeks, G. J. L.: The content and storage of phosphorus in fine-grained channel bed sediment in contrasting lowland agricultural catchments in the UK, Geoderma, 151, 141–149, https://doi.org/10.1016/j.geoderma.2009.03.021, 2009.
Bowes, M. J., House, W. A., and Hodgkinson, R. A.: Phosphorus dynamics along a river continuum, Sci. Total Environ., 313, 199–212, https://doi.org/10.1016/S0048-9697(03)00260-2, 2003.
Bieroza, M., Bergström, L., Ulén, B., Djodjic, F., Tonderski, K., Heeb, A., Svensson, J., and Malgeryd, J.: Hydrologic extremes and legacy sources can override efforts to mitigate nutrient and sediment losses at the catchment scale, J. Environ. Qual., 48, 1314–1324, https://doi.org/10.2134/jeq2019.02.0063, 2019.
Bond, N.: Hydrostats: Hydrologic Indices for Daily Time Series Data, CRAN [code], https://CRAN.R-project.org/package=hydrostats (last access: 20 March 2023), 2022.
Brink, K., Juhlin, L., and Kuhlau, Å.: Svärtaåprojektet. 2010–2012: Erfarenheter av praktiskt åtgärdsarbete i samarbete med lantbrukare i Svärtaåns avrinningsområde, Länsstyrelsen Södermanlands län, Rapport 2013:23, 1–44, https://www.lansstyrelsen.se/download/18.2fbfd5001683832bf3f540f/1548075083889/Rapport%202013_23%20Svartaaprojektet-2010-2012-web.pdf (last access: 10 March 2023), 2012.
Correll, D. L.: The Role of Phosphorus in the Eutrophication of Receiving Waters: A Review, J. Environ. Qual., 27, 261–266, https://doi.org/10.2134/jeq1998.00472425002700020004x, 1998.
D'Ambrosio, J. L., Ward, A. D., and Witter, J. D.: Evaluating Geomorphic Change in Constructed Two-Stage Ditches, J. Am. Water Resour. As., 51, 910–922, https://doi.org/10.1111/1752-1688.12334, 2015.
Davis, R. T., Tank, J. L., Mahl, U. H., Winikoff, S. G., and Roley, S. S.: The Influence of Two-Stage Ditches with Constructed Floodplains on Water Column Nutrients and Sediments in Agricultural Streams, J. Am. Water Resour. As., 51, 941–955, https://doi.org/10.1111/1752-1688.12341, 2015.
Dialameh, B. and Ghane, E.: Effect of water sampling strategies on the uncertainty of phosphorus load estimation in subsurface drainage discharge, J. Environ. Qual., 51, 377–388, https://doi.org/10.1002/jeq2.20339, 2022.
Djodjic, F. and Markensten, H.: From single fields to river basins: Identification of critical source areas for erosion and phosphorus losses at high resolution, Ambio, 48, 1129–1142, https://doi.org/10.1007/s13280-018-1134-8, 2019.
Elwan, A., Singh, R., Patterson, M., Roygard, J., Horne, D., Clothier, B., and Jones, G.: Influence of sampling frequency and load calculation methods on quantification of annual river nutrient and suspended solids loads, Environ. Monit. Assess., 190, 78, https://doi.org/10.1007/s10661-017-6444-y, 2018.
Fox, G. A., Purvis, R. A., and Penn, C. J.: Streambanks: A net source of sediment and phosphorus to streams and rivers, J. Environ. Manage., 181, 602–614, https://doi.org/10.1016/j.jenvman.2016.06.071, 2016.
Gérard, F.: Clay minerals, iron/aluminum oxides, and their contribution to phosphate sorption in soils – A myth revisited, Geoderma, 262, 213–226, https://doi.org/10.1016/j.geoderma.2015.08.036, 2016.
Good, P.: Permutation tests: a practical guide to resampling methods for testing hypotheses, Springer Science & Business Media, 2nd edn., https://doi.org/10.1007/978-1-4757-3235-1, 2000.
Gustard, A., Bullock, A., and Dixon, J. M.: Low flow estimation in the United Kingdom, Institute of Hydrology, https://nora.nerc.ac.uk/id/eprint/6050/1/IH_108.pdf (last access: 12 February 2023), 1992.
Hallberg, L., Hallin, S., and Bieroza, M.: Catchment controls of denitrification and nitrous oxide production rates in headwater remediated agricultural streams, Sci. Total Environ., 838, 156513, https://doi.org/10.1016/j.scitotenv.2022.156513, 2022.
Hedin, J. and Kivivuori, H.: Tullstorpsåprojektet. Utvärdering. Tvåstegsdiken och kantavplaning sträckan Stora Markie-Stävesjö Ålholmens dikningsföretag, Naturvårdsingenjörerna AB, Rapport, 1–22, https://tullstorpsan.se/rapporter/Tvastegsdiken_och_kantavplaning.pdf (last access: 10 March 2023), 2015.
Herschy, R. W.: Streamflow Measurement, 3rd edn., CRC Press, https://doi.org/10.1201/9781482265880, 2014.
Ho, J. C., Michalak, A. M., and Pahlevan, N.: Widespread global increase in intense lake phytoplankton blooms since the 1980s, Nature, 574, 7780, https://doi.org/10.1038/s41586-019-1648-7, 2019.
Hupfer, M., Gächter, R., and Giovanoli, R.: Transformation of phosphorus species in settling seston and during early sediment diagenesis, Aquat. Sci., 57, 305–324, https://doi.org/10.1007/BF00878395, 1995.
Hupfer, M., Zak, D., Roßberg, R., Herzog, C., and Pöthig, R.: Evaluation of a well-established sequential phosphorus fractionation technique for use in calcite-rich lake sediments: Identification and prevention of artifacts due to apatite formation, Limnol. Oceanogr.-Meth., 7, 399–410, https://doi.org/10.4319/lom.2009.7.399, 2009.
Jarvie, H. P., Jürgens, M. D., Williams, R. J., Neal, C., Davies, J. J. L., Barrett, C., and White, J.: Role of river bed sediments as sources and sinks of phosphorus across two major eutrophic UK river basins: The Hampshire Avon and Herefordshire Wye, J. Hydrol., 304, 51–74, https://doi.org/10.1016/j.jhydrol.2004.10.002, 2005.
Jayakaran, A. D. and Ward, A. D.: Geometry of inset channels and the sediment composition of fluvian benches in agricultural drainage systems in Ohio, J. Soil Water Conserv., 62, 296–307, 2007.
Kindervater, E. and Steinman, A. D.: Two-Stage Agricultural Ditch Sediments Act as Phosphorus Sinks in West Michigan, J. Am. Water Resour. As., 55, 1183–1195, https://doi.org/10.1111/1752-1688.12763, 2019.
Kohl, M.: MKinfer: Inferential Statistics, CRAN [code], https://CRAN.R-project.org/package=MKinfer (last access: 20 March 2023), 2022.
Krider, L., Magner, J., Hansen, B., Wilson, B., Kramer, G., Peterson, J., and Nieber, J.: Improvements in Fluvial Stability Associated with Two-Stage Ditch Construction in Mower County, Minnesota, J. Am. Water Resour. As., 53, 886–902, https://doi.org/10.1111/1752-1688.12541, 2017.
Kronvang, B., Andersen, H. E., Larsen, S. E., and Audet, J.: Importance of bank erosion for sediment input, storage and export at the catchment scale, J. Soil. Sediment., 13, 230–241, https://doi.org/10.1007/s11368-012-0597-7, 2013.
Kyllmar, K., Forsberg, L. S., Andersson, S., and Mårtensson, K.: Small agricultural monitoring catchments in Sweden representing environmental impact, Agr. Ecosyst. Environ., 198, 25–35, https://doi.org/10.1016/j.agee.2014.05.016, 2014.
Lacoursière, J. O. and Vought, L. B.: Field Evaluation of Two-Stage Channels Impact on Local Biodiversity and Nutrient Retention Potential, Environmental Awareness International, Report Number: 2020:06, https://northsearegion.eu/media/14698/raaaan-two-stage-channels-impact-on-biodiversity-and-nutrient-retention.pdf (last access: 10 February 2023), 2020.
Landemaine, V., Gay, A., Cerdan, O., Salvador-Blanes, S., and Rodrigues, S.: Morphological evolution of a rural headwater stream after channelisation, Geomorphology, 230, 125–137, https://doi.org/10.1016/j.geomorph.2014.11.011, 2015.
Landwehr, K. and Rhoads, B. L.: Depositional response of a headwater stream to channelization, East Central Illinois, USA, River Res. Appl., 19, 77–100, https://doi.org/10.1002/rra.699, 2003.
Lannergård, E. E., Agstam-Norlin, O., Huser, B. J., Sandström, S., Rakovic, J., and Futter, M. N.: New Insights Into Legacy Phosphorus From Fractionation of Streambed Sediment, J. Geophys. Res.-Biogeo., 125, e2020JG005763, https://doi.org/10.1029/2020JG005763, 2020.
Leppo, E.: ContDataQC: Quality Control (QC) of Continous Monitoring Data, GitHub [code], https://github.com/leppott/ContDataQC/ (last access: 20 March 2023), 2023.
Lindmark, P., Karlsson, L., and Nordlund, J.: Tvåstegsdiken – ett steg i rätt riktning?, Jordbruksverket, Rapport 2013:15, https://www2.jordbruksverket.se/webdav/files/SJV/trycksaker/Pdf_rapporter/ra13_15.pdf (last access: 10 March 2023), 2013.
Littlejohn, K. A., Poganski, B. H., Kröger, R., and Ramirez-Avila, J. J.: Effectiveness of low-grade weirs for nutrient removal in an agricultural landscape in the Lower Mississippi Alluvial Valley, Agr. Water Manage., 131, 79–86, https://doi.org/10.1016/j.agwat.2013.09.001, 2014.
Lorenz, A. W., Jähnig, S. C., and Hering, D.: Re-meandering German lowland streams: qualitative and quantitative effects of restoration measures on hydromorphology and macroinvertebrates, Environ. Manage., 44, 745–754, https://doi.org/10.1007/s00267-009-9350-4, 2009.
Magner, J., Hansen, B., Sundby, T., Kramer, G., Wilson, B., and Nieber, J.: Channel evolution of Des Moines Lobe till drainage ditches in southern Minnesota (USA), Environ. Earth Sci., 8, 2359–2369, https://doi.org/10.1007/s12665-012-1682-3, 2012.
Mahl, U. H., Tank, J. L., Roley, S. S., and Davis, R. T.: Two-Stage Ditch Floodplains Enhance N-Removal Capacity and Reduce Turbidity and Dissolved P in Agricultural Streams, J. Am. Water Resour. As., 51, 923–940, https://doi.org/10.1111/1752-1688.12340, 2015.
Mehdi, B., Ludwig, R., and Lehner, B.: Evaluating the impacts of climate change and crop land use change on streamflow, nitrates and phosphorus: a modeling study in Bavaria, J. Hydrol. Reg. Stud., 4, 60–90, https://doi.org/10.1016/j.ejrh.2015.04.009, 2015.
Murphy, J. and Riley, J. P.: A modified single solution method for the determination of phosphate in natural waters, Anal. Chim. Acta, 27, 31–36, https://doi.org/10.1016/S0003-2670(00)88444-5, 1962.
Noe, G. B., Boomer, K., Gillespie, J. L., Hupp, C. R., Martin-Alciati, M., Floro, K., Schenk, E. R., Jacobs, A., and Strano, S.: The effects of restored hydrologic connectivity on floodplain trapping vs. Release of phosphorus, nitrogen, and sediment along the Pocomoke River, Maryland USA, Ecol. Eng., 138, 334–352, https://doi.org/10.1016/j.ecoleng.2019.08.002, 2019.
Ockenden, M. C., Hollaway, M. J., Beven, K. J., Collins, A. L., Evans, R., Falloon, P. D., Forber, K. J., Hiscock, K. M., Kahana, R., Macleod, C. J. A., Tych, W., Villamizar, M. L., Wearing, C., Withers, P. J. A., Zhou, J. G., Barker, P. A., Burke, S., Freer, J. E., Johnes, P. J., Snell, M. A., Surridge B. W. J., and Haygarth, P. M.: Major agricultural changes required to mitigate phosphorus losses under climate change, Nat. Commun., 8, 161, https://doi.org/10.1038/s41467-017-00232-0, 2017.
Oksanen, J., Simpson, G., Blanchet, F., Kindt, R., Legendre, P., Minchin, P., O'Hara, R., Solymos, P., Stevens, M., Szoecs, E., Wagner, H., Barbour, M., Bedward, M., Bolker, B., Borcard, D., Carvalho, G., Chirico, M., De Caceres, M., Durand, S., Evangelista, H., FitzJohn, R., Friendly, M., Furneaux, B., Hannigan, G., Hill, M., Lahti, L., McGlinn, D., Ouellette, M., Ribeiro Cunha, E., Smith, T., Stier, A., Ter Braak, C., and Weedon, J.: Vegan: Community Ecology Package, CRAN [code], https://CRAN.R-project.org/package=vegan (last access: 20 March 2023), 2022.
Powell, G. E., Ward, A. D., Mecklenburg, D. E., and Jayakaran, A. D.: Two-stage channel systems: Part 1, a practical approach for sizing agricultural ditches, J. Soil Water Conserv., 10, 277–286, 2007.
Psenner, R. and Puckso, R.: Phosphorus fractionation: Advantages and limits of the method for the study of sediment P origins and interactions, Arch. Hydrobiol., 30, 43–59, 1988.
Reinfelds, I., Cohen, T., Batten, P., and Brierley, G.: Assessment of downstream trends in channel gradient, total and specific stream power: a GIS approach, Geomorphology, 60, 403–416, https://doi.org/10.1016/j.geomorph.2003.10.003, 2004.
RStudio Team: RStudio: Integrated Development for R, http://www.rstudio.com/, last access: 25 October 2022.
Sandström, S., Futter, M. N., Kyllmar, K., Bishop, K., O'Connell, D. W., and Djodjic, F.: Particulate phosphorus and suspended solids losses from small agricultural catchments: Links to stream and catchment characteristics, Sci. Total Environ., 711, 134616, https://doi.org/10.1016/j.scitotenv.2019.134616, 2020.
Sandström, S., Futter, M. N., O'Connell, D. W., Lannergård, E. E., Rakovic, J., Kyllmar, K., Gill, L. W., and Djodjic, F.: Variability in fluvial suspended and streambed sediment phosphorus fractions among small agricultural streams, J. Environ. Qual., 50, 612–626, https://doi.org/10.1002/jeq2.20210, 2021.
Sharpley, A., Jarvie, H. P., Buda, A., May, L., Spears, B., and Kleinman, P.: Phosphorus Legacy: Overcoming the Effects of Past Management Practices to Mitigate Future Water Quality Impairment, J. Environ. Qual., 42, 1308–1326, https://doi.org/10.2134/jeq2013.03.0098, 2013.
Simon, A. and Rinaldi, M.: Disturbance, stream incision, and channel evolution: The roles of excess transport capacity and boundary materials in controlling channel response, Geomorphology, 79, 361–383, https://doi.org/10.1016/j.geomorph.2006.06.037, 2006.
Smith, V. H.: Eutrophication of freshwater and coastal marine ecosystems a global problem, Environ. Sci. Pollut. R., 10, 126–139, https://doi.org/10.1065/espr2002.12.142, 2003.
Speir, S. L., Tank, J. L., and Mahl, U. H.: Quantifying denitrification following floodplain restoration via the two-stage ditch in an agricultural watershed, Ecol. Eng., 155, 105945, https://doi.org/10.1016/j.ecoleng.2020.105945, 2020.
Thorne, C. R. and Tovey, N. K.: Stability of composite river banks, Earth Surf. Proc. Land., 6, 469–484, https://doi.org/10.1002/esp.3290060507, 1981.
Trentman, M. T., Tank, J. L., Jones, S. E., McMillan, S. K., and Royer, T. V.: Seasonal evaluation of biotic and abiotic factors suggests phosphorus retention in constructed floodplains in three agricultural streams, Sci. Total Environ., 729, 138744, https://doi.org/10.1016/j.scitotenv.2020.138744, 2020.
Wiström, D. and Lindberg, G.: Havsmiljö Gamlebyviken del 3 Övergödningen som en resurs – Slutrapport, Västerviks kommun, 1–29, https://www.vastervik.se/globalassets/trafik-och-infrastruktur/hallbar-utveckling/bilaga-1-slutrapport-havsmiljo-gamlebyviken-3-20161215rev.pdf (last access: 10 March 2023), 2016.
Wohl, E., Lane, S., and Wilcox, A.: The science and practice of river restoration, Water Resour. Res., 51, 5974–5997, https://doi.org/10.1002/2014WR016874, 2015.
Wollheim, W. M., Bernal, S., Burns, D. A., Czuba, J. A., Driscoll, C. T., Hansen, A. T., Hensley, R. T., Hosen, J. D., Inamdar, S., Kaushal, S. S., Koenig, L. E., Lu, Y. H., Marzadri, A., Raymond, P. A., Scott, D., Stewart, R. J., Vidon, P. G., and Wohl, E.: River network saturation concept: Factors influencing the balance of biogeochemical supply and demand of river networks, Biogeochemistry, 141, 503–521, https://doi.org/10.1007/s10533-018-0488-0, 2018.
Worrall, F., Burt, T. P., Hancock, G. R., Howden, N. J. K., and Wainwright, J.: The problem of underpowered rivers, Earth Surf. Proc. Land., 45, 3869–3878, https://doi.org/10.1002/esp.5007, 2020.