the Creative Commons Attribution 4.0 License.
the Creative Commons Attribution 4.0 License.
 | 25 Jul 2024
The agricultural expansion in South America's Dry Chaco: regional hydroclimate effects
María Agostina Bracalenti
Miguel A. Lovino
Ernesto Hugo Berbery
The Gran Chaco ecoregion is South America's largest remaining continuous stretch of dry forest. It has experienced intensive deforestation, mainly in the western part known as the Dry Chaco, resulting in the highest rate of dry-forest loss globally between 2000 and 2012. The replacement of natural vegetation with other land uses modifies the surface's biophysical properties, affecting heat and water fluxes and modifying the regional climate. This study examines land use and land cover changes (LULCCs) in the Dry Chaco from 2001 to 2015 and their effects on local and non-local climate and explores the potential impacts of future agricultural expansion in the region. To this end, Weather Research and Forecasting (WRF) model simulations are performed for two scenarios: the first one evaluates the observed land cover changes between 2001 and 2015 that covered 8 % of the total area of the Dry Chaco; the second scenario assumes an intensive agricultural expansion within the Dry Chaco. In both scenarios, deforestation processes lead to decreases in leaf area index (LAI), reductions in stomatal resistance, and increases in albedo, thus reducing the net surface radiation and, correspondingly, decreasing the turbulent fluxes, suggesting a decline in available energy in the boundary layer. The result is an overall weakening of the water cycle in the Dry Chaco and, most prominently, implying a reduction in precipitation. A feedback loop develops since dry soil absorbs significantly less solar radiation than moist soil. Finally, the simulations suggest that the Dry Chaco will intensify its aridity, extending drier and hotter conditions into the Humid Chaco.
- Article
(3987 KB) - Full-text XML
- BibTeX
- EndNote


The expansion of the agricultural frontier in southern South American countries (Brazil, Paraguay, Argentina, and Uruguay) has been favoured by natural, technological, economic, and socio-cultural factors. Large areas of South America have experienced a significant increase in land use and land cover changes (LULCCs), mostly of anthropogenic origin (Richards et al., 2012; De Sy et al., 2015; Stanimirova et al., 2022). The regional increase in annual average rainfall in arid regions (Barros et al., 2015), combined with biotechnological advances (Ribichich et al., 2020; Bulacio et al., 2023), strengthened the crops' adaptability to adverse climate conditions and enhanced the availability of productive lands. Moreover, the availability of cheap land and labour, the lack of environmental regulations or their inadequate enforcement, and the increased food demand from new international markets in the last decades have contributed to the agricultural expansion advancing on native vegetation (Paruelo et al., 2005; Volante et al., 2016).
The Gran Chaco, comprised of the arid Dry Chaco in the west and the Humid Chaco in the east, stands as the largest remaining continuous stretch of dry forest in South America (Portillo-Quintero and Sanchez-Azofeifa, 2010). This dry-forest ecoregion combines all the previous factors that increase the crop productivity, leading to an intensive deforestation process, predominantly in the Dry Chaco subregion (Fehlenberg et al., 2017; Mosciaro et al., 2022). Currently, only 9 % of Gran Chaco is protected (Nori et al., 2016), exposing it to the highest rate of dry-forest loss worldwide and positioning the region as one of the largest global deforestation hotspots (Hansen et al., 2013). The Gran Chaco underwent deforestation of 78 000 km2 between 2001 and 2012, with varying deforestation rates, from ∼2900 km2 yr−1 during 2001–2002 to ∼9200 km2 yr−1 during 2007–2008 (Fehlenberg et al., 2017). In particular, dry-forest deforestation rates in the Argentinian part of Gran Chaco during the 2000s became up to 3 times higher than in the 1980s (Piquer-Rodríguez et al., 2015).
LULCCs affect the soil state and the overlying atmosphere through the influence of the soil conditions on the land–atmosphere interactions (Dirmeyer, 2000). This is particularly evident in southern South America, where the land–atmosphere coupling shows strong relationships between the water cycle components (Spennemann and Saulo, 2015; Ruscica et al., 2016; Martínez et al., 2016). The replacement of natural vegetation by pastures, crops, or other types of land use modifies biophysical properties related to vegetation (albedo, stomatal resistance, surface roughness, among others), altering the ecosystem functioning and the surface fluxes (Lee and Berbery, 2012; Müller et al., 2014; Baldi et al., 2015). For instance, when crops replace forests, groundwater uptake and transpiration are reduced due to the lack of deep roots in crops. This mechanism may induce the rise of the water table level, facilitating soil saturation and increasing surface runoff and, therefore, the probability of occurrence of floods or waterlogging (Miguez-Macho et al., 2007; Martínez et al., 2016).
In brief, the changes in soil conditions affect the energy and water fluxes on the surface, which in turn modify the atmospheric fluxes (e.g. moisture transport) (Lee and Berbery, 2012; Mahmood et al., 2014). Thus, LULCCs inevitably alter the local climate state, but they may also impact adjacent or remote areas due to changes in river flow or atmospheric dynamics (Mahmood et al., 2010). A suitable way to comprehensively investigate the impact of LULCCs on the regional climate is using regional climate model (RCM) simulations. RCMs have two components – the land surface and the atmosphere – that interact at each time step through surface fluxes, enabling feedback between the atmosphere and the soil, thus uncovering the atmospheric response to LULCCs. Land cover types and their associated biophysical properties are usually prescribed in land surface models (LSMs), the land component of RCMs. This feature hinders LSMs from simulating ongoing LULCCs (Maertens et al., 2021). However, sensitivity experiments can be conducted by updating the land cover map to simulate the impact of observed LULCCs on the regional hydroclimate (e.g. Lal et al., 2021) or artificially modifying the land cover to simulate possible scenarios of LULCCs and their potential impacts (e.g. Lee and Berbery, 2012; Georgescu et al., 2013; Flanagan et al., 2021).
In this context, and as a follow-on of the previous studies, the questions that motivate this paper are as follows: how do LULCCs in the Dry Chaco alter the land surface processes locally? And what are the local and non-local effects of LULCCs on the Gran Chaco? To answer the questions raised, we adopt a comprehensive three-step methodology. First, we evaluate the dominant LULCC in the Dry Chaco during the current century using state-of-the-art satellite information (the Moderate Resolution Imaging Spectroradiometer, MODIS). Second, we analyse the local effects of current LULCCs in the Dry Chaco by assessing simulations performed for the same period but using MODIS land cover maps of different years with the Weather Research and Forecasting (WRF) model. Third, we investigate the remote effects of LULCCs in the Humid Chaco by analysing WRF simulations that assume a progressive expansion of the agricultural frontier in the Dry Chaco. In this way, this study considers both observed and possible future expansions of LULCCs, offering a nuanced understanding of the actual and potential impacts on regional climate. By considering these two scenarios, it is possible to hypothesize how agricultural expansion in one region influences the hydroclimate of another, which is crucial for effective regional land use planning on a topic prone to developing socio-ecological conflicts associated with LULCCs. This focus on uncovering the processes behind such remote effects is a relatively unexplored aspect of existing literature.
The paper is organized as follows: Sect. 2 describes the region of interest, the observational data, the experiments, and the evaluation datasets. Section 3 evaluates the performance of the WRF control simulations. Section 4 presents the analysis of the model simulation responses to different LULCC scenarios. Finally, a discussion is provided in Sect. 5, and the concluding remarks are summarized in Sect. 6.
2.1 Study region
2.1.1 Geographical features
The Gran Chaco is a natural region of about 1.1×10⁶ km2 stretching from northern Argentina to southeastern Bolivia and northwestern Paraguay (Fig. 1). In South America, it is the second-largest forest after the Amazon and the largest remaining continuous stretch of dry forest (Bucher and Huszar, 1999; Portillo-Quintero and Sánchez-Azofeifa, 2010). The Gran Chaco is characterized by a flat topography, with elevations varying between 100 and 500 m. The region is part of the subtropical belt, with a latitudinal south–north thermal gradient with a mean annual temperature ranging from 19 to 24 °C (Garreaud et al., 2009; Almazroui et al., 2021). The region shows a pronounced longitudinal gradient in precipitation, dividing the Gran Chaco into two distinct subregions: the Dry Chaco and the Humid Chaco (as indicated by the borders in Fig. 1). The Dry Chaco is dominated by a semi-arid climate, with annual precipitation ranging from 450 to 900 mm. The Humid Chaco presents a humid subtropical climate, with annual precipitation of about 900–1200 mm (Garreaud et al., 2009; Almazroui et al., 2021). Note that the Gran Chaco region exhibits minimal sensitivity to large-scale phenomena such as the El Niño–Southern Oscillation (ENSO) and the Madden–Julian Oscillation (MJO). Extreme ENSO phases predominantly induce precipitation excesses or deficits in eastern southeastern South America (SESA), with minimal influence observed in the study region (Cai et al., 2020). The MJO has a non-significant impact on precipitation anomalies over the Gran Chaco region (Grimm, 2019).
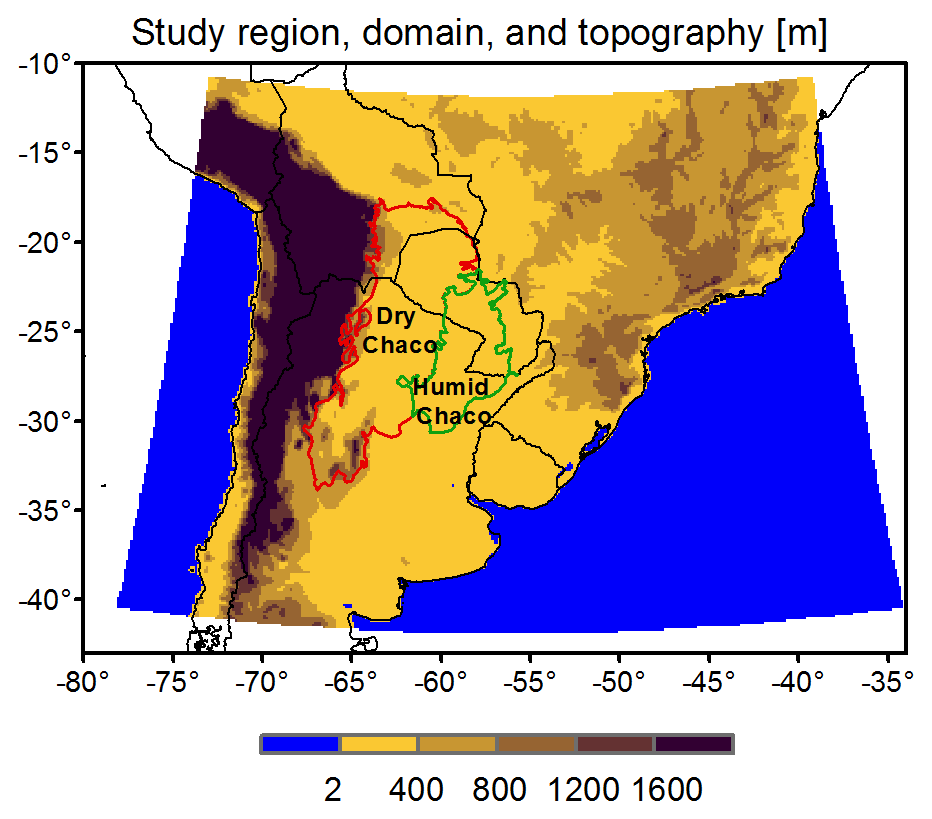
Figure 1Model domain and topography. The coloured lines highlight the Gran Chaco subregions: the Dry Chaco (red) and the Humid Chaco (green).
The Gran Chaco is one of the most dramatic global deforestation hotspots, with the highest rate of dry-forest loss in the world in the 2000–2012 period (Hansen et al., 2013), due to the expansion of soybean production and cattle ranching (Fehlenberg et al., 2017). The Humid Chaco has been intensively transformed into agriculture, while the Dry Chaco remained largely forested because agriculture methods depend on rain, making it unprofitable despite high soil fertility and flat terrain (Bucher and Huszar, 1999). This historical behaviour has changed in recent decades due to the westward shift of the isohyets in the Gran Chaco and the availability of climate-resistant seeds (Dros, 2004).
2.1.2 Land cover and its evolution in the Dry Chaco
The dominant land cover in the Dry Chaco and its evolution from 2001 to 2015 are estimated using land use maps derived from the MODIS Land Cover Climate Modeling Grid product, MCD12C1. The product is provided as a global mosaic at 0.05° grid spacing and follows the International Geosphere-Biosphere Programme (IGBP) classification.
The top land cover categories in the region, as observed in 2015, are savanna, woody savanna, forest, grassland, shrubland, and cropland (Fig. 2a). Figure 2b shows how the dominant land cover categories in the Dry Chaco evolved from 2001 to 2015. For simplicity, some of the IGBP types were grouped into major land cover classes on this panel. For instance, forest includes evergreen broadleaf, deciduous broadleaf, and mixed forests, and shrubland includes closed and open shrublands, while cropland includes a cropland and cropland–natural vegetation mosaic. The land cover evolution indicates that agricultural lands (cropland and grassland) mainly increased up to 2007. Between 2001 and 2015, agriculture coverage increased by 15.4 %, representing 2.6 % of the total area of the Dry Chaco. On the other hand, forests and woody savanna decreased by 1.5 % and 16.4 %, respectively, representing 4.3 % of the Dry Chaco area.
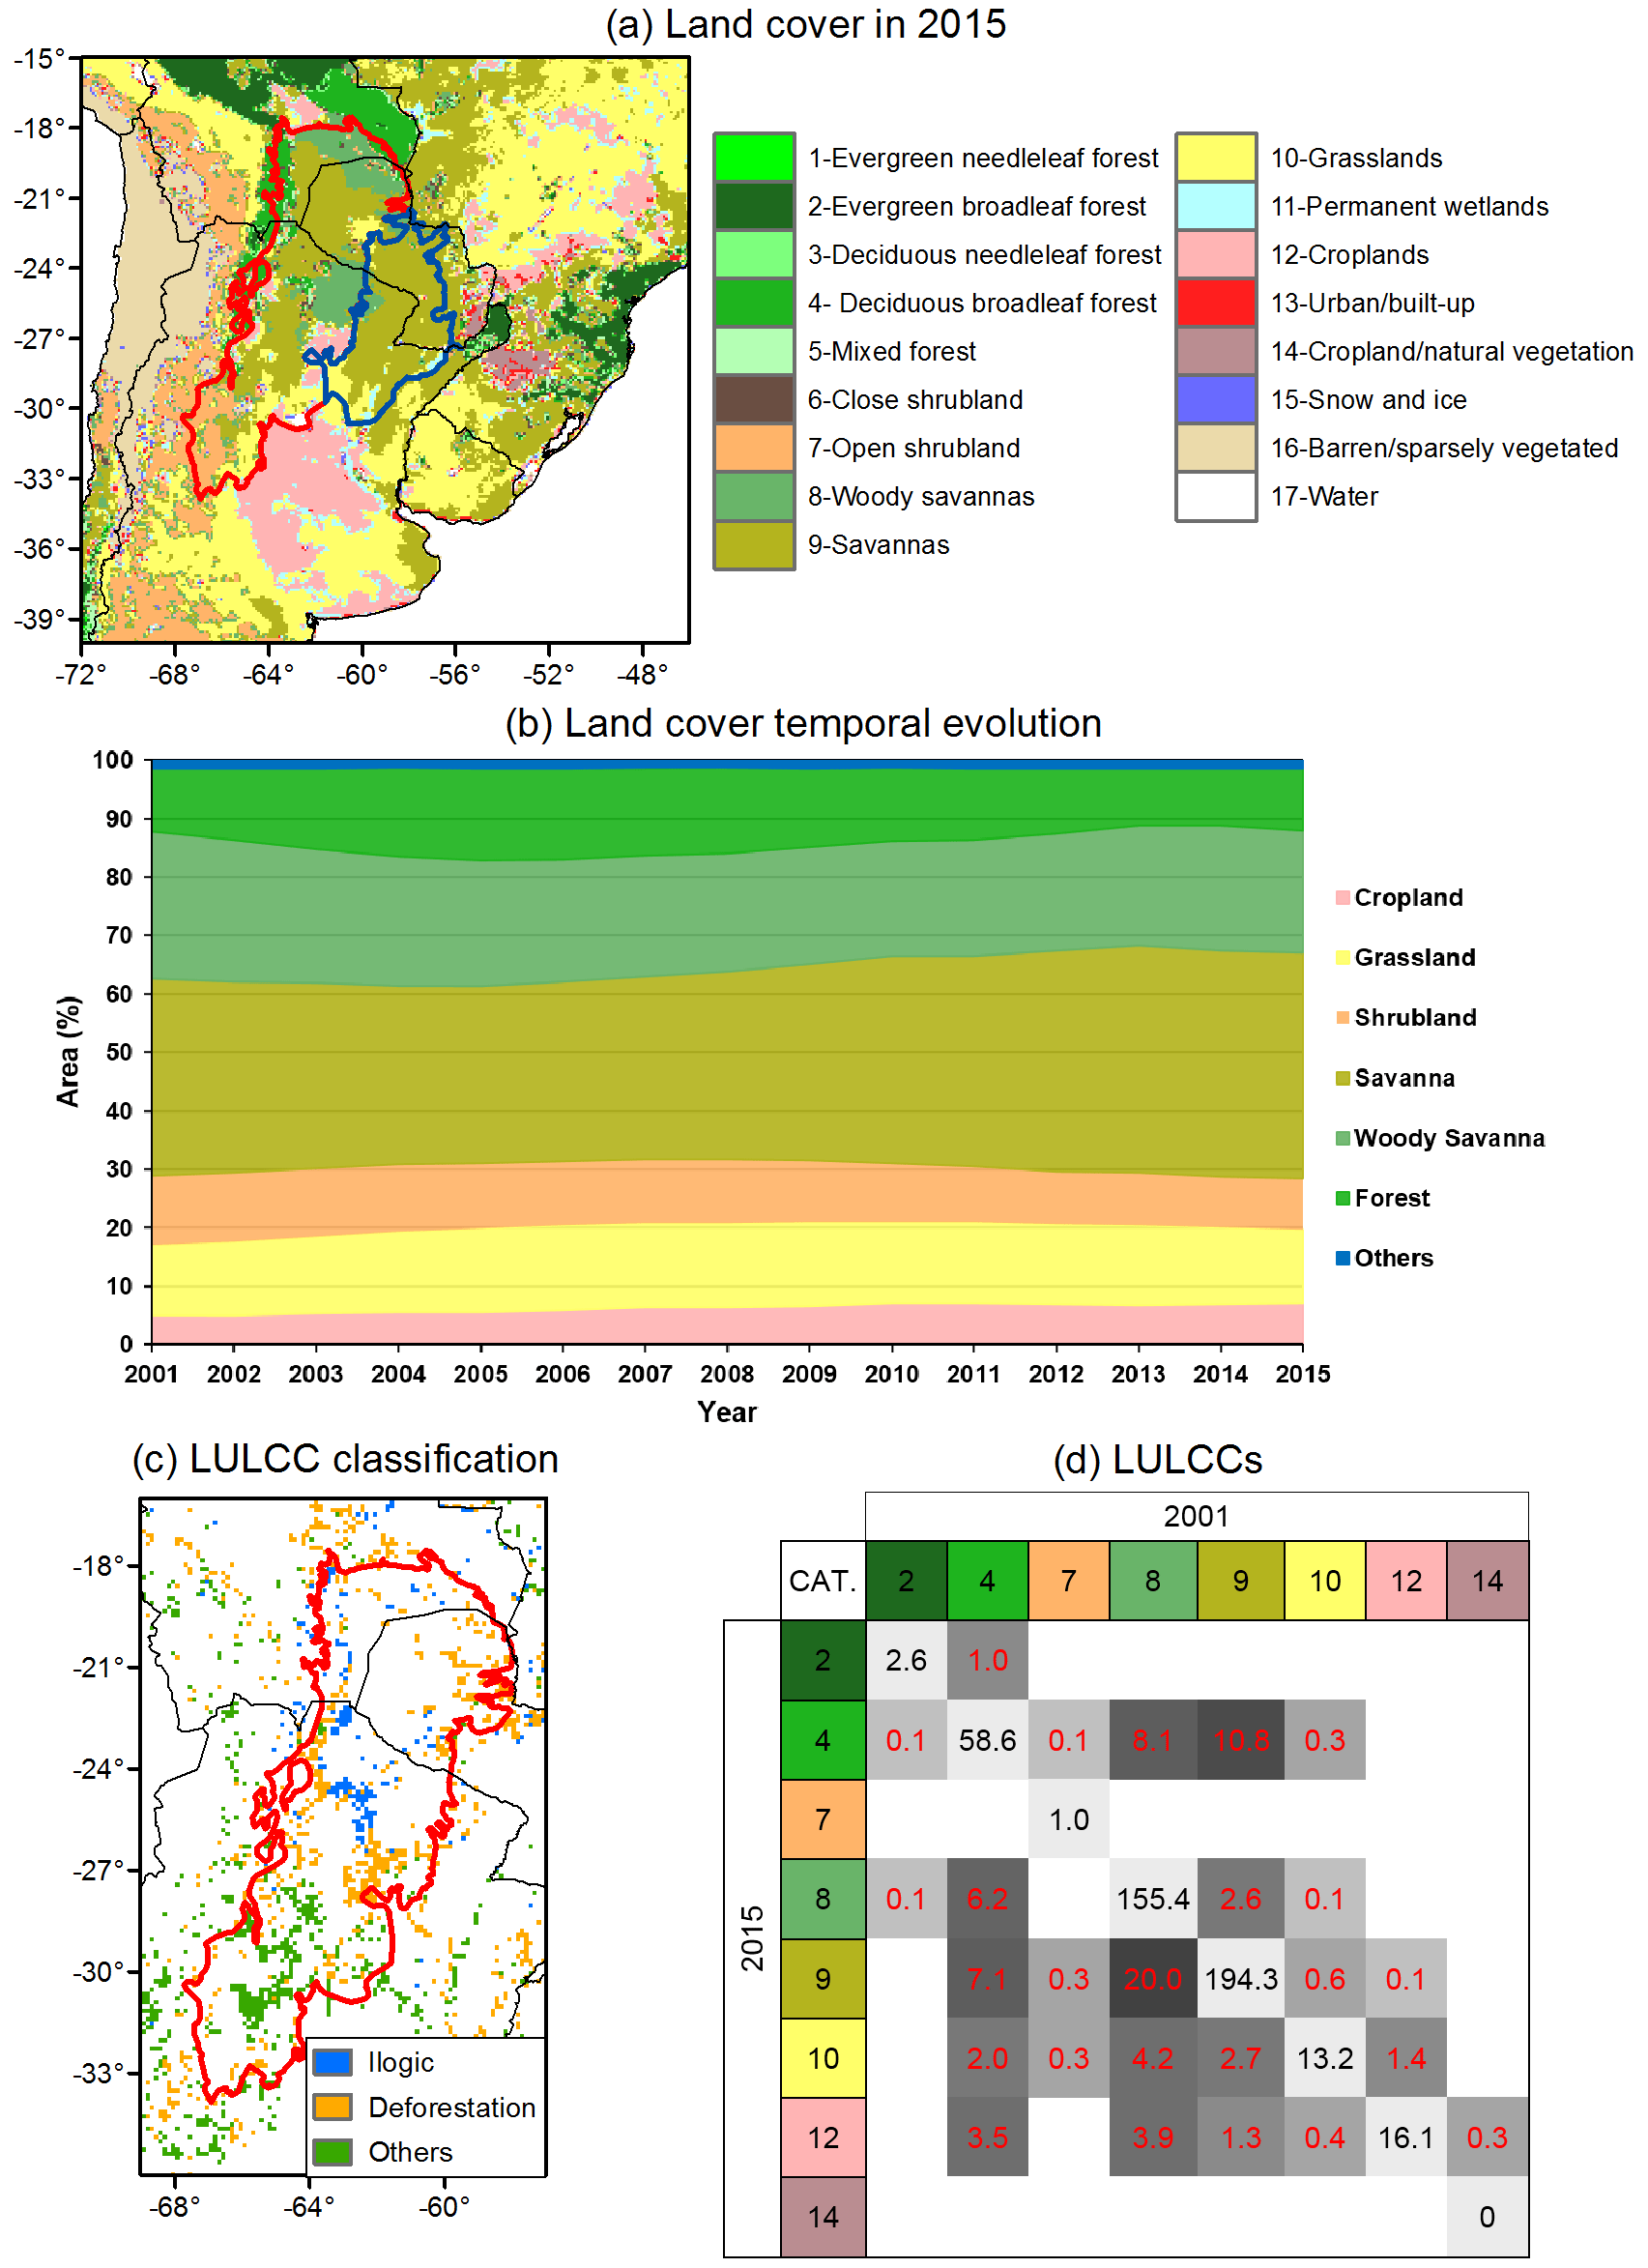
Figure 2(a) The 2015 MODIS land cover map using IGBP classification. (b) Temporal evolution of land cover in the Dry Chaco. For simplicity, land cover types are aggregated in fewer classes (see text). (c) LULCCs in the Dry Chaco. (d) Quantification (1000 km2) of LULCCs in the Dry Chaco from 2001 to 2015. The cell shade is proportional to its value.
Figure 2c indicates that 18 % of the Dry Chaco area suffered LULCCs from 2001 to 2015. These changes are quantified per category in Fig. 2d. Most of these changes (52 %) involve transitioning from categories characterized by higher tree coverage to others with lower coverage, which could be associated with deforestation processes. According to Fig. 2d, they are as follows:
-
from woody savanna to savanna, 23 328 km2;
-
from savanna to agriculture, 12 672 km2 (40 % to cropland and 60 % to grassland);
-
from woody savanna to agriculture, 10 368 km2 (50 % to cropland and 50 % to grassland);
-
from forest to savanna, 8064 km2;
-
from forest to woody savanna, 6336 km2;
-
from forest to agriculture, 6192 km2 (67 % to cropland and 33 % to grassland); and
-
from open shrubland to grassland, 5904 km2.
Note that about 31 % of the area corresponds to changes called “others” that consist of changes that are not linked to deforestation processes (e.g. from open shrubland to savanna or to barren and from grassland to cropland). Curiously, about 17 % of the changes are from savanna and woody savanna to deciduous broadleaf forests. This transformation between natural land covers in a short period (14 years) is unthinkable in the real world. The rapid and natural conversion to deciduous broadleaf forests contradicts established ecological dynamics and is likely an artefact of the computation algorithms of land cover maps (Liang and Gong, 2010; Cai et al., 2014). Following the terminology defined by Cai et al. (2014), these implausible rapid transformations are named “illogical” in Fig. 2c.
2.2 The WRF model and its configuration
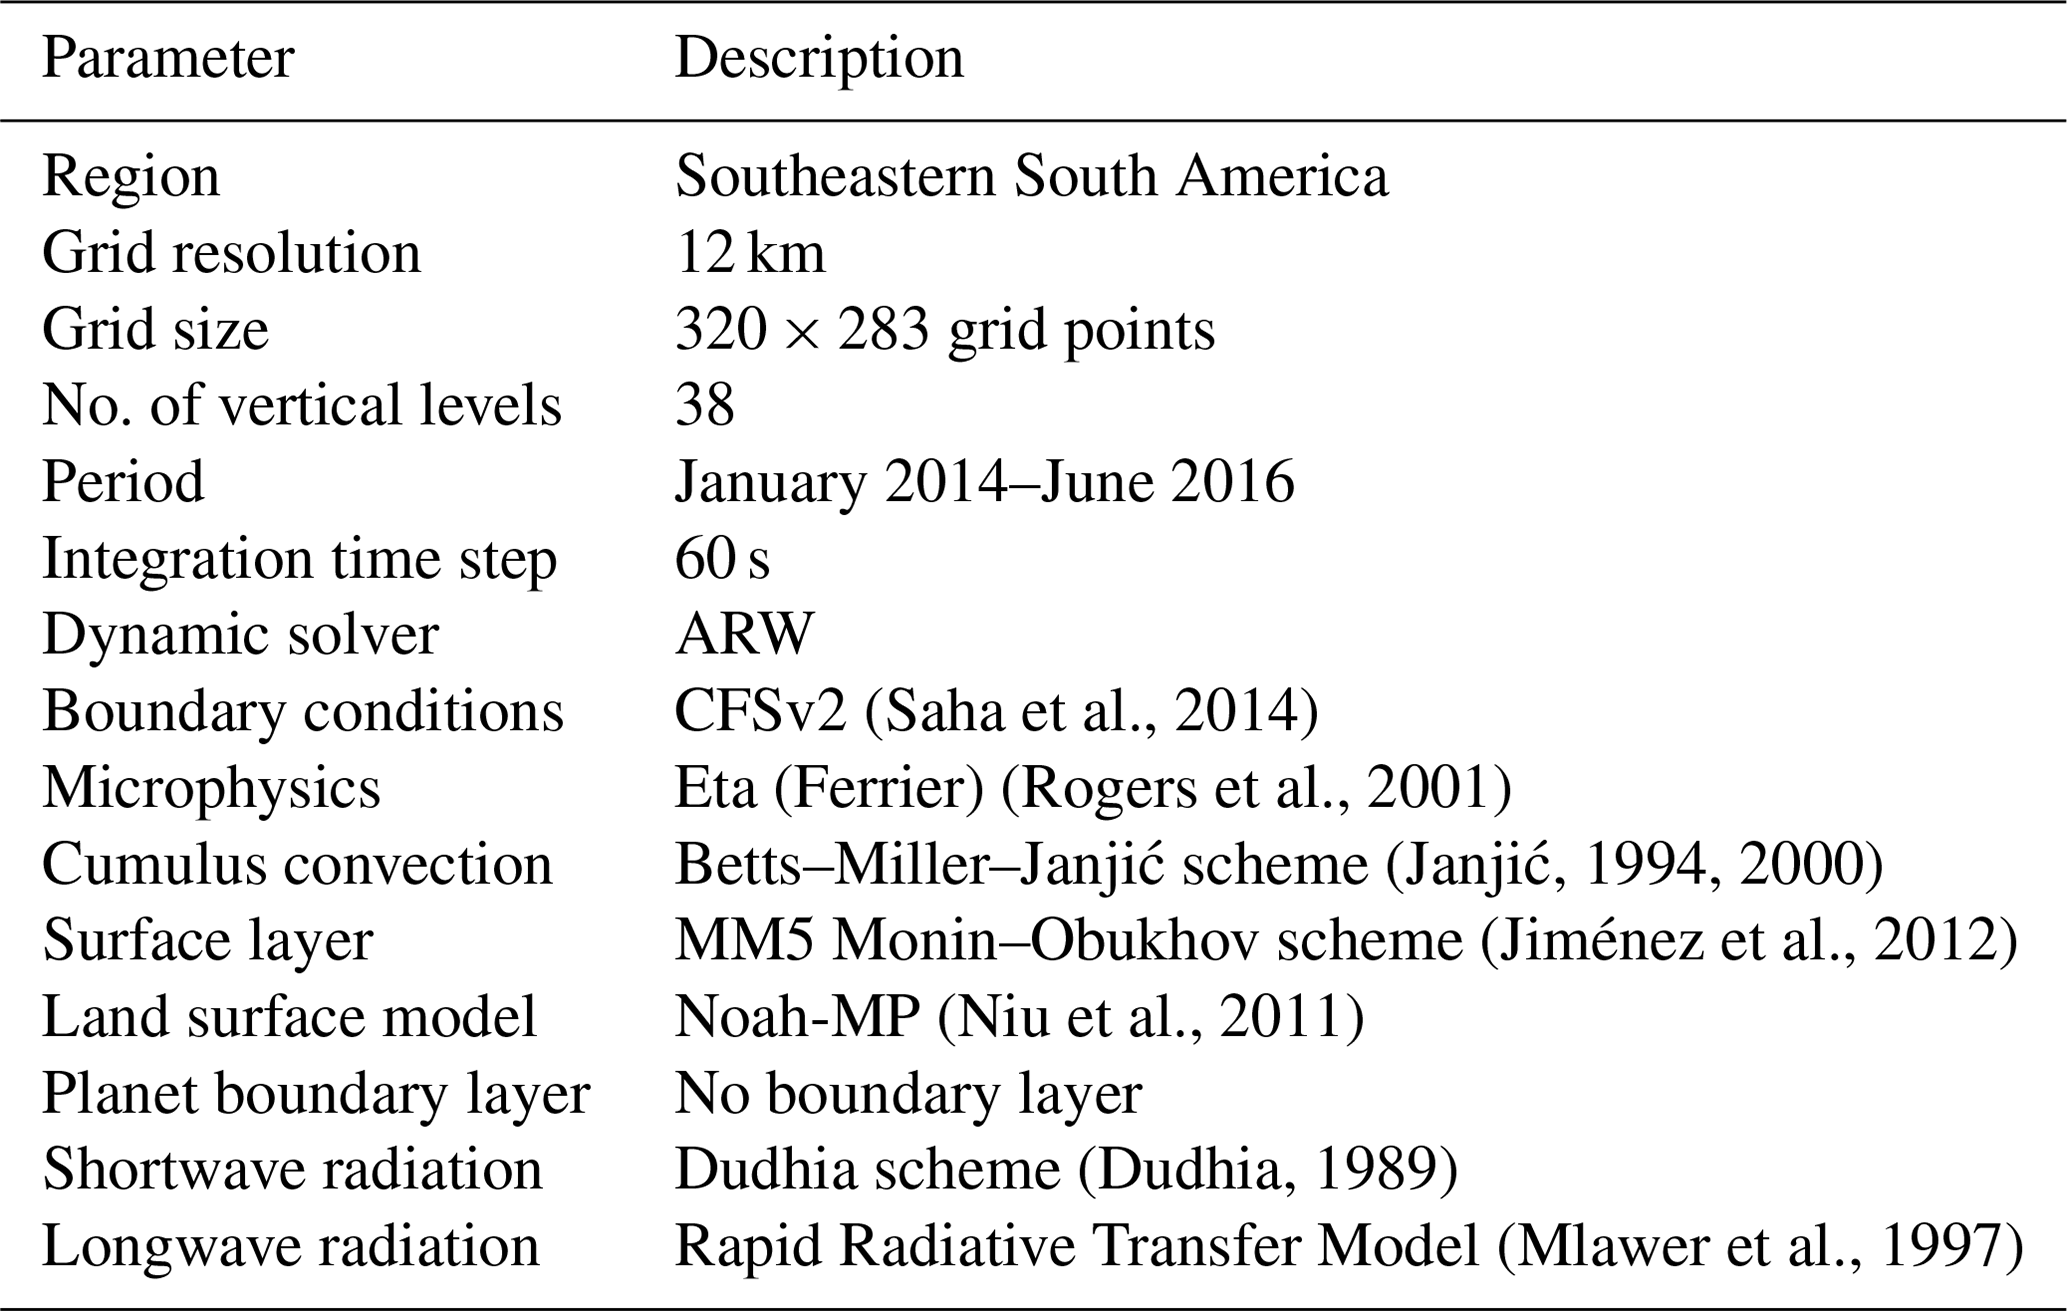
The numerical simulations were performed with the WRF model in its Advanced Research WRF (ARW) version 3.9 (Skamarock et al., 2008). The WRF was run with a horizontal grid spacing of 12 km and 38 vertical levels over a domain that covers the southern part of South America, which includes the Gran Chaco (see Fig. 1). A lateral boundary relaxation zone spanning 10 grid points was implemented, and spectral nudging within the domain was intentionally omitted to allow the atmosphere more freedom in responding to surface forcing (Pohl and Crétat, 2014). The model physics configuration is summarized in Table 1. The physical parameterizations follow the selection of schemes and options suggested by Lee (2010) and Lee and Berbery (2012), who developed a comprehensive set of 10 WRF simulations combining different surface layer schemes, atmospheric boundary layer schemes, cumulus parameterization schemes, and microphysical schemes to identify the configuration that exhibited the highest skill for southern South America. This optimal configuration was subsequently employed in Müller et al. (2014) to assess droughts and in Müller et al. (2016) to evaluate the model's performance in short-term forecasts. In both cases, the selected parameterizations were well-suited to represent the hydroclimate in South America. The model was forced by the initial and 6 h boundary conditions obtained from the National Centers for Environmental Prediction (NCEP) Climate Forecast System Version 2 (CFSv2; Saha et al., 2014).
The WRF atmospheric component is coupled with the Noah-MP LSM (Niu et al., 2011), which solves the surface energy and water balances linking the surface conditions with the atmosphere. Noah-MP is an improved version of the Noah LSM (Chen et al., 1996; Chen and Dudhia, 2001), including multiple parameterization options for selected physical processes (see selected schemes in Table 2). Noah-MP comprises four soil layers with a thickness from top to bottom of 10, 30, 60, and 100 cm (2 m total depth) and includes representations of the root zone, vegetation categories, monthly vegetation fraction, and soil hydraulic properties. It simulates soil moisture, soil temperature, skin temperature, canopy water content, and the energy flux and water flux terms of the surface energy balance and surface water balance. Different options of schemes for various physical processes that are key in the soil–atmosphere interaction are available in Noah-MP. These processes include dynamic vegetation; canopy interception; soil moisture factor controlling stomatal resistance, called the b factor; runoff and groundwater; surface exchange coefficient for heat; and radiation transfer. The vegetation and soil components are closely coupled and interact with each other via complex energy, water, and biochemical processes.
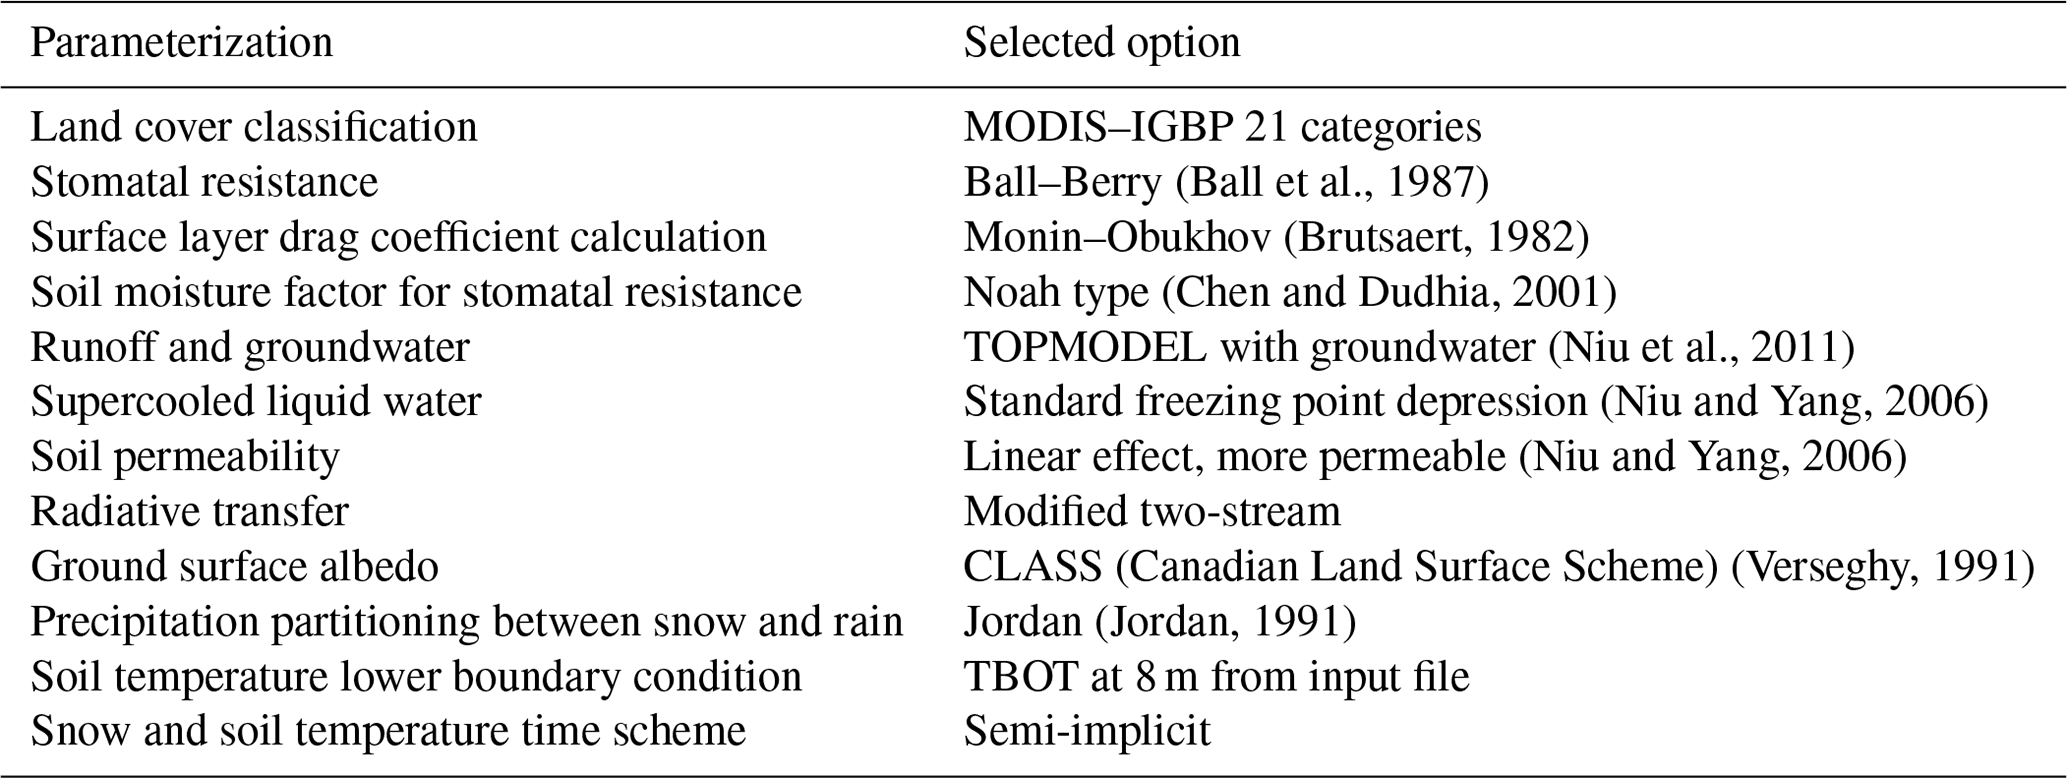
Noah-MP's thermodynamics resolves energy budgets and processes by separating the canopy layer from the ground surface using the semi-tile subgrid scheme. Within this scheme, shortwave radiation transfer considers gap probabilities across the entire grid cell, avoiding the overlap of shadows. Longwave radiation, latent heat, sensible heat, and ground heat fluxes are independently calculated over two tiles: a fractional vegetated area (Fveg) and a fractional bare ground area (1−Fveg), where Fveg depends on the leaf area index (LAI). Regarding the model hydrology, the multi-layer soil structure fed by precipitation allows for the simulation of soil moisture dynamics (water movement and storage). In the vertical column, Noah-MP considers processes such as infiltration, evaporation, transpiration, and groundwater recharge. It simulates the redistribution of water within the soil profile, accounting for the interplay between precipitation input, soil moisture storage, and water fluxes. The runoff in Noah-MP is constituted by surface and groundwater runoff. Surface runoff is mainly saturation excess, while groundwater runoff mainly depends on the depth of the water table. Further details on model thermodynamics and hydrology are found in Chen and Dudhia (2001), Niu et al. (2011), and He et al. (2023).
Focusing on the representation of vegetation in Noah-MP, the LSM assigns a dominant land cover type to each grid point, and this assignment remains constant over time (Li et al., 2013). In turn, each land cover is associated with a set of 15 biophysical properties. The properties can either be values fixed on time or can vary seasonally or dynamically when vegetation dynamics is activated. Our simulations enable vegetation dynamics, i.e. the model simulates changes in vegetation properties, such as LAI, surface roughness, and other land surface characteristics, as they naturally evolve over the simulated period due to seasonal changes and vegetation growth cycles. These dynamic properties allow the model to capture the seasonality of vegetation and its impact on land–atmosphere interactions. We chose to use dynamic vegetation to reflect the natural variability and feedback mechanisms more accurately between vegetation and climate. Although simulating LAI dynamically involves uncertainties, it provides a more realistic representation of how vegetation responds to and influences climatic conditions than using fixed LAI values. By default, the model employs the land cover map derived from MODIS, which classifies the land cover following the 21 categories proposed by the IGBP classification. Then, the land cover changes in our experiments are implicitly imposed by the change in the land cover map among the various ensembles. Noah-MP simulates isolated columns; thus grid cells with changed land cover will exert a direct and immediate local impact on surface fluxes, while surrounding grid cells will remain unchanged in the initial time step. However, as Noah-MP is coupled to WRF, the surface change generates horizontal gradients that give rise to advective processes, effectively facilitating non-local effects of the LULCCs.
2.3 Experimental design
Sensitivity experiments were performed to determine how LULCC in the Dry Chaco may influence the regional hydroclimate. Three sets of simulations (ensembles) were conducted for the same period (January 2014 to June 2016), using different land cover maps (see Fig. 3). Each ensemble has four members with identical parameterizations, with the only difference being the initial conditions that are 24 h apart, following the lagged average forecasting method (Hoffman and Kalnay, 1983).
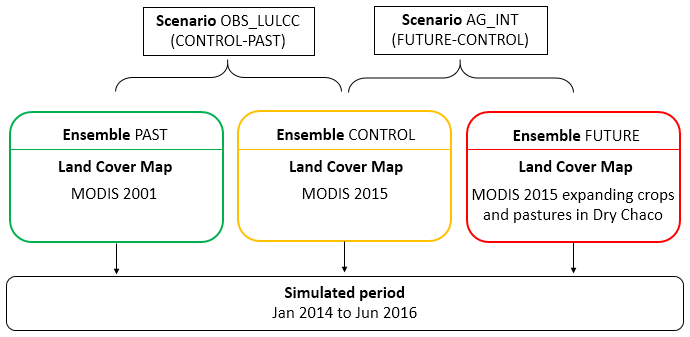
The CONTROL ensemble employs the MODIS land cover map corresponding to 2015 (Fig. 2a). The PAST ensemble uses the MODIS land cover map for the year 2001 (Fig. 4a). The FUTURE ensemble assumes an intensive agricultural expansion within the Dry Chaco (Fig. 4b), mimicking what could be expected in the future if current expansion trends are to continue in a global-low scenario. This scenario considers a strong global market opening with low state regulation of LULCC, where the conditions favour great agricultural expansion (Mosciaro et al., 2022).
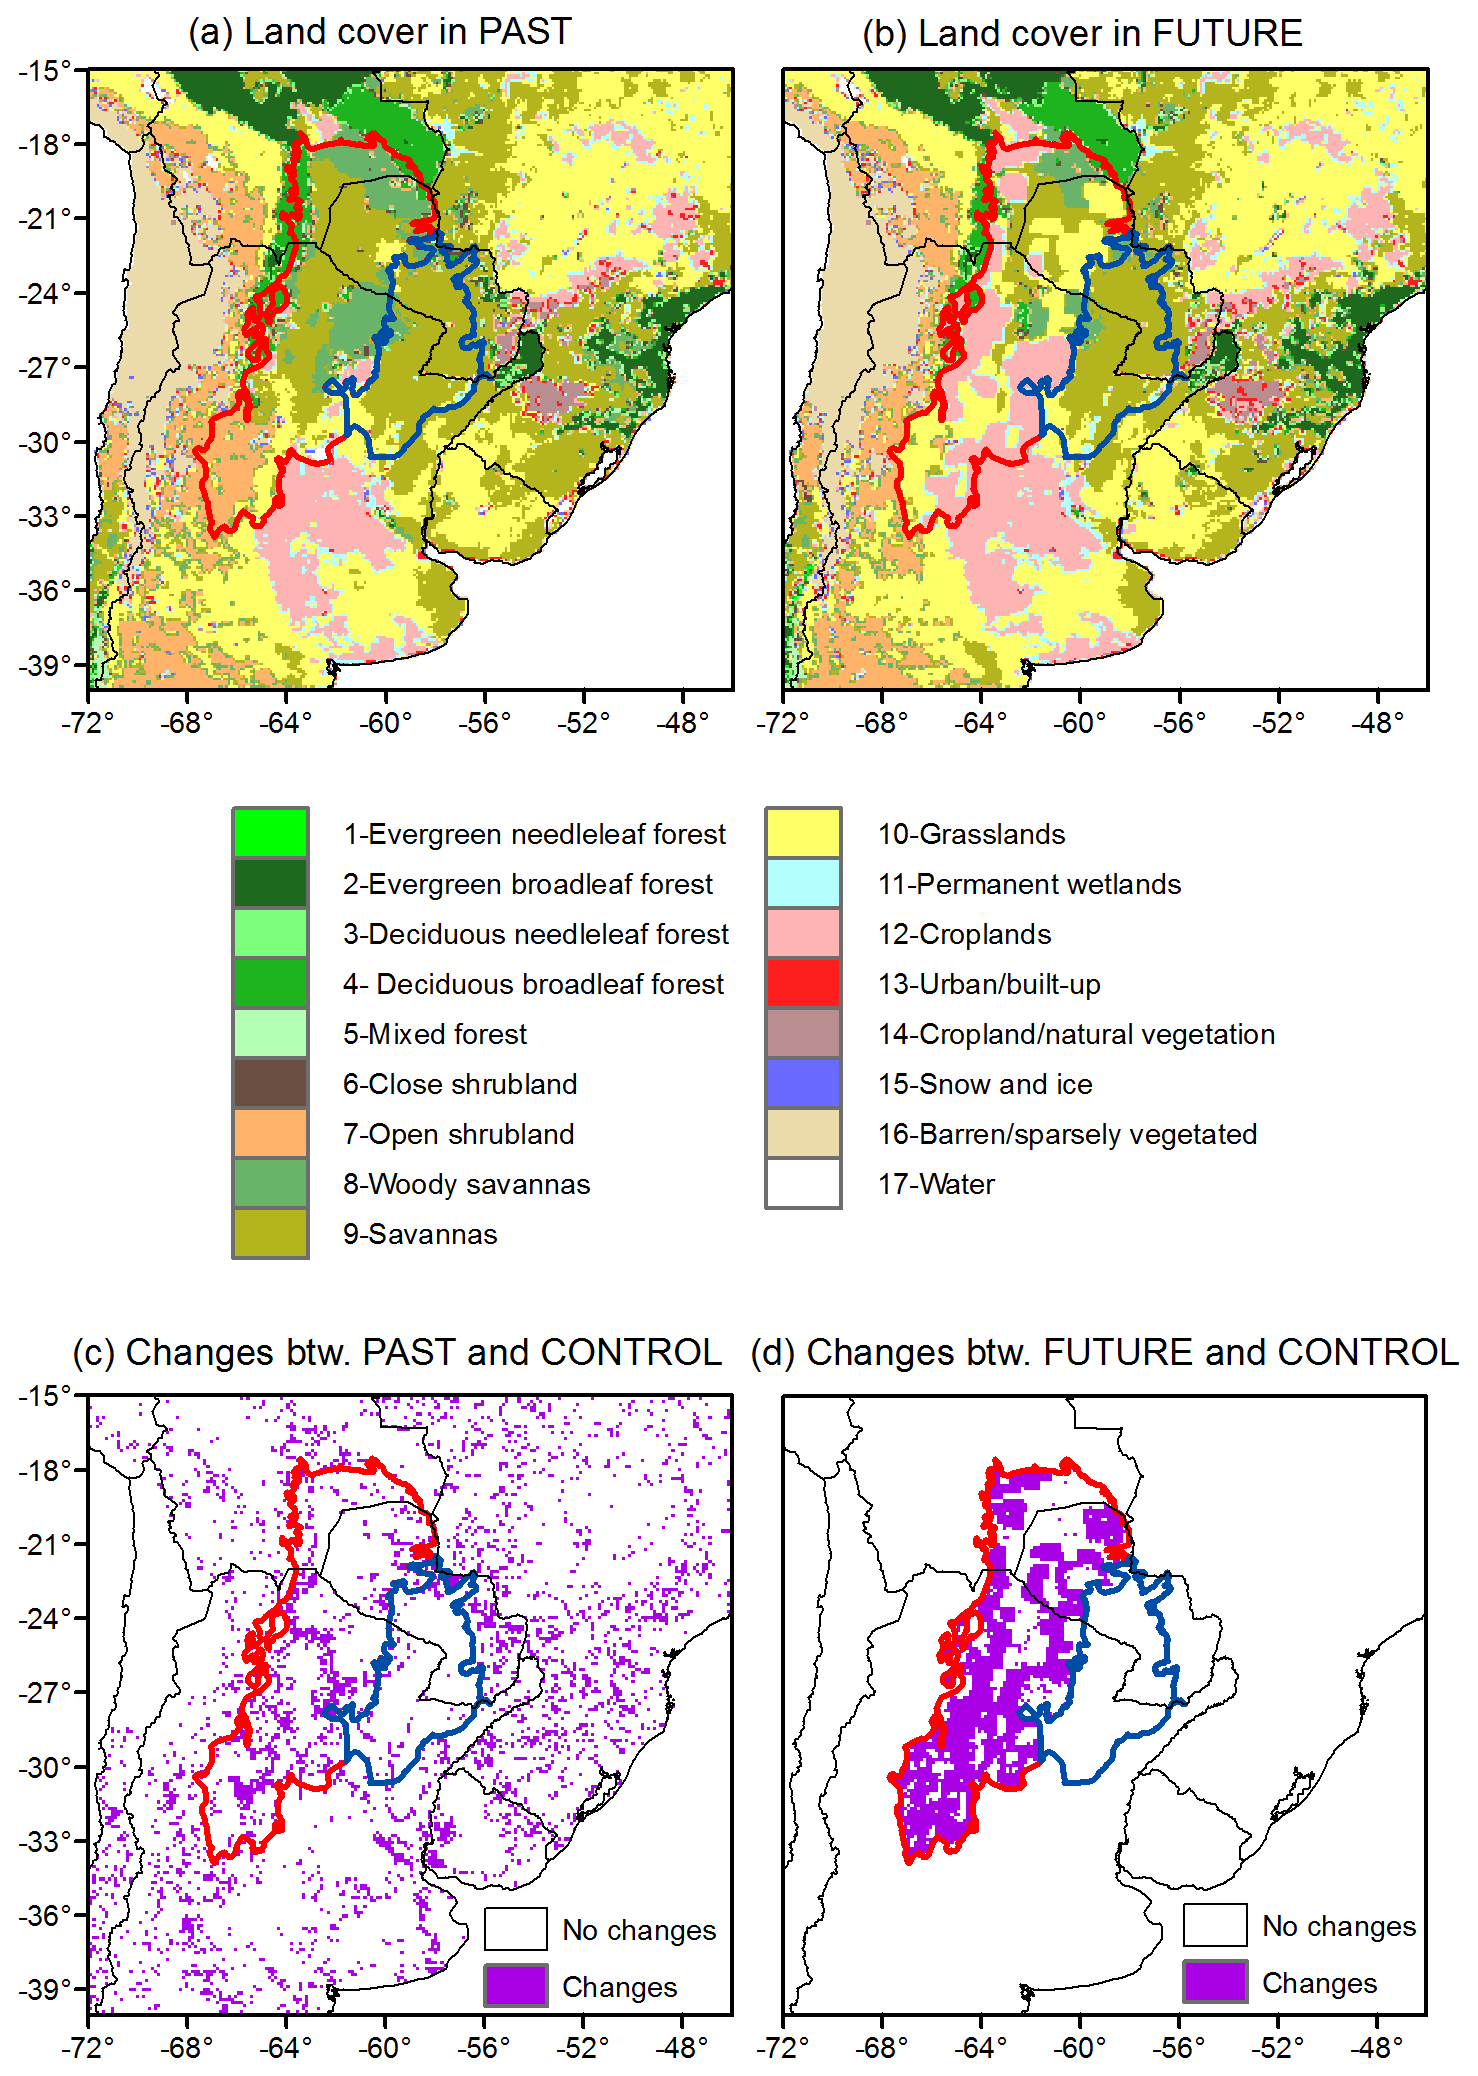
Figure 4Land cover map of (a) the PAST and (b) the FUTURE ensemble and (c, d) their respective differences with the land cover map of the CONTROL ensemble.
The corresponding FUTURE land cover map is a modified version of the 2015 land cover map in which all crop/grassland areas are expanded through a dilation process (Gonzalez and Woods, 1993). Dilation is a morphological method commonly used in digital image processing to expand target areas by adding surrounding pixels to boundaries and filling gaps. In this study, dilation is first applied to the crop category by adding 10 lines, and subsequently, dilation is applied to grassland pixels by the addition of 5 lines. In the resulting land cover map, croplands cover 29.4 %, while grasslands cover 19.1 % of the Dry Chaco area, meaning that the areas occupied by crops and pastures have been expanded by 5 and 2.5 times, respectively. Based on the rate of change in the global-low scenario proposed by Mosciaro et al. (2022), which is ∼7800 km2 yr−1, the time horizon of our FUTURE scenario is 2065.
The differences between the CONTROL and the PAST ensembles will be called the “observed LULCCs” scenario (OBS_LULCC). This scenario is employed to assess the impact of the land cover changes that have occurred since 2001 on the 2014–2016 climate of the Dry Chaco. The differences between the FUTURE and the CONTROL ensembles are referred to as a scenario of “agricultural intensification” (AG_INT). This scenario is used to evaluate the response of the 2014–2016 climate had there been a preceding large agricultural expansion in the Dry Chaco. It is well known that land cover changes have been extensive over the south of South America outside the Gran Chaco, so other effects may come into play affecting the climate of the Humid Chaco (Salazar et al., 2015); however, these other factors are not part of the current study.
Lastly, there are two important aspects related to the 30-month-long (2.5 years) simulation period. First, the validation of the CONTROL ensemble involves a comparison of simulated and observed variables for the entire period. However, the evaluation of changes has a specific focus on the austral summer season (DJF), encompassing the 2014/15 and 2015/16 summers, when vegetation is highly active, and land–atmosphere interactions are intensified in the Gran Chaco ecoregion (Müller et al., 2021a). The first 11 months is dismissed from the analysis to avoid any spin-up issues and ensuring the stabilization of all variables. Second, the simulation period includes an El Niño event, developed between September 2014 and March 2016. However, Cai et al. (2020) demonstrate that historical El Niño events did not lead to significant precipitation and temperature anomalies over the Gran Chaco. Moreover, Vera and Osman (2018) reported that the impact of the El Niño 2015 event has been weakened by the Southern Annular Mode (SAM). Thus, the resulting differences among ensembles are directly attributed to the proposed changes in land cover.
2.4 Evaluation datasets
The performance of the CONTROL ensemble is evaluated by comparing simulated precipitation, soil moisture, and 2 m temperature against observational datasets, either from satellite sources or gridded observations. The choice of these variables serves a deliberate purpose. Temperature and precipitation, being truly independent variables with relatively low uncertainty due to multiple monitoring sources, are commonly used in climate model validation (e.g. Sánchez et al., 2015, Ortega et al., 2021, and Lovino et al., 2021). Soil moisture is included in the evaluation due to its crucial role in land cover dynamics and land–atmosphere interactions, although we acknowledge the uncertainty in its estimates based on remotely sensed signals.
Three different precipitation datasets are employed. The first dataset is the NCEP's Climate Prediction Center (CPC) Unified Gauge-Based Analysis of Global Daily Precipitation (Chen et al., 2008; Xie et al., 2010), which consists of daily rain gauge observations interpolated to a 0.5°×0.5° grid. The second dataset, also at 0.5° grid spacing, is the Climate Research Unit (CRU) monthly precipitation dataset. The CRU TS v. 4.03 dataset is based on analysing more than 4000 meteorological stations (Harris et al., 2020). Lastly, we use the monthly precipitation at 0.25° grid spacing from the European Centre for Medium-Range Weather Forecasts (ECMWF) Reanalysis version 5 (ERA5) (Hersbach et al., 2020). Note that the three datasets overlap in their sources.
Soil moisture is assessed at two model layers: 0–10 and 0–100 cm. The top layer (10 cm) is compared against the Soil Moisture Operational Products System (SMOPS; Liu et al., 2016). This product combines soil moisture retrievals from multiple satellite sensors producing global soil moisture maps as a volumetric content near the surface (top 1–5 cm) at daily intervals and at a 0.25° grid spacing (Liu et al., 2016). Observed and simulated near-surface soil moisture is compared in terms of volumetric water content (m3 m−3) to minimize the impact of the thickness differences. The root-zone soil moisture (100 cm), crucial for vegetation growth, is evaluated with the operational product H14-SM-DAS-2 developed at the EUMETSAT Satellite Application Facility on Support to Operational Hydrology and Water Management (HSAF). This product gives estimates of root-zone soil moisture at daily intervals on a 25 km × 25 km grid (Albergel et al., 2012).
Temperature is evaluated with two products: the CRU TS v. 4.03 global monthly surface air temperature dataset and the ERA5 monthly temperature. They are provided at a grid spacing of 0.5 and 0.25°, respectively.
3.1 Precipitation
The spatial pattern of the observation-based precipitation for the simulation period presents maximum values in southern Brazil, eastern Paraguay, and northeastern Argentina (Fig. 5a), where the precipitation rate is ∼150 mm per month. This magnitude gradually decreases westward to less than ∼25 mm per month on top of the Andes Mountains and the desert of Atacama. The mean WRF precipitation field (Fig. 5b) reveals a similar spatial structure to the observations but with weaker values in the wet part, where the model simulates less rainfall (see Fig. 5c). On the other hand, WRF simulates wetter conditions over the Altiplano (high plateau in Bolivia). Wet anomalies over mountainous regions are often attributed to model limitations and uncertainties in gridded observations and satellite estimates (Adam et al., 2006; Beck et al., 2017; Müller et al., 2021).
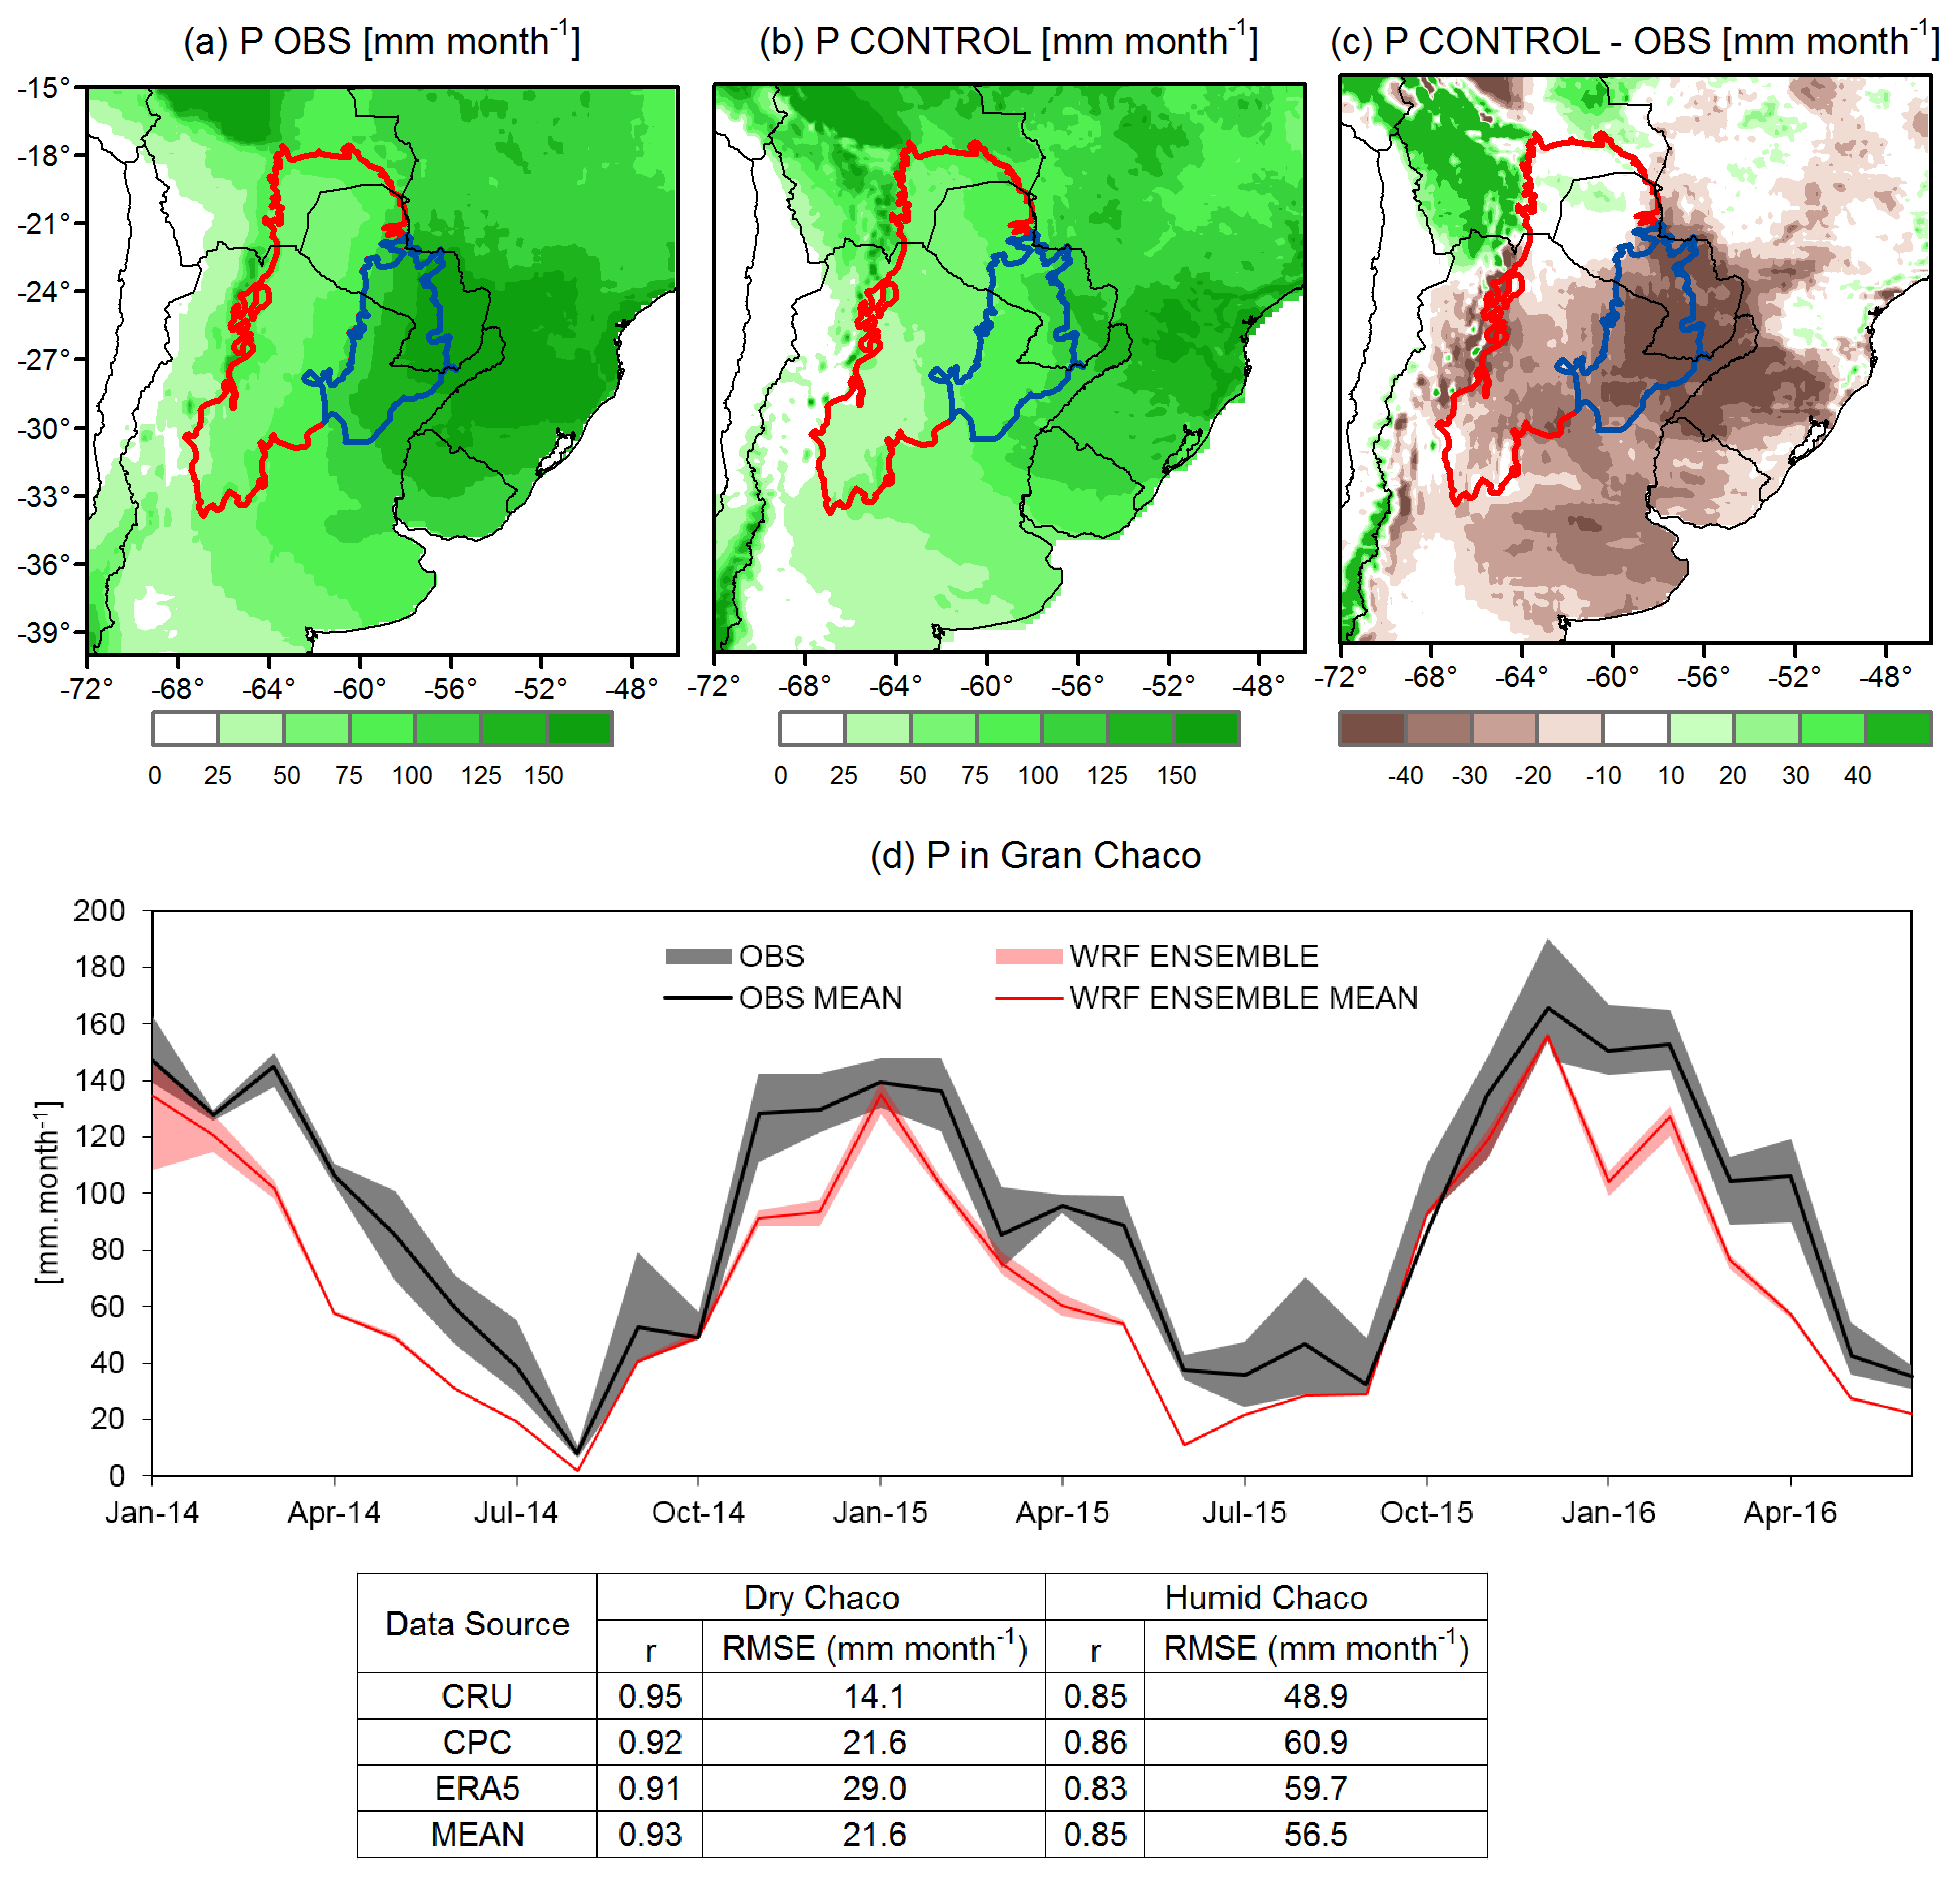
Figure 5Time average of (a) the observed precipitation (mean between ERA5, CRU, and CPC), (b) the CONTROL ensemble precipitation, and (c) their differences. (d) Precipitation time series averaged in the Gran Chaco region. The bands represent the dispersion among observational (grey) and ensemble members (pink), while the solid lines depict their respective means.
Focusing on the Gran Chaco, the model simulations show almost no biases in the Dry Chaco and present dry biases of ∼30–50 mm per month in the Humid Chaco. The drier conditions arise from underestimated late austral summer and autumn (FMAM) rain, as shown in Fig. 5d. Conversely, WRF notably improves the estimation in austral winter (JJA, the dry season) and spring (SON), showing almost the same peaks as observations for all years. The correlation and the error estimates confirm the good performance of WRF in the Gran Chaco. The monthly temporal correlation between the area-averaged observed and simulated precipitation is r=0.93 for the Dry Chaco and r=0.85 for the Humid Chaco. The RMSEs are 21.6 and 56.5 mm per month, respectively. Interestingly, the ensemble spread only reveals relevant uncertainty during the first month of simulation, after which the dispersion consistently remains in a narrow range, indicating that the model uncertainty is comparable or even smaller than the observational uncertainty.
3.2 Soil moisture
The SMOPS satellite estimate of near-surface soil moisture exhibits high values to the east and a decreasing gradient toward the west (Fig. 6a), following the precipitation pattern. The simulated soil moisture content shows a remarkable spatial structure and magnitude agreement in most of the domain, except over the Altiplano where the wet precipitation biases produce wet soils (Fig. 6b). The resemblance is even more evident over the Gran Chaco (Fig. 6c). In terms of temporal evolution, the area-averaged simulated soil moisture presents similarities with SMOPS (r=0.61 for the Humid Chaco and r=0.55 for the Dry Chaco) but with a slight systematic overestimation (Fig. 6g).
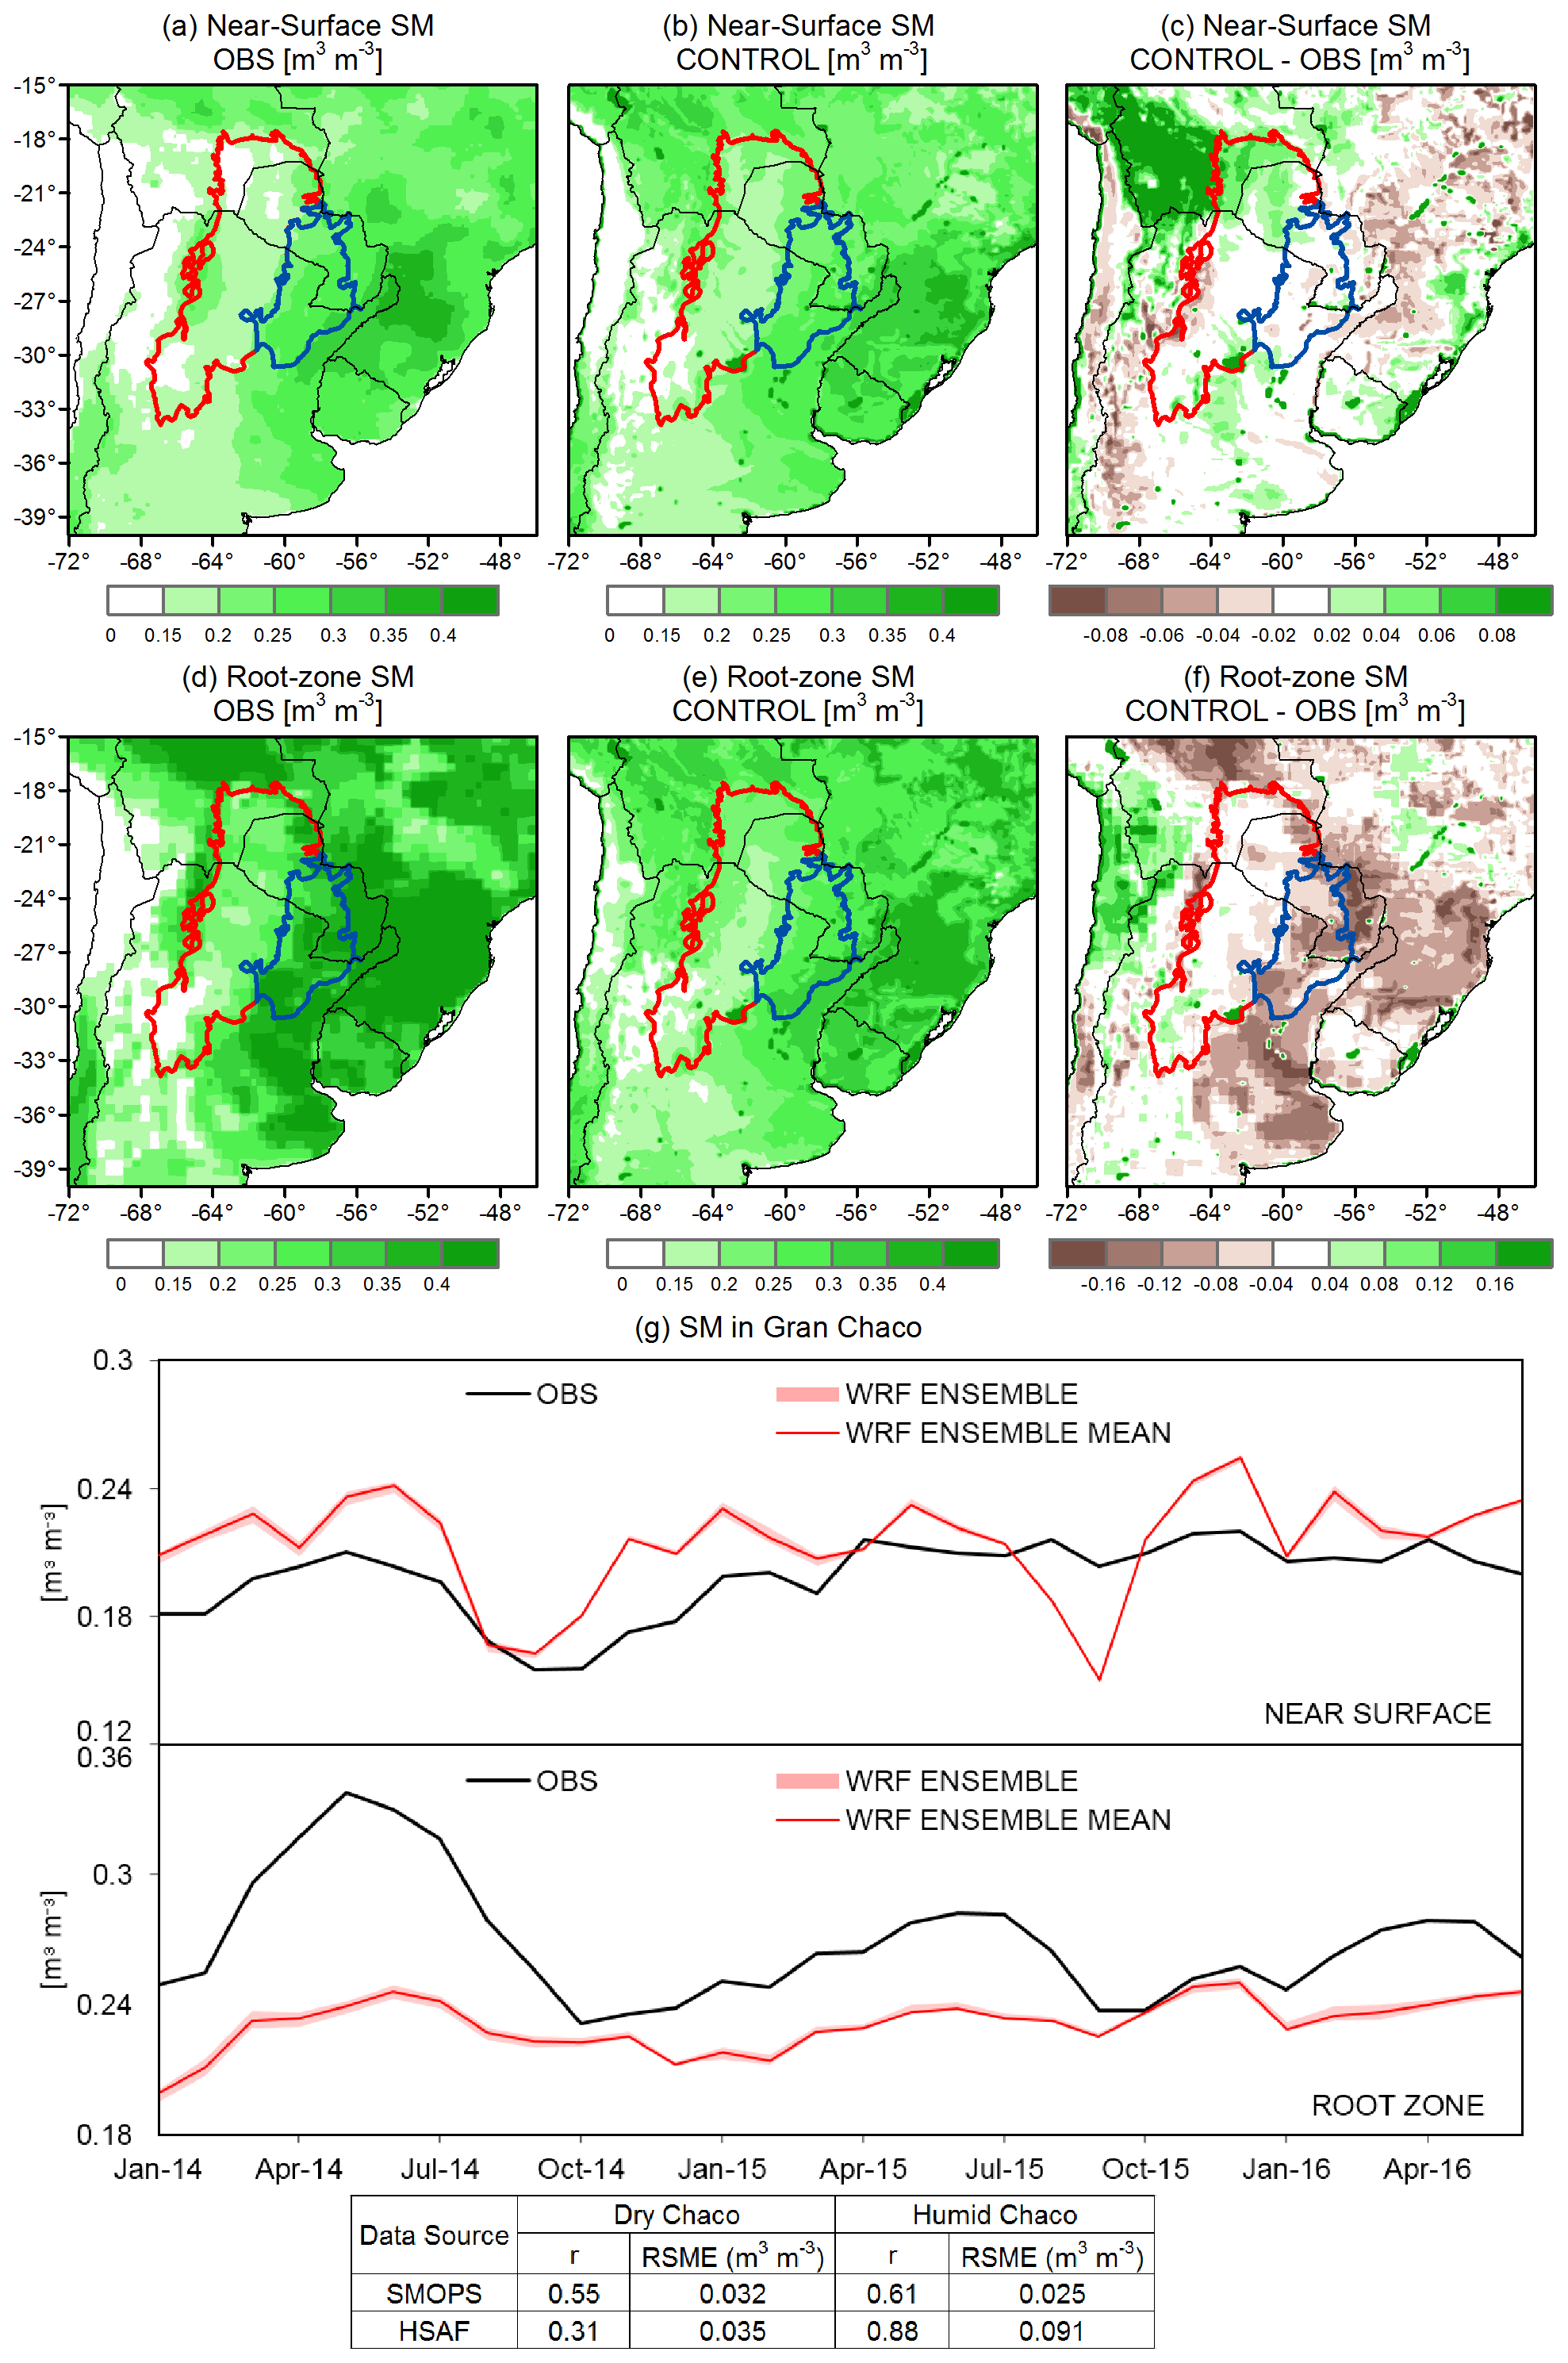
Figure 6Time average of near-surface soil moisture for (a) the SMOPS product, (b) the CONTROL ensemble, and (c) their differences and time average of DJF root-zone soil moisture for (d) the HSAF product, (e) the CONTROL ensemble, and (f) their differences. (g) Observed and simulated soil moisture time series averaged over the Gran Chaco. The pink band represent the dispersion among ensemble members, while the solid red line depicts the respective mean.
The simulated root-zone soil moisture also presents a notable overall resemblance to the HSAF satellite estimates, with slight dry biases towards the east (Fig. 6d and e). Focusing on the Gran Chaco, the area-averaged WRF soil moisture presents a similar evolution to HSAF but with a systematic negative bias (Fig. 6g). This bias is explained by the differences in the Humid Chaco, where RMSE reaches 0.091 m3 m−3, likely in response to the underestimated precipitation (Fig. 5d). Instead, the Dry Chaco presents a strong spatial agreement with HSAF (RMSE=0.035 m3 m−3).
Notably, the simulated time series of near-surface and root-zone soil moisture reveals minimal internal variability throughout the entire simulation period. This consistency aligns with the findings of Sörensson and Berbery (2015), who observed that the initialization of WRF/Noah-MP in wet months (January in our simulations) favours a rapid stabilization of soil conditions. The limited internal variability of precipitation also contributes to the small ensemble members dispersion.
3.3 Temperature
The spatial distribution of the time-mean observed temperature shows a latitudinal gradient with maximum values over the central-northern domain, decreasing toward the south (Fig. 7a). The warmer region has an average temperature above 25 °C that gradually decreases southward to less than 15 °C. The coldest region over the high-altitude Andes Mountains has average temperatures below 5 °C.
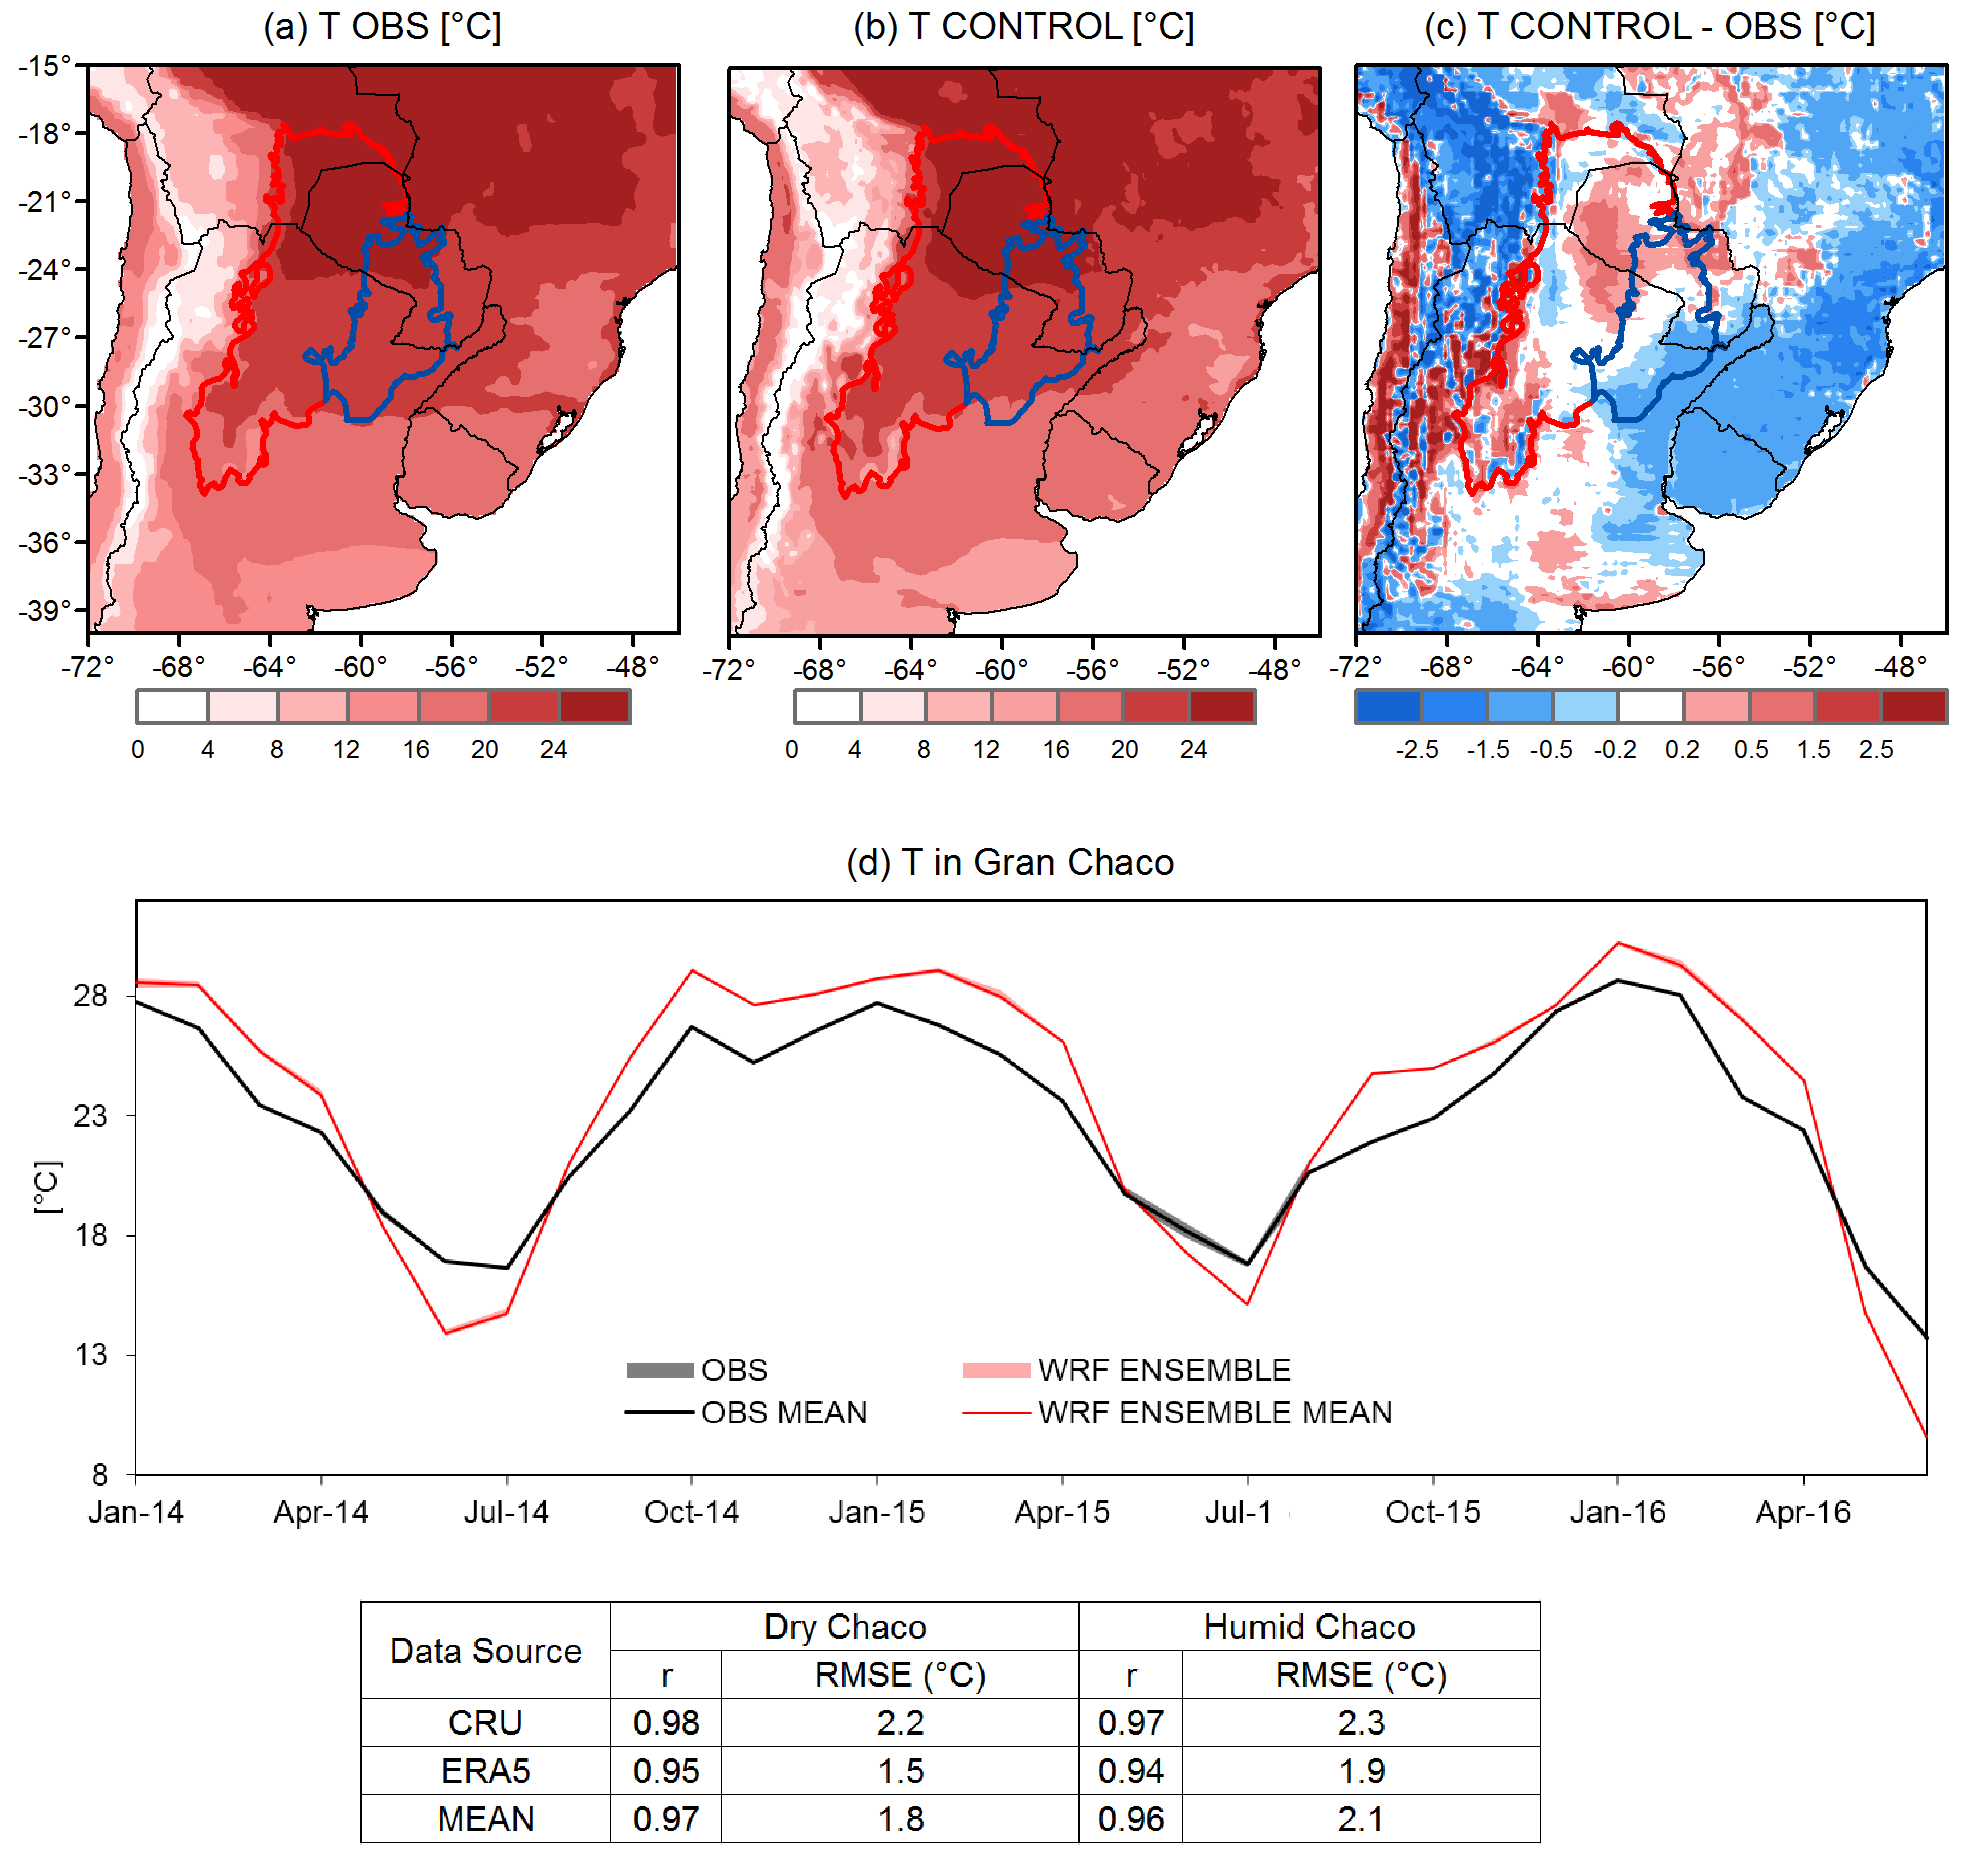
Figure 7Time average of (a) the observed 2 m temperature (mean between ERA5, CRU), (b) the CONTROL ensemble 2 m temperature, and (c) their differences. (d) Temperature time series averaged over the Gran Chaco. The bands represent the dispersion among observational (grey) and ensemble members (pink), while the solid lines depict their respective means.
Figure 7b shows that the simulated temperature's spatial pattern captures the observation-based products' main features in terms of distribution and magnitude (Fig. 7c), especially in flat areas (see Fig. 1). In high-altitude regions, the model produces cold biases. For the region of interest, WRF shows slight warm and cool biases (about ±1 °C) in parts of the Dry Chaco and the Humid Chaco, respectively. The simulated temperature evolution in the Gran Chaco closely aligns with observations (r=0.96 for the Humid Chaco and r=0.97 for the Dry Chaco), with slightly higher seasonal variability (Fig. 7d). As for precipitation and soil moisture, the simulated temperature presents insignificant sensitivity to initial conditions, reinforcing the robustness of the model simulations.
This section examines the two scenarios (OBS_LULCC and AG_INT) presented in Sect. 2.3. In both cases, simulations were carried out for 2014–2016 just changing the corresponding land cover maps, and the analysis is conducted during the austral summer months (DJF). Throughout the analysis, we will refer to local effects as those that pertain to the grid points within the Dry Chaco that experienced LULCCs (purple grid cells in Fig. 4c and d). Non-local effects are those found at grid points that did not undergo any land cover change in the remaining area of the Dry Chaco (blank areas in Fig. 4c). Lastly, remote effects encompass those observed in the Humid Chaco area (blank areas within the blue limits in Fig. 4d). Sections 4.1 and 4.2 focus on the description of the experiments' results, while plausible interpretation of the process behind the changes is offered in Sect. 4.3.
4.1 Scenario OBS_LULCC: actual LULCCs from 2001 to 2015
Almost 20 % of the Dry Chaco's land cover changed from 2001 to 2015. Figure 8a–c show the changes in biophysical properties that are particularly sensitive to the observed LULCCs: leaf area index (LAI), albedo, and stomatal resistance. The changes in properties are spread over the small fragmented areas that underwent LULCCs. The decrease in LAI, increase in albedo, and reduction in stomatal resistance in the Dry Chaco's centre-east, northeast, and west boundaries are associated with deforestation processes (orange grid cells in Fig. 2c). On the other hand, other areas showing increases in LAI and stomatal resistance and decreases in albedo are not associated with deforestation as discussed in Sect. 2.1.2.
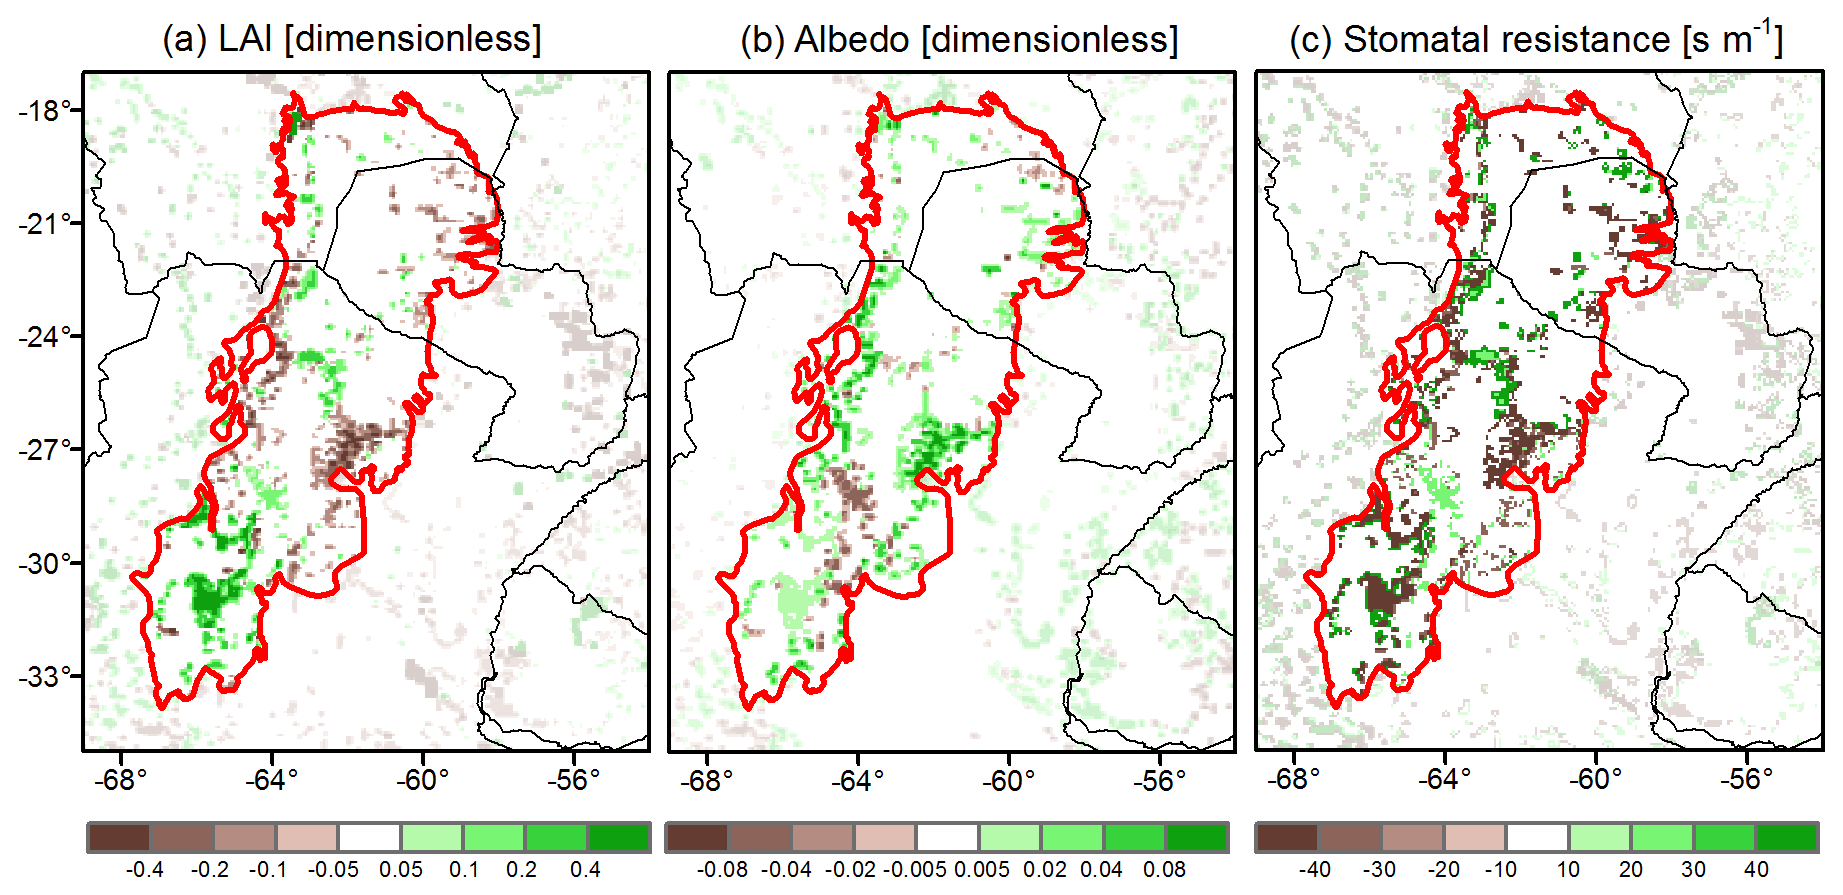
Figure 8Differences in the biophysical properties for the OBS_LULCC scenario (CONTROL-PAST): (a) LAI, (b) albedo, and (c) stomatal resistance. Opacity was used in all panels to highlight the region of interest.
4.1.1 Effects on the energy budget
The changes in biophysical properties lead to the uneven distribution of positive and negative changes in the radiation fluxes (Fig. 9a–c). The net radiation pattern is primarily influenced by variations in shortwave radiation, while changes in longwave radiation are minimal due to negligible emissivity variations. On average, the areas that underwent local LULCCs experienced a ∼2 % reduction in net radiation, which aligns with the overall increase in albedo (Fig. 8b) and the consequent enhancement of outgoing shortwave radiation. In the remaining areas of the Dry Chaco, where land cover was not changed, positive and negative changes up to ±10 W m−2 balance each other, resulting in a near-zero areal average.
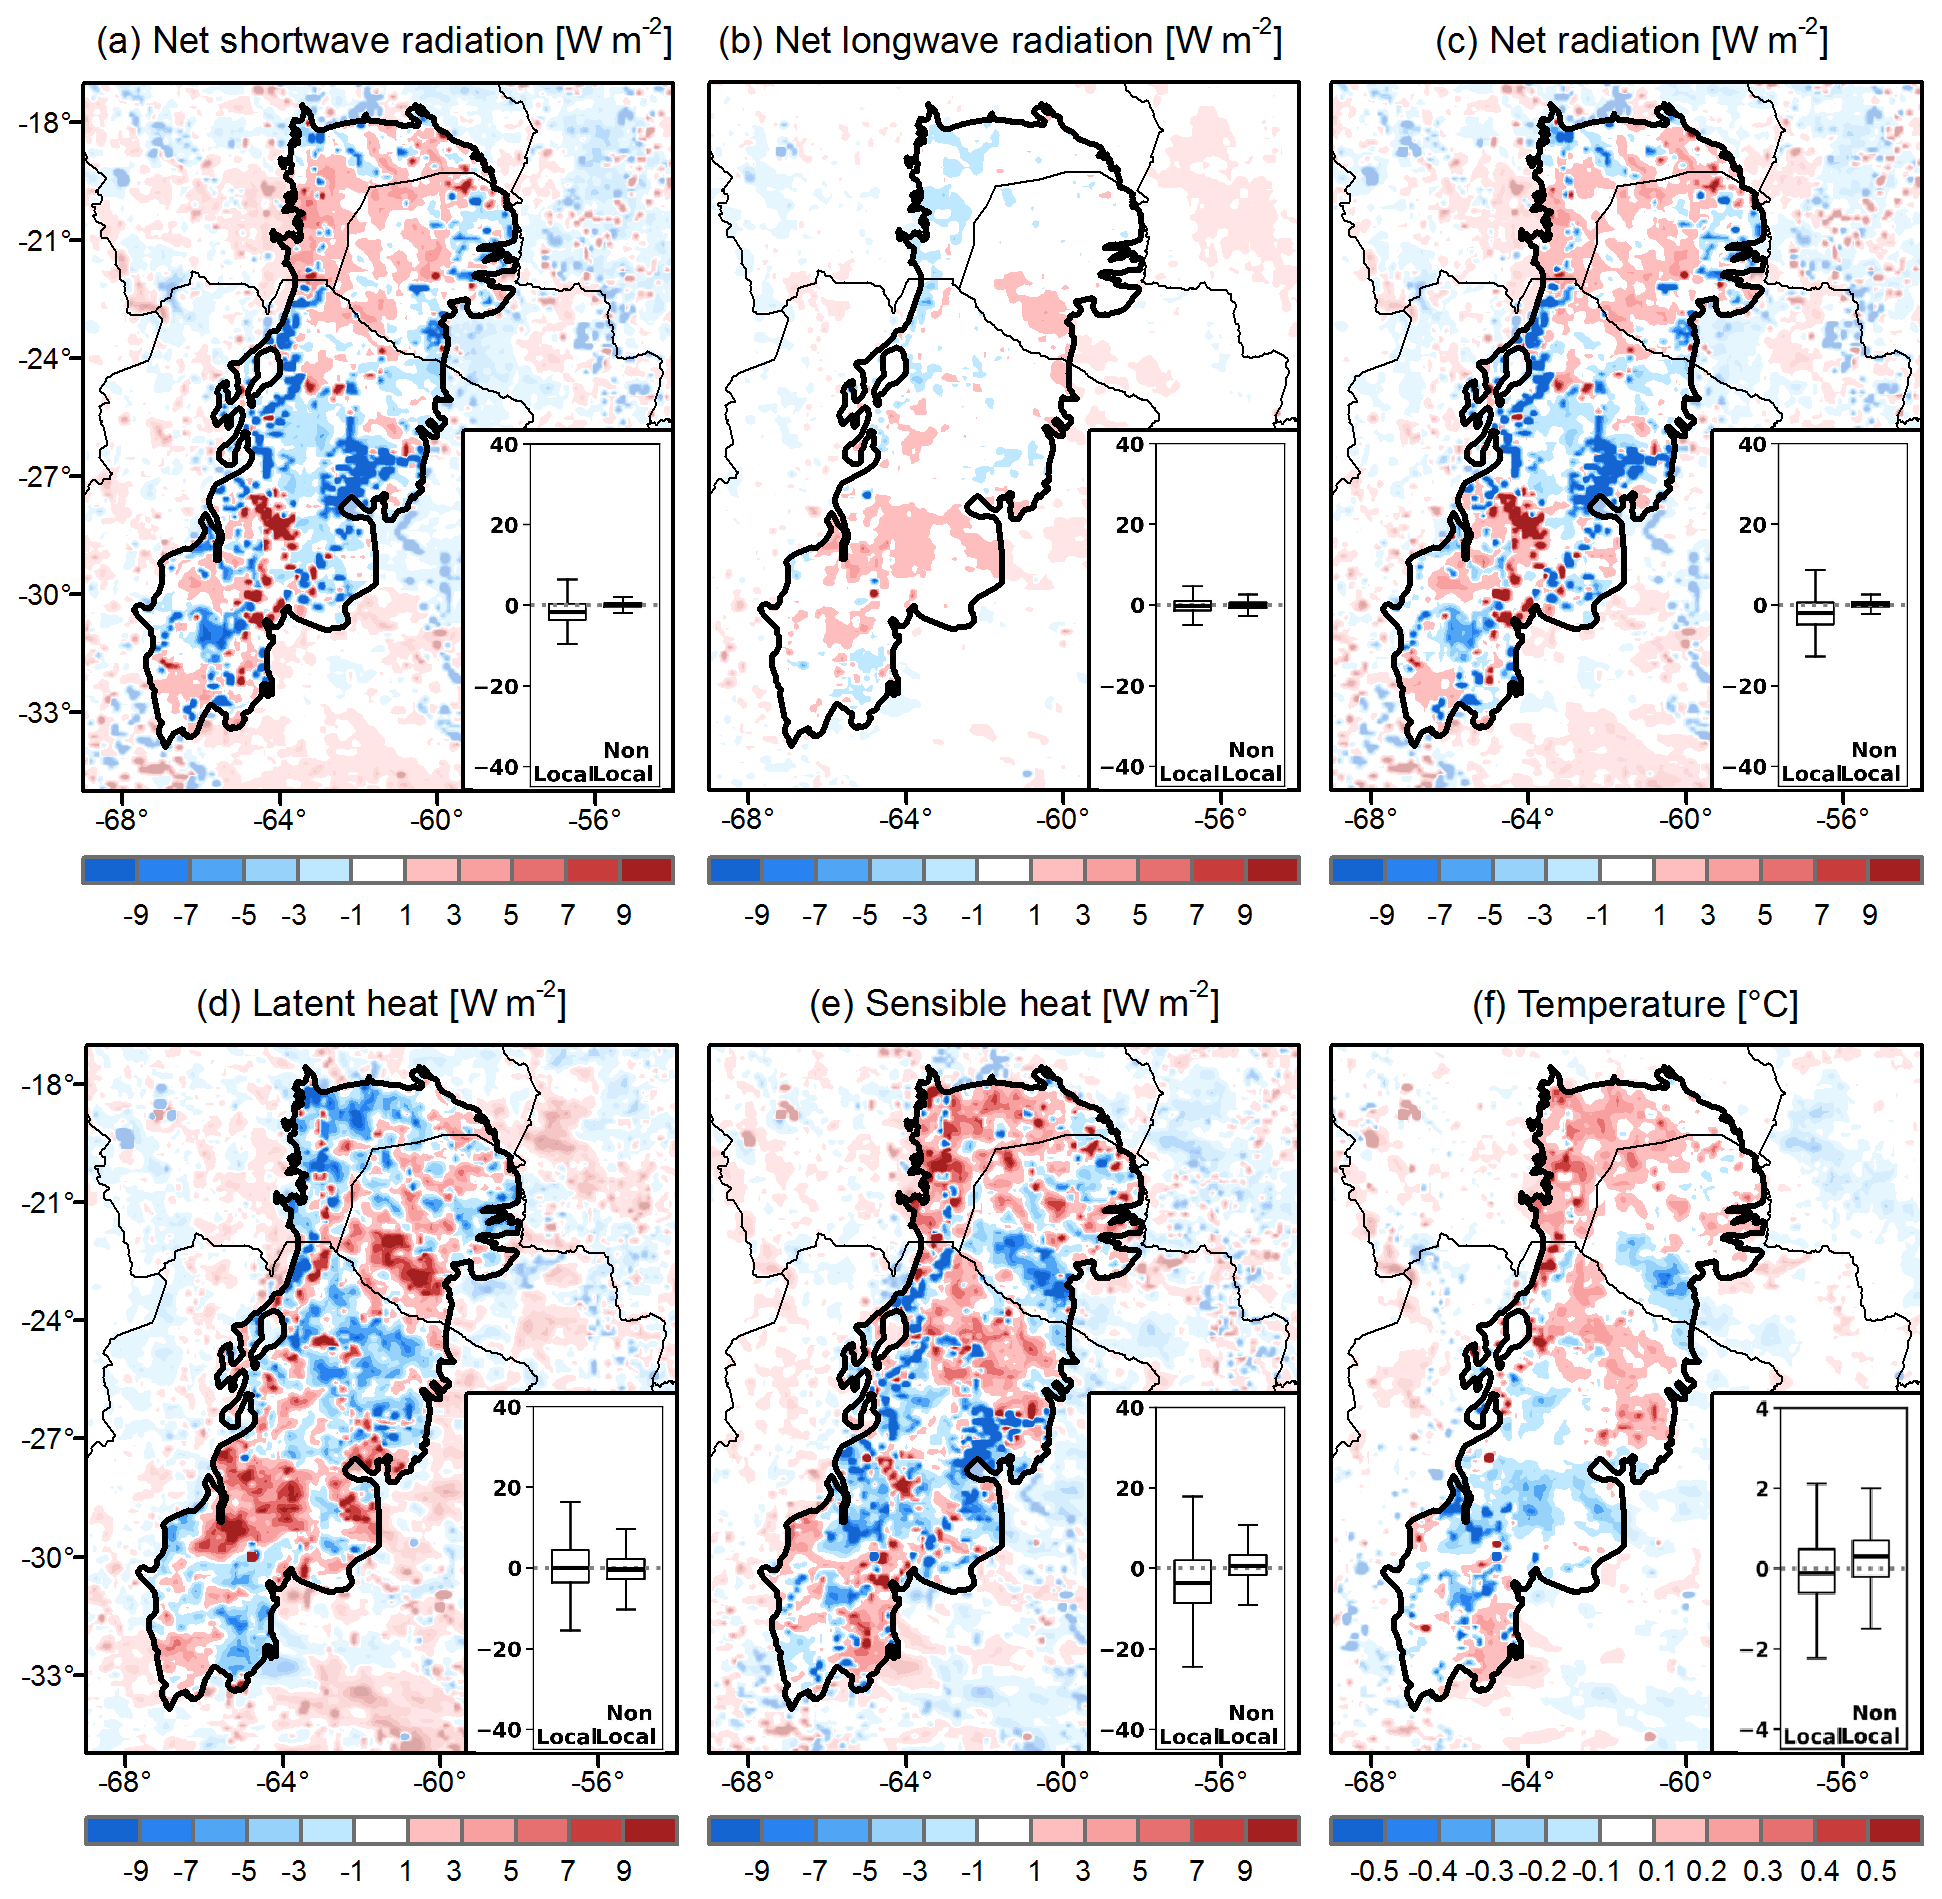
Figure 9Differences in the summer energy budget components in the OBS_LULCC scenario (CONTROL-PAST): (a) net shortwave radiation, (b) net longwave radiation, (c) net radiation, (d) latent heat, (e) sensible heat, and (f) 2 m temperature. Opacity was used to highlight the region of interest. The box plots in the insets show the percentage differences of grid cells with land cover changes (local) and without land cover changes in the Dry Chaco (non-local).
The changes in net radiation alter the main components of the energy balance, i.e. the sensible heat flux and the latent heat flux. The spatial distributions of these fluxes play important roles in determining near-surface temperature, as variations in these fluxes affect the amount of energy used for heating the surface as opposed to being released through evapotranspiration. Figure 9d and e reveal that changes in sensible heat and latent heat have a similar spatial pattern but with opposite signs. As with the radiation terms, the changes are of the order of ±10 W m−2. Furthermore, Fig. 9f shows that the deforested areas in the northern and central eastern zones of the Dry Chaco experience warming, while the southern area exhibits cooling. Both of these changes can be attributed to variations in sensible heat flux. On average, the changes in net radiation lead to an average decrease of −3.5 % in sensible heat at the local level and 0.6 % in the remaining area of the Dry Chaco (Fig. 9e). Latent heat exhibits minor or negligible changes over the whole of the Dry Chaco (Fig. 9d). Despite the presence of locally strong signals (up to ±0.4 °C), the spatially averaged temperature changes present a slight rise due to the compensatory warming and cooling effects.
4.1.2 Effects on the hydrological response
The changes in biophysical properties led to overall drier conditions in the Dry Chaco, with precipitation decreasing by about −1.7 % on average. However, there is a significant spatial heterogeneity, with precipitation changes ranging from −29 to +35 mm per month, even in areas that conserved the land cover (Fig. 10a). Soil moisture (Fig. 10b) follows the spatial pattern of precipitation, with net negative changes in both local (−2.6 %) and non-local (−0.7 %) areas. Evapotranspiration also follows the patterns of precipitation and soil moisture, although the net changes are negligible (see inset in Fig. 10c). Note that stomatal resistance is strongly reduced in deforested areas, which would facilitate plant transpiration and consequently higher evapotranspiration. Our interpretation is that plants cannot take advantage of the open stomata due to the dry soils, given that the Dry Chaco is a region where soil moisture availability limits the evapotranspiration regime. The reduced precipitation and drier soils end up affecting the total runoff, resulting in a net reduction of about 8 % in the Dry Chaco (Fig. 10d). These results suggest that the observed LULCCs in just 14 years can weaken the hydrological cycle in the Dry Chaco, leading this arid region to experience even drier summers.
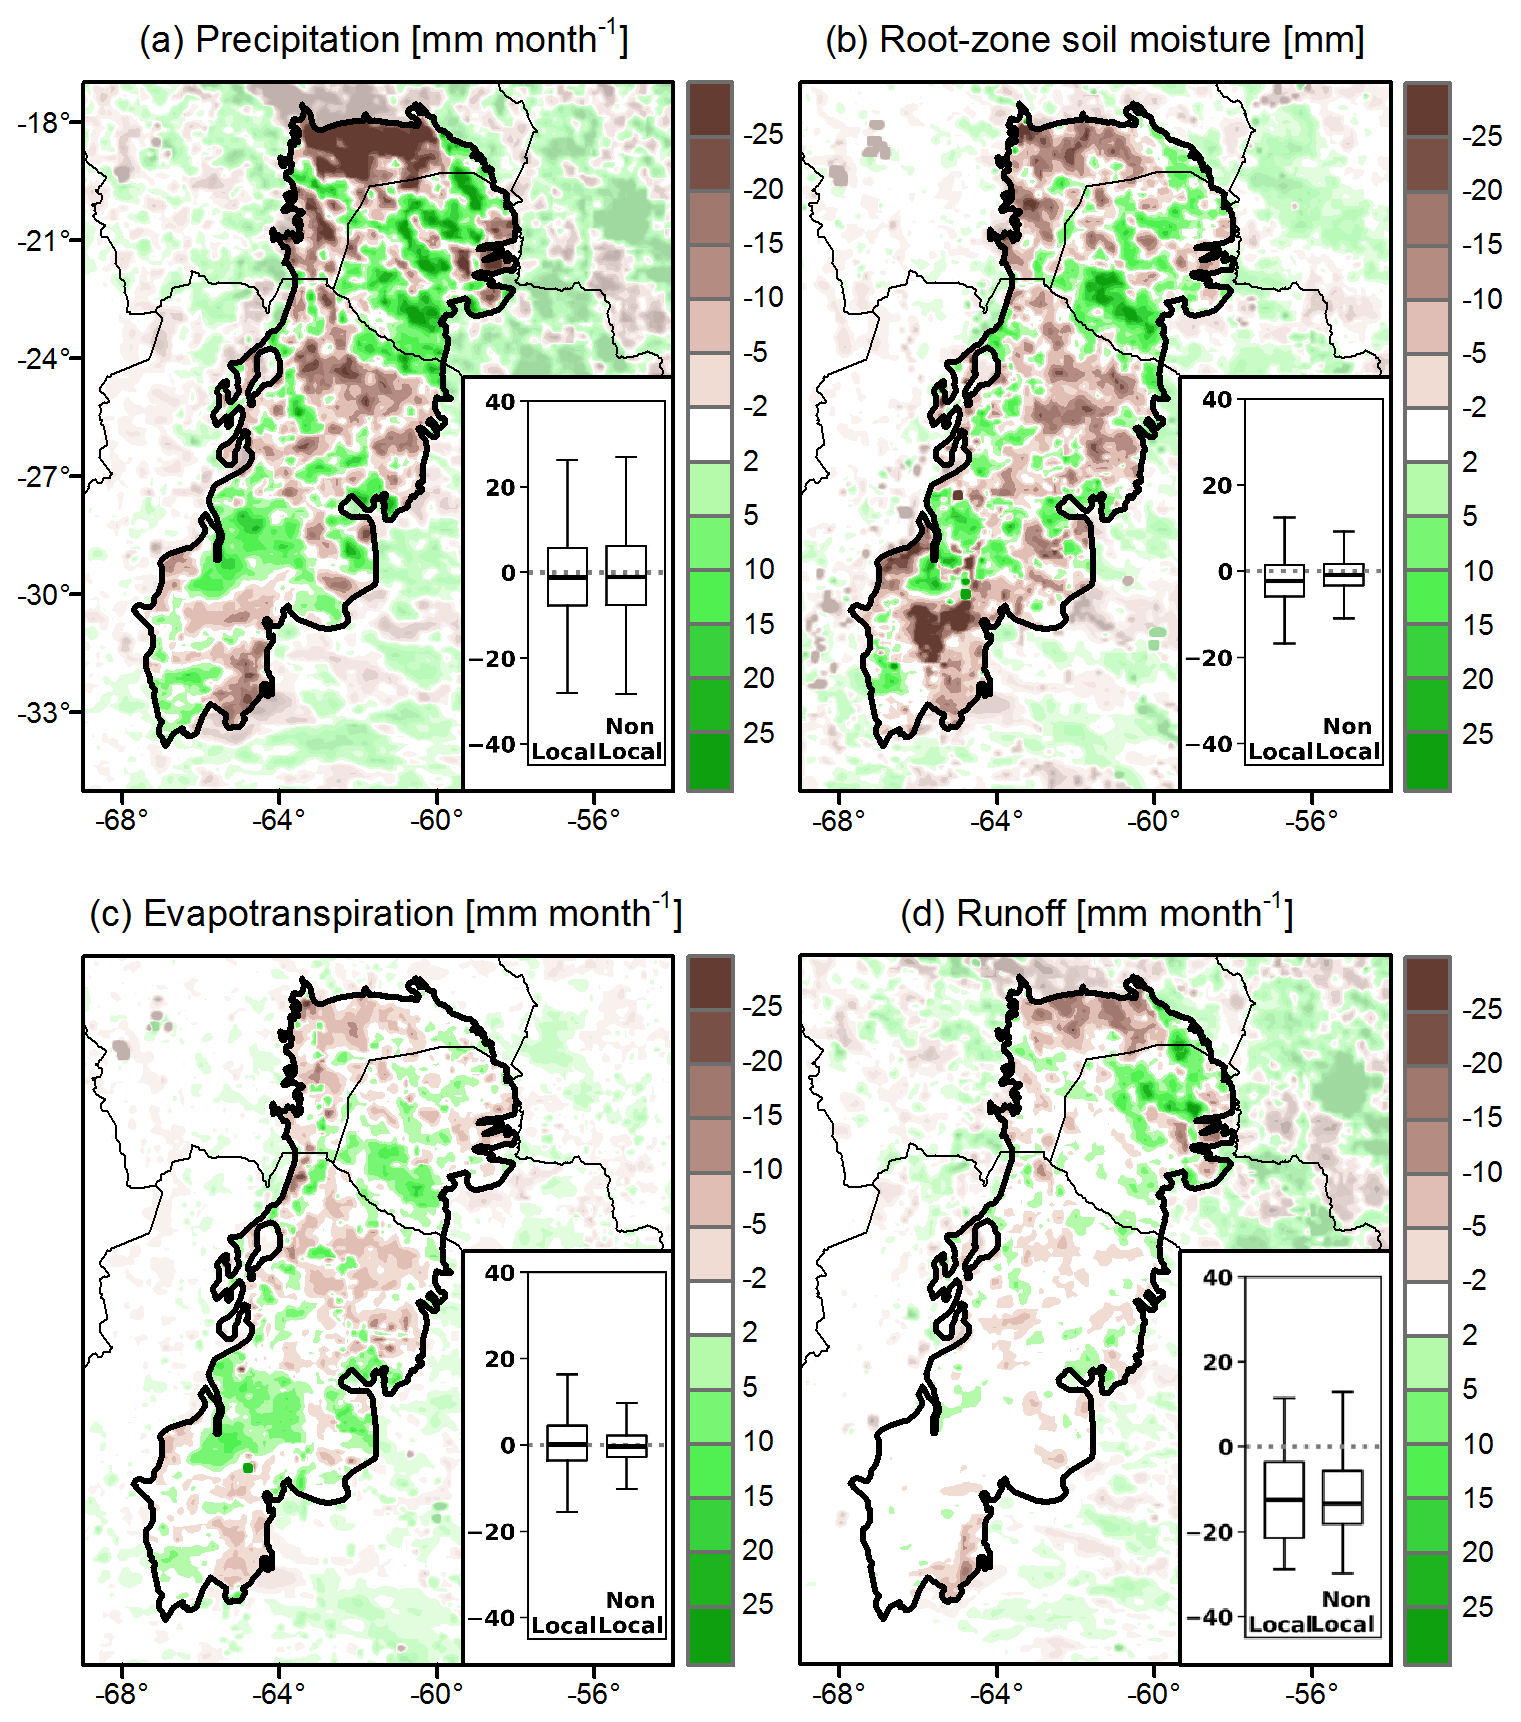
Figure 10Differences in the summer water budget components in the OBS_LULCC scenario (CONTROL-PAST): (a) precipitation, (b) soil moisture, (c) evapotranspiration, and (d) runoff. Opacity was used to highlight the region of interest. The box plots in the insets show the percentage differences of grid cells with land cover changes (local) and without land cover changes in the Dry Chaco (non-local).
4.2 Scenario AG_INT: intensive expansion of the agricultural land
The changes in surface properties in the OBS_LULCC scenario have a granular structure that illustrates the realistic ways deforestation progresses. Unlike the OBS_LULCC scenario, the AG_INT scenario shows changes in LAI, albedo, and stomatal resistance that exhibit spatial continuity, consistent with the assumed idealized LULCCs. In this AG_INT scenario, the expansion of crops and grasslands covers 64 % of the Dry Chaco. Figure 11a–c illustrate that replacing native vegetation with grasslands and croplands leads to a general reduction in LAI and stomatal resistance, as well as an increase in albedo. Interestingly, the anthropization of certain native covers results in “greener” conditions, in line with the prescribed values of the biophysical properties applied by the LSM. For instance, Noah-MP prescribes a higher LAI for grassland (1.7) than open shrubland (1.6).
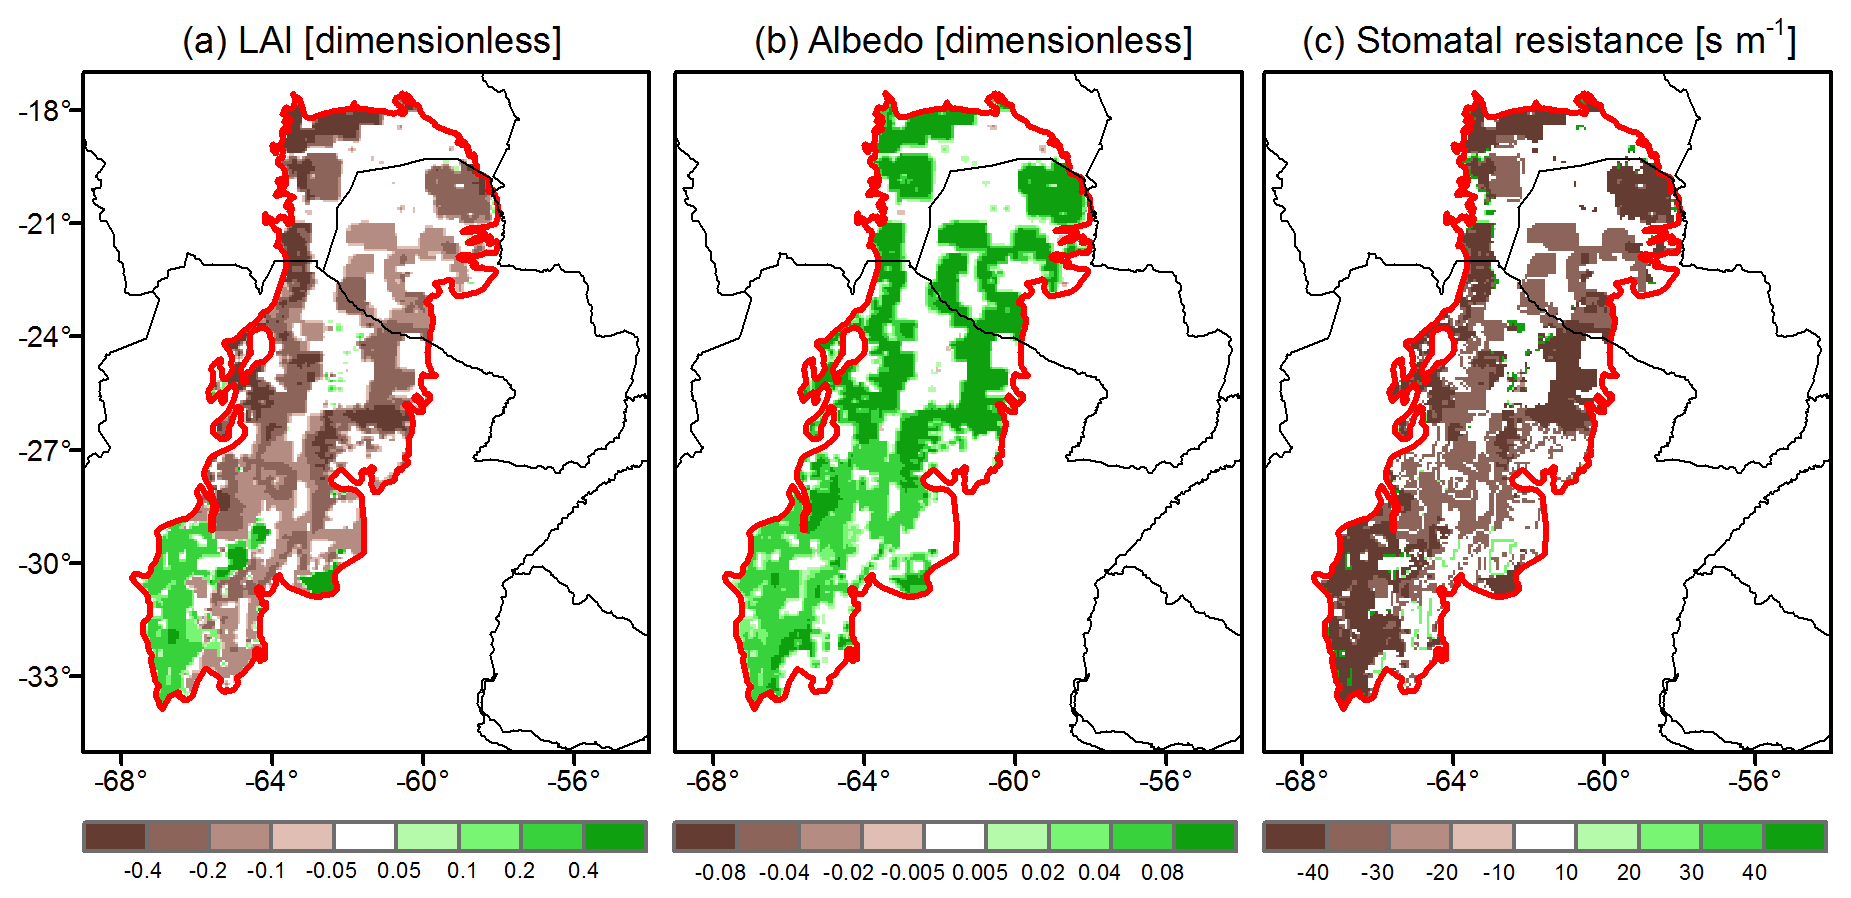
Figure 11Differences in the biophysical properties for the AG_INT scenario (FUTURE-CONTROL): (a) LAI, (b) albedo, and (c) stomatal resistance. Opacity was used in all panels to highlight the region of interest.
4.2.1 Effects on the energy budget
The intensive expansion of agriculture simulated in the Dry Chaco resulted in an overall decrease in net total radiation, which is reduced by −9.5 % (Fig. 12c). This reduction is primarily due to changes in shortwave radiation (Fig. 12a). Areas where LULCCs are imposed present higher albedo (Fig. 11b), reducing the net shortwave radiation by −15.6 % (Fig. 12a) due to the increased outgoing shortwave radiation. Changes in LAI, longwave radiation, and near-surface temperature follow similar patterns (Figs. 11a and 12b and f). In the southwest, where LAI is increased, there is a decrease in net longwave radiation and cooler near-surface temperature. Conversely, regions with reduced LAI in the rest of the Dry Chaco result in increased net longwave radiation and warmer temperature. This can be explained by the reduced vegetation cover, which diminishes shading and leads to surface warming and increased outgoing longwave radiation. The opposite effect occurs in areas with higher LAI. Although area-averaged values at local level tend to be small due to compensating positive and negative changes, temperature changes can reach values of up to ±0.6 °C. It is worth noting that the overall reduction in net total radiation is also evident in the generally weaker turbulent surface fluxes (Fig. 12d and e). Latent heat decays by −4.2 %, while sensible heat decreases by −11 % on average.
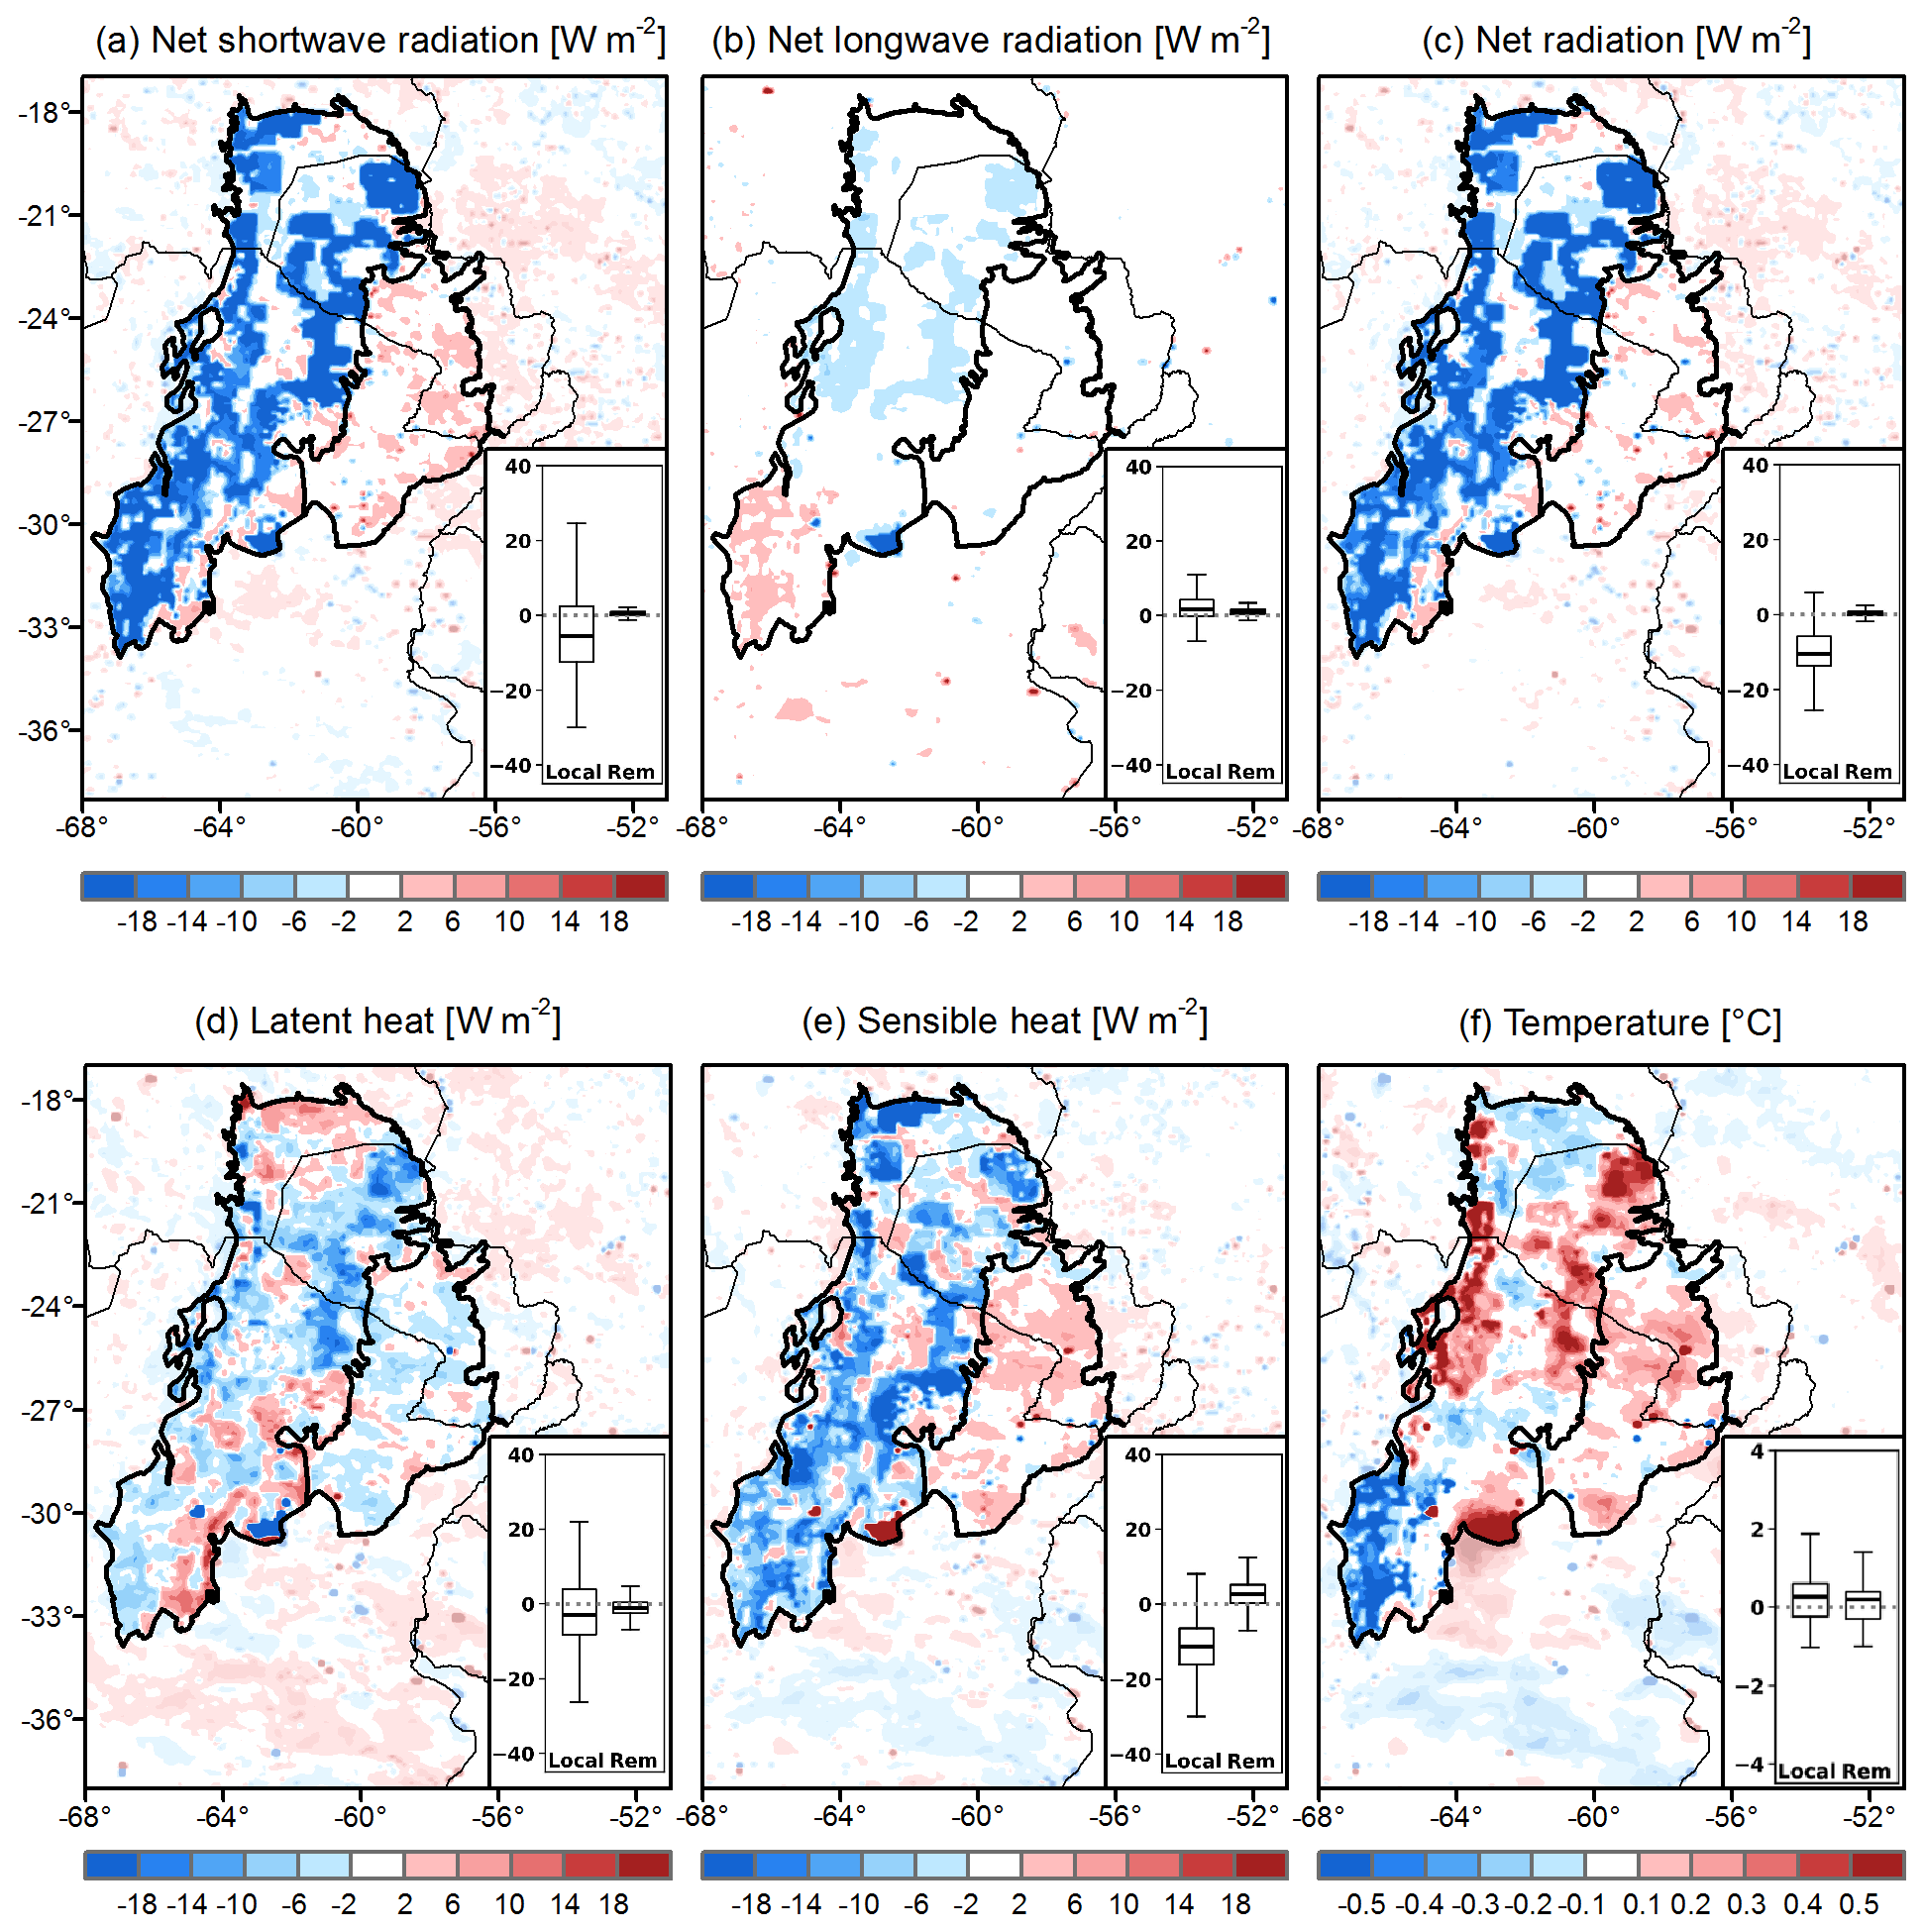
Figure 12Differences in the summer energy budget components in the AG_INT scenario (FUTURE-CONTROL): (a) net shortwave radiation, (b) net longwave radiation, (c) net radiation, (d) latent heat, (e) sensible heat, and (f) 2 m temperature. Opacity was used to highlight the region of interest. The box plots in the insets show the percentage differences of grid cells with land cover changes in the Dry Chaco (local) and over the Humid Chaco (Rem).
The agricultural expansion imposed in the Dry Chaco has weak remote effects on the energy budget of the Humid Chaco (Fig. 12). The net radiation presents a slight increase consistent with the overall rise in the net shortwave radiation (Fig. 12a–c). The spatial patterns of changes in latent heat and sensible heat are similar but of opposite signs, with latent heat decreasing by −1.1 % and sensible heat increasing by 2.7 % (Fig. 12d and e). The near-surface temperature shows a slight warming that can be associated with increased heat (Fig. 12f).
4.2.2 Effects on the hydrological response
The extensive expansion of crops and grasslands in the Dry Chaco results in generally drier summers in the Gran Chaco (Fig. 13). The areas that experienced direct LULCCs (local effects) present a decay in summer precipitation of −7 % on average and −9.3 % in soil moisture. The overall drier soils cause a reduction in evapotranspiration of −4.2 %, with a spatial distribution of changes similar to those observed for precipitation and soil moisture, except in the southeast of the Dry Chaco. Similarly, runoff is slightly reduced by −1.2 % on average. While the average reductions in water balance components represent less than 10 % in magnitude, nearly half of the area with LULCCs exhibits significant negative changes of approximately −30 %. These substantial changes have the potential for a significant impact on the region, considering its arid nature.
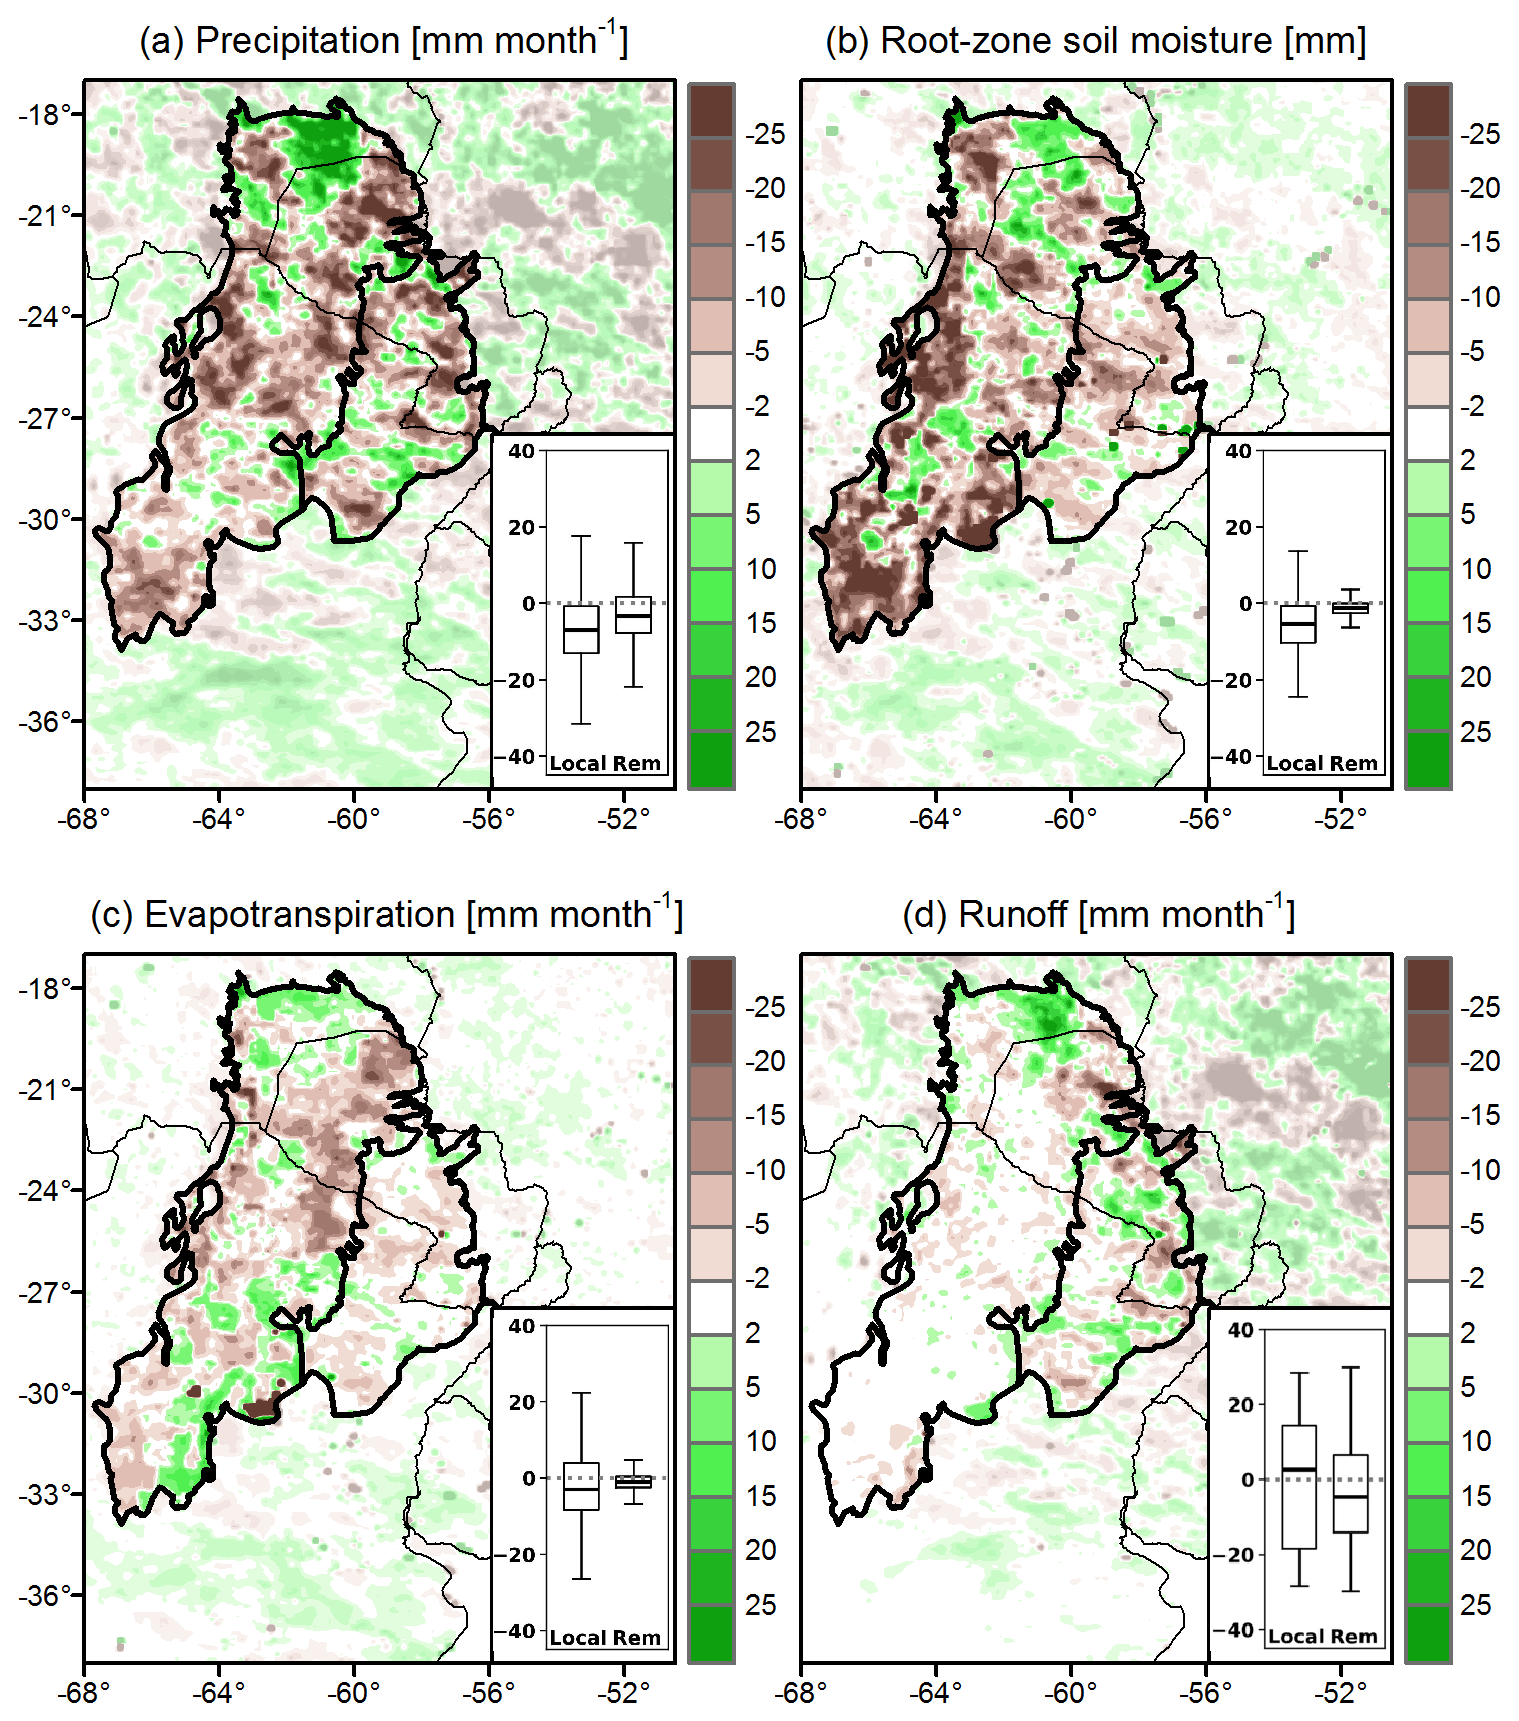
Figure 13Differences in the summer water budget components in the AG_INT scenario (FUTURE–CONTROL): (a) precipitation, (b) soil moisture, (c) evapotranspiration, and (d) runoff for the PAST experiment. Opacity was used to highlight the region of interest. The box plots in the insets show the percentage differences of grid cells with land cover changes in the Dry Chaco (local) and over the Humid Chaco (Rem).
The overall remote effects in the Humid Chaco region result in drier summers, similar to those observed in the Dry Chaco but with lesser intensity (Fig. 13). The changes in precipitation indicate a general tendency towards increased dryness in most parts of the Humid Chaco, except for isolated areas experiencing significant increases (Fig. 13a). On average, summer precipitation decreases by −4 %, although there are areas with changes of up to ±30 mm per month. These changes in precipitation are accompanied by corresponding patterns in soil moisture, which also show a slight average decrease of about −1.2 % (Fig. 13b). Furthermore, evapotranspiration experiences an average reduction of −1.1 %, with localized decreases of up to −8 % in specific parts of the Humid Chaco. The overall drier conditions contribute to a reduction in runoff by about −4.2 % on average. Interestingly, this reduction is greater in the Humid Chaco than the Dry Chaco (−4.5 %). In summary, our results suggest that the expansion of agriculture in the Dry Chaco intensifies the aridity of this already dry region and extends drier conditions into the Humid Chaco.
4.3 Process-based analysis
The results of the experiments consistently demonstrate that agricultural expansion in the Dry Chaco region leads to drier and warmer summers, regardless of the magnitude of the agricultural expansion. It is always a challenge to elucidate the processes that explain a specific change in a given variable due to the several factors acting together, as shown in Fig. 1 of Santanello et al. (2018). Thus, our goal is to identify the most relevant mechanisms that explain the effects of LULCCs in the Gran Chaco hydroclimate, while acknowledging that other processes may also have certain impact on our results. Figure 14 presents a schematic diagram summarizing our interpretation of the key processes involved.
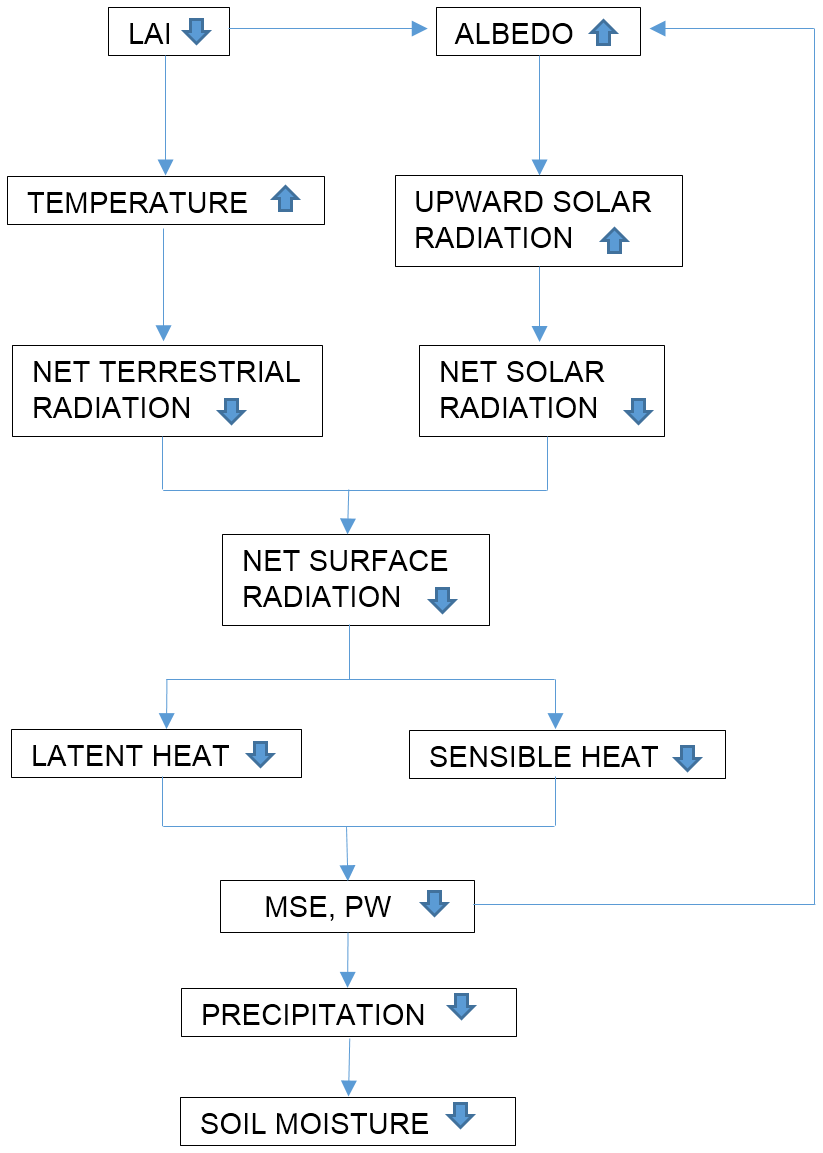
Figure 14Schematic diagram of the possible land–atmosphere feedback pathway caused by agricultural expansion. Upward arrows represent increases, while downward arrows depict decreases.
The intensification of agriculture in the Dry Chaco region brings about significant variations in biophysical properties, particularly LAI and albedo. While stomatal resistance is also greatly reduced, which would facilitate plant transpiration, its impact remains limited due to the water-limited regime. Consequently, the main focus lies on the effect of reduced LAI, leading to increased surface temperature due to decreased vegetation radiation sheltering. This rise in temperature increases the outgoing longwave radiation, resulting in a decrease in net longwave radiation. Conversely, the increased albedo decreases the net shortwave radiation by reflecting a greater portion of incoming shortwave radiation. These changes in the energy budget consequently lead to a reduction in net surface radiation, aligning with the feedback mechanisms proposed by Eltahir (1998), Seneviratne et al. (2010), and Santanello et al. (2018).
The changes in net surface radiation are counterbalanced by the sum of latent and sensible fluxes, with soil heat flux considered negligible over longer time periods. Thus, the decrease in net radiation is equivalent to a decrease in the combined latent and sensible heat fluxes. This total energy flux from the land surface into the atmosphere represents the moist static energy (MSE), characterizing the overall energy within the atmospheric boundary layer. Consequently, a reduction in net radiation, and, therefore, a decline in available energy at the land surface, can be associated with less energetic conditions in the boundary layer. This, in turn, influences the dynamics of the planetary boundary layer and diminishes the generation of convective precipitation (Eltahir and Pal, 1996; Eltahir, 1998). Our interpretation is that the reduced energy in the atmosphere combined with the reduced precipitable water (PW; not shown) contributes to the overall stabilization of the boundary layer, resulting in less convective rainfall. This decrease in precipitation subsequently contributes to a decline in soil moisture. This creates a feedback loop since dry soil absorbs significantly less solar radiation than moist soil.
The significant deforestation in the Dry Chaco, driven by agricultural expansion, is widely recognized, and several studies have focused on its causes and environmental consequences. This study goes beyond by exploring how the dominant LULCCs in the Dry Chaco from 2001 to 2015 impact the regional hydroclimate and the potential non-local effects that may develop in the Humid Chaco if the intensive agricultural expansion within the Dry Chaco continues. To this end, three ensembles of four simulations using different land cover maps were conducted using the WRF model from January 2014 to June 2016. Longer simulations could offer a more comprehensive understanding under diverse large-scale atmospheric conditions; in our case, the length of these high-resolution simulations (determined by the computational capacity) provides valuable insights for assessing the land–atmosphere processes that occur on daily to monthly timescales. The role of background flow on interannual or larger scales is outside the scope of this study. The first ensemble employed the MODIS land cover map corresponding to 2015 (CONTROL). The second one used the MODIS land cover map corresponding to 2001 (PAST). The third one employed a modified version of the 2015 land cover map where the existing crop and pasture areas in 2015 within the Dry Chaco were expanded (FUTURE).
The performance of the CONTROL simulation was assessed by comparing simulated precipitation, near-surface and root-zone soil moisture, and 2 m temperature with gridded observations or satellite estimates. Other variables such as radiation, heat fluxes, runoff, LAI, and albedo could potentially be included in an evaluation; however their derivation involves algorithms or models with inherent approximations and uncertainties, primarily due to the lack of field observations of non-conventional variables in the Gran Chaco region. Consequently, the validation of such variables without the inclusion of the ground truth would be reduced to a comparison between two disparate estimates. Given these limitations, and to maintain the scope of the research, we focused on evaluating the model's final output products, rather than its parameterizations and intermediate components. The evaluation of the selected variables demonstrates good skills of the WRF model for the region of interest. Simulated precipitation shows a marked resemblance with observations in Gran Chaco, with minor negative biases in the Humid Chaco. Near-surface and root-zone soil moisture closely matches the products derived from remotely sensed data in the Gran Chaco, although, consistent with negative precipitation biases, drier biases are observed in the Humid Chaco. The correlation coefficients for near-surface temperature indicate a strong agreement with observations in the Gran Chaco, although with somewhat larger seasonal variability. These results reinforce the effectiveness of the WRF model and the selected parameterizations in simulating southern South America hydroclimate, aligning with the results of our prior research efforts (Lee and Berbery, 2012; Müller et al., 2014, 2016; Sörensson and Berbery, 2015).
The MODIS maps reveal that the dominant land cover categories in the Dry Chaco include savanna, woody savanna, forest, grassland, shrubland, and cropland. Over the period from 2001 to 2015, land cover changes were observed in 18 % of the entire Chaco region. These changes can be categorized as deforestation (52 %), illogical (17 %), and other (31 %). Agricultural lands, specifically cropland and grassland, experienced a sustained increase in the region particularly until 2007. Land cover changes due to deforestation processes, primarily characterized by the loss of woodlands, have been observed along the central-east, northeast, and western boundaries of the Dry Chaco, consistent with the finding of recent studies (Maertens et al., 2021; Mosciaro et al., 2022). The changes were observed in small fragmented areas, with deforestation primarily associated with decreases in LAI, increases in albedo, and reduced stomatal resistance. These findings align with other studies (e.g. Jiang et al., 2021), which reported that deforestation leads to lower LAI and higher surface albedo. In other areas where different land cover changes occurred (from open shrubland to barren, from grassland to cropland, among others), some biophysical properties show opposite trends, resulting in a heterogeneous pattern of property changes.
The simulations show that the heterogeneous LULCCs from 2001 to 2015 and the associated changes in biophysical properties led to uneven distribution of positive and negative changes in radiation fluxes, particularly affecting net radiation, sensible heat flux, and latent heat flux. While there were average reductions in net radiation and sensible heat at the local level, latent heat changes were minor. Spatially, changes in sensible heat influenced near-surface temperature, leading to warming in deforested areas and cooling in areas with other LULCCs. For instance, the conversion from open shrublands and grasslands to savannas resulted in an increased LAI, which enhanced transpiration and shading, thereby producing a cooling effect. The changes in biophysical properties and in the energy budget also affected the water cycle, resulting in overall drier conditions in the Dry Chaco. Precipitation exhibited significant changes, with both decreases and increases observed in different areas. Soil moisture followed the pattern of precipitation, displaying net local negative changes. The changes in precipitation and soil moisture are reflected in the evapotranspiration and the total runoff, all experiencing net negative changes. The findings suggest that the observed land cover changes weakened the water cycle in the Dry Chaco, contributing to drier summers and increased vulnerability to extreme events in this arid region, at least when the large-scale atmospheric conditions remain as in the simulated period.
At present, there is no indication that deforestation will slow down. Assuming a scenario of a strong global market opening with minimal regulation (Mosciaro et al., 2022), we designed a set of simulations that included agricultural expansion of the existing agricultural areas within the Dry Chaco and evaluated the possible consequences for the regional climate. Consistent with the effects observed in the OBS_LULCC scenario, a general decrease in LAI and stomatal resistance and an increase in albedo were observed at the local level. The expansion of agriculture in the Dry Chaco region resulted in significant changes in the energy budget, with further reductions in net radiation and weakening of the turbulent surface fluxes. These changes had local effects on the water cycle, causing drier conditions with decreased precipitation, soil moisture, evapotranspiration, and runoff. The extensive expansion of crops and grasslands in the Dry Chaco led to generally drier summers in the simulations, particularly in areas that experienced land use and land cover changes, with reductions in precipitation, soil moisture, evapotranspiration, and runoff. In this context, the aridity of the Chaco region that is already dry could be intensified further, with potential implications for its ecosystems and water resources. Furthermore, the expansion of agriculture may produce remote effects on the Humid Chaco, extending the drier conditions into this region, although to a lesser extent than the Dry Chaco. These findings highlight the complex interactions between land use, land cover changes, and the energy and water cycles, emphasizing the need for sustainable land management practices in the Chaco region to mitigate the impacts of agricultural expansion and preserve these ecosystems' ecological and hydrological integrity.
Lastly, we acknowledge the inherent uncertainties associated with models that may limit the full representation of complex physical processes related to deforestation. However, we highlight that climate models offer distinctive advantages, including the ability to maintain physical consistency within the Earth system, simulate a wide range of processes, and facilitate controlled experiments by modifying initial and boundary conditions. These features make climate models the only tool capable of exploring the intricate chain of processes affected by changes in initial and boundary conditions, an analysis that cannot be replicated using observed data or reanalysis. Moreover, the minimal internal variability of the WRF simulations, coupled with the high level of skill of the WRF model in simulating fundamental variables – a recognition echoed in prior studies – strengthens our confidence in its ability to capture underlying processes. Thus, our experiments provide a valid and unique approach to analysing the sensitivity of land–atmosphere physical interactions to different land cover scenarios. On the other hand, we also acknowledge that longer-timescale simulations are needed to assess the impacts of LULCCs under diverse large-scale conditions. Future studies should extend the simulation period or repeat the experiments under different climatic conditions to provide a more nuanced understanding of the long-term impacts of LULCC.
Our investigation demonstrates that the WRF model exhibited strong performance, effectively simulating fundamental variables in the Gran Chaco, reinforcing its reliability for assessing land–atmosphere processes. Additionally, the remotely sensed data show that the predominant form of LULCCs in the Dry Chaco since 2000 involves the conversion of natural vegetation, primarily woodlands and forests, into agricultural patches in lands adjacent to previously deforested areas, typically along the central-east, northeast, and western boundaries of the Dry Chaco.
The observed LULCCs from 2001 to 2015 modify the biophysical properties, affecting the energy and water budget in the Dry Chaco summers. The simulations indicate an average reduction in net surface radiation and surface energy fluxes, which, in turn, leads to drier hydrological conditions overall in terms of precipitation and runoff. Although changes in hydroclimate variables are found in the whole of the Dry Chaco, they are larger in areas that undergo land cover changes.
Simulations assuming continued agricultural expansion in the Dry Chaco indicate further reductions in net radiation and turbulent surface fluxes and drier conditions, with the noteworthy outcome of extending these impacts remotely into the Humid Chaco. Thus, the expansion of agriculture alters the regional hydroclimate through local, non-local, and remote changes in different magnitudes. Although our simulations are subject to uncertainties, the results suggest that the current land use practices over the Dry Chaco may not be sustainable in the long term, as they expose an already arid and hot region to even drier and warmer conditions, increasing its vulnerability to extreme events.
The observational datasets used in this study are freely available online. The MODIS MCD12C1 product is available at https://doi.org/10.5067/MODIS/MCD12C1.006 (Sulla-Menashe and Friedl, 2018). The CPC dataset is available at https://climatedataguide.ucar.edu/climate-data/cpc-unified-gauge-based-analysis-global-daily-precipitation (Xie and Arkin, 2023). The CRU TS v. 4.03 dataset is available at https://doi.org/10.5285/10d3e3640f004c578403419aac167d82 (Harris and Jones, 2020). The ERA5 dataset is available at https://doi.org/10.24381/cds.adbb2d47 (Hersbach et al., 2023), the SMOPS dataset is available at https://www.ospo.noaa.gov/Products/land/smops (NOAA Office of Satellite and Product Operations, OSPO, 2023), and the H14-SM-DAS-2 dataset can be acquired at https://hsaf.meteoam.it/User/UserSupport (EUMETSAT H SAF, 2023). Simulations are available upon request.
MAB, OVM, and EHB designed the study. MAB performed the simulations, computed the results, and prepared the original manuscript. All authors analysed and discussed the results and contributed to the subsequent versions of the paper. OVM, MAL, and EHB acquired funding and resources.
The contact author has declared that none of the authors has any competing interests.
Publisher's note: Copernicus Publications remains neutral with regard to jurisdictional claims made in the text, published maps, institutional affiliations, or any other geographical representation in this paper. While Copernicus Publications makes every effort to include appropriate place names, the final responsibility lies with the authors.
We thank José Paruelo for his comments on the MODIS classification of land covers. Ernesto Hugo Berbery also thanks the Fulbright Commission for facilitating the last stages of this research.
This research has been supported by ASaCTeI (grant no. PEICID-2021-028), ANPCYT (grant no. PICT-2019-2019-03982), and CONICET (grant no. PIP 11220200102257CO). Ernesto Hugo Berbery was supported by NOAA (grant no. NA19NES4320002, Cooperative Institute for Satellite Earth System Studies – CISESS at the University of Maryland/ESSIC).
This paper was edited by Yongping Wei and reviewed by two anonymous referees.
Adam, J. C., Clark, E. A., Lettenmaier, D. P., and Wood, E. F.: Correction of global precipitation products for orographic effects, J. Climate, 19, 15–38, https://doi.org/10.1175/JCLI3604.1, 2006.
Albergel, C., De Rosnay, P., Gruhier, C., Muñoz-Sabater, J., Hasenauer, S., Isaksen, L., Kerr, Y., and Wagner, W.: Evaluation of remotely sensed and modelled soil moisture products using global ground-based in situ observations, Remote Sens. Environ., 118, 215–226, https://doi.org/10.1016/j.rse.2011.11.017, 2012.
Almazroui, M., Ashfaq, M., Islam, M., Rashid, I., Kamil, S., Abid, M., O'Brien, E., Ismail, M., Reboita, M., Sörensson, A., Arias, P., Muniz Alves, L., Tippett, M., Saeed, S., Haarsma, R., Doblas-Reyes, F., Saeed, F., Kucharski, F., Nadeem, I., Silva-Vidal, Y., Rivera, J., Ehsan, M., Martínez-Castro, D., Muñoz, A., Ali, M., Coppola, E., and Bamba Sylla, M.: Assessment of CMIP6 Performance and Projected Temperature and Precipitation Changes Over South America, Earth Syst. Environ., 5, 155–183, https://doi.org/10.1007/s41748-021-00233-6, 2021.
Baldi, G., Houspanossian, J., Murray, F., Rosales, A., Rueda, C., and Jobbágy, E.: Cultivating the dry forests of South America: Diversity of land users and imprints on ecosystem functioning, J. Arid Environ., 123, 47–59, https://doi.org/10.1016/j.jaridenv.2014.05.027, 2015.
Ball, J. T., Woodrow, I. E., and Berry, J. A.: A model predicting stomatal conductance and its contribution to the control of photosynthesis under different environmental conditions, in: Progress in Photosynthesis Research, edited by: Biggins, J., Springer, Dordrecht, 4, 221–224, 1987.
Barros, V. R., Boninsegna, J. A., Camilloni, I. A., Chidiak, M., Magrín, G. O., and Rusticucci, M.: Climate change in Argentina: trends, projections, impacts and adaptation, WIREs Clim. Change, 6, 151–169, https://doi.org/10.1002/wcc.316, 2015.
Beck, H. E., van Dijk, A. I. J. M., Levizzani, V., Schellekens, J., Miralles, D. G., Martens, B., and de Roo, A.: MSWEP: 3-hourly 0.25° global gridded precipitation (1979–2015) by merging gauge, satellite, and reanalysis data, Hydrol. Earth Syst. Sci., 21, 589–615, https://doi.org/10.5194/hess-21-589-2017, 2017.
Brutsaert, W.: Evaporation into the Atmosphere: Theory, History, and Applications, D. Reidel Publishing Company, ISBN 13: 9789027712479, 1982.
Bucher, E. H. and Huszar, P. C.: Sustainable management of the Gran Chaco of South America: ecological promise and economic constraints, J. Environ. Manage., 57, 99–108, https://doi.org/10.1006/jema.1999.0290, 1999.
Bulacio, E. M., Romagnoli, M., Otegui, M. E., Chan, R. L., and Portapila, M.: OSTRICH-CROPGRO multi-objective optimization methodology for calibration of the growing dynamics of a second-generation transgenic soybean tolerant to high temperatures and dry growing conditions, Agr. Syst., 205, 103583, https://doi.org/10.1016/j.agsy.2022.103583, 2023.
Cai, S., Liu, D., Sulla-Menashe, D., and Friedl, M. A.: Enhancing MODIS land cover product with a spatial–temporal modeling algorithm, Remote Sens. Environ., 147, 243–255, https://doi.org/10.1016/j.rse.2014.03.012, 2014.
Cai, W., McPhaden, M. J., Grimm, A. M., Rodrigues, R. R., Taschetto, A. S., Garreaud, R. D., Dewitte, B., Poveda, G., Ham, Y.-G., Santoso, A., Ng, B., Anderson, W., Wang, G., Geng, T., Jo, H.-S., Marengo, J. A., Alves, L. M., Osman, M., Li, S., Karamperidou, C., Takahashi, K., and Vera, C.: Climate impacts of the El Niño–southern oscillation on South America, Nat. Rev. Earth Environ., 1, 215–231, https://doi.org/10.1038/s43017-020-0040-3, 2020.
Chen, F. and Dudhia, J.: Coupling an advanced land surface hydrology model with the Penn State–NCAR MM5 modeling system. Part I: Model implementation and sensitivity, Mon. Weather. Rev., 129, 569–585, https://doi.org/10.1175/1520-0493(2001)129<0569:CAALSH>2.0.CO;2, 2001.
Chen, F., Mitchell, K., Schaake, J., Xue, Y., Pan, H. L., Koren, V., Duan, Q. Y., Ek, M., and Betts, A.: Modeling of land surface evaporation by four schemes and comparison with FIFE observations, J. Geophys. Res.-Atmos., 101, 7251–7268, https://doi.org/10.1029/95JD02165, 1996.
Chen, M., Shi, W., Xie, P., Silva, V., Kousky, V. E., Wayne, R., Higgins, R., and Janowiak, J. E.: Assessing objective techniques for gauge-based analyses of global daily precipitation, J. Geophys. Res., 113, D04110, https://doi.org/10.1029/2007JD009132, 2008.
De Sy, V., Herold, M., Achard, F., Beuchle, R., Clevers, J. G., Lindquist, E., and Verchot, L.: Land use patterns and related carbon losses following deforestation in South America, Environ. Res. Lett., 10, 124004, https://doi.org/10.1088/1748-9326/10/12/124004, 2015.
Dirmeyer, P.: Using a global soil wetness dataset to improve seasonal climate simulation, J. Climate, 13, 2900–2922, https://doi.org/10.1175/1520-0442(2000)013<2900:UAGSWD>2.0.CO;2, 2000.
Dros, J. M.: Managing the Soy Boom: Two scenarios of soy production, AIDEnvironment, Amsterdam, 63 pp., https://wwfeu.awsassets.panda.org/downloads/managingthesoyboomenglish_nbvt.pdf (last access: 5 May 2024), 2004.
Dudhia, J.: Numerical study of convection observed during the Winter Monsoon Experiment using a mesoscale two-dimensional model, J. Atmos. Sci., 46, 3077–3107, https://doi.org/10.1175/1520-0469(1989)046<3077>2.0.CO;2, 1989.
Eltahir, E. A. B.: A Soil Moisture–Rainfall Feedback Mechanism: 1. Theory and observations, Water Resour. Res., 34, 765–776, https://doi.org/10.1029/97WR03499, 1998.
Eltahir, E. A. B. and Pal, J. S.: Relationship between surface conditions and subsequent rainfall in convective storms, J. Geophys. Res., 101, 26237–26245, 1996.
EUMETSAT H SAF: H14-SM-DAS-2 Soil Moisture Data Assimilation System, EUMETSAT H SAF, https://hsaf.meteoam.it/User/UserSupport, last access: 10 May 2023.
Fehlenberg, V., Baumann, M., Gasparri, N. I., Piquer-Rodriguez, M., Gavier-Pizarro, G., and Kuemmerle, T.: The role of soybean production as an underlying driver of deforestation in the South American Chaco, Global Environ. Chang., 45, 24–34, https://doi.org/10.1016/j.gloenvcha.2017.05.001, 2017.
Flanagan, P. X., Mahmood, R., Sohl, T., Svoboda, M., Wardlow, B., Hayes, M., and Rappin, E.: Simulated Atmospheric Response to Four Projected Land-Use Land-Cover Change Scenarios for 2050 in the North-Central United States, Earth Interact., 25, 177–194, https://doi.org/10.1175/EI-D-20-0019.1, 2021.
Garreaud, R. D., Vuille, M., Compagnucci, R., and Marengo, J.: Present-day south American climate, Palaeogeogr. Palaeocl., 281, 180–195, https://doi.org/10.1016/j.palaeo.2007.10.032, 2009.
Georgescu, M., Lobell, D. B., Field, C. B., and Mahalov, A.: Simulated hydroclimatic impacts of projected Brazilian sugarcane expansion, Geophys. Res. Lett., 40, 972–977, https://doi.org/10.1002/grl.50206, 2013.
Gónzalez, R. and Woods, R.: Digital Image Processing, Addison-Wesley Longman Publishing Co., Boston, United States, 503 pp., ISBN 978-0-201-11026-5, 1993.
Grimm, A. M.: Madden–Julian Oscillation impacts on South American summer monsoon season: precipitation anomalies, extreme events, teleconnections, and role in the MJO cycle, Clim. Dynam., 53, 907–932, https://doi.org/10.1007/s00382-019-04622-6, 2019.
Hansen, M. C., Potapov, P. V., Moore, R., Hancher, M., Turubanova, S. A., Tyukavina, A., Thaus, D., Stehman, S. V., Goetz, S. J., Loveland, T. R., Kommareddy, A., Egorov, A., Chini, L., Justice, C. O., and Townshend, J.: High-resolution global maps of 21st-century forest cover change, Science, 342, 850–853, https://doi.org/10.1126/science.1244693, 2013.
Harris, I. C. and Jones, P. D.: CRU TS4.03: Climatic Research Unit (CRU) Time-Series (TS) version 4.03 of high-resolution gridded data of month-by-month variation in climate (Jan. 1901–Dec. 2018), Centre for Environmental Data Analysis (CEDA) [data set], https://doi.org/10.5285/10d3e3640f004c578403419aac167d82, 22 January 2020.
Harris, I., Osborn, T. J., Jones, P., and Lister, D.: Version 4 of the CRU TS monthly high-resolution gridded multivariate climate dataset, Scientific Data, 7, 1–18, https://doi.org/10.1038/s41597-020-0453-3, 2020.
He, C., Valayamkunnath, P., Barlage, M., Chen, F., Gochis, D., Cabell, R., Schneider, T., Rasmussen, R., Niu, G.-Y., Yang, Z.-L., Niyogi, D., and Ek, M.: Modernizing the open-source community Noah with multi-parameterization options (Noah-MP) land surface model (version 5.0) with enhanced modularity, interoperability, and applicability, Geosci. Model Dev., 16, 5131–5151, https://doi.org/10.5194/gmd-16-5131-2023, 2023.
Hersbach, H., Bell, B., Berrisford, P., Hirahara, S., Horányi, A., Muñoz-Sabater, J., Nicolas, J., Peubey, C., Radu, R., Schepers, D., Simmons, A., Soci, C., Abdalla, S., Abellan, X., Balsamo, G., Bechtold, P., Biavati, G., Bidlot, J., Bonavita, M., De Chiara, G., Dahlgren, P., Dee, D., Diamantakis, M., Dragani, R., Flemming, J., Forbes, R., Fuentes, M., Geer, A., Haimberger, L., Healy, S., Hogan, R., Hólm, E., Janisková, M., Keeley, S., Laloyaux, P., Lopez, P., Lupu, C., Radnoti, G., de Rosnay, P., Rozum, I., Vamborg, F., Villaume, S., and Thépaut, J. N.: The ERA5 global reanalysis, Q. J. Roy. Meteor. Soc., 146, 1999–2049, https://doi.org/10.1002/qj.3803, 2020.
Hersbach, H., Bell, B., Berrisford, P., Biavati, G., Horányi, A., Muñoz Sabater, J., Nicolas, J., Peubey, C., Radu, R., Rozum, I., Schepers, D., Simmons, A., Soci, C., Dee, D., and Thépaut, J.-N.: ERA5 hourly data on single levels from 1940 to present, Copernicus Climate Change Service (C3S) Climate Data Store (CDS) [data set], https://doi.org/10.24381/cds.adbb2d47, 2023.
Hoffman, R. N. and Kalnay, E.: Lagged average forecasting, an alternative to Monte Carlo forecasting, Tellus A, 35, 100–118, https://doi.org/10.3402/tellusa.v35i2.11425, 1983.
Janjic, Z. I.: The step-mountain eta coordinate model: Further developments of the convection, viscous sublayer, and turbulence closure schemes, Mon. Weather Rev., 122, 927–945, https://doi.org/10.1175/1520-0493(1994)122<0927>2.0.CO;2, 1994.
Janjic, Z. I.: Comments on “Development and evaluation of a convection scheme for use in climate models”, J. Atmos. Sci., 57, 3686, https://doi.org/10.1175/1520-0469(2000)057<3686>2.0.CO;2, 2000.
Jiang, Y., Wang, G., Liu, W., Erfanian, A., Peng, Q., and Fu, R.: Modeled response of South American climate to three decades of deforestation, J. Climate, 34, 2189–2203, https://doi.org/10.1175/JCLI-D-20-0380.1, 2021.
Jiménez, P. A., Dudhia, J., González-Rouco, J. F., Navarro, J., Montávez, J. P., and García-Bustamante, E.: A revised scheme for the WRF surface layer formulation, Mon. Weather Rev., 140, 898–918, https://doi.org/10.1175/MWR-D-11-00056.1, 2012.
Jordan, R.: A one-dimensional temperature model for a snow cover: Technical documentation for SNTHERM.89, Special Rep. 91-16, Cold Regions Research and Engineering Laboratory, U.S. Army Corps of Engineers, Hanover, NH, 61 pp., 1991.
Lal, P., Shekhar, A., and Kumar, A.: Quantifying temperature and precipitation change caused by land cover change: a case study of India using the WRF model, Front. Environ. Sci., 9, 766328, https://doi.org/10.3389/fenvs.2021.766328, 2021.
Lee, S.-J.: Impact of land surface vegetation change over the La Plata Basin on the regional climatic environment: A study using conventional land-cover/land-use and newly developed ecosystem functional types, PhD dissertation, University of Maryland, 153 pp., http://hdl.handle.net/1903/10831 (last access: 10 May 2023), 2010.
Lee, S. J. and Berbery, E. H.: Land cover change effects on the climate of the La Plata Basin, J. Hydrometeorol., 13, 84–102, https://doi.org/10.1175/JHM-D-11-021.1, 2012.
Li, D., Bou-Zeid, E., Barlage, M., Chen, F., and Smith, J. A.: Development and evaluation of a mosaic approach in the WRF-Noah framework, J. Geophys. Res.-Atmos., 118, 11918—11935, https://doi.org/10.1002/2013JD020657, 2013.
Liang, L. and Gong, P.: An assessment of MODIS Collection 5 global land cover product for biological conservation studies, in: 2010 18th International Conference on Geoinformatics, Beijing, China, 18–20 June 2010, 1–6, https://doi.org/10.1109/GEOINFORMATICS.2010.5567991, 2010.
Liu, J., Zhan, X., Hain, C., Yin, J., Fang, L., Li, Z., and Zhao, L.: NOAA soil moisture operational product system (SMOPS) and its validations, in: 2016 IEEE International Geoscience and Remote Sensing Symposium (IGARSS), Beijing, China, 10–15 July 2016, IEEE, 3477–3480, https://doi.org/10.1109/IGARSS.2016.7729899, 2016.
Lovino, M. A., Pierrestegui, M. J., Müller, O. V., Berbery, E. H., Müller, G. V., and Pasten, M.: Evaluation of historical CMIP6 model simulations and future projections of temperature and precipitation in Paraguay, Climatic Change, 164, 1–24, https://doi.org/10.1007/s10584-021-03012-4, 2021.
Maertens, M., De Lannoy, G. J. M., Apers, S., Kumar, S. V., and Mahanama, S. P. P.: Land surface modeling over the dry Chaco: the impact of model structures, and soil, vegetation and land cover parameters, Hydrol. Earth Syst. Sci., 25, 4099–4125, https://doi.org/10.5194/hess-25-4099-2021, 2021.
Mahmood, R., Pielke Sr., R. A., Hubbard, K. G., Niyogi, D., Bonan, G., Lawrence, P., McNider, R., McAlpine, C., Etter, A., Gameda, S., Qian, B., Carleton, A., Beltran-Przekurat, A., Chase, T., Quintanar, A., Adegoke, J., Vezhapparambu, S., Conner, G., Asefi, S., Sertel, E., Legates, D., Wu, Y., Hale, R., Frauenfeld, O., Watts, A., Shepherd, M., Mitra, C., Anantharaj, V., Fall, S., Lund, R., Treviño, A., Blanken, P., Du, J., Chang, H-I., Leeper, R., Nair, U., Dobler, S., Deo, R., and Syktus, J.: Impacts of land use/land cover change on climate and future research priorities, B. Am. Meteorol. Soc., 91, 37–46, https://doi.org/10.1175/2009BAMS2769.1, 2010.
Mahmood, R., Pielke Sr., R. A., Hubbard, K. G., Niyogi, D., Dirmeyer, P. A., McAlpine, C., Carleton, A. M., Hale, R., Gameda, S., Beltrán-Przekurat, A., Baker, B., McNider, R., Legates, D. R., Shepherd, M., Du, J., Blanken, P. D., Frauenfeld, O. W., Nair, U. S., and Fall, S.: Land cover changes and their biogeophysical effects on climate, Int. J. Climatol., 34, 929–953, https://doi.org/10.1002/joc.3736, 2014.
Martinez, J., Dominguez, F., and Miguez-Macho, G.: Impacts of a Groundwater Scheme on Hydroclimatological Conditions over Southern South America, J. Hydrometeorol., 17, 2959–2978, https://doi.org/10.1175/JHM-D-16-0052.1, 2016.
Miguez-Macho, G., Fan, Y., Weaver, C., Walko, R., and Robock, A.: Incorporating water table dynamics in climate modeling: 1. Water table observations and equilibrium water table simulations, J. Geophys. Res., 112, D10125, https://doi.org/10.1029/2006JD008111, 2007.
Mlawer, E. J., Taubman, S. J., Brown, P. D., Iacono, M. J., and Clough, S. A.: Radiative transfer for inhomogeneous atmospheres: RRTM, a validated correlated-k model for the longwave, J. Geophys. Res., 102, 16663–16682, https://doi.org/10.1029/97JD00237, 1997.
Mosciaro, M. J., Calamari, N. C., Peri, P. L., Flores Montes, N., Seghezzo, L., Ortiz, E., Rejalaga, L., Barral, P., Villarino, S., Mastrangelo, M., and Volante, J.: Future scenarios of land use change in the Gran Chaco: how far is zero-deforestation?, Reg. Environ. Change, 22, 115, https://doi.org/10.1007/s10113-022-01965-5, 2022.
Müller, O., Vidale, P. L., Vannière, B., Schiemann, R., and McGuire, P.: Does the HadGEM3-GC3.1 GCM overestimate land precipitation at high resolution? A constraint based on observed river discharge, J. Hydrometeorol., 22, 2131–2151, https://doi.org/10.1175/JHM-D-20-0290.1, 2021.
Müller, O. V., Berbery, E. H., Alcaraz Segura, D., and Ek, M. B.: Regional model simulations of the 2008 drought in southern South America using a consistent set of land surface properties, J. Climate, 27, 6754–6778, https://doi.org/10.1175/JCLI-D-13-00463.1, 2014.
Müller, O. V., Lovino, M. A., and Berbery, E. H.: Evaluation of WRF model forecasts and their use for hydroclimate monitoring over southern South America, Weather Forecast., 31, 1001–1017, https://doi.org/10.1175/WAF-D-15-0130.1, 2016.
Niu, G.-Y. and Yang, D.: Elevated freezing point of supercooled liquid water and its effect on the simulated snow properties in a land surface model, J. Geophys. Res., 111, D15103, https://doi.org/10.1029/2005JD006712, 2006.
Niu, G. Y., Yang, Z. L., Mitchell, K. E., Chen, F., Ek, M. B., Barlage, M., Kumar, A., Manning, K., Niyogi, D., Rosero, E., Tewari, M., and Xia, Y.: The community Noah land surface model with multiparameterization options (Noah-MP): 1. Model description and evaluation with local-scale measurements, J. Geophys. Res.-Atmos., 116, D12109, https://doi.org/10.1029/2010JD015139, 2011.
NOAA Office of Satellite and Product Operations (OSPO): Soil Moisture Operational Product System (SMOPS), OSPO [data set], https://www.ospo.noaa.gov/Products/land/smops, last access: 10 June 2023.
Nori, J., Torres, R., Lescano, J. N., Cordier, J. M., Periago, M. E., and Baldo, D.: Protected areas and spatial conservation priorities for endemic vertebrates of the Gran Chaco, one of the most threatened ecoregions of the world, Divers. Distrib., 22, 1212–1219, https://doi.org/10.1111/ddi.12497, 2016.
Ortega, G., Arias, P. A., Villegas, J. C., Marquet, P. A., and Nobre, P.: Present-day and future climate over central and South America according to CMIP5/CMIP6 models, Int. J. Climatol., 41, 6713–6735, https://doi.org/10.1002/joc.7221, 2021.
Paruelo, J. M., Guerschman, J. P., and Verón, S. R.: Agricultural expansion and changes in land use, Ciencia Hoy, 15, 14–23, 2005 (in Spanish).
Piquer-Rodríguez, M., Torella, S., Gavier-Pizarro, G., Volante, J., Somma, D., Ginzburg, R., and Kuemmerle, T.: Effects of past and future land conversions on forest connectivity in the Argentine Chaco, Landscape Ecol., 30, 817–833, https://doi.org/10.1007/s10980-014-0147-3, 2015.
Pohl, B. and Creìtat, J.: On the use of nudging techniques for regional climate modeling: Application for tropical convection, Clim. Dynam., 43, 1693–1714, https://doi.org/10.1007/s00382-013-1994-3, 2014.
Portillo-Quintero, C. A. and Sánchez-Azofeifa, G. A.: Extent and conservation of tropical dry forests in the Americas, Biol. Conserv., 143, 144–155, https://doi.org/10.1016/j.biocon.2009.09.020, 2010.
Ribichich, K. F., Chiozza, M., Ávalos-Britez, S., Cabello, J. V., Arce, A. L., Watson, G., Arias, C., Portapila, M., Trucco, F., Otegui, M. E., and Chan, R. L.: Successful field performance in warm and dry environments of soybean expressing the sunflower transcription factor HB4, J. Exp. Bot., 71, 3142–3156, https://doi.org/10.1093/jxb/eraa064, 2020.
Richards, P. D., Myers, R. J., Swinton, S. M., and Walker, R. T.: Exchange rates, soybean supply response, and deforestation in South America, Global Environ. Change, 22, 454–462, https://doi.org/10.1016/j.gloenvcha.2012.01.004, 2012.
Rogers, E., Ek, M., Lin, Y., Mitchell, K., Parrish, D., and DiMego, G.: Changes to the NCEP Meso Eta analysis and forecast system: Assimilation of observed precipitation, upgrades to land-surface physics, modified 3DVAR analysis, NWS Tech. Procedures Bull., 473, 2001.
Ruscica, R., Menéndez, C., and Sörensson, A.: Land surface-atmosphere interaction in future South American climate using a multi-model ensemble, Atmos. Sci. Lett., 17, 141–147, https://doi.org/10.1002/asl.635, 2016.
Saha, S., Moorthi, S., Wu, X., Wang, J., Nadiga, S., Tripp, P., Behringer, D., Hou, Y., Chuang, H., Iredell, M., Ek, M., Meng, J., Yang, R., Mendez, M. P., van den Dool, H., Zhang, Q., Wang, W., Chen, M., and Becker, E.: The NCEP Climate Forecast System Version 2, J. Climate, 27, 2185–2208, https://doi.org/10.1175/JCLI-D-12-00823.1, 2014.
Salazar, A., Baldi, G., Hirota, M., Syktus, J., and McAlpine, C.: Land use and land cover change impacts on the regional climate of non-Amazonian South America: A review, Global Planet. Change, 128, 103–119, https://doi.org/10.1016/j.gloplacha.2015.02.009, 2015.
Sánchez, E., Solman, S., Remedio, A. R. C., Berbery, H., Samuelsson, P., Da Rocha, R. P., Mourão, C., Li, L., Samuelsson, P., Da Rocha, R. P., de Castro, M., and Jacob, D.: Regional climate modelling in CLARIS-LPB: a concerted approach towards twentyfirst century projections of regional temperature and precipitation over South America, Clim. Dynam., 45, 2193–2212, https://doi.org/10.1007/s00382-014-2466-0, 2015.
Santanello, J. A., Dirmeyer, P. A., Ferguson, C. R., Findell, K. L., Tawfik, A. B., Berg, A., Ek, M., Gentine, P., Guillod, B. P., van Heerwaarden, C., Roundy, J., and Wulfmeyer, V.: Land–atmosphere interactions: The loco perspective, B. Am. Meteorol. Soc., 99, 1253–1272, https://doi.org/10.1175/bams-d-17-0001.1, 2018.
Seneviratne, S. I., Corti, T., Davin, E. L., Hirschi, M., Jaeger, E. B., Lehner, I., Orlowsky, B., and Teuling, A. J.: Investigating soil moisture–climate interactions in a changing climate: A Review, Earth-Sci. Rev., 99, 125–161, https://doi.org/10.1016/j.earscirev.2010.02.004, 2010.
Skamarock, W. C., Klemp, J. B., Dudhia, J., Gill, D. O., Barker, D. M., Wang, W., and Powers, J. G.: A description of the Advanced Research WRF version 3, Technical report, NCAR, https://doi.org/10.5065/D68S4MVH, 2008.
Sörensson, A. A. and Berbery, E. H.: A note on soil moisture memory and interactions with surface climate for different vegetation types in the La Plata basin, J. Hydrometeorol., 16, 716–729, https://doi.org/10.1175/JHM-D-14-0102.1, 2015.
Spennemann, P. and Saulo, A.: An estimation of the land-atmosphere coupling strength in South America using the Global Land Data Assimilation System, Int. J. Climatol., 35, 4151–4166, https://doi.org/10.1002/joc.4274, 2015.
Stanimirova, R., Graesser, J., Olofsson, P., and Friedl, M. A.: Widespread changes in 21st century vegetation cover in Argentina, Paraguay, and Uruguay, Remote Sens. Environ., 282, 113277, https://doi.org/10.1016/j.rse.2022.113277, 2022.
Sulla-Menashe, D. and Friedl, M. A.: MCD12C1 MODIS/Terra+Aqua Land Cover Type Yearly L3 Global 0.05Deg CMG V006, NASA EOSDIS Land Processes DAAC [data set], https://doi.org/10.5067/MODIS/MCD12C1.006, 2018.
Vera, C. S. and Osman, M.: Activity of the Southern Annular Mode during 2015–2016 El Niño event and its impact on Southern Hemisphere climate anomalies, Int. J. Climatol., 38, e1288–e1295, https://doi.org/10.1002/joc.5419, 2018.
Verseghy, D.: CLASS–A Canadian Land Surface Scheme for GCMs. I: Soil model, Int. J. Climatol., 11, 111–133, https://doi.org/10.1002/joc.3370110202, 1991.
Volante, J. N., Mosciaro, M. J., Gavier-Pizarro, G. I., and Paruelo, J. M.: Agricultural expansion in the Semiarid Chaco: Poorly selective contagious advance, Land Use Policy, 55, 154–165, https://doi.org/10.1016/j.landusepol.2016.03.025, 2016.
Xie, P. and Arkin, P. A.: CPC Global Precipitation, NOAA PSL [data set], https://climatedataguide.ucar.edu/climate-data/cpc-unified-gauge-based-analysis-global-daily-precipitation, last access: 1 June 2023.
Xie, P., Arkin, P. A., and Schubert, M. C.: A new global precipitation dataset from CPC, Clim. Dynam., 35, 545–564, https://doi.org/10.1007/s00382-009-0532-0, 2010.